
Laws and Mechanism of the Fe (III) Clogging of Porous Media in Managed Aquifer Recharge


1
Key Laboratory of Groundwater Resources and Environment (Jilin University), Ministry of Education, Changchun 130021, China
2
Jilin Provincial Key Laboratory of Water Resources and Environment, Jilin University, Changchun 130021, China
3
College of New Energy and Environment, Jilin University, Changchun 130021, China
*
Author to whom correspondence should be addressed.
Water 2021, 13(3), 284; https://doi.org/10.3390/w13030284
Submission received: 1 December 2020
/
Revised: 19 January 2021
/
Accepted: 21 January 2021
/
Published: 25 January 2021
(This article belongs to the Special Issue Rainwater Management in Urban Areas)
Abstract
:The use of stormwater for managed aquifer recharge (MAR) has become one of the most important ways to deal with water shortages and the corresponding environmental geological problems, especially in the north of China. The Fe (III) clogging of porous media is a common and significant problem that influences the effect of the infiltration rate. This paper focuses on the migration characteristics and clogging mechanisms of iron hydroxides in sand columns. The results indicate that the permeability of porous media significantly decreased at the inlet of the fine sand column and inside the coarse sand column. We demonstrated that, when the Fe (III) concentration was higher, a smaller infiltration medium size was produced more rapidly, and there was more significant clogging. More than 80% of the injected Fe (III) remained in the sand column, and more than 50% was retained within 1 cm of the column inlet. The mass retention increased with the decrease in the size of the infiltration medium particles and with the increase in the injected Fe (III) concentration. The main material that caused Fe (III) clogging was iron hydroxide colloids, which were in the form of a granular or flocculent membrane coating the quartz sand. The mechanisms of clogging and retention were blocking filtration and deep bed filtration, adsorption, and deposition, which were strongly affected by the coagulation of Fe (III) colloidal particles.
1. Introduction
Managed aquifer recharge (MAR) using stormwater is an effective way of controlling urban stormwater, saving costs, and generating ecological benefits [1]. Although MAR using stormwater has many advantages, it is difficult to popularize this technology due to porous media clogging. Clogging occurs in aquifers and recharge facilities and is typically related to the quality of the recharge water and the composition and particle size of the infiltration medium [2,3,4]. Iron oxides, hydroxides, and calcium carbonate are the main forms of geochemical clogging [5]. Metal materials are one of the main pollutant types in stormwater runoff [6] and are usually absorbed or complexed in the water system and deposited.
The primary metal ions in clogging materials include iron, manganese, aluminum, and zinc when using potable water for laboratory column MAR experiments [7]. The presence of oxygen or nitrate in recharge water can stimulate bacteria and produce iron or manganese oxides and hydroxide precipitates [8]. The stormwater quality data extracted from the literature (Table 1) show that iron is the most common metal pollutant in stormwater [6,9,10,11,12,13,14], and the iron content ranges from 0.3 to 1.8 mg/L, generally exceeding the Australian Drinking Water Guidelines(AWDG) [15] standard.
The total iron concentration specified in the water quality standard for reclaimed water recharge in China (GB/T 19772-2005) stipulates that the limit value of the total iron concentration is 0.3 mg/L; in Beijing, it is 0.3–1.0 mg/L [14]; for most states in America, it is 0.3 mg/L [16,17]; and in the former Soviet Union, it is 3 mg/L [18]. The precipitation formed by iron oxides and hydroxides can cause the clogging of recharge wells and infiltration medium, and affect the infiltration of stormwater, which will reduce the lifetime and increase the cost of MAR facilities [1].
The value of pH strongly affects the various species present in solution and the geochemical clogging effect and also has a significant influence on the adsorption phenomena for the fraction of iron species present in solution. Omura et al. found that the pH should be kept below 2 to avoid clogging by ferric hydroxide [19]. However, the lower pH would corrode metal pipes and vessels and contribute to additional colloid retention, which tends to exacerbate clogging and reduce the performance and service life of the recharge equipment [20].
According to the guidelines for water reuse, the pH for recharge water should be 6.5–8.5 [16,17]. Escalante and Enrique conducted measurements of the evolution of pH along the infiltration channels and found that the pH values fluctuated in the range of 6.8–7.5 (nearly neutral values) [21]. Pavelic et al. identified pH < 7.2 as a suitable target for source water to prevent clogging [22]. Therefore, the pH for the recharge water in laboratory experiments should be of neutral values.
In this study, through a vertical laboratory column experiment, the laws and mechanism of Fe (III) clogging in the MAR process were studied, and the retention of iron in the sand columns was quantitatively analyzed, providing a scientific basis for preventing and controlling iron clogging.
2. Materials and Methods
2.1. Experimental Equipment and Materials
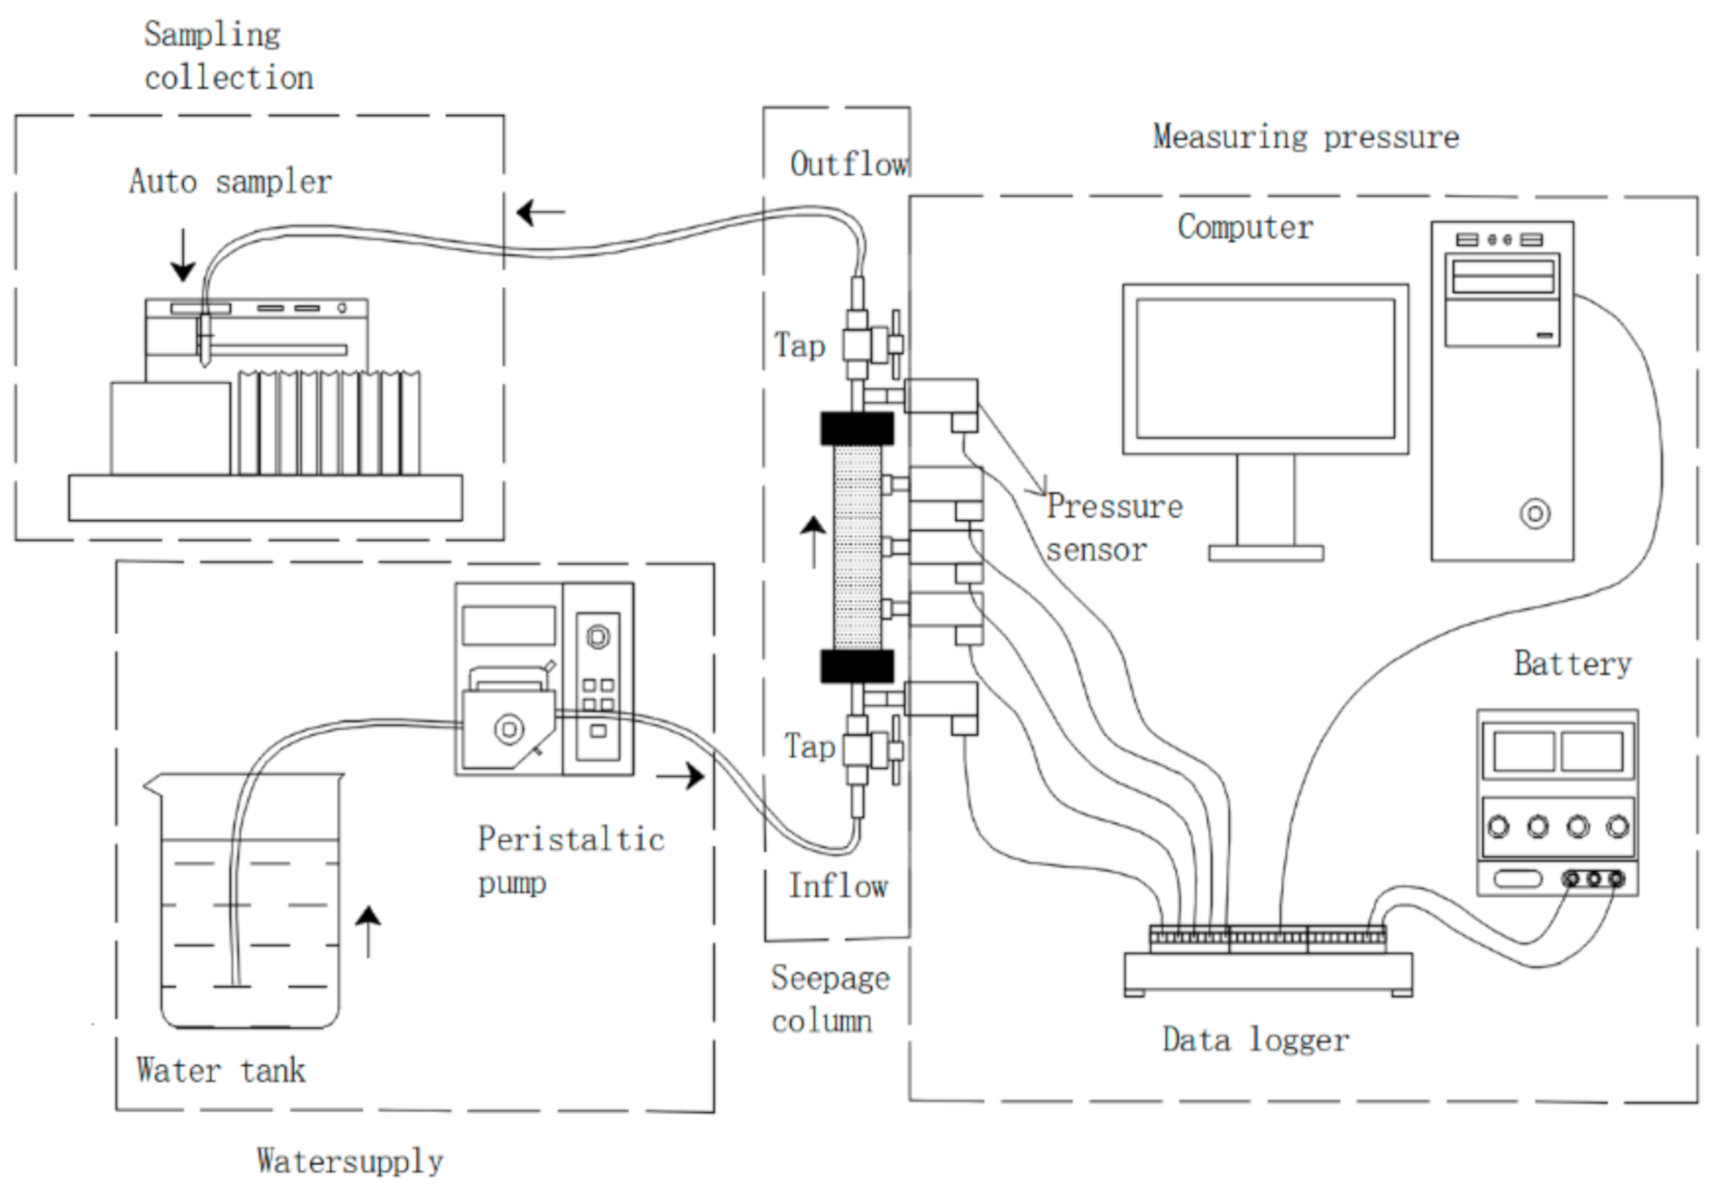
The experiment system involved four parts connected with a polyethylene hose, including a water supply, sand column, water pressure sensor, and water sample collector (Figure 1). The plexiglass column had a 16 cm height and 2.0 cm diameter and was packed with quartz sand with a density of 1.6 g/cm3. The water pumped into the column was a solution of FeCl3·6H2O (>99%) and Milli-Q water. According to the feature of the stormwater quality, the pH value of the recharge water was adjusted with 25% ammonia water (NH3·H2O) to 7. The infiltration velocity was 1.62 m/d, and the water was continuously fed through the columns from the bottom to the top.
The concentration of Fe (III) in water samples was measured by a UV–VIS Spectrophotometer (the wavelength detection range was 190–1100 nm, T6, Beijing Purkinje General Instrument Co.,Ltd., Beijing, China), and the total iron content was based on the phenanthroline spectrophotometry method with the absorbance measured at 510 nm. In the adsorption experiment, a mixing instrument (MX-RL-Pro, DLAB Scientific Co., Ltd., Beijing, China) was employed to mix the quartz sand with the Fe (III) solution at a rotation speed of 70 rpm. The temperature of the adsorption experiment was 18 °C. The reaction time of adsorption was 2, 5, 10, 30, 48, and 72 h, and the liquid to solid ratio (L/S) was 2, 5, 10, 15, 20, 30, 40, and 50 mL/g.
Based on the background iron concentration of the stormwater quality in China and the recommended standard of the recharge water quality for iron in different countries, Fe (III) concentrations of 0.3, 1, and 3 mg/L, with infiltration media of fine sand, medium sand, and coarse sand were adopted in six laboratory experiments (Table 2).
2.2. Experimental Methods and Procedures
2.2.1. Recharge Experiment
The column was packed in 1 cm increments by pouring the dry quartz sand into the pre-filled column with pure water, then stirred and allowed to precipitate naturally. The water injection volume at the time of sand loading was controlled and calculated using the total volume of the sand column, and the porosity obtained was close to 40%.
In this experiment, the constant flow recharge process was adopted at room temperature at 20 ± 2 °C. The change in the clogging degree of porous media is expressed by the change in the hydraulic conductivity (K), which was calculated by Darcy’s law:
where (m3/day) is the flow rate, (m) is the column length between any two pressure transducers, (m) is the difference in hydraulic head between the two points along the column, and (m) is the inner radius of the column.
To quantify the mass of clogging material that was retained in the sand column, the infiltration medium was excavated at 1 cm intervals at the end of the experiments. The sand samples were immersed in hydrochloric acid and shaken vigorously to dissolve the Fe (III) clogging material [23]. The mass retained in the column, referred to as M(t), was estimated from the difference between the inlet and outlet Fe (III) concentrations:
where is the time spent at ith operating time; n is the total operating time; and and are the Fe (III) volume concentrations at the initial and ith operating time, respectively.
The change in retained mass with time was expressed as the retention rate, . When calculating the ratio of retained Fe (III) in the whole experimental process with the retention rate in a stable period, it is expressed as .
where (mg/L) is the Fe (III) concentration of the recharge water and (L/h) is the flow velocity of recharge.
2.2.2. Adsorption Experiment
The adsorption kinetic equation and adsorption thermodynamic equation were fitted by the optimal ratio of liquid and solid (L/S) and reaction time to determine the maximum adsorption amount and adsorption type. The adsorption ratio is expressed as :
where (mg/g) is the maximum adsorption amount, (g) is the mass of sand used in the adsorption experiment, (mg/L) is the Fe (III) concentration, and (L) is the volume of the solution used in the adsorption experiment.
3. Results and Discussion
3.1. Laws of Fe (III) Clogging in Porous Media
The clogging degree can be indicated by a dimensionless index of Kt/Ko where Kt is the instantaneous hydraulic conductivity, and Ko is the initial hydraulic conductivity.
3.1.1. Temporal Laws
The change in hydraulic conductivity can be divided into three parts: T1 is the maintaining stage of the initial permeability; T2 is the rapid decline stage of permeability; and T3 is the slow decline and relatively stable stage of low permeability.
- (a)
- Different infiltration media
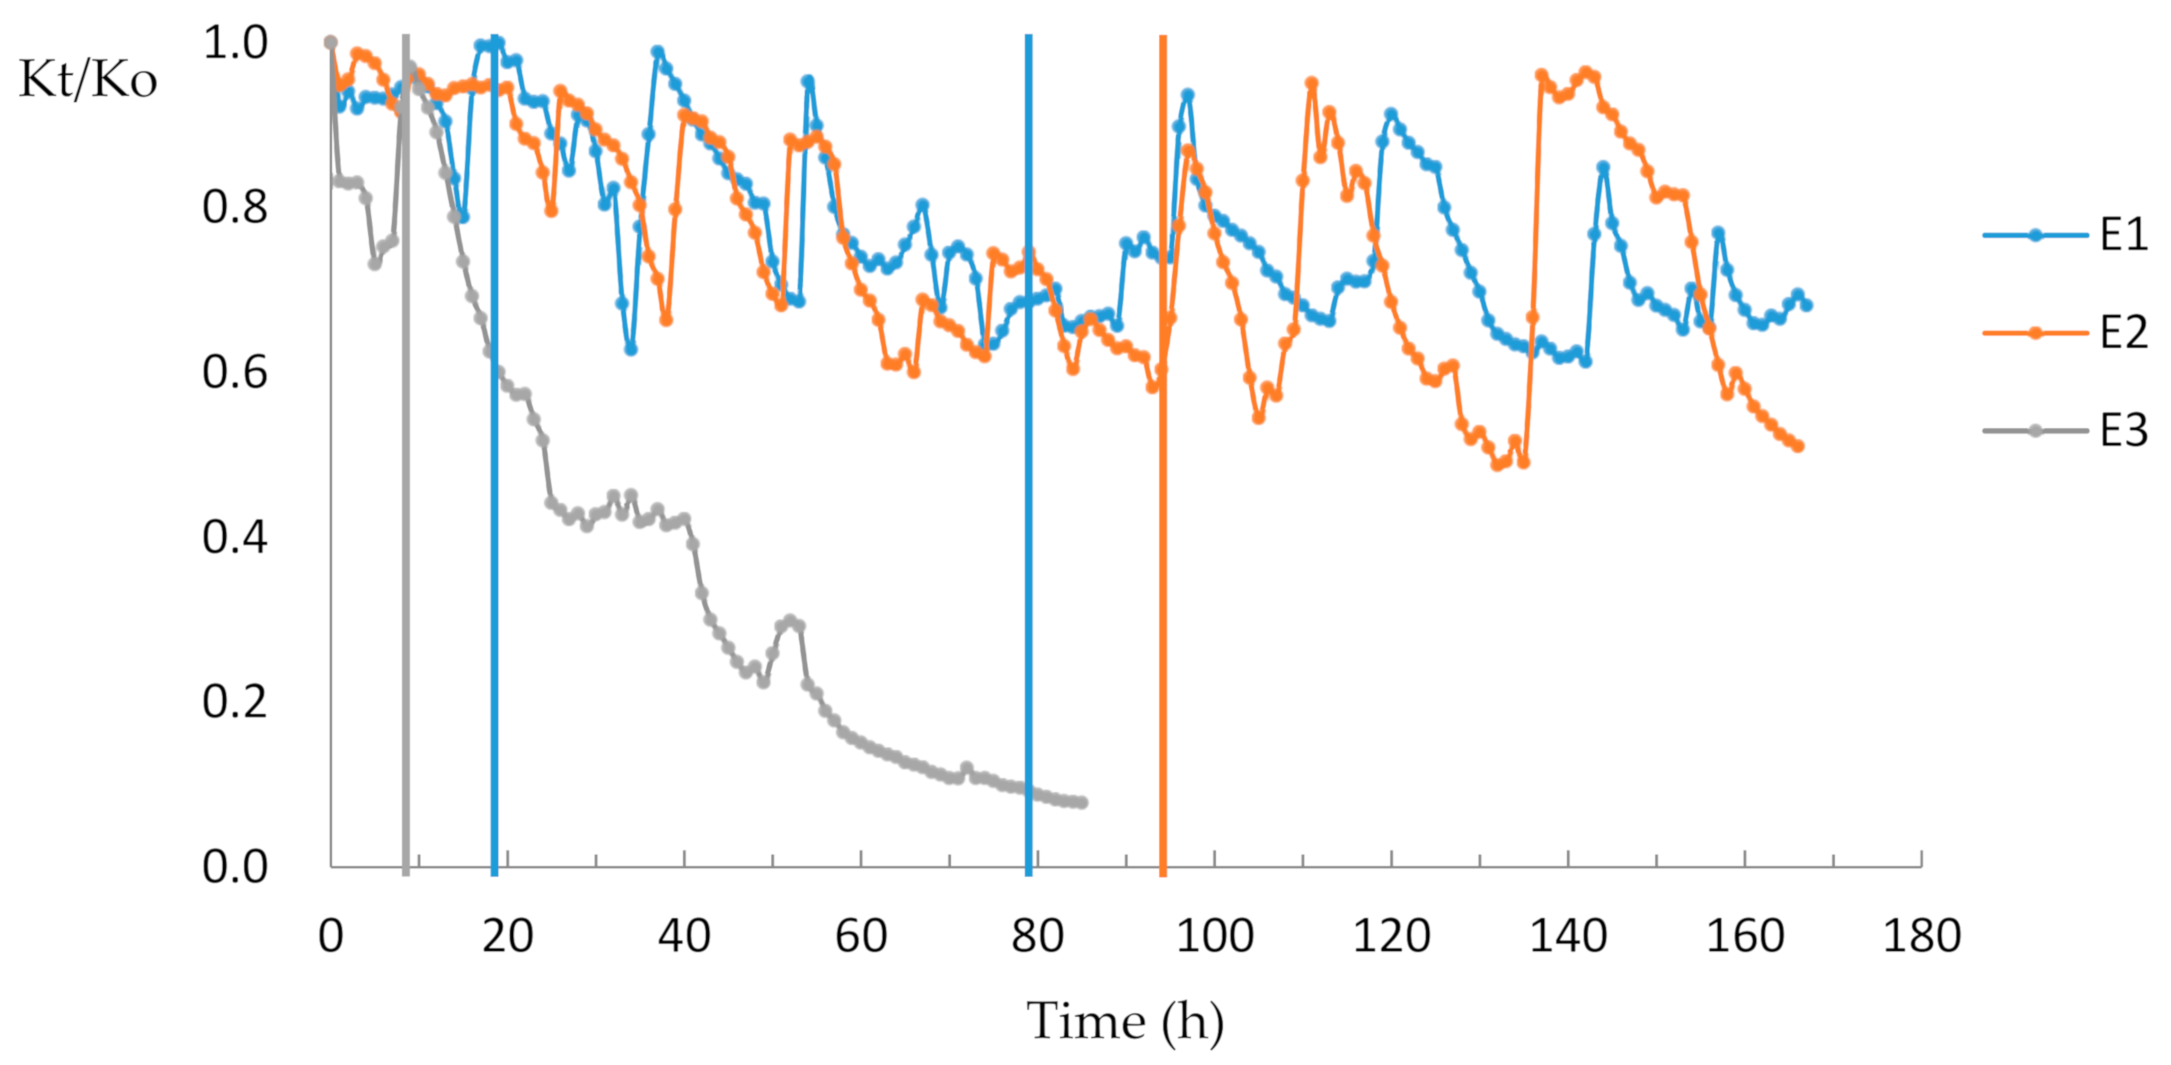
The results for different infiltration media are shown in Figure 2. In addition to the fine sand (E3), T1 was usually about 20 h, and E3 was about 9 h. As for T2, from 20 to 80 h, the coarse sand (E1) relative hydraulic conductivity experienced an oscillation decline, and the permeability dropped to the initial value of 65%. The change trend of medium sand (E2) was similar to that of coarse sand (E1); from 20 to 94 h, the permeability in the oscillation decline stage dropped to the initial value of 60%.
From 9 to 80 h, the permeability of E3 declined from 97% to 8% of its initial value. After 80 h, the coarse sand (E1) permeability entered a period of stable oscillation, and the minimum relative hydraulic conductivity was 61% of the initial value. After 94 h, the permeability of E2 entered a large oscillation phase, where the maximum was 94% of the initial value, and the minimum was 50% of the initial value.
The hydraulic conductivity of E1 and E2 nearly returned to the initial value several times, which indicates a transient clogging. Since E1 and E2 were coarse sand and medium sand, the diameter of the pores in the sand column was larger than that for fine sand. Under constant flow conditions, clogging materials would form blockages at the pore throats and cause the pressure to increase. After the pressure increasing to a certain extent, the clogging material at the throat would be washed away, making the hydraulic conductivity rise. However, the pore diameter of the fine sand was small, and the clogging material could easily block the entire pore and formed a cake layer; thus, the pore could not reopen, the blockage continued to increase, and the hydraulic conductivity continued to decrease.
- (b)
- Different Fe (III) concentrations in recharge water
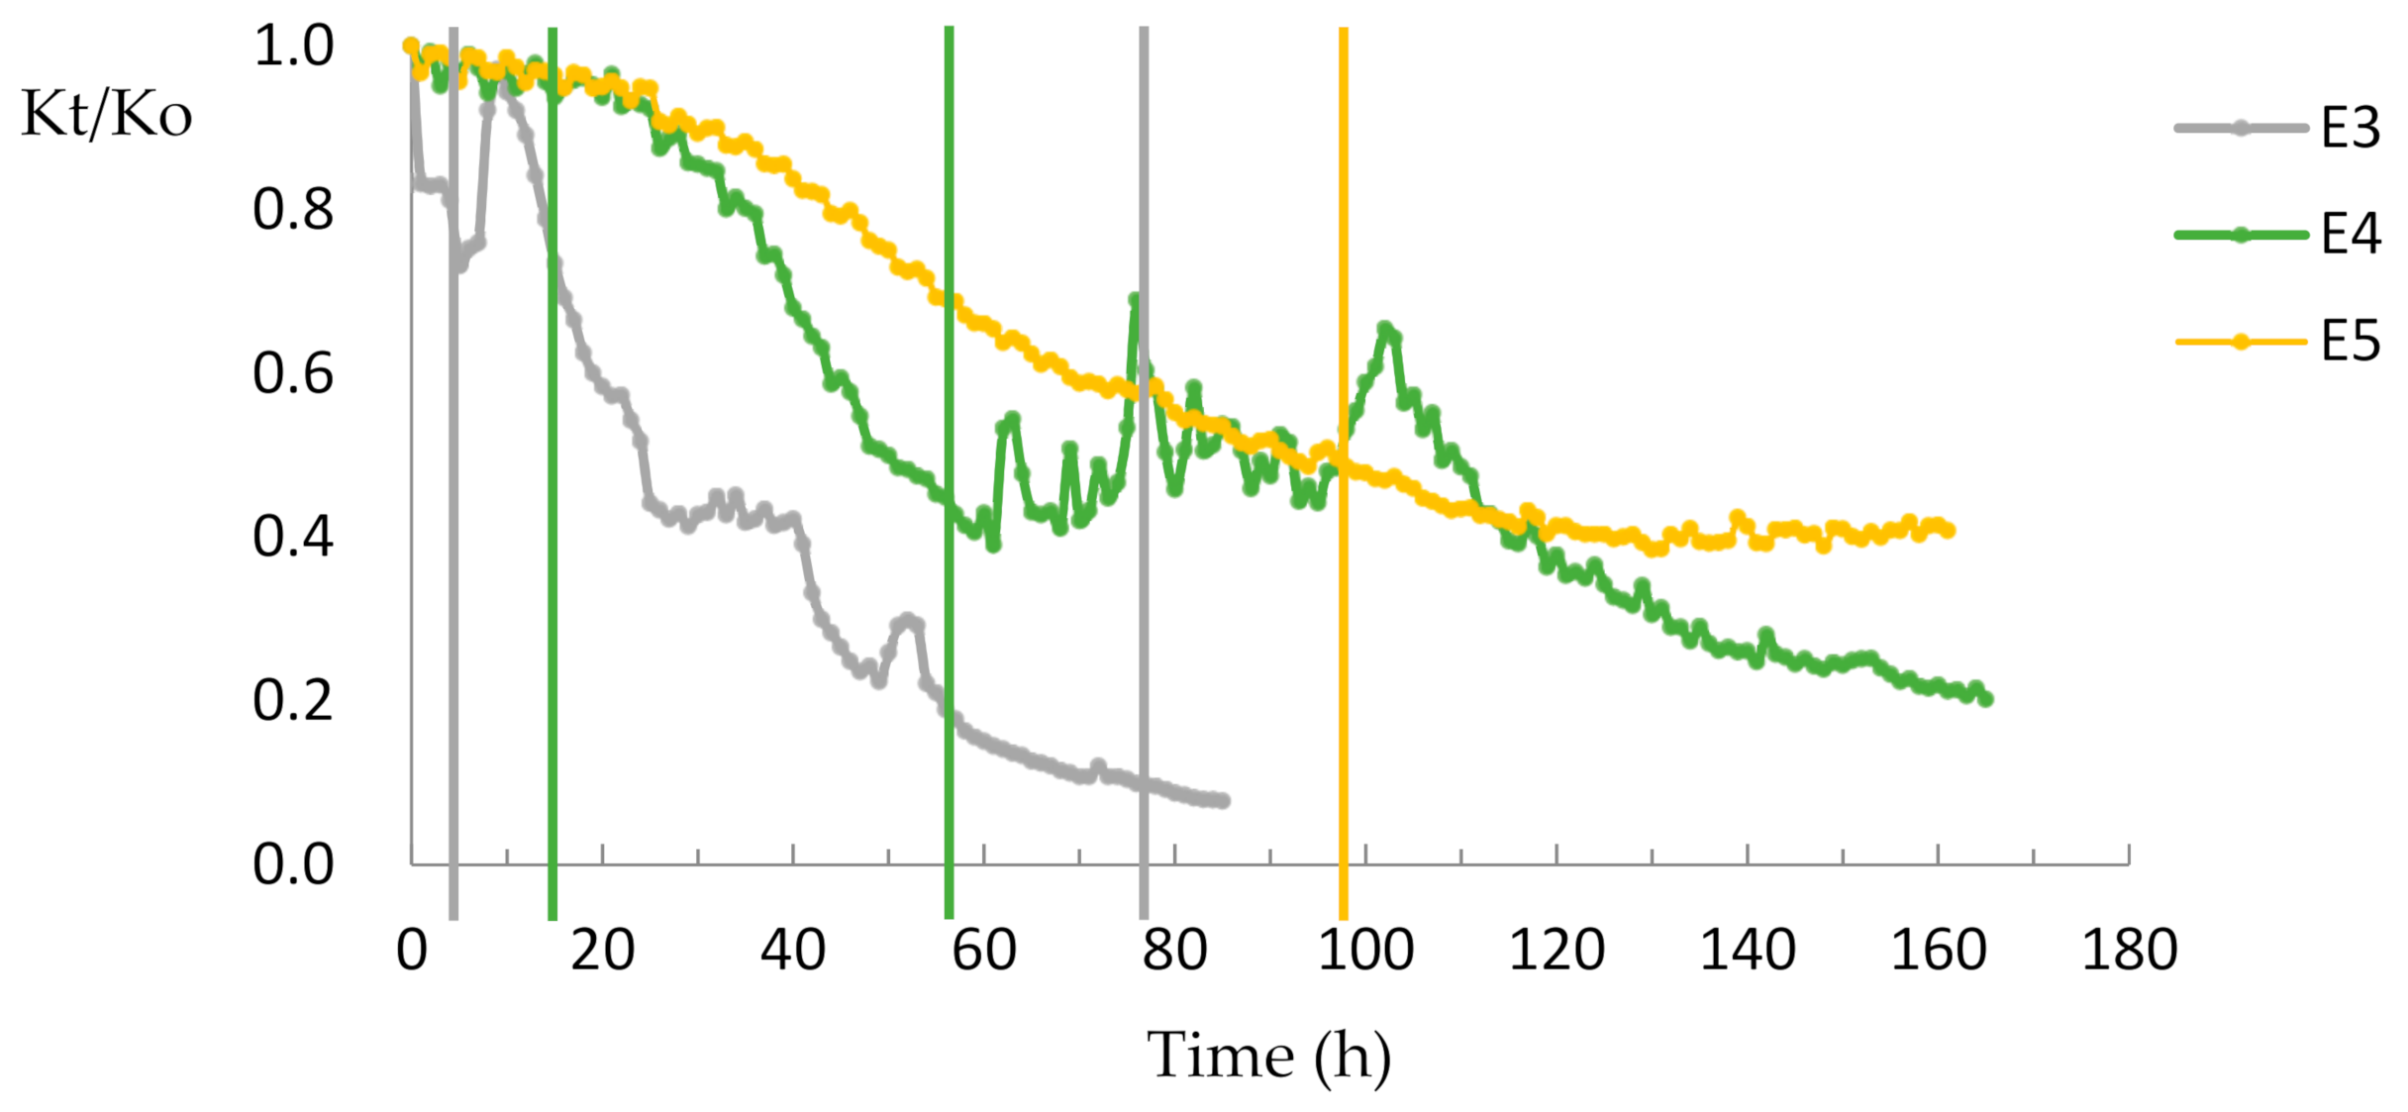
The results for different Fe (III) concentrations in recharge water are shown in Figure 3. The highest concentration (E3) led to the fastest decline in the relative hydraulic conductivity. In the T2 stage, the permeability dropped by 87% in only 80 h, and decreased by 92% in 85 h (T3 stage). For the middle Fe (III) concentration (E4), T1 was20 h; the relative hydraulic conductivity decreased from 96% of the initial value to 40% in 20 to 60 h (T2 stage); and, after 60 h (T3 stage) to the end of the experiment (165 h), the relative hydraulic conductivity decreased from 40% of the initial value to 20%. The curve of the lowest Fe (III) concentration (E5) displays the most stable drop. T1 was 20 h; in 20 to 100 h (T2 stage), the relative hydraulic conductivity decreased from 96% of the initial value to 43%; and, after 100 h (T3 stage), the relative hydraulic conductivity was stable at 40% of the initial value.
The hydraulic conductivity of E3 and E4 appeared to have oscillations, but that of E5 decreased steadily, which indicates that, under constant flow conditions when the infiltration material concentration was low, the clogging material was more likely to continue to accumulate to form a stable clog, and when the infiltration material concentration was high, the clogging material at the pore was more easily washed away by the increase in pressure; however, due to the small pore diameter, it would eventually be completely blocked to form a cake layer.
A decreased hydraulic conductivity indicated that porous media clogging occurred, and when the size of the infiltration medium was smaller and the Fe (III) concentration was higher, the clogging occurred more rapidly and significantly.
3.1.2. Spatial Laws
To compare the changes in the hydraulic conductivity at different locations, we calculated the hydraulic conductivity for the column inlet (0–3 cm) and the remaining part of the column (3–16 cm).
- (a)
- Different infiltration media
The results for different infiltration media are shown in Figure 4. The permeability decreases for the column inlet (0–3 cm), which is shown in Figure 4a, were similar to the whole column’s changes, except for E1, which was similar to the whole column of 3–16 cm. E1 and E2 exhibited an oscillation decline after 10 and 5 h of the experiment start, respectively; E2 reached the stable period of large oscillation after 94 h; and the minimum relative hydraulic conductivity was 0.3.
The oscillation amplitude of E1 in the stable period was smaller than that of E2, and after 101 h, the relative hydraulic conductivity began to decrease and finally stabilized near 0.43. For different infiltration media, in the outlet (3–16 cm), as shown Figure 4b, the relative hydraulic conductivity of fine sand (E3) was basically unchanged; that of medium sand (E2) fluctuated slightly; and that of coarse sand (E1) fluctuated greatly, with a value from 0.54 to 0.95 through the whole experiment, and at the end of experiment, at 0.75.
- (b)
- Different Fe (III) concentrations in recharge water
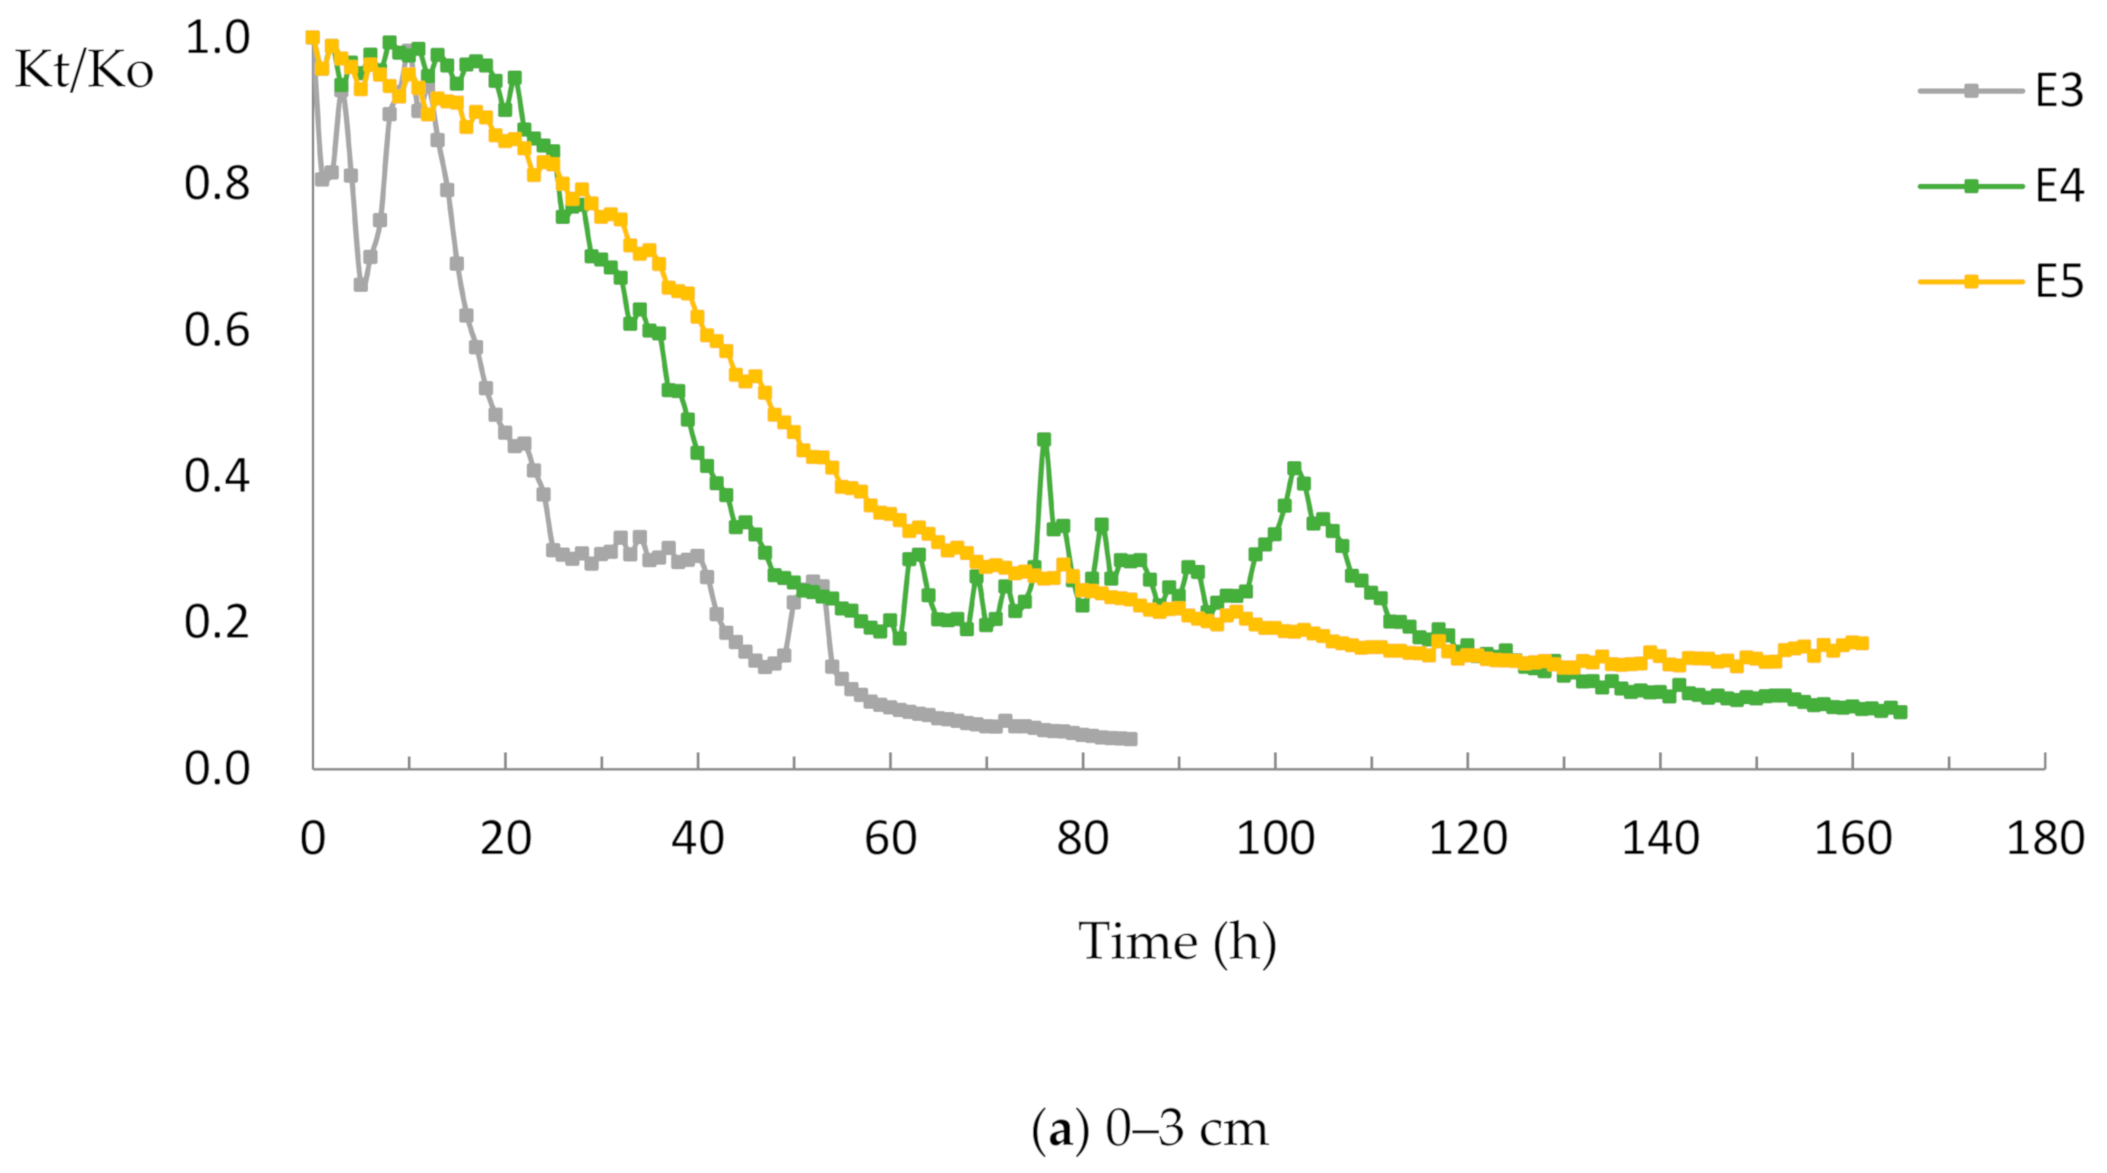
For the experiment on different Fe (III) concentrations in recharge water, the results are shown in Figure 5. The permeability decreases for the column inlet (0–3 cm), which is shown in Figure 5a, were similar to the whole column’s permeability changes. The relative hydraulic conductivity at the inlet decreased steadily. At the end of the experiment, the relative hydraulic conductivities of E3, E4, and E5 were 0.04, 0.08, and 0.17, respectively. In the remaining part of the column (3–16 cm), displayed in Figure 5b, for different Fe (III) concentrations, the relative hydraulic conductivity was basically unchanged.
Hydraulic conductivity changes mostly occurred in the inlet, especially for fine sand and high Fe (III) concentration conditions. For coarse sand, Fe (III) can migrate over a long distance and, once the clogging occurs at a certain depth, the clogging will gradually develop over the column and eventually lead to clogging on the surface of the column.
3.2. Retention Laws of Fe (III) in Porous Media
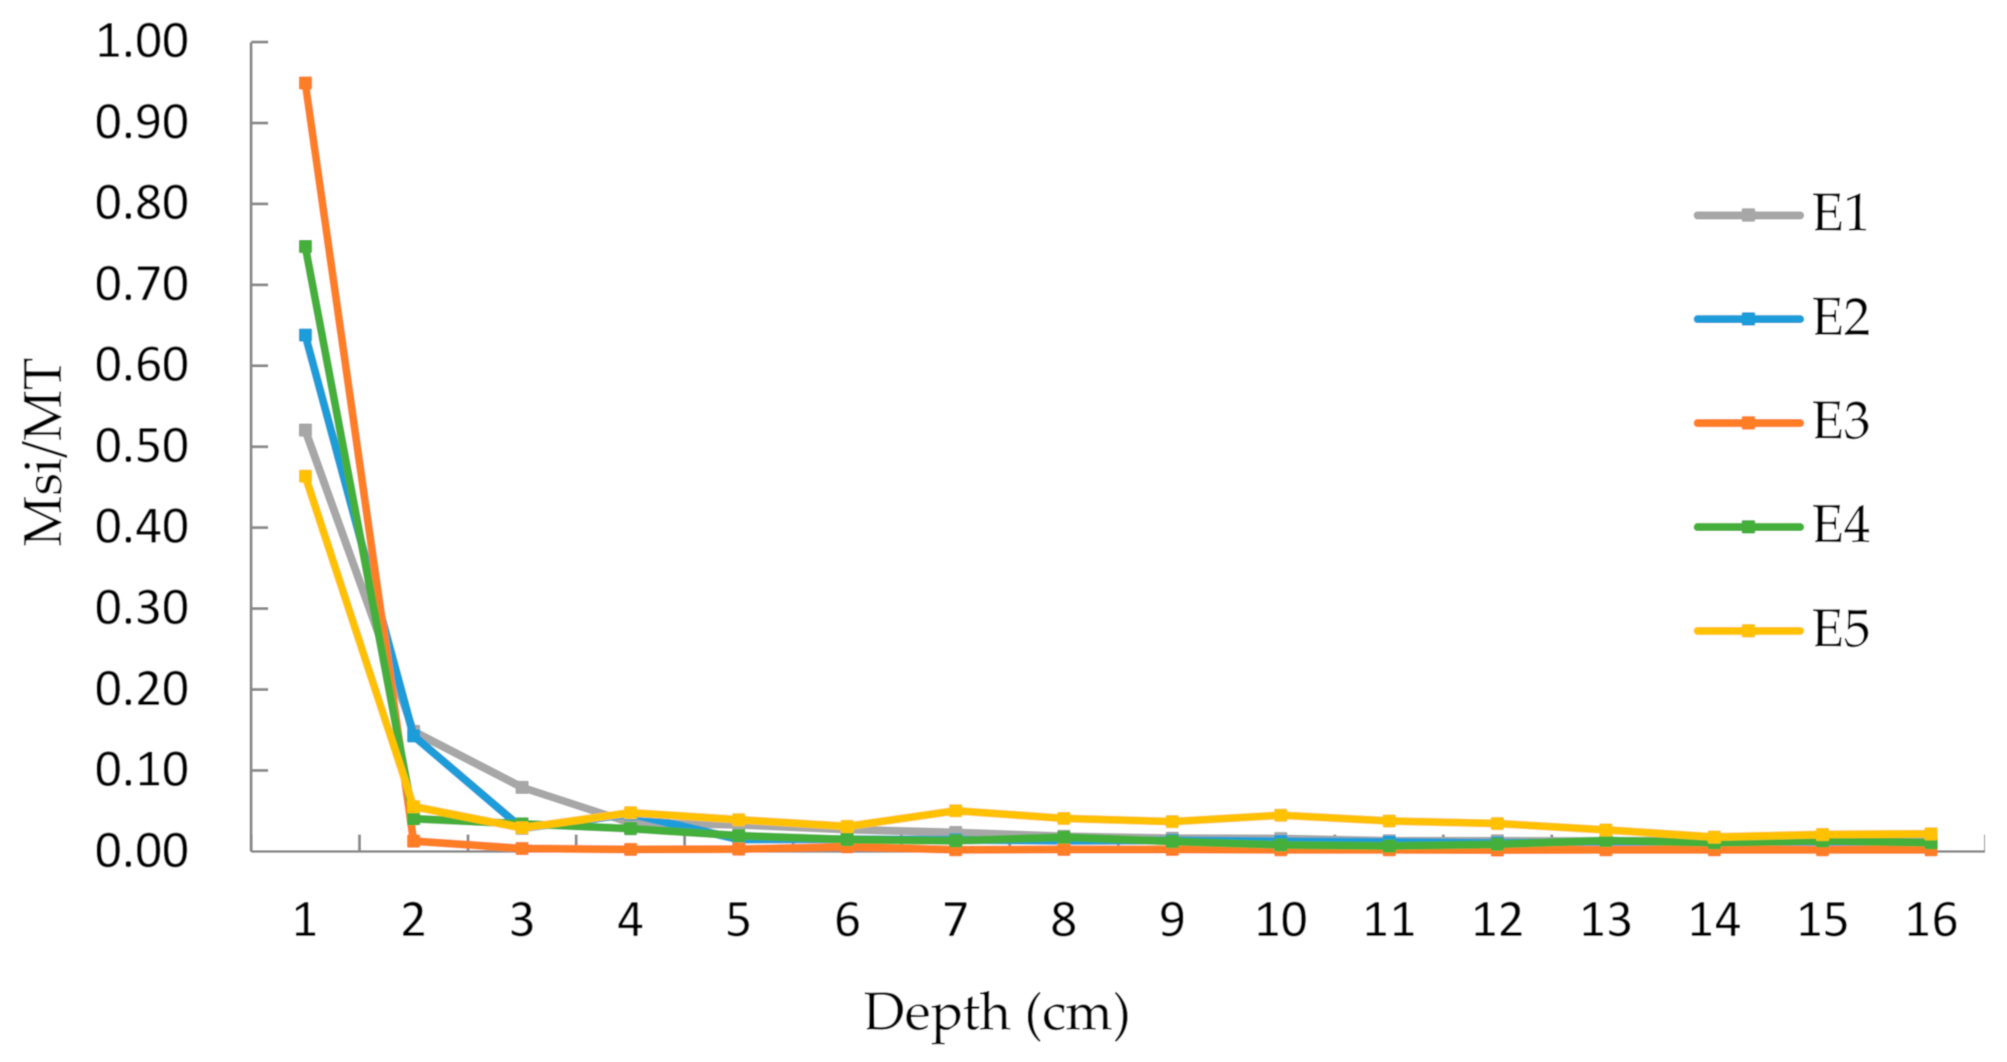
In terms of the mass of Fe (III) retained in the sand column, the distribution was also obtained by dismantling the column at the end of the experiment. As Figure 6 shows, the recharge water was fed from the bottom to the top of the column; therefore, the depth was the distance of the location from the inlet. Most Fe (III) was retained within 0–1 cm, which was the inlet section. The mass ratio (ratio of mass at si layer (Msi) to total mass (MT), Msi/MT) was well fitted by an exponential function of the column length, with the function as shown in Equation (5), which returned an estimate of the Fe (III) penetration depth for the different infiltration media and Fe (III) initial concentration, with the fitting parameters as shown in Table 3. The value of parameter a had a negative correlation with the infiltration medium and a positive correlation with the Fe (III) concentration of the recharge water. Therefore, the mass ratio was affected by the size of the infiltration medium and the Fe (III) concentration of the recharge water.
where was the Msi/MT ratio; was the Fe (III) penetration depth; and and were the fitting parameters.
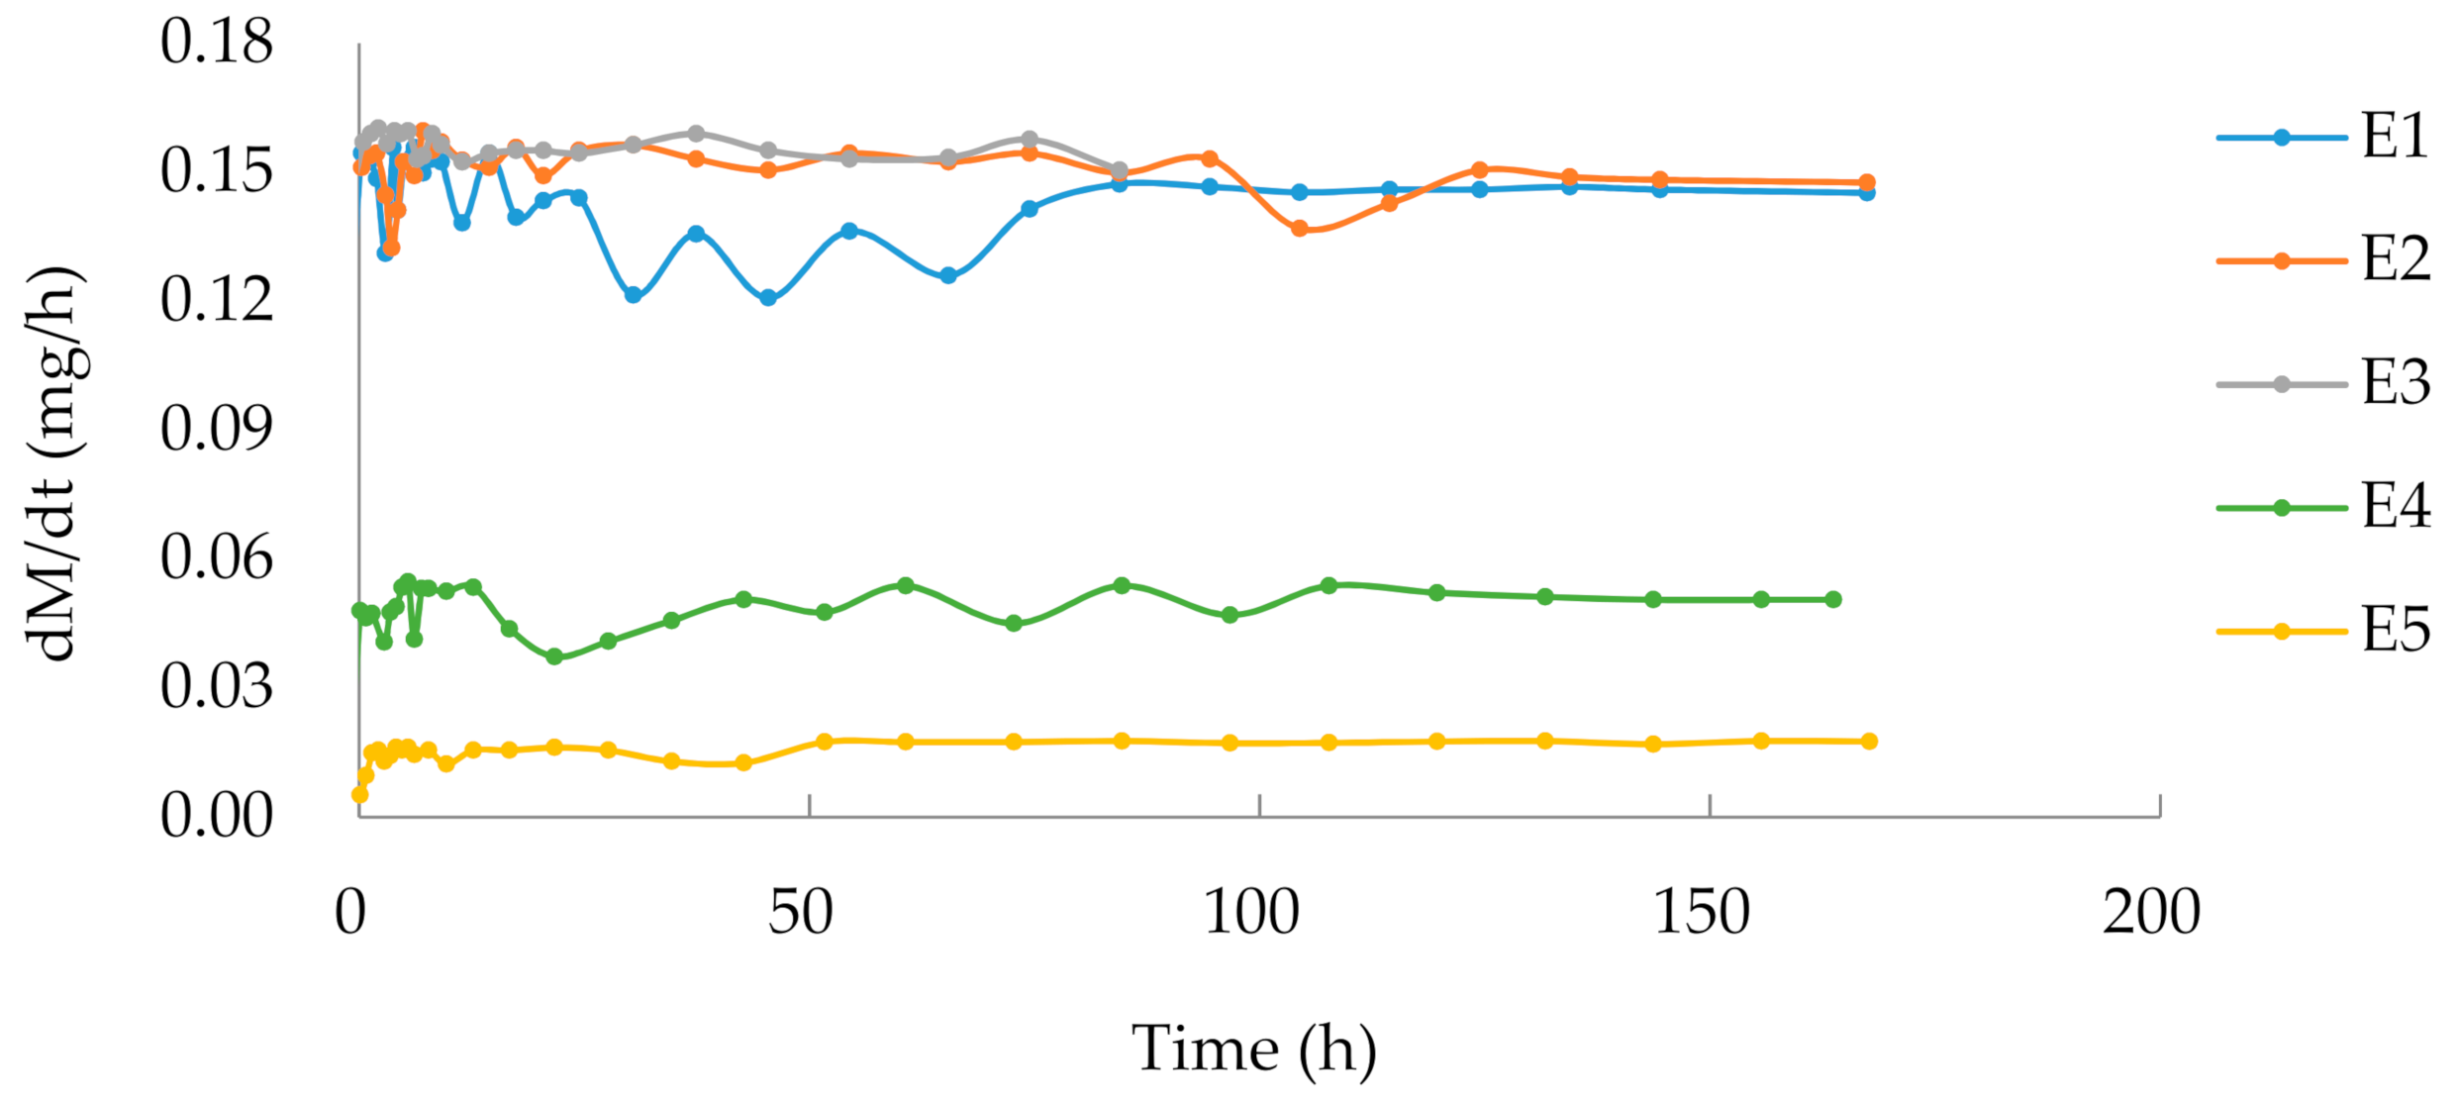
The mass of Fe (III) retained in column (M) was calculated by the inlet and outlet Fe (III) concentration, as shown in Equation (2). The Fe (III) retention increased overtime for all experiments in a linear fashion, as shown in Figure 7. The slope of each interval in Figure 7 was the mass retention rate (dM/dt) as shown in Figure 8. The variation of the retention rate of coarse sand (E1) fluctuated greatly, from 0.121 to 0.15 mg/h, before 84 h. The middle Fe (III) concentration (E4) of the recharge water displayed a small amount of fluctuation, from 0.037 to 0.053 mg/h, before 104 h.
At the end of the experiment, the retention rate for all experiments had a relatively stable value: for E1, it was 0.147 mg/h; for E2, it was 0.150 mg/h; for E3, it was 0.155 mg/h; for E4, it was 0.051 mg/h; and for E5, it was 0.0175 mg/h. Eliassen [24] demonstrated that the deposition rate become zero at saturation, and no further suspended materials could be deposited in the porous matrix. However, in this experiment, perhaps due to the deposited materials being washed out during sampling or internal erosion creating a new volume where silt could become immobilized, the retention rate reached a stable value [25].
In addition, the pores of the infiltration medium were easily washed away in the early stage of the experiment, and the internal blockage of the sand column was unstable. The retention rate of Fe (III) oscillated slightly for a period of time after the beginning of the experiment; however, after the clogging was stable, the retention rate tended to a stable value.
As Table 4 shows, mass ratio of the total mass of Fe (III) in the recharge water throughout the whole experiment to the Fe (III) retained in the column after the end of the experiment was represented as RMT. The majority of the Fe (III) in the recharge water was retained in the column. In addition to coarse sand (E1), over 80%of Fe (III) was retained in the column. E1 exhibited the minimum value of 77%, whileE5 displayed the maximum value of 92.5%.
For the inlet section, over 50% of the retained Fe (III) was within 0–2 cm, except for E5, where over 50% was retained within 0–1 cm. E3 exhibited the maximum value, with over 90% of the injected Fe (III) being retained in the inlet, and E5 displayed the minimum value of only 46%. The RMT at the inlet of the column and were negative for a relation with the particle size of the infiltration medium and the Fe (III) concentration of the recharge water.
For stable retention rates, represented by the retention ratio () of each experiment, more than 80% of Fe (III) in the recharge water was retained in the column. The Fe (III) concentration of 0.3 mg/L exhibited the highest mass ratio of approximately 93–97%, and coarse sand had the lowest mass ratio of about 77–81%. The mass ratio decreased slightly (by about 3%) with the increase in the size of the infiltration medium.
3.3. Mechanisms of Fe (III) Clogging in Porous Media
The change in the degree of clogging is expressed by the change in the hydraulic conductivity. There was a clear decrease in the hydraulic conductivity in the inlet section and inside coarse sand.
As there were no other components in the recharge water except for FeCl3·6H2O, we confirmed that the clogging of the sand column was caused by the retention and accumulation of Fe (III). FeCl3·6H2O was used to form a certain concentration of Fe (III), and ammonia was then employed to adjust the pH value to 7. At room temperature (18 °C), the iron hydroxide (Fe(OH)3) solubility capacity Ksp = 4 × 10−38, and when the pH value was 1.87, the solution began to form an iron hydroxide precipitate [26]. In this experiment, the following reaction occurred in Fe (III):
3.3.1. Surface Filtration
For different Fe (III) concentrations of the recharge water, the clogging only occurred at the inlet port, indicating surface filtration. For different infiltration media, the hydraulic conductivity decreased rapidly at the inlet section, the clogging at the inlet was quite serious, and there was a surface filtration effect. Surface filtration involves two processes: blocking filtration and cake filtration [27], the clogging mechanisms as shown in Figure 9. Surface filtration was strongly affected by the size of blocked material and the pore diameter of the infiltration medium.
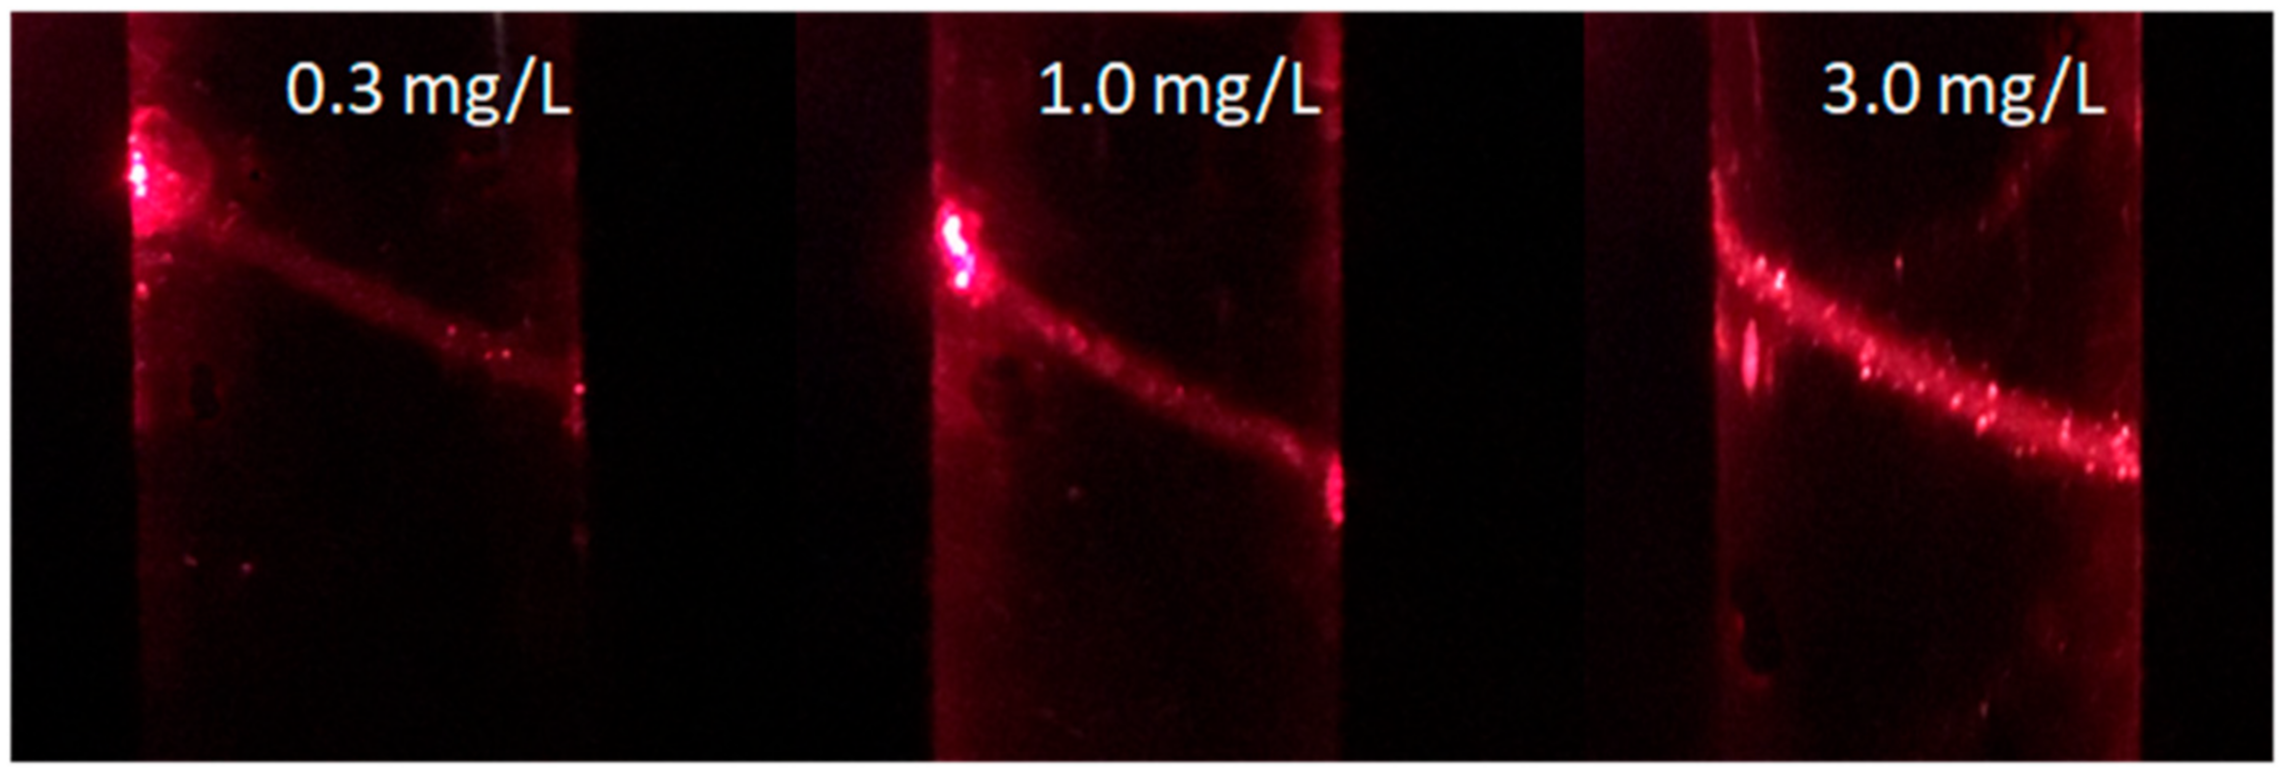
The size of the blocked material was related to the Fe (III) concentration of the recharge water. Through the Tyndall effect experiment with three different concentrations of Fe (III) where the pH was7 (Figure 10), with the increase in the concentration, the Tyndall effect became more obvious (the red beam line became clearer), and the form of Fe (III) in solution was mostly an iron hydroxide colloid. In the colloidal solution, according to the Schulze–Hardy rule [28], the main substance that plays the role of a coagulator is the counter ion, where the higher the valence of the counter ion, the higher the coagulation efficiency.
The coagulation value of monovalent ions was 25–150 mmol/L. In this experiment, the counter ion was ammonium (NH4+), and the concentration was about 66 mmol/L. Therefore, there was a coagulation effect in the solution. According to the Burton–Bishop rule [29], the concentration of a solution also affects the coagulation value of the electrolyte. Generally, for monovalent counter ions, the coagulation value increases when the solution is diluted. The smaller the value of coagulation, the stronger the coagulation effect and the greater the coagulation capacity.
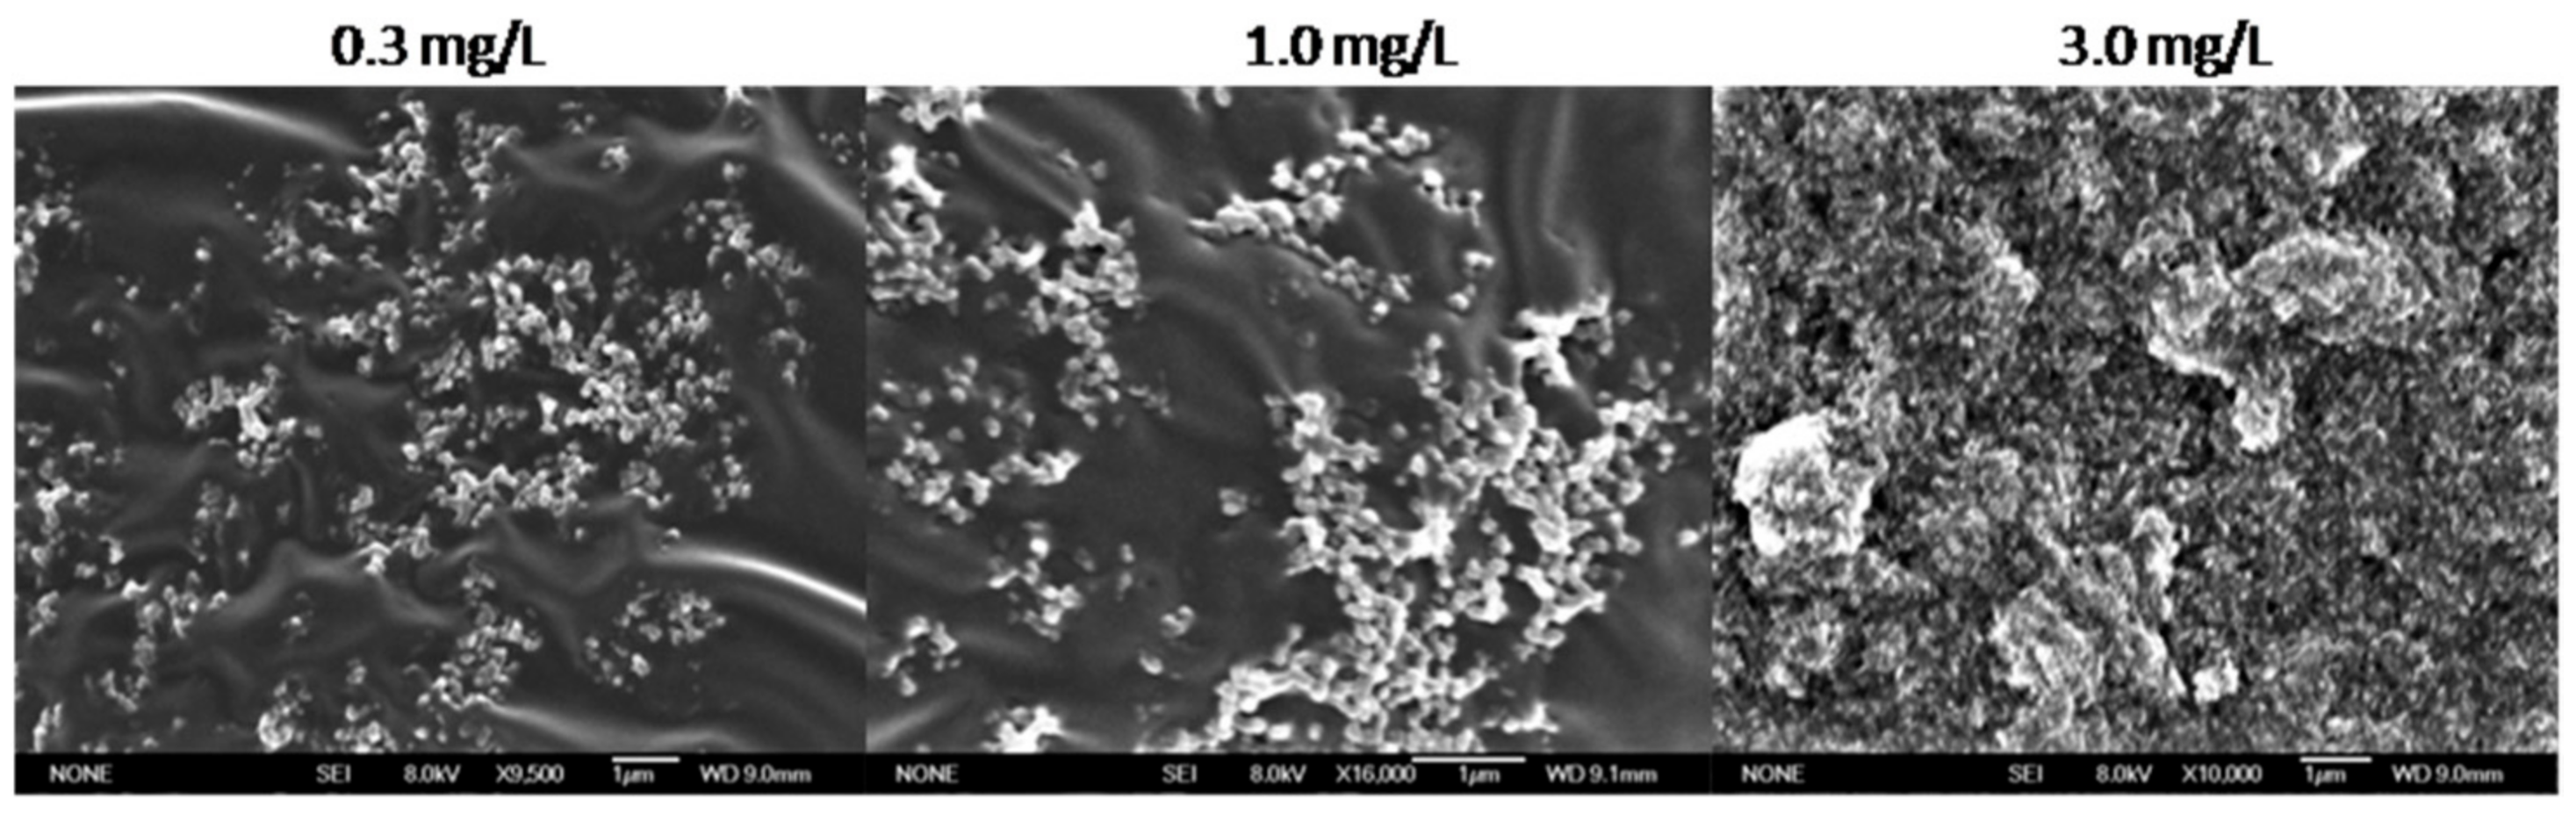
In this experiment, with the increase in the concentration of Fe (III) in the recharge solution, the concentration of monovalent counter ions increased, the coagulation value of solution decreased, the coagulation effect increased, and the size of iron hydroxide colloid increased. The iron hydroxide colloidal particles in solution are shown in Figure 11. At 0.3 mg/L, the diameter of colloidal particles was greater than 0.1 μm. A higher concentration appeared to increase the number of iron hydroxide colloidal particles, as well as their diameter; for 3.0 mg/L, colloidal particles appeared to form a film and exhibit a diameter greater than 10 μm.
Fe (III) exists in the form of iron hydroxide colloidal particles in the recharge water, where the higher the concentration, the easier it is to coagulate, which increases the particle size effect during the clogging process. Therefore, at the beginning of the experiment, the hydraulic conductivity of the highest Fe (III) concentration decreased the most rapidly, and the clogging material of lower Fe (III) concentration passed through the pores easily and formed a slow and stable clog.
Due to the coagulation effect, the iron hydroxide colloid particles flocculated as a membrane coating on the surface layer of the infiltrated media and were subjected to surface layer interception filtration. Then, cake filtration (Figure 9b) [27] proceeded as the previously retained particles lodged other mobile particles, and the clogging layer was compressed during the accumulation of particles. The clogging formed by cake filtration was not easily broken; therefore, the clogging was relatively stable at the end of the experiment, and the hydraulic conductivity did not fluctuate greatly.
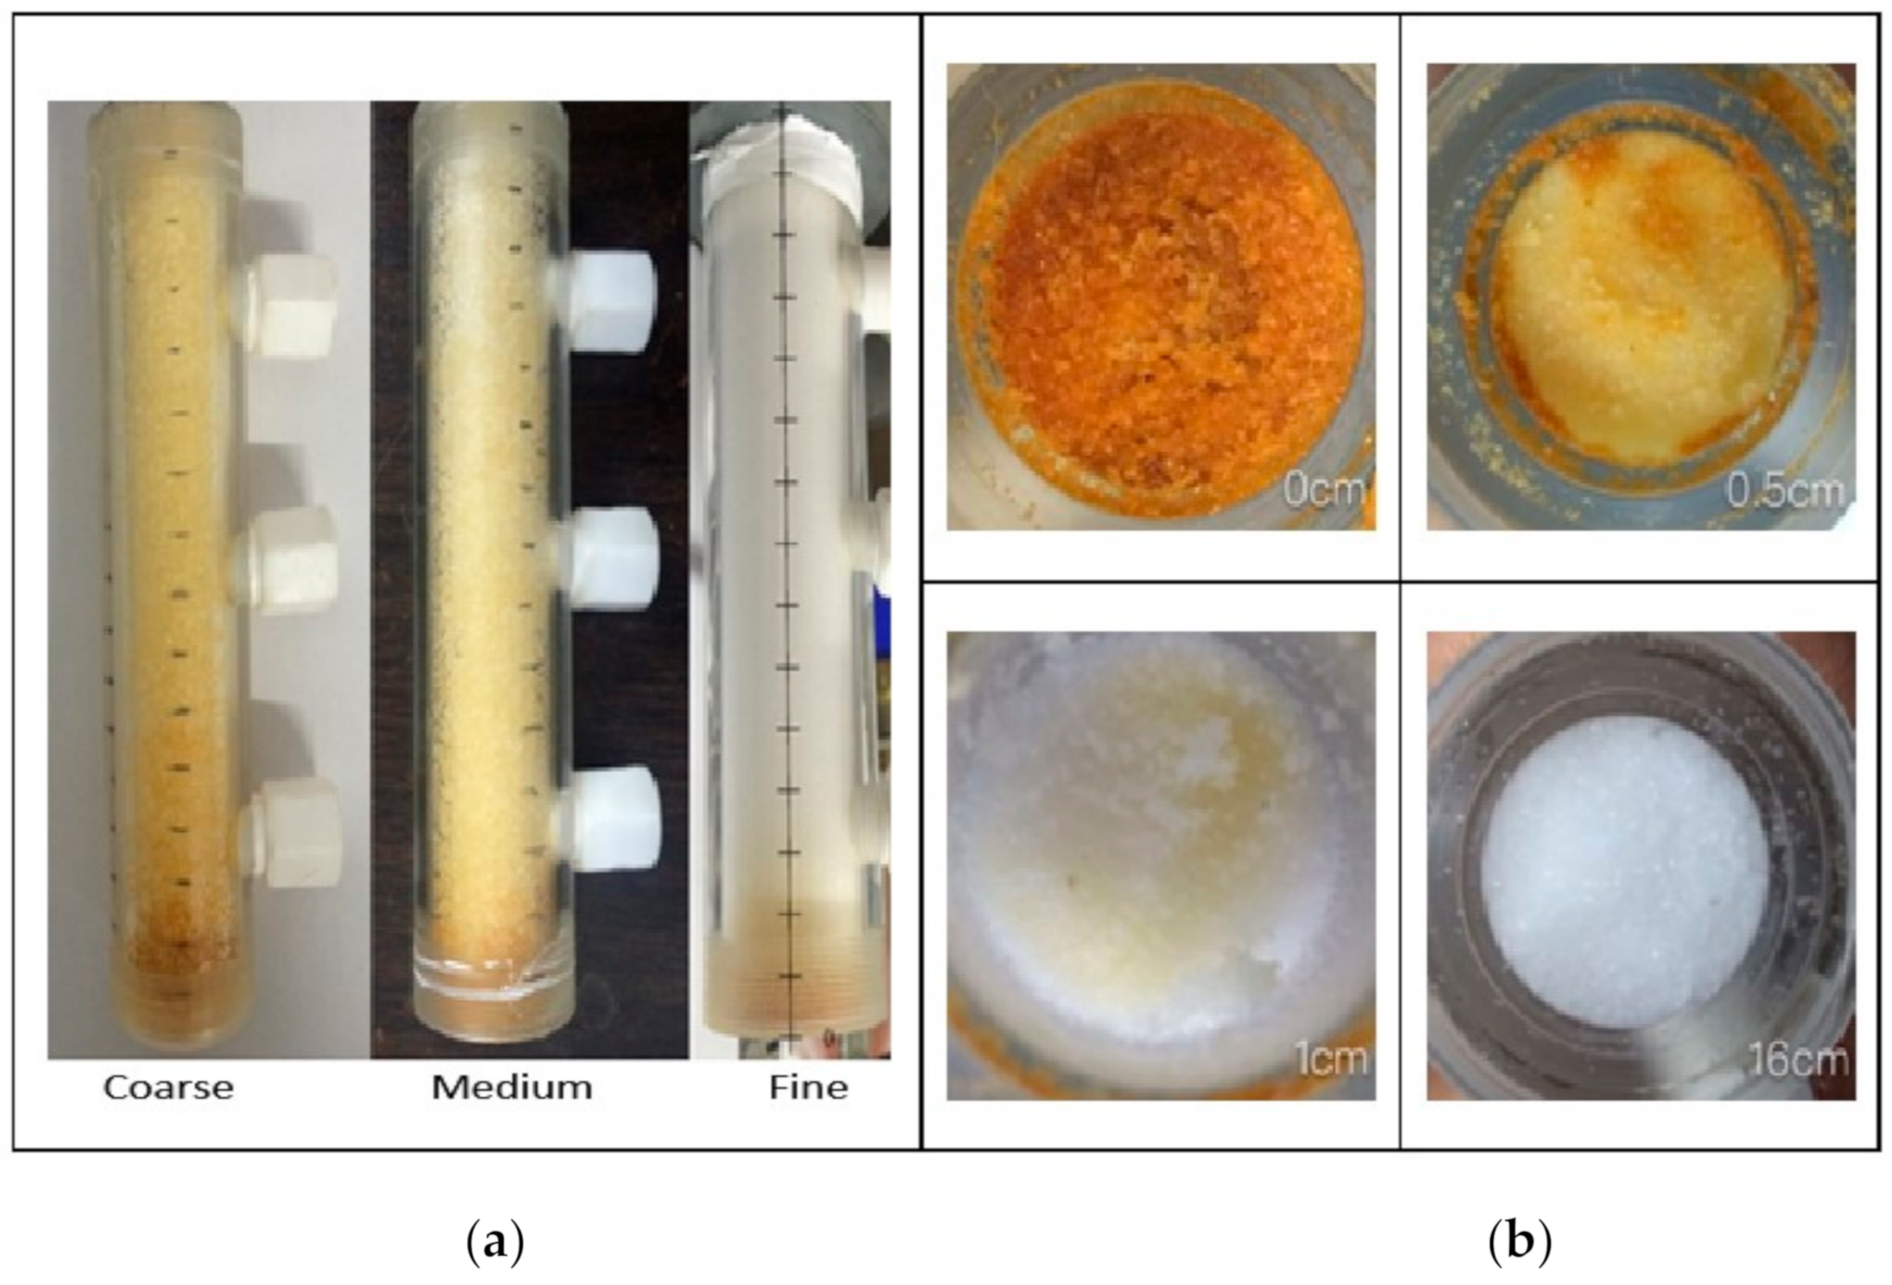
Therefore, the surface of the sand column had a red–brown blocking sedimentary layer (Figure 12a), and the larger the diameter of the infiltration medium, the larger the range of the red–brown sedimentary layer. The fine sand was only 0.5 cm (Figure 12b). This indicates that the larger the size of the infiltration medium and the larger the pore diameter, the easier it was for the clogging material to enter the infiltration medium. Hence, the degree of clogging of the coarse sand was the lightest, and the hydraulic conductivity oscillated greatly.
3.3.2. Depth Filtration
Depth filtration (Figure 13) takes place when the particles are smaller than the media pores. These particles can travel a certain distance in the column until they are captured and deposited during the passage process [14], such as with pore throat blockage. The median particle size of the infiltration medium is large, and the smaller the specific surface area, the easier the iron hydroxide colloid enters the sand column through interception. In the coarse sand experiment column, the iron hydroxide colloidal particles easily entered the inside of the column through the surface layer to form a clog. Therefore, the permeability changes at 3–16 cm of media were similar to those of the whole coarse sand column.
For different Fe (III) concentrations, the hydraulic conductivity at 3–16 cm remained unchanged, and no depth filtration occurred. For different infiltration media, the hydraulic conductivity at 3–16 cm only decreased in coarse sand. Therefore, only infiltration medium D50 over 0.7 mm underwent depth filtration, independent of the recharge Fe (III) concentration.
3.3.3. Deposition
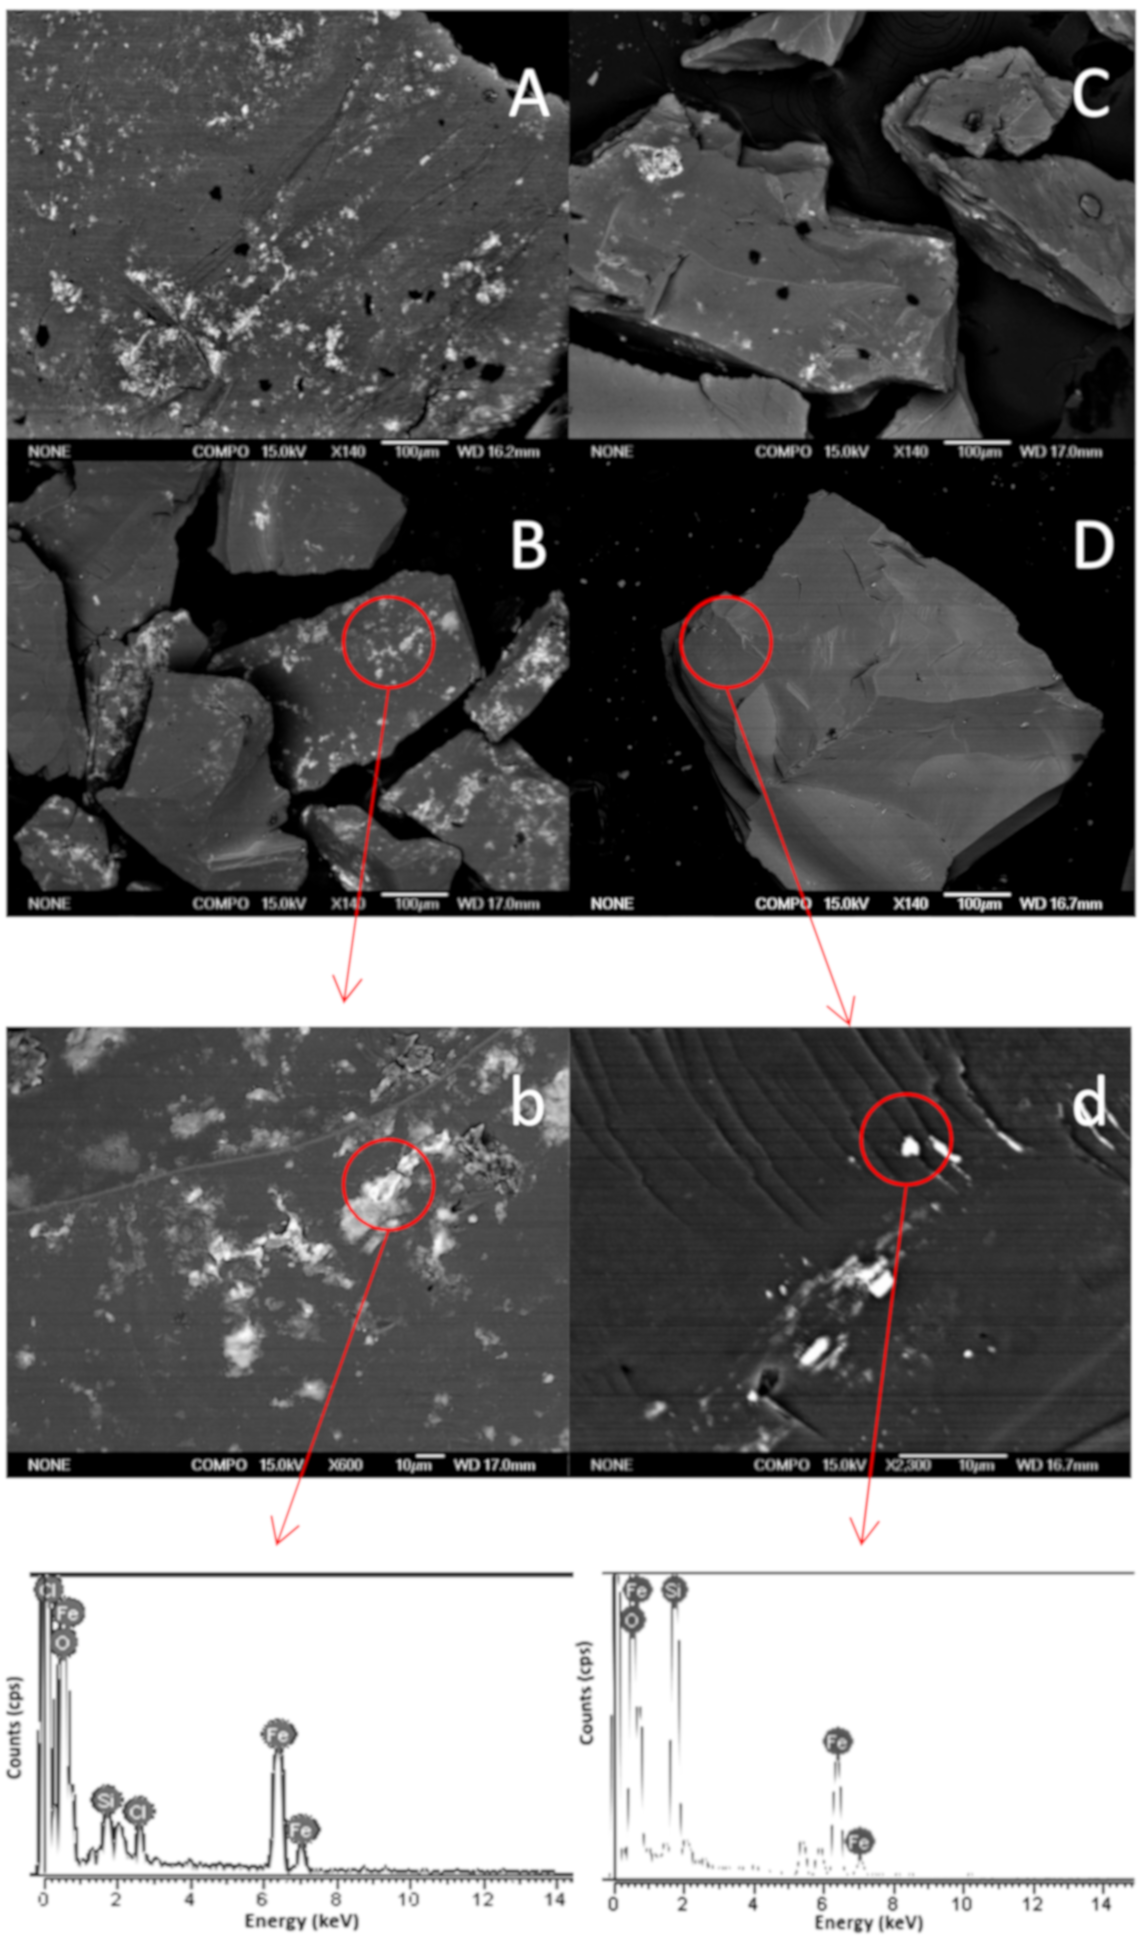
After the experiment, the quartz sand particles were examined using scanning electron micrographs (SEM), and in Figure 14, the white point/region on the quartz sand represents an iron hydroxide colloid. Additionally, there were two forms of iron hydroxide colloids: One was granular and attached to sand, and the other was a large-sized flocculent membrane coating the quartz sand. The flocculent mostly existed at the inlet section, as shown in Figure 14b, and for the high concentration (Figure 14B) was larger than that for the low concentration (Figure 14C). The colloid size in fine sand (Figure 14B) was larger than that in the coarse sand (Figure 14A). There was almost no white region at the outlet section after local amplification, only a few granular substances, as shown in Figure 14d. According to the analysis of white region elements, Table 5 and Table 6, the iron content of the flocculent membrane was higher than that of the granular substances.
As Figure 12a shows, for different infiltration media, that the clogging extent of the sand column became greater with an increase in the particle size of the infiltration medium. The coarser the infiltration medium, the longer the distance of Fe (III) migration, but generally, it still tended to deposit on and near the surface of the sand column, especially in the fine sand, which is why the white point/region was larger. Due to the lower concentration of Fe (III) in the recharge water, the coagulation effect was small, and the sand column was not easily clogged. Due to the particle size of the colloidal particles being small, it was easier for them to enter the sand column and be retained.
3.3.4. Adsorption
The mechanism of retention of Fe (III) in the column not only involved deposition but also adsorption. The results of the adsorption experiment are shown in Figure 15. The best adsorption time was 48 h; the best L/S was 30; the maximum adsorption amounts of E1, E2, E3, E4, and E5 were 0.065, 0.065, 0.076, 0.015, and 0.002 mg/g, respectively; and the corresponding adsorption ratios (Ra) were 72.22%, 72.22%, 84.44%, 50.0%, and 22.22%.
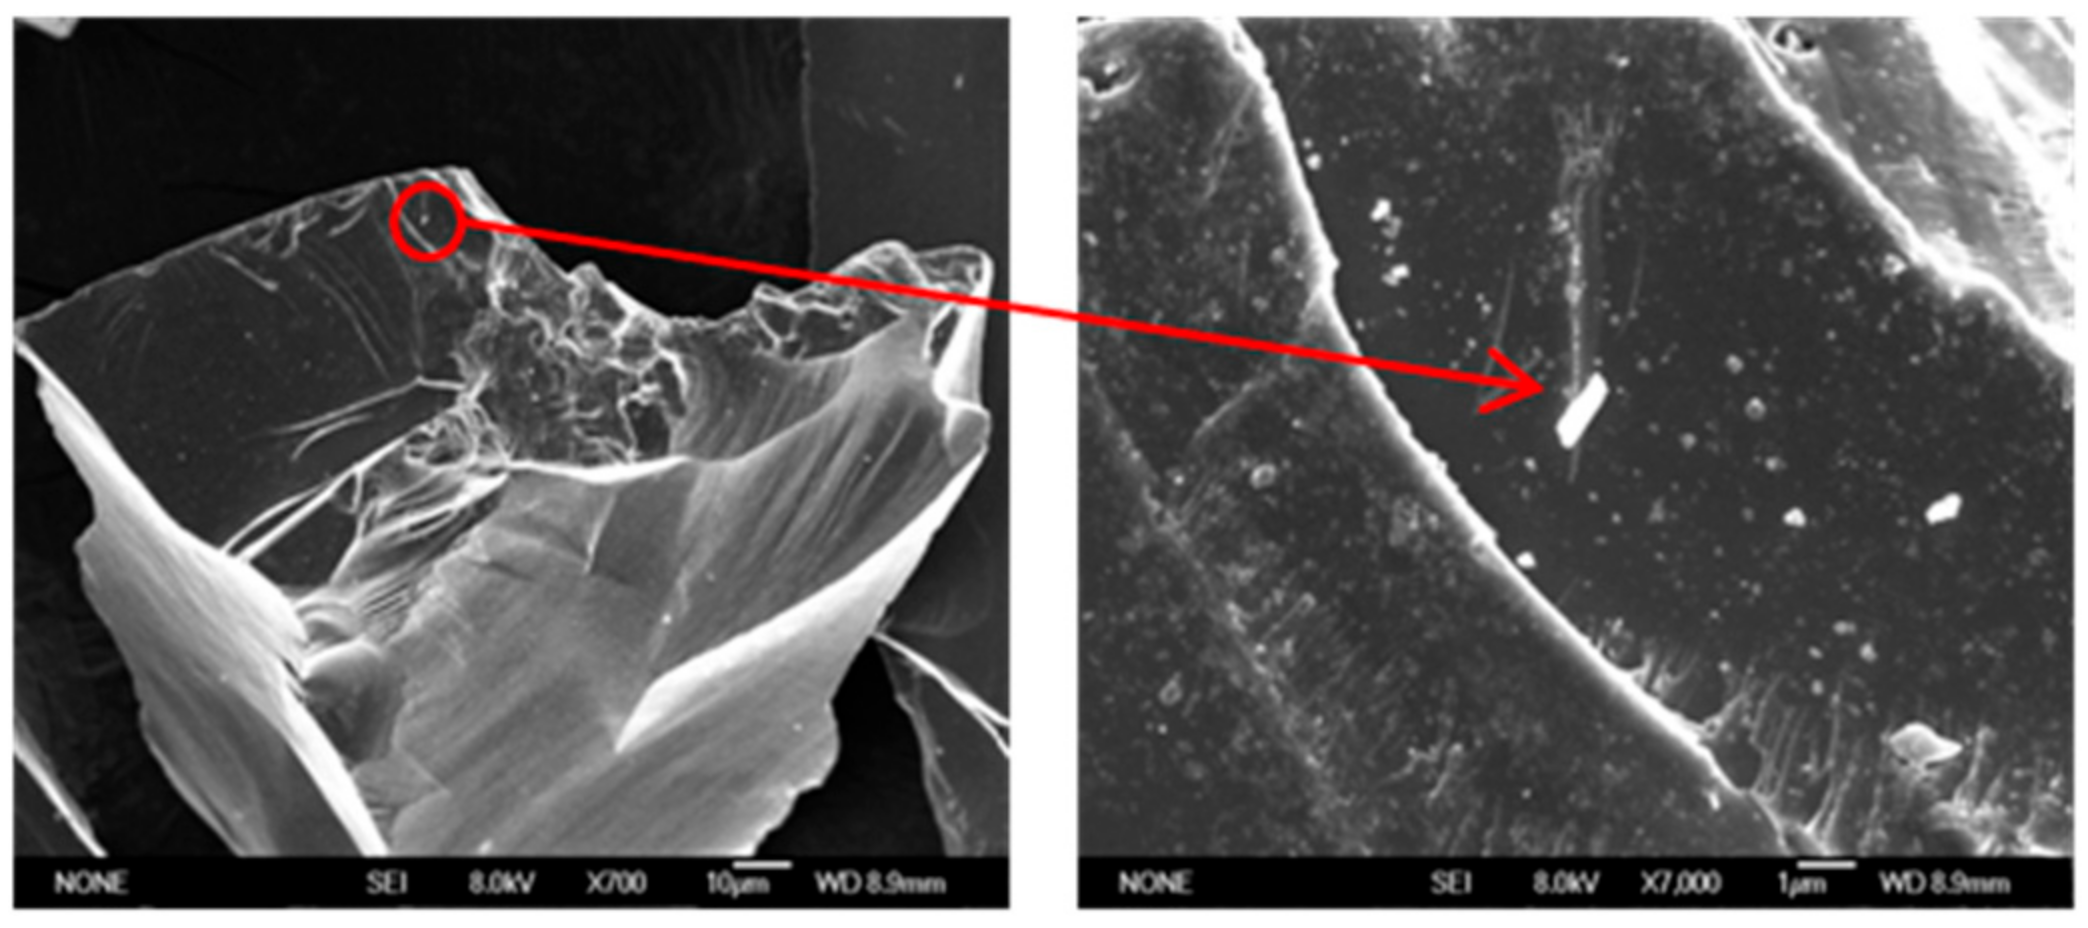
It can be seen from the adsorption SEM (Figure 16) that the white light spot on the quartz sand was the iron hydroxide colloid, and, from the enlarged observation, the colloidal particles were adsorbed on the quartz sand, which is the same as for the outlet section of the sand column in Figure 14d. The elemental analysis (Table 7) shows that the iron content was similar. Therefore, Fe (III) was retained inside the column due to adsorption.
The adsorption performance depends on the nature of the adsorbent, the size of the surface area of the adsorbent, the nature and concentration of the adsorbate, and the temperature. As the adsorption occurs on the sand surface, the larger the specific surface area of the adsorbent, the stronger the adsorption capacity [30,31]. Therefore, the high Fe (III) concentration of the fine sand shows the largest adsorption capacity and the largest adsorption ratio.
Fe (III) was mainly deposited at the inlet of the sand column, and adsorption may have occurred inside the sand column. Therefore, as Table 8 shows, there was over 80% Fe (III) retention in the sand column due to deposition, and E3 and E5 exhibited values of over 90%. As the sand was loaded with a fixed density in the experiment, there was approximately 80 g of sand in each column, and about 70 g of sand at 2–16 cm. Since the time of each experiment was much longer than 48 h and the L/S was also much more than 30, the saturation of the solid by adsorption should have been exceeded.
The maximum adsorption capacity of quartz sand in the sand column at 2–16 cm (MA2–16cm) was obtained by multiplying the maximum adsorption amount by the mass of the quartz sand. Comparing M2–16cm and MA2–16cm, we found that, except for E3, the mass of Fe (III) retained in the sand column was generally larger than the maximum adsorption, MD2–16cm < 0. For coarse sand (E1) and a low Fe (III) concentration (E5), the adsorption amount was much smaller than the retention amount; therefore, there should have been deposition in the sand column.
As it is difficult for quartz sand to adsorb many iron hydroxide colloidal particles, a temporary pore throat blockage occurred inside, which caused internal permeability fluctuations of the sand column. When the Fe (III) concentration was low, the colloidal particles of iron hydroxide produced were very small, and the colloidal phenomenon was not obvious. In a static adsorption experiment, the solution was always in an oscillating state, and the colloidal particles could not easily coagulate. However, in a recharge experiment, colloidal particles were more likely to be deposited on the quartz sand particles, because the colloidal particles had a smaller particle size, and thus clogging was less likely to occur.
4. Conclusions
This paper presented an experimental work investigating the impact of Fe (III) on the permeability of the infiltration medium during urban rainwater groundwater recharge. The influence of the size of the infiltration medium and Fe (III) concentration of recharge water on the permeability change was discussed. The study highlighted the interaction of the experiment condition effects on clogging mechanisms as follows:
(1) Spatial and temporal development of the infiltration medium permeability. For different infiltration media, the permeability of fine sand decreased the fastest, while medium and coarse sand exhibited an oscillating decline. For different Fe (III) concentrations in the recharge water, the permeability decreased stably, and the highest concentration declined the fastest. The development trends of the permeability at 0–3 cm of the sand column were similar to those of the whole column; however, the clogging degree was more serious.
(2) The retention mass of Fe (III) changed with different infiltration media and Fe (III) concentrations in the recharge water. More than 80% of the Fe (III) was retained in the sand column, of which, more than 50%wasretained within 1 cm of the column inlet. The retention increased with time for all experiments in a linear fashion, and, for different infiltration media, the mass retention rates at the stable stage were similar. For different Fe (III) concentrations in the recharge water, the mass retention rates at the stable stage increased with the concentration.
(3) Decreased hydraulic conductivity indicated that column clogging had occurred, and the clogging mainly occurred at the inlet section of the sand column and inside coarse sand in this study. The Fe (III) concentration in the recharge water influenced the clogging degree, and the infiltration medium influenced the depth of the clogging extent in the column.
(4) The main material that caused clogging of the sand column was iron hydroxide colloids, which were in a granular form and attached to sand or in a flocculent membrane form coating the quartz sand. The higher the concentration was, the greater the coagulation effect, and, the larger the particle size of the formed polymer, the more serious the surface clogging. The diameter of 0.3 mg/L iron hydroxide colloidal particles was over 0.1 μm, and a higher concentration increased the number of iron hydroxide colloidal particles, as well as their diameter. For 3.0 mg/L, colloidal particles with a diameter of over 10 μm formed a film coating the sand surface.
(5) The Fe (III) clogging mechanism was a combination of surface filtration, depth filtration, deposition, and adsorption. Surface filtration involved blocking filtration and cake filtration. For different Fe (III) concentrations in the recharge water, the main clogging mechanism was blocking filtration and then cake filtration. For different infiltration media, when the infiltration medium D50 was between 0.38 and 0.7 mm, the mechanism was blocking filtration, and, when it was over 0.7 mm, the mechanism was depth filtration. The retention of Fe (III) in the column was mainly due to a deposition effect, with a value of over 80%. The adsorption was of a chemical nature and did not easily occur—mostly occurring inside of the column. The deposition in the sand column mostly occurred at the inlet of the column, leading to surface filtration, and inside the coarse sand, leading to pore throat blockage.
The adsorption of Fe (III) by the quartz sand likely involved the oxygen atoms of quartz and was strongly affected by the experimental conditions used (e.g., the pH, ionic strength, type of counterions, etc.). Adsorption may also facilitate coagulation. In this paper, there was no further study on these conditions, as they will be discussed in the future.
Author Contributions
All authors are participants in the research projects described in this paper. H.Z. and X.D. conducted the experiment and preparing manuscript, X.Y. revised the article. All authors have read and agreed to the published version of the manuscript.
Funding
This research was funded by National Natural Science Foundation of China, grant number 41672231.
Institutional Review Board Statement
Not applicable.
Informed Consent Statement
Not applicable.
Conflicts of Interest
The authors declare no conflict of interest.
References
- Zeng, B.; Guo, Q.; Tao, H. Application of Rainwater Utilization Facilities in Arid and Semi-arid Cities of Northern China. Build. Technol. Dev. 2019, 46, 98–99. [Google Scholar]
- Barraud, S.; Gonzalez-Merchan, C.; Nascimento, N.; Moura, P.; Silva, A. A method for evaluating the evolution of clogging: Application to the pampulha campus infiltration system (Brazil). Water Sci. Technol. 2014, 69, 1241–1248. [Google Scholar] [CrossRef] [PubMed]
- Kumar, S.; Kamra, S.K.; Yadav, R.K.; Sharma, J.P. Evaluation of sand-based stormwater filtration system for groundwater recharge wells. Curr. Sci. 2012, 103, 395–404. [Google Scholar]
- Du, X.; Ye, X.; Lu, Y.; Chi, B.; Steffen, B.; Yang, Y. Advances in Clogging Research of Artificial Recharge. Adv. Earth Sci. 2009, 24, 973–980. [Google Scholar]
- Martin, R.R.; Dillon, P. Aquifer Storage and Recovery: Future Directions for South Australia; CSIRO Land and Water Department of Water, Land and Biodiversity Conservation: Canberra, Australia, 2002. [Google Scholar]
- Pan, J.; Chen, Y.; Dong, J.; Wang, C. Heavy metal distribution characteristics in the rainwater runoff of Shenyang zone. J. Shenyang Jianzhu Univ. Nat. Sci. 2015, 31, 730–736. [Google Scholar]
- Du, X.; Wang, Z.; Ye, X. Potential clogging and dissolution effects during artificial recharge of groundwater using potable water. Water Resour. Manag. 2013, 27, 3573–3583. [Google Scholar] [CrossRef]
- Martin, R. (Ed.) Clogging Issues Associated with Managed Aquifer Recharge Methods; IAH Commission on Managing Aquifer Recharge: Adelaide, Australia, 2013. [Google Scholar]
- Areerachakul, N.; Kitiphatmontree, M.; Kandasamy, J.; Kus, B.; Duangduen, C.; Pivsa-Art, S.; Vigneswaran, S. Submerged membrane system with biofilter as a treatment to rainwater. Water Air Soil Pollut. Focus 2009, 9, 431. [Google Scholar] [CrossRef] [Green Version]
- Page, D.; Vanderzalm, J.; Dillon, P.; Gonzalez, D.; Barry, K. Stormwater quality review to evaluate treatment for drinking water supply via managed aquifer recharge. Water Air Soil Pollut. 2016, 227, 322. [Google Scholar] [CrossRef]
- Vlastos, D.; Antonopoulou, M.; Lavranou, A.; Efthimiou, I.; Dailianis, S.; Hela, D.; Lambropoulou, D.; Paschalidou, A.K.; Kassomenos, P. Assessment of the toxic potential of rainwater precipitation: First evidence from a case study in three Greek cities. Sci. Total Environ. 2019, 648, 1323–1332. [Google Scholar] [CrossRef]
- Igbinosa, I.H.; Aighewi, I.T. Quality assessment and public health status of harvested rainwater in a peri-urban community in Edo State of Nigeria. Environ. Monit. Assess. 2017, 189, 405. [Google Scholar] [CrossRef]
- Yuan, H.; Li, X.; Wang, X. Heavy metals pollution and analysis of seasonal variation runoff in Xi’an. Huan Jing KeXue 2014, 35, 4143–4147. [Google Scholar]
- Wang, Z. Laboratory Research on the Law of Suspended Solids Clogging During Urban Stormwater Groundwater Recharge. Ph.D. Thesis, Jilin University, Jilin, China, 2012. (In Chinese). [Google Scholar]
- Australian Water Resources Council. Australian Drinking Water Guidelines; National Health and Medical Research Council: Canberra, Australia, 2004.
- United State Environmental Protection Agency (USEPA). Guidelines for Water Reuse; Agency for International Development: Washington, DC, USA, 1999.
- Massachusetts Department of Environmental Protection. Interim Guidelines on Reclaimed Water (Revised); Department of Environmental Protection: New York, NY, USA, 2000; Available online: https://archive.org/details/interimguideline00mass (accessed on 24 January 2021).
- Jin, C. (Ed.) Practical Manual of Water Quantity and Water Quality Technology; Standards Press of China: Beijing, China, 2007. (In Chinese) [Google Scholar]
- Omura, T.; Umita, T.; Nenov, V.; Aizawa, J.; Onuma, M. Biological oxidation of ferrous iron in high acid mine drainage by fluidized bed reactor. Water Sci. Technol. 1991, 23, 1447–1456. [Google Scholar] [CrossRef]
- Mays, D.C.; Hunt, J.R. Hydrodynamic and chemical factors in clogging by montmorillonite in porous media. Environ. Sci. Technol. 2007, 41, 5666–5671. [Google Scholar] [CrossRef] [PubMed] [Green Version]
- Fernández Escalante, E. Practical management to minimize the effects of clogging in managed aquifer recharge wells at two sites in the Guadiana Basin, Spain. J. Hydrol. Eng. 2015, 20, B5014002. [Google Scholar] [CrossRef]
- Pavelic, P.; Dillon, P.J.; Barry, K.E.; Vanderzalm, J.L.; Correll, R.L.; Rinck-Pfeiffer, S.M. Water quality effects on clogging rates during reclaimed water ASR in a carbonate aquifer. J. Hydrol. 2007, 334, 1–16. [Google Scholar] [CrossRef]
- Du, X.; Zhang, H.; Ye, X.; Lu, Y. Flow Velocity Effects on Fe (III) Clogging during Managed Aquifer Recharge Using Urban Storm Water. Water 2018, 10, 358. [Google Scholar] [CrossRef] [Green Version]
- Eliassen, R. An Experimental and Theoretical Investigation of the Clogging of a Rapid Sand Filter. Ph.D. Thesis, Massachusetts Institute of Technology, Cambridge, MA, USA, 1935. [Google Scholar]
- Faber, S.; Al-Maktoumi, A.; Kacimov, A.; Al-Busaidi, H.; Al-Ismaily, S.; Al-Belushi, M. Migration and deposition of fine particles in a porous filter and alluvial deposit: Laboratory experiments. Arab. J. Geosci. 2016, 9, 293. [Google Scholar] [CrossRef]
- Department of Chemistry, Physical and Chemical Teaching and Research Group of Nanchong Teachers College. Determination of solubility product of insoluble metal hydroxide. J. China West Norm. Univ. Nat. Sci. 1980, 1, 25–27. [Google Scholar]
- Pérez Paricio, A. Integrated Modelling of Clogging Processes in Artificial Groundwater Recharge. Ph.D. Thesis, UniversitatPolitècnica de Catalunya, Barcelona, Spain, 2001. [Google Scholar]
- Trefalt, G. Derivation of the inverse Schulze-Hardy rule. Phys. Rev. E 2016, 93, 032612. [Google Scholar] [CrossRef] [Green Version]
- Fisher, E.; Sorum, C.H. Chromium Hydroxide Hydrosols and the Burton-Bishop Rule. J. Phys. Chem. 2002, 39, 283–288. [Google Scholar] [CrossRef]
- Papelis, C.; Um, W.; Russell, C.E.; Chapman, J.B. Measuring the specific surface area of natural and manmade glasses: Effects of formation process, morphology, and particle size. Colloids Surf. A Physicochem. Eng. Asp. 2003, 215, 221–239. [Google Scholar] [CrossRef]
- Samoilov, V.M. Specific surface area, shape, and size of fine carbon filler particles. Inorg. Mater. 2010, 46, 818–823. [Google Scholar] [CrossRef]
Figure 1.
Experimental column set up.

Figure 2.
Permeability results in different media.

Figure 3.
The permeability in different Fe (III) concentrations in recharge water.

Figure 4.
The permeability changes at different locations for the infiltration medium. (a) Inlet part of the column (0–3 cm). (b) Outlet part of the column (3–16 cm).
Figure 4.
The permeability changes at different locations for the infiltration medium. (a) Inlet part of the column (0–3 cm). (b) Outlet part of the column (3–16 cm).


Figure 5.
Permeability at different locations for the Fe (III) concentration in recharge water. (a) Inlet of the column (0–3 cm). (b) Outlet of the column (3–16 cm).
Figure 5.
Permeability at different locations for the Fe (III) concentration in recharge water. (a) Inlet of the column (0–3 cm). (b) Outlet of the column (3–16 cm).


Figure 6.
The mass ratio between the inlet and total column for different conditions.

Figure 7.
The calculated Fe (III) mass retained in the column.

Figure 8.
The mass retention rates for different experiments.

Figure 9.
Schematic diagram of the two surface filtration mechanisms. (a) Blocking filtration. (b) Cake filtration.
Figure 9.
Schematic diagram of the two surface filtration mechanisms. (a) Blocking filtration. (b) Cake filtration.

Figure 10.
Tyndall experiment results with different Fe (III) concentrations.

Figure 11.
Scanning electron micrographs of Fe (III) in the recharge water.

Figure 12.
The clogging phenomena in the sand column. (a) The clogging extent in different sand columns. (b) The clogging degree at different depths of the fines and column.
Figure 12.
The clogging phenomena in the sand column. (a) The clogging extent in different sand columns. (b) The clogging degree at different depths of the fines and column.

Figure 13.
Schematic diagram of the depth filtration mechanisms.

Figure 14.
Scanning electron micrographs (SEM) of the sand columns at the end of the experiment. (A–C) show the inlet of the column (0–1 cm) of E1, E3, and E5. (D) is the outlet of the column (15–16 cm) of E1; (b) and (d) are the (B) and (D) local magnifications.
Figure 14.
Scanning electron micrographs (SEM) of the sand columns at the end of the experiment. (A–C) show the inlet of the column (0–1 cm) of E1, E3, and E5. (D) is the outlet of the column (15–16 cm) of E1; (b) and (d) are the (B) and (D) local magnifications.

Figure 15.
The adsorption experiment employed to determine the optimum liquid/solid (L/S) ratio, adsorption time, and maximum adsorption amount.
Figure 15.
The adsorption experiment employed to determine the optimum liquid/solid (L/S) ratio, adsorption time, and maximum adsorption amount.

Figure 16.
Scanning electron micrographs of the adsorption experiment with fine sand and a 3.0 mg/L Fe (III) concentration.
Figure 16.
Scanning electron micrographs of the adsorption experiment with fine sand and a 3.0 mg/L Fe (III) concentration.


Table 1.
The content of heavy metals in stormwater for different countries (mg/L). AWDG, Australian Drinking Water Guidelines.
Table 1.
The content of heavy metals in stormwater for different countries (mg/L). AWDG, Australian Drinking Water Guidelines.
| Thailand | Australia | Greece | Nigeria | China | AWDG (2004) | |||||
|---|---|---|---|---|---|---|---|---|---|---|
| Ayudhaya | Rmutt | Parafield | Mount Gambier | Patras | Corfu | Oluku | Xi’an | Beijing | ||
| pH | 6.4 | 6.7 | 7.0 | 5.8 | 5.37 | 5.65 | 7.48 | 6.5–8.5 | ||
| Al | 0.001 | 0.004 | 0.096 | 0.381 | <0.2 | |||||
| Mn | 0.001 | 0.006 | 0.097 | 0.059 | <0.1 | |||||
| Zn | 0.150 | 0.190 | 0.100 | 0.210 | 0.036 | 0.071 | 0.360 | 0.138 | 0.007 | <3.0 |
| Cu | 0.030 | 0.190 | 0.007 | 0.003 | 0.045 | 0.006 | <2.0 | |||
| Pb | 0.017 | 0.174 | 0.006 | 0.001 | <0.01 | |||||
| Fe | 0.540 | 0.875 | 1.800 | 0.840 | 0.087 | 0.033 | 1.550 | 0.408 | 0.029 | <0.3 |
Table 2.
The experimental conditions.
| No. | E1 | E2 | E3 | E4 | E5 |
|---|---|---|---|---|---|
| r/mm | 0.50–1.00 | 0.22–0.50 | <0.22 | <0.22 | <0.22 |
| D50/mm | 0.70 | 0.38 | 0.16 | 0.16 | 0.16 |
| Fe (III)/mg/L | 3.00 | 3.00 | 3.00 | 1.00 | 0.30 |
r is the diameter range of quartz sand particles, which was obtained by sieving. D50 is the particle size of a quartz sand sample when the cumulative particle size distribution percentage reaches 50%, which is also called median diameter or median particle size.
Table 3.
The values of the fitting parameters.
| No. | R2 | |||
|---|---|---|---|---|
| E1 | 1.743 | 1.249 | 0.019 | 0.996 |
| E2 | 3.039 | 1.582 | 0.013 | 0.997 |
| E3 | 87.234 | 4.523 | 0.003 | 1.000 |
| E4 | 19.915 | 3.303 | 0.015 | 0.999 |
| E5 | 8.962 | 3.038 | 0.034 | 0.992 |
R2 is the coefficient of determination.
Table 4.
Mass ratios for different layers in the column.
| No. | RMT (%) | RM 0–1 cm (%) | RM 1–2 cm (%) | RM 2–16 cm (%) | dM/dt (mg/h) | σ (%) | |
|---|---|---|---|---|---|---|---|
| E1 | 77.07 | 52.05 | 14.83 | 33.12 | 0.147 | 81.67 | 2.27 |
| E2 | 81.06 | 63.94 | 14.11 | 21.95 | 0.150 | 83.33 | 2.80 |
| E3 | 84.97 | 94.95 | 1.29 | 3.76 | 0.155 | 86.11 | 1.47 |
| E4 | 80.09 | 74.75 | 4.05 | 21.20 | 0.051 | 85.00 | 0.23 |
| E5 | 92.51 | 46.37 | 5.54 | 48.09 | 0.018 | 97.22 | 0.15 |
There are two methods to obtain the mass of Fe (III) in the column: one is dismantling the column after the end of experiment, and the other is to calculate the mass of Fe (III) retained in the column by detecting the concentration of Fe (III) in the outlet during the experiment, where σ is the error of the two methods, which is used to obtain the mass of Fe (III) in the column.
Table 5.
The elemental analysis (SEM) of the flocculent membrane (Figure 14b).
Table 5.
The elemental analysis (SEM) of the flocculent membrane (Figure 14b).
| Element | Weight (%) | Atomic (%) | Compounds (%) | Formula |
|---|---|---|---|---|
| Si | 4.90 | 5.79 | 10.49 | SiO2 |
| Cl | 2.34 | 2.19 | 0.00 | |
| Fe | 67.76 | 40.22 | 87.17 | FeO |
| O | 25.00 | 51.80 | ||
| Total | 100.00 |
Table 6.
The elemental analysis (SEM) of the granular substances (Figure 14d).
Table 6.
The elemental analysis (SEM) of the granular substances (Figure 14d).
| Element | Weight (%) | Atomic (%) | Compounds (%) | Formula |
|---|---|---|---|---|
| Si | 25.63 | 22.84 | 54.83 | SiO2 |
| Fe | 35.11 | 15.73 | 45.17 | FeO |
| O | 39.26 | 61.42 | ||
| Total | 100.00 |
Table 7.
The elemental analysis (SEM) of the adsorption (Figure 16).
Table 7.
The elemental analysis (SEM) of the adsorption (Figure 16).
| Element | Weight (%) | Atomic (%) | Compounds (%) | Formula |
|---|---|---|---|---|
| Si | 26.26 | 23.23 | 56.17 | SiO2 |
| Fe | 34.07 | 15.16 | 43.83 | FeO |
| O | 39.67 | 61.61 | ||
| Total | 100.00 |
Table 8.
The mass of Fe (III) in the sand column.
| No. | RMA (%) | RMD (%) | M2–16 cm (mg) | RM2–16 cm (%) | MA2–16 cm (mg) | RMA2–16 cm (%) | MD2–16 cm (mg) | RMD2–16 cm (%) |
|---|---|---|---|---|---|---|---|---|
| E1 | 19.52 | 80.48 | 7.72 | 33.12 | 4.55 | 58.94 | 3.17 | 41.06 |
| E2 | 18.53 | 81.47 | 5.39 | 21.95 | 4.55 | 84.40 | 0.84 | 15.60 |
| E3 | 3.76 | 96.24 | 0.83 | 3.76 | 5.32 | 100.00 | −4.49 | 0.00 |
| E4 | 13.01 | 86.99 | 1.71 | 21.20 | 1.05 | 61.37 | 0.66 | 38.63 |
| E5 | 5.71 | 94.29 | 1.35 | 48.09 | 0.16 | 11.88 | 1.19 | 88.12 |
Note: RMA is the ratio of Fe (III) retained on the sand column because of adsorption, and RMD is because of deposition. M2–16 cm is the measured result of the dismantling experiment, MA2–16 cm is the adsorption result calculated when the quartz sand is saturated, MD2–16 cm is the deposition result, and MD2–16 cm = M2–16 cm − MA2–16 cm. RMA2–16 cm is the ratio of the mass of Fe (III) retained on the 2–16 cm sand column because of the adsorption effect, and RMD2–16 cm is because of the deposition effect.
Publisher’s Note: MDPI stays neutral with regard to jurisdictional claims in published maps and institutional affiliations. |
© 2021 by the authors. Licensee MDPI, Basel, Switzerland. This article is an open access article distributed under the terms and conditions of the Creative Commons Attribution (CC BY) license (http://creativecommons.org/licenses/by/4.0/).
Share and Cite
MDPI and ACS Style
Zhang, H.; Ye, X.; Du, X. Laws and Mechanism of the Fe (III) Clogging of Porous Media in Managed Aquifer Recharge. Water 2021, 13, 284. https://doi.org/10.3390/w13030284
AMA Style
Zhang H, Ye X, Du X. Laws and Mechanism of the Fe (III) Clogging of Porous Media in Managed Aquifer Recharge. Water. 2021; 13(3):284. https://doi.org/10.3390/w13030284
Chicago/Turabian StyleZhang, Hexuan, Xueyan Ye, and Xinqiang Du. 2021. "Laws and Mechanism of the Fe (III) Clogging of Porous Media in Managed Aquifer Recharge" Water 13, no. 3: 284. https://doi.org/10.3390/w13030284
Note that from the first issue of 2016, this journal uses article numbers instead of page numbers. See further details here.