
Population Dynamics, Fishery, and Exploitation Status of Norway Lobster (Nephrops norvegicus) in Eastern Mediterranean


Department of Ichthyology and Aquatic Environment, School of Agriculture Sciences, University of Thessaly, 38446 Volos, Greece
*
Author to whom correspondence should be addressed.
Water 2021, 13(3), 289; https://doi.org/10.3390/w13030289
Submission received: 30 December 2020
/
Revised: 14 January 2021
/
Accepted: 19 January 2021
/
Published: 25 January 2021
(This article belongs to the Special Issue Marine Aquatic Resources and Ecosystem Sustainability)
Abstract
:Norway lobster (Nephrops norvegicus) is one of the most valuable shellfish resources in the Mediterranean and the northeast Atlantic. Sustainable management of its fishery require long-term scientific monitoring of its stocks. Population dynamics, fishery, and exploitation status of the Norway lobster were studied over a long time series (between 2008 and 2014) in a semi enclosed gulf in Easter Mediterranean (Pagasitikos Gulf). Sampling was carried out using a commercial bottom trawl with a codend mesh size of 28 mm in three different regions within the Gulf. Sex was identified macroscopically and all individuals were measured and weighed. Growth and Age groups were investigated by analysis of length–frequency distributions of the Carapace length (CL) for both sexes. Fishing, Natural and Total Mortality, along with Exploitation rate of the total stock were estimated by the FiSAT software package. Females were further examined and classified based on their maturity stage and the size at onset of sexual maturity was estimated by Probit analysis. Temporal differences in mean CL were detected for both sexes, with a tendency of lower values each year, along with a respective increase in Fishing Mortality and Exploitation Rate, indicating the effects of fishing pressure over the population. Size at onset of sexual maturity was estimated at 32.6 mm, higher than the official mesh sizes for creels (28 mm) and gillnets (26 mm). According to the analyses, the local Norway lobster stock is over-exploited, which should be taken under consideration by the regional policy makers.
1. Introduction
The Norway lobster Nephrops norvegicus, Linnaeus 1758, (hereafter referred to as “Nephrops”) is a common decapod crustacean inhabiting the muddy bottoms of the European continental shelves and slopes, at depths from 10 to 800 m. It is found throughout the northeast Atlantic and also in the western Mediterranean, the Adriatic, and the Aegean seas, with its distribution being limited by the extent of suitable muddy sediment in which animals construct their burrows [1].
Nephrops is fished wherever it is found in exploitable quantities and is one of the commercially most important demersal species in the north-east Atlantic [2]. Across Europe, it is considered an important target species in 34 Functional Management Units (FUs), with the UK and Ireland sharing the majority of landings from the North Atlantic stocks, followed by France, Iceland, Denmark, and Sweden [3]. Global capture production has reached a plateau and seems to fluctuate around 60,000 tonnes for the last 30 years [4].
Management of Nephrops stocks, just like all other fisheries in the European Union (EU), derives from a mixture of EU regulations (Common Fisheries Policy—CFP) and individual National laws. The proposed managing measures, such as the minimum landing size (MLS), total allowable catches (TACs) or maximum sustainable yield (MSY), are decided following biological scientific advices provided by the International Council for the Exploration of the Sea (ICES) [3,5,6]. The challenge which most management policies face is that, at least in the case of the Mediterranean Sea, they are not often successfully enforced and they are not revised according to the current state of stocks [7]. Since the marine ecosystems are constantly changing due to environmental factors and, mostly, pressure from human exploitation, fisheries and their stocks do not stay unaffected. In that context, fisheries management should not be based on just recent studies, but rather on long time series data in order to better understand the temporal changes in species abundance, distribution and biology [8].
Due to its importance and high economic value as a commercial species in the Atlantic and North Sea [2,3,9], Nephrops has been the subject of several biological and fishery studies [9,10,11,12,13,14,15,16,17,18,19,20,21,22,23,24,25,26,27,28,29], leading to the collection of long time series data for that region. In regard to the Mediterranean Sea, most of the studies have focused on the Western region and the Adriatic sea [7,8,13,15,30,31,32,33,34,35,36,37,38], with the majority of them within the framework of the EU research project “MEDITS” [39], contrary to even fewer studies in the Eastern Mediterranean and the Aegean Sea [40,41,42,43,44]. The aim of the present study was to fill that knowledge gap in the Eastern Mediterranean, since no such studies were found for the region. The goals were to study the local stock and estimate its exploitation status over a long time series, in order to assess the potential impact of the fishery to the population dynamics of Nephrops.
2. Materials and Methods
2.1. Sampling Area
Pagasitikos Gulf is a semi-enclosed bay, with a maximum depth of approximately 100 m and is an area of high interest for Nephrops, as this is the shallowest occurrence (<100 m depth) of the species in high quantities, in Greek waters. Sediments below 60 m are dominated by soft clay muds allowing full development of sedimentary burrowing communities [40]. Trawling is prohibited inside the gulf due to an official ban, established in 1966, as a conservational measure. However, artisanal fishing with bottoms nets and baited creels is still allowed, with seasonal closures in June–August for bottom nets and May–July for baited creels [44].
2.2. Trawl Survey
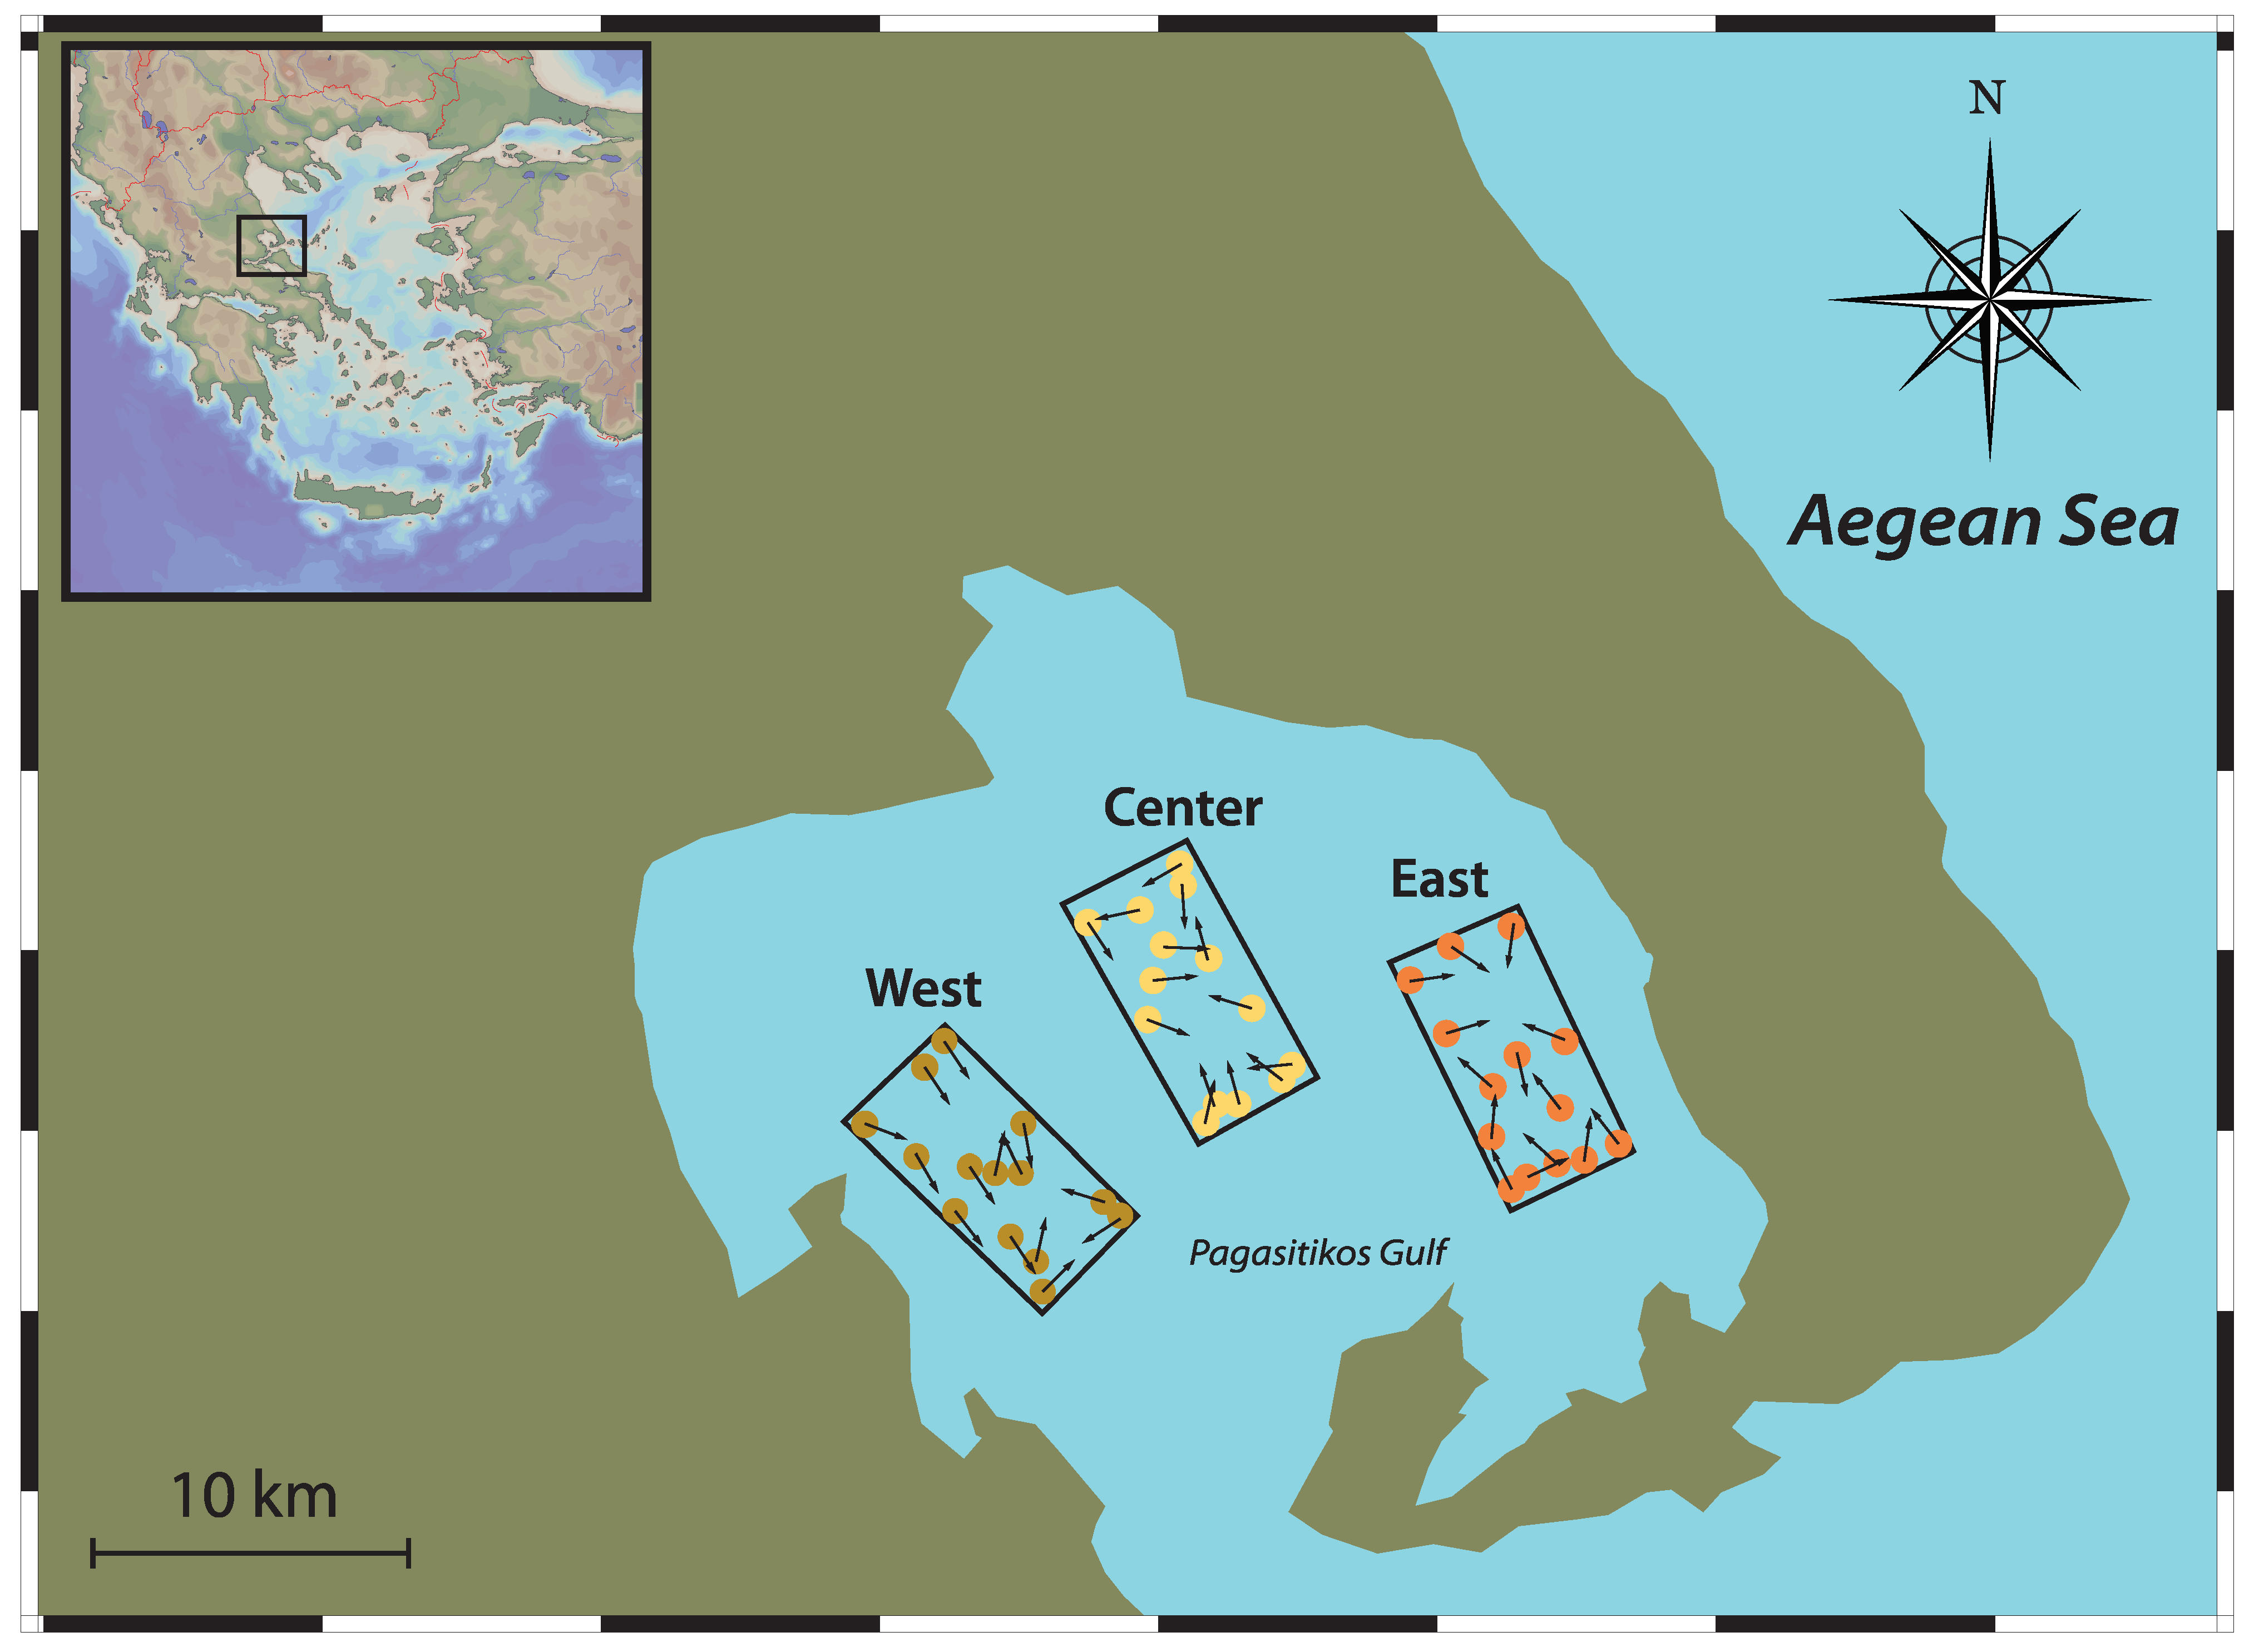
The survey design consisted of three distinct quadrants: at the western, center, and eastern part of the gulf, each spanning over an area of approximately 12 km2 (Figure 1), covering the range of previously recorded Nephrops burrow densities [40]. Samplings were carried for 2 consecutive days during the first week of June each year, in order to coincide with the maximum availability of female Nephrops on the sediment surface, which is estimated between April and August [41]. Every sampling day, three hauls were conducted, one in each quadrant, adding to a total of 42 hauls, over a 7-year period (2008–2014).
The bottom trawl was a traditional Greek commercial trawl with a codend mesh size of 28 mm (stretched). Speed of tow was approximately 2 knots. Starting position and depth were recorded when the trawl reached the bottom with wires fixed and then, position and depth were noted every 5 min until hauling. Hauling duration was approximately 30 min. Nephrops from each trawl haul were separated from the rest of the catch, placed in labeled polystyrene boxes packed with ice flakes and, at the end of the day, transported to the Laboratory for further processing.
2.3. Measurements
In the laboratory, samples were removed from the boxes, the ice flakes were washed away from the body and only individuals without missing parts were selected to be used for size and growth measurements. Wet body weight (BW) was measured to the nearest 0.01 g. Carapace length (CL) was measured with a digital caliper to the nearest 0.01 mm, as the distance between the post-orbital margin and the medial posterior border of the carapace. Individuals with CL < 20 mm (minimum landing size, MLS, Council Regulation (EC) No 1967/2006) were still included in the data and were considered as “recruits” [32].
Sex was determined macroscopically by observing the distinctive first pair of pleopods, which for males is harder and larger. Sex ratio (SR) was calculated as the proportion of females in the whole sample (SR = F/F + M) and tested for significant difference from the expected sex ratio (SR = 0.5, i.e., equal proportion of two sexes) using the chi-squared test.
2.4. Data Analysis
The null hypothesis of no significant differences in CL and BW values between sexes was tested using Student’s t-test and since significant differences were detected, following the recommendation by ICES, further analyses were carried out separately for each sex [7]. Spatial (among regions) and temporal (among years) variations in CL and BW values were tested using one-way ANOVA, while individual group differences were assessed by the Fisher’s LSD procedure. The Kolmogorov–Smirnov two sample test was used to detect any difference between female and male size distributions (DN, maximum distance between the cumulative distributions) and a Mann–Whitney test was used to compare medians (U statistic) [45]. The biometric relationship between CL and BW was estimated with the exponential model (BW = a × CLb), using linear regression analysis, while a t-test was applied to check for allometry (H0:b = 3) [46].
Length–frequency distributions (LFD) were constructed per 1-mm size class for each sex [12]. In order to identify mean lengths for the age groups present in the length distributions, the Modal Progression Analysis (MPA) of the “FiSAT II” software package (version 1.2.2, FAO, Rome, Italy) was used, by applying the Bhattacharya and NORMSEP analyses on the constructed LFD. All identified age groups were taken into account for analyses, but only the ones with n > 30 and Separation Index (SI) > 2 were considered “representative” [32]. Mean lengths-at-age results were used to estimate the parameters of the von Bertalanffy growth function (VBGF), with a non-linear regression analysis [13].
Total mortality (Z, years−1) and natural mortality (M, year−1) were calculated as the respective average of Z and M values estimated by specific methods incorporated in FiSAT II (detailed explanation of the formulas, in Kevrekidis and Thessalou-Legaki [47]). Fishing mortality (F, year−1) was estimated as the difference between Z and M (F = Z − M), while the exploitation rate (E) was calculated as the ratio of fishing to total mortality (E = F/Z) [47].
Females were further examined and individuals were classified into 6 maturity stages, based on the macroscopic examination of the colors from the ovaries and the eggs, following the scale proposed by Mente et al. [42]: stage 1, white–immature; stage 2, green, expands up to the cephalothorax–maturing; stage 3, dark green, expands down into the abdomen–fully mature; stage 4, white–ovigerous female carrying green eggs on its pleopods; stage 5, white–ovigerous female carrying brown eggs on its pleopods; stage 6, white–eggs are released with brown filaments on legs of the adult females. For the estimation of the size at onset of sexual maturity (SOM), females from stages 3–6 were considered as “mature”. A Probit analysis was used and a logarithmic curve was fitted to the data so that the CL value at which 50% of females are in reproductive condition (L50) for SOM could be estimated [42].
All statistical analyses were performed by the “STATGRAPHICS Centurion” software package (v.16.1.11, Statgraphics Technologies, Inc., The Plains, VA, USA) and values of p < 0.05 were considered significant.
3. Results
3.1. Population Structure
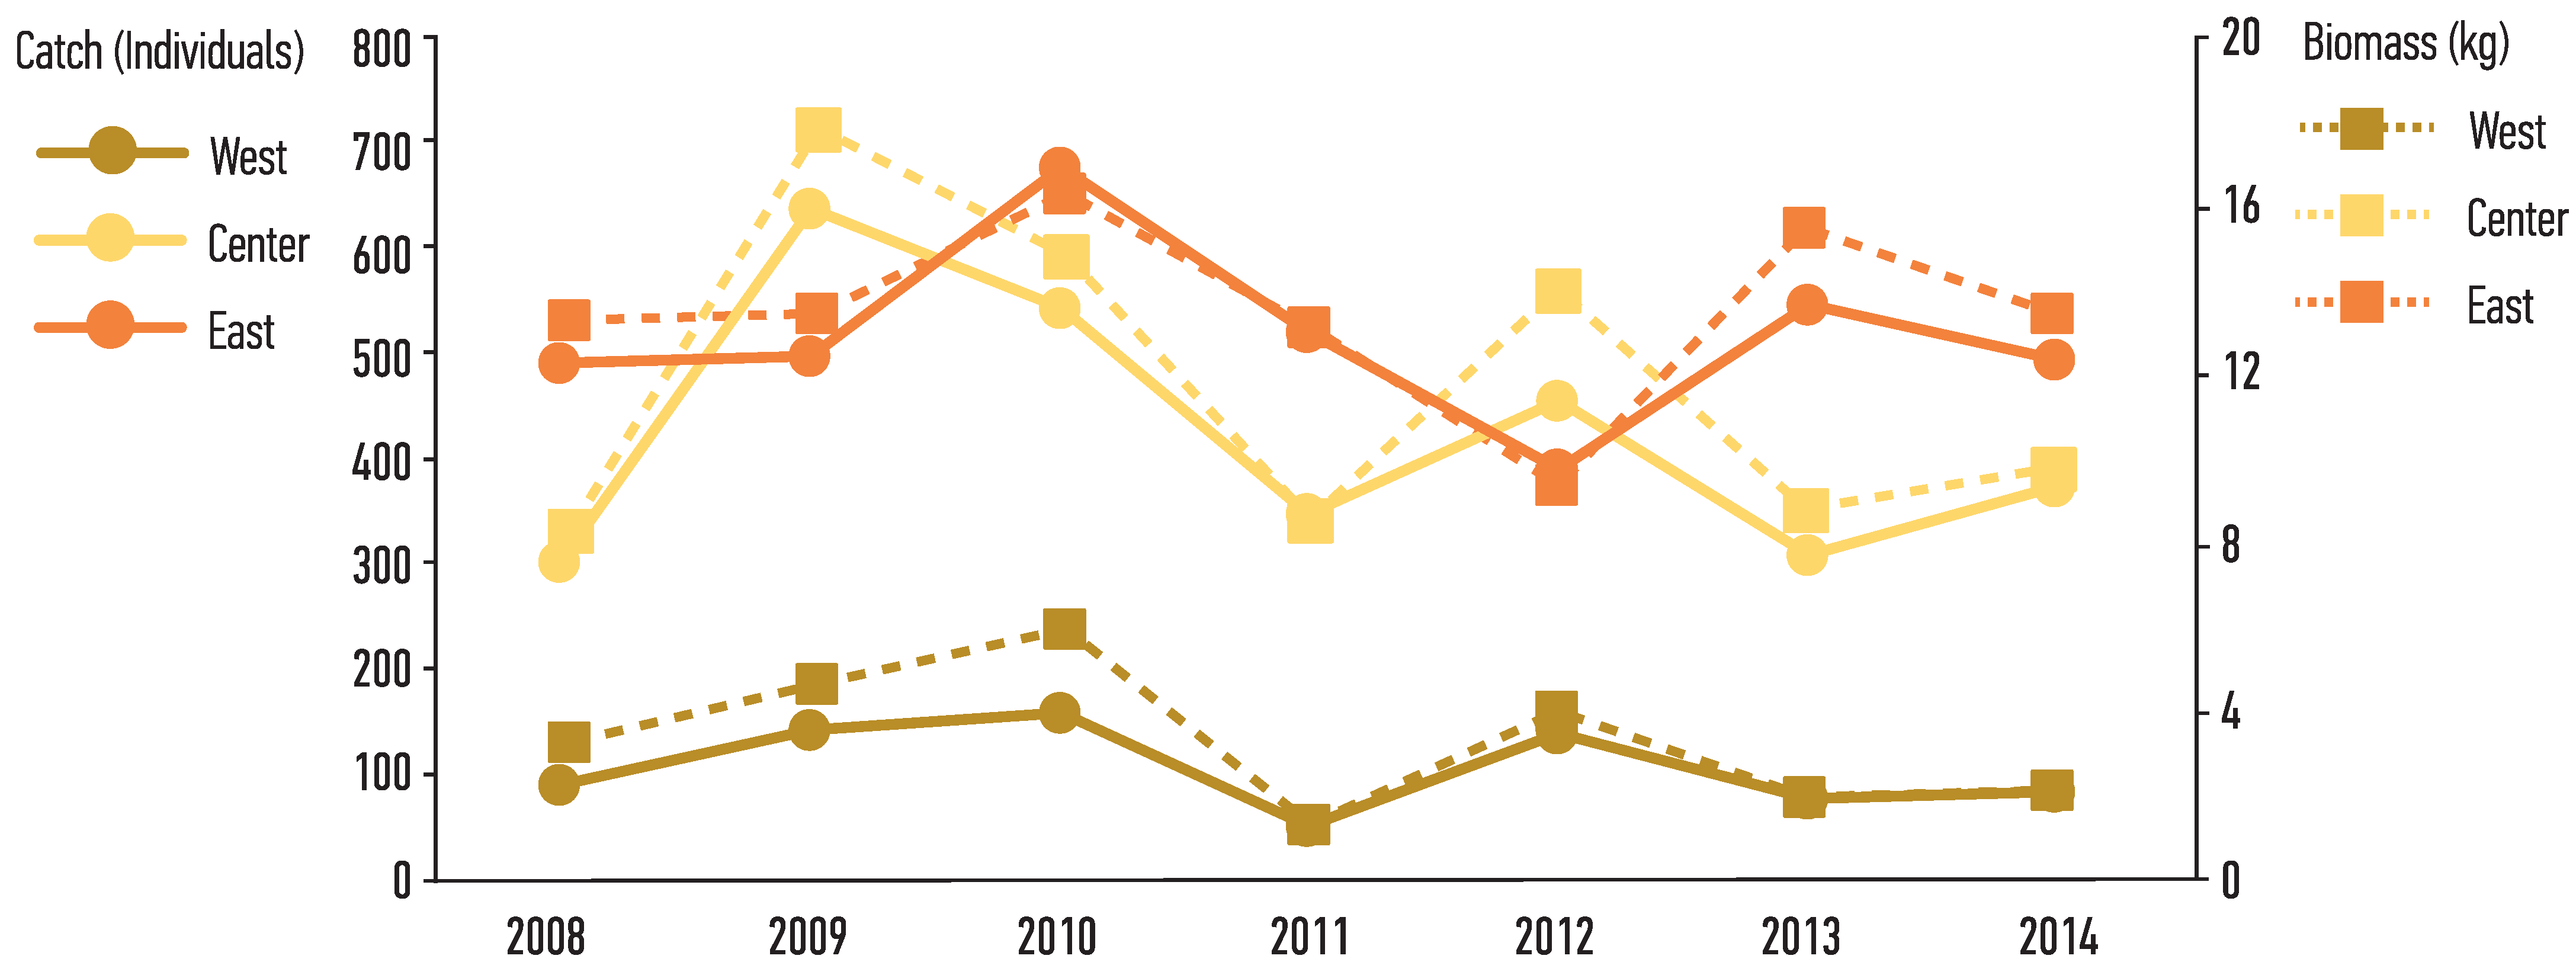
From the 42 hauls, the total number of measured Nephrops individuals was 2954 males and 4362 females (n = 7316). Trawling depth ranged between 50 and 70 m, with hauls within the West and East parts ranging between 50 and 60 m, while the Central part had a wider range, between 55 and 70 m. The West part of the gulf always yielded the lowest catch in the total number of individuals (312 males–429 females), followed by the Central region (1194 males–1766 females), with the Eastern part having the highest abundance (1448 males–2167 females). In terms of years, the lowest catch in absolute numbers was in 2008 (362 males–517 females) and the highest in 2010 (508 males–869 females). Considering the total biomass of the catch, the West part yielded the lowest (23.56 kg), followed by the Central (82.33 kg), whereas the Eastern part yielded a total 94.73 kg. In terms of years, the lowest value was 2011 (23.15 kg) and the one with the highest was 2010 (37.18 kg) (Figure 2).
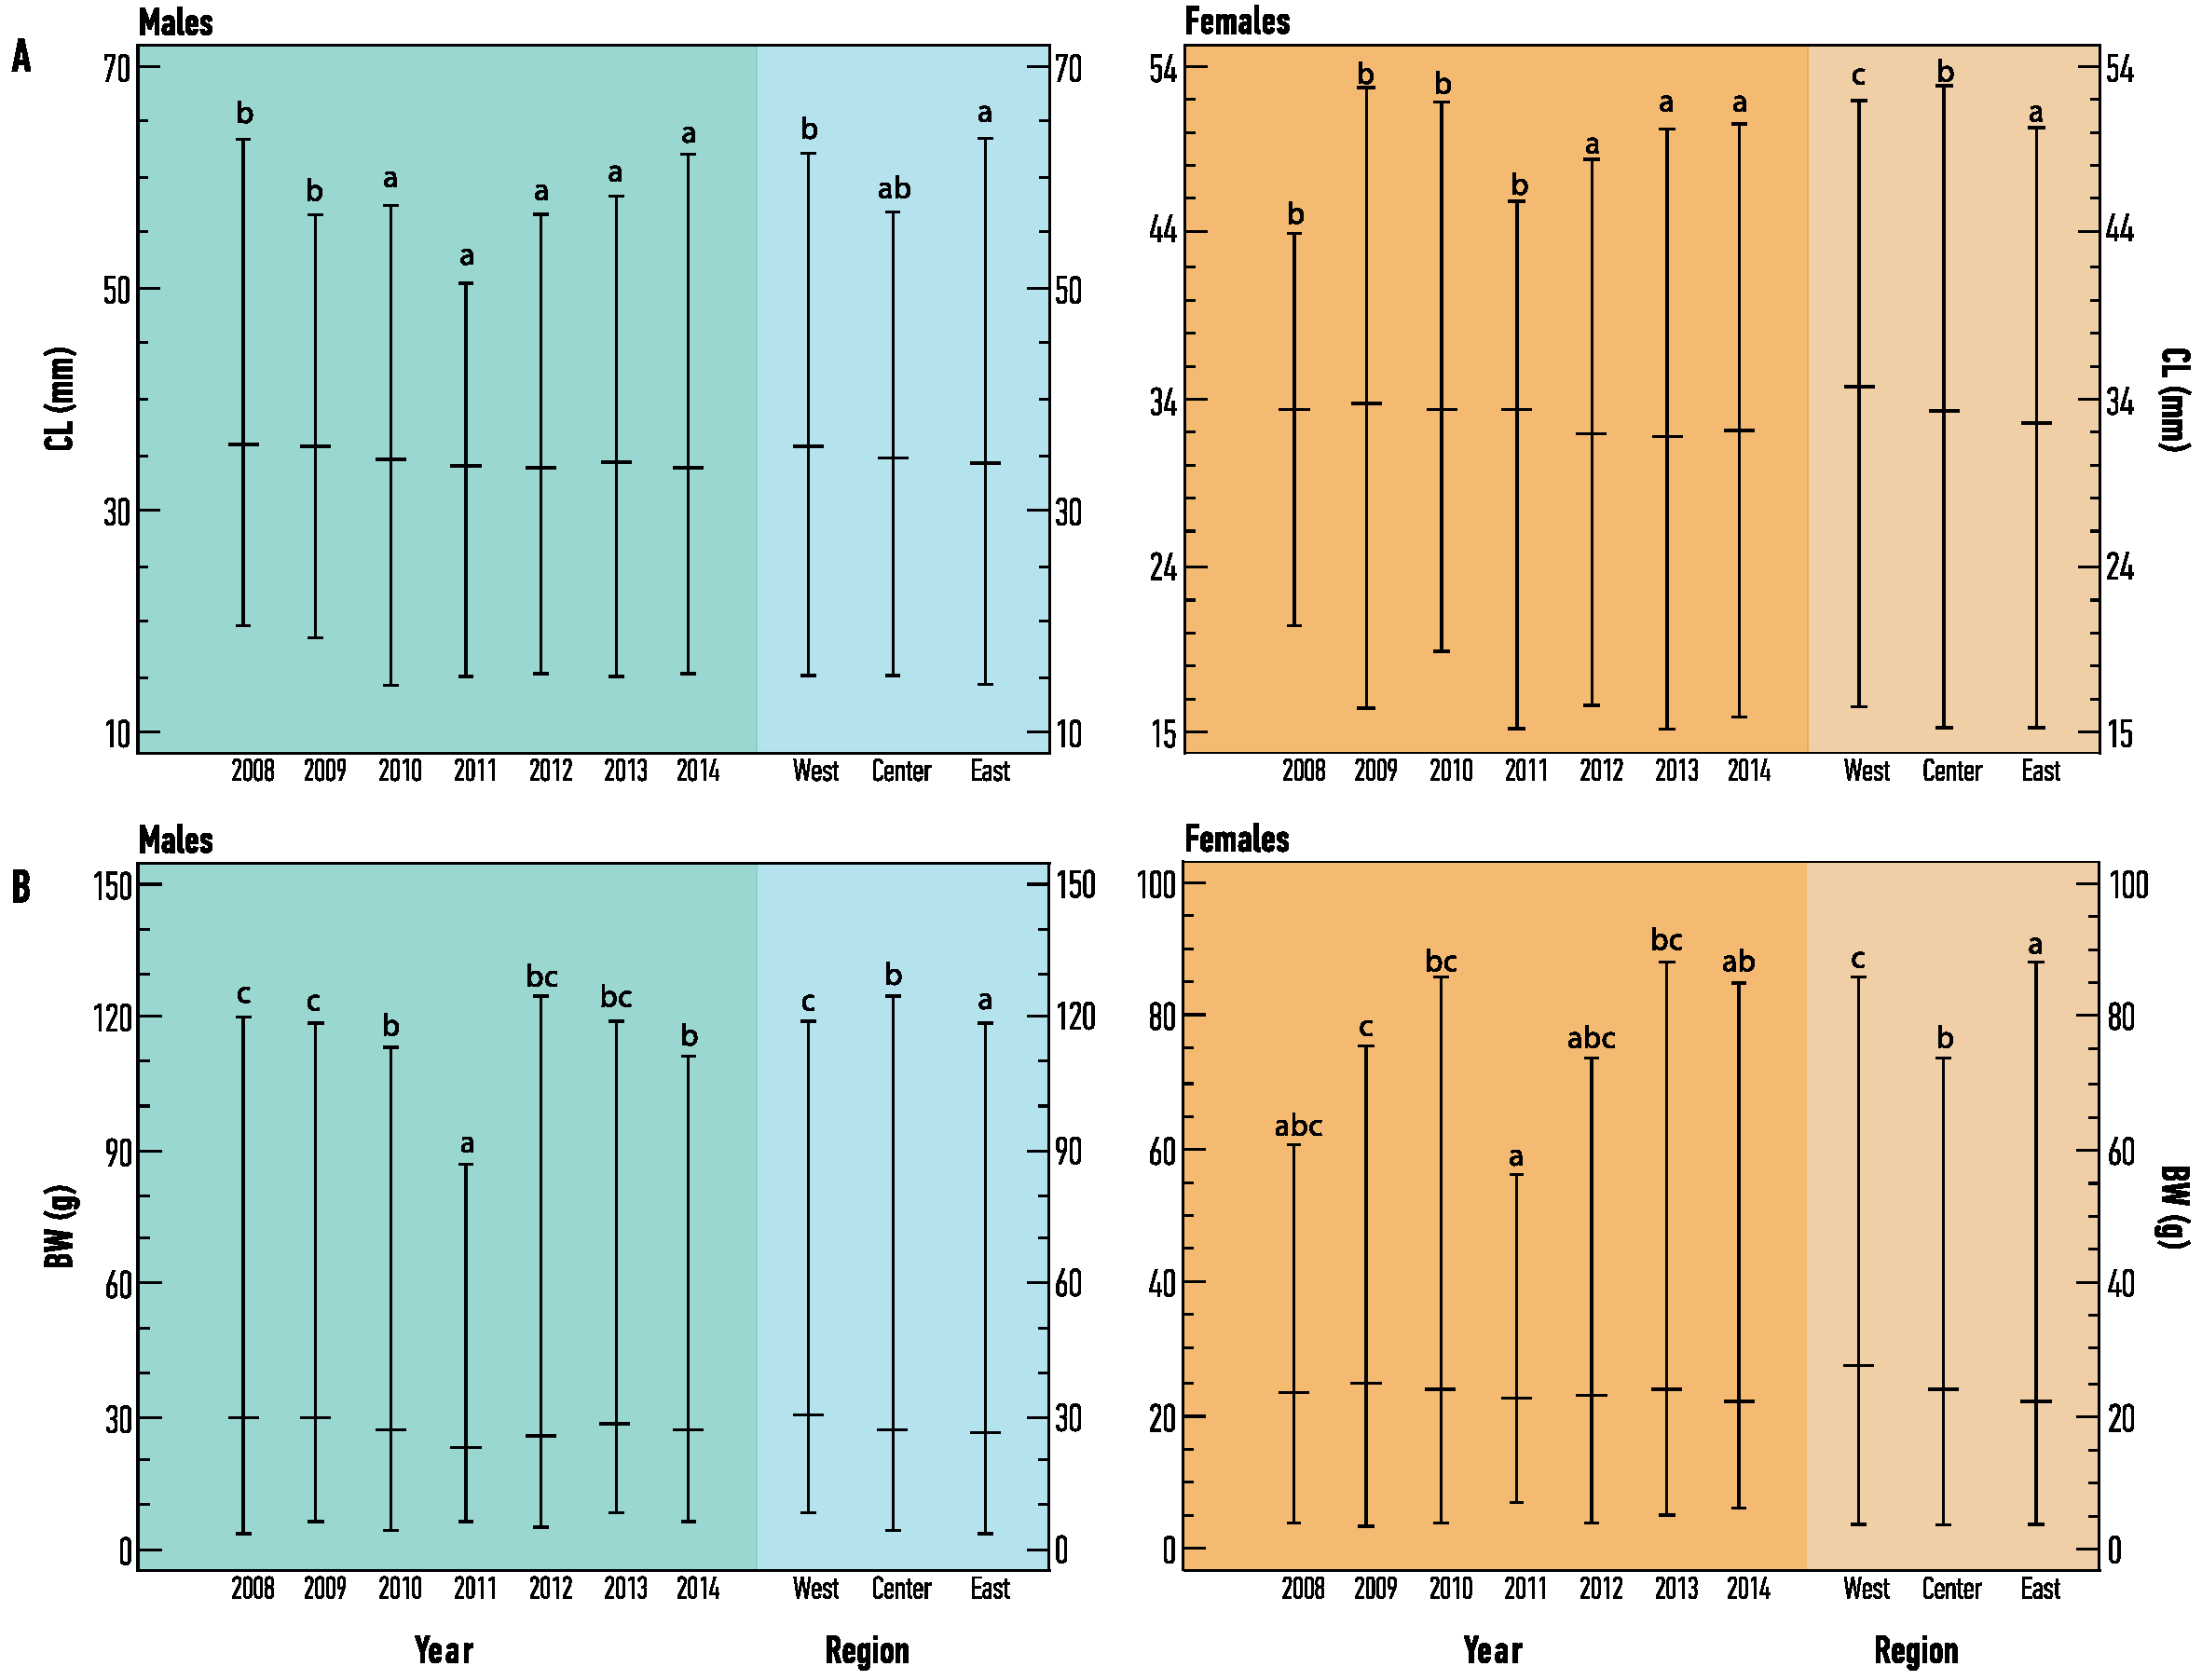
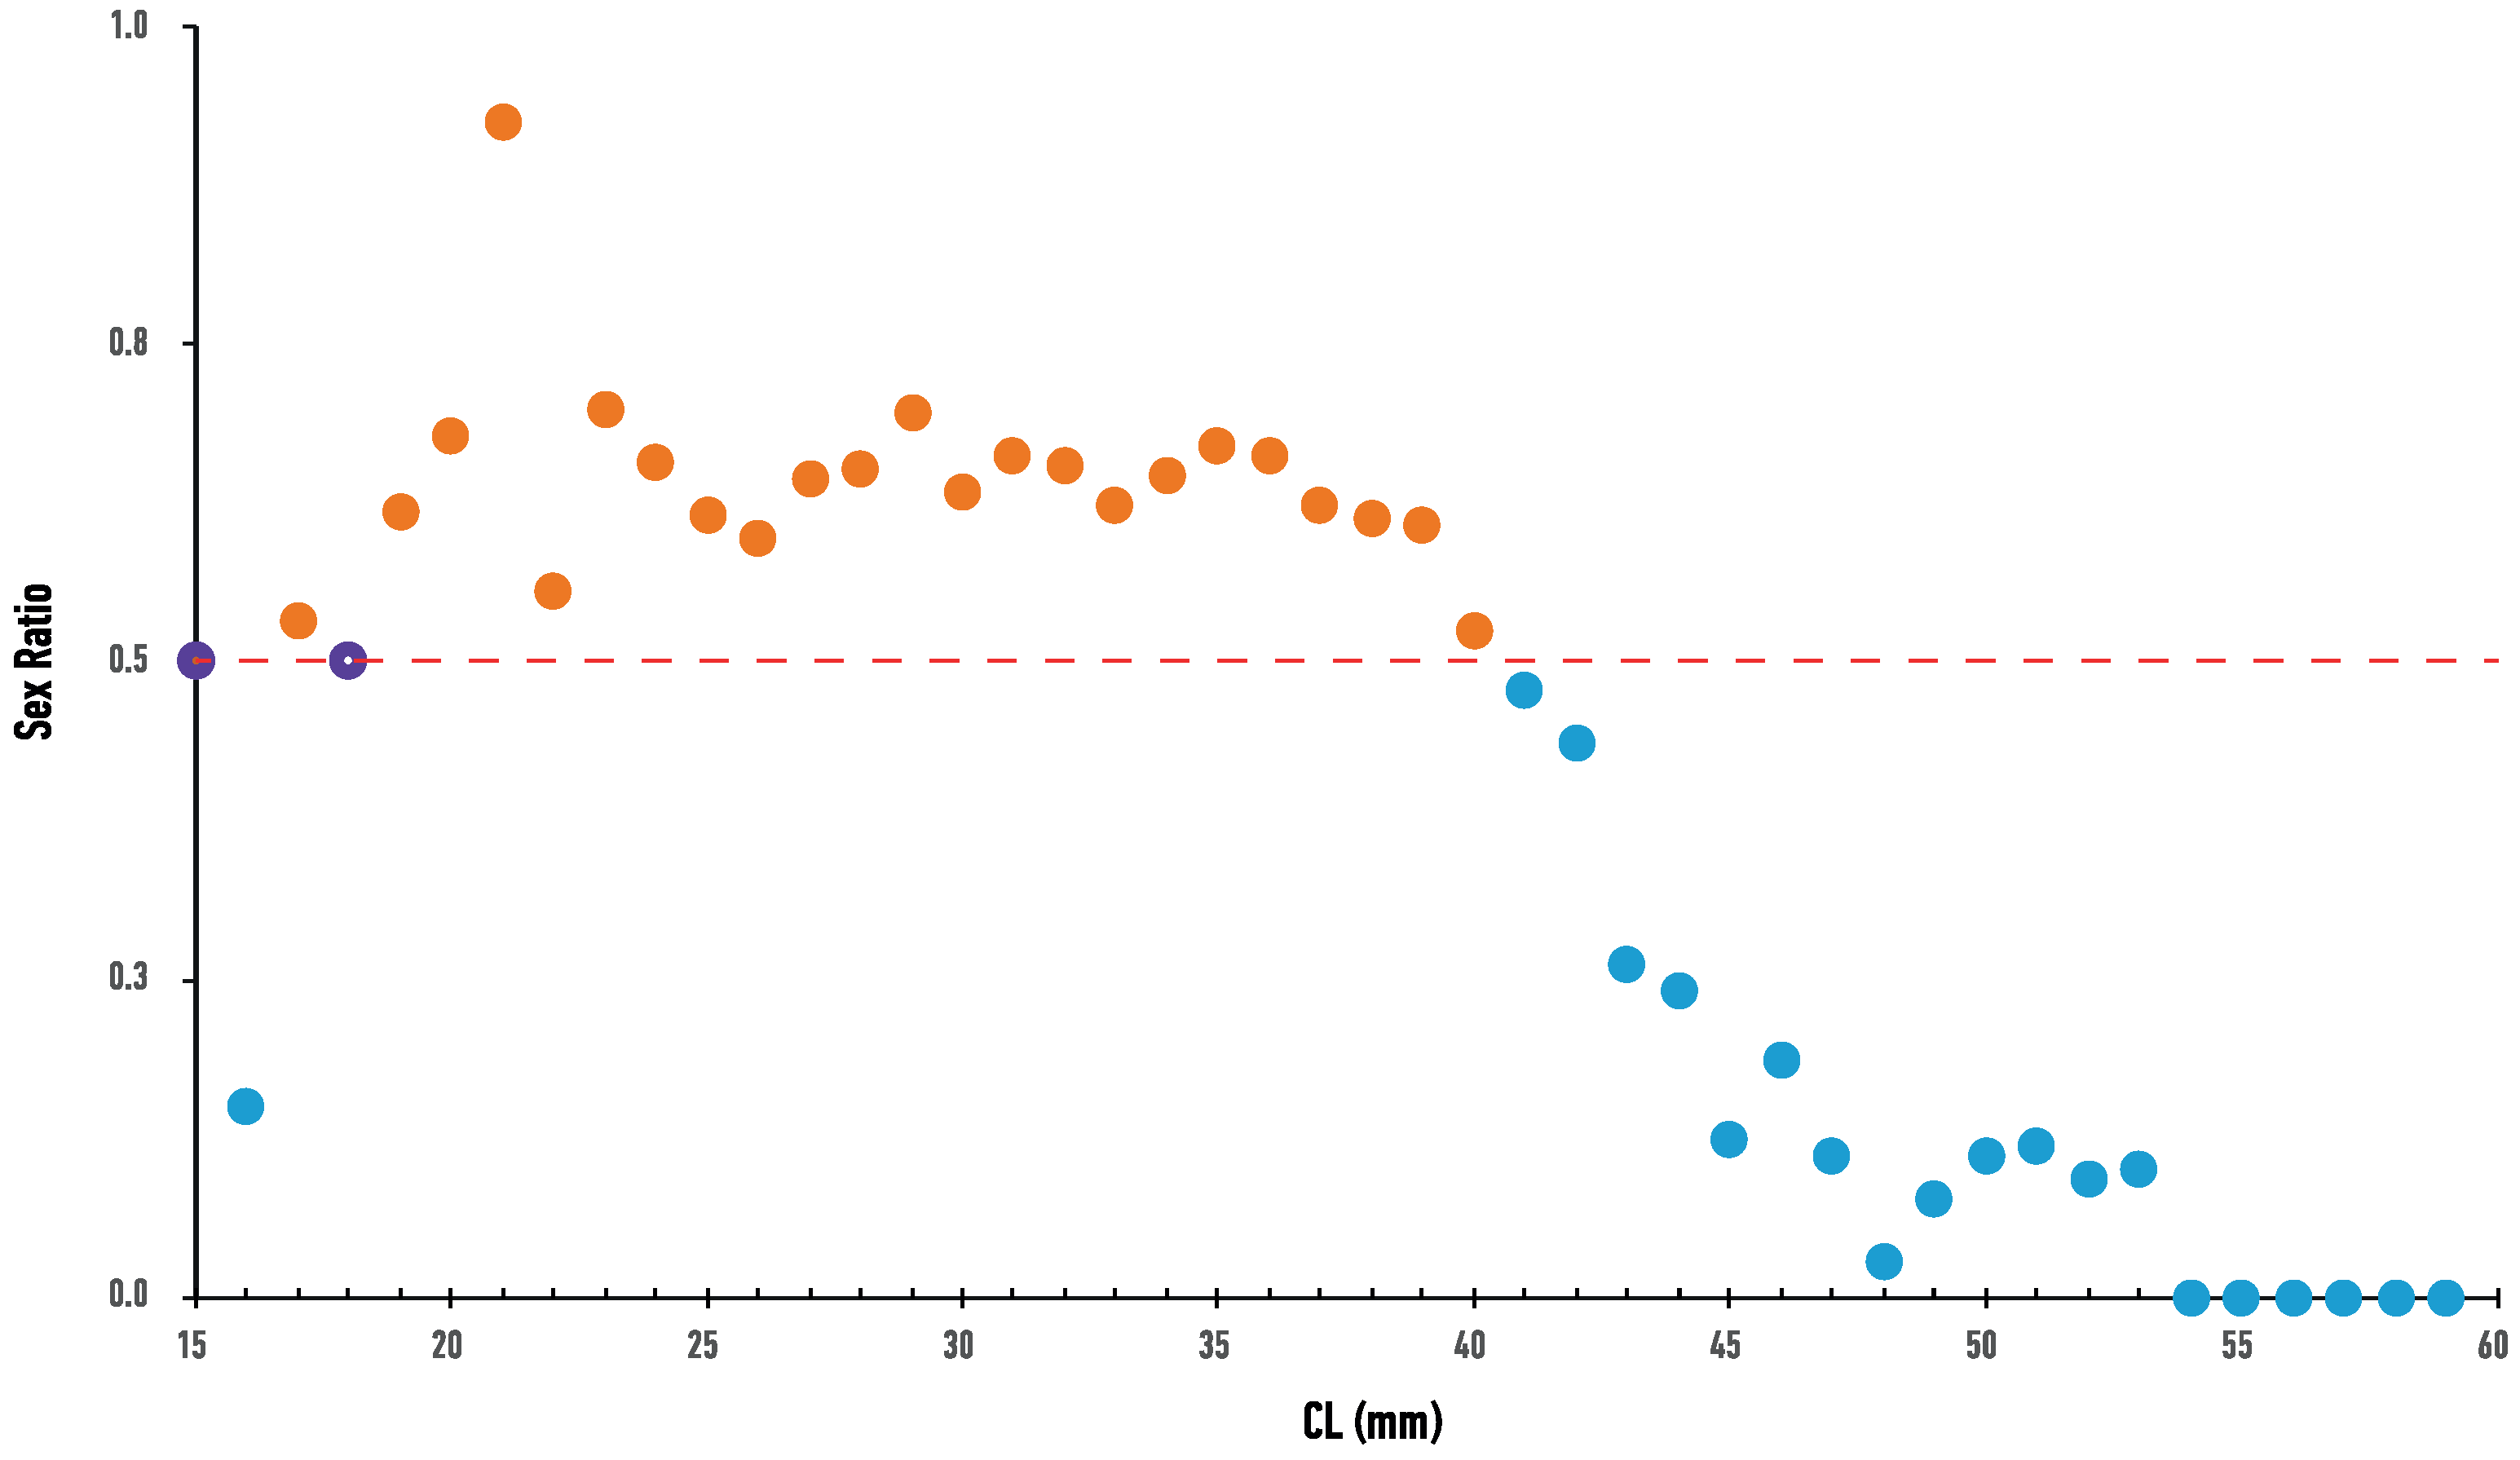
No spatial differences in CL were detected among the three regions, both for males (F2, 2953 = 2.54, p = 0.0792) and females (F2, 4361 = 1.35, p = 0.0533), whereas significant differences were detected in BW values, both for males (F2, 2953 = 9.98, p < 0.05) and females (F2, 4361 = 54.99, p < 0.05). On the contrary, temporal differences were detected for CL and BW values among the years of sampling, for both sexes (Figure 3). Mean size (CL ± SD) and weight (BW ± SD) of males was 34.89 ± 6.75 mm (range 14–64 mm) and 31.52 ± 18.78 g (range 3–125 g), while that of females was 32.79 ± 4.99 mm (range 14–53 mm) and 24.65 ± 10.68 g (range 3–89 g) respectively. Sex ratio was found to be significantly different from the expected equilibrium (0.50) in all samplings (p < 0.05), always in favor of the females (range 0.54–0.65). Females were more abundant in smaller CL size classes, but their proportion decreased significantly with the increase in CL size (Figure 4).
The biometric relationship between CL and BW was negatively allometric in all cases, for both sexes, indicating faster axonometric growth (body length) than volumetric growth (body mass). High values of the correlation coefficient are indicators of a strong relationship between the variables, while low p-values of the lack-of-fit test indicated that the selected model appeared to be more accurate for the males rather than the females (Table 1).
3.2. Age Determination and Maturity
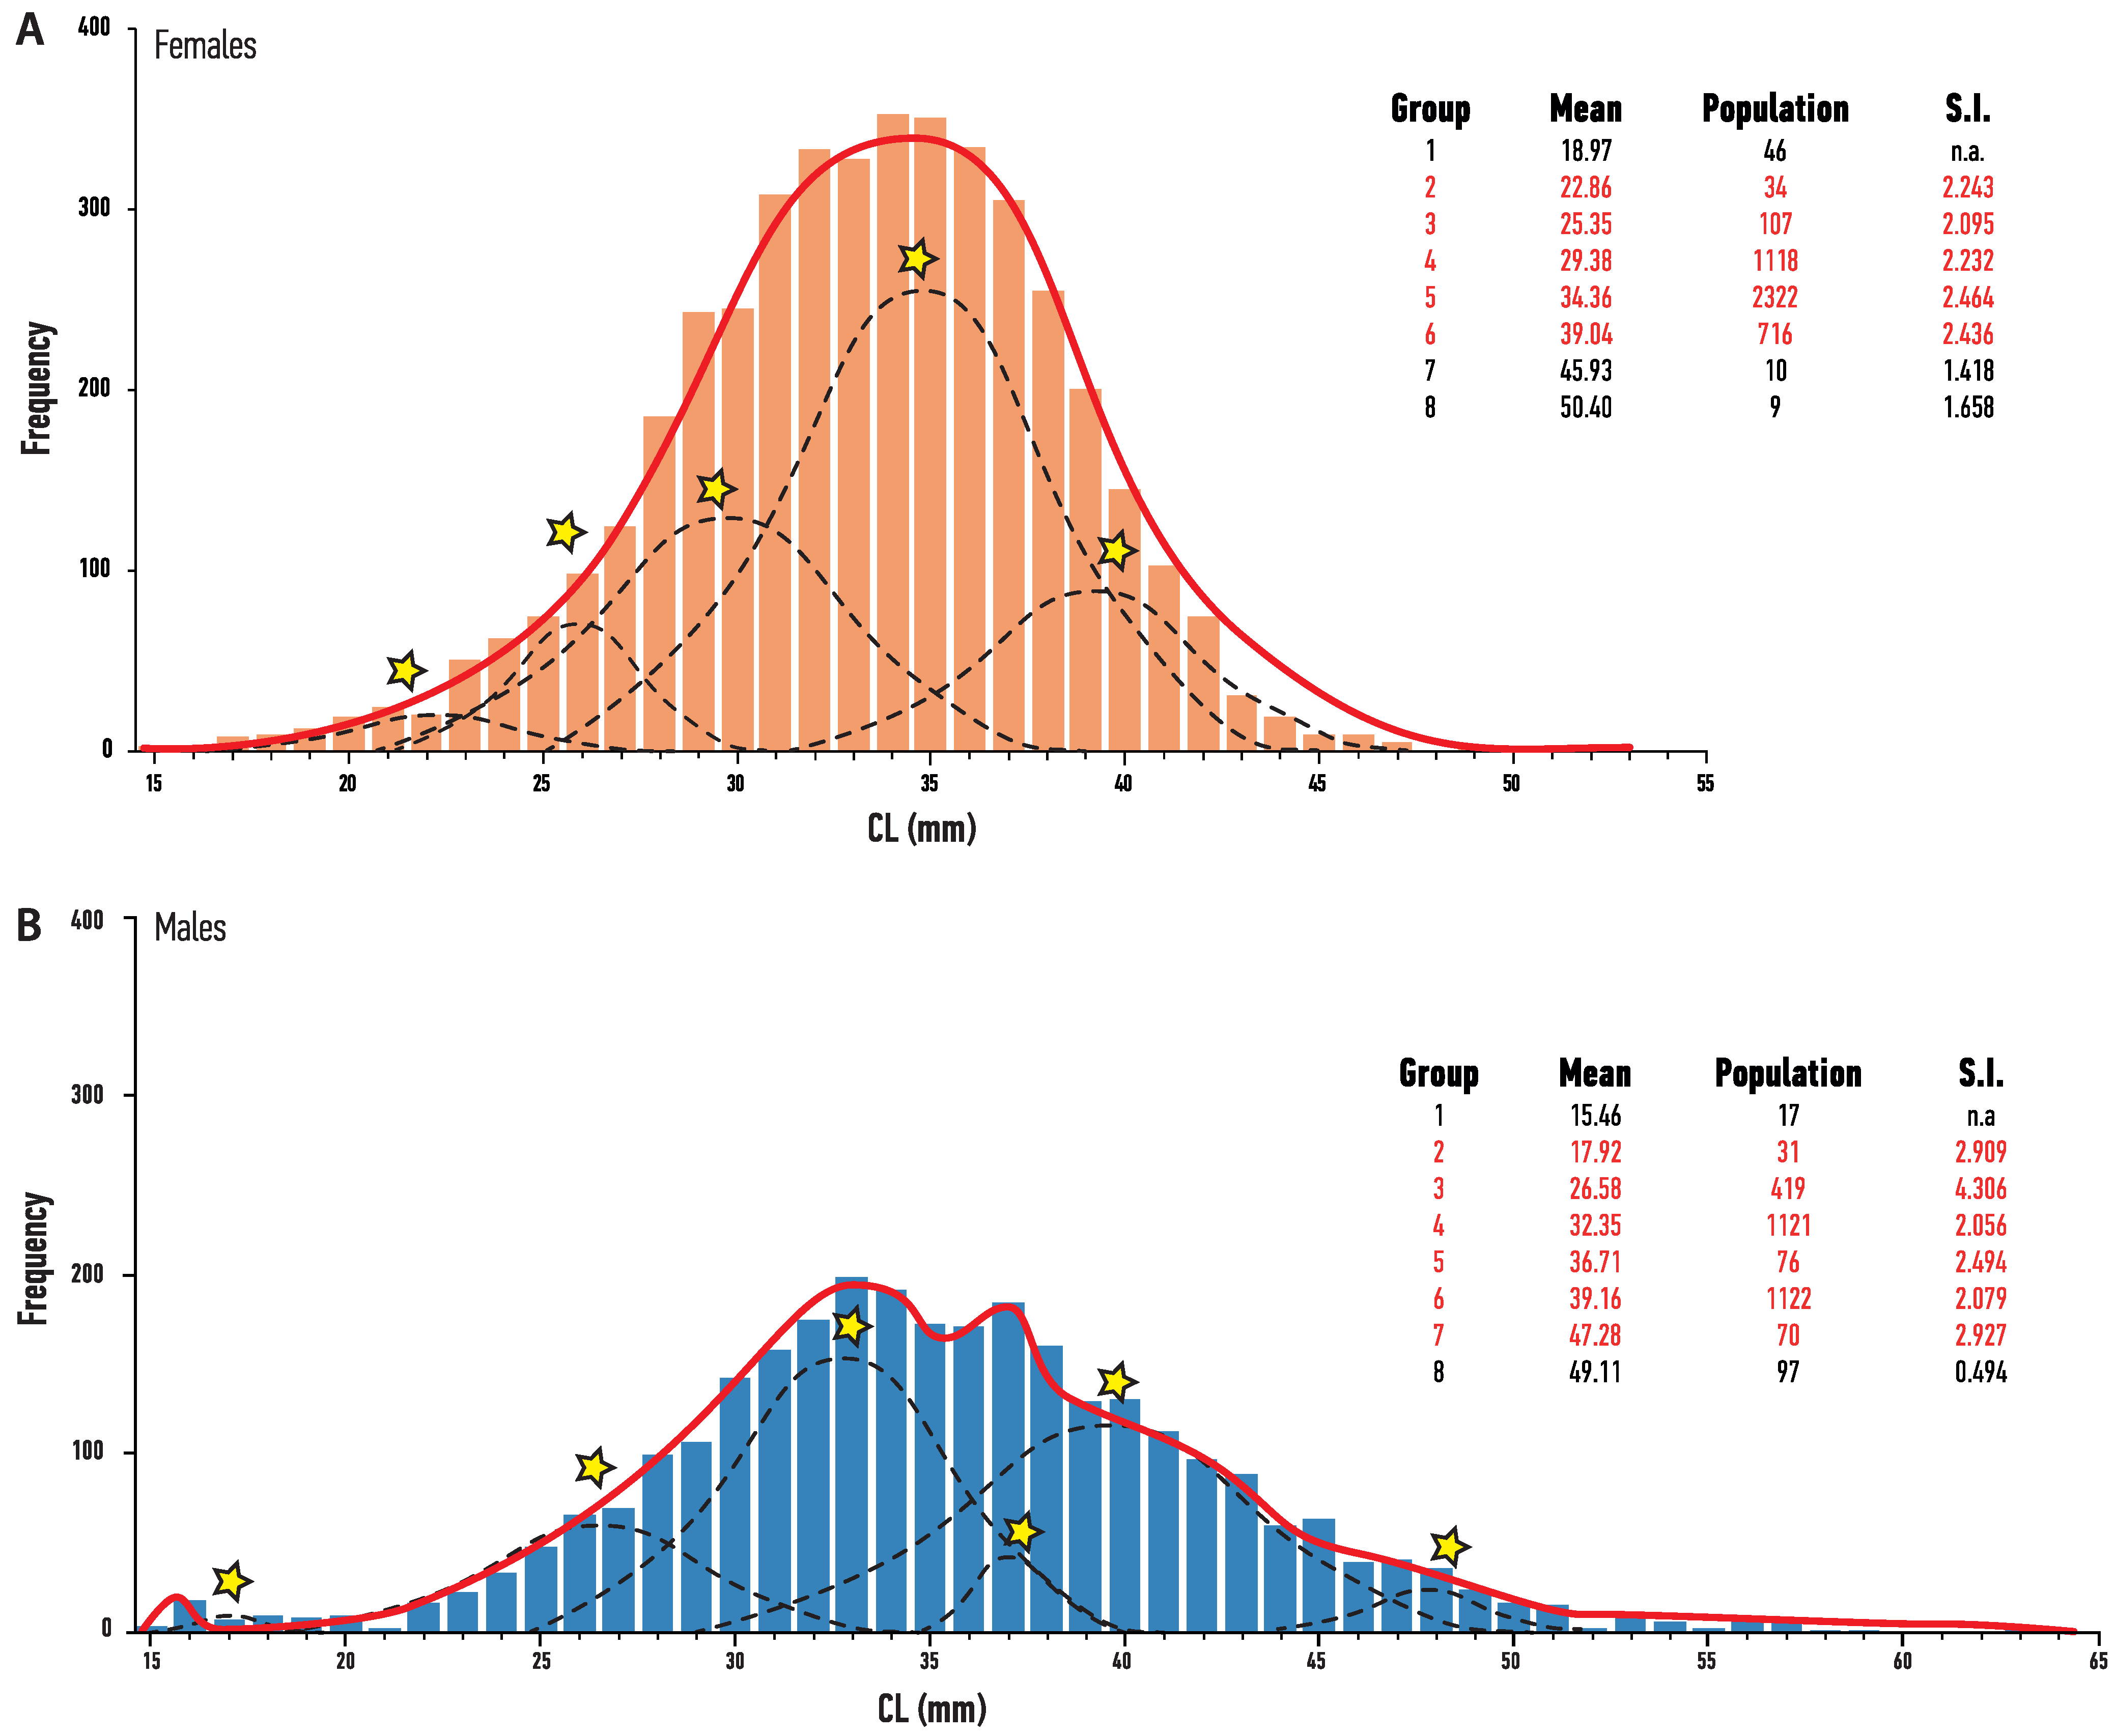
Length–frequency distribution (LFD) differed between sexes with males exhibiting a wider size range (14.08–63.40 mm) than the females (14.12–52.82 mm) (Kolmogorov–Smirnov DN = 0.168, p < 0.05), with also a significantly higher median size (34.56 mm) than females (33.07) (Mann–Whitney U = 7.61 × 10⁶, p < 0.05). MPA estimations identified 6–8 age groups every year for both sexes, but usually only 4–5 were considered representative. In a few cases, 1–2 of the identified age groups were below the MLS threshold, but they were not considered as representative. The LFD of the whole stock (pooled data from all samplings) identified eight age groups for each sex, with five being representative for female and six for male Nephrops (Figure 5)
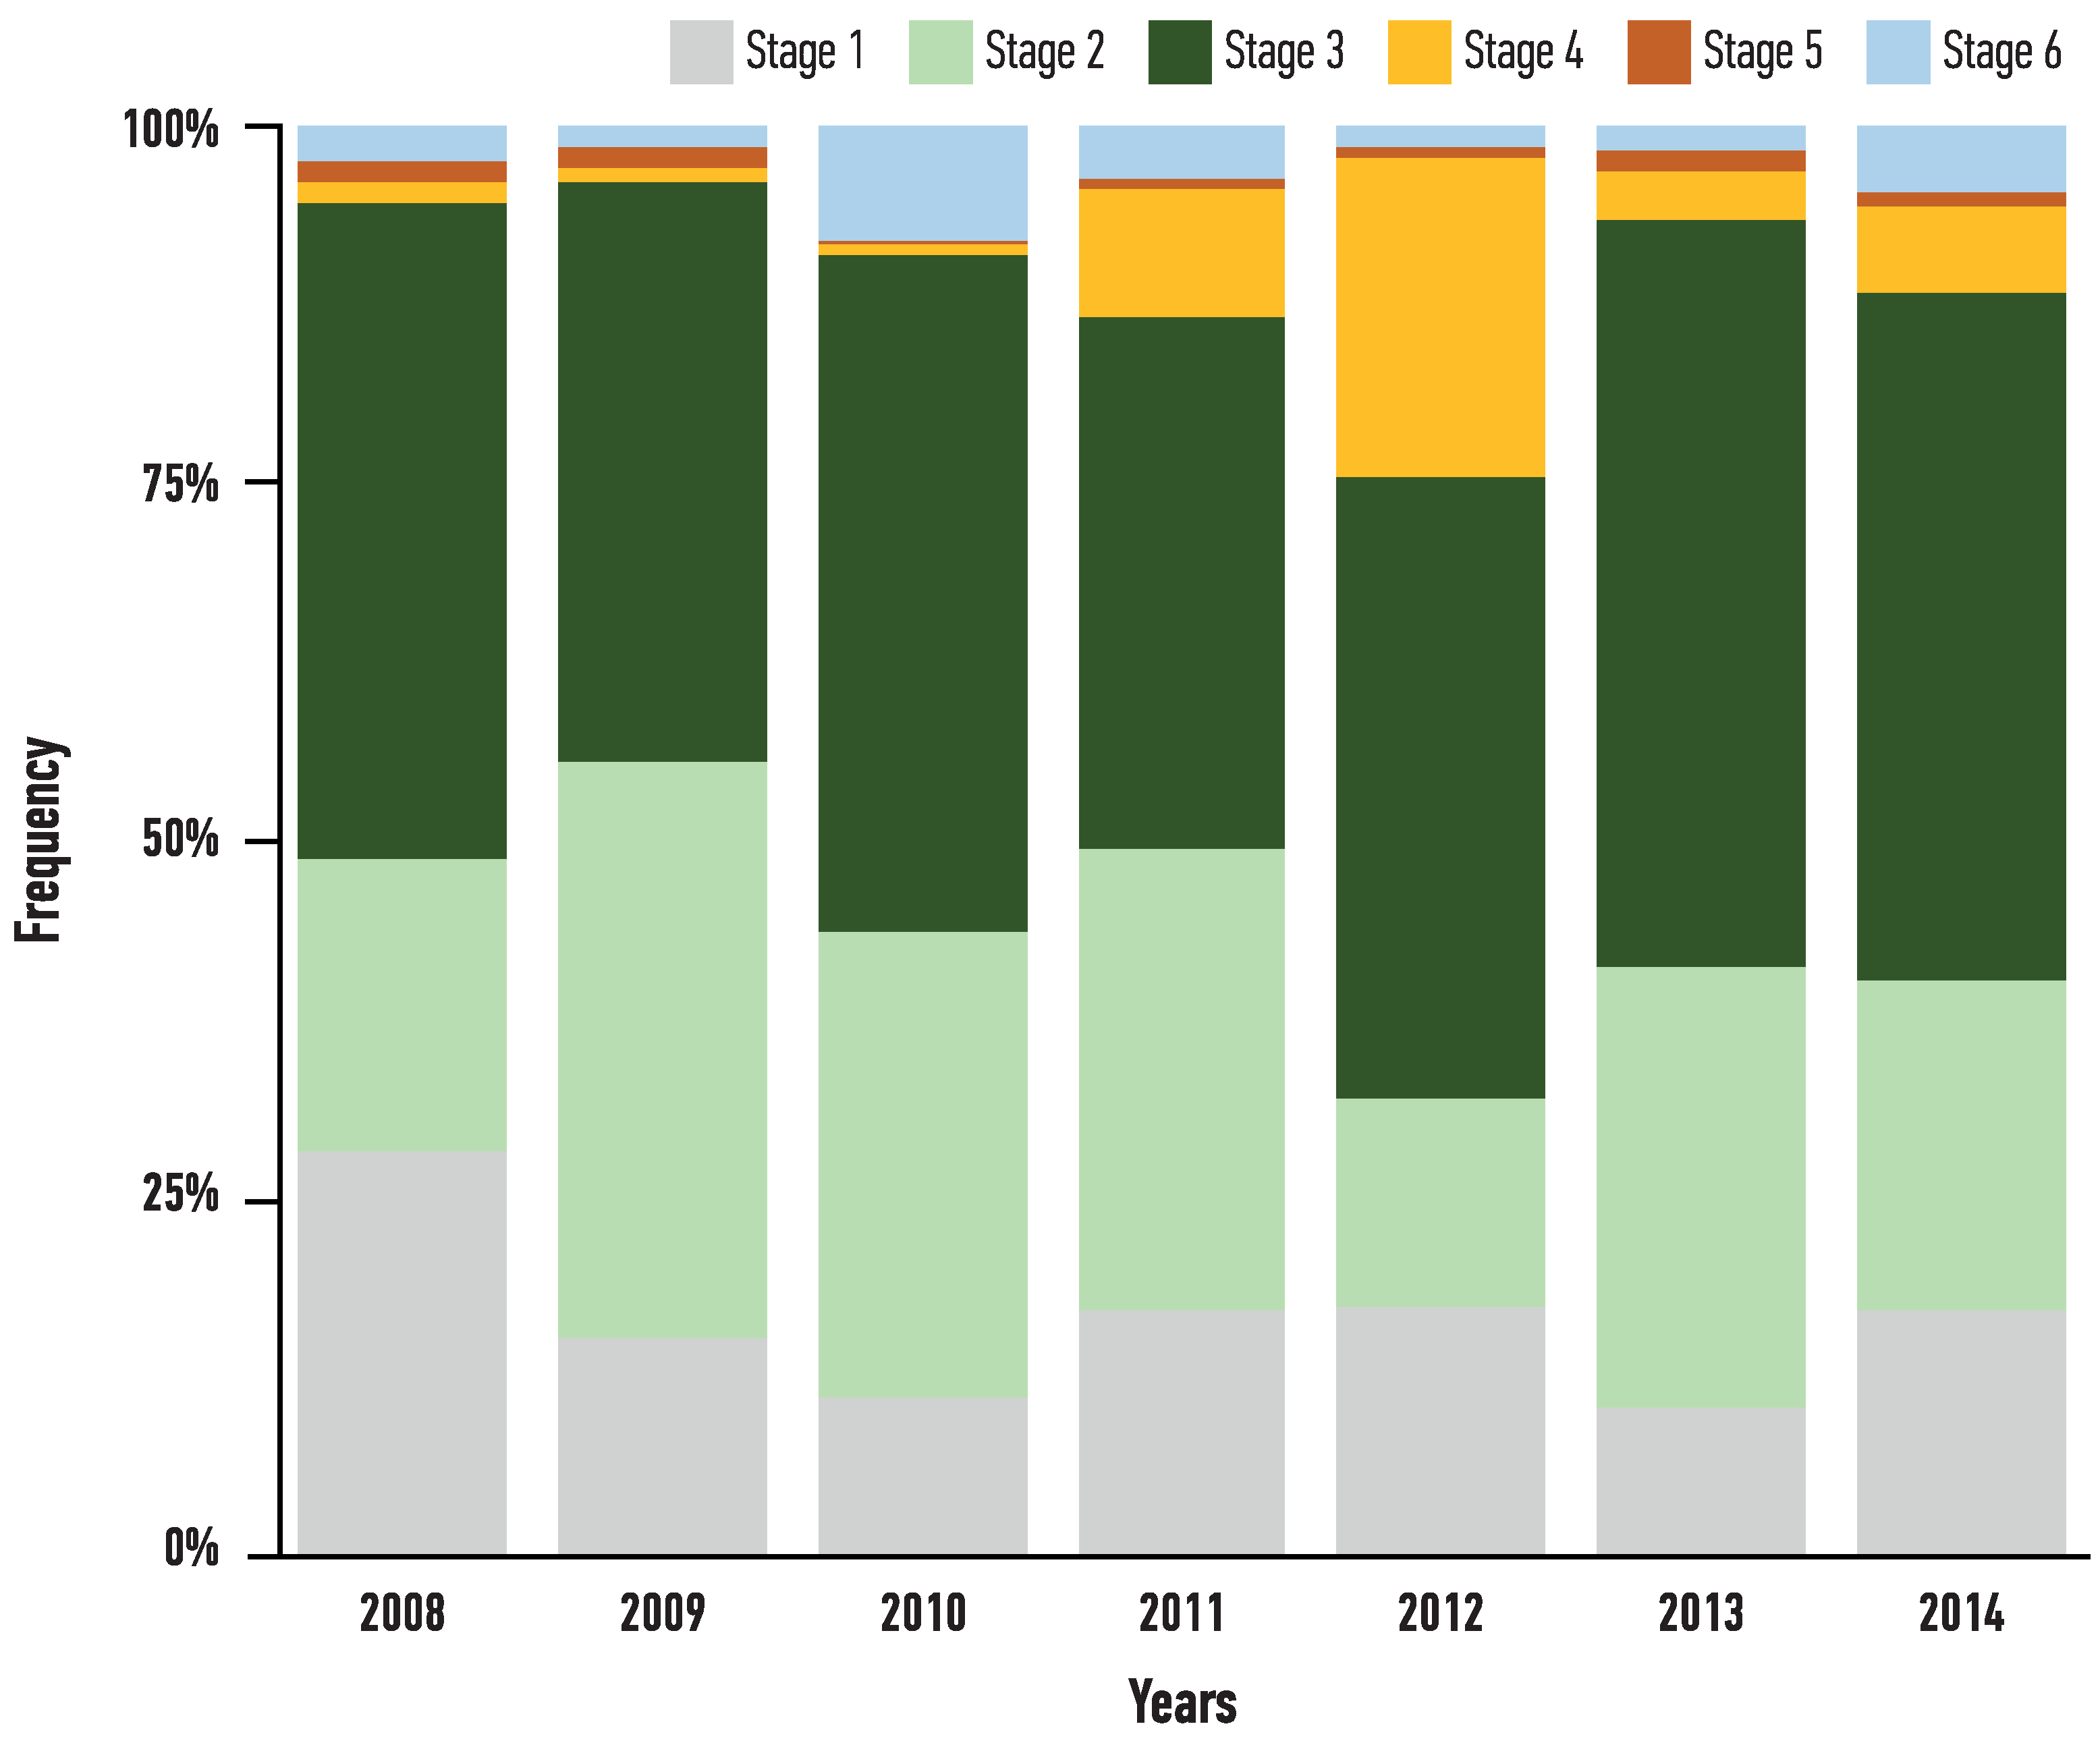
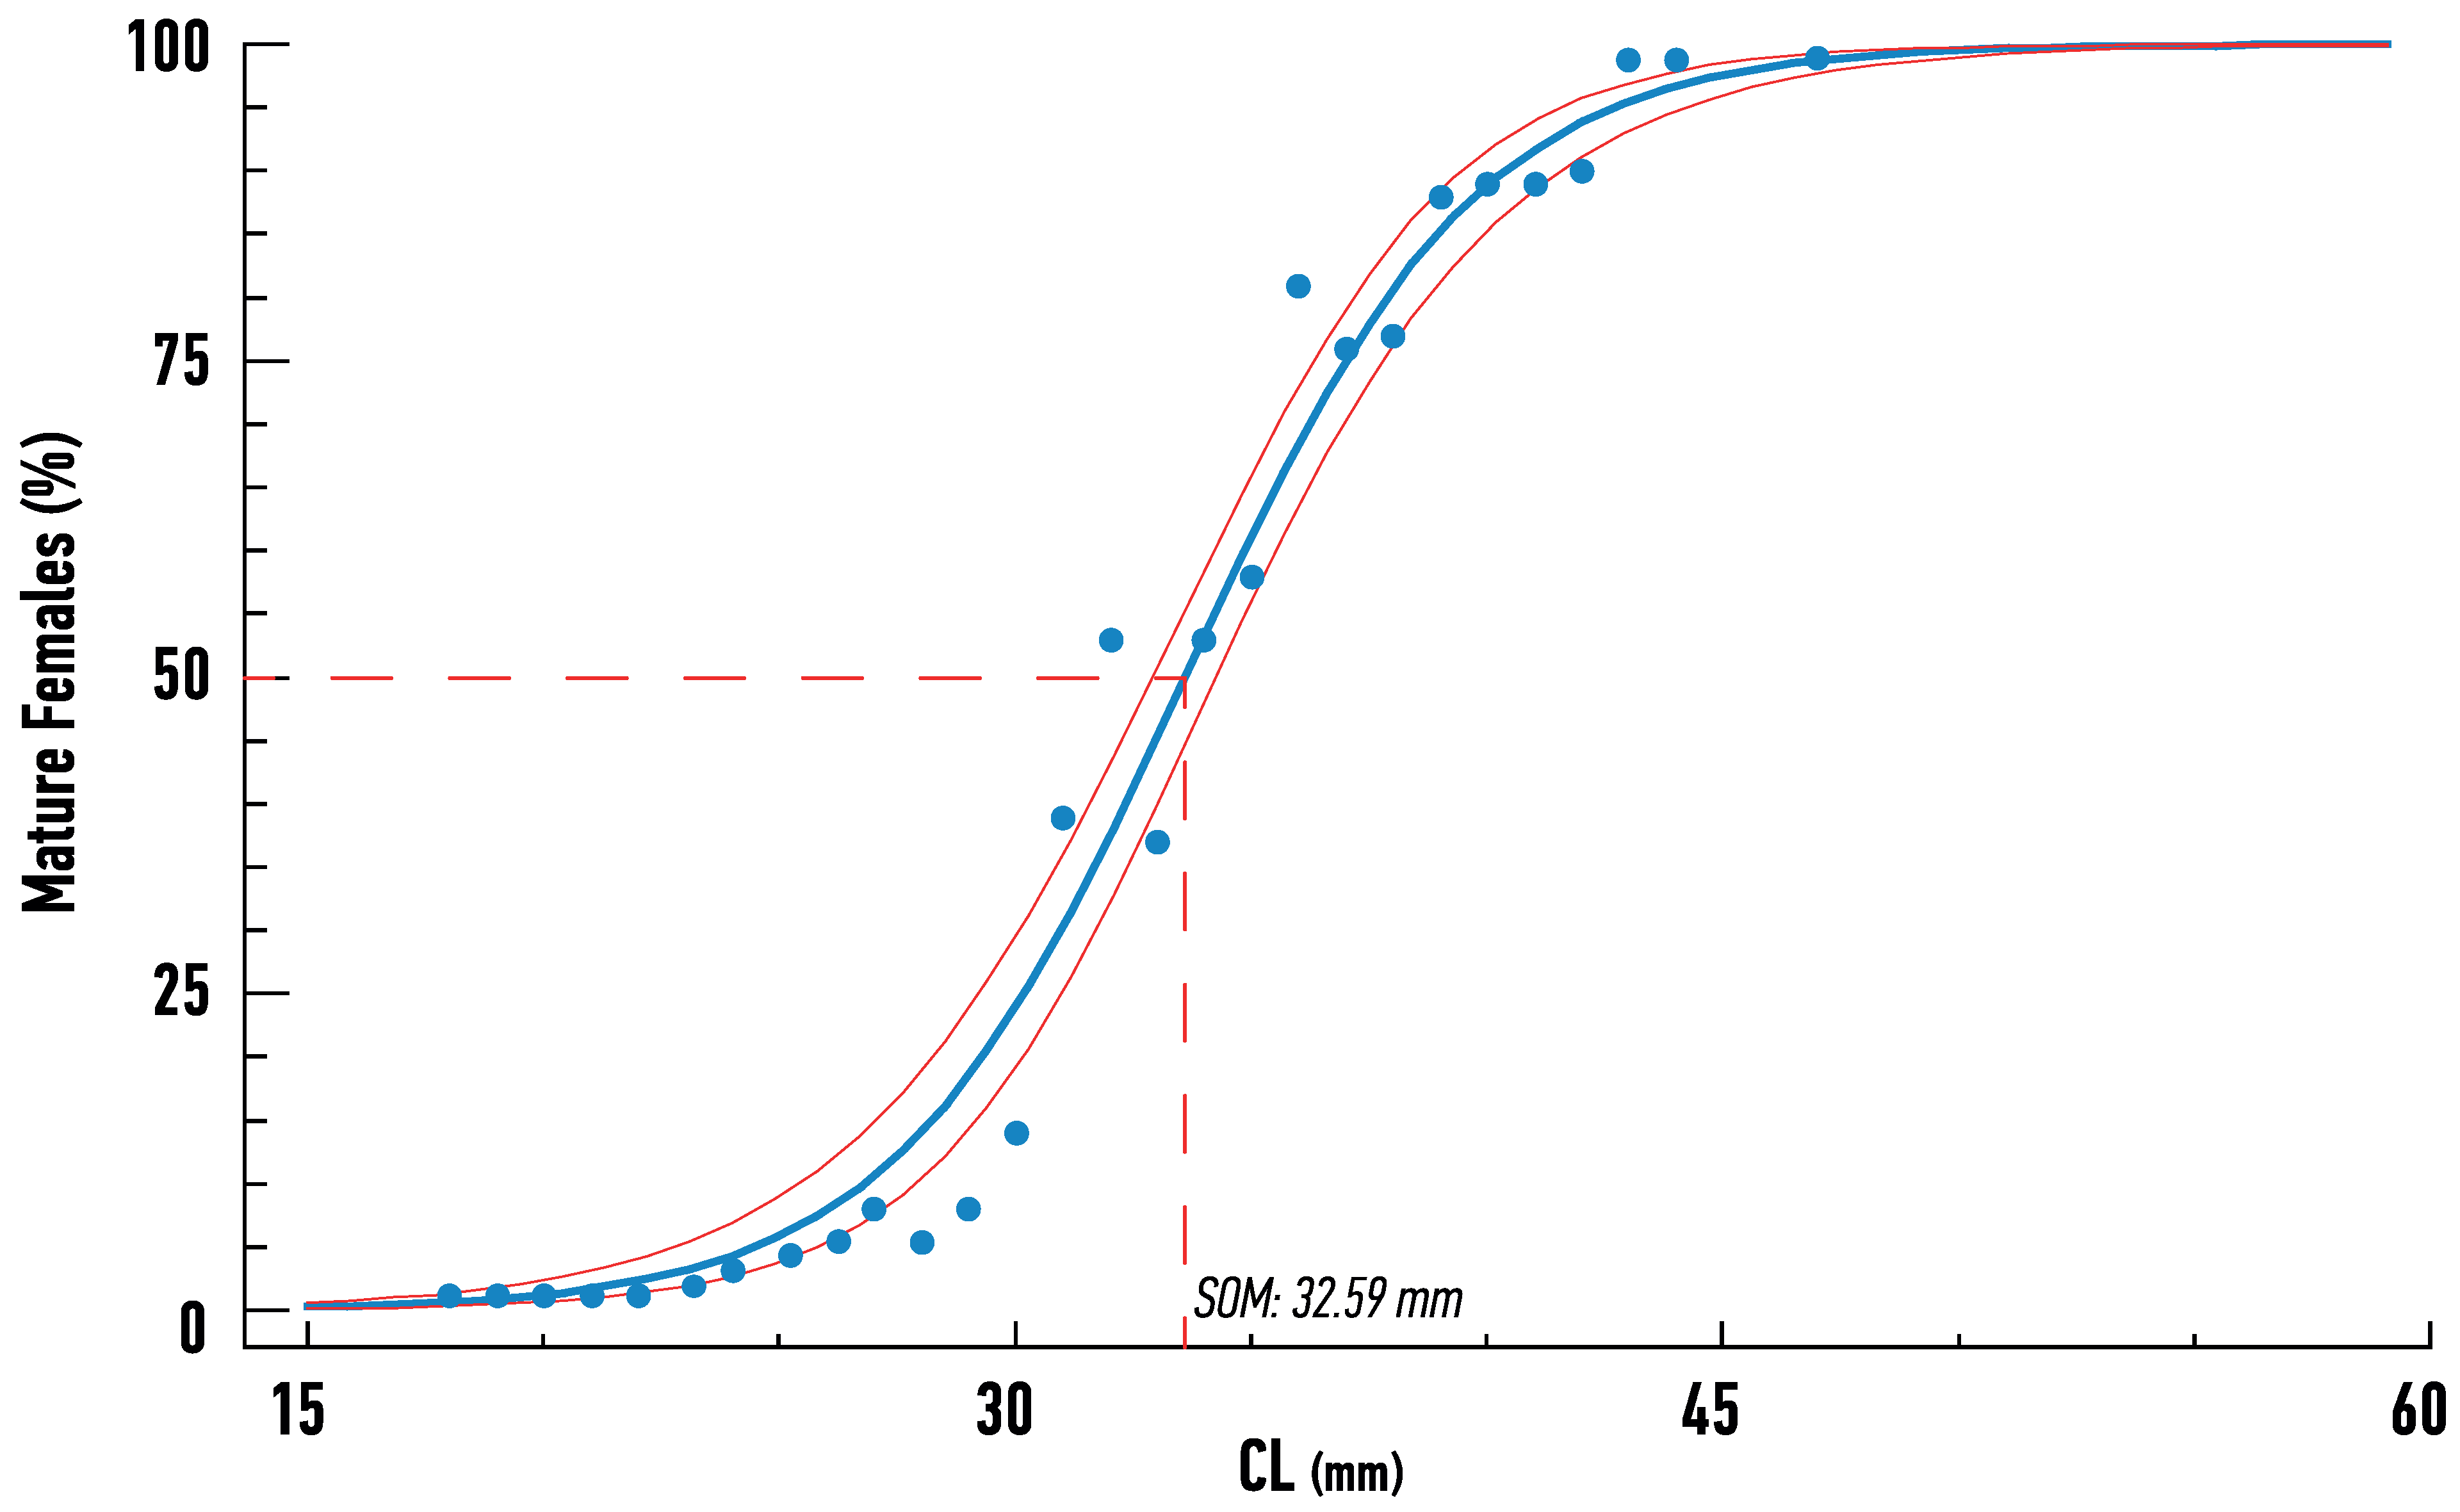
All maturity stages were observed (Figure 6), with stages 2 and 3 being more prominent through all years, contrary to low numbers of berried females, except for 2012, when a large number of stage 4 females were captured. The estimated size at 50% of maturity was estimated from the pooled data of female Nephrops and was 32.6 mm, as estimated by Probit analysis (Figure 7).
3.3. Growth Parameters and Mortality
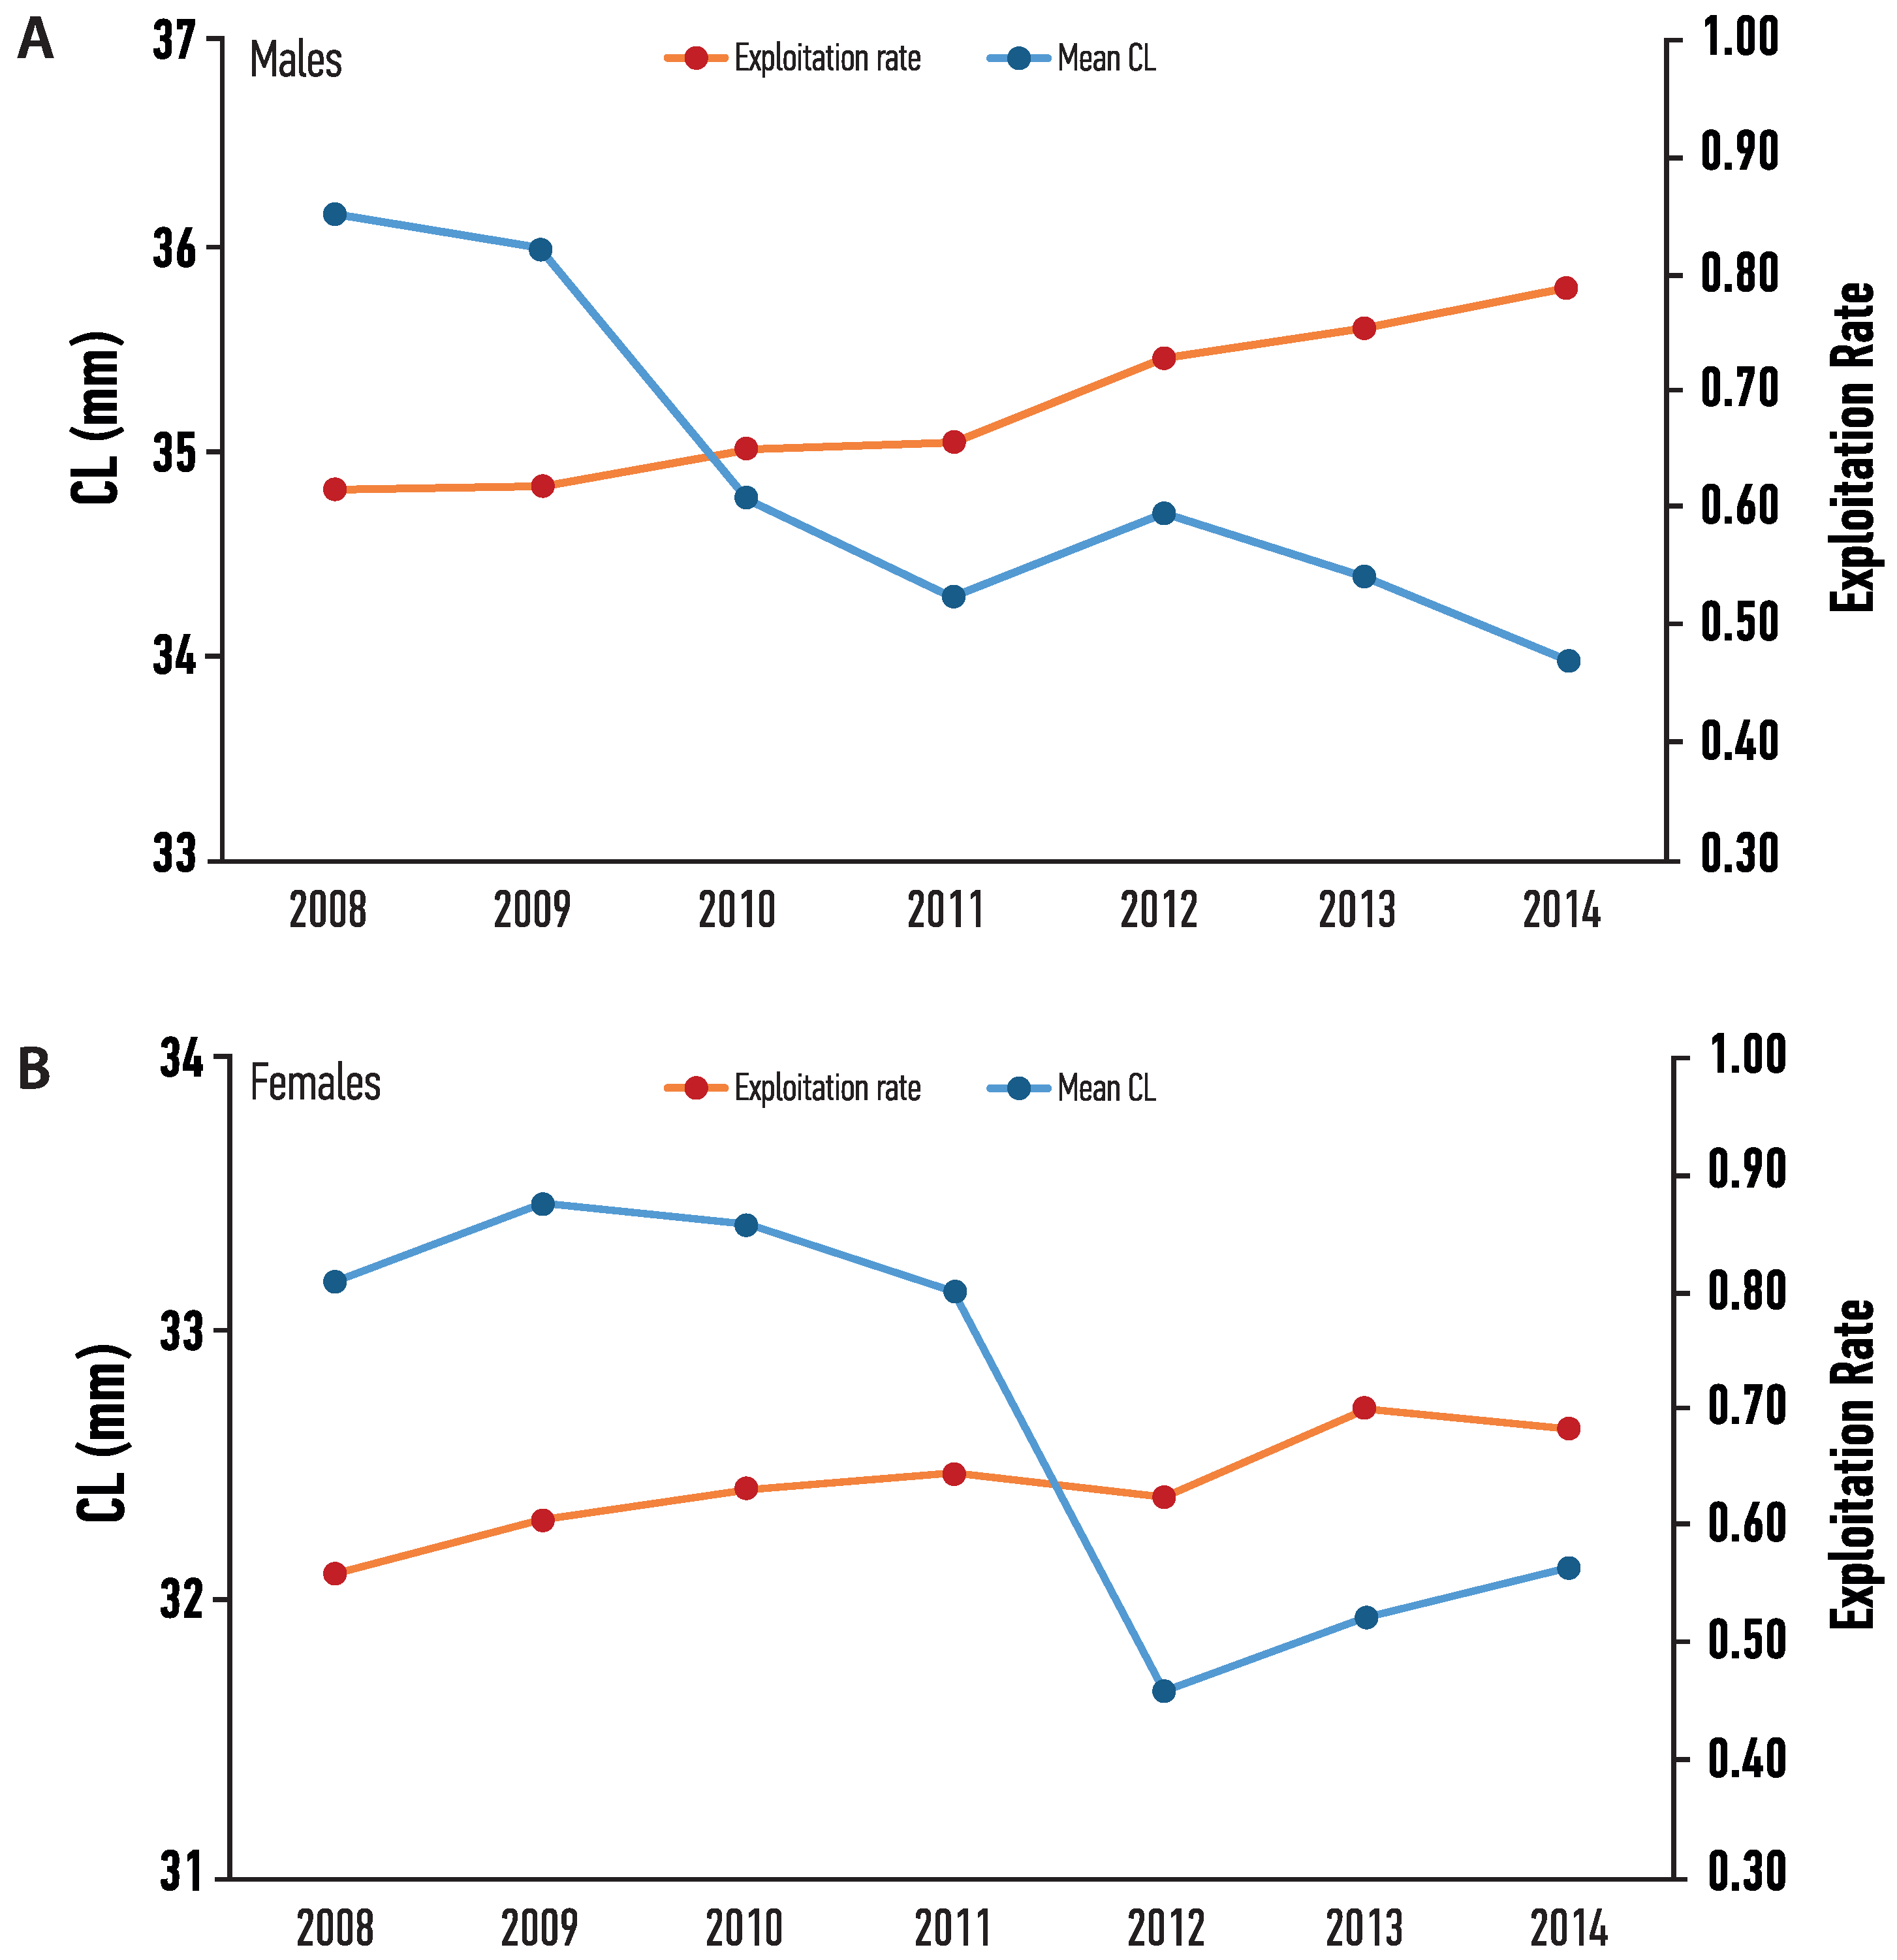
The yearly parameters of the VBGF and mortality values, for each sex are presented in Table 2. Males had higher CLinf (range 74.23–83.62 mm) but lower K values (range 0.09–0.13) than females (range 64.83–69.55 mm and 0.11–0.18, respectively). Total mortality (Z) ranged from 0.690 to 0.798 year−1 for males, and from 0.721 to 0.854 year−1 for females. Natural mortality (M) ranged from 0.161 to 0.306 for males, and from 0.228 to 0.346 for females. Fishing mortality (F) ranged from 0.449 to 0.606 year−1 for males, and from 0.437 to 0.554 year−1 for females. Finally, exploitation rate (E) ranged from 0.62 to 0.79 for males, and from 0.56 to 0.70 for females, indicating an intense fishing pressure of the stock, with a tendency to overexploitation of males (Figure 8).
4. Discussion
Populations of Nephrops are known to differ in terms of distribution, density, or growth rates, even in small spatial scales. Such degree of variation could be attributed to the respective variability in several local environmental factors (e.g., temperature, hydro geography, and sediment particle size) [2,12,31]. In the case of Pagasitikos Gulf, population density (in terms of total catch) varied between the different regions, with a distinct geographical pattern. Low densities were recorded in the West contrary to higher abundance in the Central-East region. This distinction coincides with the local water circulation pattern of Pagasitikos, which includes a cyclone in the West and an anti-cyclone in the East. This unique pattern seems to alter certain functions or processes with the local coastal ecosystems (e.g., nutrient flow, hydrodynamic regime, genetic flow, etc.), thus affecting the composition or structure of several coastal communities in the area [48,49,50,51]. In the case of Nephrops, local hydrographic features could interfere with the settlement of post larval juveniles or change sediment composition, thus effecting burrow densities [1,40,52].
Reproductive cycle of Nephrops varies throughout the year, seemingly affected by factors such as geographic distribution, depth, water temperature, even annual weather patterns and climate [53]. In the Mediterranean Sea, developmental rate and incubation period were found to be approximately 6 months [33] contrary to the Irish Sea, where they were found around 10 months [10] and the Icelandic waters, where they were found to be over 14 months [23]. During their incubation period, females are less active, spending more time in their burrows, thus making them harder to catch [11], and thus making the sampling of females less representative of the actual stock [7]. This might be the case in several studies [7,11,12,19,20], where more males where captured than females, probably because samplings were carried out during winter. In our study, the choice to schedule the trawling surveys early in June, lead to a sex ratio of over 50%, in favor of females, every year. This is an important finding for managing authorities to consider when planning new policies, but also as a reference for future research studies of Nephrops, especially in Eastern Mediterranean.
Growth rates, estimated via the von Bertalanffy Growth Function (VBGF), were found to be slightly different between sexes, which is to be expected, since Nephrops males grow to larger size but in slower rates [2]. Values of K (growth rate) and CLinf (maximum length) vary strongly among several studies in the Mediterranean and the North Atlantic [7,12,13,14,20,25,30,32], with no apparent geographic pattern. Most studies estimated growth rate of Nephrops between 0.1 and 0.2 years−1, which comes to an agreement with the values obtained in our study. Spatial and temporal variation in growth can be attributed to the different environmental factors such as population density, hydrological conditions, sediment type [12,31] or fishing pressure [54]. It is worth noting that the very high growth rates estimated in Portugal [20] were attributed to the low fishing pressure on Nephrops in the area which positively affected local population density.
Age estimation within a stock is an essential resource in the effective management of commercial species, in conjunction with the estimation of size at the onset of sexual maturity (SOM), which is particularly important in understanding the reproductive strategy and fitness of a species as a determinant of reproductive output [16]. SOM was estimated 32.6 mm which falls within the value range reported in other studies [20,30,32,55]. By assuming that the first representative mode of the MPA groups corresponds to an absolute age of 3.5 years, the estimated SOM of this study is estimated between 5 and 6 years, which is similar to other studies [2,11,13,30,32,56,57]. Since mesh sizes in fishing gear are set within the framework of an effective management policy by official bodies (e.g., EU, Central Government, Local Authorities), in order to reduce the capture of immature individuals [52], it is important to note that the regional legal minimum mesh size for creels (28 mm) and gillnets (26 mm) for Nephrops fisheries in Greece [44] is lower than the estimated SOM of this study. This difference should be put under consideration by the regional policy makers and stakeholders in Nephrops fishery, since it could pose as a potential threat in the long-term viability of the stocks. In general, size-frequency growth models have proven useful in several analyses in crustaceans, even if they have some limitations [58]. They usually are more reliable when applied on short-lived species, because specimens of older age with slower growth rates might be grouped with younger ones. Especially in Nephrops, after the onset of sexual maturity, growth rate slows down and the identification of age cohorts becomes difficult [2]. Nevertheless, these models have proven to be very convenient, easy to apply and require very little resources for the estimation of the age structure of species which lack “age-recording” structures (e.g., otoliths); therefore, they will “remain the prime source of information on longevity in decapod crustaceans, at least until something better comes along” [58].
Very few studies have focused on the exploitation of the Nephrops fishery by estimating natural and fishing mortality [7,30,35,55]. In general, natural mortality values are lower than the respective values for females, usually because males are captured in larger quantities than females due to the cryptic behavior of the latter, but also owning to the differences in the methods used to calculate mortalities [35,47,59]. In the case of the Nephrops fishery in Pagasitikos, fishing mortality was increasing every year with the respective increase in the exploitation rate (E), for both sexes. On the other hand, average values of Carapace length (CL) for both sexes were decreasing, which is an indication of fishing pressure [35]. Furthermore, values of E were above 0.5, with an increasing trend, reaching up to 0.8 for males and 0.7 for females, marking the local fishery as over-exploited. Even though, total catch (in terms of number of individuals or total biomass) did not fluctuate much between the sampling years, this should not be considered as a sign of potential resilience of the species to overexploitation. The biology of Nephrops (burrowing behavior, absence of juveniles in catches, wide trophic spectrum) might explain this resistance but does not change the fact that Nephrops is a sensitive species to trawl disturbance, and thus management and conservation measures should be taken to minimize the impact on fisheries and stocks from trawl gear, mostly, but also other fishing gear, in general [7,17].
In conclusion, the results from our study identified temporal and spatial changes in the population dynamics of Nephrops in the Pagasitikos gulf, which can be related to fishing pressure. Still, in order to improve the tools for better stock assessment and to provide better insight for the management and conservation of Nephrops fisheries, more focused research is required in the future. Effort should be directed in the better understanding of the life-cycle of the species in local and regional scale, as well as improving the available tools for data collecting by integrating new technologies and non-destructive methods (e.g., ROV imaging and GIS mapping).
Author Contributions
Conceptualization, D.V.; Data curation, A.L.; Formal analysis, A.L. and D.V.; Funding acquisition, D.V.; Methodology, A.L. and D.V.; Supervision, D.V.; Visualization, A.L.; Writing—original draft, A.L.; Writing—review and editing, D.V. All authors have read and agreed to the published version of the manuscript.
Funding
This research received no external funding.
Acknowledgments
The authors would like to express their gratitude to the Captain and crew of the fishing vessel “Filippos” for their help during the fieldwork. We would also like to thank the two anonymous reviewers for their constructive comments and suggestions. Finally, we would like to thank Stergiani Matsiori, Associate Professor of our Department for her help during the measurements in the lab.
Conflicts of Interest
The authors declare no conflict of interest.
References
- Johnson, M.P.; Lordan, C.; Power, A.M. Habitat and Ecology of Nephrops norvegicus. In Advances in Marine Biology; Johnson, M.L., Johnson, M.P., Eds.; Academic Press: Cambridge, MA, USA, 2013; Volume 64, pp. 27–63. [Google Scholar]
- Bell, M.; Tuck, I.D.; Dobby, H. Nephrops Species. In Lobsters: Biology, Management, Aquaculture and Fisheries; Phillips, B.F., Ed.; Wiley: Hoboken, NJ, USA, 2013; pp. 357–413. [Google Scholar]
- Ungfors, A.; Bell, E.; Johnson, M.L.; Cowing, D.; Dobson, N.C.; Bublitz, R.; Sandell, J. Nephrops Fisheries in European Waters. In Advances in Marine Biology; Johnson, M.L., Johnson, M.P., Eds.; Academic Press: Cambridge, MA, USA, 2013; Volume 64, pp. 247–314. [Google Scholar]
- FAO. Fishfinder-Web Site. FAO FishFinder Contacts. FI Institutional Websites; FAO Fisheries and Aquaculture Department: Rome, Italy, 2021; Available online: www.fao.org/fishery/ (accessed on 13 January 2021).
- Carpenter, G.; Kleinjans, R.; Villasante, S.; O’Leary, B.C. Landing the blame: The influence of EU Member States on quota setting. Mar. Policy 2016, 64, 9–15. [Google Scholar] [CrossRef] [Green Version]
- Colloca, F.; Cardinale, M.; Maynou, F.; Giannoulaki, M.; Scarcella, G.; Jenko, K.; Bellido, J.M.; Fiorentino, F. Rebuilding Mediterranean fisheries: A new paradigm for ecological sustainability. Fish Fish. 2011, 14, 89–109. [Google Scholar] [CrossRef]
- Sardà, F.; Lleonart, J.; Cartes, J.E. An analysis of the population dynamics of Nephrops norvegicus (L.) in the Mediterranean Sea. Sci. Mar. 1998, 62, 135–143. [Google Scholar] [CrossRef] [Green Version]
- Ligas, A.; Sartor, P.; Colloca, F. Trends in population dynamics and fishery of Parapenaeus longirostris and Nephrops norvegicus in the Tyrrhenian Sea (NW Mediterranean): The relative importance of fishery and environmental variables. Mar. Ecol. 2011, 32, 25–35. [Google Scholar] [CrossRef]
- Cosgrove, R.; Browne, D.; Minto, C.; Tyndall, P.; Oliver, M.; Montgomerie, M.; McHugh, M. A game of two halves: Bycatch reduction in Nephrops mixed fisheries. Fish. Res. 2019, 210, 31–40. [Google Scholar] [CrossRef]
- Farmer, A.S.D. Reproduction in Nephrops norvegicus (Decapoda: Nephropidae). J. Zoöl. 1974, 174, 161–183. [Google Scholar] [CrossRef]
- Sardà, F. Reproduction and Moult Synchronism in Nephrops norvegicus (L.) (Decapoda, Nephropidae) in the Western Mediterranean: Is Spawning Annual or Biennial? Crustaceana 1991, 60, 186–199. [Google Scholar] [CrossRef]
- Tuck, I.; Chapman, C.J.; Atkinson, R.J.A. Population biology of the Norway lobster, Nephrops norvegicus(L.) in the Firth of Clyde, Scotland—I: Growth and density. ICES J. Mar. Sci. 1997, 54, 125–135. [Google Scholar] [CrossRef]
- Mytilineou, C.; Castro, M.; Gancho, P.; Fourtouni, A. Growth studies on Norway lobster, Nephrops norvegicus (L.), in different areas of the Mediterranean Sea and the adjacent Atlantic. Sci. Mar. 1998, 62, 43–60. [Google Scholar] [CrossRef]
- Ulmestrand, M.; Eggert, H. Growth of Norway lobster, Nephrops norvegicus (Linnaeus 1758), in the Skagerrak, estimated from tagging experiments and length frequency data. ICES J. Mar. Sci. 2001, 58, 1326–1334. [Google Scholar] [CrossRef] [Green Version]
- Stamatis, C.; Triantafyllidis, A.; Moutou, K.A.; Mamuris, Z. Mitochondrial DNA variation in Northeast Atlantic and Mediterranean populations of Norway lobster, Nephrops norvegicus. Mol. Ecol. 2004, 13, 1377–1390. [Google Scholar] [CrossRef] [PubMed]
- McQuaid, N.; Briggs, R.; Roberts, D. Estimation of the size of onset of sexual maturity in Nephrops norvegicus (L.). Fish. Res. 2006, 81, 26–36. [Google Scholar] [CrossRef]
- Ridgway, I.; Taylor, A.; Atkinson, R.; Chang, E.; Neil, D. Impact of capture method and trawl duration on the health status of the Norway lobster, Nephrops norvegicus. J. Exp. Mar. Biol. Ecol. 2006, 339, 135–147. [Google Scholar] [CrossRef]
- Bell, M.; Elson, J.; Addison, J.; Revill, A.; Bevan, D. Trawl catch composition in relation to Norway lobster (Nephrops norvegicus L.) abundance on the Farn Deeps grounds, NE England. Fish. Res. 2008, 90, 128–137. [Google Scholar] [CrossRef]
- Ziegler, F.; Valentinsson, D. Environmental life cycle assessment of Norway lobster (Nephrops norvegicus) caught along the Swedish west coast by creels and conventional trawls—LCA methodology with case study. Int. J. Life Cycle Assess. 2008, 13, 487–497. [Google Scholar] [CrossRef]
- Ayza, O.; Tuset, V.M.; González, J.A. Estimation of size at onset of sexual maturity and growth parameters in Norway lobster (Nephrops norvegicus) off the Portuguese coast. Fish. Res. 2011, 108, 205–208. [Google Scholar] [CrossRef]
- Murray, F.; Cowie, P.R. Plastic contamination in the decapod crustacean Nephrops norvegicus (Linnaeus, 1758). Mar. Pollut. Bull. 2011, 62, 1207–1217. [Google Scholar] [CrossRef]
- Leocádio, A.M.; Whitmarsh, D.; Castro, M. Comparing Trawl and Creel Fishing for Norway Lobster (Nephrops norvegicus): Biological and Economic Considerations. PLoS ONE 2012, 7, e39567. [Google Scholar] [CrossRef]
- Eiríksson, H. Reproductive Biology of Female Norway Lobster, Nephrops norvegicus (Linnaeus, 1758) Leach, in Icelandic Waters During the Period 1960–2010: Comparative Overview of Distribution Areas in the Northeast Atlantic and the Mediterranean. In Advances in Marine Biology; Lesser, M., Ed.; Academic Press: Cambridge, MA, USA, 2014; Volume 68, pp. 65–210. [Google Scholar]
- Wood, H.; Eriksson, S.; Nordborg, M.; Styf, H. The effect of environmental stressors on the early development of the Norway lobster Nephrops norvegicus (L.). J. Exp. Mar. Biol. Ecol. 2015, 473, 35–42. [Google Scholar] [CrossRef]
- Haynes, P.S.; Browne, P.; Fullbrook, L.; Graham, C.T.; Hancox, L.; Johnson, M.P.; Lauria, V.; Power, A.M. Growth in Nephrops norvegicus from a tag-recapture experiment. Sci. Rep. 2016, 6, 35143. [Google Scholar] [CrossRef] [Green Version]
- Méhault, S.; Morandeau, F.; Kopp, D. Survival of discarded Nephrops norvegicus after trawling in the Bay of Biscay. Fish. Res. 2016, 183, 396–400. [Google Scholar] [CrossRef] [Green Version]
- Becker, C.; Cunningham, E.M.; Dick, J.T.A.; Eagling, L.E.; Sigwart, J.D. A unified scale for female reproductive stages in the Norway lobster (Nephrops norvegicus): Evidence from macroscopic and microscopic characterization. J. Morphol. 2018, 279, 1700–1715. [Google Scholar] [CrossRef] [PubMed] [Green Version]
- Power, A.M.; Merder, J.; Browne, P.; Freund, J.A.; Fullbrook, L.; Graham, C.; Kennedy, R.J.; O’Carroll, J.P.J.; Wieczorek, A.M.; Johnson, M.P. Field-recorded data on habitat, density, growth and movement of Nephrops norvegicus. Sci. Data 2019, 6, 7. [Google Scholar] [CrossRef] [PubMed]
- Gallagher, J.; Finarelli, J.A.; Jonasson, J.P.; Carlsson, J. Mitochondrial D-loop DNA analyses of Norway lobster (Nephrops norvegicus) reveals genetic isolation between Atlantic and East Mediterranean populations. J. Mar. Biol. Assoc. UK 2019, 99, 933–940. [Google Scholar] [CrossRef]
- Mytilineou, C.; Sardà, F. Age and growth of Nephrops norvegicus in the Catalan Sea, using length-frequency analysis. Fish. Res. 1995, 23, 283–299. [Google Scholar] [CrossRef]
- Maynou, F.; Sardà, F. Nephrops norvegicus population and morphometrical characteristics in relation to substrate heterogeneity. Fish. Res. 1997, 30, 139–149. [Google Scholar] [CrossRef]
- Bianchini, M.L.; Di Stefano, L.; Ragonese, S. Size and age at onset of sexual maturity of female Norway lobster Nephrops norvegicus L. (Crustacea: Nephropidae) in the Strait of Sicily (Central Mediterranean Sea). Sci. Mar. 1998, 62, 151–159. [Google Scholar] [CrossRef]
- Mori, M.; Biagi, F.; De Ranieri, S. Fecundity and egg loss during incubation in Norway lobster (Nephrops norvegicus) in the North Tyrrhenian Sea. J. Nat. Hist. 1998, 32, 1641–1650. [Google Scholar] [CrossRef]
- Sardà, F. Growth parameters of deep-water decapod crustaceans in the Northwestern Mediterranean Sea: A comparative approach. Mar. Biol. 2000, 136, 79–90. [Google Scholar] [CrossRef]
- Abelló, P.; Abella, Á.; Adamidou, A.; Jukic-Peladic, S.; Maiorano, P.; Spedicato, M.T. Geographical patterns in abundance and population structure of Nephrops norvegicus and Parapenaeus longirostris (Crustacea: Decapoda) along the European Mediterranean coasts. Sci. Mar. 2002, 66, 125–141. [Google Scholar] [CrossRef] [Green Version]
- Morello, E.B.; Antolini, B.; Gramitto, M.E.; Atkinson, R.J.A.; Froglia, C. The fishery for Nephrops norvegicus (Linnaeus, 1758) in the central Adriatic Sea (Italy): Preliminary observations comparing bottom trawl and baited creels. Fish. Res. 2009, 95, 325–331. [Google Scholar] [CrossRef]
- Brčić, J.; Herrmann, B.; Mašanović, M.; Baranović, M.; Šifner, S.K.; Škeljo, F. Size selection of Nephrops norvegicus (L.) in commercial creel fishery in the Mediterranean Sea. Fish. Res. 2018, 200, 25–32. [Google Scholar] [CrossRef] [Green Version]
- García-De-Vinuesa, A.; Breen, M.; Benoît, H.P.; Maynou, F.; Marquès, M. Seasonal variation in the survival of discarded Nephrops norvegicus in a NW Mediterranean bottom-trawl fishery. Fish. Res. 2020, 230, 105671. [Google Scholar] [CrossRef]
- Bertrand, J.A.; Gil de Sola, L.; Papaconstantinou, C.; Relini, G.; Souplet, A. The general specifications of the MEDITS surveys. Sci. Mar. 2002, 66, 9–17. [Google Scholar] [CrossRef] [Green Version]
- Smith, C.J.; Papadopoulou, K.-N. Burrow density and stock size fluctuations of Nephrops norvegicus in a semi-enclosed bay. ICES J. Mar. Sci. 2003, 60, 798–805. [Google Scholar] [CrossRef] [Green Version]
- Smith, C.J.; Marrs, S.; Atkinson, R.; Papadopoulou, K.; Hills, J. Underwater television for fisheries-independent stock assessment of Nephrops norvegicus from the Aegean (eastern Mediterranean) Sea. Mar. Ecol. Prog. Ser. 2003, 256, 161–170. [Google Scholar] [CrossRef] [Green Version]
- Mente, E.; Karapanagiotidis, I.T.; Logothetis, P.; Vafidis, D.; Malandrakis, E.; Neofitou, N.; Exadactylos, A.; Stratakos, A. The reproductive cycle of Norway lobster. J. Zoöl. 2009, 278, 324–332. [Google Scholar] [CrossRef]
- Aydin, I.; Aydin, C. Length-Length and Length-Weight Relationships in Nephrops norvegicus from the Aegean Sea (Linnaeus, 1758). Mediterr. Mar. Sci. 2011, 12, 121. [Google Scholar] [CrossRef] [Green Version]
- Stathopoulou, E.; Apostologamvrou, C.; Vafidis, D.; Mente, E.; Berillis, P. Sex differentiation in the histology of the digestive gland of Nephrops norvegicus from Pagasitikos Gulf during spring. Aquat. Living Resour. 2017, 30, 28. [Google Scholar] [CrossRef]
- Kevrekidis, K.; Thessalou-Legaki, M. Catch rates, size structure and sex ratio of Melicertus kerathurus (Decapoda: Penaeidae) from an Aegean Sea trawl fishery. Fish. Res. 2006, 80, 270–279. [Google Scholar] [CrossRef]
- Vafidis, D.; Leontarakis, P.K.; Dailianis, T.; Kallianiotis, A. Population characteristics of four deep-water pandalid shrimps (Decapoda: Caridea) in the northern Aegean Sea (NE Mediterranean). J. Nat. Hist. 2008, 42, 2079–2093. [Google Scholar] [CrossRef]
- Kevrekidis, K.; Thessalou-Legaki, M. Population dynamics of Melicertus kerathurus (Decapoda: Penaeidae) in Thermaikos Gulf (N. Aegean Sea). Fish. Res. 2011, 107, 46–58. [Google Scholar] [CrossRef]
- Lolas, A.; Vafidis, D. Population dynamics of two caprellid species (Crustaceae: Amphipoda: Caprellidae) from shallow hard bottom assemblages. Mar. Biodivers. 2013, 43, 227–236. [Google Scholar] [CrossRef]
- Konstantinidis, I.; Gkafas, G.; Karamitros, G.; Lolas, A.; Antoniadou, C.; Vafidis, D.; Exadactylos, A. Population structure of two benthic species with different larval stages in the eastern Mediterranean Sea. J. Environ. Prot. Ecol. 2017, 18, 930–939. [Google Scholar]
- Lolas, A.; Antoniadou, C.; Vafidis, D. Spatial variation of molluscan fauna associated with Cystoseira assemblages from a semi-enclosed gulf in the Aegean Sea. Reg. Stud. Mar. Sci. 2018, 19, 17–24. [Google Scholar] [CrossRef]
- Klaoudatos, D.; Kotsiri, Z.; Neofitou, N.; Lolas, A.; Vafidis, D. Population Characteristics of the Mid-Littoral Chthamalid Barnacle C. stellatus (Poli, 1791) in Eastern Mediterranean (Central Greece). Water 2020, 12, 3304. [Google Scholar] [CrossRef]
- Tuck, I.; Atkinson, R.J.A.; Chapman, C.J. Population biology of the Norway lobster, Nephrops norvegicus (L.) in the Firth of Clyde, Scotland II: Fecundity and size at onset of sexual maturity. ICES J. Mar. Sci. 2000, 57, 1227–1239. [Google Scholar] [CrossRef]
- Powell, A.; Eriksson, S.P. Reproduction: Life Cycle, Larvae and Larviculture. In Advances in Marine Biology; Johnson, M.L., Johnson, M.P., Eds.; Academic Press: Cambridge, MA, USA, 2013; Volume 64, pp. 201–245. [Google Scholar]
- Sánchez-Lizaso, J.L.; Goñi, R.; Reñones, O.; Charton, J.G.; Galzin, R.; Bayle, J.; Sanchez-Jerez, P.; Pérez-Ruzafa, A.; Ramos, A. Density dependence in marine protected populations: A review. Environ. Conserv. 2000, 27, 144–158. [Google Scholar] [CrossRef] [Green Version]
- Relini, L.O.; Zamboni, A.; Fiorentino, F.; Massi, D. La reproducción de la cigala (Nephrops norvegicus, Crustacea Decapoda Nephropidae) en diferentes zonas del Mediterráneo. Sci. Mar. 1998, 62, 25–41. [Google Scholar] [CrossRef] [Green Version]
- Castro, M. A Methodology for Obtaining Information on the Age Structure and Growth Rates of the Norway Lobster, Nephrops Nor Vegicus (L.) (Decapoda, Nephropoidea). Crustaceana 1992, 63, 29–43. [Google Scholar] [CrossRef]
- Angelini, S.; Martinelli, M.; Santojanni, A.; Colella, S. Biological evidence of the presence of different subpopulations of Norway lobster (Nephrops norvegicus) in the Adriatic Sea (Central Mediterranean Sea). Fish. Res. 2020, 221, 105365. [Google Scholar] [CrossRef]
- Vogt, G. Ageing and longevity in the Decapoda (Crustacea): A review. Zoöl. Anz. A J. Comp. Zoöl. 2012, 251, 1–25. [Google Scholar] [CrossRef]
- Pauly, D. Beyond duplicity and ignorance in global fisheries. Sci. Mar. 2009, 73, 215–224. [Google Scholar] [CrossRef] [Green Version]
Figure 1.
Map of the study area of Pagasitikos gulf, with the three distinct sampling quadrants and sampling locations. Dots indicate the starting position of the haul and vectors indicate the bearing.
Figure 1.
Map of the study area of Pagasitikos gulf, with the three distinct sampling quadrants and sampling locations. Dots indicate the starting position of the haul and vectors indicate the bearing.

Figure 2.
Total Catch and Biomass of Nephrops captured in each sampling year and region of Pagasitikos Gulf, Eastern Mediterranean, Greece.
Figure 2.
Total Catch and Biomass of Nephrops captured in each sampling year and region of Pagasitikos Gulf, Eastern Mediterranean, Greece.

Figure 3.
Temporal (i.e., among years) and spatial (i.e., among regions) variability of (A) Carapace Length (CL) and (B) Body Weight (BW), for each sex of Nephrops from Pagasitikos Gulf, Eastern Mediterranean, Greece. Vertical bars represent the range of values. The horizontal line represents the Median value of each data set. Letters above the bars represent the homogenous groups estimated by the Fisher’s LSD procedure. Data sets with different letters show statistically significant differences at the 95.0% confidence level.

Figure 4.
Sex ratio, in terms of the proportion of female Nephrops individuals, for each size class. Dashed line indicates the 1:1 equilibrium. Dots over the dashed line indicate female dominance, whereas dots under the dashed line indicate male dominance, for the specific size class.
Figure 4.
Sex ratio, in terms of the proportion of female Nephrops individuals, for each size class. Dashed line indicates the 1:1 equilibrium. Dots over the dashed line indicate female dominance, whereas dots under the dashed line indicate male dominance, for the specific size class.

Figure 5.
Modal Progression Analysis of length–frequency distributions of Carapace Length (CL) length from Nephrops (A) female and (B) male individuals. Dashed line indicates representative group of individuals belonging to the same cohorts selected in FISAT Bhattacharya’s Method. Star symbol denotes the mean CL of the representative age group. Solid line indicates better estimates of the NORMSEP analysis module. Values in table represent the mean body size (Mean) of each age group, the standard deviation (SD), population size assigned to this group (Population), and separation index (SI). Representative groups are designated with red type.

Figure 6.
Temporal allocation of the developmental stages of Nephrops females from Pagasitikos Gulf, Eastern Mediterranean, Greece. Stage 1, white–immature; Stage 2, green, expands up to the cephalothorax–maturing; Stage 3, dark green, expands down into the abdomen–fully mature; Stage 4, white–ovigerous female carrying green eggs on its pleopods; Stage 5, white–ovigerous female carrying brown eggs on its pleopods; Stage 6, white–eggs are released with brown filaments on legs of the adult females.

Figure 7.
Maturity ogive and confidence limits estimated by Probit analysis, indicating average mean size at onset of maturity (SOM) of Nephrops females from Pagasitikos Gulf, Eastern Mediterranean, Greece.
Figure 7.
Maturity ogive and confidence limits estimated by Probit analysis, indicating average mean size at onset of maturity (SOM) of Nephrops females from Pagasitikos Gulf, Eastern Mediterranean, Greece.

Figure 8.
Temporal variation of Exploitation rate and Mean CL of (A) Male and (B) Female Nephrops from Pagasitikos Gulf, Eastern Mediterranean, Greece.
Figure 8.
Temporal variation of Exploitation rate and Mean CL of (A) Male and (B) Female Nephrops from Pagasitikos Gulf, Eastern Mediterranean, Greece.


Table 1.
Values of the linear regression constants a and b, estimated from the correlation of Carapace Length (CL) with Body Weight (BW) for both sexes of Nephrops, for each year of sampling (r: correlation coefficient, F and p: values from the lack-of-fit test. * designates significant lack of fit).
| Year | a | b | r | F | p |
|---|---|---|---|---|---|
| Males | |||||
| 2008 | −3.023 ± 0.12 | 2.893 ± 0.07 | 0.898 | 0.83 | 0.7743 |
| 2009 | −3.348 ± 0.08 | 3.100 ± 0.05 | 0.941 | 0.61 | 0.9873 |
| 2010 | −3.105 ± 0.08 | 2.939 ± 0.05 | 0.924 | 2.12 | 0.0003 * |
| 2011 | −2.089 ± 0.12 | 2.269 ± 0.08 | 0.801 | 1.44 | 0.1064 |
| 2012 | −2.565 ± 0.09 | 2.604 ± 0.06 | 0.901 | 2.82 | 0.1002 |
| 2013 | −1.530 ± 0.10 | 1.956 ± 0.07 | 0.827 | 1.21 | 0.2648 |
| 2014 | −1.865 ± 0.10 | 2.158 ± 0.06 | 0.857 | 1.66 | 0.0505 |
| Females | |||||
| 2008 | −3.252 ± 0.08 | 3.101 ± 0.05 | 0.933 | 1.35 | 0.0533 |
| 2009 | −2.975 ± 0.07 | 2.851 ± 0.05 | 0.901 | 1.90 | <0.0001 * |
| 2010 | −3.342 ± 0.05 | 3.089 ± 0.03 | 0.956 | 1.09 | 0.2307 |
| 2011 | −1.555 ± 0.11 | 1.913 ± 0.07 | 0.779 | 1.49 | 0.0200 * |
| 2012 | −2.193 ± 0.09 | 2.365 ± 0.06 | 0.858 | 2.36 | <0.0001 * |
| 2013 | −1.988 ± 0.08 | 2.234 ± 0.06 | 0.866 | 1.49 | 0.0143 * |
| 2014 | −2.094 ± 0.09 | 2.285 ± 0.06 | 0.861 | 1.27 | 0.0935 |
Table 2.
Values of the Von Bertalanffy Growth Function of Nephrops, estimated by a non-linear regression and Morality values, estimated by several models incorporated in the FiSAT II software, for each year of sampling and for each sex. (CLinf = asymptotic carapace length, K = growth coefficient, t0 = hypothetical age at zero length, Z = total mortality, M = natural mortality, F = fishing mortality, E = exploitation rate).
| Year | CLinf (mm) | K (year−1) | t0 (year) | Z (year−1) | M (year−1) | F (year−1) | E |
|---|---|---|---|---|---|---|---|
| Males | |||||||
| 2008 | 83.62 | 0.11 | −2.84 | 0.798 | 0.306 | 0.492 | 0.62 |
| 2009 | 79.38 | 0.10 | −2.57 | 0.771 | 0.293 | 0.478 | 0.62 |
| 2010 | 77.14 | 0.09 | −1.66 | 0.690 | 0.241 | 0.449 | 0.65 |
| 2011 | 74.23 | 0.11 | −1.18 | 0.698 | 0.239 | 0.460 | 0.66 |
| 2012 | 78.99 | 0.11 | −0.59 | 0.723 | 0.196 | 0.527 | 0.73 |
| 2013 | 80.95 | 0.09 | −0.77 | 0.704 | 0.174 | 0.531 | 0.75 |
| 2014 | 79.90 | 0.13 | −0.13 | 0.768 | 0.161 | 0.606 | 0.79 |
| Females | |||||||
| 2008 | 66.91 | 0.14 | −1.93 | 0.783 | 0.346 | 0.437 | 0.56 |
| 2009 | 69.55 | 0.18 | −2.19 | 0.854 | 0.337 | 0.518 | 0.61 |
| 2010 | 68.19 | 0.12 | −1.46 | 0.726 | 0.269 | 0.457 | 0.63 |
| 2011 | 64.83 | 0.18 | −2.72 | 0.767 | 0.273 | 0.494 | 0.64 |
| 2012 | 67.48 | 0.14 | −2.98 | 0.813 | 0.308 | 0.506 | 0.62 |
| 2013 | 69.12 | 0.11 | −1.25 | 0.792 | 0.238 | 0.554 | 0.70 |
| 2014 | 68.76 | 0.13 | −0.51 | 0.721 | 0.228 | 0.493 | 0.68 |
Publisher’s Note: MDPI stays neutral with regard to jurisdictional claims in published maps and institutional affiliations. |
© 2021 by the authors. Licensee MDPI, Basel, Switzerland. This article is an open access article distributed under the terms and conditions of the Creative Commons Attribution (CC BY) license (http://creativecommons.org/licenses/by/4.0/).
Share and Cite
MDPI and ACS Style
Lolas, A.; Vafidis, D. Population Dynamics, Fishery, and Exploitation Status of Norway Lobster (Nephrops norvegicus) in Eastern Mediterranean. Water 2021, 13, 289. https://doi.org/10.3390/w13030289
AMA Style
Lolas A, Vafidis D. Population Dynamics, Fishery, and Exploitation Status of Norway Lobster (Nephrops norvegicus) in Eastern Mediterranean. Water. 2021; 13(3):289. https://doi.org/10.3390/w13030289
Chicago/Turabian StyleLolas, Alexios, and Dimitris Vafidis. 2021. "Population Dynamics, Fishery, and Exploitation Status of Norway Lobster (Nephrops norvegicus) in Eastern Mediterranean" Water 13, no. 3: 289. https://doi.org/10.3390/w13030289
Note that from the first issue of 2016, this journal uses article numbers instead of page numbers. See further details here.