
Bioelectrochemical Greywater Treatment for Non-Potable Reuse and Energy Recovery
by
 , ,
, ,
Daniele Cecconet
1,2,* ,
,
Silvia Bolognesi
2,3 ,
,
Luca Piacentini
2, 
Arianna Callegari
2 and
Andrea G. Capodaglio
2 1
Department of Chemistry, University of Pavia, via Torquato Taramelli 12, 27100 Pavia, Italy
2
Department of Civil Engineering and Architecture, University of Pavia, via Adolfo Ferrata 3, 27100 Pavia, Italy
3
LEQUiA, Institute of the Environment, Campus Montilivi, Universitat de Girona, C/Maria Aurèlia Capmany 69, E-17003 Girona, Spain
*
Author to whom correspondence should be addressed.
Water 2021, 13(3), 295; https://doi.org/10.3390/w13030295
Submission received: 20 October 2020
/
Revised: 20 January 2021
/
Accepted: 21 January 2021
/
Published: 26 January 2021
(This article belongs to the Special Issue Emerging Integrated Processes for Sustainable Water-Energy-Materials-Food Nexus)
Abstract
:Greywater normally represents the largest fraction of wastewater generated in buildings and may be suitable for non-potable reuse after on-site treatment. Conventional technologies for greywater treatment include sequencing batch reactors, membrane filtration, and membrane biological reactors. Even though these can be very effective, they are highly energy consuming and may negatively impact the energy balance of the building where they are installed. Microbial fuel cells (MFCs) have emerged as a sustainable technology for contaminant removal and energy production from a variety of substrates. In this study, the application of MFCs for greywater treatment is reported, with a particular focus on the analysis of energy losses, in view of non-potable reuse. MFCs were fed with different types of greywater, characterized by either high or low conductivity, because greywater’s conductivity may greatly differ based on its origin; in either case, organic matter (chemical oxygen demand; COD) removal was higher than 85% and not influenced by the influent conductivity, coupled with a maximum power production of 0.46 mW L−1 and 0.38 mW L−1. Electrolyte overpotentials were dramatically higher in the case of low conductivity greywater (20% vs. 10%, compared to high conductivity influent); these overpotentials are related to the conductivity of the influent, showing that low conductivity hindered energy generation, but not COD removal. Polarization and power curves showed higher internal resistance in the case of low conductivity, confirming the overpotentials’ analysis. Results showed the feasibility of the use of MFCs in greywater treatment, with potential to reduce the energy demand connected to its reuse compared to conventional technologies; coupling with a disinfection stage would be necessary to fully comply with most non-potable reuse regulations.
1. Introduction
Water scarcity and resource recovery issues have led to the formulation of innovative water paradigms, with particular focus on decentralized on-site treatment [1], source separation [2], and fit-for-purpose reuse [3]. Furthermore, as a consequence of emerging concerns about water cycle energy use and greenhouse gas (GHG) emissions [4,5,6] proper technology selection and valorization of often-neglected waste streams are becoming crucial issues. Source-separated greywater (GW) could contribute to lower the demand of valuable drinking water currently utilized for non-potable uses, greatly reducing domestic per capita water consumption. It is estimated that a fraction between 60% and 75% of domestic wastewater is represented by GW [7,8,9], defined as used water from domestic sources, including kitchen sinks (but excluding waste grinders, if present), washing machines, and hand basins, with the exclusion of toilets, bidets, and urinal flows [10]. Its amount could be quantified in up to 100–150 L/PE/day in high-income countries [9]. Compared to unsegregated domestic wastewater, GW contains a relatively lower amount of organic matter that needs to be removed in order to comply with applicable regulations regarding non-potable water reuse applications [11].
Current options for on-site GW treatment and reuse include membrane bioreactors (MBR) [3,12,13], sequencing batch reactors [14], and green walls [11]; nature-based solutions, such as constructed wetlands [15,16], are applicable, but they demand large spatial footprints. Innovative proposed technologies include electrocoagulation and filtration combined with biological processes [17]. All these options should consider potential uses and possible risks related to pathogenic and pollutants’ residual content after treatment [18]. Among different options, membrane filtration and its coupling with biological treatment, MBR, are particularly common due to their simplicity, compactness, and solid-free effluents [3,13]. This makes them suitable for onsite application in single buildings or groups thereof, even in dense conurbations. However, some of the cited technologies are highly energy demanding: values of 0.16–0.24, 0.5–0.7, 0.1–0.3, and 0.11–0.22 kWh m−3 were measured for biological aerated filter, MBR, sequential batch reactor and conventional activated sludge, respectively, operated at pilot scale for urban non-potable reuse of greywater [19]. Matos et al. [20] reported energy consumption up to 1.89 kWh m−3 for MBR treatment of greywater in decentralized in-building applications. Therefore, this aspect may negatively impact the local energy and emissions balance of the installation site [21]. Therefore, alternative technologies that use less energy and may even generate it ought to be evaluated to enhance sustainability of GW treatment and its local reuse.
Bioelectrochemical systems (BESs) have emerged in the last two decades as a multi-faceted platform for a variety of purposes, including organic matter removal, nutrient recovery, hazardous site remediation, and groundwater treatment [22,23,24,25]. The first and most common declination of BESs is represented by microbial fuel cells (MFCs), in which organic matter is oxidized in an anodic compartment; electrons collected at the anode travel through resistance to reach the cathode, where they are used in a reduction reaction. Electrochemically active microorganisms act as catalysts for reaction evolution at anode and cathode [26,27,28]. MFCs proved proficient in treating a large variety of wastewaters, including agro-industrial effluents, swine wastewater, and nitrate-contaminated groundwater [29,30,31,32]. The presence of organic matter at high concentrations in the anolyte, however, may lead to the development of an undesired competition between electrochemically active microorganisms and methanogens; this phenomenon is limited at low organic concentrations, while it can be highly detrimental at higher organic matter concentrations [33,34]. Due to the low organic content of GW, MFCs may therefore represent an ideal, virtually zero-energy input process technology for decentralized GW treatment for reuse, while at the same time producing a certain amount of energy from an often-neglected waste stream. Decentralized systems, in fact, can not only mitigate the effects of wastewater disposal on the environment and public health, but may increase the ultimate local reuse of water [35,36].
In this study, an application of a double-chamber MFC for GW treatment for possible reuse purposes, focusing on organic matter removal, energy production, and internal energy losses, is presented, and analyzed.
2. Materials and Methods
2.1. MFC Setup
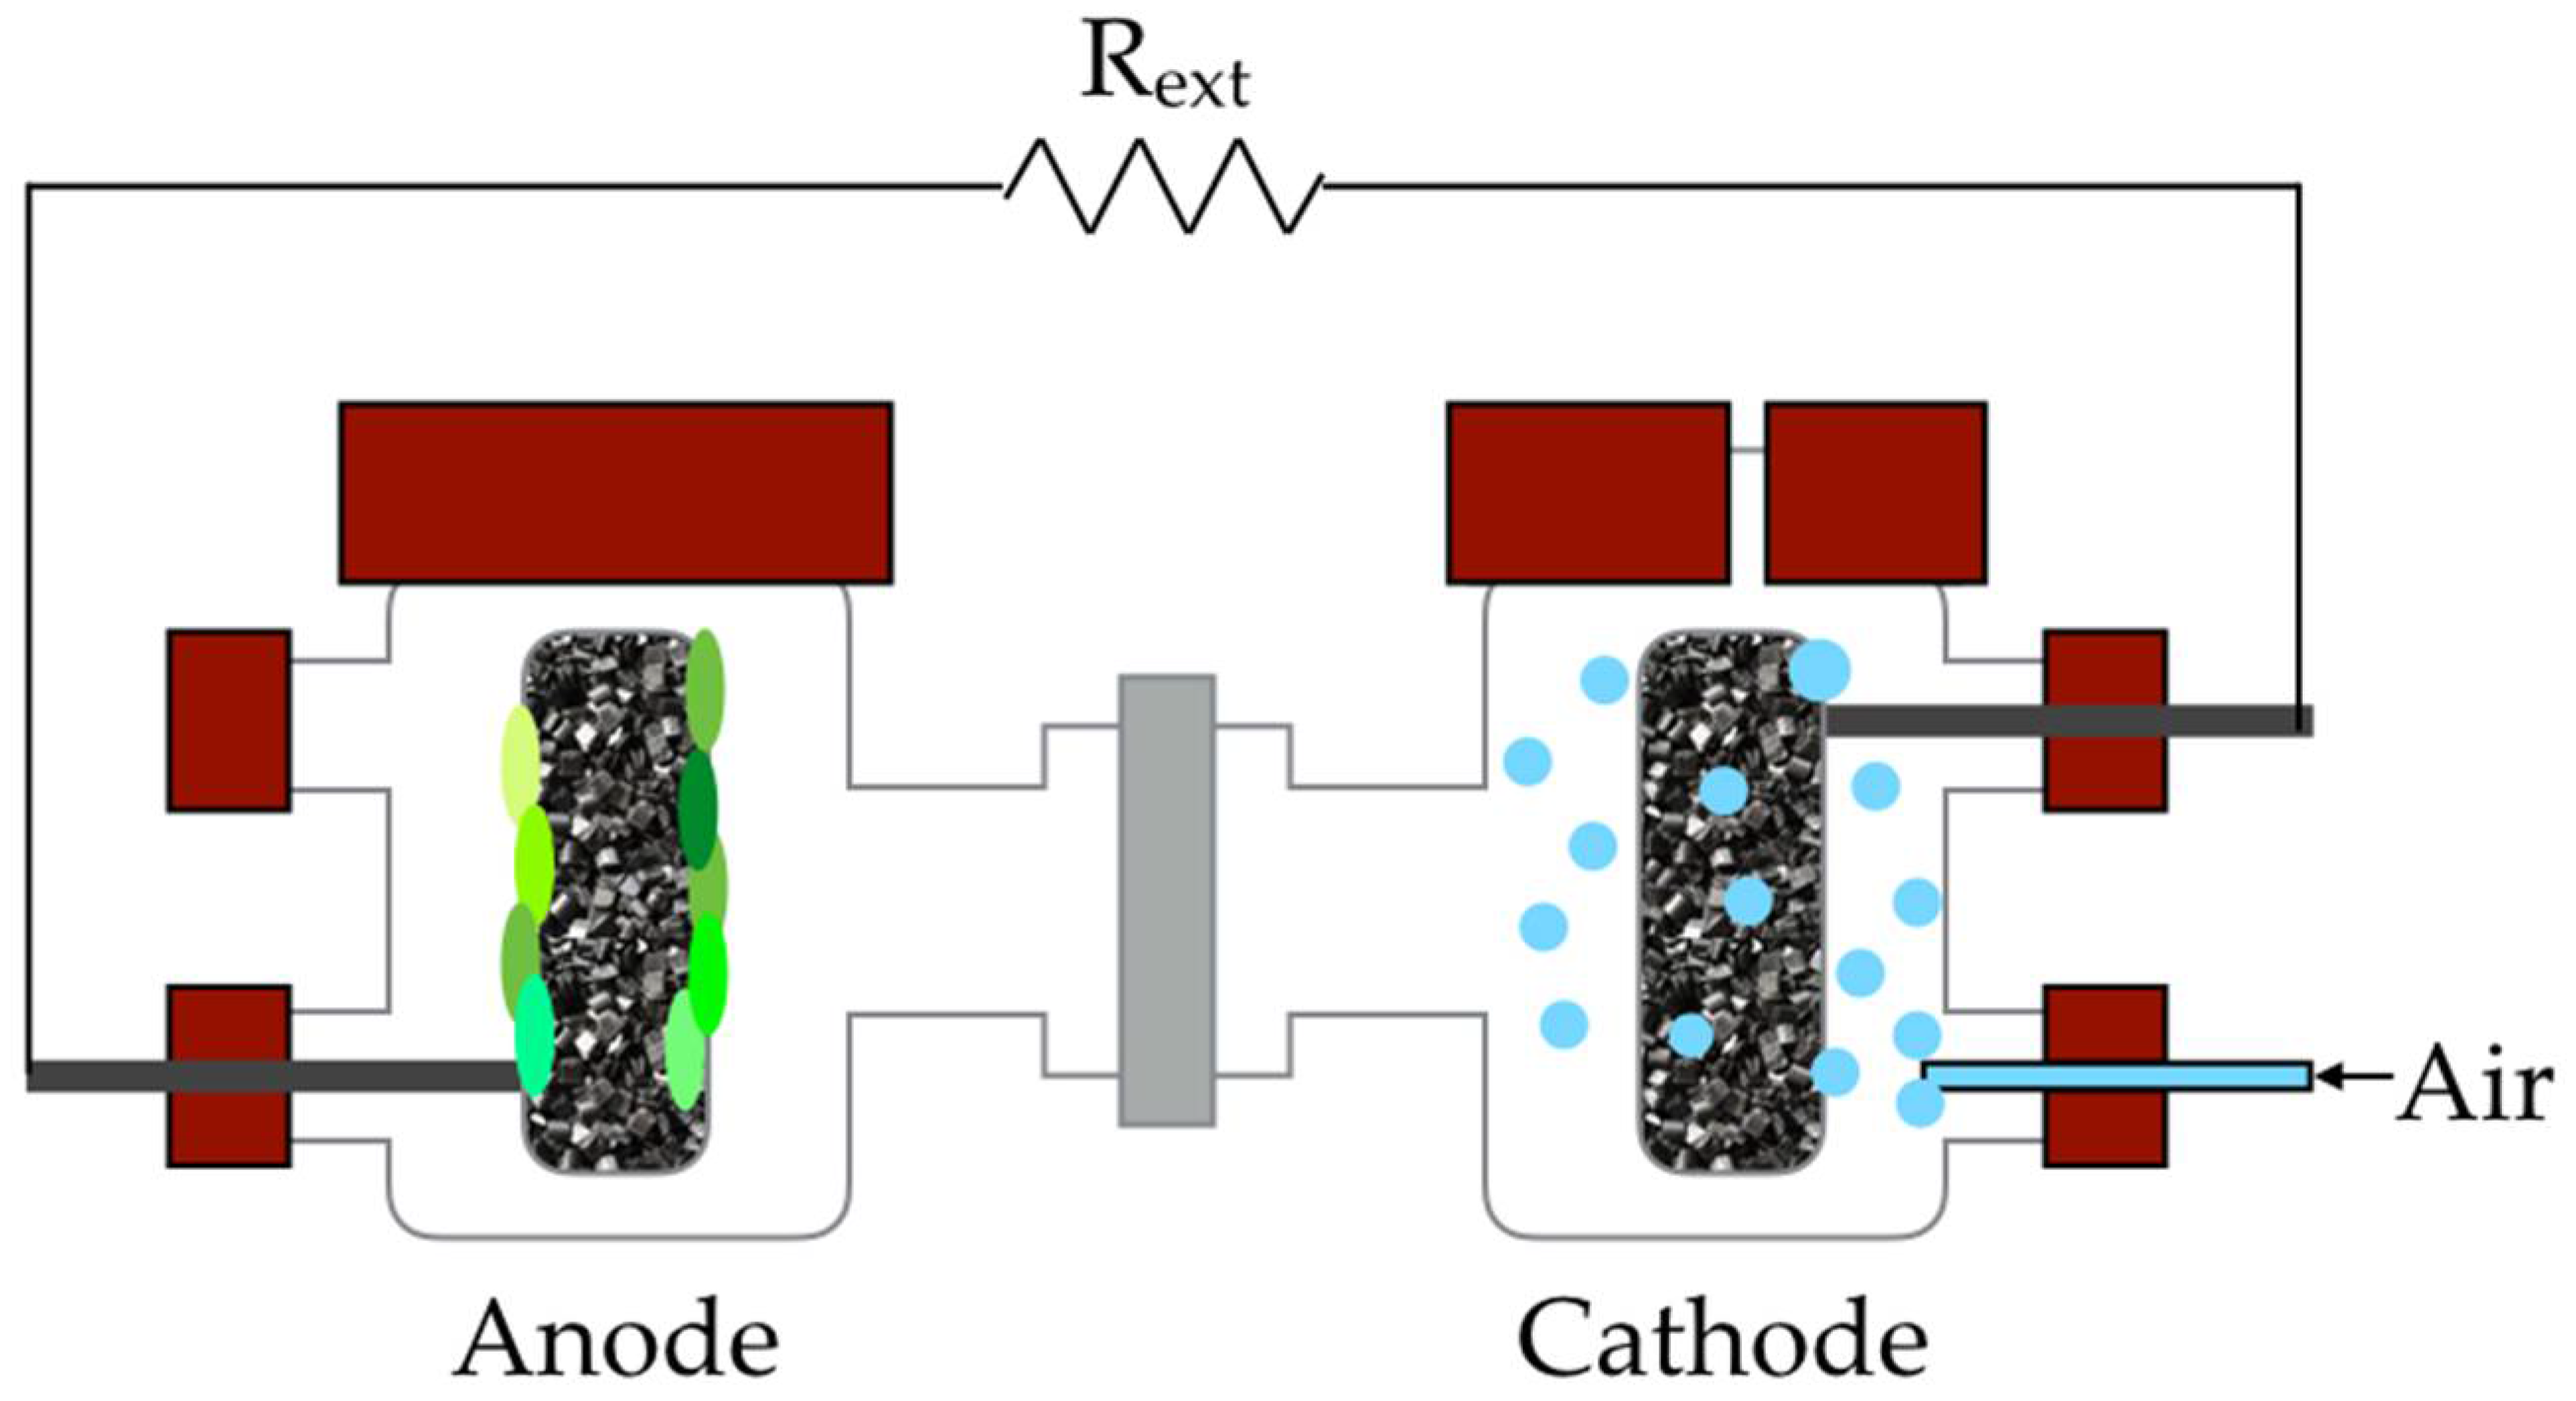
Three identical H-type MFCs were built, each with two 130 mL glass half-cells, as shown in Figure 1. The cathode and anode were composed of granular graphite (model 00514, diameter 2.5–5 mm, EnViro-Cell, Oberursel, Germany) inserted in a perforated plastic cuvette to allow dispersion-less, full contact between the graphite and anolyte/catholyte. The volume of each graphite electrode was 10 mL, with a distance between electrodes of 5 cm. A cation exchange membrane (CEM, CMI-7000, Membranes International Inc., Ringwood, NJ, USA) separated the anodic and cathodic chambers. Addition of electrodes decreased the internal net cell volume in each chamber (net anodic chamber, NAC, and net cathodic chamber, NCC) to 110 mL. Air was supplied to the cathode using an air pump to provide oxygen as a terminal electron acceptor (TEA) for the necessary cathodic reduction. Mixing was provided at the anodes by magnetic stirrers. Anodes of the MFCs were inoculated using the effluent of a long-term operating parent MFC with the addition of CH3COONa (1.5 g L−1) as an organic matter source. Once inoculated, the MFCs were fed with acetate-based solution for 30 batch cycles. After this initial phase, the MFCs were operated in batch mode using GW as the influent. Each of the MFCs was equipped with 3750 Ω external resistance (Rext); this value was chosen based on polarization and power curves observation conducted in the preliminary acetate-fed phase. A phosphate buffer solution (PBS, 10 mM, pH = 7), with the following composition: 0.507 g L−1 NaH2PO4, 0.819 g L−1 Na2HPO4, was fed to the abiotic cathodes.
2.2. Greywater Composition
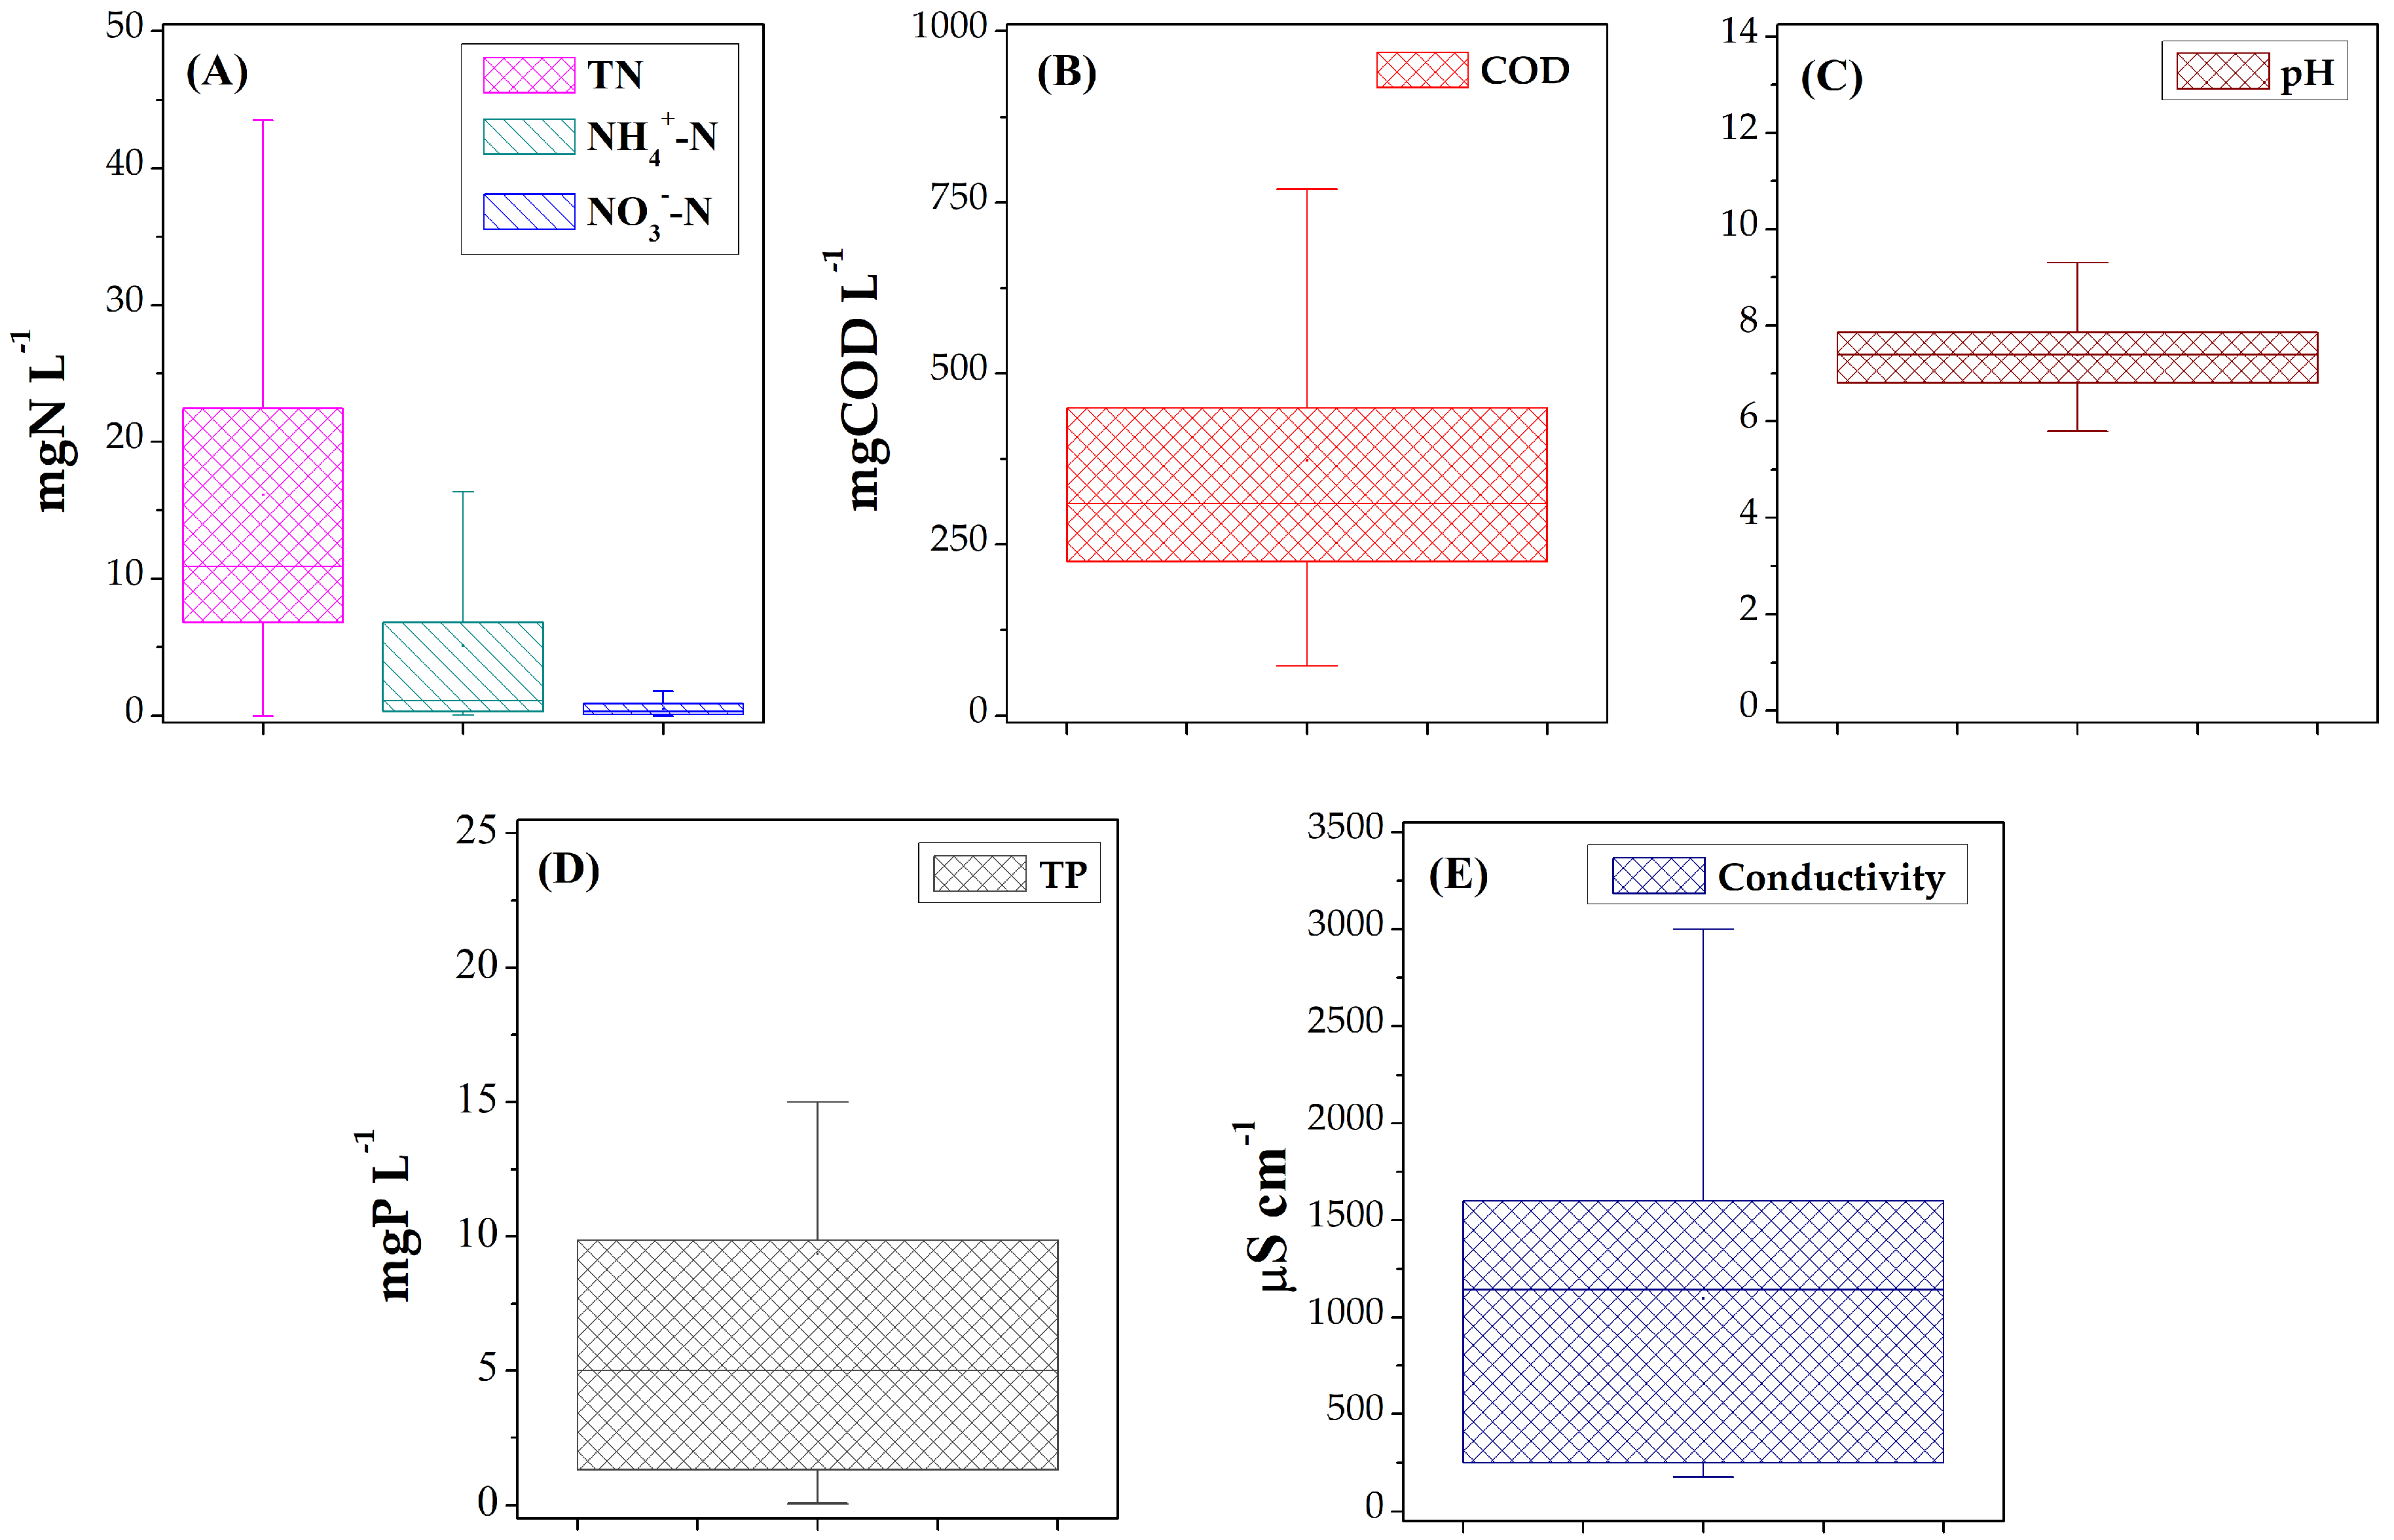
Due to different water consumption patterns, GW characteristics may greatly vary across geographical areas [37,38]. An analysis of reported physical and chemical parameters was conducted, leading to the definition of key GW characteristics summarized in Figure 2.
As shown in Figure 2, GW presents a wide range of conductivity values, which can greatly influence bioelectrochemical processes; variability in the ionic conductivity is attributed to the different initial uses of water [3]. Dissolved ions contribute to the charge transport and reduce the solution resistance [39,40]. Therefore, low ionic conductivity values may hinder electron and proton transport due to the increase in resistance in the BES reactor [41]. To proceed with the study, GW was prepared, modifying the recipe proposed by Jefferson et al. [42], consisting of handwashing soap (0.064 g L−1), shampoo (0.8 mL L−1), sunflower oil (0.01 mL L−1), and effluent of a long-term operating MFC (2.4 mL L−1). Details on shampoo and soap composition are available in the Supplementary Materials. The simulated GW was thus representative of average GW characteristics reported in the literature. A solution with higher conductivity was also prepared by KCl addition, and an acetate solution with a similar organic matter concentration with the following recipe: Na2HPO4 0.8192 g L−1, NaH2PO4 0.5074 g L−1, KCl 0.0026 g L−1, CH3COONa 1 g L−1, NH4Cl 0.02 g L−1, micronutrients 1 mL L−1 was prepared as a control substrate. All the used solutions’ parameters are summarized in Table 1.
After inoculation and start-up, three different performance tests were carried out, each in a different MFC fed with: (a) GW with low conductivity; (b) GW with high conductivity; and (c) acetate control solution. Each experiment lasted 500 h and was repeated three times to ensure reproducibility.
2.3. Monitoring and Analytics
Voltage, power, and electric current were monitored at 60 s intervals with an automatic data acquisition system (NI-USB 6008, National Instruments Co., Austin, TX, USA) connected to a computer. Influent characterization in terms of chemical oxygen demand (COD), NO3−-N, NH4+-N, total nitrogen (TN), and total phosphorus (TP) was carried out with a spectrophotometer (HI 83224 Wastewater Treatment Photometer, Hanna Instruments, Padua, Italy), while NO2−-N measurements were performed using nitrite test kits (HI3873, Hanna Instruments). All samples were stored at 4 °C prior to analysis for no more than 24 h. Conductivity and pH were monitored at the beginning of each test using a multi-parametric probe (IntelliCALTM equipped with HQdTM Digital Meter, Hach Lange, Lainate, Italy). At the end of each test (elapsed time 500 h), residual COD was measured. Current and power densities (mA L−1 and mW L−1) were calculated by the ratio of the current or power and NAC. Normalized energy recovery (NERS, kWh kgCODremoved−1) was calculated using Equation (1), as proposed by Ge et al. [43]:
where P is the power (mW) measured by the data acquisition system, t is the time (s), and ∆COD is the mass of COD removed in the batch (kgCODremoved).
NERs = (P · t)/∆COD
Polarization and power curves were obtained using a single-channel potentiostat (NEV4, Nanoelectra, Madrid, Spain) and imposing a linear decrease of 0.5 mV s−1 from the open circuit voltage (OCV) down to 0 mV. From these curves, internal resistance was calculated by the power density peak method [44]; electrochemical tests were conducted in a second phase (subsequent to the batch tests) in order not to affect the energy production during the tests [45]. The energy balance equation was used to calculate the energy loss factors, following the procedure reported in Sleutels et al. [46]. Anode and cathode overpotentials (ηAn and ηCat), ionic (Eion), pH gradient (EΔpH), and membrane transport losses (Et) were then evaluated; ohmic losses other than ionic were not directly measured but included in the terms ηAn and ηCat [46].
3. Results
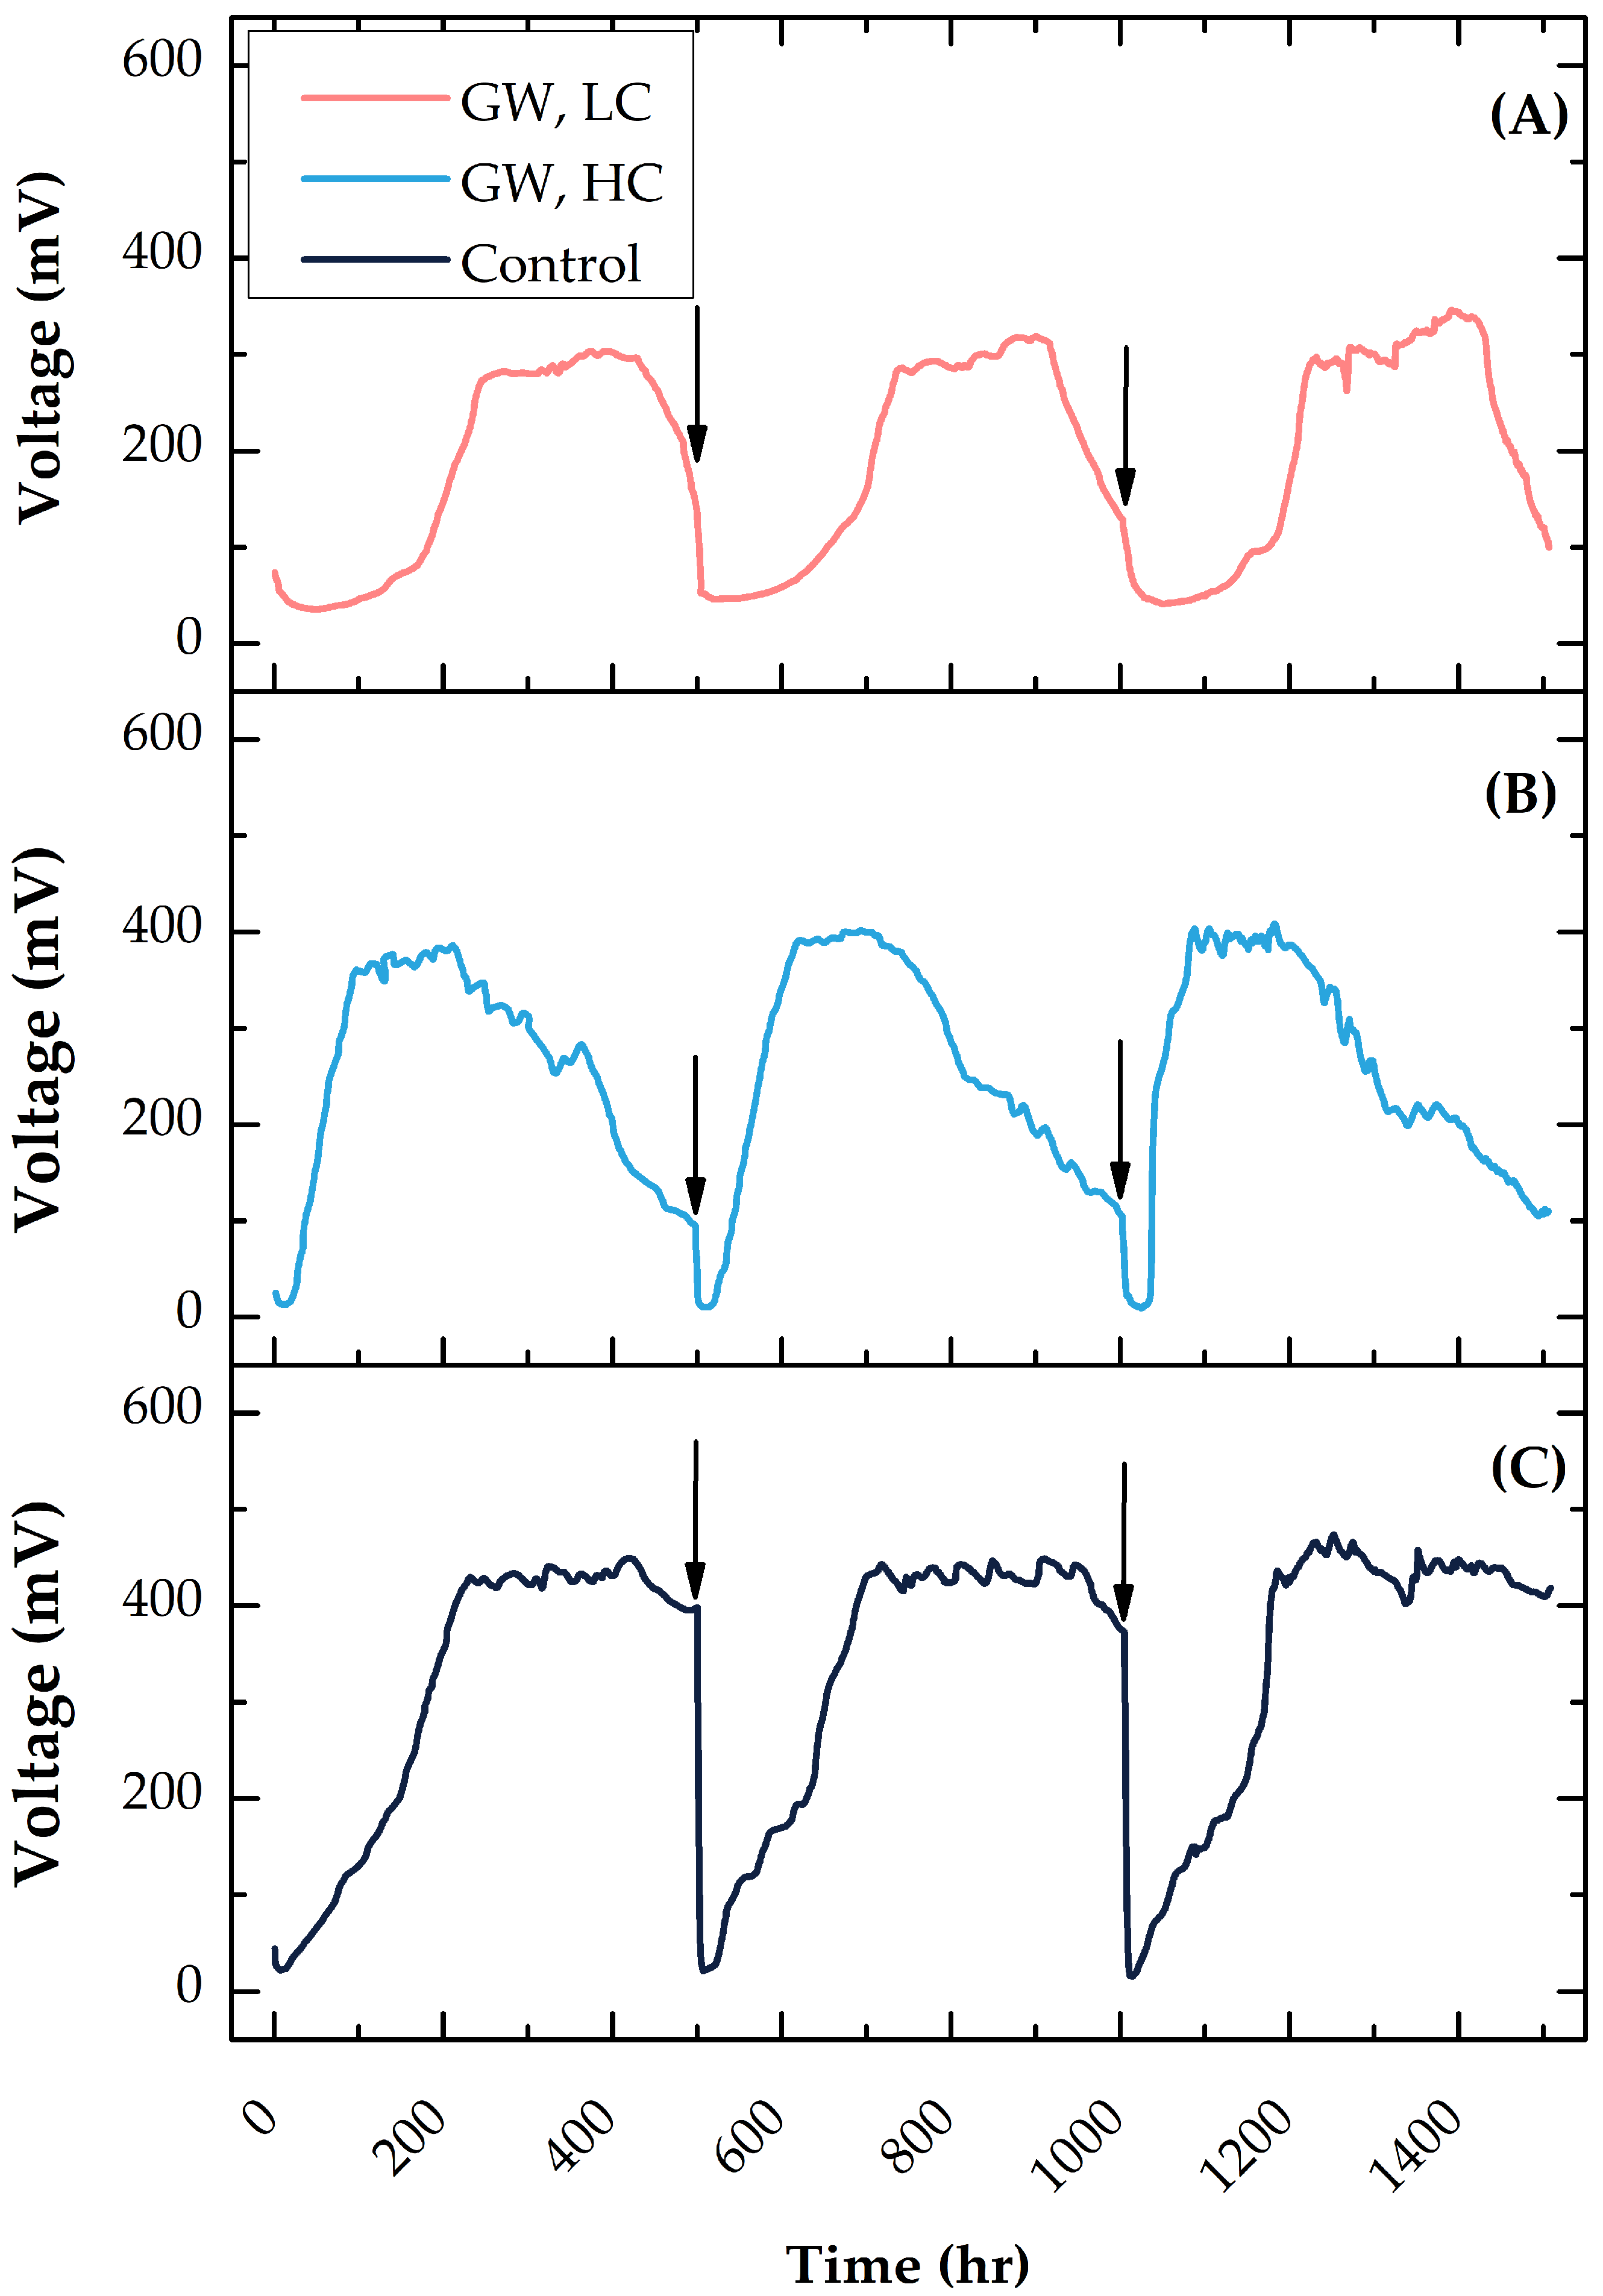
Each experiment was repeated three times; the graphs observed during the entire study are reported in Figure 3 and show good reproducibility of the results. When fed with low conductivity GW, MFCs achieved maximum voltage generation after a long (nearly 400 h) lag time in each batch, as shown in Figure 3A; this trend was confirmed in all tests with low conductivity GW. Maximum voltage of 346 mV was measured; at the end of each test, the voltage declined to about 100 mV. Current and power density trends during the experimentation are available in the Supplementary Materials (Figures S1 and S2, respectively).
Compared to the tests with high conductivity GW (Figure 3B), in the case of low conductivity GW, a much slower voltage increase, as well as lower observed peak voltage, are noticeable. This finding agrees with previously reported results, where electrochemical performances of MFCs were observed to increase with the ionic strength of the substrate [39,41,47]. Low wastewater conductivity usually causes overpotentials to increase, due to slow proton transport in the active biofilm [48] and higher resistance originating from the diffusion boundary and electric double layers [49,50]. In addition, low values of ionic conductivity were reported as a limiting aspect in the transfer of cations from anode to cathode and vice versa, therefore retarding the balance of electro-neutrality of the system [39,51]. Combination of these factors may lead to the observed decrease in MFC’s energy production with low conductivity anolytes.
On the other hand, observed COD removal was not impacted by ionic strength differences, showing comparable values in both GW tests, and close to the values for acetate control test. Voltage in the control test reached a maximum value of 474 mV, higher than those observed when GW was fed as the anolyte. This could be attributed to GW complexity, due to the variety of compounds originally contained in detergents and personal care products, compared to the relatively simple acetate substrate, easily oxidable in the anodic compartment [52,53]. Complete removal of nitrogen and phosphorus from GW was observed at the end of each test.
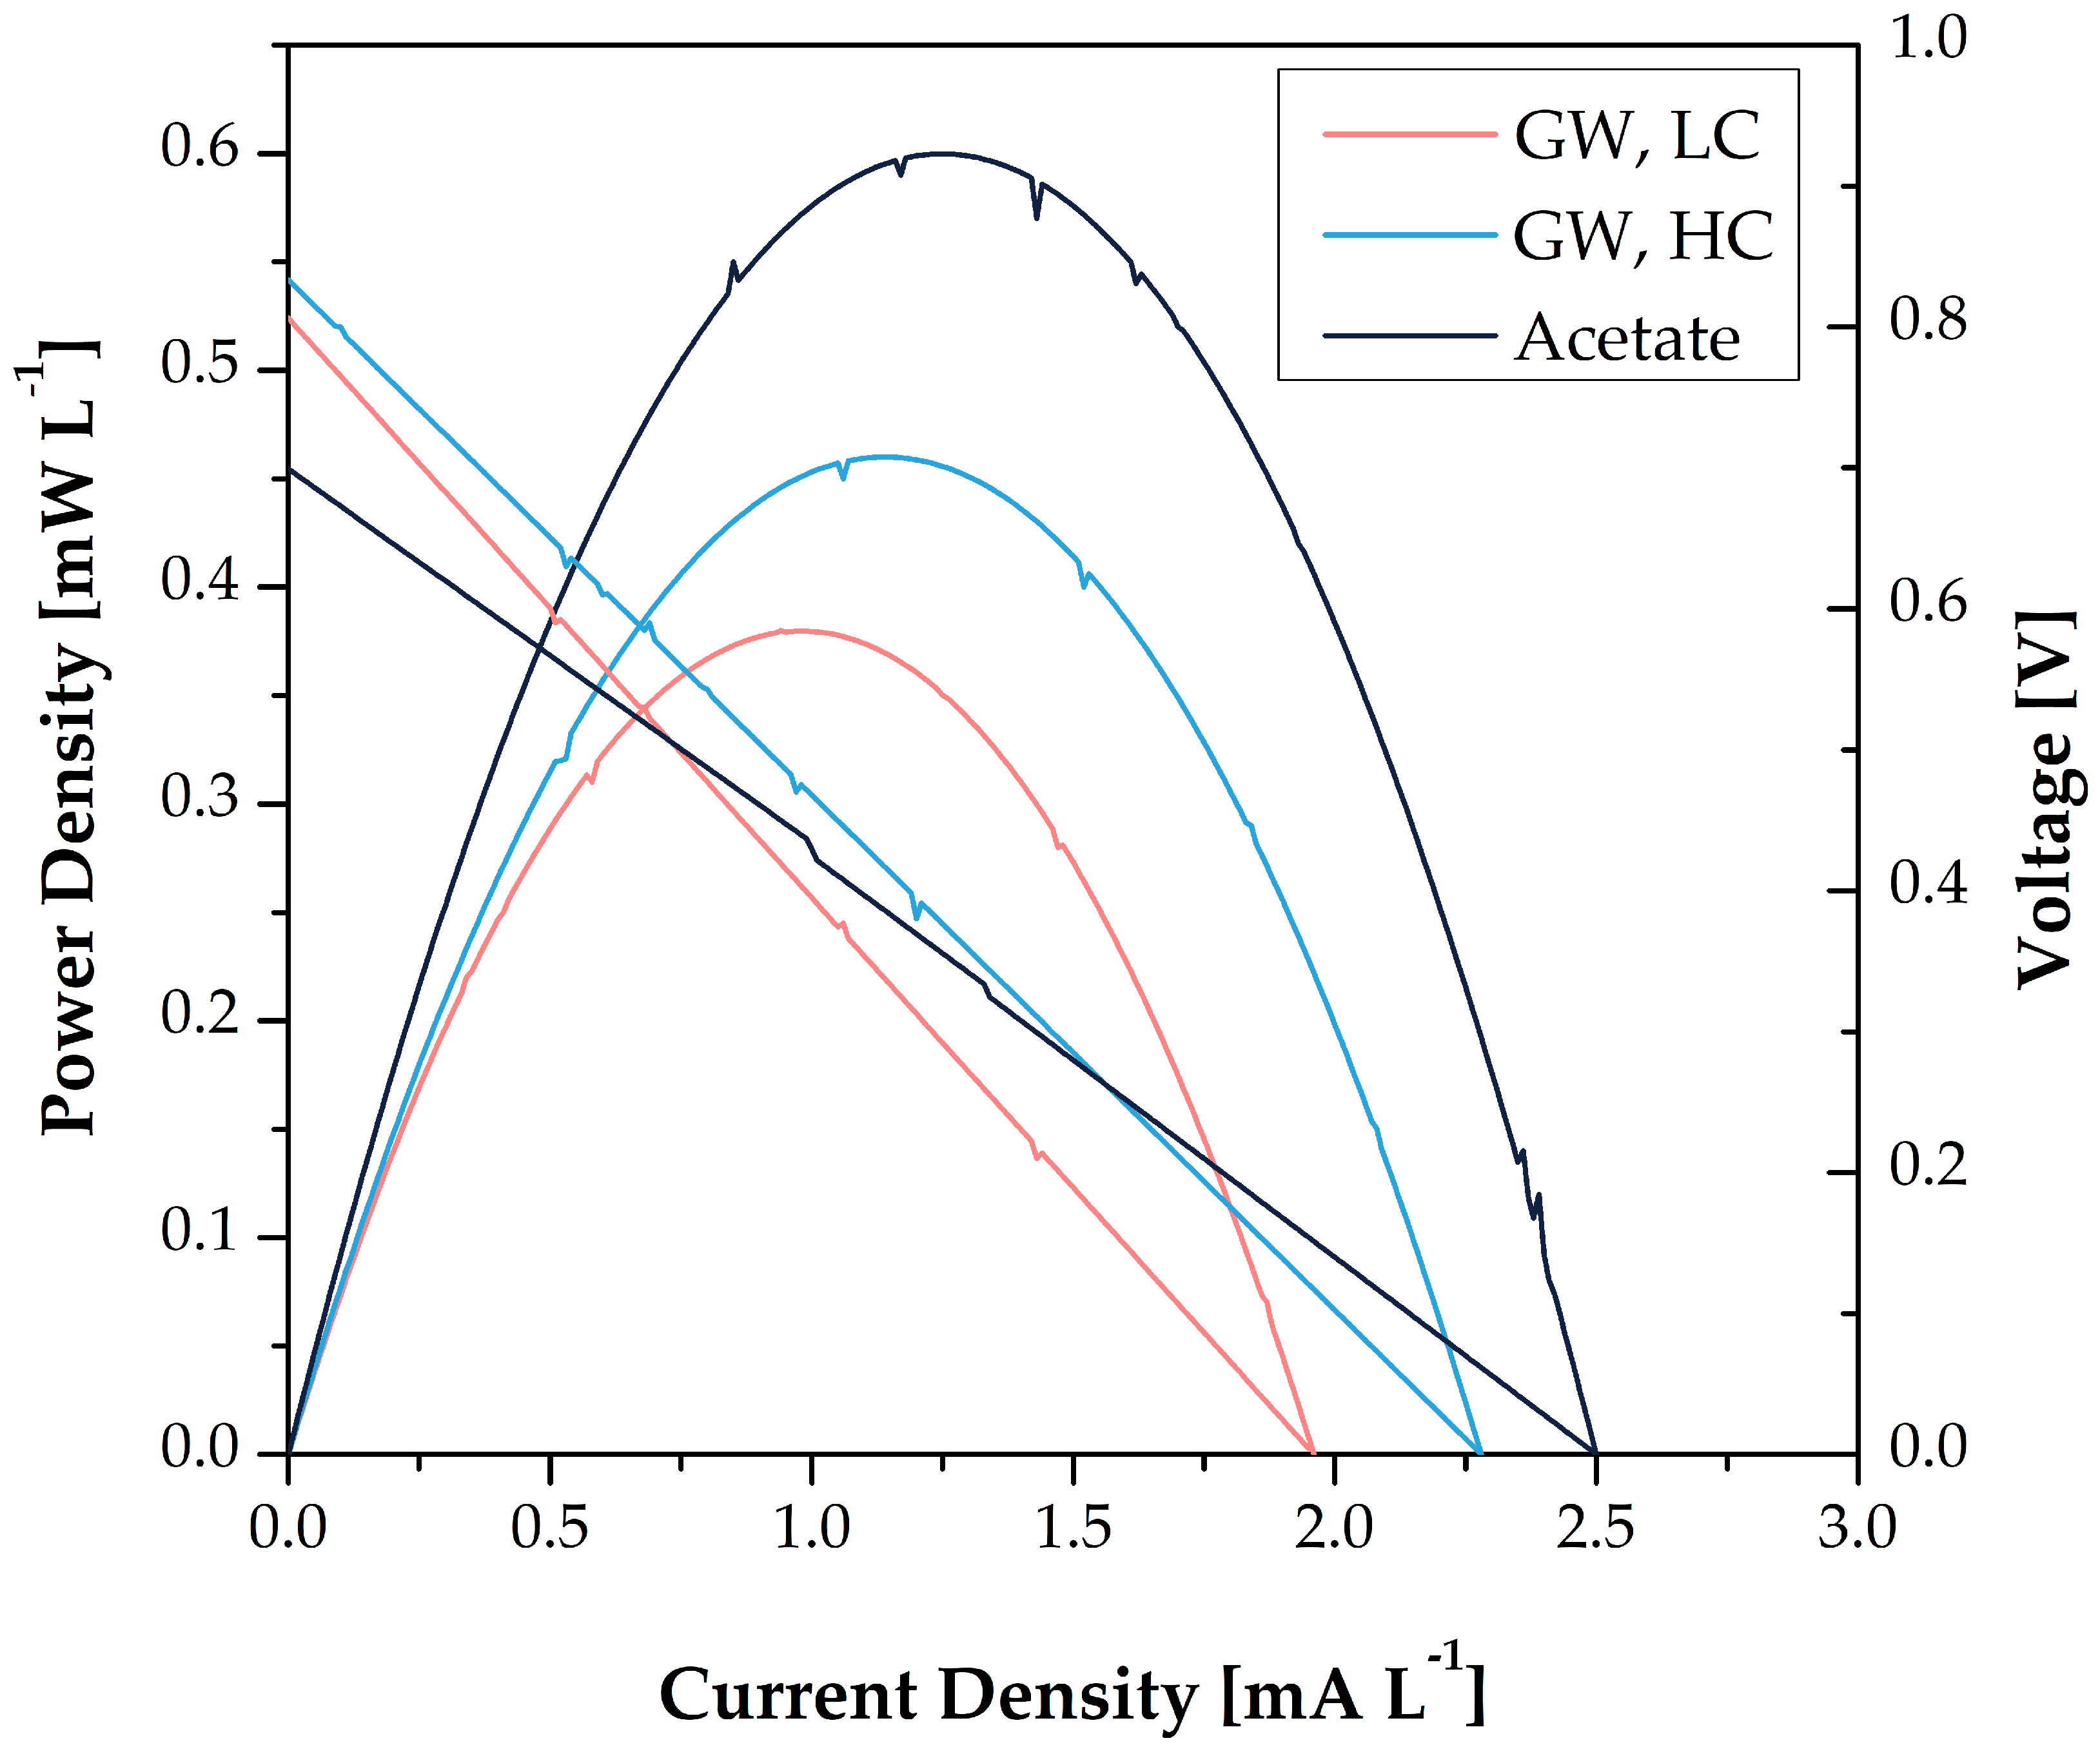
Current and power densities reflected the trend set by voltage patterns, as displayed by the polarization and power curves shown in Figure 4. The MFC operated with high conductivity GW scored a Pmax value 21% higher than that at low conductivity. Analysis of polarization curves allowed the calculation of the MFCs’ internal resistance: 3323 Ω and 3740 Ω for low and high conductivity substrates, respectively; 2543 Ω for the acetate-fed control system. The use of GW as the influent led to the increase in internal resistances.
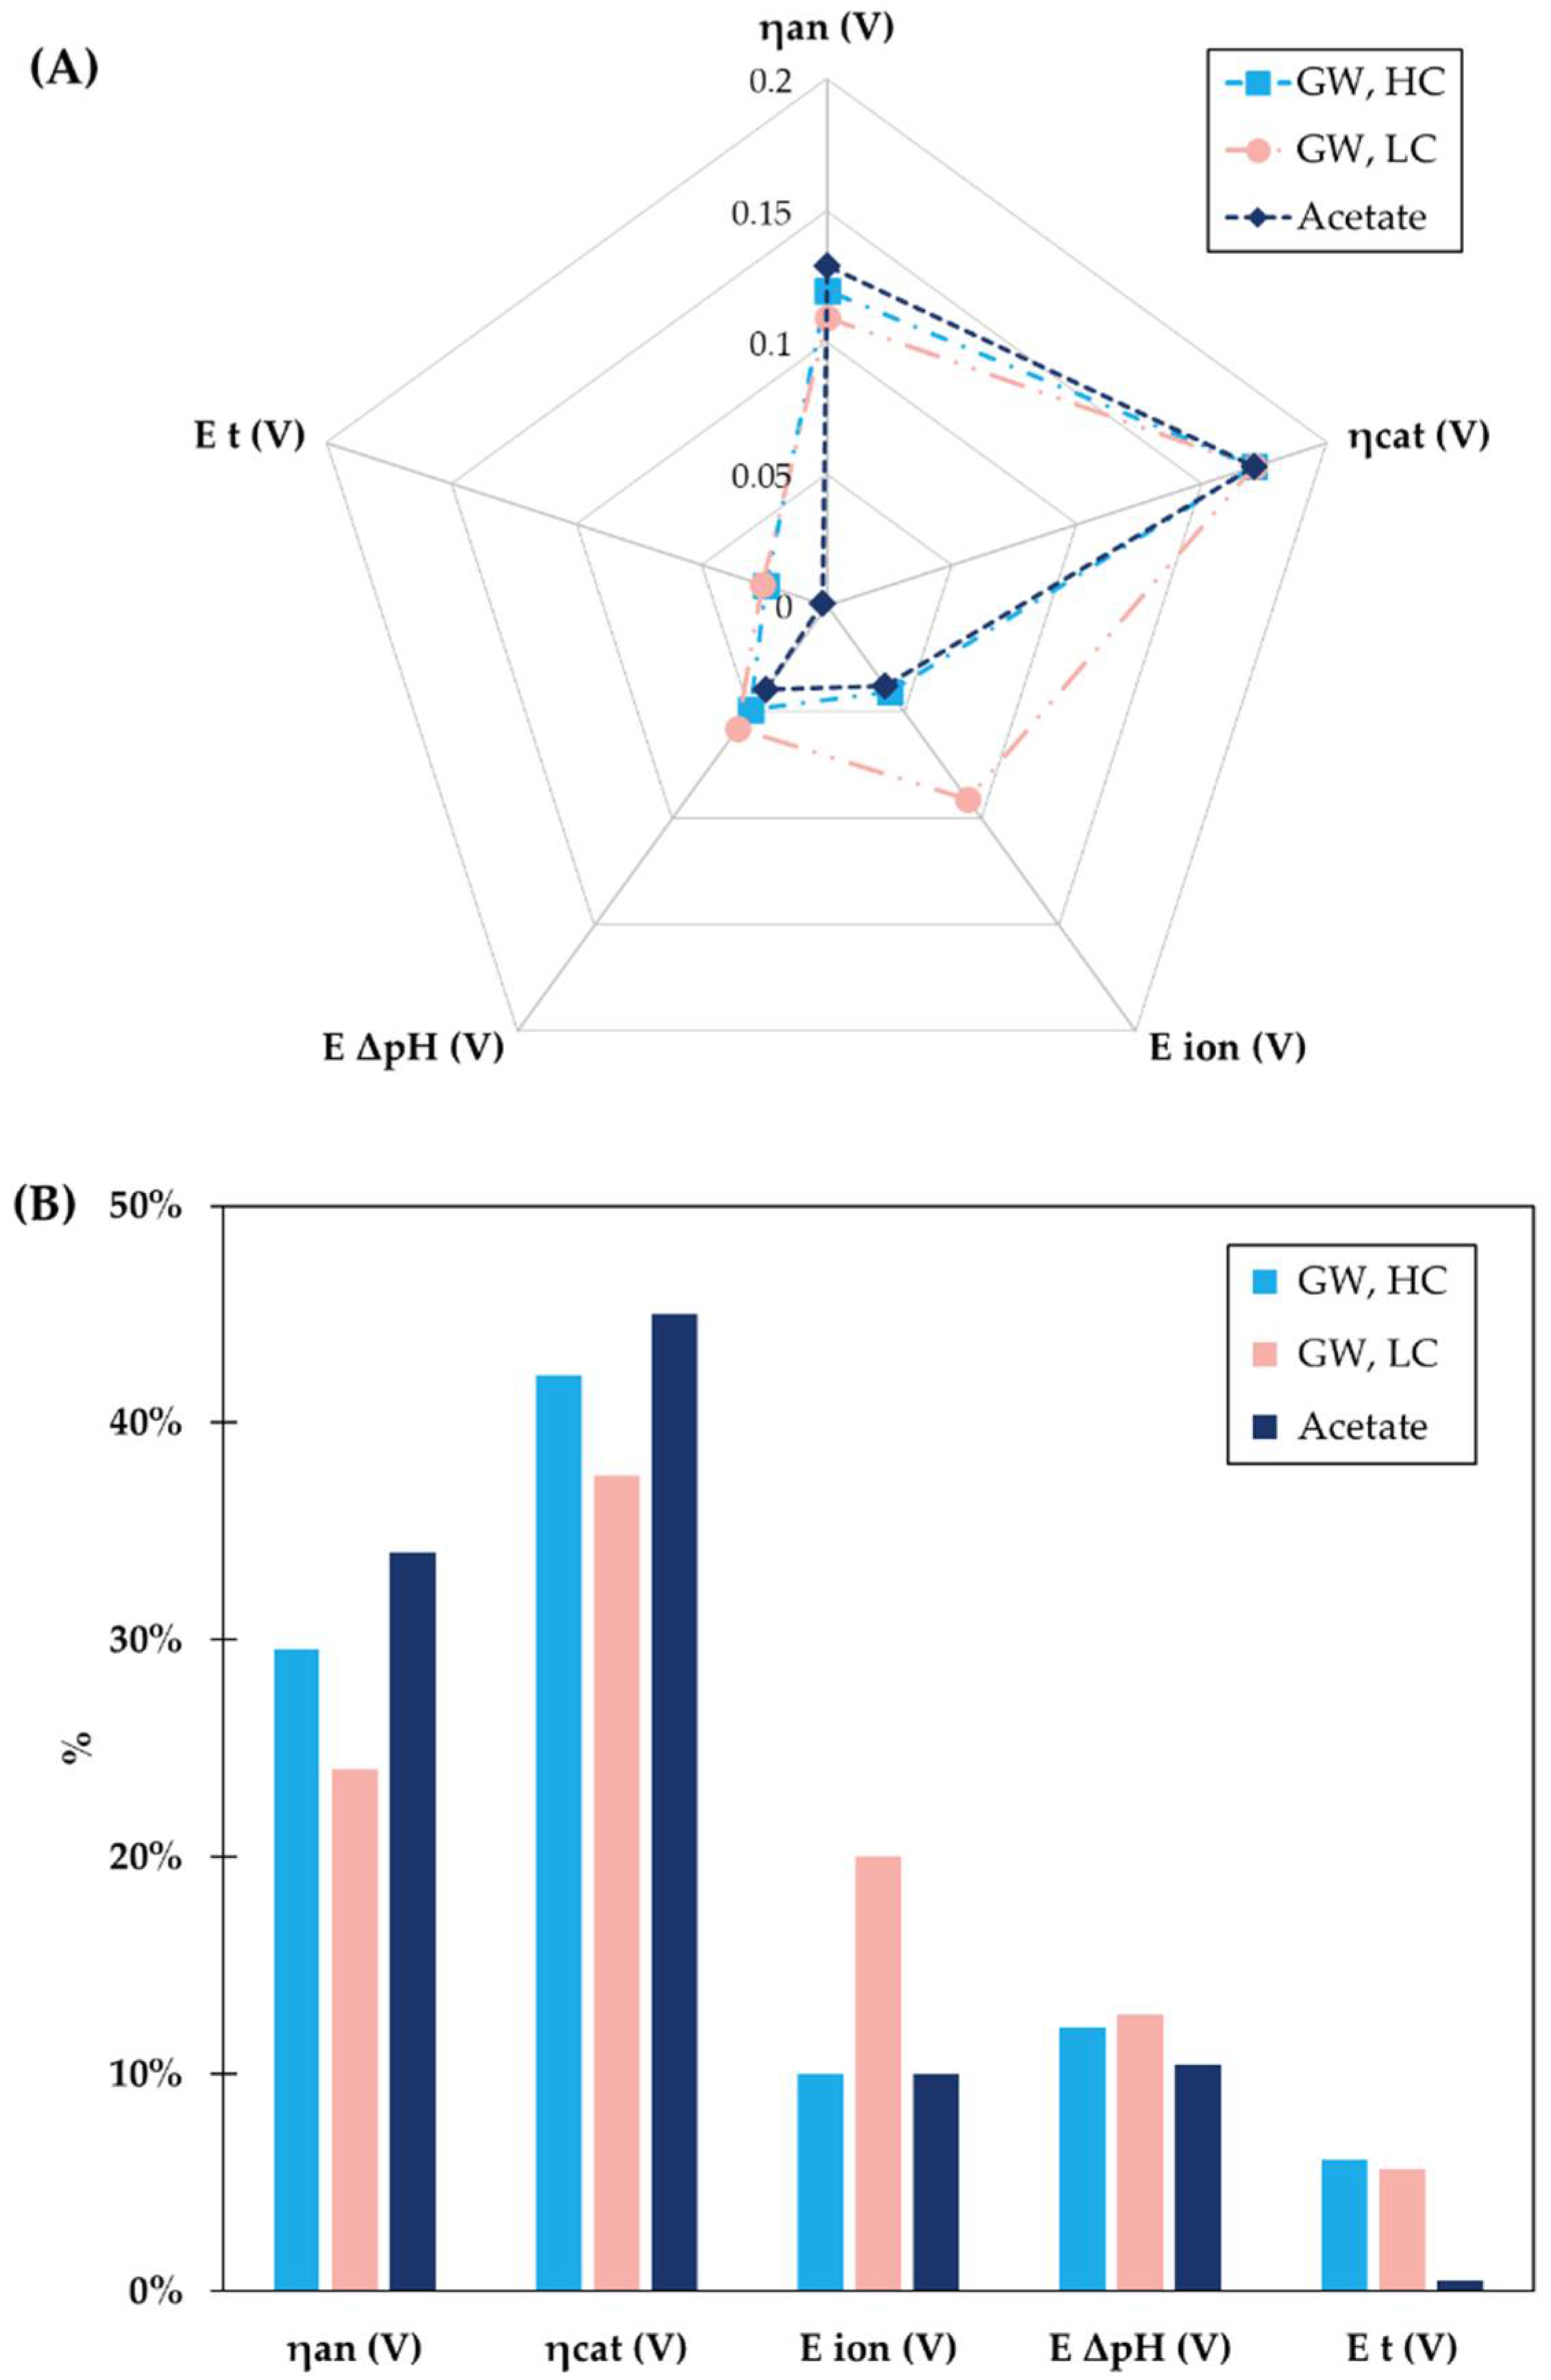
The analysis of the energy losses may suggest useful insights on the different performances of the MFCs fed with GW (low or high conductivity) or acetate. Several factors contribute the various losses and were considered in the analysis: anode and cathode overpotentials (ηAn and ηCat), conductivity-based ionic overpotentials (Eion), pH gradient (EΔpH), and membrane transport losses (Et). As shown in Figure 5B, cathode overpotentials were identified as the major contributors in the overall losses, accounting for 42.2% in the case of the MFC operated with high conductivity GW, 37.6% in the case of low conductivity, and 45.0% in the control acetate-fed MFC. This may be attributed to the low performance electrodes used in the cathode, in which abiotic conditions were maintained and no catalysts (Pt, Ti) were applied, paving the way for cathode overpotentials higher than 0.17 V, as shown in Figure 5A; the development of a biocathode would have led to a reduction in cathodic overpotentials [53,54]. In all the cases, the anode overpotentials reached values close to 30%, while pH-related overpotentials settled around 12%. Electrolyte overpotentials were dramatically higher in the case of low conductivity GW (20% vs. 10% in the other cases); these overpotentials are related to the conductivity of the influent [46], explaining why worse results in terms of energy production were scored when low conductivity GW was used as feed.
Analysis of NERs, a parameter expressing the amount of energy recovered from organic matter removal throughout the test normalized on the NAC, showed that high conductivity GW led to better values compared to low conductivity feed; results were lower than those reported in the control test with acetate, as shown in Table 2. Reported common NER values are in the order of < 1.0 in MFCs fed with different influents [43,55].
4. Perspectives
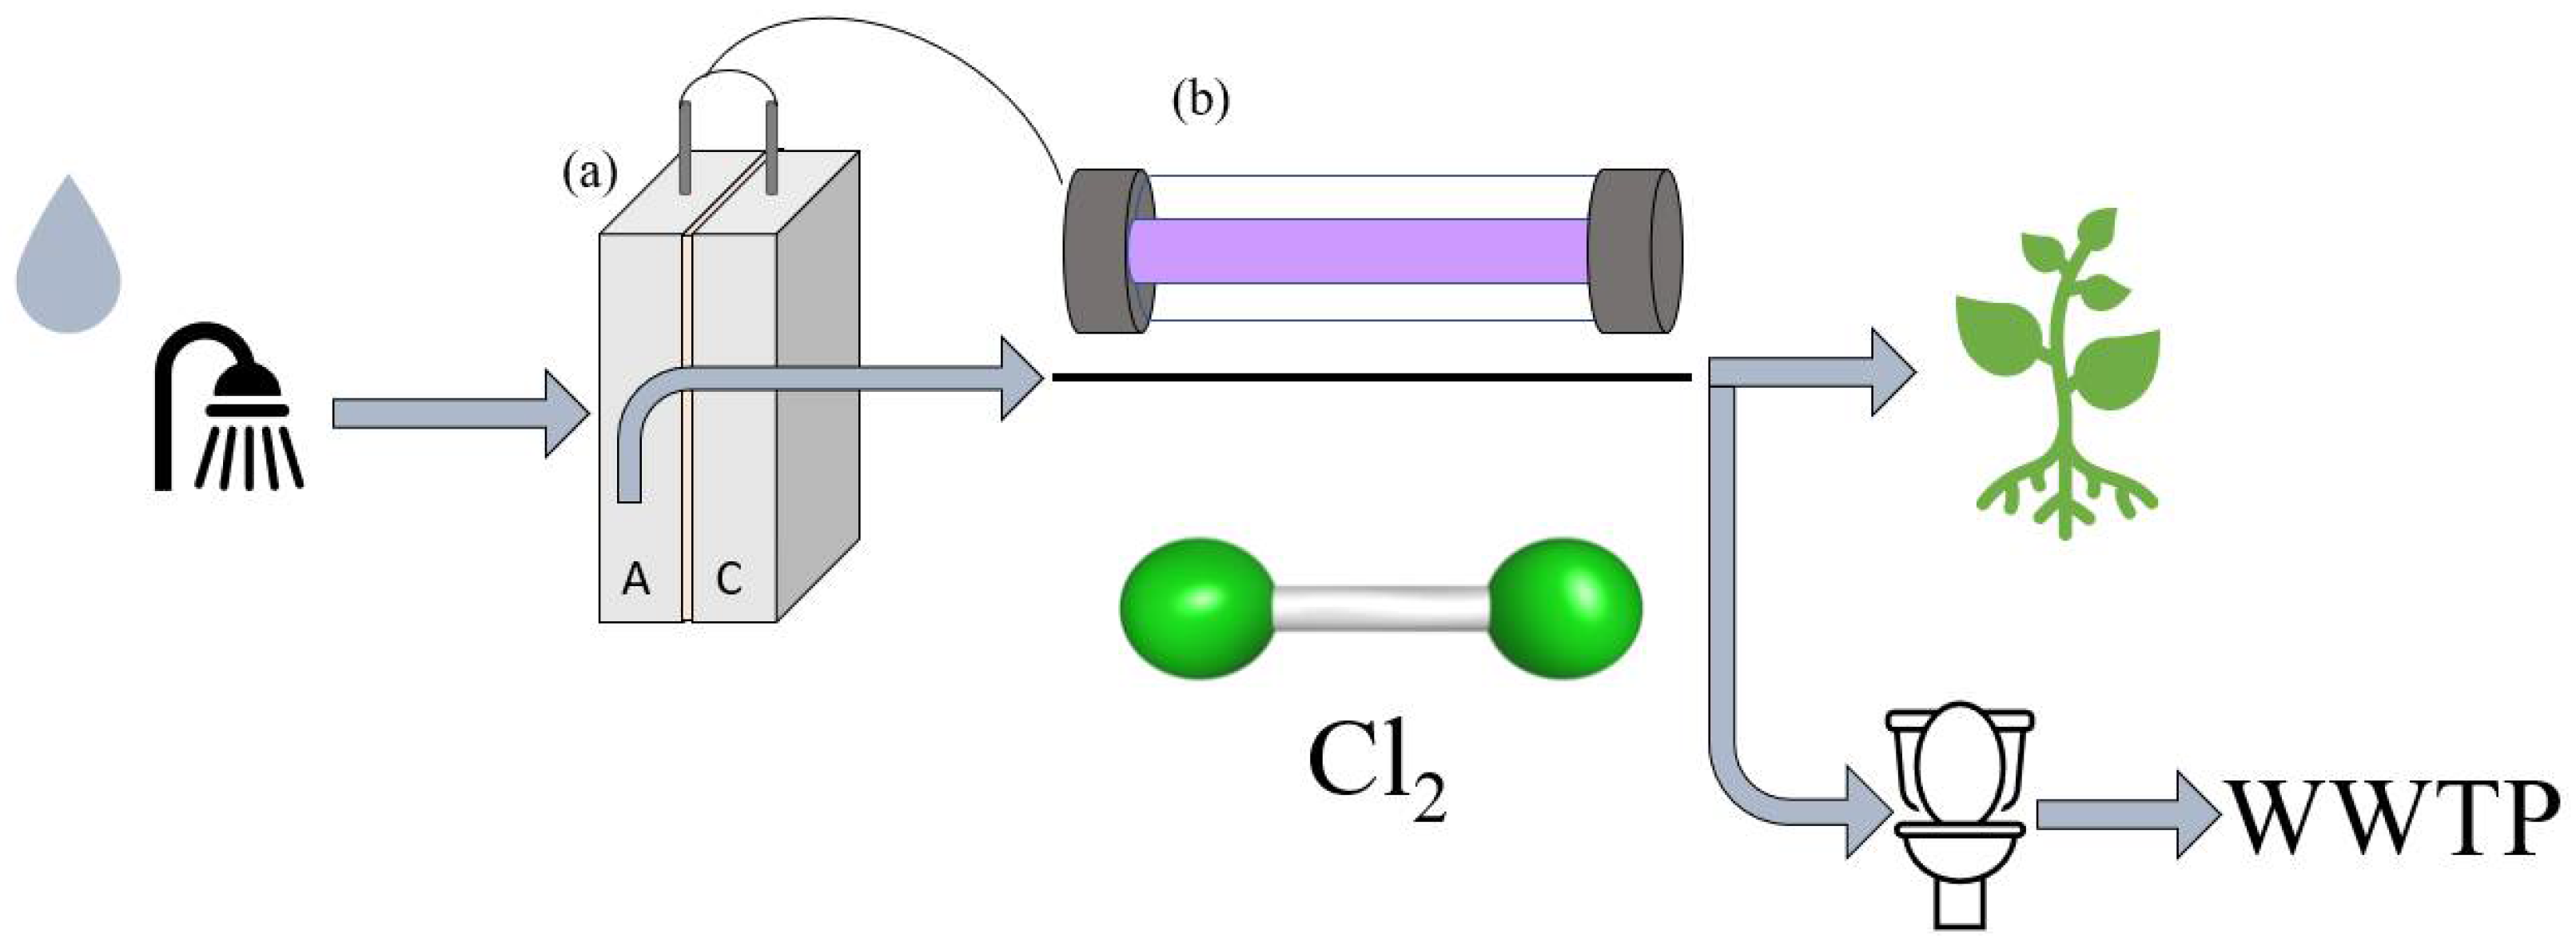
As shown in Section 3, MFC technology can remove a large fraction (>85%) of the organic matter in GW. However, this might not be sufficient to ensure compliance of current regulations for reuse, which usually require strict limits on coliform counts present in the treated effluents, even for non-potable-reuses such as toilet flushing [18,56]; this issue is shared with most conventional greywater treatment technologies [57]. MFC treatment should therefore be complemented by a disinfection stage to ensure sufficient pathogen reduction in effluents, as shown in Figure 6, although preliminary evidence suggests some disinfection capability by MFCs [58], an issue which deserves further experimental investigation. In addition, several greywater reuse regulations, including the U.S.A. [59], Canadian [60], Chinese [61,62], Japanese [63], and South Korean [64] regulations, require the presence of a chlorine residual in treated greywater intended for non-potable water reuse. Addition of chlorine-based disinfectants would then remove the presence of residual pathogens and ensure the necessary chlorine residual. Other regulations, such as the German [65], Italian [66], and Israeli [67], and World Health Organization guidelines [68], do not require the presence of chlorine residuals in the treated effluent to allow non-potable reuse. In these cases, an effective disinfection treatment could consist of UV disinfection: a stack of MFCs could partly sustain the energy requirement of a UV lamp system [69], allowing sustainable GW treatment. The development of LED UV lamps, with greater energy efficiency compared to traditional UV lamps, could improve the efficiency of similar setups. MFC/UV effluents water could then be safely used for many reuse applications. Batlle-Vilanova et al. [70] reported the simultaneous production of anodic methane and cathodic chlorine, which could be used as a disinfection agent; in the future, this may lead to a comprehensive GW treatment based solely on BESs.
Bioelectrochemical reactions associated with power production (and related redox potential) were reported as the driving force behind the inactivation of different pathogens (Salmonella enterica, Pseudomonas aeruginosa, Staphylococcus aureus) present in urine in a cascade system of MFC anodes connected in series [71,72]; a similar system succeeded in the removal of hepatitis B virus surface HBsAg and core HBcAg antigens, showing to reduce the possibility of environmental transmission of hepatitis B [73]. Connection in series of multiple BES units, proposed as an alternative to dimensional upscaling [74,75], may allow complete removal of pathogens, organic matter and nutrients, ensuring the safe reuse of greywater. Further research is necessary on this issue. Besides organic matter, GW contains a variety of other contaminants: fragrances, surfactants, emulsifiers, preservatives and antioxidants, softeners and plasticizers, UV filters, and solvents, other than estrogens and personal care products [7,76]. BESs have a proven capability to remove a wide variety of pharmaceutically active compounds and antibiotics [77,78], but their effectiveness on these pollutants has still to be proved in GW treatment schemes. Cross-circuit MFCs ought to be investigated to exploit both the anodic and cathodic redox environment. It was observed that surfactant addition led to an increase in MFC energy production in the treatment of bilge water, with no detrimental effects on electrochemically active microorganisms’ activity [79]; a similar result was obtained for the removal of PCB in contaminated soil using sediment MFCs [80]: in both cases, the increase in energy production was attributed to increases in the solubilization and bioavailability of the target compounds due to the surfactants’ effect. The addition of the non-ionic surfactant Tween 80 to BESs showed contrasting results: addition to MFC’s anode led to power production improvement due to the increase in cell membranes permeability, which in turn reduced electron transfer resistance [81]. No impact was shown on the cathodic activity of microbial electrolysis cells (MEC) at concentrations in the 5–20 mg L−1 range; decrease in current density was observed at a concentration of 80 mg L−1 [82]. The literature suggests that surfactants can be successfully removed using BESs, and that their addition may stimulate the removal of inorganic and organic compounds; however, they may exert toxicity effects negatively affecting biological and electrochemical performances [83,84]. Observations on conventional biological processes showed detrimental effects of anionic surfactants (2 mg L−1) on organic matter and nitrogen removal, possibly due to their interference with oxygen transfer [85]. Reports of negative effects on MFCs’ anodic microbiota at increasing sodium dodecyl sulfate (SDS, widely used in soaps) concentrations from 10 to 50 mg L−1, leading to decrease in power production have also been published [86]; however, Chakraborty et al. reported 76.1% SDS removal in the anode of an MFC spiked with 10.21 mg SDS L−1, simultaneously with 88% COD removal and steady power production [87]. Therefore, surfactant removal should be further explored, to ensure efficient process performance and foam-less, reusable treated water.
5. Conclusions
In this study, maximum power density of 0.46 mW L−1, coupled with 85% COD removal were achieved through GW treatment by MFCs. Low GW conductivity, similar to that observed with other anolytes, limited energy production due to increased cell overpotentials (20% vs. 10% when compared with high conductivity) as revealed by the in-depth analysis of the energy losses; COD removal (and hence reuse possibilities) was not affected by the electrolytes’ conductivity.
Results from this study suggest the feasibility of achieving satisfactory GW treatment with MFCs as a step leading to subsequent reuse, given the observed quality parameters of the effluent, in line with those expected from conventional wastewater treatment. Source-separated GW could then become an on-site, readily reusable resource, without the need for energy-intensive long-range transport to distant wastewater treatment facilities. As in any other resource reuse situation, the type of reuse would be subject to local regulations and other quality limitations, which would equally affect any type of used water treatment train. Low GW conductivity may limit bioelectrochemical energy production; however, considering that between 60% and 75% of domestic wastewater is represented by GW, segregated stream systems could contribute to safe sustainable local reuse, avoiding wastewater over-dilution that impacts negatively on water cycle energy demand, and on the generalized adoption of sustainable water management paradigms.
Supplementary Materials
The following are available online at https://www.mdpi.com/2073-4441/13/3/295/s1: Figure S1: Current density trends recorded in the study. Figure S2: Power density trends recorded in the study. Table S1: Data for Figure 1. Lists of components in the shampoo and soap used for the preparation of the simulated greywater.
Author Contributions
Conceptualization, D.C.; methodology, D.C. and S.B.; investigation, D.C., S.B., and L.P.; writing—original draft preparation, D.C.; writing—review and editing, A.C. and A.G.C.; supervision, A.C. and A.G.C.; resources, A.C., A.G.C., and D.C. All authors have read and agreed to the published version of the manuscript.
Funding
This research received no external funding.
Institutional Review Board Statement
Not applicable.
Informed Consent Statement
Not applicable.
Acknowledgments
Silvia Bolognesi is a doctoral PhD candidate at the University of Pavia, subsequently admitted to a Double Doctorate program at the University of Girona. The study described here was carried out at the University of Pavia. The authors wish to thank the anonymous reviewers for their valuable comments, that greatly helped in improving the quality of the final manuscript.
Conflicts of Interest
The authors declare no conflict of interest.
References
- Capodaglio, A.G. Integrated, decentralized wastewater management for resource recovery in rural and peri-urban areas. Resources 2017, 6, 22. [Google Scholar] [CrossRef] [Green Version]
- Malila, R.; Lehtoranta, S.; Viskari, E.L. The role of source separation in nutrient recovery—Comparison of alternative wastewater treatment systems. J. Clean. Prod. 2019, 219, 350–358. [Google Scholar] [CrossRef]
- Cecconet, D.; Callegari, A.; Hlavínek, P.; Capodaglio, A.G. Membrane bioreactors for sustainable, fit-for-purpose greywater treatment: A critical review. Clean Technol. Environ. Policy 2019, 21, 745–762. [Google Scholar] [CrossRef]
- Tian, H.; Xu, R.; Canadell, J.G.; Thompson, R.L.; Winiwarter, W.; Suntharalingam, P.; Davidson, E.A.; Ciais, P.; Jackson, R.B.; Janssens-Maenhout, G.; et al. A comprehensive quantification of global nitrous oxide sources and sinks. Nature 2020, 586, 248–256. [Google Scholar] [CrossRef] [PubMed]
- Sabba, F.; Terada, A.; Wells, G.; Smets, B.F.; Nerenberg, R. Nitrous oxide emissions from biofilm processes for wastewater treatment. Appl. Microbiol. Biotechnol. 2018, 102, 9815–9829. [Google Scholar] [CrossRef] [Green Version]
- Sabba, F.; Picioreanu, C.; Boltz, J.P.; Nerenberg, R. Predicting N2O emissions from nitrifying and denitrifying biofilms: A modeling study. Water Sci. Technol. 2017, 75, 530–538. [Google Scholar] [CrossRef]
- Eriksson, E.; Auffarth, K.; Eilersen, A.M.; Henze, M.; Ledin, A. Household chemicals and personal care products as sources for xenobiotic organic compounds in grey wastewater. Water SA 2003, 29, 135–146. [Google Scholar] [CrossRef] [Green Version]
- Friedler, E.; Hadari, M. Economic feasibility of on-site greywater reuse in multi-storey buildings. Desalination 2006, 190, 221–234. [Google Scholar] [CrossRef]
- Shaikh, I.N.; Ahammed, M.M. Quantity and quality characteristics of greywater: A review. J. Environ. Manag. 2020, 261, 110266. [Google Scholar] [CrossRef]
- Jefferson, B.; Laine, A.; Parsons, S.; Stephenson, T.; Judd, S. Technologies for domestic wastewater recycling. Urban Water 2000, 1, 285–292. [Google Scholar] [CrossRef]
- De Gisi, S.; Casella, P.; Notarnicola, M.; Farina, R. Grey water in buildings: A mini-review of guidelines, technologies and case studies. Civ. Eng. Environ. Syst. 2015, 33, 35–54. [Google Scholar] [CrossRef]
- Atanasova, N.; Dalmau, M.; Comas, J.; Poch, M.; Rodriguez-Roda, I.; Buttiglieri, G. Optimized MBR for greywater reuse systems in hotel facilities. J. Environ. Manag. 2017, 193, 503–511. [Google Scholar] [CrossRef]
- Wu, B. Membrane-based technology in greywater reclamation: A review. Sci. Total Environ. 2019, 656, 184–200. [Google Scholar] [CrossRef]
- Leal, L.H.; Temmink, H.; Zeeman, G.; Cees, C.J. Comparison of three systems for biological greywater treatment. Water 2010, 2, 155–169. [Google Scholar] [CrossRef]
- Arden, S.; Ma, X. Constructed wetlands for greywater recycle and reuse: A review. Sci. Total Environ. 2018, 630, 587–599. [Google Scholar] [CrossRef]
- Bolton, C.R.; Randall, D.G. Development of an integrated wetland microbial fuel cell and sand filtration system for greywater treatment. J. Environ. Chem. Eng. 2019, 7, 103249. [Google Scholar] [CrossRef]
- Cecconet, D.; Omodeo Salè, E.; Callegari, A.; Capodaglio, A.G. Wastewater treatment with a new electrically enhanced biomass concentrator reactor: Trial application and technological perspectives. Environ. Technol. (UK) 2019, 40, 896–902. [Google Scholar] [CrossRef]
- Vuppaladadiyam, A.K.; Merayo, N.; Prinsen, P.; Luque, R.; Blanco, A.; Zhao, M. A review on greywater reuse: Quality, risks, barriers and global scenarios. Rev. Environ. Sci. Biotechnol. 2019, 18, 77–99. [Google Scholar] [CrossRef]
- Meda, A.; Henkel, J.; Chang, Y.; Cornel, P. Comparison of processes for greywater treatment for urban water reuse: Energy consumption and footprint. In Water-Energy Interactions in Water Reuse; Lazarova, V., Choo, K.-H., Cornel, P., Eds.; IWA Publishing: London, UK, 2012; pp. 203–211. ISBN1 978-1-84339-541-6. ISBN2 978-1-78040-066-2. [Google Scholar]
- Matos, C.; Pereira, S.; Amorim, E.V.; Bentes, I.; Briga-Sá, A. Wastewater and greywater reuse on irrigation in centralized and decentralized systems—An integrated approach on water quality, energy consumption and CO2 emissions. Sci. Total Environ. 2014, 493, 463–471. [Google Scholar] [CrossRef]
- Longo, S.; d’Antoni, B.M.; Bongards, M.; Chaparro, A.; Cronrath, A.; Fatone, F.; Lema, J.M.; Mauricio-Iglesias, M.; Soares, A.; Hospido, A. Monitoring and diagnosis of energy consumption in wastewater treatment plants. A state of the art and proposals for improvement. Appl. Energy 2016, 179, 1251–1268. [Google Scholar] [CrossRef]
- Osset-Álvarez, M.; Rovira-Alsina, L.; Pous, N.; Blasco-Gómez, R.; Colprim, J.; Balaguer, M.D.; Puig, S. Niches for bioelectrochemical systems on the recovery of water, carbon and nitrogen in wastewater treatment plants. Biomass Bioenergy 2019, 130, 105380. [Google Scholar] [CrossRef]
- Sharma, M.; Nandy, A.; Taylor, N.; Venkatesan, S.V.; Ozhukil Kollath, V.; Karan, K.; Thangadurai, V.; Tsesmetzis, N.; Gieg, L.M. Bioelectrochemical remediation of phenanthrene in a microbial fuel cell using an anaerobic consortium enriched from a hydrocarbon-contaminated site. J. Hazard. Mater. 2020, 389, 121845. [Google Scholar] [CrossRef]
- Cecconet, D.; Sabba, F.; Devecseri, M.; Callegari, A.; Capodaglio, A.G. In situ groundwater remediation with bioelectrochemical systems: A critical review and future perspectives. Environ. Int. 2020, 137, 105550. [Google Scholar] [CrossRef]
- Wang, H.; Ren, Z.J. A comprehensive review of microbial electrochemical systems as a platform technology. Biotechnol. Adv. 2013, 31, 1796–1807. [Google Scholar] [CrossRef] [PubMed]
- Slate, A.J.; Whitehead, K.A.; Brownson, D.A.C.; Banks, C.E. Microbial fuel cells: An overview of current technology. Renew. Sustain. Energy Rev. 2019, 101, 60–81. [Google Scholar] [CrossRef]
- Jain, A.; He, Z. Cathode-enhanced wastewater treatment in bioelectrochemical systems. NPJ Clean Water 2018, 1, 23. [Google Scholar] [CrossRef]
- Rosenbaum, M.; Aulenta, F.; Villano, M.; Angenent, L.T. Cathodes as electron donors for microbial metabolism: Which extracellular electron transfer mechanisms are involved? Bioresour. Technol. 2011, 102, 324–333. [Google Scholar] [CrossRef]
- Pandey, P.; Shinde, V.N.; Deopurkar, R.L.; Kale, S.P.; Patil, S.A.; Pant, D. Recent advances in the use of different substrates in microbial fuel cells toward wastewater treatment and simultaneous energy recovery. Appl. Energy 2016, 168, 706–723. [Google Scholar] [CrossRef]
- Pant, D.; Van Bogaert, G.; Diels, L.; Vanbroekhoven, K. A review of the substrates used in microbial fuel cells (MFCs) for sustainable energy production. Bioresour. Technol. 2010, 101, 1533–1543. [Google Scholar] [CrossRef]
- Sindhuja, M.; Harinipriya, S.; Bala, A.C.; Ray, A.K. Environmentally available biowastes as substrate in microbial fuel cell for efficient chromium reduction. J. Hazard. Mater. 2018, 355, 197–205. [Google Scholar] [CrossRef]
- Molognoni, D.; Chiarolla, S.; Cecconet, D.; Callegari, A.; Capodaglio, A.G. Industrial wastewater treatment with a bioelectrochemical process: Assessment of depuration efficiency and energy production. Water Sci. Technol. 2018, 77, 134–144. [Google Scholar] [CrossRef] [PubMed]
- Molognoni, D.; Puig, S.; Balaguer, M.D.; Capodaglio, A.G.; Callegari, A.; Colprim, J. Multiparametric control for enhanced biofilm selection in microbial fuel cells. J. Chem. Technol. Biotechnol. 2016, 91, 1720–1727. [Google Scholar] [CrossRef]
- Pinto, R.P.; Srinivasan, B.; Manuel, M.-F.; Tartakovsky, B. A two-population bio-electrochemical model of a microbial fuel cell. Bioresour. Technol. 2010, 101, 5256–5265. [Google Scholar] [CrossRef] [Green Version]
- Capodaglio, A.G.; Callegari, A.; Cecconet, D.; Molognoni, D. Sustainability of decentralized wastewater treatment technologies. Water Pract. Technol. 2017, 12, 463–477. [Google Scholar] [CrossRef]
- Oh, K.S.; Leong, J.Y.C.; Poh, P.E.; Chong, M.N.; Lau, E. Von A review of greywater recycling related issues: Challenges and future prospects in Malaysia. J. Clean. Prod. 2018, 171, 17–29. [Google Scholar] [CrossRef]
- Ghaitidak, D.M.; Yadav, K.D. Characteristics and treatment of greywater—A review. Environ. Sci. Pollut. Res. 2013, 20, 2795–2809. [Google Scholar] [CrossRef]
- Eriksson, E.; Andersen, H.R.; Madsen, T.S.; Ledin, A. Greywater pollution variability and loadings. Ecol. Eng. 2009, 35, 661–669. [Google Scholar] [CrossRef]
- Karthikeyan, R.; Selvam, A.; Cheng, K.Y.; Wong, J.W.C. Influence of ionic conductivity in bioelectricity production from saline domestic sewage sludge in microbial fuel cells. Bioresour. Technol. 2016, 200, 845–852. [Google Scholar] [CrossRef] [PubMed]
- Vologni, V.; Kakarla, R.; Angelidaki, I.; Min, B. Increased power generation from primary sludge by a submersible microbial fuel cell and optimum operational conditions. Bioprocess Biosyst. Eng. 2013, 36, 635–642. [Google Scholar] [CrossRef] [PubMed]
- Puig, S.; Coma, M.; Desloover, J.; Boon, N.; Colprim, J.; Balaguer, M.D. Autotrophic denitrification in microbial fuel cells treating low ionic strength waters. Environ. Sci. Technol. 2012, 46, 2309–2315. [Google Scholar] [CrossRef] [PubMed]
- Jefferson, B.; Burgess, J.E.; Pichon, A.; Harkness, J.; Judd, S.J. Nutrient addition to enhance biological treatment of greywater. Water Res. 2001, 35, 2702–2710. [Google Scholar] [CrossRef]
- Ge, Z.; Li, J.; Xiao, L.; Tong, Y.; He, Z. Recovery of Electrical Energy in Microbial Fuel Cells. Environ. Sci. Technol. Lett. 2014, 1, 137–141. [Google Scholar] [CrossRef]
- Logan, B.E.; Hamelers, B.; Rozendal, R.A.; Schröder, U.; Keller, J.; Freguia, S.; Aelterman, P.; Verstraete, W.; Rabaey, K. Microbial Fuel Cells: Methodology and Technology. Environ. Sci. Technol. 2006, 40, 5181–5192. [Google Scholar] [CrossRef] [PubMed]
- Rossi, R.; Pant, D.; Logan, B.E. Chronoamperometry and linear sweep voltammetry reveals the adverse impact of high carbonate buffer concentrations on anode performance in microbial fuel cells. J. Power Sources 2020, 476, 228715. [Google Scholar] [CrossRef]
- Sleutels, T.H.J.A.; Hamelers, H.V.M.; Rozendal, R.A.; Buisman, C.J.N. Ion transport resistance in Microbial Electrolysis Cells with anion and cation exchange membranes. Int. J. Hydrogen Energy 2009, 34, 3612–3620. [Google Scholar] [CrossRef]
- Lefebvre, O.; Tan, Z.; Kharkwal, S.; Ng, H.Y. Effect of increasing anodic NaCl concentration on microbial fuel cell performance. Bioresour. Technol. 2012, 112, 336–340. [Google Scholar] [CrossRef] [PubMed]
- Torres, C.I.; Lee, H.S.; Rittmann, B.E. Carbonate species as OH- carriers for decreasing the pH gradient between cathode and anode in biological fuel cells. Environ. Sci. Technol. 2008, 42, 8773–8777. [Google Scholar] [CrossRef]
- Długołecki, P.; Ogonowski, P.; Metz, S.J.; Saakes, M.; Nijmeijer, K.; Wessling, M. On the resistances of membrane, diffusion boundary layer and double layer in ion exchange membrane transport. J. Memb. Sci. 2010, 349, 369–379. [Google Scholar] [CrossRef]
- Ji, E.; Moon, H.; Piao, J.; Ha, P.T.; An, J.; Kim, D.; Woo, J.J.; Lee, Y.; Moon, S.H.; Rittmann, B.E.; et al. Interface resistances of anion exchange membranes in microbial fuel cells with low ionic strength. Biosens. Bioelectron. 2011, 26, 3266–3271. [Google Scholar] [CrossRef]
- Harnisch, F.; Schröder, U.; Scholz, F. The suitability of monopolar and bipolar ion exchange membranes as separators for biological fuel cells. Environ. Sci. Technol. 2008, 42, 1740–1746. [Google Scholar] [CrossRef]
- Liu, H.; Cheng, S.; Logan, B.E. Production of Electricity from Acetate or Butyrate Using a Single-Chamber Microbial Fuel Cell. Environ. Sci. Technol. 2005, 39, 658–662. [Google Scholar] [CrossRef]
- Srikanth, S.; Venkata Mohan, S. Change in electrogenic activity of the microbial fuel cell (MFC) with the function of biocathode microenvironment as terminal electron accepting condition: Influence on overpotentials and bio-electro kinetics. Bioresour. Technol. 2012, 119, 241–251. [Google Scholar] [CrossRef] [PubMed]
- Ter Heijne, A.; Strik, D.P.B.T.B.; Hamelers, H.V.M.; Buisman, C.J.N. Cathode potential and mass transfer determine performance of oxygen reducing biocathodes in microbial fuel cells. Environ. Sci. Technol. 2010, 44, 7151–7156. [Google Scholar] [CrossRef] [PubMed]
- Xiao, L.; Ge, Z.; Kelly, P.; Zhang, F.; He, Z. Evaluation of normalized energy recovery (NER) in microbial fuel cells affected by reactor dimensions and substrates. Bioresour. Technol. 2014, 157, 77–83. [Google Scholar] [CrossRef] [PubMed]
- Yoonus, H.; Al-Ghamdi, S.G. Environmental performance of building integrated grey water reuse systems based on Life-Cycle Assessment: A systematic and bibliographic analysis. Sci. Total Environ. 2020, 712, 136535. [Google Scholar] [CrossRef] [PubMed]
- Oteng-Peprah, M.; Acheampong, M.A.; deVries, N.K. Greywater Characteristics, Treatment Systems, Reuse Strategies and User Perception—A Review. Water. Air. Soil Pollut. 2018, 229. [Google Scholar] [CrossRef] [PubMed] [Green Version]
- Vasieva, O.; Sorokin, A.; Szydlowski, L.; Goryanin, I. Do Microbial Fuel Cells have Antipathogenic Properties? J. Comput. Sci. Syst. Biol. 2019, 12, 57–70. [Google Scholar] [CrossRef]
- USEPA 2012 Guidelines for Water Reuse; United States Environmental Protection Agency: Washington, DC, USA, 2012.
- Health Canada. Canadian Guidelines for Domestic Reclaimed Water for Use in Toilet and Urinal Flushing; Health Canada: Ottawa, ON, Canada, 2010. [Google Scholar]
- Li, F.; Wichmann, K.; Otterpohl, R. Evaluation of appropriate technologies for grey water treatments and reuses. Water Sci. Technol. 2009, 59, 249–260. [Google Scholar] [CrossRef]
- Zhu, Z.; Dou, J. Current status of reclaimed water in China: An overview. J. Water Reuse Desalin. 2018, 8, 293–307. [Google Scholar] [CrossRef] [Green Version]
- Maeda, M.; Nakada, K.; Kawamoto, K.; Ikeda, M. Area-wide use of reclaimed water in Tokyo, Japan. Water Sci. Technol. 1996, 33, 51–57. [Google Scholar] [CrossRef]
- Jong, J.; Lee, J.; Kim, J.; Hyun, K.; Hwang, T.; Park, J.; Choung, Y. The study of pathogenic microbial communities in graywater using membrane bioreactor. Desalination 2010, 250, 568–572. [Google Scholar] [CrossRef]
- Nolde, E. Greywater reuse systems for toilet flushing in multi-storey buildings. Urban Water 1999, 1, 275–284. [Google Scholar] [CrossRef]
- Fountoulakis, M.S.; Markakis, N.; Petousi, I.; Manios, T. Single house on-site grey water treatment using a submerged membrane bioreactor for toilet flushing. Sci. Total Environ. 2016, 551–552, 706–711. [Google Scholar] [CrossRef] [PubMed]
- Pidou, M.; Memon, F.A.; Stephenson, T.; Jefferson, B.; Jeffrey, P. Greywater recycling: Treatment options and applications. Proc. Inst. Civ. Eng. Eng. Sustain. 2007, 160, 119–131. [Google Scholar] [CrossRef] [Green Version]
- World Health Organization; United Nations Environment Program. WHO Guidelines for the Safety Use of Wastewater, Excreta and Greywater; World Health Organization: Geneva (CH), Switzerland, 2006. [Google Scholar]
- Ieropoulos, I.A.; Stinchcombe, A.; Gajda, I.; Forbes, S.; Merino-Jimenez, I.; Pasternak, G.; Sanchez-Herranz, D.; Greenman, J. Pee power urinal-microbial fuel cell technology field trials in the context of sanitation. Environ. Sci. Water Res. Technol. 2016, 2, 336–343. [Google Scholar] [CrossRef] [Green Version]
- Batlle-Vilanova, P.; Rovira-Alsina, L.; Puig, S.; Balaguer, M.D.; Icaran, P.; Monsalvo, V.M.; Rogalla, F.; Colprim, J. Biogas upgrading, CO2 valorisation and economic revaluation of bioelectrochemical systems through anodic chlorine production in the framework of wastewater treatment plants. Sci. Total Environ. 2019, 690, 352–360. [Google Scholar] [CrossRef]
- Ieropoulos, I.; Pasternak, G.; Greenman, J. Urine disinfection and in situ pathogen killing using a Microbial Fuel Cell cascade system. PLoS ONE 2017, 12, e176475. [Google Scholar] [CrossRef] [PubMed] [Green Version]
- Ieropoulos, I.; Obata, O.; Pasternak, G.; Greenman, J. Fate of three bioluminescent pathogenic bacteria fed through a cascade of urine microbial fuel cells. J. Ind. Microbiol. Biotechnol. 2019, 46, 587–599. [Google Scholar] [CrossRef] [Green Version]
- Pasternak, G.; Greenman, J.; Ieropoulos, I. Removal of Hepatitis B virus surface HBsAg and core HBcAg antigens using microbial fuel cells producing electricity from human urine. Sci. Rep. 2019, 9, 1–8. [Google Scholar] [CrossRef] [Green Version]
- Cecconet, D.; Bolognesi, S.; Callegari, A.; Capodaglio, A.G. Controlled sequential biocathodic denitrification for contaminated groundwater bioremediation. Sci. Total Environ. 2019, 651, 3107–3116. [Google Scholar] [CrossRef]
- Greenman, J.; Ieropoulos, I.A. Allometric scaling of microbial fuel cells and stacks: The lifeform case for scale-up. J. Power Sources 2017, 356, 365–370. [Google Scholar] [CrossRef]
- Eriksson, E.; Auffarth, K.; Henze, M.; Ledin, A. Characteristics of grey wastewater. Urban Water 2002, 4, 85–104. [Google Scholar] [CrossRef]
- Cecconet, D.; Molognoni, D.; Callegari, A.; Capodaglio, A.G. Biological combination processes for efficient removal of pharmaceutically active compounds from wastewater: A review and future perspectives. J. Environ. Chem. Eng. 2017, 5, 3590–3603. [Google Scholar] [CrossRef]
- Yan, W.; Xiao, Y.; Yan, W.; Ding, R.; Wang, S.; Zhao, F. The effect of bioelectrochemical systems on antibiotics removal and antibiotic resistance genes: A review. Chem. Eng. J. 2019, 358, 1421–1437. [Google Scholar] [CrossRef]
- Hwang, J.H.; Kim, K.Y.; Resurreccion, E.P.; Lee, W.H. Surfactant addition to enhance bioavailability of bilge water in single chamber microbial fuel cells (MFCs). J. Hazard. Mater. 2019, 368, 732–738. [Google Scholar] [CrossRef]
- Xu, X.; Zhao, Q.L.; Wu, M.S. Improved biodegradation of total organic carbon and polychlorinated biphenyls for electricity generation by sediment microbial fuel cell and surfactant addition. RSC Adv. 2015, 5, 62534–62538. [Google Scholar] [CrossRef]
- Wen, Q.; Kong, F.; Ma, F.; Ren, Y.; Pan, Z. Improved performance of air-cathode microbial fuel cell through additional Tween 80. J. Power Sources 2011, 196, 899–904. [Google Scholar] [CrossRef]
- Ren, L.; Tokash, J.C.; Regan, J.M.; Logan, B.E. Current generation in microbial electrolysis cells with addition of amorphous ferric hydroxide, Tween 80, or DNA. Int. J. Hydrogen Energy 2012, 37, 16943–16950. [Google Scholar] [CrossRef]
- Cserháti, T.; Forgács, E.; Oros, G. Biological activity and environmental impact of anionic surfactants. Environ. Int. 2002, 28, 337–348. [Google Scholar] [CrossRef]
- Sathe, S.M.; Bhowmick, G.D.; Dubey, B.K.; Ghangrekar, M.M. Surfactant removal from wastewater using photo-cathode microbial fuel cell and laterite-based hybrid treatment system. Bioprocess Biosyst. Eng. 2020, 43, 2075–2084. [Google Scholar] [CrossRef]
- Callegari, A.; Capodaglio, A.G. Effects of selected industrial pollutants on urban WWTPs activated sludge population, and possible mitigation strategies. Water Pract. Technol. 2017, 12, 619–637. [Google Scholar] [CrossRef]
- Stein, N.E.; Hamelers, H.V.M.; van Straten, G.; Keesman, K.J. Effect of Toxic Components on Microbial Fuel Cell-Polarization Curves and Estimation of the Type of Toxic Inhibition. Biosensors 2012, 2, 255–268. [Google Scholar] [CrossRef] [PubMed] [Green Version]
- Chakraborty, I.; Khuman, C.; Bhowmick, G.; Ghangrekar, M. Upflow microbial fuel cell for removal of emerging contaminants from greywater with concomitant energy recovery. In Proceedings of the IWA Water and Development Ciongress & Exhibition, Colombo, Sri Lanka, 1–5 December 2019; International Water Association: Colombo, Sri Lanka, 2019. [Google Scholar]
Figure 1.
Scheme of the microbial fuel cell used in the experimentation. Air was supplied to the cathode using an air pump. Rext: external resistance.
Figure 1.
Scheme of the microbial fuel cell used in the experimentation. Air was supplied to the cathode using an air pump. Rext: external resistance.

Figure 2.
Chemical and physical parameters in greywater reported in the literature. Error bars represent the 25th and 75th percentiles. (A) Total nitrogen (TN), ammonia and nitrate nitrogen concentration; (B) Chemical oxygen demand (COD); (C) pH; (D) total phosphorus (TP); (E) conductivity. The list of the works consulted for the preparation of the figure is available in the Supplementary Materials.

Figure 3.
Voltage trend in the different tests. (A) GW, LC: greywater, low conductivity; (B) GW, HC: greywater, high conductivity; (C) Control: control test with acetate. Vertical black arrows represent the refresh of the MFC’s medium at the end of a batch prior to the following.
Figure 3.
Voltage trend in the different tests. (A) GW, LC: greywater, low conductivity; (B) GW, HC: greywater, high conductivity; (C) Control: control test with acetate. Vertical black arrows represent the refresh of the MFC’s medium at the end of a batch prior to the following.

Figure 4.
Polarization and power curves. GW, LC: greywater, low conductivity; GW, HC: greywater, high conductivity; acetate was used as anode feed in the control reactor.
Figure 4.
Polarization and power curves. GW, LC: greywater, low conductivity; GW, HC: greywater, high conductivity; acetate was used as anode feed in the control reactor.

Figure 5.
Energy losses in the different conditions. (A) distribution of the internal losses; (B) percentage of the internal losses. GW, LC: greywater, low conductivity; GW, HC: greywater, high conductivity; acetate was used as anode feed in the control reactor. Et: membrane transport losses; E∆pH: pH overpotential; ηan: anode overpotential; ηcat: cathode overpotential; Eion: ionic overpotential.

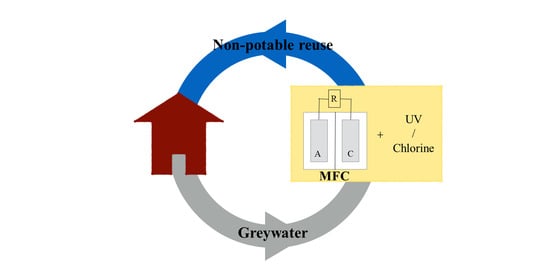
Figure 6.
Schematic of the proposed on-site treatment plant. (a) MFC reactor; (b) disinfection stage, with UV lamp or chlorination. The effluent can be used for toilet flushing or for urban food crop cultivation. WWTP: wastewater treatment plant.
Figure 6.
Schematic of the proposed on-site treatment plant. (a) MFC reactor; (b) disinfection stage, with UV lamp or chlorination. The effluent can be used for toilet flushing or for urban food crop cultivation. WWTP: wastewater treatment plant.


Table 1.
Characteristics of the synthetic microbial fuel cell (MFC) greywater (GW) influents. COD: chemical oxygen demand; TN: total nitrogen; TP: total phosphorus.
Table 1.
Characteristics of the synthetic microbial fuel cell (MFC) greywater (GW) influents. COD: chemical oxygen demand; TN: total nitrogen; TP: total phosphorus.
| COD | NO2−-N | NO3−-N | NH4+-N | TN | TP | pH | Conductivity | |
|---|---|---|---|---|---|---|---|---|
| mg L−1 | mg L−1 | mg L−1 | mg L−1 | mg L−1 | mg L−1 | - | μS cm−1 | |
| Greywater, low conductivity | 489 | 0.1 | 0 | 0 | 1.8 | 1.13 | 8.65 | 348 |
| Greywater, high conductivity | 489 | 0.1 | 0 | 0 | 1.8 | 1.13 | 8.65 | 1578 |
| Acetate solution | 500 | 0 | 0 | 5.8 | 5.8 | 309.64 | 8.21 | 2360 |
Table 2.
Maximum voltage measured, current density and power densities obtained from polarization curves, normalized energy recovery, and COD removal in the experimentation.
Table 2.
Maximum voltage measured, current density and power densities obtained from polarization curves, normalized energy recovery, and COD removal in the experimentation.
| Test | NERs kWh kgCODrem−1 | CDmax mA L−1 | PDmax mW L−1 | ηCOD % | Vmax mV |
|---|---|---|---|---|---|
| Greywater, low conductivity | 0.15 | 0.97 | 0.38 | 87% | 346 |
| Greywater, high conductivity | 0.21 | 1.13 | 0.46 | 85% | 409 |
| Control, acetate | 0.34 | 1.27 | 0.60 | 90% | 474 |
Publisher’s Note: MDPI stays neutral with regard to jurisdictional claims in published maps and institutional affiliations. |
© 2021 by the authors. Licensee MDPI, Basel, Switzerland. This article is an open access article distributed under the terms and conditions of the Creative Commons Attribution (CC BY) license (http://creativecommons.org/licenses/by/4.0/).
Share and Cite
MDPI and ACS Style
Cecconet, D.; Bolognesi, S.; Piacentini, L.; Callegari, A.; Capodaglio, A.G. Bioelectrochemical Greywater Treatment for Non-Potable Reuse and Energy Recovery. Water 2021, 13, 295. https://doi.org/10.3390/w13030295
AMA Style
Cecconet D, Bolognesi S, Piacentini L, Callegari A, Capodaglio AG. Bioelectrochemical Greywater Treatment for Non-Potable Reuse and Energy Recovery. Water. 2021; 13(3):295. https://doi.org/10.3390/w13030295
Chicago/Turabian StyleCecconet, Daniele, Silvia Bolognesi, Luca Piacentini, Arianna Callegari, and Andrea G. Capodaglio. 2021. "Bioelectrochemical Greywater Treatment for Non-Potable Reuse and Energy Recovery" Water 13, no. 3: 295. https://doi.org/10.3390/w13030295
Note that from the first issue of 2016, this journal uses article numbers instead of page numbers. See further details here.