
Modeling and Monitoring of Hydrodynamics and Surface Water Quality in the Sulejów Dam Reservoir, Poland


1
Faculty of Process and Environmental Engineering, Lodz University of Technology, Wólczańska 213 Str., 90-924 Lodz, Poland
2
Norwegian Institute for Water Research, Gaustadalléen 21 Str., 0349 Oslo, Norway
*
Author to whom correspondence should be addressed.
Water 2021, 13(3), 296; https://doi.org/10.3390/w13030296
Submission received: 14 December 2020
/
Revised: 13 January 2021
/
Accepted: 20 January 2021
/
Published: 26 January 2021
(This article belongs to the Section Hydraulics and Hydrodynamics)
Abstract
:The aim of this work is to evaluate core variables of the ecological potential of the Sulejów Reservoir (temperature distribution, flow velocities, and concentrations of selected indicators, e.g., phosphates, nitrates, the abundance of phytoplankton) using a three-dimensional hydrodynamic model, GEMSS-HDM (generalized environmental modeling system for surface waters), coupled with a water quality model, WASP EUTRO (GEMSS-WQM). The monitoring data necessary to build the model were obtained from two multiparameter probes that were submerged in two locations in the Sulejów Reservoir. An ADCP current profiler was used to collect data for hydrodynamic model calibration and verification. Total error between computed and measured velocity was estimated at 10–15%. A high concentration of chlorophyll-a during the vegetation season of 2015 (0.02 mg/L) was coupled with high water temperature (above 25 °C) and low concentrations of biogenic compounds (phosphorus and nitrogen at 0.02 and 0.001 mg/L, respectively). In 2015, NO3-N was the limiting nutrient in the Sulejów Reservoir. Maximum growth of algae was observed in June and July 2015 (0.02 mg/L chla) along the entire length of the reservoir; algae bloom volume reduction was observed in September (0.004 mg/L chla). Proposed scenarios for nutrient reduction—50% reduction of phosphate-phosphorus (PO4-P) and nitrate-nitrogen (NO3-N) from agriculture areas as well as 50% reduction of discharges from septic tanks—led to a considerable reduction of nutrient concentrations in the reservoir waters; it additionally favors reducing the concentration of chlorophyll-a. The obtained results indicate that these sources of pollutants are mainly responsible for the poor water quality status of the reservoir and more intensive eutrophication phenomena.
1. Introduction
Low water quality limits the possibility of its utilization for particular purposes, including the needs of industry, tourism, and supplying the population with water for consumption, which generates additional costs for entire sectors of the national economy [1,2,3].
The growing intensity of eutrophication and the specificity and dynamics of this process in various types of waters require the adoption of integrated actions to improve the status of the aquatic environment. Comprehensive analysis of the indicated issues requires a multidisciplinary approach, in which (besides the basic techniques of environmental engineering) modern methods of mathematical and computer techniques must be used [4,5,6,7,8]. Simulation and control of water quality require the use of advanced mathematical and numerical methods as well as high-performance computing [9,10,11].
The application of mathematical modeling techniques to water quality problems has proved to be a powerful instrument in water resource management. As a diagnostic tool, it permits the abstraction of highly complex real conditions [12,13,14,15]. As a predictive tool, mathematical modeling permits the forecasting and evaluation of the effects of changes in the surrounding environment on water quality. Although engineering insight and political and socioeconomic concerns play important roles in water resource management, some water quality problems are of such a highly complex nature that the predictive capability of mathematical models provides the only real means for screening the myriad number of management alternatives [16].
The accuracy of environmental assessment using models depends on the understanding of processes that occur in the environment and the appropriate choice of mathematical equations that describe them. On the other hand, it depends on available datasets, namely, results of the measurement of water quality indicators, on which the estimation of the parameters and coefficients of the model is based [17].
In the last four decades, significant efforts have been expended in developing mathematical models to predict the eutrophic status of natural and man-made water bodies as a function of nutrient inputs [18,19,20,21,22,23]. The objective of water quality modeling is to study the characteristics of both spatial and temporal distribution of water quality variables under different conditions and various external factors (e.g., light extinction in the water column, temperature) and the biochemical kinetics of nutrients [24,25,26,27,28,29,30].
In order to control algal blooms more effectively, hydrodynamics should be studied and correlated with nutrient dynamics and phytoplankton growth [31,32]. Hydrodynamic characteristics, such as residence time of water, surface circulation pattern, and turbulent mixing, have been reported as important features for maintaining the quality of surface water bodies [33,34,35,36,37,38].
Water quality models have made influential progress—from a single factor of water quality to multiple factors, from steady-state models to dynamic models, from point-source models to the coupling models of point and nonpoint sources, and from zero-dimensional models (input–output models that contain no information on hydrodynamics, only the assumption that the water body is well mixed) to one-dimensional models (1D steady-state models determining that water quality only occurs along the longitudinal profile of the watercourse, e.g., the Streeter–Phelps model, QUASAR, QUAL [4,8,39]), two-dimensional models (longitudinal–vertical models, e.g., CE-QUAL [8]) and three-dimensional models (which examine the spatial distribution of concentrations of simulated water-quality parameters and integrate modules for the simulation of hydrodynamics, water quality, and sediment processes, e.g., WASP, MIKE, GEMSS, DELFT [40,41,42,43]).
Several authors have studied the effect of discharge of nutrients in water bodies that cause eutrophication [44,45,46]. Voinov and Tonkikh [47] presented a model for eutrophication in macrophyte lakes that assumes that the nutrients are supplied only by detritus. The qualitative behavior of the growth of algae and macrophytes was discussed, and they considered the input of nutrients from either point or diffuse sources. Franke et al. [48] proposed a physical–biological coupled model for algal dynamics in lakes by considering the interactions of phytoplankton and zooplankton and their response to the physical environment. Edwards and Brindley [49] studied zooplankton mortality and the dynamical behavior of plankton populations by considering nutrients, phytoplankton, and zooplankton as variables. Chakraborty et al. [50] studied the dynamics of one and two phytoplankton populations by considering that nutrients are supplied by external sources. Nitrification in the water column and sediment of a lake and the adjoining river system has been studied by Paur and Auer [51]. Other ecological modeling studies involving phytoplankton, zooplankton, and nutrients have also been conducted [24,32,52]. In some of these studies, it was suggested that by controlling the influx of nutrients, the density of algae can be controlled, and, thus, the level of dissolved oxygen can be maintained; however, the mechanisms to control the influx rate were not discussed.
Among all water quality constituents, only nutrients can be controlled by human intervention on the system. For this reason, the control of biogenic substances is considered a method to monitor algal blooms and to improve the status of water quality [44]. From the point of view of the eutrophication process, the most important are nitrogen and phosphorus.
As with phosphorus, nitrogen discharges into natural water result from human activities as both human and animal wastes contain substantial amounts of nitrogen. In addition, nonpoint sources from both agricultural and urban land contribute to excess nitrogen. Because forms such as nitrate do not associate strongly with solid matter, they can be easily transmitted to surface waters along with groundwater flow [45,46].
Elements that cannot be ignored when determining the impact of abiotic factors on the growth of algae in the aquatic environment are currents and water level fluctuations. As a result of the mixing of water masses, permanent enrichment of aquatic ecosystems with gases and nutrients takes place. Water movement further contributes to the removal of the products of metabolic processes of periphyton. The intensity of photosynthetic activity and the respiration of phytoplankton, as well as the nutrient uptake rate and the reproduction of algae, will increase [53].
Plant production in surface waters is affected by light, temperature, nutrient content as well as the morphological, hydrodynamic, and hydrobiological properties of watercourses and reservoirs. Constant increment of nutrients in water primarily causes a massive expansion of phytoplankton (revealed by algae blooms, e.g., cyanobacteria or diatoms), leading finally to the secondary pollution of water with the remains of dead plants and to a significant deficit of dissolved oxygen. The current conditions in the Sulejów Reservoir limit the recreational use of the lake and have had a negative impact on the economy and tourism development of the region.
The Sulejów Reservoir is representative of a small lowland reservoir in Central Europe. It has been widely studied since it was first filled in 1973. Many authors have described its physical and chemical characteristics, flora and fauna, economic aspects, and environmental impact [54,55,56,57,58,59,60,61]. An important gap in the full picture of the environmental status of the Sulejow Reservoir is the lack of description of its hydrodynamics coupled with the water quality of this water body. In this present work, the modeling of the hydrodynamics of the Sulejów Reservoir is presented and coupled with the modeling of water quality constituents by using the GEMSS model. Additionally, scenarios for reducing pollutants entering the Sulejów Reservoir are proposed.
2. Study Area
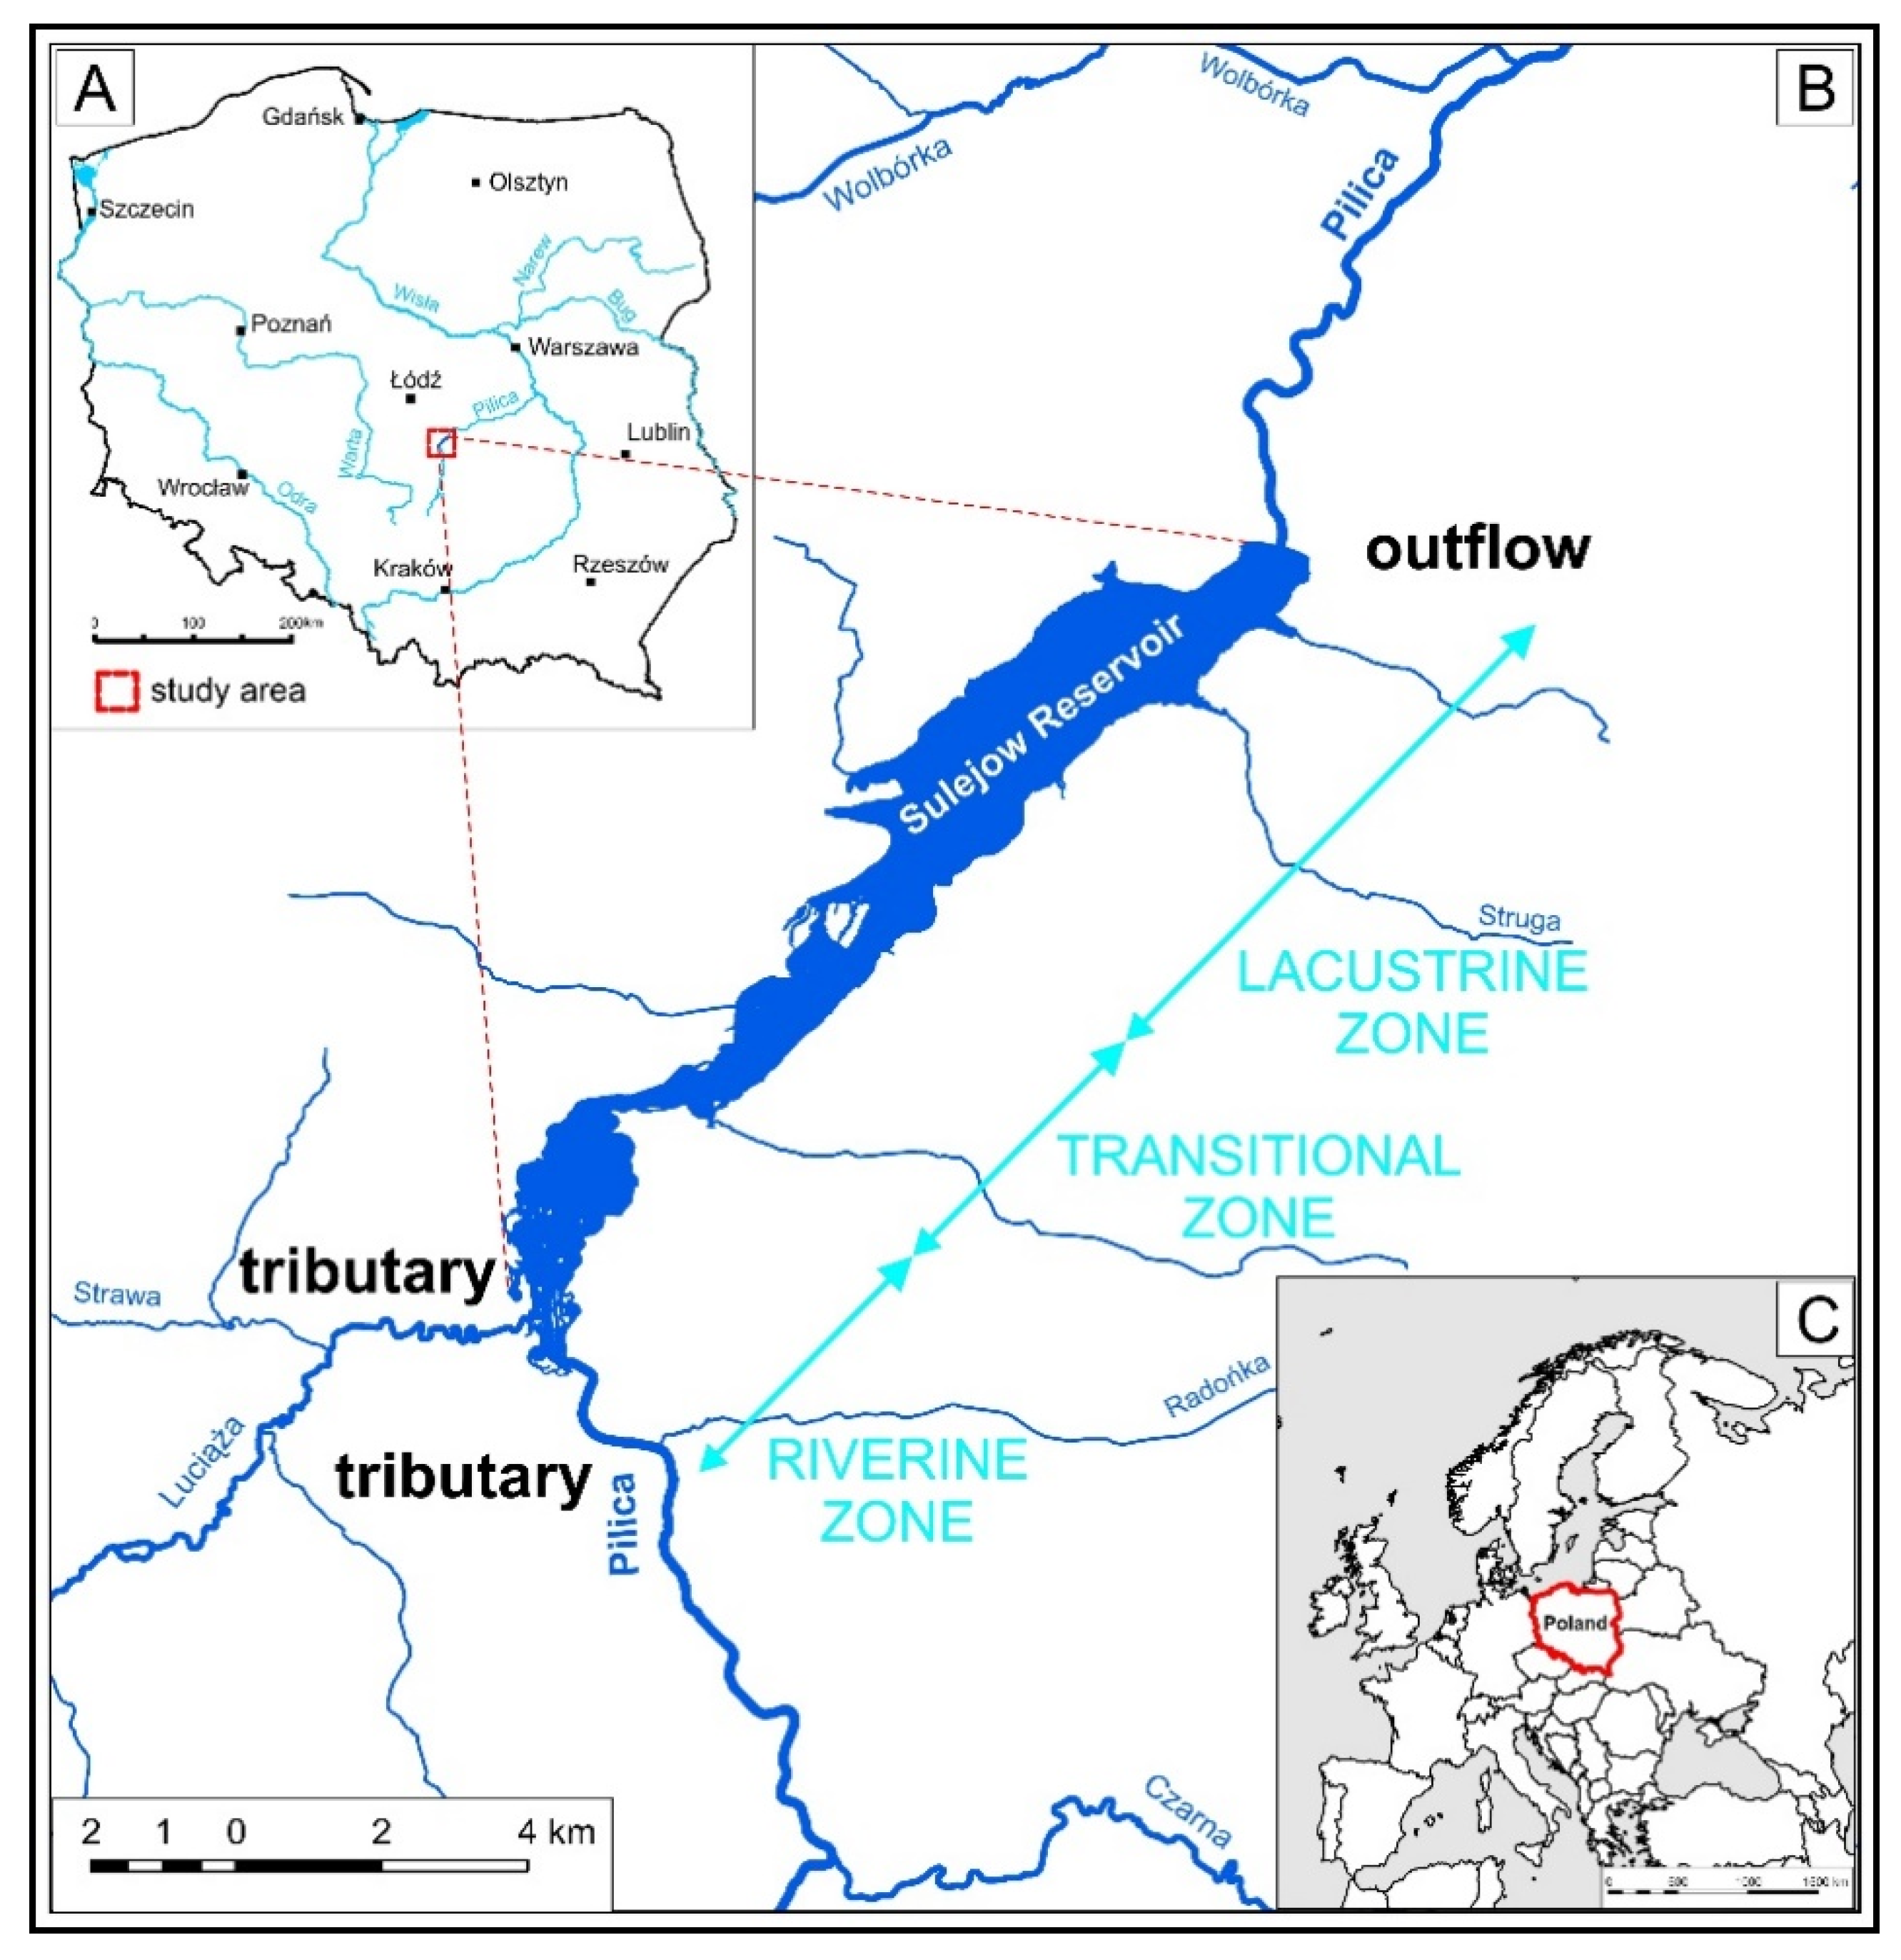
The Sulejów Reservoir was built by impounding the Pilica River at 138.9 km with a dam in the years 1969–1973. The Sulejów Reservoir, originally planned as a water supply resource for the city of Łódź (approx. 800,000 inhabitants), now serves mostly as a recreational area. The basic parameters on the characteristics of the Sulejów Reservoir are presented in Table 1.
The Sulejów Reservoir receives water from two main tributaries, Pilica and Luciąża, and several small streams that influence the hydrological balance of its area (Figure 1). The Pilica River is the eighth largest river in Poland, the longest left-bank tributary of the Vistula River. The river sources are in the town of Pilica, at an altitude of around 350 m a.s.l. in the eastern part of the Cracow-Czestochowa Upland. The catchment area of 9258 km² has a mostly natural character; however, the quality of water is impacted by both point and nonpoint sources of pollutants that have resulted from the agricultural use of over 60% of the basin [57]. The Luciąża River (length—48.7 km) is the longest left-bank tributary of the Pilica River. It flows into the Pilica River near Sulejów city at an altitude of 167.5 m a.s.l. The catchment area covers 760 km2. The flow of water in the Luciąża is in the range of 0.8 to 9.2 m3/s, with an average annual flow of 1.91 m3/s [57]. The results of studies on water quality in the reservoir confirm significant loading with biogenic compounds from both Pilica and Luciaza rivers [62,63,64,65].
3. Methods
The computations are done on a horizontal and vertical grid that represents the waterbody, bound by its water surface, shoreline, and bottom. The water surface elevations are computed simultaneously with the velocity components. The transport of water quality constituents is computed from the velocity components and elevations. Both hydrodynamic and water quality models in GEMSS are run simultaneously to preserve volume and mass balance. Included in the computations are boundary condition formulations for friction, wind shear, turbulence, inflow, outflow, surface heat exchange, and water quality kinetics. The hydrodynamic and transport relationships used in GEMSS are developed from horizontal momentum balance, continuity, constituent transport, and the equation of state. The theoretical basis of the three-dimensional model was first presented by Edinger and Buchak [66] and, subsequently, by Edinger and Buchak [67] under its previous name, GLLVHT. GEMSS has been peer-reviewed and published [66,67,68,69].
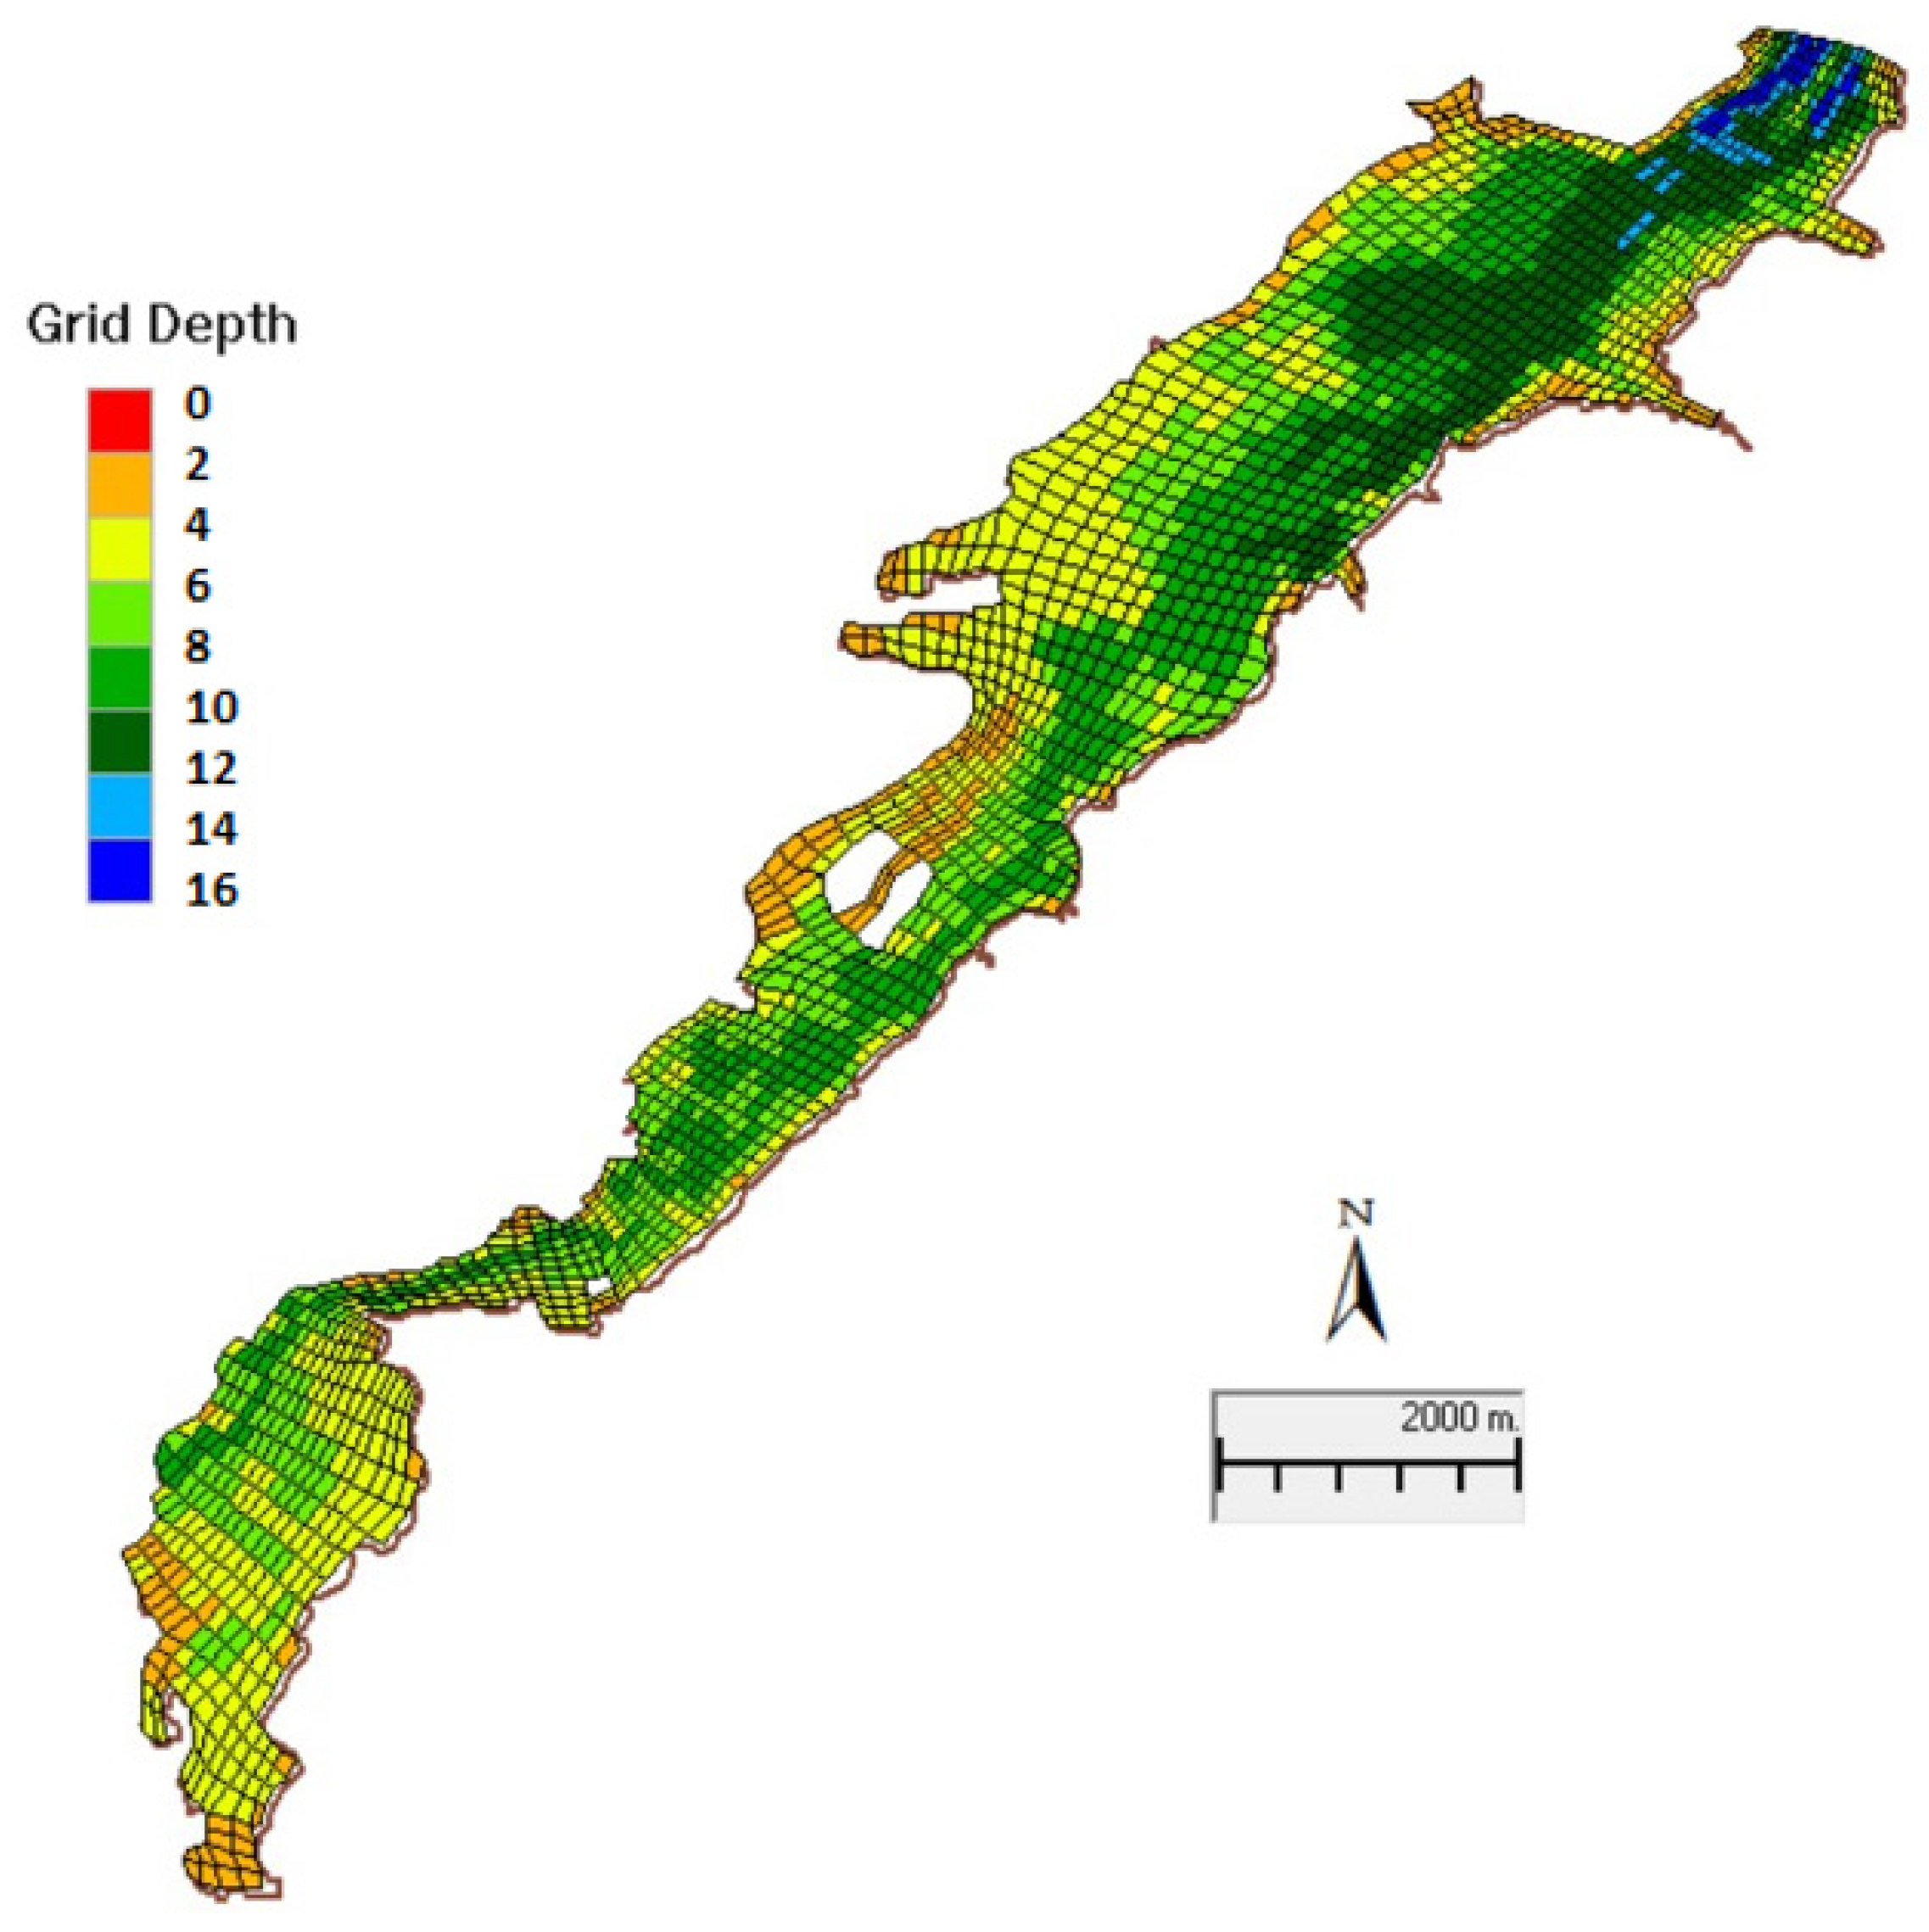
The model was based on a three-dimensional computational mesh (grid). The numerical grid covers the entire area of the Sulejów Reservoir, and refinement of the grid structure was applied in order to better reflect the phenomena occurring in this water body vertically, crosswise, and along the reservoir (algae blooms). The horizontal distribution of the computational cells is shown in Figure 2. The area of the grid cells varies horizontally, while a constant vertical layer thickness of 1 m is used to characterize the water column processes.
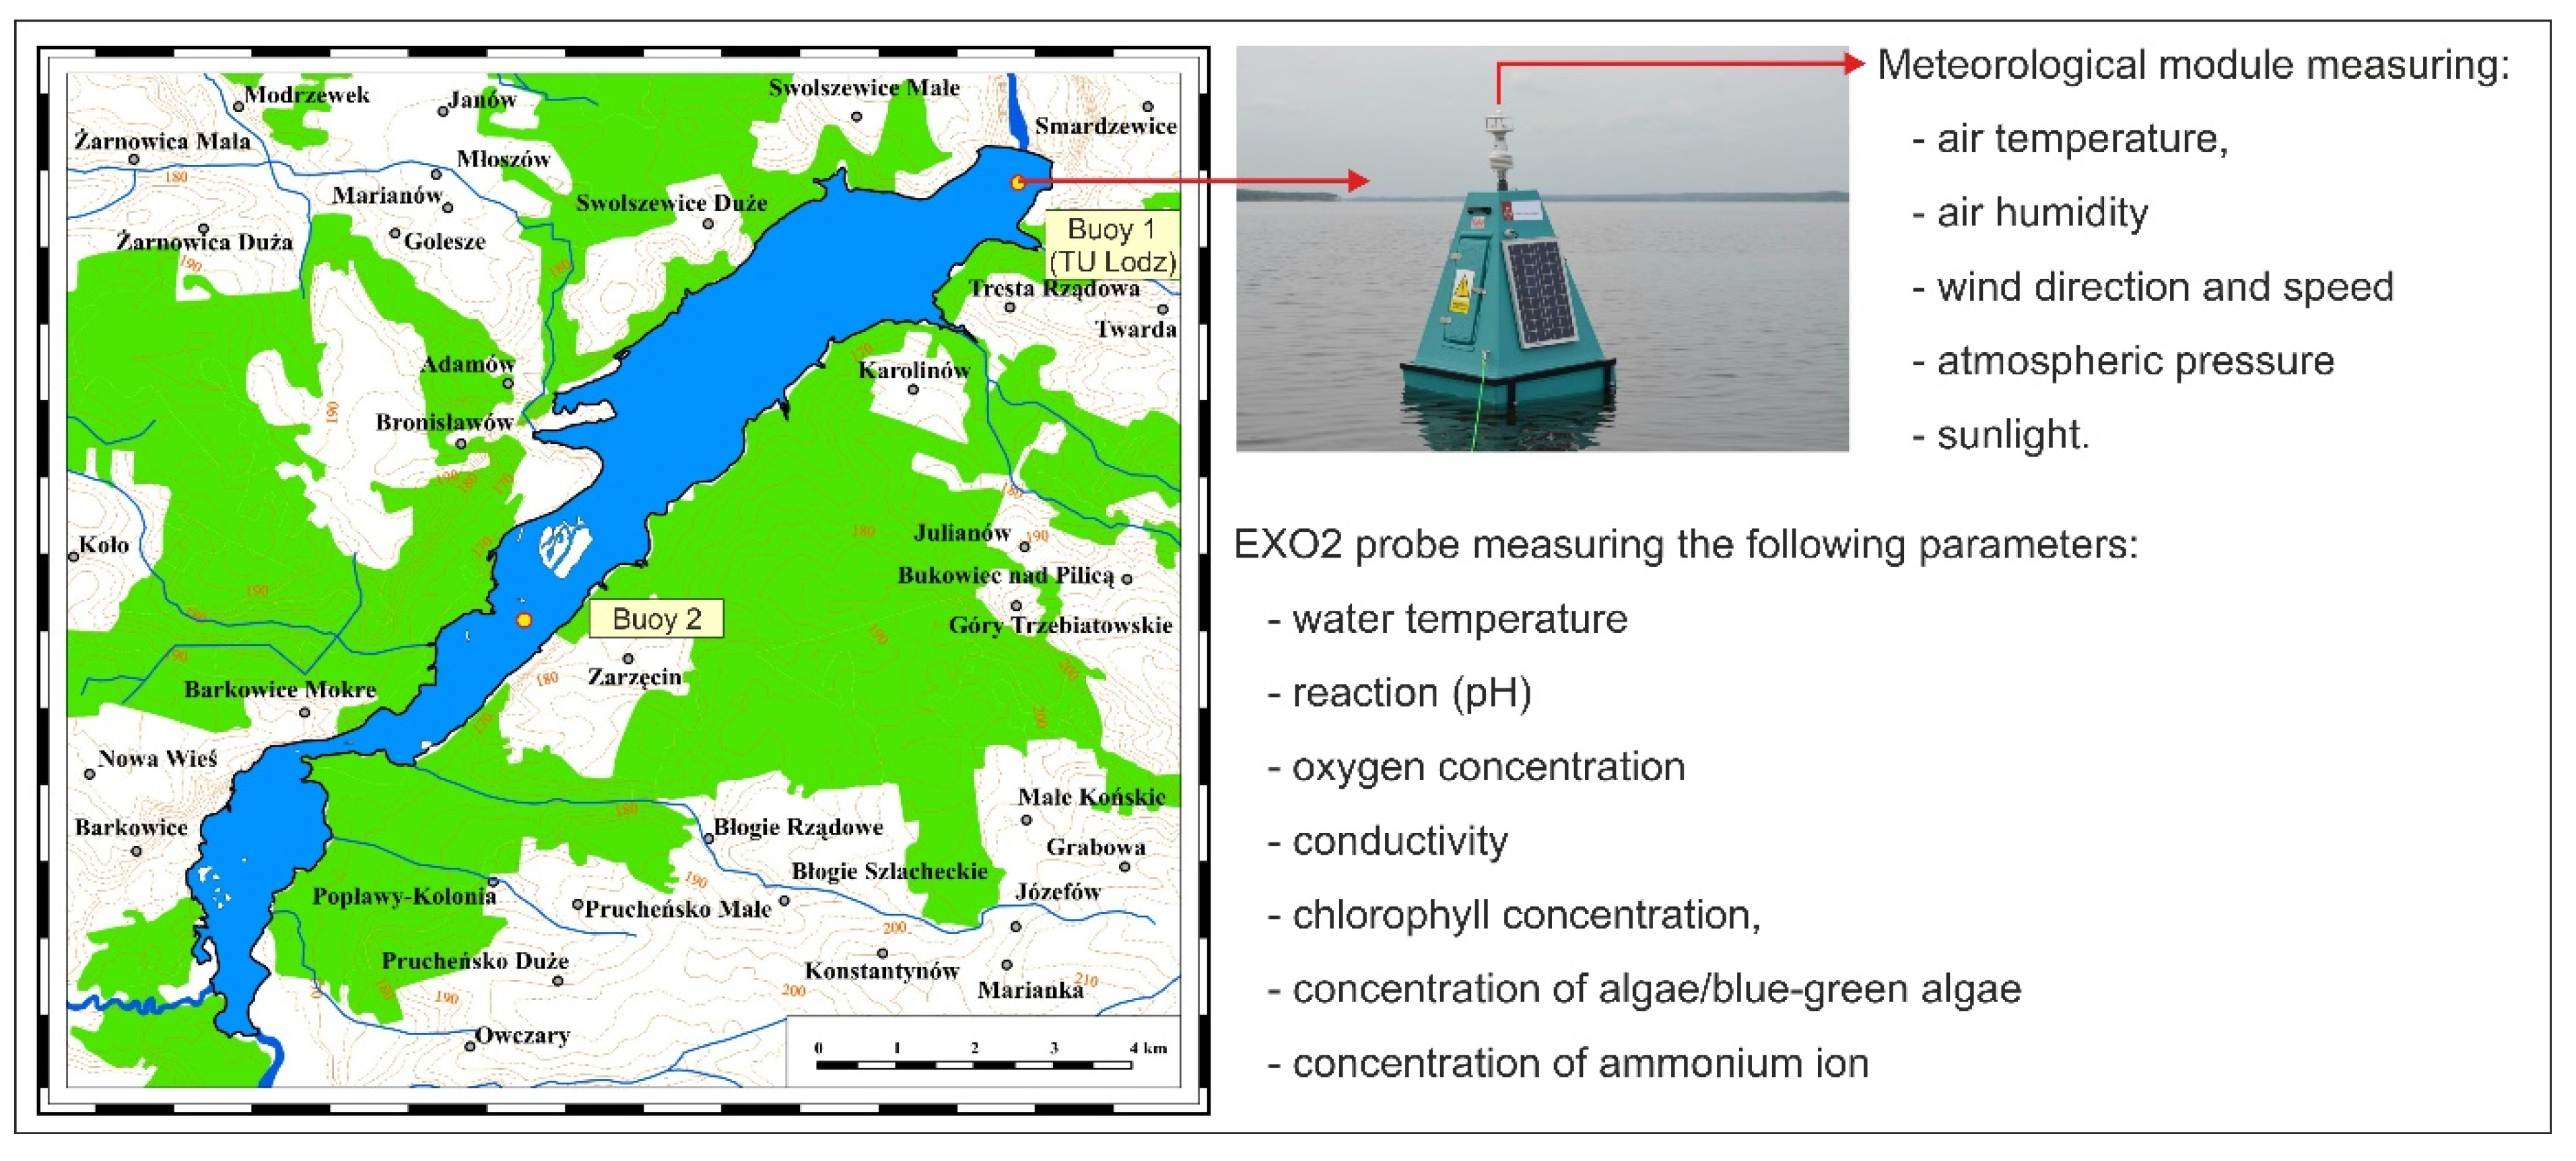
Water quality data were measured in 2015 and 2016 using two monitoring buoys deployed in the Sulejów Reservoir. The monitoring system for the Sulejów Reservoir consisted of two EXO 2 (YSI, USA) probes mounted on a buoy, anchored near the dam and in the middle part of the reservoir (Figure 3), and equipped with sensors enabling continuous, automatic measurements of water quality constituents, namely, temperature, pH, concentration of dissolved oxygen, conductivity, chlorophyll concentration, algae concentration (blue-green algae, BGA), and concentration of ammonium ions. The device, located near the dam, was also combined with a meteorological station for continuous measurement of the following constituents: water temperature, relative humidity, wind speed and direction, atmospheric pressure, and solar radiation. For the two main inflowing rivers, Sulejów and Pilica, as well as the outflow through the dam, daily flowrates were provided by the Voivodeship Inspectorate for Environmental Protection in Łódź (https://www.wios.lodz.pl/Rzeki_i_zbiorniki_2015,250). The water quality constituents of the two main tributaries had variable time frequencies, mostly between a week and a month. Temperatures of the inflowing rivers were calculated by the model from the meteorological data provided by the Institute of Meteorology and Water Management—National Research Institute.
Two multiparameter probes were immersed in the water to a depth of approx. 2.5 m. The probes were calibrated every two months based on relevant procedures and benchmark solutions supplied by the producer (https://www.ysi.com/EXO2). The collected data were used for the calibration and validation of the modeling results. Detailed results of water and air measurements have been published by Ziemińska-Stolarska et al. [64,65].
During 2015, the wind blew most frequently along the lake from the inlet towards the dam of the reservoir; 37% of the time, the speed was below 2 m/s, and 57% of the time, it was between 2 and 6 m/s. The movement of standing water caused by wind can reach up to 50 cm in the lakes of the moderate zone. Seasonal fluctuations of the water level are caused by the influx or loss of water in the reservoir. Increased inflow can result from spring thaw or abundant rains in the summer, while losses are primarily due to evaporation from the surface. Large decreases occur during prolonged drought. Changes in the water level, mainly by the lowering of the water table, affect the distribution and composition of algae species in the area of flow fluctuations (the littoral zone). On the shore of lakes and dam reservoirs, due to the above-discussed variations in the water table, a zonal arrangement of algal communities has developed over the years.
4. Acoustic Measurements
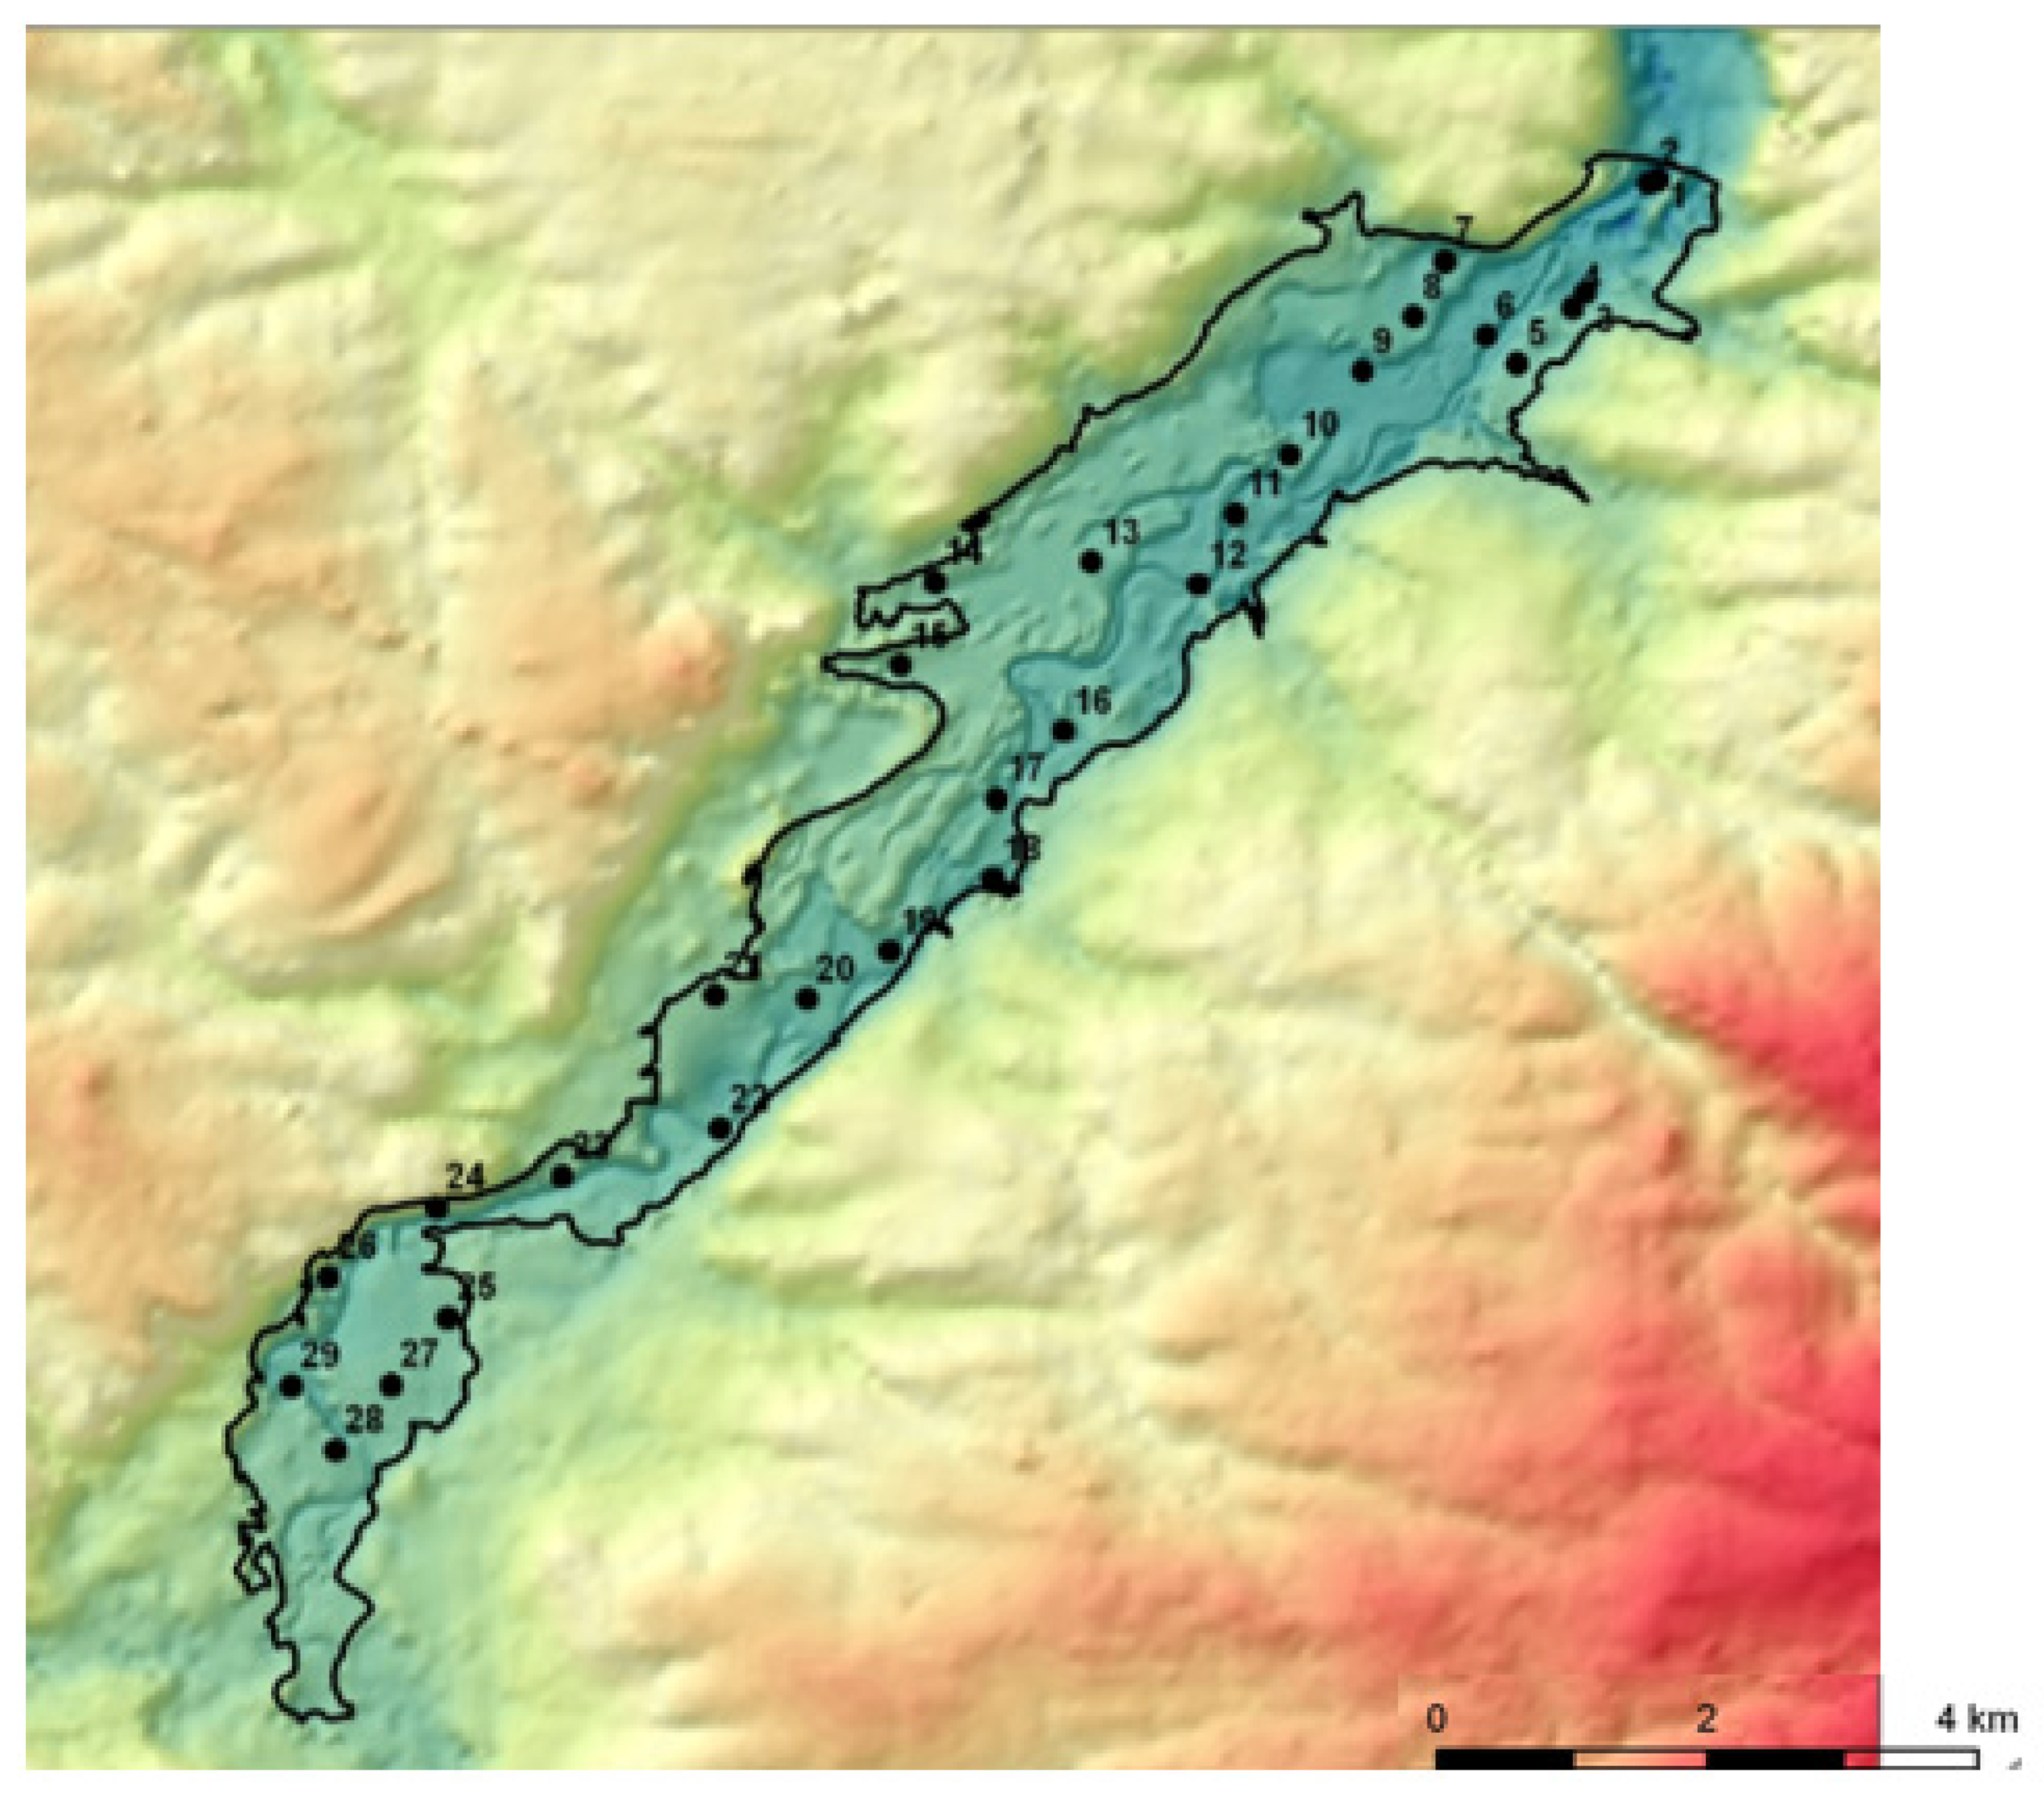
Data on water currents (velocity and direction) in the Sulejów Reservoir have strengthened the calibration and verification of the hydrodynamic model. An acoustic Doppler current profiler was used to made observations at 29 locations, from the dam to the inlet of the reservoir (Figure 4). Twenty-nine measurement points were chosen, with special attention to water temperature and water current speed.
The measurements were repeated continuously during the movement of the boat. As a result, for a single passage along the cross-section, a few hundred to several thousand measurements of partial flow were obtained, which were aggregated during the measurement process. The measurements were repeated several times. The final result was calculated as the average value of at least four correct runs.
Since the reservoir is an extension of the Pilica river, the general movement of water through the lake towards the north-east is observed, but wind and the topography of the lake influence the pattern of water movements on the short time-scale.
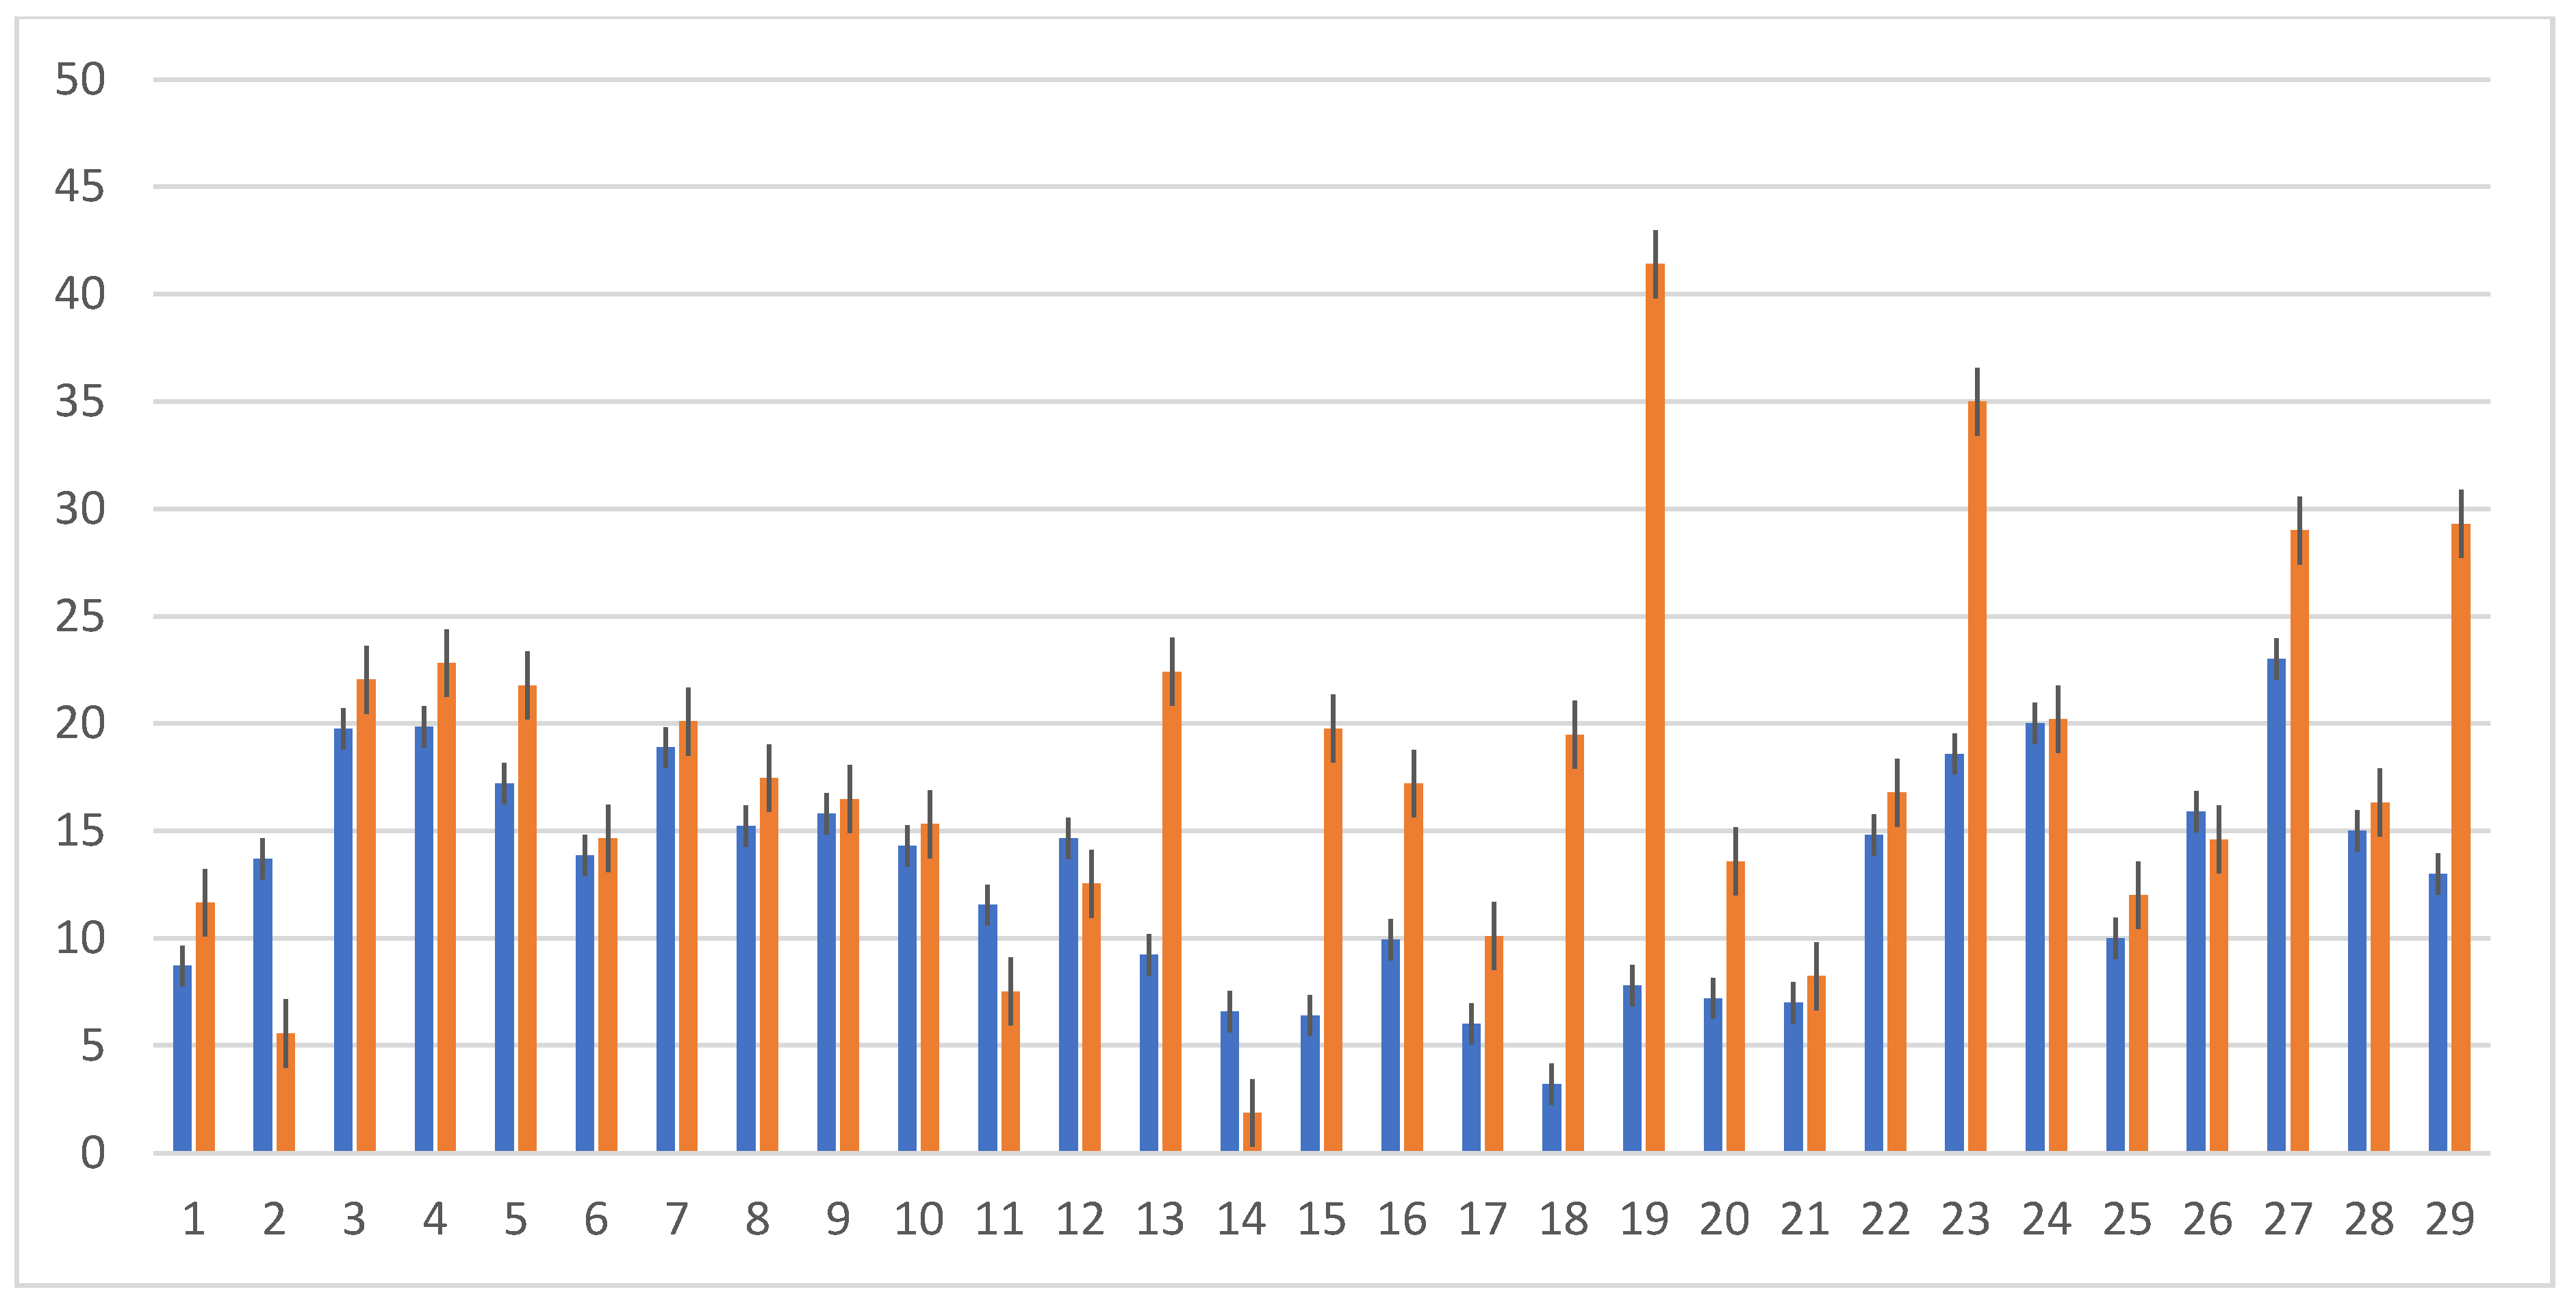
The 3D GEMSS model produced a 3D field for water movements, and the collected data were later used for the verification of the model (comparison of obtained and modeled flow velocities). Observed and modeled velocity and direction were compared daily for the month of September 2015 (Figure 5). The highest velocities were observed in the riverine and lacustrine parts of the reservoir (22–14 cm/s), the lowest in the transitional part of the lake (7–10 cm/s); this area is characterized by a low flow due to greater width (1500 m) and depth (approx. 6 m) of the basin.
A comparison between measured and modeled average current water velocities shows (except for a few points, such as 13,15, 19, 23, 27, and 29) that the results from the 3D model correspond well with the results measured with the ADCP device. Model data deviated more from observed data in the shallower (riverine) part of the reservoir.
The possible reasons for the discrepancies are as follows:
- Inaccuracies in the location of the measuring points;
- Point velocity measurement errors;
- Errors in modeling the flow;
- Errors in modeling the geometry.
The first category is related to field velocity measurements taken from a boat. Considering the fact that a boat cannot maintain an absolute fixed position due to waves and wind, errors are introduced in velocity measurements. A deviation of ±20 cm from the fixed position can be assumed, which can cause large errors if there is a steep velocity change in the plane of measurements. The magnitude of this kind of error cannot be estimated accurately; however, a rough estimate of nearby velocities, within a distance of ±20 cm to the measuring point, gave an error in the range 10–15%.
The second category consists of errors related to the instrument, its volume resolution, its range of operation, and the sampling time. The ADCP device measures instantaneous 3-D velocity vectors with 10% accuracy. The vertical resolution of the instrument was 0.05 m, which is less than the vertical mesh spacing (∆y) used in the numerical model, i.e., 0.08 m. Thus, the instrument resolution error can be ignored.
The third category is related to the numerical methods (discretization and iteration errors), boundary conditions, and closure models. For a carefully modeled problem that has well-posed boundary conditions, these errors are relatively low in comparison with other errors. Wind is an important boundary condition. The wind measurements (velocities and directions) obtained at one point near the outlet were extrapolated in the model to the whole lake. Regional variations may lead to a deviation between simulated and observed results.
The fourth category is related to how the model geometry is built. The modeled geometry is an approximation of the reservoir’s topography as it is based on measurements of discrete cross-sections. The regions between the cross-sections are interpolated and may not represent the right topography of the whole artificial lake. A rapid variation in the topography significantly affects flow velocity distributions. The spacing used in the present study were selected with special attention to the section properties of the reservoir. However, they may not have captured important changes in the bed.
Based on the above uncertainties, a total error between computed and measured velocities of about 10–15% is a reasonable assumption.
5. Results
We used numerical models to predict the parameters that may be useful for the evaluation of algal bloom occurrence in lowland dam reservoirs.
Water temperature is one of the major driving forces in phytoplankton succession; it contributes to changes in the structure of phytoplankton dominance. Cyanobacteria have generally higher temperature optima for growth than other phytoplankton. Intense biomass growth occurs at temperatures above 20 °C, although cyanobacteria, which dominate in the Sulejów Reservoir, have developed a wider temperature range of 15–24 °C. Such conditions prevailed from June to September 2015. A comparison of model-predicted water temperature with the observed data is shown in Figure 6. The modeling results capture the seasonal variations of a one-year simulation period.
One of the most important challenges controlling the accuracy of water quality models is satisfied by the calibration technique of adapting kinetic model parameters to a particular water body by achieving the smallest discrepancies between the simulation results and the measurement data. Such an approach can give a reliable description of the eutrophication process, assuming high quality and sufficient quantity of the measured data. The maximum growth of algae is a function of available phosphate-phosphorus, nitrate-nitrogen, light, and water temperature. Algal bloom volume is reduced according to death, respiration, excretion, and sedimentation processes. The cycle of carbon is essential to handling the degradation of algae and other organic matter and the subsequent transformation of nutrients. The processes are described by mathematical formulas, which include the coefficients of each process.
In the lake, many algal species exist. Each species has a separate set of coefficients. For simplicity, two types of algae, cyanobacteria and “other blue-green algae”, were selected. Coefficients describing the algal blooms were stimulated from experience, the literature, and calibration and are presented in Table 2 [70,71].
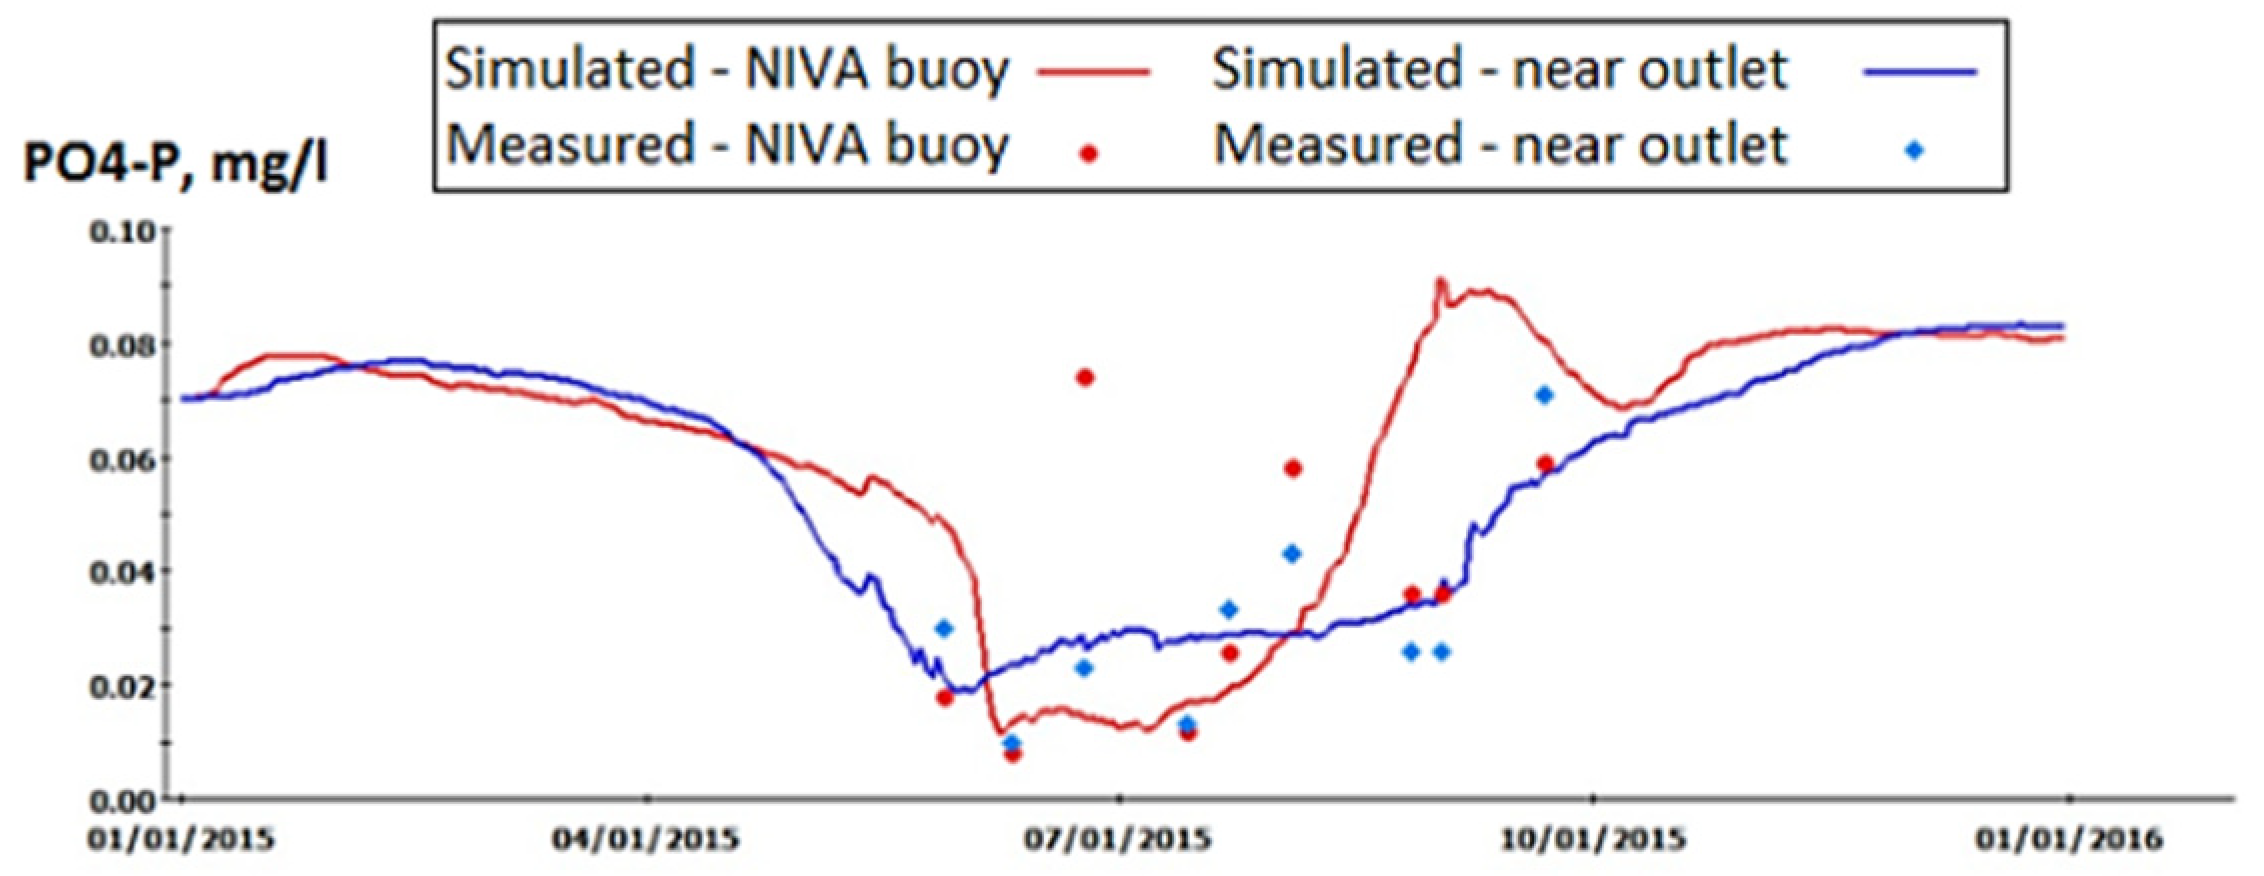
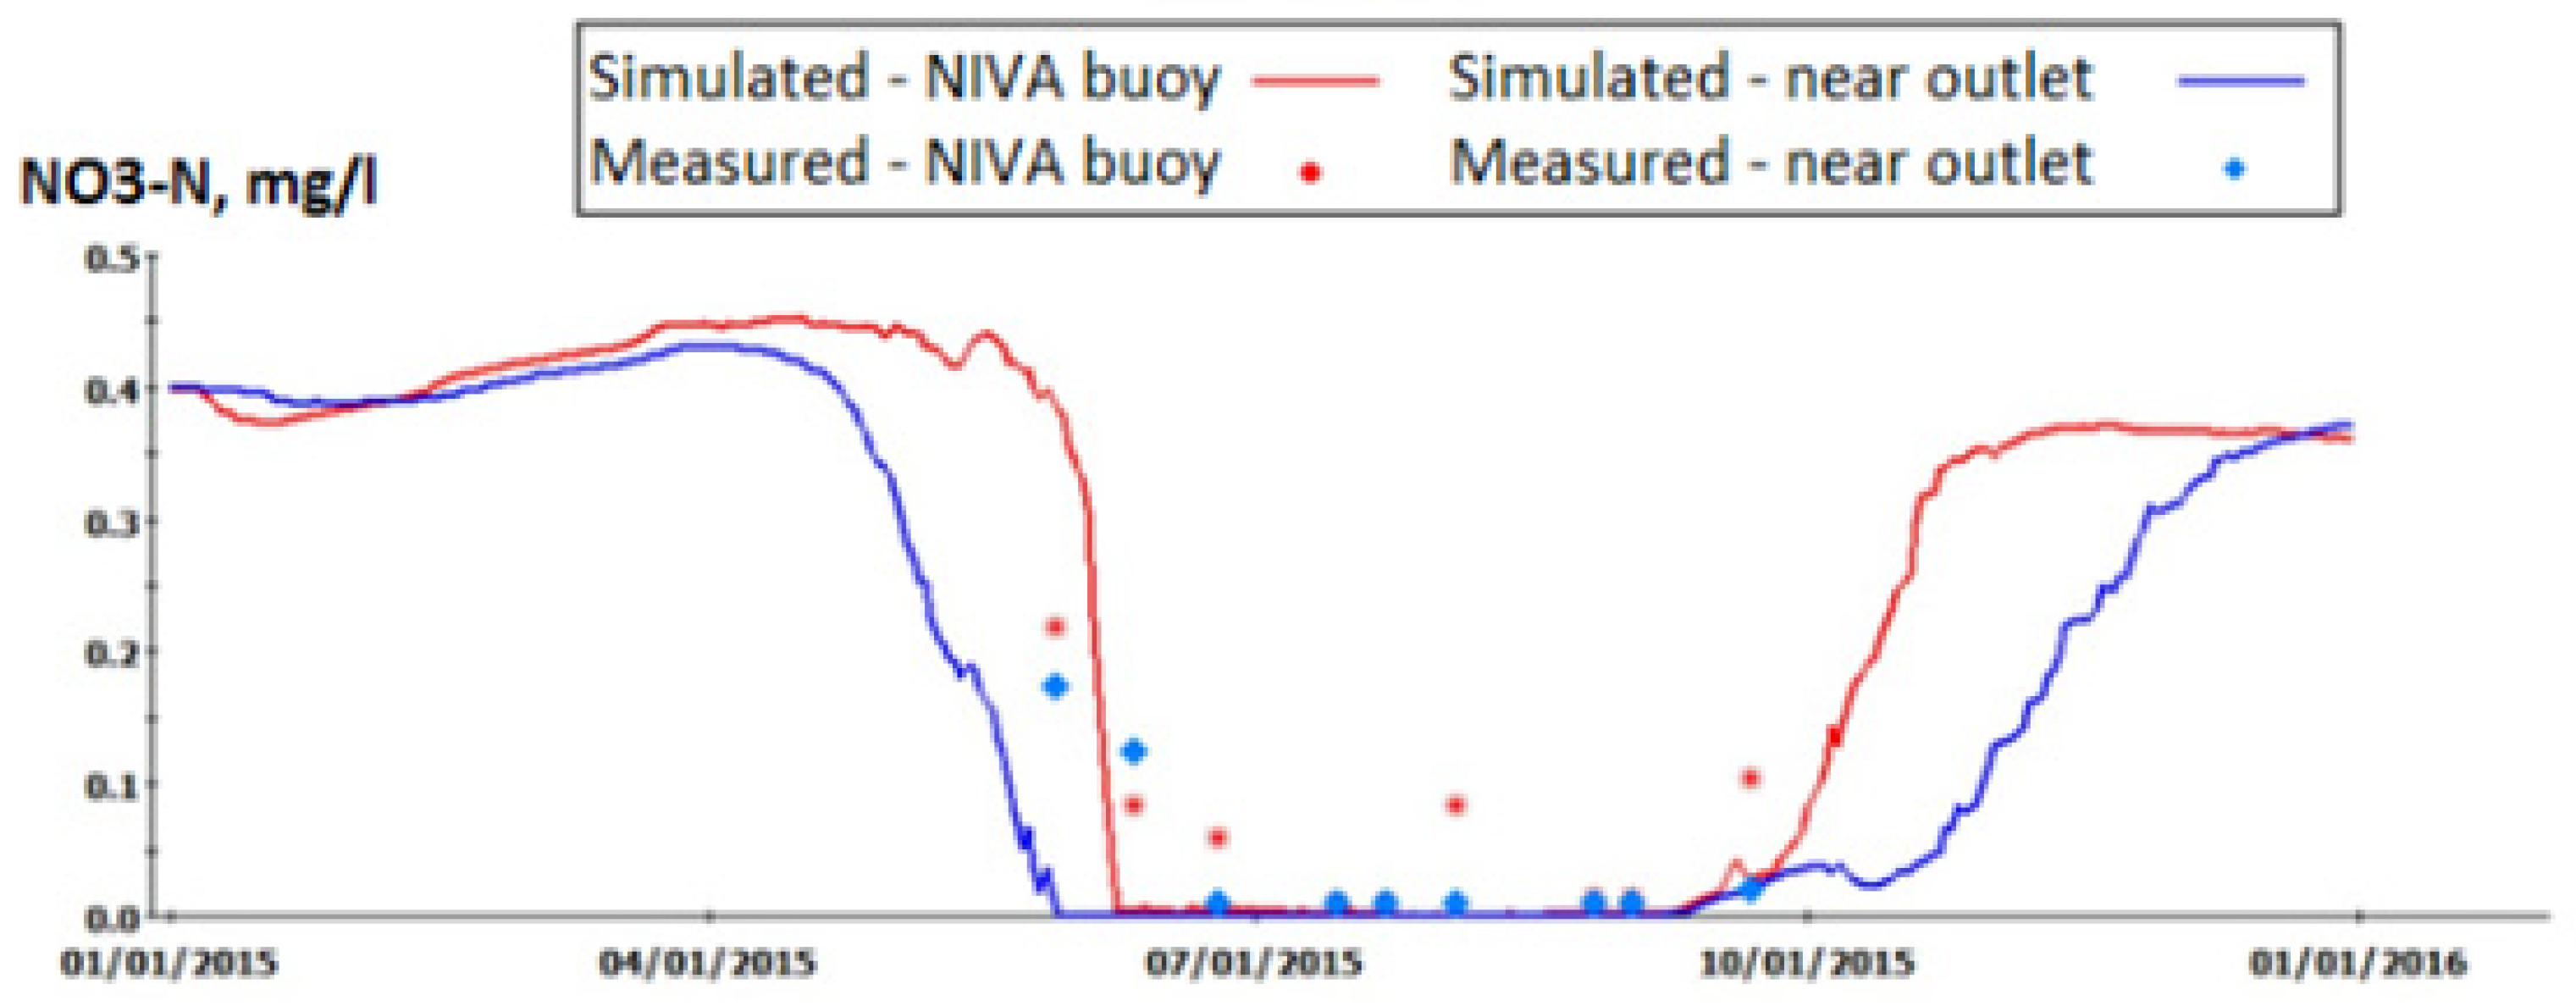
The simulated concentrations of phosphate-phosphorus (PO4-P) and nitrate-nitrogen (NO3-N) were high during the first part of the year (January–March; 0.07 and 0.04 mg/L, respectively; Figure 7 and Figure 8). Thereafter, NO3-N values and PO4-P concentrations were reduced to zero and near-zero, respectively, during the summer months (April–September). Subsequently, the concentrations of biogenic compounds increased again (October–December): NO3-N—0.35 mg/L and PO4-P—0.08 mg/L. In 2015, NO3-N was the limiting nutrient.
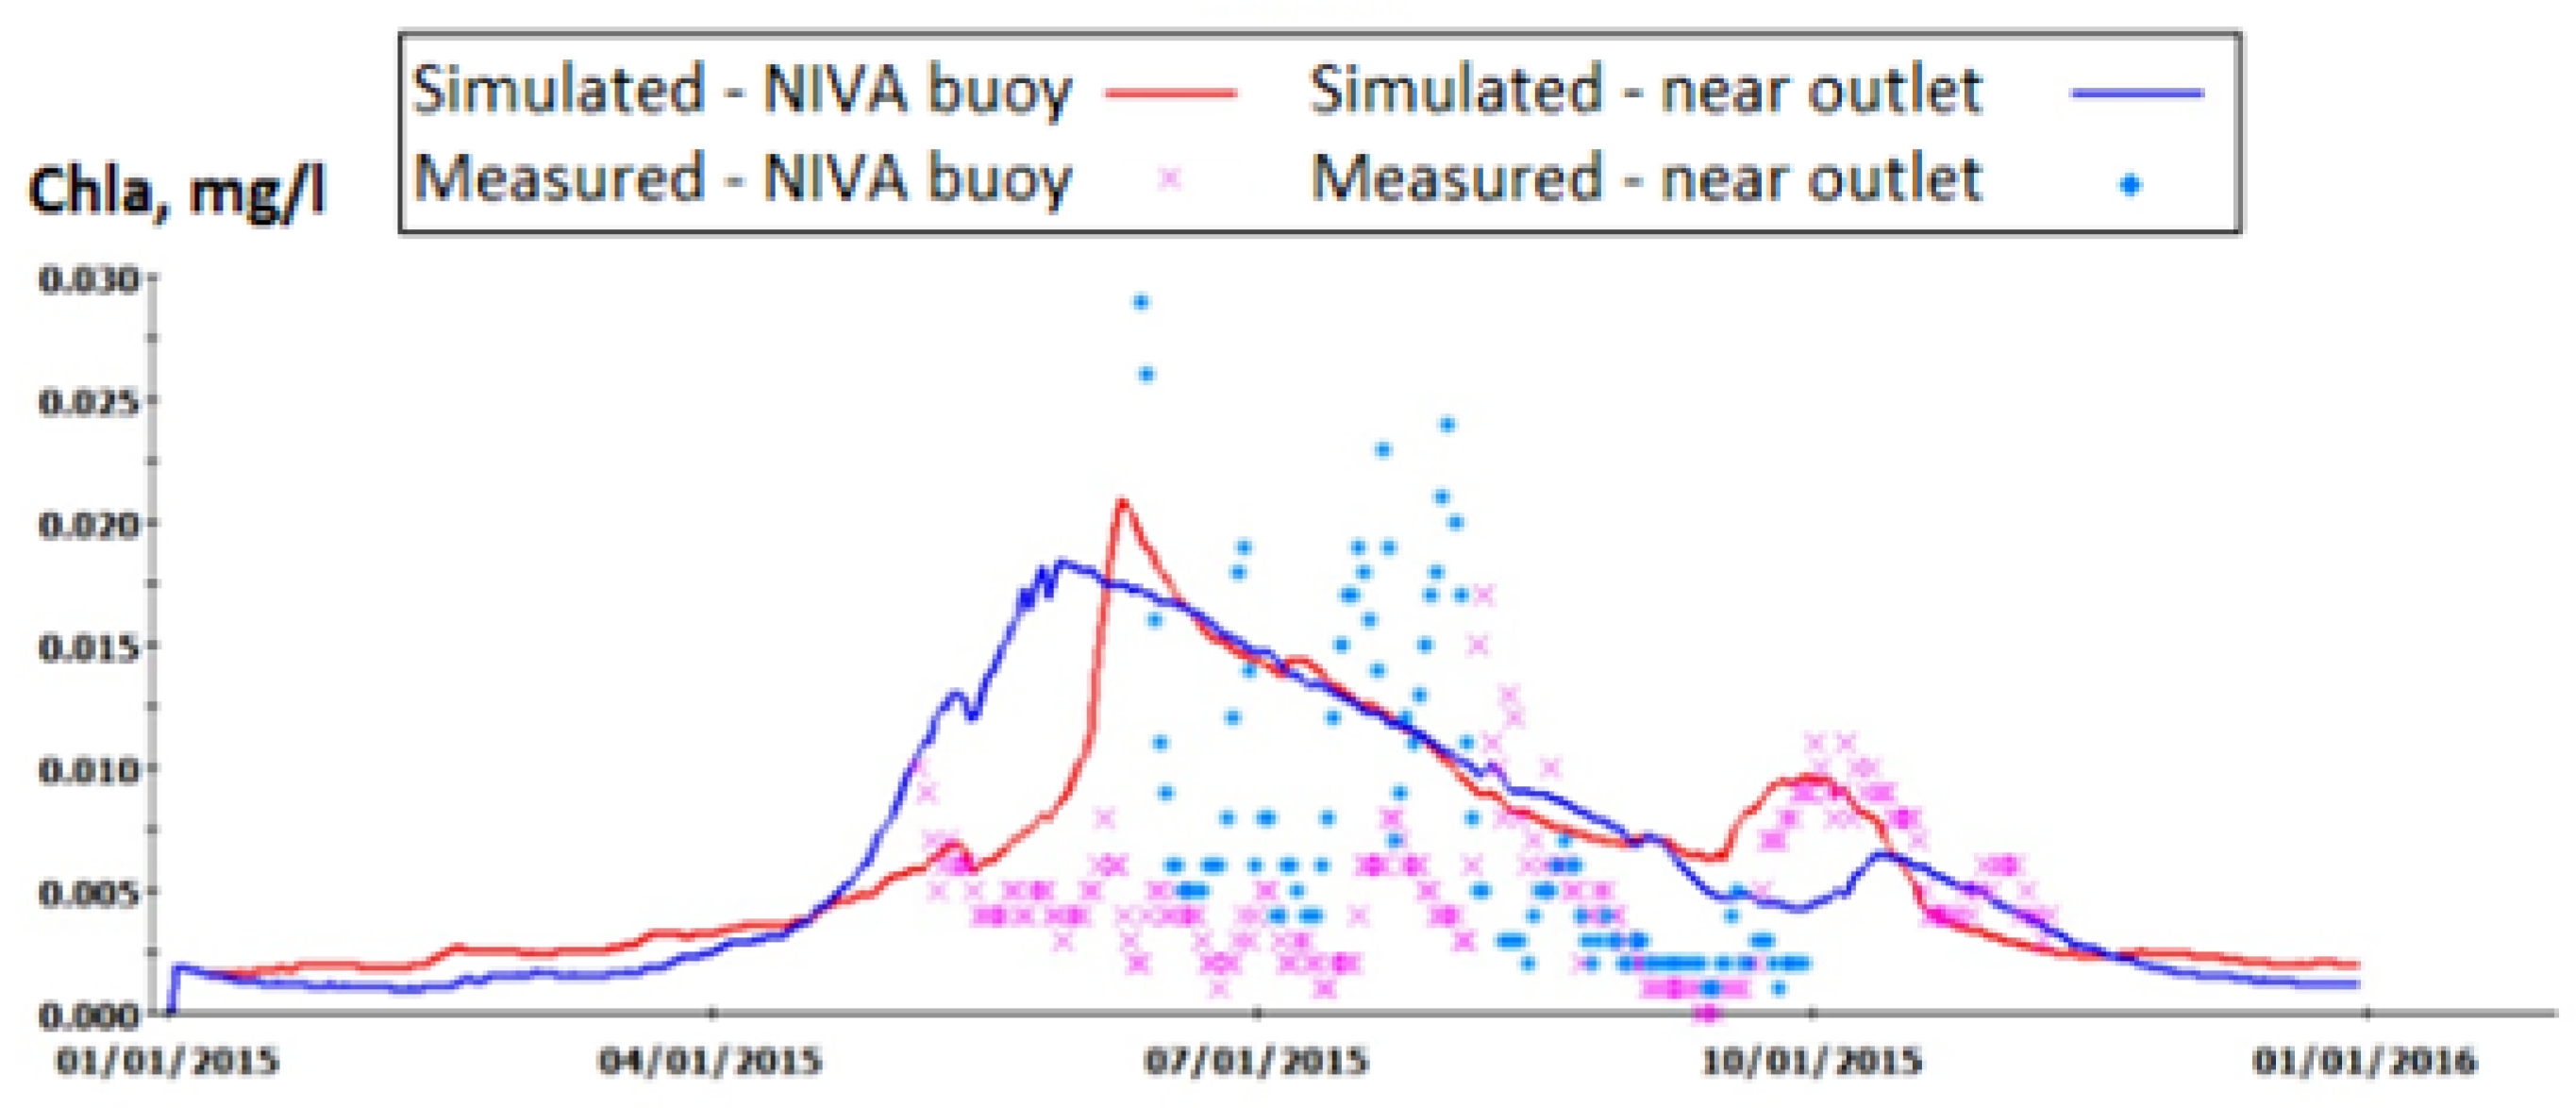
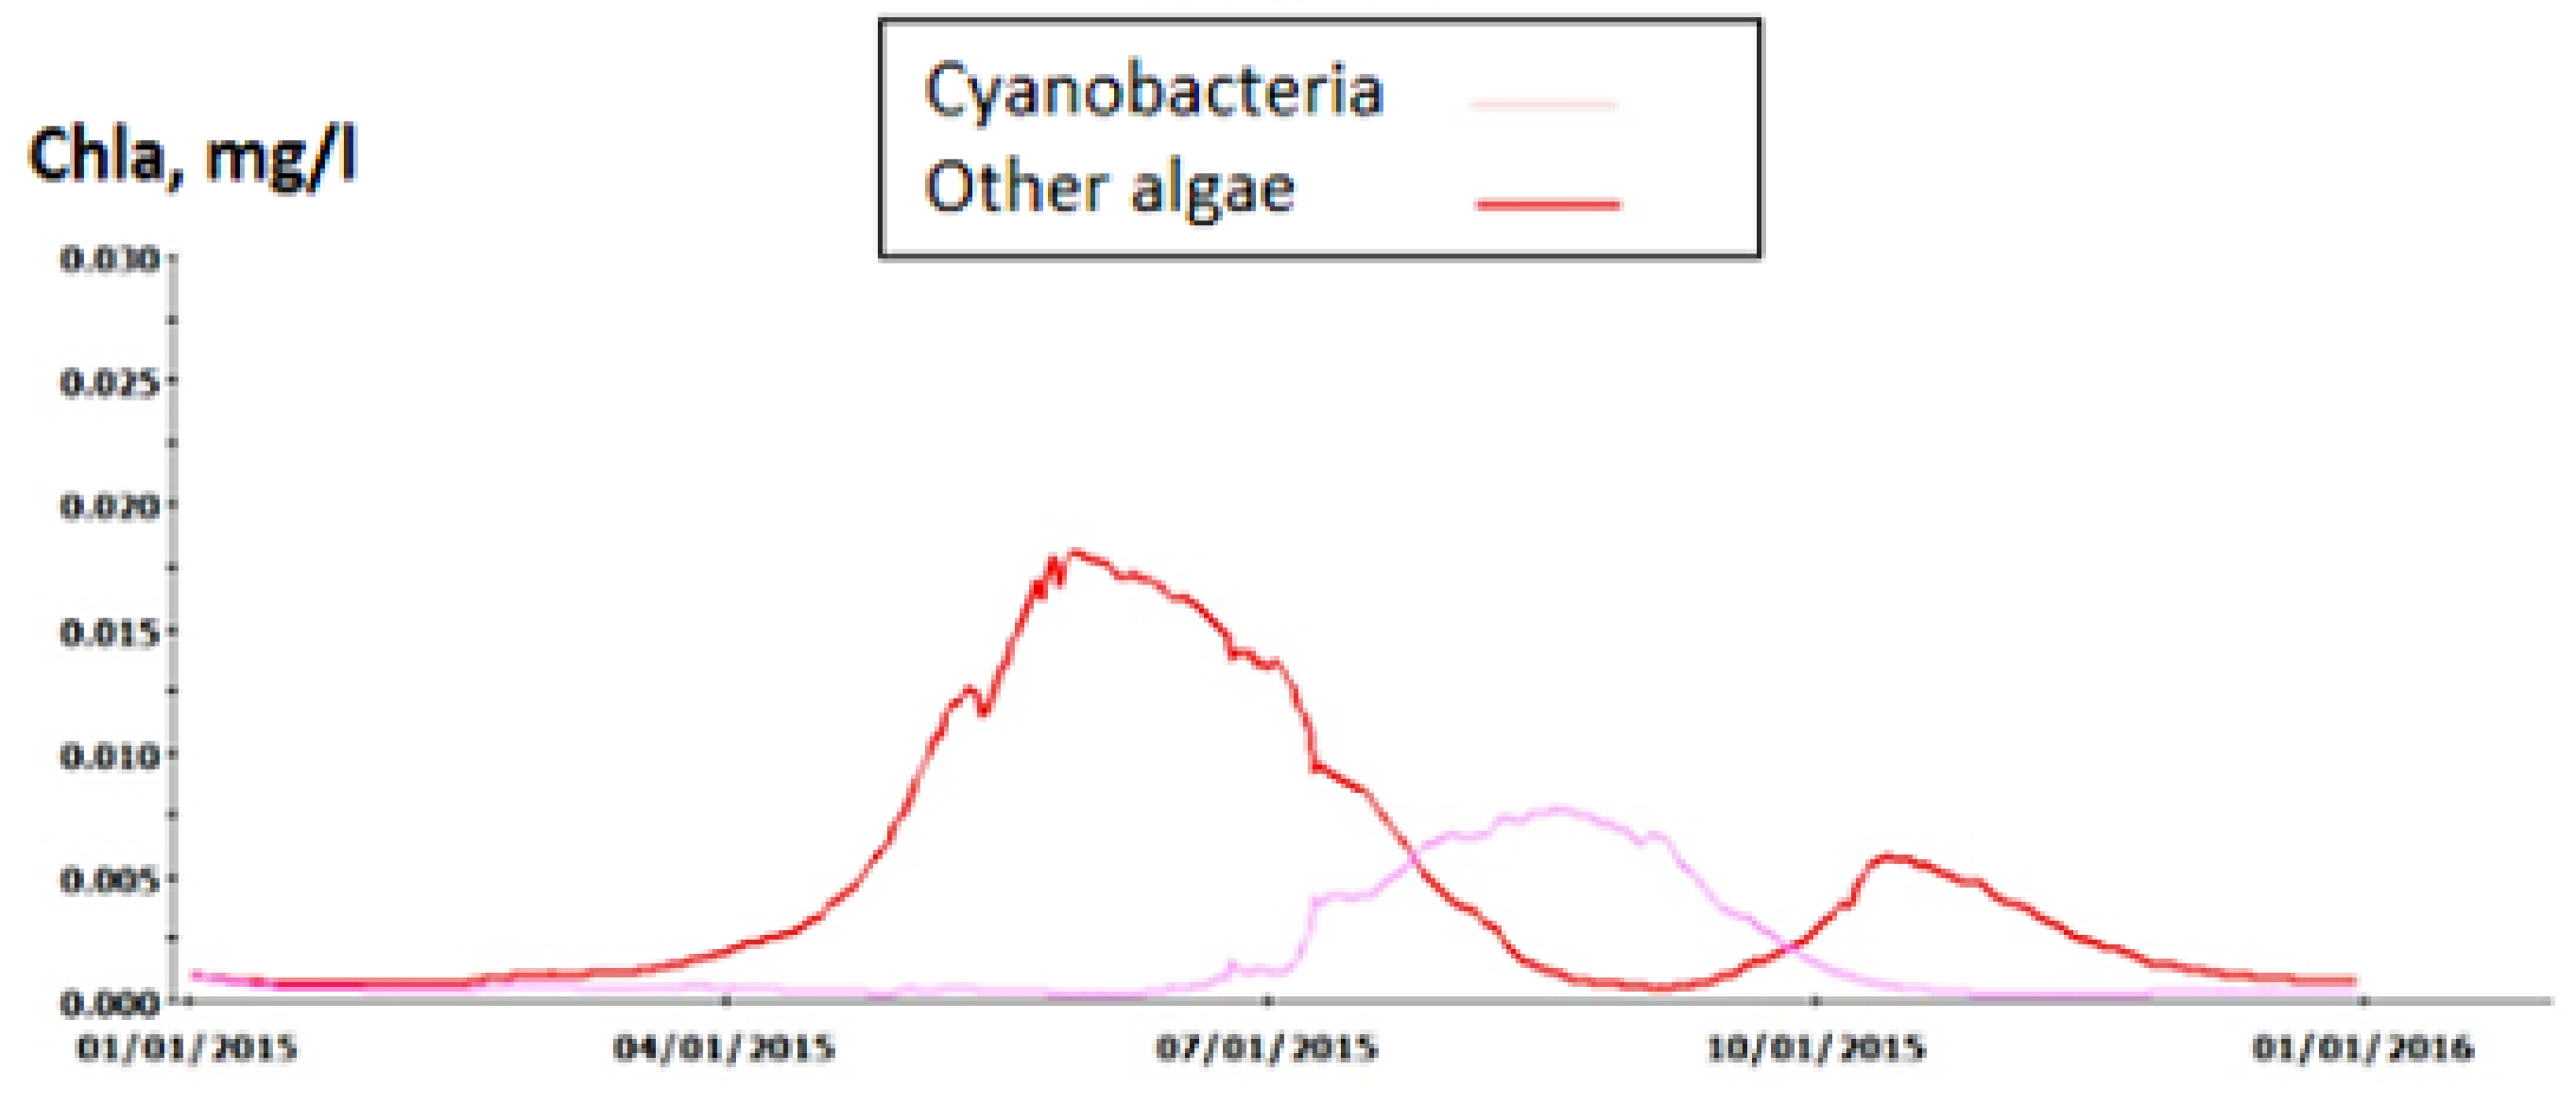
Lack of stratification in the Sulejów Reservoir makes chemical substance deposits of allochtonic (terrestrial) origin more difficult; therefore, nutrients rapidly circulate in the biosystem and intensify primary production. Chlorophyll-a content expresses the quantity of phytoplankton cells in water and is a measure of the intensity of primary production in the reservoir. Determined by the WASP model, chlorophyll-a levels fluctuate over the year. Between November and February, the water surface temperature progressively decreased and the wind swelled, which caused the concentrations of chlorophyll-a to decline (0.0025 mg/L), increase rapidly in the spring (0.02 mg/L), and slowly decrease during the summer months to 0.01 m/l (Figure 9). The simulated values produced the main pattern of the observations. Results of the simulations of “other algae species” show the highest concentrations during the spring and autumn seasons (May and June—0.02 mg/L) due to the high growth rate that is the result of higher water temperatures (Figure 10).
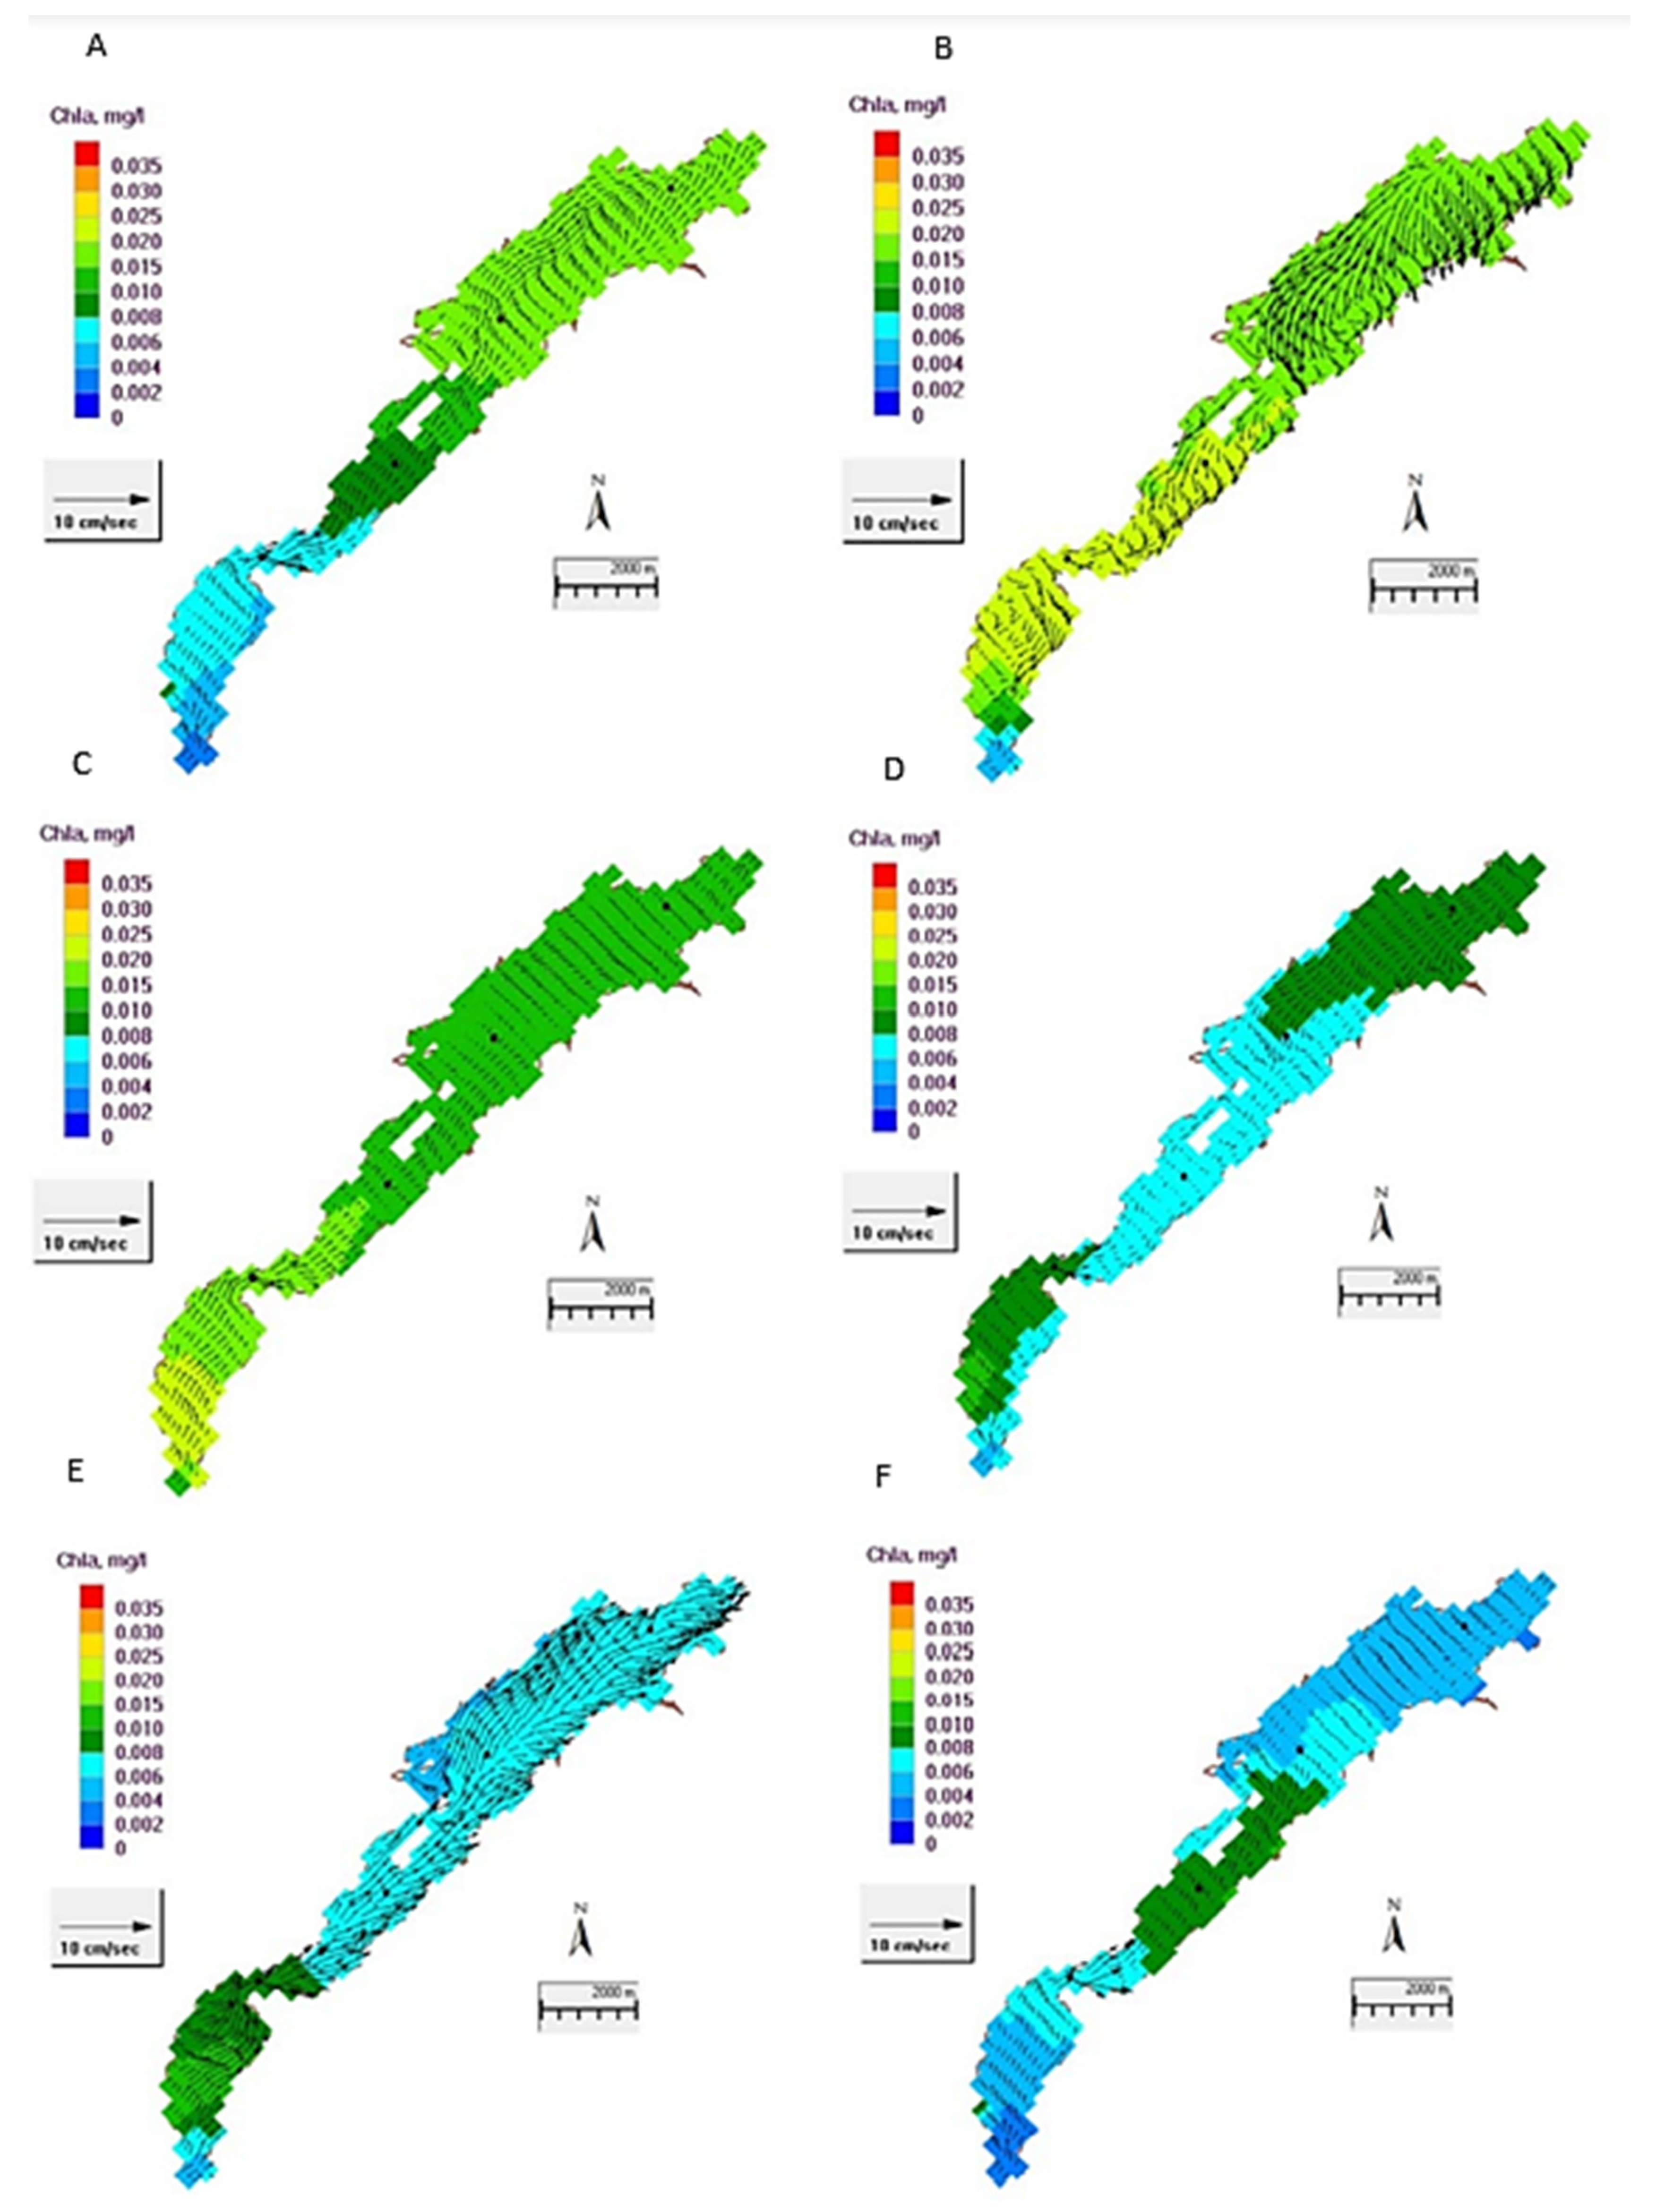
Figure 11 shows the simulated horizontal distribution of algae concentrations in the Sulejów Reservoir. The spring bloom starts near the outlet of the lake (lacustrine part—0.015–0.02 mg/L). In June, in the riverine part (0.025 mg/L), the highest algae concentrations are observed. In July, the algae concentrations decrease towards the dam (0.015 mg/L). In August, chlorophyll-a concentrations are the lowest in the transitional part of the Sulejów Reservoir (0.006 mg/L). In September, the highest concentrations are observed in the riverine part of the lake (0.01 mg/L), while in October, the highest values are observed in the transitional part (0.008 mg/L).
6. Discussion
In the Sulejów Reservoir, which is a reserve source of drinking water for the inhabitants of the Łódź agglomeration (approx 800,000 inhabitants) and an important recreation area, a bad ecological status, aggravated by regular cyanobacteria bloom, has been observed for decades. Results of studies on the water quality of the reservoir confirm the significant loading of the reservoir with inflowing waters of the Pilica and Luciaza Rivers. From 1981 to 1990, 78.8–92.2% of nitrogen and 79.3–93.8% of phosphorus reached the reservoir from major tributaries [57]. Similar proportions were observed from 1991 to 1993 [72]. Recent data show (average data of 2005–2009) that together with the main source of pollutants, i.e., with waters of the Pilica and Luciaza rivers, the reservoir is supplied with the following quantities of nutrients [63]:
- Pilica River—43.3 Total Phosphorus/year, 986 Total Nitrogen/year;
- Luciaza River—8.68 Total Pfosphorus/year, 215 Total Nitrogen/year
Many authors have shown that nitrogen compounds pass into surface water mainly from agriculture, while phosphorus compounds are a result of inflow purified to varying degrees or untreated municipal sewage and water erosion of arable land [73,74,75,76]. The latest studies by Kowalkowski [53] indicate the important contribution of groundwater and drainage systems to the total supply of mainly nitrogen compounds to the reservoir. The reason for the bad condition of water in the Sulejow Reservoir, besides pollutants flowing from the Pilica catchment, is also the development of holiday cottages that are devoid of adequate sewage systems [77]. Without improving the sanitary conditions, the discharge of significant quantities of nutrients to the reservoir will continue. Diffuse sources of municipal pollutants (in terms of the number of inhabitants not serviced by wastewater treatment plants) may provide the reservoir with about 1811 tons of nitrogen and 302 tons of phosphorus per year [78]. A significant contribution to the waters in the Sulejów Reservoir is the surface run-offs from agricultural fields that occupy over 60% of the catchment area. The use of mineral and organic fertilizers causes the loads of TN and TP that get to the reservoir to be 4176 tons N/year and 1425.6 tons P/year, respectively. Determining the input of pollutants from the catchment area, which includes water erosion, infiltration of pollutants, atmospheric deposition, and agricultural surface pollution (the quantity and type of applied mineral and organic fertilizers), is hampered. Many of the diffuse sources are difficult to define precisely [79].
An additional threat to water quality in the Sulejów Reservoir is the location of a wastewater treatment plant (Sulejów; max. capacity 3000 m3/day) just above the backwater of the reservoir. Although most of the sewage treatment has been taken over by the modernized (in 2011) treatment plant, the discharge of wastewater containing phosphorus in the form of orthophosphates is a serious source of this nutrient that is readily assimilated by plankton. The development of phytoplankton is additionally favored by a slow-down of water flow in the inlet of the reservoir. Thus, in terms of the balance of nutrients flowing into the reservoir, point sources of pollution cannot be neglected. The most important include direct discharges from wastewater treatment plants into the Pilica River and the left-bank tributaries of the Luciąża River.
Among abiotic factors, a subsequent important factor that supports the formation of algal blooms in the artificial lake is the water retention time. The extension of the water exchange rate, as indicated by Kabziński [80], causes a significant increase in algal biomass. In the modeled year, the water retention time in summer is 40 days. Shortening the retention time to 8–10 days reduces the phytoplankton biomass in the upper part of the reservoir from over 0.02 mg/L to less than 0.001 mg/L within 10 days. In the lacustrine part, the same decreased cyanobacterial biomass happens within 14 days.
7. Scenarios of Nutrient Reduction Effort
The GEMSS model was used to evaluate the effects of potential nutrient reduction scenarios. The model was used to find out how much the nutrient discharges need to be reduced in order to obtain the water quality that meets the standards of the 1st Purity Class. Furthermore, it is important to investigate which of the nutrient-mitigating actions should be concentrated on. In the Sulejów Reservoir, the availability of nutrients during the winter season is high; in April, due to better light and temperature conditions, the rapid growth and high concentrations of the so-called “spring bloom” is observed. A high amount of algae requires high concentrations of nutrients to survive. When the “winter magazine” of nutrients is empty, the algae only use the daily discharges to the lake, which will reduce the algae concentrations in equilibrium with the inputs. If the nitrate-nitrogen pool is emptied, the algal growth stops, even if there is phosphate-phosphorus left. Should the availability of phosphate-phosphorus end, the algal growth ends, even if there is nitrate-nitrogen present. Over time, both nutrients can have the role of being a limiting factor for algal growth. It follows that the reduction in the inputs of nutrients to the lake should lead to reduced algae occurrence. To get an overview of the possible mitigating actions that would be required, the sources of input of nutrients need to be quantified. The results for total phosphorus and total nitrogen are shown in four tables (Table 3, Table 4, Table 5 and Table 6). The sources are diffuse losses from arable lands and forest areas and input from urban areas. Wastewater from the public is shared between sewage treatment plants (WWTP in the tables) and the use of septic tanks. The sources are localized to three subcatchments: Sulejów River upper part, Sulejów River lower part, and the local area around Sulejów, including the Pilicia River. Most of the data were collected from the official Polish monitoring program.
Three nutrient reduction scenarios were modeled:
- 50% reduction in losses from agriculture areas;
- 50% reduction in losses from septic tanks;
- Both the 50% reduction in losses from agriculture areas and the 50% reduction in losses from septic tanks.
It has been suggested that all phosphorus and nitrogen fractions used as inputs to the model should be reduced in the same way as total phosphorus and total nitrogen.
A 50% reduction in the nutrients phosphate-phosphorus (PO4-P) and nitrate-nitrogen (NO3-N) from agriculture areas, as well as a 50% reduction in discharges from septic tanks, leads to a considerable reduction of nutrient concentrations in the lake (Figure 12). As can be seen, a 50% reduction of nutrients from agriculture areas and/or a 50% reduction in discharges from septic tanks leads to around a 20% reduction in algae occurrence during the summer growth season (Figure 12C). If both measures take place, the algae concentrations will be below half of today’s values. The water quality due to algal content might be classified as good in the above situation. The simulated results shown in Figure 12 are localized near the outlet of the reservoir.
Improved data quality on the input of nutrients to the reservoir would improve the calibration of the model. Improved knowledge of the nutrient sources in the catchment would lead to a prudent selection of the most cost-effective mitigating measures.
The presented study had a short duration, but the results made available indicate the potential of utilizing this modeling tool in future work related to improving water quality and the biodiversity of the valuable Sulejów Reservoir.
A 50% reduction in phosphate-phosphorus from agriculture areas, as well as a 50% reduction in presented compounds from wastewater sources, leads to considerably reduced concentrations in the lake and reduced algae content during the summer growth season.
8. Conclusions
The WASP model was used to determine the water quality in the Sulejów Reservoir, and the GEMSS model was used to determine the percent reduction in discharges derived from the supplying rivers that is necessary to improve the water quality standard in the Sulejów Reservoir. The obtained results show that a reduction of half the amount of nitrogen and phosphorus, together with point and diffuse sources of pollution, reduces the concentrations within the reservoir to the level of the 1st Purity Class. Moreover, by using the monitoring results, we show that concentrations of nutrient compounds during the vegetation season are reduced almost to zero, while the chlorophyll-a concentrations exceed the permissible level of 10 µg/l. We use our model to propose scenarios of nutrient reduction to solve the problem of algae blooms.
The application of mathematical modeling techniques to water quality problems has proven to be a powerful instrument in water resource management. As a diagnostic tool, it permits the abstraction of highly complex real-life conditions. As a predictive tool, mathematical modeling permits the forecasting and evaluation of the effects of changes in the surrounding environment on water quality [81,82]. Although engineering insights and political and socioeconomic concerns play important roles in water resource management, some water quality problems are of such a highly complex nature that the predictive capability of mathematical models provides the only real means for screening the myriad number of management alternatives.
The multifaceted usage of reservoirs is possible only if the ecological values of their geosystems, especially the quality of water, are retained. This quality is derived from environmental conditions and the way in which maintenance drainage areas are developed. Identification of relationships and interactions in the drainage basin–reservoir system helps indicate optimal forms of land use, triggering the protection of water resources.
Author Contributions
Conceptualization, A.Z.-S.; methodology, A.Z.-S.; software, M.K., validation, M.K., formal analysis, A.Z.-S.; investigation, A.Z.-S. and M.K.; resources, A.Z.-S.; data curation, A.Z.-S.; writing—original draft preparation, A.Z.-S.; writing—review and editing, A.Z.-S.; visualization, A.Z.-S. and M.K.; supervision, A.Z.-S.; project administration, A.Z.-S.; funding acquisition, A.Z.-S. All authors have read and agreed to the published version of the manuscript.
Funding
This research was funded by the Financial Mechanism for the European Economic Area 2009–2014, Grant Number 24/2015 / Wn07 / MN-XN-03 / D.
Informed Consent Statement
Informed consent was obtained from all subjects involved in the study.
Data Availability Statement
Acknowledgments
The research work presented in the paper was financed by the MONSUL project. funded by the Financial Mechanism for the European Economic Area 2009–2014, Grant Number 24/2015 / Wn07 / MN-XN-03 / D.
Conflicts of Interest
The authors declare no conflict of interest.
References
- Biemans, H.; Haddeland, I.; Kabat, P.; Ludwig, F.; Hutjes, R.W.A.; Heinke, J.; Von Bloh, W.; Gerten, D. Impact of reservoirs on river discharge and irrigation water supply during the 20th century. Water Resour. Res. 2011. [Google Scholar] [CrossRef] [Green Version]
- Vörösmarty, C.J.; Green, P.; Salisbury, J.; Lammers Richard, B. Global water resources: Vulnerability from climate change and population growth. Science 2000. [Google Scholar] [CrossRef] [PubMed] [Green Version]
- Gleick, P.H. Water and conflict: Fresh water resources and international security. Int. Secur. 1993, 18, 79–112. [Google Scholar] [CrossRef]
- Chapra, S.C.; Pelletier, G.J.; Tao, H. QUAL2K: A Modeling Framework for Simulating River and Stream Water Quality, Version 2.11: Documentation and User’s Manual; Civil and Environmental Engineering Dept, Tufts University: Medford, MA, USA, 2008. [Google Scholar]
- Grigg, N.S. Water Resources Management: Principles, Regulations, and Cases; No. 631.7 G72; McGraw-Hill: New York, NY, USA, 1996. [Google Scholar]
- Anderson, A.; Andreasson, P.; Lundström, S.T. CFD-modelling and validation of free surface flow during spilling of reservoir in down-scale model. Eng. Appl. Comput. Fluid Mech. 2013, 7, 159–167. [Google Scholar] [CrossRef] [Green Version]
- Shoener, B.D.; Schramm, S.M.; Béline, F.; Bernard, O.; Martínez, C.; Plósz, B.G.; Snowling, S.; Steyer, J.-P.; Valverde-Pérez, B.; Wágner, D.; et al. Microalgae and cyanobacteria modeling in water resource recovery facilities: A critical review. Water Res. X 2019, 2, 100024. [Google Scholar]
- Cole, T.; Buchak, E. CE-QUAL-W2: A Two-Dimensional, Laterally Averaged, Hydrodynamic and Water Quality Model—Version 2.0. Tech. Rpt; Waterways Experiments Station: Vicksburg, MS, USA, 1995. [Google Scholar]
- Chapra, S.C. Surface Water—Quality Modeling; McGraw-Hill Companies, Inc.: New York, NY, USA; Toronto, ON, Canada, 1997. [Google Scholar]
- Agberien, A.V.; Örmeci, B. Monitoring of Cyanobacteria in Water Using Spectrophotometry and First Derivative of Absorbance. Water 2020, 12, 124. [Google Scholar] [CrossRef] [Green Version]
- Yustiani, Y.M.; Lidya, L. Towards an Information System of Modeling and Monitoring of Cikapundung River, Bandung, Indonesia. Procedia Eng. 2016, 154, 353–360. [Google Scholar] [CrossRef] [Green Version]
- Jarman, D.S.; Faram, M.G.; Butler, D.; Tabor, G.; Stovin, V.R.; Burt, D.; Throp, E. Computational fluid dynamics as a tool for urban drainage system analysis: A review of applications and best practice. In Proceedings of the 11th International Conference on Urban Drainage, Edinburg, Scotland, UK, 31 August–5 September 2008; pp. 1–10. [Google Scholar]
- Chau, K.W. A three-dimensional eutrophication modeling in Tolo Harbour. Appl. Math. Model. 2004, 28, 849–861. [Google Scholar] [CrossRef] [Green Version]
- Vinçon-Leite, B.; Casenave, C. Modelling eutrophication in lake ecosystems: A review. Sci. Total Environ. 2019, 651, 2985–3001. [Google Scholar] [CrossRef]
- Soetaert, K.; Middelburg, J.J. Modeling eutrophication and oligotrophication of shallow-water marine systems: The importance of sediments under stratified and well-mixed conditions. In Eutrophication in Coastal Ecosystems. Developments in Hydrobiology; Andersen, J.H., Conley, D.J., Eds.; Springer: Dordrecht, The Netherlands, 2009; Volume 207. [Google Scholar]
- Shourian, M.; Moridi, A.; Kaveh, M. Modeling of eutrophication and strategies for improvement of water quality in reservoirs. Water Sci. Technol. J. Int. Assoc. Water Pollut. Res. 2016, 74, 1376–1385. [Google Scholar] [CrossRef]
- Di Toro, D.M.; Connolly, J.P. Connolly, Mathematical Models of Water Quality in Large Lages, Part 2: Lake Erie; USEPA: Washington, DC, USA, 1980.
- Ansari, A.A.; Sarvajeet, S.G.; Lanza, G.R.; Rast, W. Eutrophication: Causes, Consequences and Control; Springer: Berlin, Germany, 2011. [Google Scholar] [CrossRef]
- Cerco, C.F.; Noel, M.R. Twenty-one-year simulation of Chesapeake Bay water quality using the CE-QUAL-ICM eutrophication model. J. Am. Water Resour. Assoc. 2013, 49, 1119–1133. [Google Scholar] [CrossRef]
- Jørgensen, S.E.; Ray, S.; Berec, L.; Straskraba, M. Improved calibration of a eutrophication model by use of the size variation due to succession. Ecol. Model. 2002, 153, 269–277. [Google Scholar] [CrossRef]
- Chen, D.; Shen, H.; Hu, M.; Wang, J.; Zhang, Y.; Dahlgren, R.A. Chapter Five—Legacy Nutrient Dynamics at the Watershed Scale: Principles, Modeling, and Implications. In Sparks, Advances in Agronomy; Donald, L., Ed.; Academic Press: Cambridge, MA, USA, 2018; Volume 149, pp. 237–313. [Google Scholar]
- Di Toro, D.M.; O’Connor, D.J.; Thomann, R.V. A Dynamic Model of Phytoplankton Population in the Sacramento San Joaquin Delta. Adv. Chem. Ser. 1971, 106, 131–180. [Google Scholar]
- Lung, W.S. Modeling of Phosphorus Sediment-Water Interactions in White Lake, Michigan. Ph.D. Thesis, Department of Civil Engineering, University of Michigan, Ann Arbor, MI, USA, 1975. [Google Scholar]
- Thomann, R.V.; Di Toro, D.M.; Winfield, R.; O’Connor, D.J. Mathematical Modeling of Phytoplankton in Lake Ontario; Model Development and Verification; U.S. Environmental Protection Agency, Office of Research Development, National Environment Research Center: Corvallis, OR, USA, 1975; p. 177.
- Orlob, G.T. (Ed.) Mathematical Modeling of Water Quality: Streams, Lakes and Reservoirs; John Willey &Sons: Hoboken, NJ, USA, 1983; p. 518. [Google Scholar]
- Thomann, R.V.; Muller, J.A. Principles of Surface Water Quality Modeling and Control; Harper & Row Publishers: New York, NY, USA, 1987; p. 644. [Google Scholar]
- Martin, J.L.; McCutcheon, S.C. Hydrodynamics and Transport for Water Quality Modeling; CRP Press, Inc.: Boca Raton, FL, USA, 1999; p. 794. [Google Scholar]
- Lung, W.S. Water Quality Modeling for Waste Load Allocations and TMDLs; John Wiley & Sons, Inc.: Hoboken, NJ, USA, 2001; p. 333. [Google Scholar]
- Leon, L.F.; Lam, D.C.; McCrimmon, C.; Swayne, D.A. Watershed management modeling in Malawi: Application and technology transfer. Environ. Modeling Softw. 2003, 18, 531–539. [Google Scholar] [CrossRef]
- Liu, W.C.; Kuo, J.T.; Kuo, A.Y. Modeling hydrodynamics and water quality in the separation waterway of the Yulin offshore industrial park, Taiwan. Environ. Model. Softw. 2005, 20, 309–328. [Google Scholar] [CrossRef]
- Pastres, R.; Ciavatta, S. A comparison between the uncertainties in model parameters and in forcing functions: Its application to a 3D water-quality model. Environ. Model. Softw. 2005, 20, 981–989. [Google Scholar] [CrossRef] [Green Version]
- Kuo, J.T.; Thomann, R.V. Phytoplankton modeling in the embayment of lakes. J. Environ. Eng. 1983, 119, 1311–1332. [Google Scholar] [CrossRef]
- Miyanaga, Y. Modeling of stratified flow and eutrophication in reservoirs. Ecol. Model. 1986, 31, 133–144. [Google Scholar] [CrossRef]
- Carrick, H.J.; Worth, D.; Marshall, M. The influence of water circulation on chlorophyll-turbidity relationship in Lake Okeechobee as determined by remote-sensing. J. Phytoplankton Res. 1994, 16, 1117–1135. [Google Scholar] [CrossRef] [Green Version]
- Kawara, O.; Yura, E.; Fujii, S.; Matsumoto, T. A study on the role of hydraulic retention time eutrophication of the Asahi river dam reservoir. Water Sci. Technol. 1998, 37, 245–252. [Google Scholar] [CrossRef]
- Tufford, D.L.; McKellar, H.N. Spatial and temporal hydrodynamic and water quality modeling analysis of a large reservoir on the South Carolina coastal plain. Ecol. Model. 1999, 114, 137–173. [Google Scholar] [CrossRef]
- Verkhozina, V.A.; Kozhova, O.M.; Kusner, Y.S. Hydrodynamics as a limiting factor in the Lake Baikal ecosystem. Aquat. Ecosyst. Health Manag. 2000, 392, 203–210. [Google Scholar] [CrossRef]
- Irianto, E.W.; Triweko, R.W.; Soedjono, P. Simulation Analysis to Utilize Hypolimnetic Withdrawal technique for eutrophication control in tropical reservoir (Case study: Jatiluhur Reservoir, Indonesia). Int. J. Environ. Resour. 2012, 1, 89–100. [Google Scholar]
- Streeter, H.W.; Phelps, E. A Study of the Pollution and Natural Purification of the Ohio River; Factors Concerned in the Phenomena of Oxidation and Reaeration; Public Health Bulletin No.146. U.S. Public Health Service; US Department of Health, Education & Welfare: Washington, DC, USA, 1925.
- Deus, R.; Brito, D.; Kenov, I.A.; Lima, M.; Costa, V.; Medeiros, A.; Neves, R.; Alves, C.N. Three-dimensional model for analysis of spatial and temporal patterns of phytoplankton in Tucurui reservoir, Para, Brasil. Ecol. Model. 2013, 253, 28–43. [Google Scholar] [CrossRef]
- Wang, Q.; Li, S.; Jia, P.; Qi, C.; Ding, F. A review of surface water quality models. Sci. World J. 2013. [Google Scholar] [CrossRef] [Green Version]
- Xu, Z.X.; Lu, S.Q. Research on hydrodynamic and water quality model for tidal river networks. J. Hydrodyn. 2003, 15, 64–70. [Google Scholar]
- James, I.D. Modeling pollution dispersion, the ecosystem and water quality in coastal waters: A review. Environ. Model. Softw. 2002, 17, 363–385. [Google Scholar] [CrossRef]
- Hartnett, M.; Nash, S. Modeling nutrient and chlorophyll a dynamics in an Irish brackish water body. Environ. Model. Softw. 2004, 19, 47–56. [Google Scholar] [CrossRef] [Green Version]
- Beck, M.B. Environmental foresight and structural change. Environ. Model. Softw. 2005, 20, 651–670. [Google Scholar] [CrossRef] [Green Version]
- Na, E.H.; Park, S.S. A hydrodynamic and water quality modeling study of spatial and temporal patterns of phytoplankton growth in a stratified lake with buoyant incoming flow. Ecol. Model. 2006, 199, 298–314. [Google Scholar] [CrossRef]
- Voinov, A.A.; Tonkikh, A.P. Qualitative model of eutrophication in macrophyte lakes. Ecol. Model. 1987, 35. [Google Scholar] [CrossRef] [Green Version]
- Franke, U.; Hutter, K.; Johnk, K. A physical-biological coupled model for algal dynamics in lakes. Bull. Math. Biol. 1999, 61, 239–272. [Google Scholar] [CrossRef] [PubMed]
- Edwards, A.M.; Brindley, J. Zooplankton mortality and the dynamical behavior of plankton population models. Bull. Math. Biol. 1999, 61, 303–339. [Google Scholar] [CrossRef] [PubMed]
- Chakraborty, S.; Roy, S.; Chattopadhyay, J. Nutrient-limited toxin production and the dynamics. of two phytoplankton in culture media: A mathematical model. Ecol. Model. 2008, 213, 191–201. [Google Scholar] [CrossRef]
- Pauer, J.; Auer, M.T. Nitrification in the Water Column and Sediment of a Hypereutrophic Lake and Adjoining River System. Water Res. 2000, 34, 1247–1254. [Google Scholar] [CrossRef]
- Kuriata-Potasznik, A.; Szymczyk, S.; Skwierawski, A. Influence of Cascading River–Lake Systems on the Dynamics of Nutrient Circulation in Catchment Areas. Water 2020, 12, 1144. [Google Scholar] [CrossRef] [Green Version]
- Kowalkowski, T.; Pastuszak, M.; Igras, J.; Buszewski, B. Differences in emission of nitrogen and phosphorus into the Vistula and Oder basins in 1995–2008—Natural and anthropogenic causes (MONERIS model). J. Mar. Syst. 2012, 89, 48–60. [Google Scholar] [CrossRef]
- Ambrożewski, Z. Monography of the Sulejów Reservoir. WKiL Warszawa 1980, 1–84. (In Polish) [Google Scholar]
- Ambrożewski, Z. Projektowanie i realizacja zbiornika wodnego Sulejów [Design and implementation of the water Sulejów Reservoir]. Gosp Wod 1993, 12, 267–273. (In Polish) [Google Scholar]
- Galicka, W. Total nitrogen and phosphorus budgets in the lowland Sulejów Reservoir for the hydrological years 1985–1988. Arch. Hydrobiol. Suppl. 1992, 2, 159–169. [Google Scholar]
- Galicka, W.; Drożdżyk, A.; Korczyńska, A. Limnological characteristics of the Sulejów Reservoir in the period 1981–1987. Warsaw 1990. (In Polish) [Google Scholar]
- Galicka, W.; Lesiak, T.; Rzerzycha, E. Characteristic of phytoplankton in the Sulejów Reservoir in the period 1982–1987. Warsaw 1990. (In Polish) [Google Scholar]
- Galicka, W.; Penczak, T. Total nitrogen and phosphorus budgets in the lowland Sulejów Reservoir. Arch. Hydrobiol. 1989, 117, 177–190. [Google Scholar]
- Tarczyńska, M. The Causes of Toxic Cyanobacterial Blooms in the Sulejowski Reservoir and Their Impact on the Aquatic Ecosystem. Ph.D. Thesis, University of Lódź, Łódź, Poland, 1997. (In Polish). [Google Scholar]
- Mankiewicz-Boczek, J.; Urbaniak, M.; Romanowska-Duda, Z.; Izydorczyk, K. Toxic Cyanobacteria strains in lowland dam reservoir (Sulejow Res Central Poland): Amplification of mcy genes for detection and identification. Pol. J. Ecol. 2006, 53, 171–180. [Google Scholar]
- Zieminska-Stolarska, A.; Zbicinski, I.; Imbierowicz, M.; Skrzypski, J. Waterpraxis as a tool supporting protection of water in the Sulejow Reservoir. Desalin. Water Treat. 2013, 51, 4194–4206. [Google Scholar] [CrossRef]
- Zieminska-Stolarska, A. Analysis of the Flux of Biogenic Substances on Water Eutrophication in the Large Water Bodies on the Example of the Sulejow Reservoir. Ph.D. Thesis, Faculty of Process and Environmental Engineering, Lodz University of Technology, Lodz, Poland, 2014. [Google Scholar]
- Ziemińska-Stolarska, A.; Imbierowicz, M.; Jaskulski, M.; Szmidt, A.; Zbiciński, I. Continuous and Periodic Monitoring System of Surface Water Quality of an Impounding Reservoir: Sulejow Reservoir, Poland. Int. J Environ. Res. Public Health 2019, 16, 301. [Google Scholar] [CrossRef] [Green Version]
- Ziemińska-Stolarska, A.; Adamiec, J.; Imbierowicz, M.; Imbierowicz, E.; Jaskulski, M.; Zbiciński, I. Surface water quality monitoring in a large dam reservoir, Poland. Desalin. Water Treat. 2018, 130–142. [Google Scholar] [CrossRef]
- Edinger, J.E.; Buchak, E.M. Numerical Hydrodynamics of Estuaries. In Estuarine and Wetland Processes with Emphasis on Modeling; Hamilton, P., Macdonald, K.B., Eds.; Plenum Press: New York, NY, USA, 1980; pp. 115–146. [Google Scholar]
- Edinger, J.E.; Buchak, E.M. Numerical Waterbody Dynamics and Small Computers. In Proceedings of the ASCE 1985 Hydraulic Division Specialty Conference on Hydraulics and Hydrology in the Small Computer Age, Lake Buena Vista, FL, USA, 13–16 August 1985; American Society of Civil Engineers: Reston, VA, USA, 1985. [Google Scholar]
- Edinger, J.E.; Buchak, E.M. Numerical Intermediate and Far Field Dilution Modelling. Water Air Soil Pollut. 1995, 83, 147–160. [Google Scholar]
- Edinger, J.E.; Buchak, E.M.; McGurk, M.D. Analyzing Larval Distributions Using Hydrodynamic and Transport Modelling. Estuarine and Coastal Modeling III; American Society of Civil Engineers: New York, NY, USA, 1994. [Google Scholar]
- Ambrose, R.; Wool, T.A.; Martin, J. The Water Quality Analysis Simulation Program, Wasp5 Part A: Model Documentation; Environmental Research Laboratory, US Environmental Protection Agency: Athens, GA, USA, 1993.
- WDOE (State of Washington Department of Environment). Comprehensive Circulation and Water Quality Study at Budd Inlet, Southern Puget Sound Water Quality Assessment Study; URS Corporation for the Washington State Department of Ecology: Washington, DC, USA, 1984.
- Galicka, W. Limnological Characteristics of a Lowland Dam Reservoir on the Pilica River in the Years 1981–1993; University of Lodz: Lodz, Poland, 1996. (In Polish) [Google Scholar]
- Giercuszkiewicz-Bajtlik, M. Forecasting of changes of standing water quality. Inst. Ochr. Sr. 1990, 74. (In Polish) [Google Scholar]
- Wagner-Lotkowska, I. Influence of the Selected Climatic, Hydrological and Biological Factors on Eutrophication Processes and Symptoms in the Sulejów Reservoir. Ph.D. Thesis, University of Lodz, Lodz, Poland, 2002. [Google Scholar]
- Izydorczyk, K.; Jurczak, T.; Wojtal-Frankiewicz, A.; Skowron, A.; Mankiewicz-Boczek, J.; Tarczyńska, M. Influence of abiotic and biotic factors on microcystis content in Microcystis aeruginosacells in a eutrophic temperate reservoir. J. Plankton Res. 2008, 30, 393–400. [Google Scholar] [CrossRef]
- Izydorczyk, K.; Frątczak, W.; Drobniewska, A.; Cichowicz, E.; Michalska-Hejduk, D.; Gross, R.; Zalewski, M. A biogeochemical barrier to enhance a buffer zone for reducing diffuse phosphorus pollution –preliminary results. Ecohydrol. Hydrobiol. 2013, 13, 104–112. [Google Scholar] [CrossRef]
- Michna, A. 35 years of the Sulejów Reservoir exploitation. Gospod. Wodna 2008, 12, 481–484. (In Polish) [Google Scholar]
- Central Statistical Office. State and Environmental Protection; Central Statistical Office: Warsaw, Poland, 2012.
- Pawlik-Dobrowolski, J. Catchment of Raba River, as an alimentation area, and pollutants for storage reservoir in Dobczyce. Monogr. Crac. Univ. Technol. Crac. 1993, 2, 135–155. (In Polish) [Google Scholar]
- Kabzinski, A.K.M.; Grabowska, H. Investigation into effectiveness of elimination of cyjanobacterial toxins in the process of water treatment in the productive transferring system Sulejów-Łódź. Gospod. Wodna 2003, 3, 109–118. (In Polish) [Google Scholar]
- Absalon, D.; Matysik, M.; Woźnica, A.; Łozowski, B.; Jarosz, W.; Ulańczyk, R.; Babczyńska, A.; Pasierbiński, A. Multi-Faceted Environmental Analysis to Improve the Quality of Anthropogenic Water Reservoirs (Paprocany Reservoir Case Study). Sensors 2020, 20, 2626. [Google Scholar] [CrossRef]
- Ziemińska-Stolarska, A.; Skrzypski, J. Review of Mathematical Models of Water Quality. Ecol. Chem. Eng. 2012, 19, 197–211. [Google Scholar] [CrossRef] [Green Version]
Figure 1.
(A,C) Localization (B) Morphological differentiation of the Sulejów Reservoir along the longitudinal axis.
Figure 1.
(A,C) Localization (B) Morphological differentiation of the Sulejów Reservoir along the longitudinal axis.

Figure 2.
The refined grid used for performing the numerical modeling of the Sulejów Reservoir.

Figure 3.
The stationary system for water quality and meteorological measurements, installed on the Sulejów Reservoir (Buoy 1—dam; Buoy 2—Zarzęcin Village).
Figure 3.
The stationary system for water quality and meteorological measurements, installed on the Sulejów Reservoir (Buoy 1—dam; Buoy 2—Zarzęcin Village).

Figure 4.
Profiles of the points where flow velocity was measured using an ADCP current profiler.

Figure 5.
Current speed (cm/s) measured using the ADCP current profiler (orange bars) and modeled using the GEMSS model (blue bars) for September 2015.
Figure 5.
Current speed (cm/s) measured using the ADCP current profiler (orange bars) and modeled using the GEMSS model (blue bars) for September 2015.

Figure 6.
Temperature distribution over the year 2015. The simulated values are marked red, blue line refers to data obtain from the buoy deployed near Zarzęcin Village (Buoy 2—Figure 3).
Figure 6.
Temperature distribution over the year 2015. The simulated values are marked red, blue line refers to data obtain from the buoy deployed near Zarzęcin Village (Buoy 2—Figure 3).

Figure 7.
Simulated and measured phosphate-phosphorus (PO4-P) concentrations for two locations in the Sulejów Reservoir in 2015.
Figure 7.
Simulated and measured phosphate-phosphorus (PO4-P) concentrations for two locations in the Sulejów Reservoir in 2015.

Figure 8.
Simulated and measured nitrate-nitrogen (NO3-N) concentrations for two locations in the Sulejów Reservoir in 2015.
Figure 8.
Simulated and measured nitrate-nitrogen (NO3-N) concentrations for two locations in the Sulejów Reservoir in 2015.

Figure 9.
Simulated and measured chlorophyll-a concentrations for two locations in the Sulejów Reservoir in 2015.
Figure 9.
Simulated and measured chlorophyll-a concentrations for two locations in the Sulejów Reservoir in 2015.

Figure 10.
Results of cyanobacteria and other algae simulations for 2015.

Figure 11.
Simulated horizontal distribution of algae concentrations for the Sulejów Reservoir in 2015: (A)—April, (B)—June (C)—July, (D)—August, (E)—September, (F)—October.
Figure 11.
Simulated horizontal distribution of algae concentrations for the Sulejów Reservoir in 2015: (A)—April, (B)—June (C)—July, (D)—August, (E)—September, (F)—October.

Figure 12.
50% reduction in the inflow of (A)—PO4-P (mg/L), (B)—chlorophyll-a (chla µg/l), and (C)—nitrate-nitrogen (NO3-N (mg/L) to the reservoir, both from point and area sources, leads to a significant decrease in the level of these substances in the reservoir waters and, consequently, to a reduction in water blooms.


Table 1.
The basic morphological and hydrological parameters of the Sulejów Reservoir [54].
Table 1.
The basic morphological and hydrological parameters of the Sulejów Reservoir [54].
| Parameter | Value |
|---|---|
| Surface area (ha) | 2.380 |
| Length of shoreline (km) | 46.875 |
| Shoreline development index | 8.64 |
| Total volume of the reservoir (million m3) | 75 |
| Usable capacity (million m3) | 61.7 |
| Dead storage capacity (million m3) | 15.7 |
| Flood volume (million m3) | 9 |
| Average depth (m) | 3.2 |
| Maximum depth (m) | 11 |
| Length of the reservoir (km) | 17 |
| Characteristic flows in the cross-section | |
| Q0.1% (m3/s) | 792 |
| Q0.02% (m3/s) | 952 |
| Q1% (m3/s) | 560 |
| Q10% (m3/s) | 324 |
| Q50% (m3/s) | 127 |
| Qavg (m3/s) | 30.2 |
| Q flow rate (m3/s) | 11.08 |
| Maximum flow through weirs (m3/s) | 450 |
| Flow through the bottom outlets (m3/s) | 24 |
Table 2.
Variables and coefficients used in the WASP model.
| Parameter | Description | Value | Unit | Min. | Max. |
|---|---|---|---|---|---|
| Ke_a | Background nonalgal light extinction | 0.336 | 1/m | 0 | 4 |
| Ke_b | Coefficient for chlorophyll for light extinction | 0.0365 | 1/m(µgA/L) | 0 | 0.054 |
| Ke_c | Exponent for chlorophyll for light extinction | 0.64 | No unit | 0 | 1 |
| anc | Nitrogen to carbon ratio | 0.25 | gN/gC | 0 | 0.25 |
| k71 | Organic nitrogen mineralization rate | 0.01 | 1/day | 0.01 | 0.15 |
| th71 | Temperature coefficient | 1.08 | No unit | 0 | 1.08 |
| k12 | Nitrification rate | 0.13 | 1/day | 0.09 | 0.13 |
| th12 | Temperature coefficient | 1.08 | No unit | 0 | 1.08 |
| knit | Half-saturation constant for oxygen limitation | 1 | gO2/m3 | 0 | 2 |
| kmnc | Half-saturation constant for nitrogen mineralization | 0.5 | gC/m3 | 0 | 1 |
| k2d | Denitrification rate @ 20 °C | 0.1 | 1/day | 0.09 | 0.16 |
| th2d | Temperature coefficient | 1.08 | No unit | 0 | 2 |
| kno3 | Michaelis constant for denitrification | 0.1 | gO2/m3 | 0.1 | 0.1 |
| apc | Phosphorus to carbon ratio | 0.025 | gP/gC | 0.025 | 0.025 |
| k83 | Dissolved organic phosphorus mineralization @ 20 °C | 0.04 | 1/day | 0.1 | 0.3 |
| th83 | Temperature coefficient | 1.08 | No unit | 0 | 1.08 |
| kmpc | Half-saturation constant for phosphorus mineralization | 8 | gC/m3 | 1 | 10 |
| plc | Phosphorus limiting switch | 1 | No unit | ||
| c2chla_d | Ratio of carbon to chlorophyll-a | 100 | No units | 10 | 100 |
| rins_d | Saturating light intensity | 150 | cal/m2/day | 110 | 200 |
| kmn_d | Half-saturation constant for nitrogen | 0.01 | gN/m3 | 0.001 | 0.025 |
| ZPGMode_d | Zooplankton grazing mode | 1 | No unit | 0 | 2 |
| kgmicro_d | Grazing rate due to microzooplankton | 0 | 1/day | 0 | 0.08 |
| kgmacro_d | Grazing rate due to macrozooplankton | 0 | 1/day | 0 | 0.101 |
| thkt_d | Temperature coefficient | 1.045 | No unit | 1.045 | 1.045 |
| k1d_d | Death rate | 0.05 | 1/day | 0.015 | 0.2 |
Table 3.
Concentrations of biogenic compounds from point and diffuse sources used in the GEMSS model.
Table 3.
Concentrations of biogenic compounds from point and diffuse sources used in the GEMSS model.
| Biogenic Compound | Arable Land | Forest Area | Urban Area | Septic Tanks | WWTP |
|---|---|---|---|---|---|
| Unit | mg/L | mg/L | mg/L | mg/L | mg/L |
| Total Phosphorus | 0.19 | 0.005 | 100 | 0.5 | 0.14 |
| Total Nitrogen | 3 | 0.3 | 700 | 4 | 2 |
Table 4.
Land area and population density in the Sulejów Reservoir catchment.
| Catchment | Area | Water Flow | Arable Land | Forest Area | Urban Area | Population Density | Septic Tanks | WWTP |
|---|---|---|---|---|---|---|---|---|
| Unit | km2 | m3/s | km2 | km2 | km2 | person | person | person |
| Sulejów River upper part | 2545.2 | 15.5 | 1614.7 | 886.7 | 43.8 | 310,514 | 127,311 | 193,203 |
| Sulejów River lower part | 1390.5 | 6.8 | 652.7 | 699.8 | 38.0 | 222,480 | 91,217 | 131,263 |
| Pilica + Sulejów Reservoir | 997.5 | 4.9 | 633.9 | 307.3 | 56.3 | 296,258 | 121,466 | 174,792 |
| Total Sulejów Reservoir catchment | 4933.2 | 27.2 | 2901.3 | 1893.9 | 138.0 | 829,252 | 339,993 | 489,259 |
Table 5.
Total phosphorus—yearly loads in the Sulejów Reservoir catchment.
| Catchment | Arable Land-Load | Forest Area-Load | Urban Area-Load | Septic Tank-Load | WWTP-Load | Total | Concentration |
|---|---|---|---|---|---|---|---|
| Unit | ton | ton | ton | ton | ton | ton | mg/L |
| Sulejów River upper part | 59.0 | 0.9 | 2.2 | 25.6 | 63.7 | 151.4 | 0.31 |
| Sulejów River lower part | 19.2 | 0.5 | 1.9 | 18.4 | 45.6 | 85.6 | 0.40 |
| Pilica + Sulejów Reservoir | 18.6 | 0.2 | 2.8 | 24.5 | 60.7 | 106.8 | 0.69 |
| Total Sulejów Reservoir catchment | 96.8 | 1.6 | 6.9 | 170 | 68.5 | 343.8 | 0.40 |
Table 6.
Total nitrogen—yearly loads in the Sulejów Reservoir catchment.
| Catchment | Arable Land-Load | Forest Area-Load | Urban Area-Load | Septic Tank-Load | WWTP-Load | Total | Concentration |
|---|---|---|---|---|---|---|---|
| Unit | ton | ton | ton | ton | ton | ton | mg/L |
| Sulejów River upper part | 932 | 51 | 15 | 509 | 366 | 1874 | 3.83 |
| Sulejów River lower part | 303 | 32 | 13 | 365 | 263 | 976 | 4.54 |
| Pilica + Sulejów Reservoir | 294 | 13 | 20 | 486 | 350 | 1162 | 7.54 |
| Total Sulejów Reservoir catchment | 1528 | 97 | 48 | 1360 | 979 | 4012 | 4.67 |
Publisher’s Note: MDPI stays neutral with regard to jurisdictional claims in published maps and institutional affiliations. |
© 2021 by the authors. Licensee MDPI, Basel, Switzerland. This article is an open access article distributed under the terms and conditions of the Creative Commons Attribution (CC BY) license (http://creativecommons.org/licenses/by/4.0/).
Share and Cite
MDPI and ACS Style
Ziemińska-Stolarska, A.; Kempa, M. Modeling and Monitoring of Hydrodynamics and Surface Water Quality in the Sulejów Dam Reservoir, Poland. Water 2021, 13, 296. https://doi.org/10.3390/w13030296
AMA Style
Ziemińska-Stolarska A, Kempa M. Modeling and Monitoring of Hydrodynamics and Surface Water Quality in the Sulejów Dam Reservoir, Poland. Water. 2021; 13(3):296. https://doi.org/10.3390/w13030296
Chicago/Turabian StyleZiemińska-Stolarska, Aleksandra, and Magdalena Kempa. 2021. "Modeling and Monitoring of Hydrodynamics and Surface Water Quality in the Sulejów Dam Reservoir, Poland" Water 13, no. 3: 296. https://doi.org/10.3390/w13030296
Note that from the first issue of 2016, this journal uses article numbers instead of page numbers. See further details here.