Article

Using Integrated Hydrological Models to Assess the Impacts of Climate Change on Discharges and Extreme Flood Events in the Upper Yangtze River Basin

1
Department of Geography and Spatial Information Techniques, Ningbo University, Ningbo 315211, China
2
Ningbo Universities Collaborative Innovation Center for Land and Marine Spatial Utilization and Governance Research, Ningbo University, Ningbo 315211, China
3
Institute of East China Sea, Ningbo University, Ningbo 315211, China
4
Ningbo Research Center for Urban Environment, Chinese Academy of Sciences, Ningbo 315800, China
5
Department of Physical Geography and Ecosystem Science, Lund University, S-22362 Lund, Sweden
*
Author to whom correspondence should be addressed.
Water 2021, 13(3), 299; https://doi.org/10.3390/w13030299
Submission received: 2 January 2021 / Revised: 19 January 2021 / Accepted: 19 January 2021 / Published: 26 January 2021
(This article belongs to the Special Issue Integrated Ecohydrological Models and Aquatic Ecosystem Management)

Abstract

:
Amongst the impacts of climate change, those arising from extreme hydrological events are expected to cause the greatest impacts. To assess the changes in temperature and precipitation and their impacts on the discharge in the upper Yangtze Basin from pre-industrial to the end of 21st century, four hydrological models were integrated with four global climate models. Results indicated that mean discharge was simulated to increase slightly for all hydrological models forced by all global climate models during 1771–1800 and 1871–1900 relative to the 1971–2000 reference period, whereas the change directions in mean discharge were not consistent among the four global climate models during 2070–2099, with increases from HadGEM2-ES and MIROC5, and decreases from GFDL-ESM2M and IPSL-CM5A-LR. Additionally, our results indicated that decreases in precipitation may always result in the decrease in mean discharge, but increases in precipitation did not always lead to increases in discharge due to high temperature rise. The changes in extreme flood events with different return intervals were also explored. These extreme events were projected to become more intense and frequent in the future, which could have potential devastating impacts on the society and ecosystem in this region.

1. Introduction

Every year, extreme hydrological events cause enormous suffering, economic, and often catastrophic environmental damage throughout the world. Droughts, for example, cause famine and wildfires in Australia and North America, whilst in Asia, summer flooding frequently ruins millions of dollars of agricultural investment and displaces large numbers of humans. Among various hydrometeorological hazards, floods are identified as the most destructive hazards in the world [1,2,3,4]. The Emergency Events Database has recorded 3062 severe floods, which alone accounts for 47% of all weather-related disasters worldwide during 1995–2015 [5]. These floods have affected 2.3 billion people and caused 157,000 deaths. China is a place prone to flood damage due to its complex geography and climate [6,7]. In July 2020, for example, flooding has caused an estimated US$25 billion of impacts in China [8]. Understanding the hydrological impacts of these climate changes is thus essential if policymakers are to be successful in averting future, recurring disasters. Climate change as a result of enhanced greenhouse effect from human activities has direct influences on temperature at global and regional scale. Global mean temperature has increased by approximately 1 °C compared to pre-industrial levels in 2017, increasing at 0.2 °C per decade [9]. The high temperature will result in the enhanced evaporation and the increased capacity of the atmosphere to hold water [10,11]. Therefore, climate change has the potential to profoundly change the hydrological cycle and the global and regional precipitation patterns, which may increase the probability of floods and drought, posing huge challenges to sustainable water resources management and planning [12,13]. Evidence from historic climatological data and climate model projection indicated that climate change in recent decades was expected to be an ongoing trend in the future [14]. Therefore, there is an urgent need to explore the climate change and its impact on hydrological cycles and water resources by integrating the climate model data with hydrological models (HMs).
Climatic changes during the past century and in the future over the river basins have been widely investigated, and results show that annual mean temperatures have significantly increased across most river basins in the world, including an increased frequency and intensity of temperature extreme and heat waves [15,16,17]. Climate projections indicated that mean and extreme temperatures over most river basins would likely continue to increase [18]. Although the directions of temperature change are generally consistent across most river basins, their magnitudes varied. Change patterns in precipitation varied among different river basins, but most of them were expected to experience more severe and frequent extreme precipitation over the past century and in future, even over basins where there had a reduction or no change in mean precipitation [19,20]. The significant climatic changes in the upper Yangtze River Basin (UYRB) have also been found. In the last century, the UYRB has experienced significant climate change, with increasing trends in mean and extreme temperature, and extreme precipitation, but little change in mean precipitation [15,21,22]; such changes have led to changes in its hydrological cycle and water resources. Results from climate models also indicated that the warmer climate was projected to continue for the 21st century in the UYRB [23,24]. There is no consistent pattern of future change in precipitation by current studies, for example, mean precipitation was projected to increase under all RCP scenarios by Su et al. (2017), while the decreasing trend was detected by Wang et al. (2015). These changes in temperature and precipitation over global river basins have implications for the water availability and the frequency and severity of extreme hydrologic events [14,23].
Climate projections have been integrated with HMs to estimate the potential effects of climatic changes on water resources in many previous studies. For example, Givati et al. (2019) used an ensemble of regional climate models as input to a GR6J daily hydrological model to project future streamflow at the upper Jordan River. They found the decrease in streamflow in the future can be explained by the decrease in precipitation. Ficklin et al. (2013) assessed the impacts of projected 21st century climatic changes from 16 global climate models (GCMs) in the Upper Colorado River Basin using the SWAT model, and found continued rising temperatures may likely cause a decline in water availability over this region. Nohara et al. (2006) found that discharge was projected to decrease during the 21st century for the rivers in Europe to the Mediterranean region (Danube, Euphrates, and Rhine), and the southern United States (Rio Grande), using the Global River flow model and 19 GCMs under the A1B emission scenario. The potential hydrologic process responses to climatic changes have also been estimated throughout the Yangtze River Basin (YRB) by many previous studies [23,25]. Based on the outputs from the Canadian Global Coupled Model and the WetSpass hydrological model, Wang et al. (2015) assessed monthly water resource distributions and river discharges over the UYRB and found that the reduction of precipitation lead to the decrease in runoff under scenarios A2 and B2 in 21st century. Bian et al. (2017) found that simulation used a distributed hydrological soil vegetation model with monthly outputs from six GCMs under three RCP scenarios and indicated that the seasonal mean streamflow was predicted to increase in the source region of the Yangtze River. In general, the climate change and its effect on streamflow differed across the globe [14]. Therefore, the climate change impacts need to be assessed at regional and local scales.
Although many previous studies documented climate models and HMs to simulate climate change and assess hydrologic responses to climate change over the YRB, the exact characteristics of such change and its impacts on mean and extreme hydrological events under different climate change conditions throughout the UYRB remain poorly known. In this study, we made use of multiple GCMs and HMs to evaluate changes in temperature and precipitation under different scenarios and to further explore the responses of mean and extreme discharges to them from a more comprehensive time span (pre-industrial to end of 21st century) with improved methodologies compared to existing studies. First, most previous studies focused on either a single hydrological model or a single climate model to simulate discharge changes. However, there is a strong influence of the selected GCM and HM on the simulated discharge under the climate change scenarios [26]. In this study, in order to reduce the uncertainties of both of the HMs and GCMs and assess the range of possible changes in discharge, four HMs and four GCMs from CMIP5 were applied to simulate the discharge over the UYRB. In addition, all four GCMs were statistically downscaled to obtain fine-resolution climate variables to force HMs. Second, most existing studies of climate change impacts assessment on hydrological processes of YRB focused on coarse temporal scale (seasonal or monthly). In this study, daily scale discharge was simulated by each of the four HMs, based on the daily input times series from each of four GCMs. Then, changes in mean discharge and extreme flood events were explored in this study. The frequency analysis was applied to annual maximum daily discharge time series to model the likely impacts of climate change on extreme flood events with different return intervals. Third, based on the temperature and precipitation projections from climate models, many previous studies applied the outputs to HMs for predicting future discharges in the 21st century under different climate change scenarios. In addition to the impact assessment of climate change on the discharge over the UYRB during the period of 2070–2099 (future period) under the RCP2.6, RCP4.5, and RCP8.5 scenarios, we assess the impacts during the period of 1771–1800 (pre-industrial period) under a pre-industrial control (piControl) scenario, and during the period of 1871–1900 (historical period) and the period of 1971–2000 (reference period) under a historical scenario with historical CO2 concentration. The major objectives of this study are to:
(1)
Calibrate and validate the four different HMs for simulating daily discharges at Cuntan station within the UYRB.
(2)
Simulate and project the changes in temperature and precipitation over the UYRB using the four GCMs from CMIP5 for the years of 1771–1800, 1871–1900, and 2070–2099, relative to the reference period 1971–2000.
(3)
Assess the responses of mean discharge at Cuntan station within the UYRB to climate change using the four HMs during all time periods relative to 1971–2000.
(4)
Evaluate the changes in extreme flood events with different interval return periods during all time periods relative to 1971–2000.

2. Data and Methodology
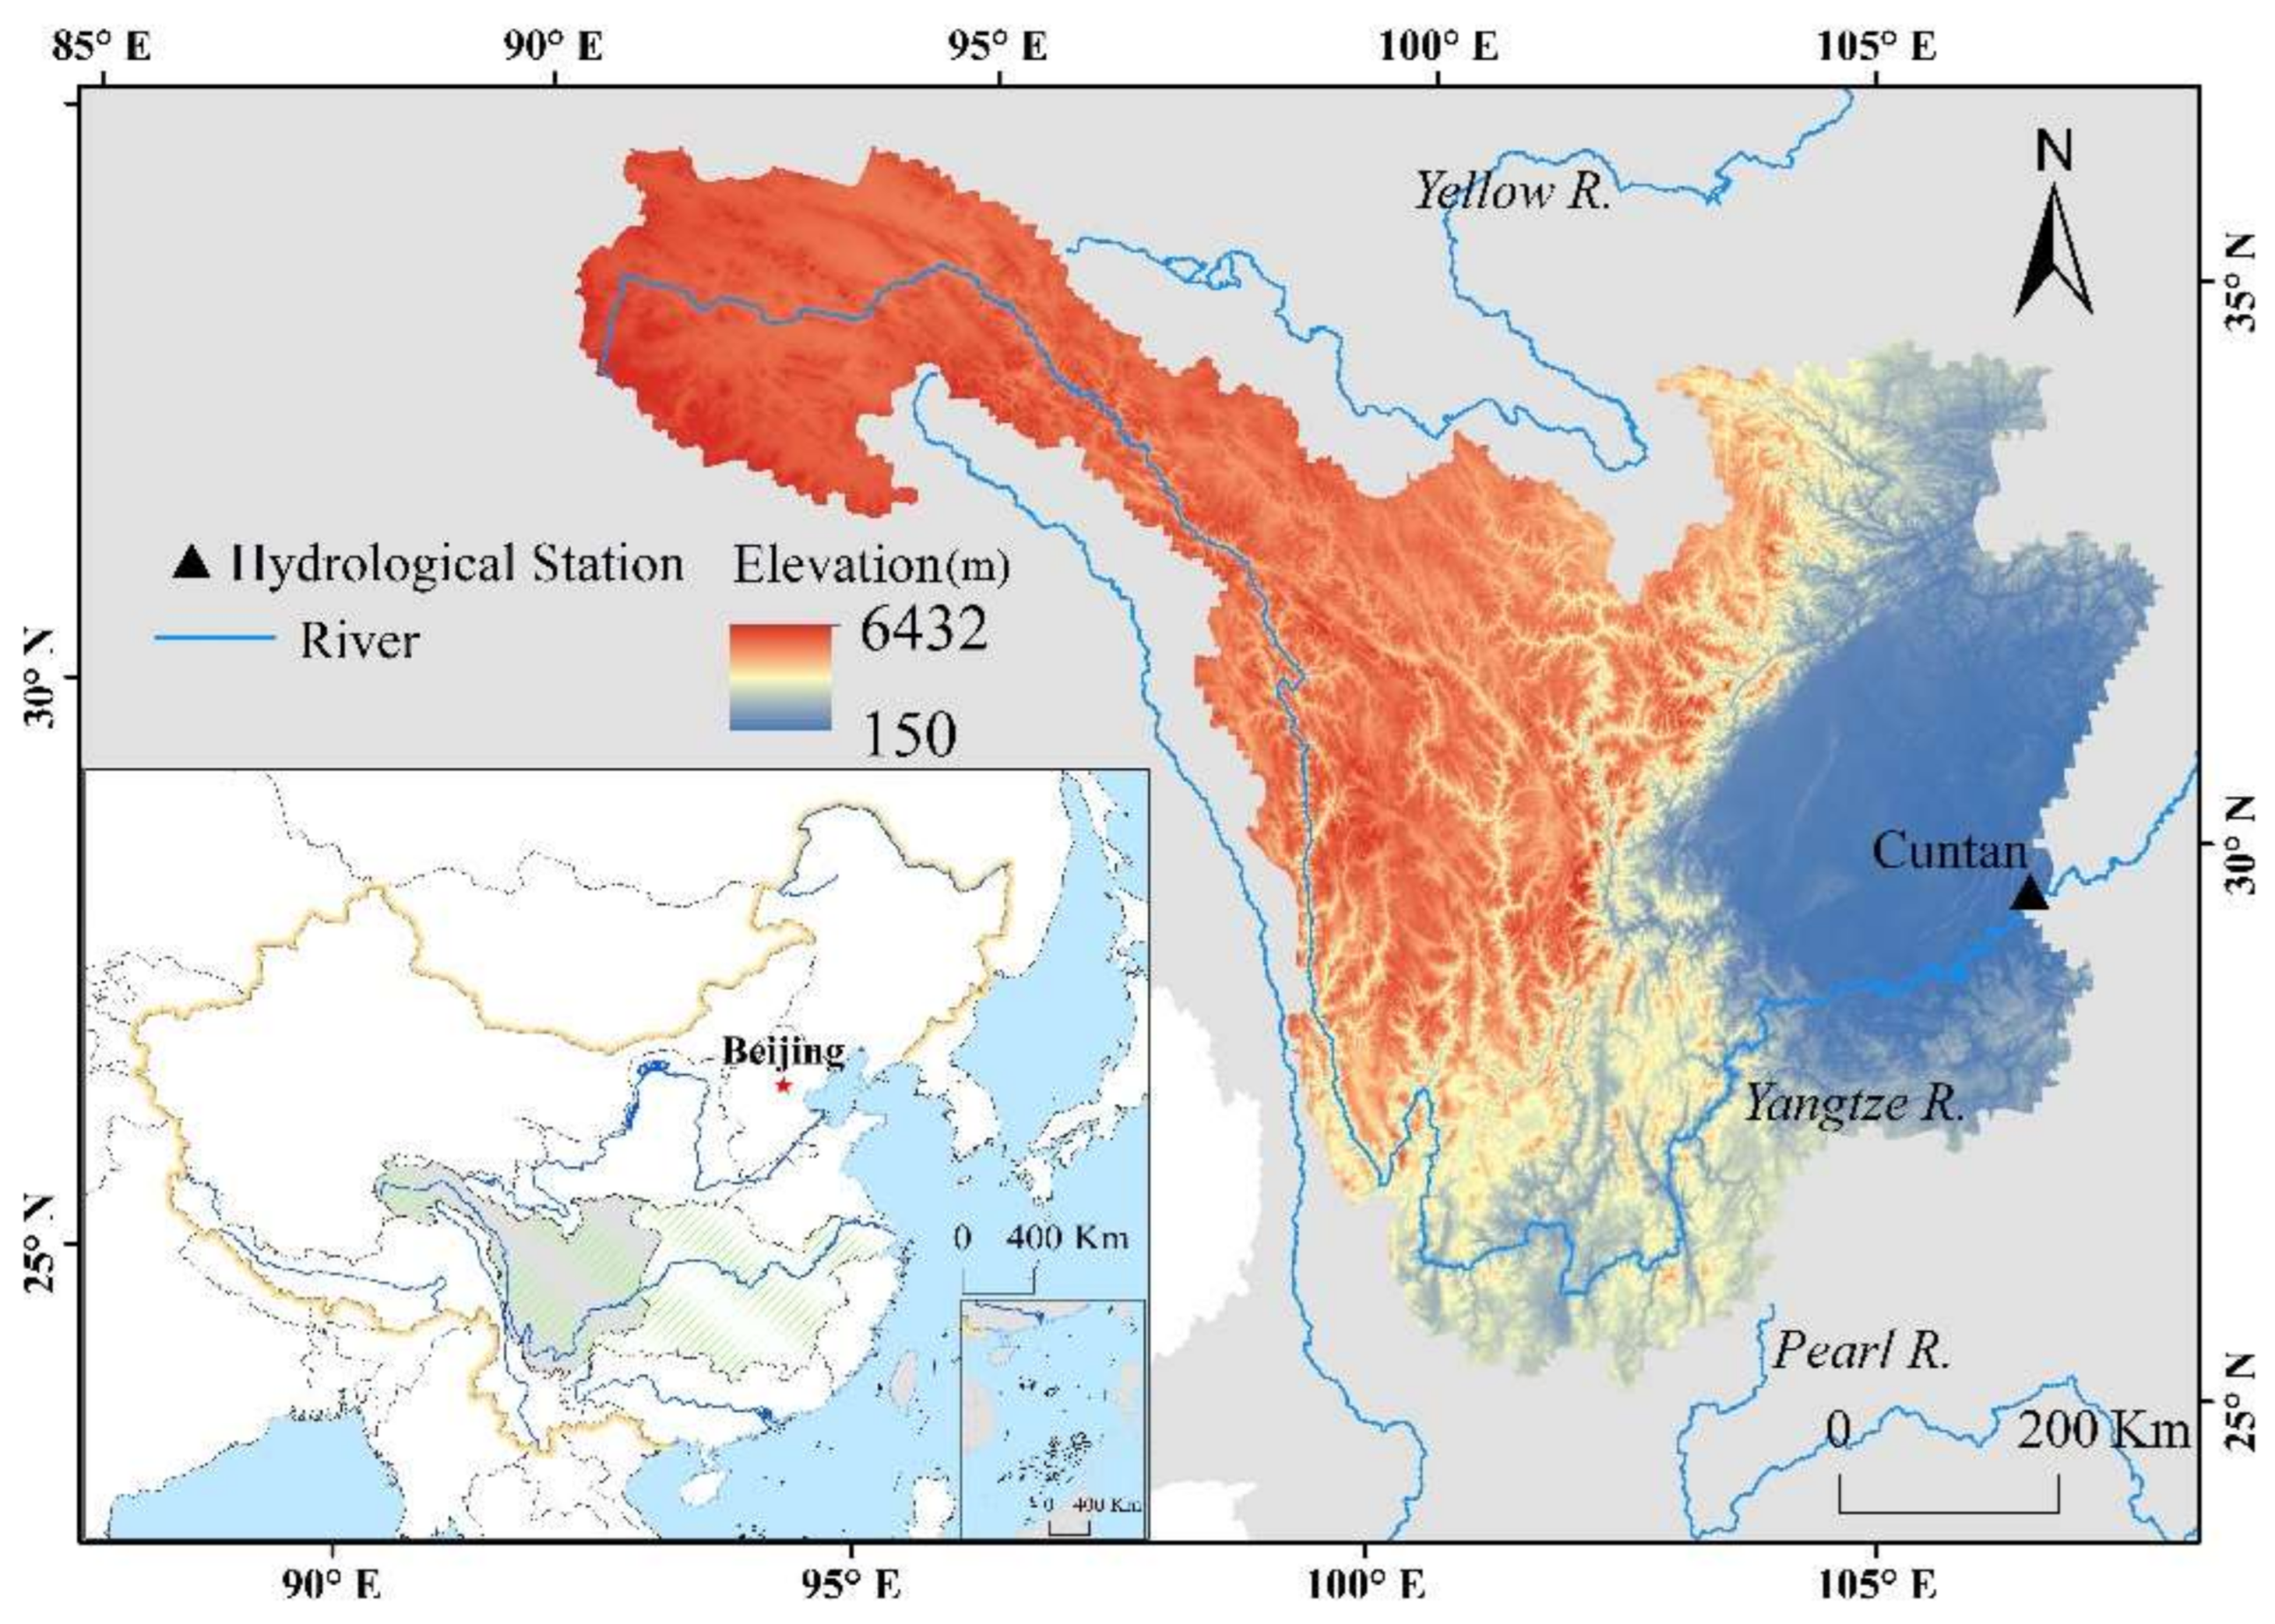
2.1. Study Area

Weather-related disasters are becoming increasingly frequent under a warmer climate. The Yangtze River, playing a vital role in the economic development of China, has experienced numerous destructive floods throughout history [27]. Meanwhile, YRB is one of the most important agricultural and industrial regions in China, and the relatively dense population and large cities along the river make the floods more deadly and costly. This study focuses on the upstream of the Cuntan hydrological gauging station (29°37′ N, 106°36′ E), which is considered as the UYRB with a drainage area of approximately 8.6 × 10⁵ km2 (Figure 1). The UYRB originates from the Tibetan Plateau and is located in the west highland geographical region of China, which is characterized with complex terrains. The study area is influenced by both the southeast and southwest monsoons and the Tibetan Plateau, therefore it is very sensitive to the climate change. It has abundant water resources and provides more than 80% of the river flow to the Three Gorges Project, but with distinctive annual and seasonal variabilities. Flooding along the river has always been a major problem in this region, particularly during the monsoon season from May to September. It has experienced increasing flood events in recent years.

2.2. Data

In this study, we used the observed daily meteorological data for over 189 stations throughout UYRB for the period 1961–2018 obtained from the National Climate Center of the China Meteorological Administration (CMA). The dataset was quality controlled by considering changes in instrument type, station relocations, and trace biases. The daily discharge data for the period 1961–2010 at the Cuntan station, the outlet of the UYRB, were derived from the China Hydrological Year book—Yangtze. In this study, daily discharge data from 1971 to 1990 were used for calibration and validation of the four HMs.
The climate data from four GCMs (GFDL-ESM2M, HadGEM2-ES, IPSL-CM5A-LR, and MIROC5) from pre-industrial to the end of the 21st century under different scenarios were used as climatic inputs to the calibrated HMs (Table 1). These models included both pre-industry and retrospective 20th century climate simulations and 21st century climate projections under the three RCP scenarios. The daily precipitation and temperature from GCM outputs for the years 1771–1800 (pre-industrial period), 1871–1900 (historical period), and 2070–2099 (future period) were compared against 1971–2000 (reference period). The climate simulations during pre-industrial period was under a pre-industrial control (piControl) scenario with a climate with natural variability under stable CO2 concentration of 286 ppm, and during the historical period and reference period were under a historical scenario with historical CO2 concentration; the climate future projections is under four emission scenarios: RCP2.6, RCP4.5, RCP6.0, and RCP8.5. The use of multiple models and scenarios provided more quantitative information about the impact of climate change on discharge and flooding. The four GCMs have a resolution between 1.25° and 3.75°. To facilitate comparison, all four climate model data were statistically downscaled and bias corrected on a regular 0.5° × 0.5° resolution grid using a first-order conservative remapping scheme [28,29].
The digital elevation model with a resolution of 90 m from the Shuttle Radar Topography Mission database was used in this study. The data were used to delineate the watershed boundaries and to generate the river basin networks. The soil property data were obtained from the Harmonized World Soil Database of the Food and Agriculture Organization of the United Nations (http://www.fao.org/), and the spatial distribution of soil types (1:1,000,000) was taken from the Institute of Soil Science of the Chinese Academy of Sciences. A land use map (1:1,000,000) for 1990 was provided by the Data Center for Resource and Environmental Sciences of the CAS, and this land use map was applied in all time periods.

2.3. Methods

2.3.1. Hydrological Models and Model Calibration

The HMs used in this study were HBV, SWAT, SWIM, and VIC, which were used extensively in studies of the climate change impact on discharge and water resource [30,31,32,33,34]. These four HMs were used in this study to simulate discharge at the Cuntan hydrological station within the UYRB. The years 1971–1980 were considered for calibration and years 1981–1990 were used to validate the models. An automated calibration technique named univariate search technique was used to calibrate the parameters of the four HMs, which has been widely used in previous studies [35,36]. Model simulations were evaluated by the Nash–Sutcliffe efficiency (NSE), the percent bias (PBIAS, %) and the coefficient of determination (R2). The NSE is a normalized statistic that determines the relative magnitude of the residual variance between the observed data and simulated data, which ranges between −∞ and 1 [37]. Its optimal value is 1. The PBIAS measures the average tendency of the simulated data to be larger or smaller than the corresponding observed data [38]. The optimal value of PBIAS is 0.0, with low values indicating accurate model simulation. R2 describes the trend similarity between the simulated data and measured data [39]. It ranges from 0 to 1, with higher values indicating better model performance. A good simulation result will have NSE and R2 close to 1, and PBIAS close to 0. The flow chart for the hydrological modelling process was shown in Figure S1. A complete description of these four HMs and the calibration procedure can be found in our previous paper [36].
Several recent studies have explored the land use and land cover changes (LULCC) resulting from climate changes and other human activities’ effects on the watershed hydrology [40,41,42], and found that their effects on hydrological processes need to be considered at the appropriate watershed scale [43,44]. Blöschl et al. (2007) indicated that LULCC impacts can only be verified at small-scale watersheds with areas up to some tens of square kilometers, and the impacts are difficult to verify at large-scales because of long time lags between cause and effect. Bi et al. (2014) suggested that large watersheds exhibit a relatively high buffering capacity that diminishes the effects of LULCC. UYRB, the study area in this study, is a large scale basin with drainage area approximately 8.6 × 10⁵ km2. Therefore, this study did not consider the LULCC here following other previous studies [25,30,36]. We assumed constant land use/land cover throughout the 21st century, as we modeled the upper and more remote regions of the YRB only.

2.3.2. Flood Frequency Analysis

Understanding the magnitude and frequency of extreme hydrological events over river basins is important for the estimation of potential floods, management of water resources and proper hydraulic design, and risk assessment and management of hydrometeorological disasters. Flood frequency analysis was the common approach to estimate the probability distribution of extreme events, which was usually fit to the block maxima (minima) series [13,20]. In most situations, it is customary and convenient to use the annual maxima (minima). WMO (2009) suggested that a distribution with three parameters was preferred because they make the distribution match available data more consistently. Generalized Logistic distribution (GLO) was a 3-parameters distribution, which was one of the most frequently used distributions in flood frequency analysis and widely used for flood frequency analysis around the world [45,46,47]. In this study, the GLO was fit to the annual maxima discharge series at Cuntan station within the UYRB to establish the magnitudes of extreme flood events with the return intervals of 5, 10, 20, 50, and 100 years for each time periods.

3. Results

3.1. Hydrological Simulations

Table 2 shows the calibration and validation efficiencies of the four different HMs (HBV, SWAT, SWIM, VIC) for the simulation of daily discharge at Cuntan station. For the statistics such as NSE and PBIAS, Moriasi et al. (2007) suggested that the performance of the model simulation can be classified into four categories: Unsatisfactory (NSE ≤ 0.50; PBIAS ≥ ±25%), satisfactory (0.50 < NSE ≤ 0.65; ±30% ≤ PBIAS < ±55%), good (0.65 < NSE ≤ 0.75; ±15% ≤ PBIAS < ±30%), and very good (NSE > 0.75; PBIAS < ±15%). This criterion has been widely used in previous studies to evaluate the model performance [39,48]. The performance of the model can be judged as satisfactory if R2 value is > 0.6, as suggested by Benaman et al. (2005). According to these criteria used in previous studies, the model efficiency statistics for the four HMs in this study indicate the good (up to very good) performance of calibration and validation with NSE value > 0.71, ±18.82% ≤ PBIAS ≤ ±25.10%, and R2 > 0.80. The specific NSE, PBIAS, and R2 values varied among the four HMs. During the calibration period, the NSE and R2 values were 0.81 and 0.86 for HBV, 0.81 and 0.81 for SWAT, 0.86 and 0.85 for SWIM, and 0.74 and 0.94 for VIC, respectively. The PBIAS value was lower for HBV (0.40) and SWAT (6.61), but much higher for SWIM (25.10) and VIC (−18.82). We should note that the optimal PBIAS value is 0, and negative (positive) values indicate overestimation (underestimation) bias in the discharge simulation. During the validation period, the NSE and R2 values for all four HMs were lower than these during the calibration period, but were still all higher than 0.71 and 0.80, respectively. The NSE value was 0.76 for HBV, 0.79 for SWAT, and 0.77 for SWIM, and the lowest value was also found for VIC (0.71). The R2 value was 0.85 for HBV, 0.80 for SWAT, and 0.83 for SWIM, and the highest value was also found for VIC (0.92). The PBIAS value for all four HMs were lower than these during the calibration period, with 1.07 for HBV, 2.00 for SWAT, 19.72 for SWIM, and −9.88 for VIC. In general, we can see that these four HMs can capture the daily discharge at Cuntan station.

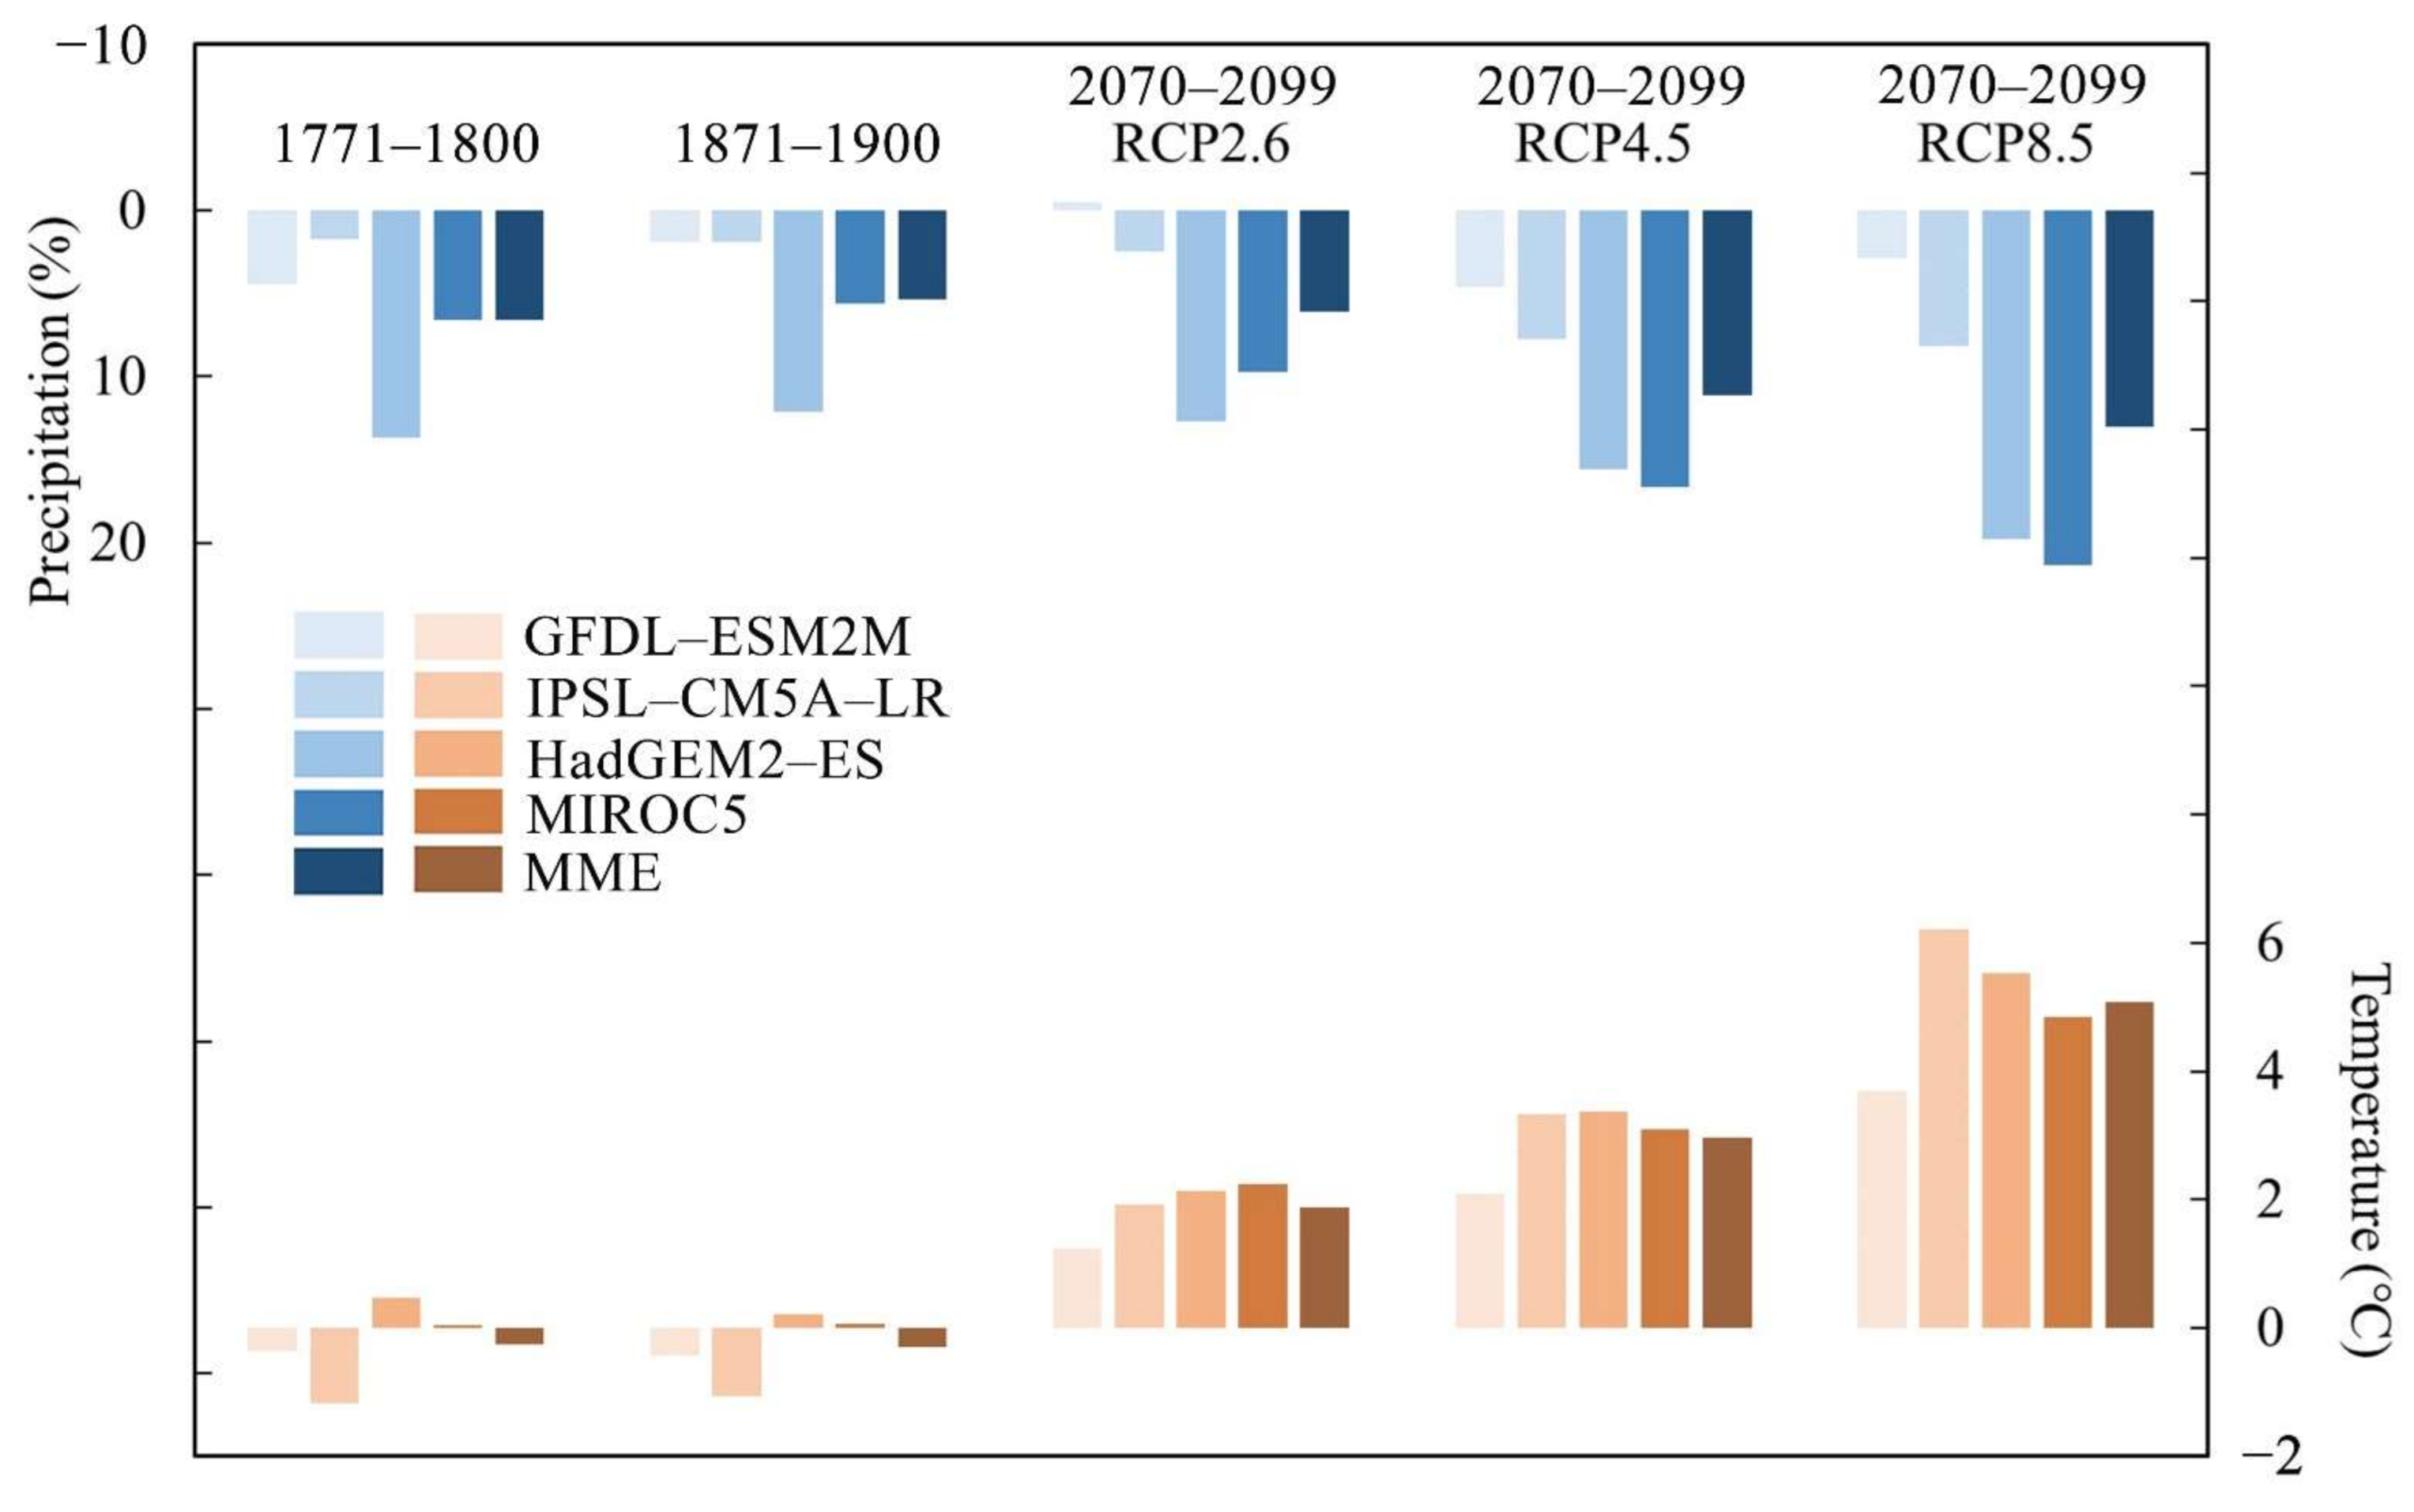
3.2. Changes in Precipitation and Temperature

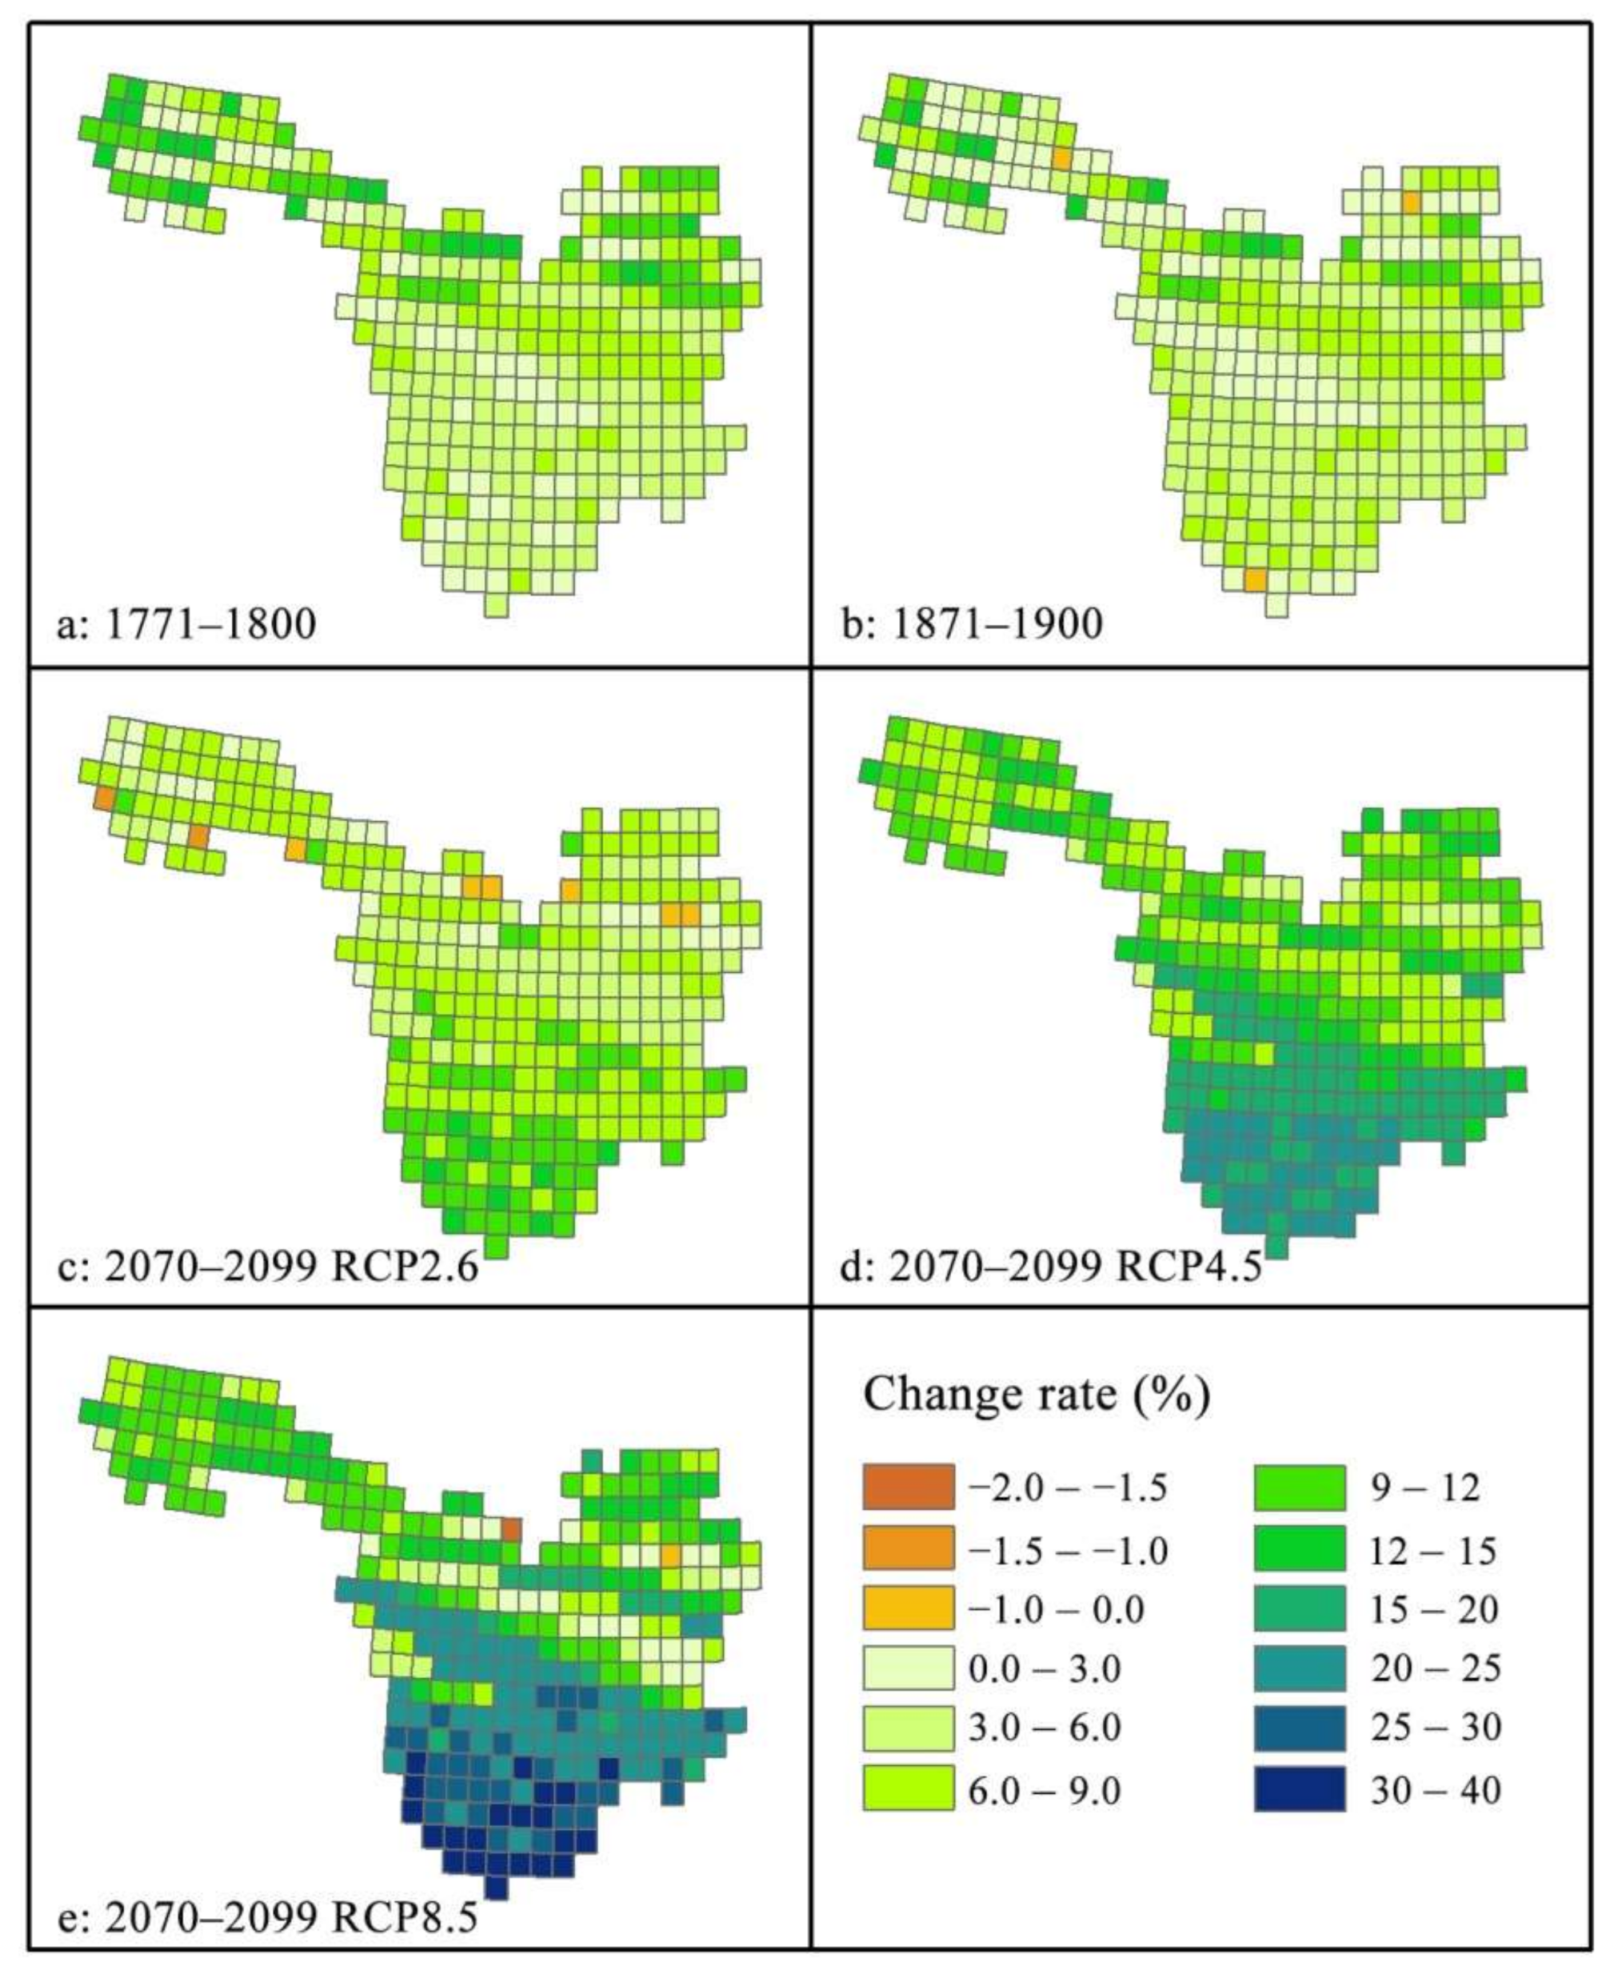
3.2.1. Precipitation
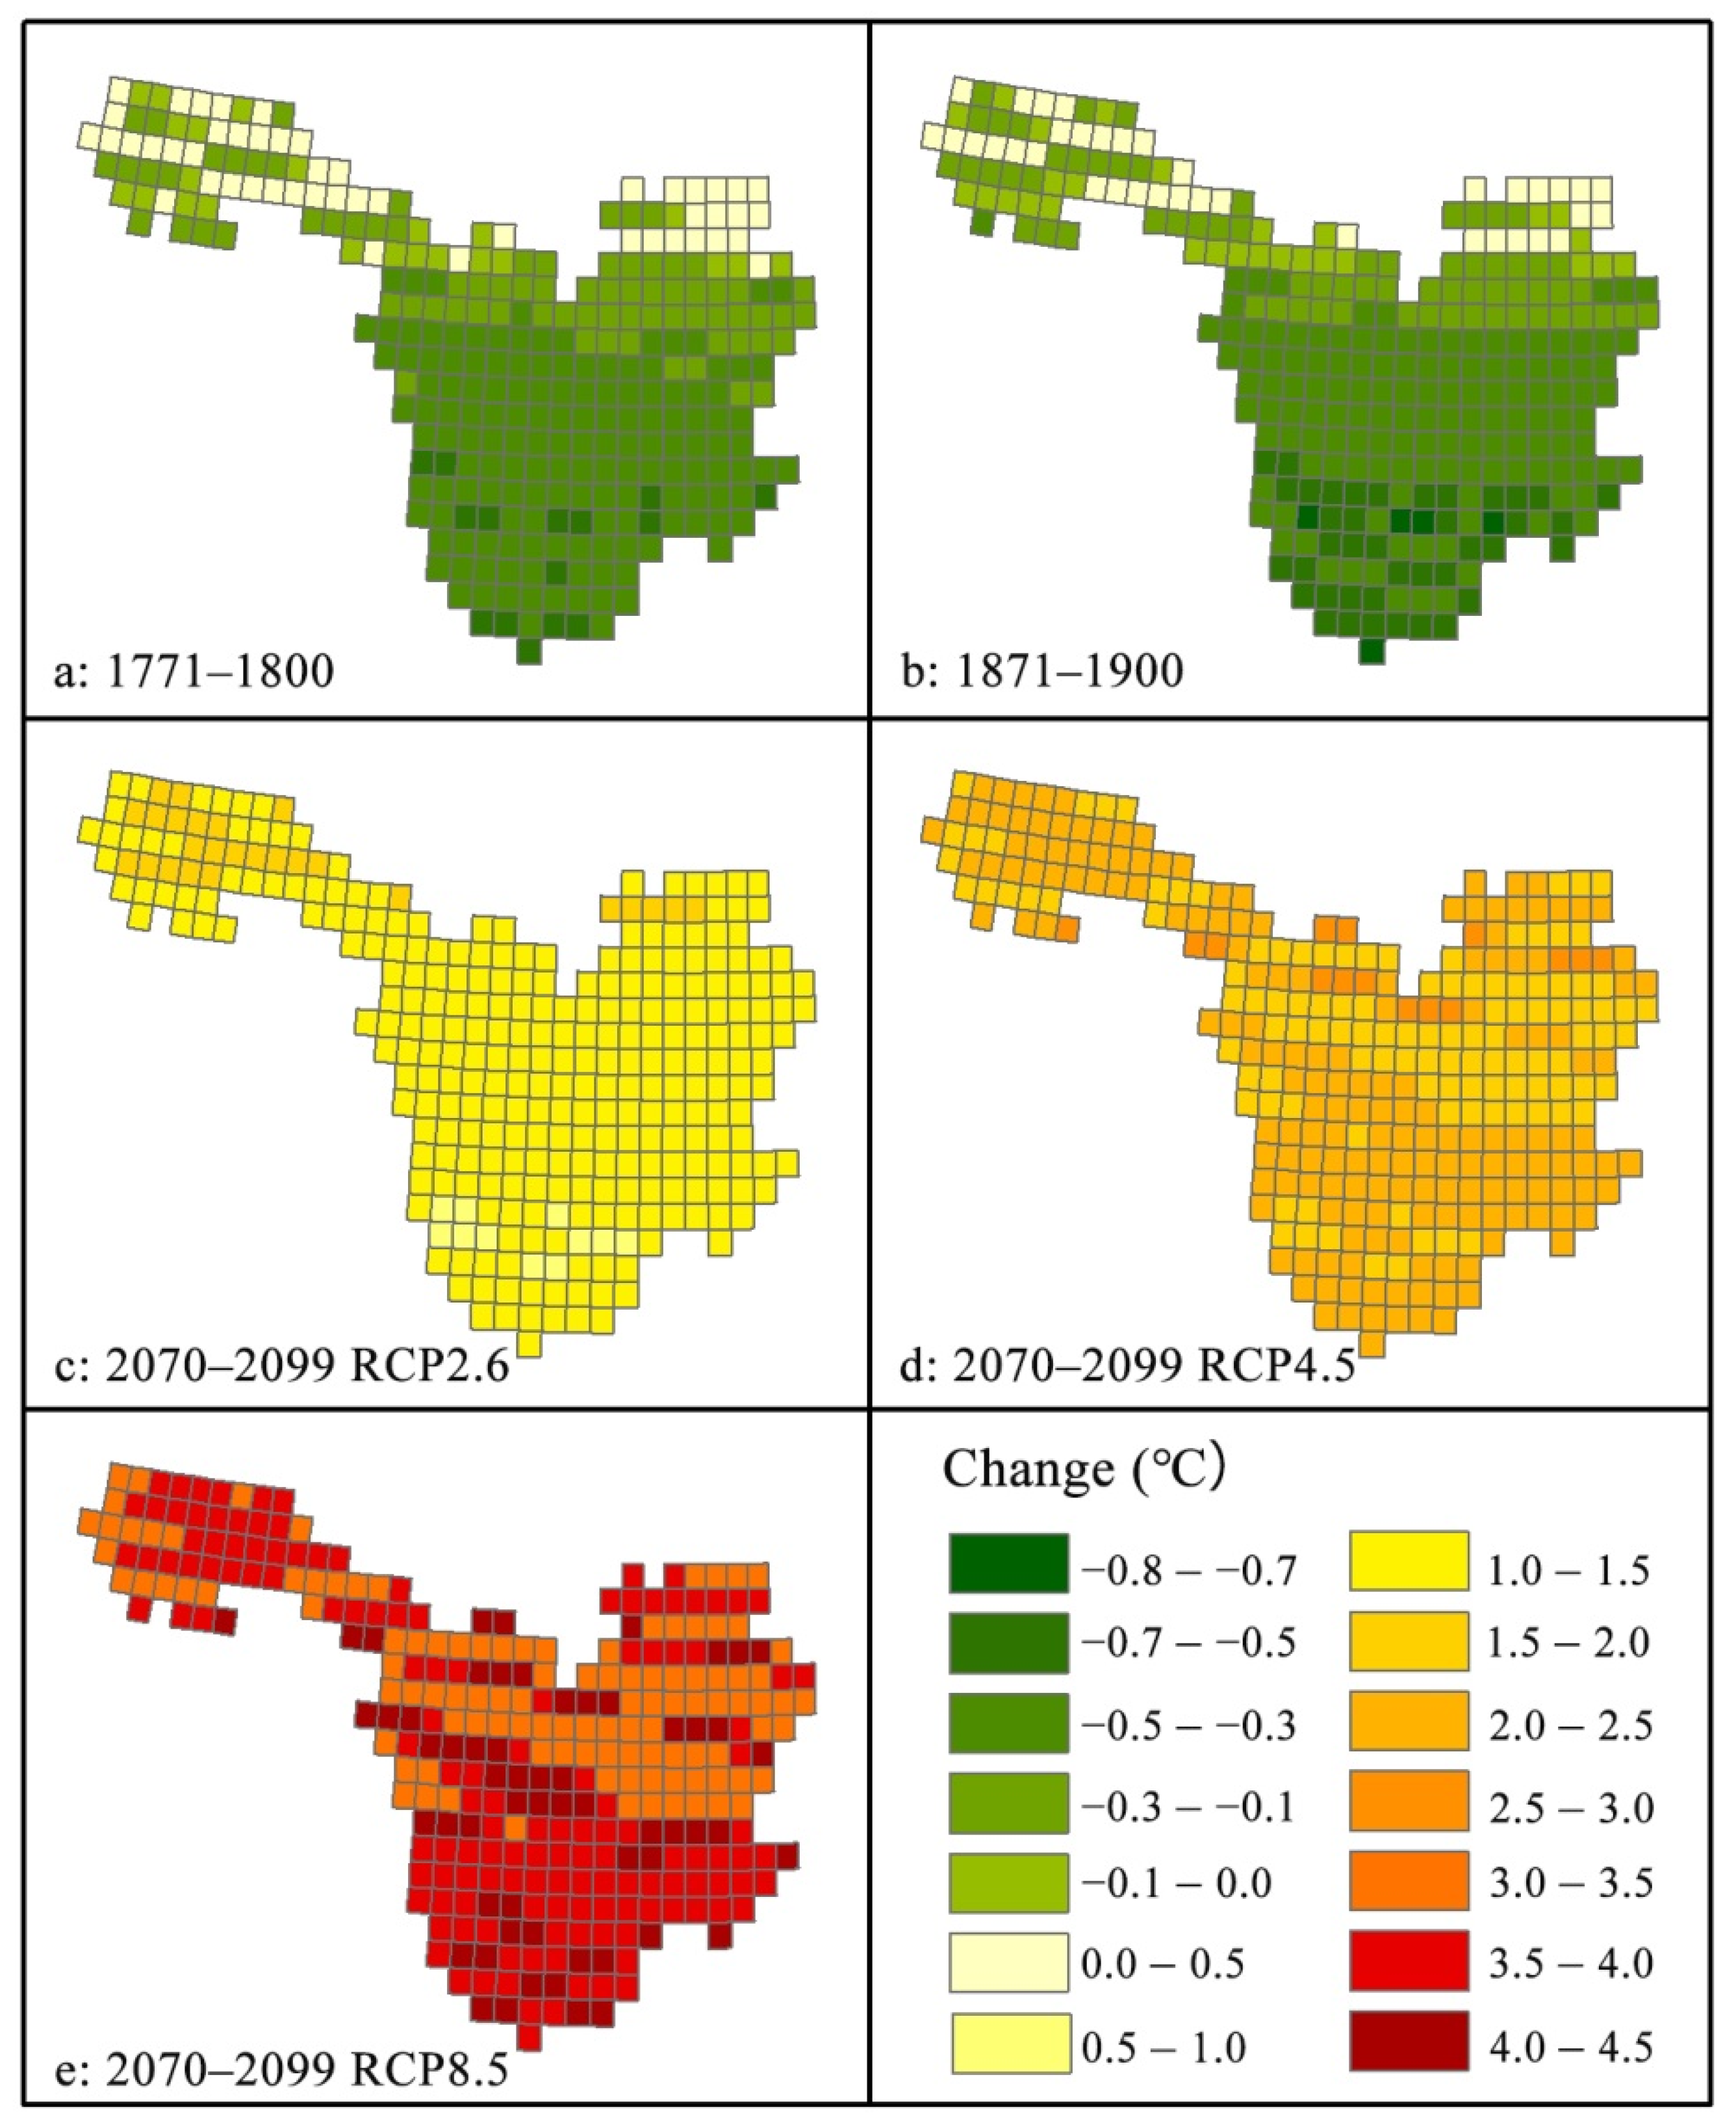
Figure 2 shows the spatial changes in the multi-model ensemble mean (MME) of mean precipitation, as a percentage change of simulated value during the pre-industrial period (1771–1800), historical period (1871–1900), and future period (2070–2099) relative to the reference period (1971–2000), and the average percentage changes for the whole study area in all four GCMs and MME are shown in Figure 3. During the pre-industrial period (1771–1800), the precipitation had increased in all GCMs and their MME for the study area as a whole, but the rate of increase varies among the different models. The rates of increase were lower for IPSL-CM5A-LR (1.7%), higher for GFDL-ESM2M (4.4%) and MIROC5 (6.6%), and much higher for HadGEM2-ES (13.7%), thus the rate was about 6.6% for the MME. During the historical period (1871–1900), the precipitation changes showed similar directions as that during the pre-industrial period, but with smaller magnitudes, which was consistent across all the models as well as the MME. For example, the rate of increase for the MME was about 5.4% during historical period compared to about 6.6% during pre-industrial period. In terms of spatial pattern, it was clear that the precipitation increased in the whole of UYRB in the MME, with a larger increase in the north, but with a smaller increase in the south for the both the pre-industrial period and historical period.
Compared with the reference period, by the end of the 21st century, mean precipitation was projected to increase for the study area as a whole in all GCMs and their MME under all three RCP scenarios, except for GFDL-ESM2M under RCP2.6 scenario (Figure 3). The increase magnitude in precipitation projections, however, varied substantially among the GCMs. In general, the rates of increase were much larger for HadGEM2-ES and MIROC5, but smaller for GFDL-ESM2M and IPSL-CM5A-LR. For example, the precipitation was projected to significantly increase by 12.7% (9.7%), 15.5% (16.7%), and 19.8% (21.4%) for HadGEM2-ES (MIROC5) under RCP 2.6, RCP 4.5, and RCP8.5, respectively. However, the increase rates were only 2.5%, 7.7%, and 8.2% for IPSL-CM5A-LR under RCP 2.6, RCP 4.5, and RCP8.5, respectively, and 4.6% and 2.9% for GFDL-ESM2M under RCP 4.5 and RCP8.5, respectively. The mean precipitation slightly decreased by −0.5% for GFDL-ESM2M under the RCP 2.6 scenario. The spatial changes in the MME projections for precipitation are shown in Figure 2c–e. Results showed that the precipitation was projected to increase over most areas of the UYRB under three RCP scenarios, but with great spatial variability. This increase is spatially uneven, with more increases in the south and less increases in the north. This change pattern, however, was different from the pre-industrial and historical period, that it showed much greater changes in north than south. In general, annual mean precipitation was simulated to increase during the pre-industrial period (1771–1800) and historical period (1871–1900), and projected to increase during the future period (2070–2099) under all three RCP scenarios relative to the 1971–2000 reference period. Moreover the increase was much higher in the future under the RCP 4.5 and 8.5 scenarios than during the pre-industrial period and historical period.

3.2.2. Temperature

Figure 4 shows the spatial patterns of changes in mean temperature for the pre-industrial period, historical period, and future period relative to the reference period by MME. The average mean of the whole study area in all four GCMs and MME are shown in Figure 2. The four individual GCM showed different change directions in mean temperature with an increase for HadGEM2-ES and MIROC5, and a decrease for GFDL-ESM2M and IPSL-CM5A-LR. The mean temperature was simulated to increase by 0.5 °C (pre-industrial period) and 0.2 °C (historical period) for HadGEM2-ES, and by 0.03 °C (pre-industrial period) and 0.06 °C (historical period) for MIROC5, while it was simulated to decrease by −0.37 °C (pre-industrial period) and −0.42 °C (historical period) for GFDL-ESM2M, and by −1.17 °C (pre-industrial period) and −1.08 °C (historical period) for IPSL-CM5A-LR. Overall, during the pre-industrial period and historical period, the mean temperature for the study area as a whole was simulated to slightly decrease by −0.26 °C and −0.31 °C for MME, respectively. Even though the mean temperature for the entire UYRB decreased for MME, the increase was also found in some part of the northern UYRB (Figure 4a,b).
Mean temperature for UYRB as a whole was projected to significantly increase at the end of 21st century by all four individual GCM and their MME, relative to the 1971–2000 reference period, under the three RCP scenarios (Figure 3). As it was expected, the magnitude of the increase found was increasing with increasing greenhouse gas forcing from RCP 2.6 to RCP 8.5. It increased by 1.8 °C for MME under RCP 2.6 with the inter-model ranges of 1.2 °C to 2.2 °C, by 3.0 °C for MME under RCP 4.5 with the inter-model ranges of 2.1 °C to 3.4 °C, and by 5.1 °C for MME under RCP 8.5 with the inter-model ranges of 3.7 °C to 6.2 °C. In terms of spatial patterns, the mean temperature change by the MME showed the familiar pattern under all three RCP scenarios (Figure 4c–e), that it showed a homogenous warming pattern across the entire study area. In general, the mean temperature was projected to increase in the future under all three RCP scenarios, and the increase rates were much higher than those during both the pre-industrial period and historical period.

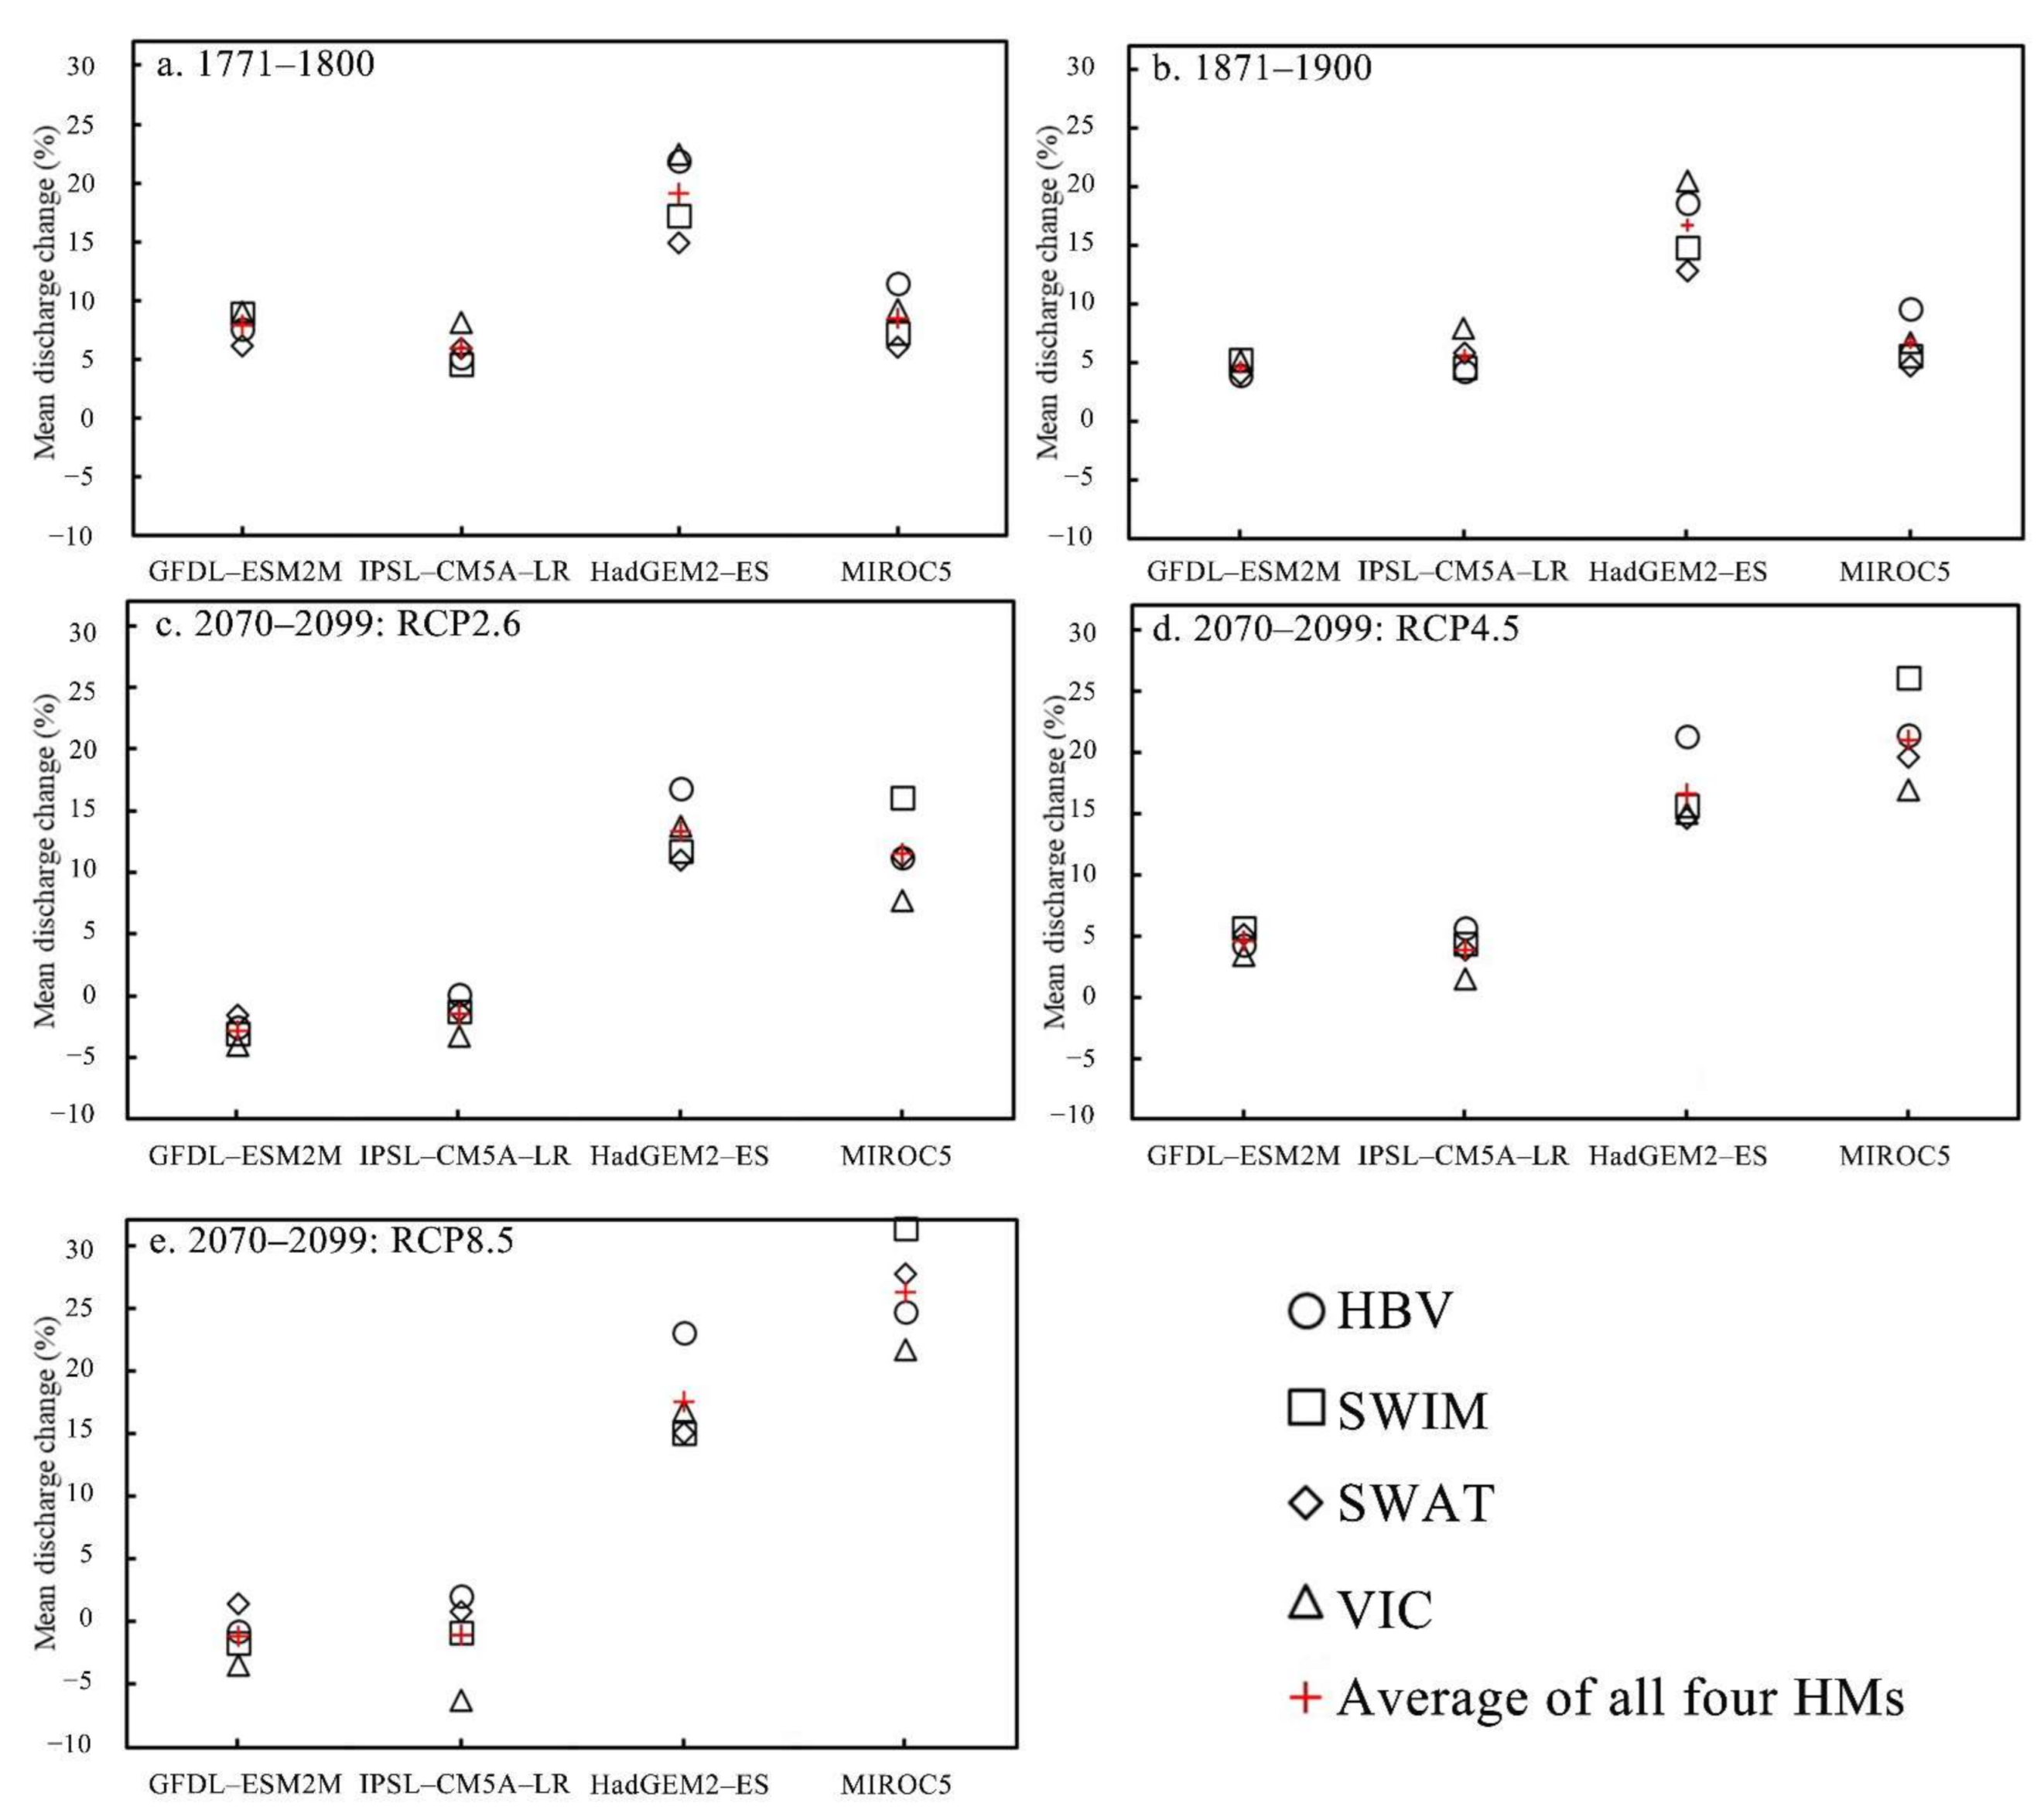
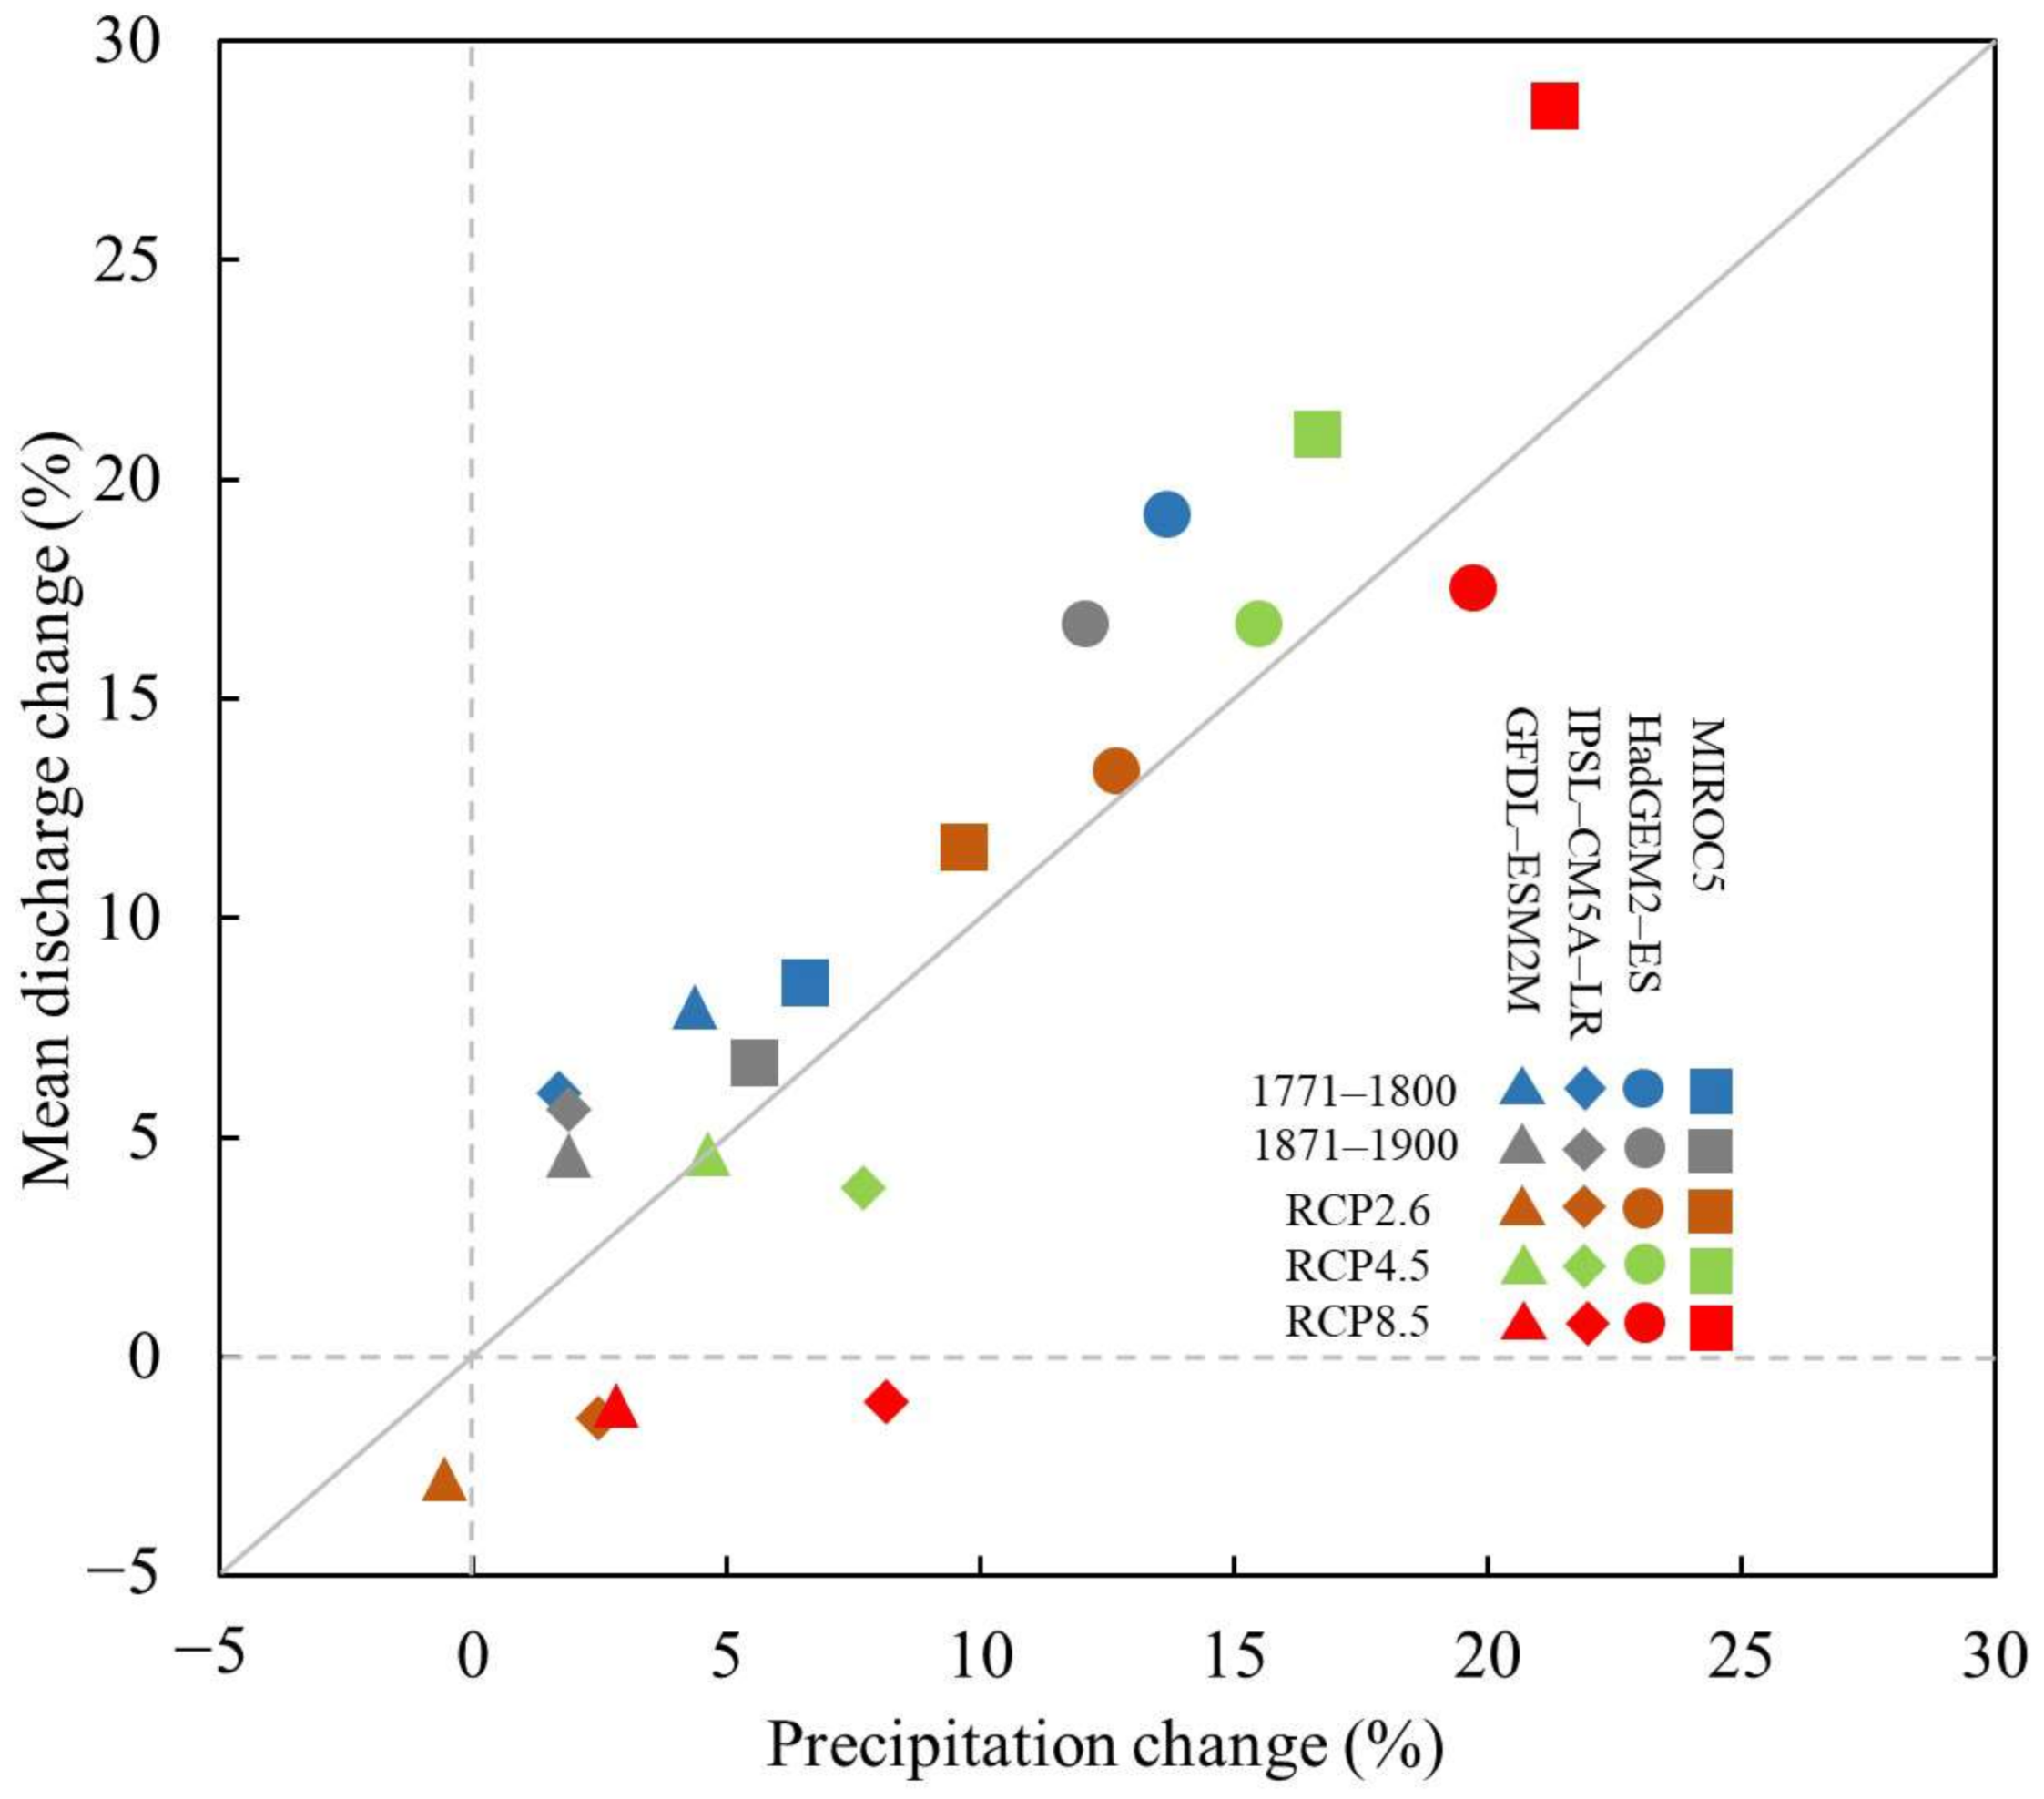
3.3. Changes in Mean Discharge

The daily precipitation and temperature from all four individual GCMs were used to drive the each of four calibrated HMs to simulate the daily discharge during all periods at Cuntan station. The percentage changes in mean discharge during the pre-industrial period (1771–1800), historical period (1871–1900), and future period (2070–2099) relative to the reference period (1971–2000) are presented in Figure 5. During the pre-industrial period and historical period, the discharge at Cuntan station was simulated to increase from the HMs driven by all GCMs. The rates of increase in discharge, however, varied in the four individual GCMs. In general, the rate of increase in discharge was less for the HMs forced by the IPSL-CM5A-LR and GFDL-ESM2M, higher for MIROC5 and HadGEM2-ES. For the pre-industrial period (historical period), the increase rates on average was 5.99% (5.62%) with a range of 5.21% to 8.18% (4.25% to 7.85%) by IPSL-CM5A-LR, 7.95% (4.56%) with a range of 6.18% to 9.08% (3.94% to 5.26%) by GFDL-ESM2M, 8.50% (6.65%) with a range of 6.03% to 11.48% (4.67% to9.61%) by MIROC5, and 19.15% (16.68%) with a range of 14.88% to 22.51% (12.85% to 20.45%) by HadGEM2-ES. Moreover, the rates of increase in discharge were much higher during the pre-industrial period than during the historical period, which closely followed the changes in precipitation.
Figure 5c–e present the future percentage changes in modeled discharge at the end of 21st century from the HMs driven by all GCMs under all three RCP scenarios and several patterns were observed. First, there was no huge difference in the change direction in discharge among the four HMs forced by the same GCM, but the change direction in discharge differed among the GCMs. Compared to the simulated discharge during the reference period, the discharge was projected to increase from the HMs forced by HadGEM2-ES and MIROC5, while it was projected to decrease from those forced by GFDL-ESM2M and IPSL-CM5A-LR under the RCP 2.6 and RCP 8.5 scenarios. According to RCP 4.5, the discharge was projected to increase from the HMs forced by all GCMs. Second, similar to during the pre-industrial and historical periods, the projection increase rates in discharge were less for the HMs forced by the IPSL-CM5A-LR and GFDL-ESM2M, and higher for MIROC5 and HadGEM2-ES. For example, on average, the discharge was projected to increase by 13.3% (11.6%), 16.7% (21.0%), and 17.5% (28.5%) for HadGEM2-ES (MIROC5) under RCP2.6, RCP4.5, and RCP8.5 scenarios, respectively. The increase rate on average was 4.62% and 3.85% for GFDL-ESM2M and IPSL-CM5A-LR under the RCP4.5 scenario, respectively. In general, the rates of increase in discharge were less under the RCP 2.6 scenario, higher under the RCP 4.5 scenario, and much higher under the RCP8.5 scenarios. Third, we can see the projection decrease rates were much less than the projections increase rates. On average, the discharge was projected to decrease by −2.8% (−1.4%) and −1.1% (−1.1%) for GFDL-ESM2M (IPSL-CM5A-LR) under the RCP2.6 and RCP8.5 scenarios, respectively.
According to the changes in precipitation and temperature, and discharge over the UYRB, we noticed that a modest decrease in precipitation would probably lead to a greater decrease in discharge. For example, a precipitation decrease of −0.5% with an increased temperature of 1.2 °C as projected by GFDL-ESM2M at the end of the 21st century under the RCP2.6 scenario was projected to decrease the discharge by −2.8% on average with the inter-HMs ranges of −4.0% to −1.6%. This result has also been found in the upper Colorado River Basin by Ficklin et al. (2013). We also found the increase in precipitation does not always lead to the increase in discharge. As we can see a great increase in precipitation always results in an increase in discharge. For example, the significant increases in precipitation during all periods had a dominating effect on the increase in discharge for MIROC5 and HadGEM2-ES simulation and projection. The slight increase in precipitation as simulated by GFDL-ESM2M and IPSL-CM5A-LR during the pre-industrial period and historical period would also lead to the slight increases in discharge, even though mean temperature was simulated to decrease by these two GCMs. While, even with the modest increase in precipitation projection, according to IPSL-CM5A-LR under the RCP 2.6 and RCP 8.5 scenarios and GFDL-ESM2M under the RCP 8.5 scenario, the decreases in discharge were also projected. This could be caused by enhanced evaporation loss due to their high temperature projection rise. This implied that the modest precipitation increase with great warming may reduce discharge in the future. Moreover, we also noticed that the increase magnitudes in discharge were relative to changes in both precipitation and temperature, but were more sensitive to changes in precipitation than to temperature. For example, during all periods, the higher increase in discharge simulation and projection for MIROC5 and HadGEM2-ES was very likely relative to the higher increase in their precipitation simulation and projection, while the lesser increase in precipitation for GFDL-ESM2M and IPSL-CM5A-LR maybe probably result in their lesser increase in discharge (Figure 6). This result was also found over the Kuye River catchment of the Loess Plateau by Wang et al. (2013). In general, we can see that the slight increase in precipitation with a decrease in temperature, and a great increase in precipitation with a weak or great warming would very likely lead to the increase in discharge, while the modest precipitation increase with great warming maybe reduce discharge. In addition, the increase rate in discharge was closely related to the increase magnitude in precipitation.

3.4. Changes in Discharge Extremes

In addition to the changes in mean discharge, the changes in extreme flood events with different return intervals were also explored in this study. The daily discharge simulated by the each of the four HMs driven by the same GCM was average first for all time periods, then the annual maxima discharge series was selected from these average daily discharge series for each GCM. The flood frequency analysis was fitted to the annual maxima discharge series to calculate the extreme flood events with different return intervals. Table 3 presents the percentage changes of the extreme flood events with the return intervals of 5, 10, 20, 50, and 100 years during the pre-industrial period (1771–1800), historical period (1871–1900), and future period (2070–2099) relative to the reference period (1971–2000). It can be seen that although the increases in mean discharge were consistent for all four GCMs during the pre-industrial period and historical period, the changes are different among the four GCMs for the extreme flood events. The magnitude of the extreme events were simulated to increase for MIROC5 and IPSL-CM5A-LR, and decrease slightly for HadGEM2-ES and significantly for GFDL-ESM2M.
By the end of the 21st century, the extreme events are projected to increase for most GCMs under the three RCP scenarios, and more increases are expected for more extreme events, suggesting the flood events during the period of 2070–2099 under different RCP scenarios will be more extreme than flood events during the 1971–2000 reference period. Among the four GCMs, the projection increases in extreme flood events were much higher for HadGEM2-ES and MIROC5 than GFDL-ESM2M and IPSL-CM5A-LR, which was similar to mean discharge. Compared with mean discharge, the increase in extreme flood events seemed to be with much greater magnitude. In general, the extreme flood events were projected to become more severe by the end of the 21st century by most GCMs, with even higher increasing rates for more extreme events, although the significant decrease in mean discharge were found by two of the GCMs. This implies that change in mean discharge was a poor predictor of changes in extreme flood events. Therefore, in order to explore the impact of climate changes on hyrdrological cycles, it is necessary to explore the change in both mean and extreme events, as we did in this study.

4. Discussion

The YRB, the largest river in China and the third longest river in the world, has experienced numerous destructive floods throughout history. Among the most recent major flood events are those of 1870, 1931, 1954, 1998, and 2010, leading to high death tolls and socioeconomic losses [49]. The 1998 China floods that lasted from the middle of June to the beginning of September 1998 in China was one of the most costly flood events worldwide, with 4150 dead, 15 million homeless, and $24 billion in economic loss [50]. In this flood, the area worst affected was the YRB, which suffered devastating social and economic losses. The floods over the YRB can be split into three general stages: The first stage was beginning when the sustained heavy precipitation hit the middle and lower YRB since mid-June and lasted for a period of about two weeks. After shifting to north China, the rain belt eventually returned to the middle and lower YRB in mid-July again, causing the second stage of the floods. Since August, the heavy rain belt shifted to the UYRB and caused the final period of heavy precipitation, leading to a sudden sharp rise in discharge over UYRB [51,52]. The peak discharge in August of 1998 at the Cuntan station within UYRB was up to 58,500 m3 s−1 according to the observed discharge from the China Hydrological Year book—Yangtze.
In this study, we found that the magnitudes of extreme flood events at Cuntan station were projected to increase during the period of 2070–2099 relative to the 1971–2000 reference period under the three RCP scenarios, which implies a change in the frequency distribution of the discharge at Cuntan station toward more extreme flood events by the end of the 21st century under a warmer climate. Therefore, here we were curious about how rare the 1998 flood was during the 1971–2000 reference period and in the future under the warmer climate. This is very important for designing and planning for flood control measures and flood risk management over UYRB. The return year of the peak discharge (58,500 m3 s−1) of the 1998 floods at Cuntan station was estimated for the 1971–2000 reference period and 2070–2099 future period under all three RCP scenarios, and the results are shown in Table 4. It can be seen that the return year of the 1998 flood event during the 1971–2000 reference period was projected to become less by the end of 21st century under warmer climate, which indicated that the 1998 flood event rarely occurred in the past will occur at a higher rate in the future. For example, the return year of the 1998 flood event was about 155 year and 510 year during 1971–2000 for HadGEM2-ES and MIROC5, respectively, which were extremely shortened to less than 13 year and 21 year during 2070–2099 under all RCP scenarios. The shortening of the return year of the 1998 flood event was also projected by GFDL-ESM2M and IPSL-CM5A-LR.
In general, with climate change, the severe flood events in the UYRB are becoming more frequent and common in the future, implying much higher flood risks for the future. Moreover, the Gross Domestic Product over the YRB, especially over the UYRB was also projected to increase by end of 21st century [53]. Relying on the golden waterway of the YRB, the Yangtze River Economic Zone has developed into one of the regions with the strongest comprehensive strength in China, which would help promoting the further development of China’s economy. This could lead to increase the risk of the severe floods over UYRB. Thus, flood risk assessment and management should be taken to reduce the potential impact of the flooding to promote social and economic sustainable development over this region.

5. Conclusions

In this study, we examined in detail how precipitation and temperature changed in the UYRB and their impacts on discharge at Cuntan station during the pre-industrial period (1771–1800), historical period (1871–1900), and future period (2070–2099) under RCP2.6, RCP4.5, and RCP8.5 scenarios relative to the reference period (1971–2000), using four HMs and four GCMs from CMIP5. The results showed that mean temperature was simulated to change slightly during the pre-industrial and historical periods, and projected to increase significantly in the future under the RCP2.6, RCP4.5, and RCP8.5 scenarios. Mean annual precipitation for most GCMs was simulated and projected to increase for all time periods. Moreover, the increase in precipitation and temperature was much higher in the future than during the pre-industrial and historical periods, and the magnitude of the increase was increasing with increasing greenhouse gas forcing from RCP2.6 to RCP8.5. Our findings implied that there was a wetter and warmer trend in the UYRB by the end of the 21st century.
In order to explore the impacts of climate change on discharge at Cuntan station within UYRB, each of four calibrated and validated HMs (HBV, SWAT, SWIM, and VIC) forced by the each of four GCMs were used to simulate and project the daily discharge during all time periods. During the pre-industrial and historical periods, the slight precipitation increases with weak warming or cooling translated to the slight increase in mean discharge for all modelling results. However, the changes in the projected mean discharge varied with the four GCMs in the future, with increases from HadGEM2-ES and MIROC5 and decreases from GFDL-ESM2M and IPSL-CM5A-LR. The significant increases in mean discharge from HadGEM2-ES and MIROC5 were associated with their great increase in projected precipitation. The decreases in mean discharge from GFDL-ESM2M and IPSL-CM5A-LR were likely corresponding to the decrease in their projected precipitation or slight increase in projected precipitation with great warming. In general, the GCM simulated and projected changes in precipitation and temperature drive changes in discharge over UYRB.
The changes in extreme discharge with different return intervals of 5, 10, 20, 50, and 100 years were also examined in this study. The magnitude of the extreme flood events were simulated and projected to increase for most models during all periods. Compared to changes in mean discharge, the magnitude of increase in extreme events were much higher, with even more increase for more extreme events. This implied the extreme flood events in UYRB were becoming more intense in the future. The decreases in the return years of the 1998 flood peak discharge by the end of 21st century indicated that the severe flood events in UYRB are becoming more frequent and common in the future with climate change. The more intense and frequent extreme flood events are likely to impose greater risks to human society, economy, and ecosystems.

Supplementary Materials

The following are available online at https://www.mdpi.com/2073-4441/13/3/299/s1, Figure S1: Flow chart for hydrological modelling process.

Author Contributions

Conceptualization, Y.W. and C.G.; methodology, G.L. and C.G.; software, C.C.; validation, Y.W. and G.L.; formal analysis, Y.W.; investigation, Y.W. and G.L.; resources, C.G.; data curation, Y.W. and Z.D.; writing—original draft preparation, G.L.; writing—review and editing, Y.W.; visualization, C.C. and Z.D.; supervision, C.G.; project administration, C.G.; funding acquisition, Y.W. All authors have read and agreed to the published version of the manuscript.

Funding

This research was partially funded by the National Natural Science Foundation of China, grand number 41871024, 42001014, 42001025, Humanity and Social Science Youth Foundation of Ministry of Education of China, grand number 20YJCZH180, Zhejiang Public Welfare Technology Research Project, grand number LGF21D010003, the Basic Science and Technology Project of Ningbo, grand number 202002N3200, Ningbo Fan-3315 Plan, and Leading and Top Talent Training Project of Ningbo.

Institutional Review Board Statement

Not applicable.

Informed Consent Statement

Not applicable.

Data Availability Statement

CMA data used in this publication is available, upon registration, at http://data.cma.cn; GCM data used in this publication is available, upon registration, at https://esgf-node.llnl.gov/projects/cmip5/.

Acknowledgments

We would like to thank the two anonymous reviewers for their helpful comments and suggestions.

Conflicts of Interest

The authors declare no conflict of interest.

Abbreviations

The acronyms and abbreviations used throughout this article include the following:
Upper Yangtze Basin: UYRBYangtze River Basin: YRB
Hydrological model: HMGlobal climate model: GCM
China Meteorological Administration: CMAGeneralized Logistic distribution: GLO
Nash-Sutcliffe efficiency: NSEPercent bias: PBIAS
Coefficient of determination: R2Multi-model ensemble mean: MME
Land use and land cover changes: LULCC

References

  1. Ali, R.; Kuriqi, A.; Kisi, O. Human–Environment Natural Disasters Interconnection in China: A Review. Climate 2020, 8, 48. [Google Scholar] [CrossRef] [Green Version]
  2. Islam, A.R.M.T.; Talukdar, S.; Mahato, S.; Kundu, S.; Limh, N.T.T. Flood susceptibility modelling using advanced ensemble machine learning models. Geosci. Front. 2020. [Google Scholar] [CrossRef]
  3. Mishra, K.; Sinha, R. Flood risk assessment in the Kosi megafan using multi-criteria decision analysis: A hydro-geomorphic approach. Geomorphology 2020, 350, 106861. [Google Scholar] [CrossRef]
  4. Sarkar, D.; Mondal, P. Flood vulnerability mapping using frequency ratio (FR) model: A case study on Kulik river basin, Indo-Bangladesh Barind region. Appl. Water Sci. 2020, 10, 17. [Google Scholar] [CrossRef] [Green Version]
  5. CRED, U. The Human Cost of Weather-Related Disasters, 1995–2015; United Nations: Geneva, Switzerland, 2015. [Google Scholar]
  6. Chen, S.; Luo, Z.; Pan, X. Natural disasters in China: 1900—2011. Nat. Hazards 2013, 69, 1597–1605. [Google Scholar] [CrossRef]
  7. Wu, Y.J.; Ji, H.X.; Wen, J.H.; Wu, S.; Xu, M.; Tagle, F.; He, B.; Duan, W.; Li, J. The characteristics of regional heavy precipitation events over eastern monsoon China during 1960–2013. Glob. Planet Chang. 2019, 172, 414–427. [Google Scholar]
  8. Guo, Y.; Wu, Y.; Wen, B.; Huang, W.; Ju, K.; Gao, Y.; Li, S. Floods in China, COVID-19, and climate change. Lancet Planet. Health 2020, 4, E443–E444. [Google Scholar] [CrossRef]
  9. Kuriqi, A.; Ali, R.; Pham, Q.B.; Gambini, J.M.; Gupta, V.; Malik, A.; Linh, N.T.T.; Joshi, Y.; Anh, D.T.; Nam, V.T.; et al. Seasonality shift and streamflow flow variability trends in central India. Acta Geophys. 2020, 68, 1461–1475. [Google Scholar] [CrossRef]
  10. Trenberth, K.E. Atmospheric moisture residence times and cycling: Implications for rainfall rates and climate change. Clim. Chang. 1998, 39, 667–694. [Google Scholar] [CrossRef]
  11. Gupta, V.; Jain, M.K. Impact of ENSO, global warming, and land surface elevation on extreme precipitation in India. J. Hydrol. Eng. 2020, 25, 05019032. [Google Scholar] [CrossRef]
  12. Khalilian, S.; Shahvari, N. A SWAT Evaluation of the Effects of Climate Change on Renewable Water Resources in Salt Lake Sub-Basin, Iran. AgriEngineering 2019, 1, 44–57. [Google Scholar] [CrossRef]
  13. Wu, S.Y.; Wu, Y.J.; Wen, J.H. Future changes in precipitation characteristics in China. Int. J. Climatol. 2019, 39, 3558–3573. [Google Scholar] [CrossRef]
  14. Sunde, M.G.; He, H.S.; Hubbart, J.A.; Urban, M.A. Integrating downscaled CMIP5 data with a physically based hydrologic model to estimate potential climate change impacts on streamflow processes in a mixed-use watershed. Hydrol. Process. 2017, 31, 1790–1803. [Google Scholar] [CrossRef]
  15. Tian, Q.; Prange, M.; Merkel, U. Precipitation and temperature changes in the major Chinese river basins during 1957–2013 and links to sea surface temperature. J. Hydrol. 2016, 536, 208–221. [Google Scholar] [CrossRef]
  16. Awange, J.L.; Kuhn, M.; Anyah, R.; Forootan, E. Changes and variability of precipitation and temperature in the Ganges–Brahmaputra–Meghna River Basin based on global high-resolution reanalysesInt. J. Climatol. 2017, 37, 2141–2159. [Google Scholar]
  17. Shrestha, A.B.; Bajracharya, S.R.; Sharma, A.R.; Duo, C.; Kulkarni, A. Observed trends and changes in daily temperature and precipitation extremes over the Koshi river basin 1975–2010. Int. J. Climatol. 2017, 37, 1066–1083. [Google Scholar] [CrossRef] [Green Version]
  18. Sharma, A.; Goyal, M.K. Assessment of the changes in precipitation and temperature in Teesta River basin in Indian Himalayan Region under climate change. Atmos. Res. 2020, 231, 104670. [Google Scholar] [CrossRef]
  19. Tariku, T.B.; Gan, T.Y. Regional climate change impact on extreme precipitation and temperature of the Nile river basin. Clim. Dyn. 2018, 51, 3487–3506. [Google Scholar] [CrossRef]
  20. Wu, Y.J.; Wu, S.Y.; Wen, J.H.; Tagle, F.; Xu, M.; Tang, J. Future changes in mean and Extreme Monsoon Precipitation in the Middle and lower Yangtze River Basin, China, in the CMIP5 Models. J. Hydrometeorol. 2016, 17, 2785–2797. [Google Scholar] [CrossRef]
  21. Chen, J.; Wu, X.D. Variability and trend in the hydrology of the Yangtze River, China: Annual precipitation and runoff. J. Hydrol. 2014, 513, 403–412. [Google Scholar] [CrossRef]
  22. Cui, L.F.; Wang, L.C.; Qu, S.; Singh, R.P.; Lai, Z.P.; Yao, R. Spatiotemporal extremes of temperature and precipitation during 1960–2015 in the Yangtze River Basin (China) and impacts on vegetation dynamics. Theor. Appl. Climatol. 2019, 136, 675–692. [Google Scholar] [CrossRef]
  23. Wang, Y.; Liao, W.; Ding, Y.; Wang, X.; Jiang, Y.; Song, X.; Lei, X. Water resource spatiotemporal pattern evaluation of the upstream Yangtze River corresponding to climate changes. Quat. Int. 2015, 380, 187–196. [Google Scholar] [CrossRef]
  24. Su, B.; Huang, J.; Zeng, X.; Gao, C.; Jiang, T. Impacts of climate change on streamflow in the upper Yangtze River basin. Clim. Chang. 2017, 141, 533–546. [Google Scholar] [CrossRef]
  25. Bian, H.; Lü, H.; Sadeghi, A.M.; Yonghua, Z.; Zhongbo, Y.; Jianbin, S.; Rensheng, C.; Richard, S. Assessment on the effect of climate change on streamflow in the source region of the Yangtze River, China. Water 2017, 9, 70. [Google Scholar] [CrossRef] [Green Version]
  26. Dams, J.; Nossent, J.; Senbeta, T.B.; Willems, P.; Batelaan, O. Multi-model approach to assess the impact of climate change on runoff. J. Hydrol. 2015, 529, 1601–1616. [Google Scholar] [CrossRef]
  27. Fang, J.; Kong, F.; Fang, J.; Zhao, L. Observed changes in hydrological extremes and flood disaster in Yangtze River Basin: Spatial–temporal variability and climate change impacts. Nat. Hazards 2018, 93, 89–107. [Google Scholar] [CrossRef]
  28. Frieler, K.; Lange, S.; Piontek, F.; Reyer, C.; Schewe, J.; Warszawski, L.; Zhao, F.; Chini, L.; Denvil, S.; Emanuel, K.; et al. Assessing the impacts of 1.5 °C global warming–simulation protocol of the Inter-Sectoral Impact Model Intercomparison Project (ISIMIP2b). Geosci. Model Dev. 2017, 10, 4321–4345. [Google Scholar] [CrossRef] [Green Version]
  29. Lange, S. Bias correction of surface downwelling longwave and shortwave radiation for the EWEMBI dataset. Earth Syst. Dynam. 2018, 9, 627–645. [Google Scholar] [CrossRef] [Green Version]
  30. Ficklin, D.L.; Stewart, I.T.; Maurer, E.P. Climate Change Impacts on Streamflow and Subbasin-Scale Hydrology in the Upper Colorado River Basin. PLoS ONE 2013, 8, e71297. [Google Scholar] [CrossRef]
  31. Huang, S.; Kumar, R.; Flörke, M.; Yang, T.; Hundecha, Y.; Kraft, P.; Gao, C.; Gelfan, A.; Liersch, S.; Lobanova, A.; et al. Evaluation of an ensemble of regional hydrological models in 12 large-scale river basins worldwide. Clim. Chang. 2017, 141, 381–397. [Google Scholar] [CrossRef]
  32. Krysanova, V.; Vetter, T.; Eisner, S.; Huang, S.; Pechlivanidis, I.; Strauch, M.; Gelfan, A.; Kumar, R.; Aich, V.; Arheimer, B.; et al. Intercomparison of regional-scale hydrological models and climate change impacts projected for 12 large river basins worldwide-a synthesis. Environ. Res. Lett. 2017, 12, 1–12. [Google Scholar] [CrossRef]
  33. Pechlivanidis, I.G.; Arheimer, B.; Donnelly, C.; Hundecha, Y.; Huang, S.; Aich, V.; Samaniego, L.; Eisner, S.; Shi, P. Analysis of hydrological extremes at different hydro-climatic regimes under present and future conditions. Clim. Chang. 2017, 141, 467–481. [Google Scholar] [CrossRef] [Green Version]
  34. Faiz, M.A.; Liu, D.; Fu, Q.; Li, M.; Baig, F.; Tahir, A.A.; Khan, M.I.; Li, T.X.; Cui, S. Performance evaluation of hydrological models using ensemble of General Circulation Models in the northeastern China. J. Hydrol. 2018, 565, 599–613. [Google Scholar] [CrossRef]
  35. Johnson, G.E.; Townsend, M.A. Nonoptimal termination properties of quadratic interpolation univariate searches. J. Franklin. Ins. 1978, 306, 257–266. [Google Scholar] [CrossRef]
  36. Gao, C.; Su, B.D.; Krysanova, V.; Zha, Q.Y.; Chen, C.; Luo, G.; Zeng, X.F.; Huang, J.L.; Xiong, M.; Zhang, L.P.; et al. A 439-year simulated daily discharge dataset (1861–2299) for the upper Yangtze River, China. Earth Syst. Sci. Data 2020, 12, 387–402. [Google Scholar] [CrossRef] [Green Version]
  37. Nash, J.E.; Sutcliffe, J.V. River flow forecasting through conceptual models: Part 1A discussion of principles. J. Hydrol. 1970, 10, 282–290. [Google Scholar] [CrossRef]
  38. Moriasi, D.N.; Arnold, J.G.; Liew, M.W.V.; Bingner, R.L.; Harmel, R.D.; Veith, T.L. Model Evaluation Guidelines for Systematic Quantification of Accuracy in Watershed Simulations. Trans. ASABE 2007, 50, 885–900. [Google Scholar] [CrossRef]
  39. Duan, Z.; Tuo, Y.; Liu, J.Z.; Gao, H.K.; Song, X.F.; Zhang, Z.X.; Yang, L.; Mekonnen, D.F. Hydrological evaluation of open-access precipitation and air temperature datasets using SWAT in a poorly gauged basin in Ethiopia. J. Hydrol. 2019, 569, 612–626. [Google Scholar] [CrossRef] [Green Version]
  40. Olang, L.O.; Kundu, P.; Bauer, T.; Fuerst, J. Analysis of spatio-temporal land cover changes for hydrological impact assessment within the Nyando River Basin of Kenya. Monit. Assess. 2011, 179, 389–401. [Google Scholar] [CrossRef] [Green Version]
  41. Grimaldi, S.; Nardi, F.; Piscopia, R.; Petroselli, A.; Apollonio, C. Continuous hydrologic modelling for design simulation in small and ungauged basins: A step forward and some tests for its practical use. J. Hydrol. 2020, 125664. [Google Scholar] [CrossRef]
  42. Petroselli, A.; Piscopia, R.; Grimaldi, S. Design discharge estimation in small and ungauged basins: EBA4SUB framework sensitivity analysis. J. Agric. Eng. 2020, 51, 107–118. [Google Scholar] [CrossRef]
  43. Bloeschl, G.; Ardoin-Bardin, S.; Bonell, M.; Dorninger, M.; Goodrich, D.; Gutknecht, D.; Matamoros, D.; Merz, B.; Shand, P.; Szolgay, J. At what scales do climate variability and land cover change impact on flooding and low flows? Process 2007, 21, 1241–1247. [Google Scholar] [CrossRef]
  44. Guzha, A.C.; Rufino, M.C.; Okoth, S.; Jacobs, S.; Nóbrega, R.L.B. Impacts of land use and land cover change on surface runoff, discharge and low flows: Evidence from East Africa. J. Hydrol. Reg. Studies 2018, 15, 49–67. [Google Scholar] [CrossRef]
  45. Ashkar, F.; Mahdi, S. Fitting the log-logistic distribution by generalized moments. J. Hydrol. 2006, 328, 694–703. [Google Scholar] [CrossRef]
  46. Bhunya, P.K.; Singh, R.D.; Berndtsson, R.; Kumar, P.K. Flood analysis using generalized logistic models in partial duration series. J. Hydrol. 2012, 420, 59–71. [Google Scholar] [CrossRef]
  47. Zamani, R.; Tabari, H.; Willems, P. Extreme streamflow drought in the Karkheh river basin (Iran): Probabilistic and regional analyses. Nat. Hazards. 2015, 76, 327–346. [Google Scholar] [CrossRef]
  48. Setegn, S.G.; Dargahi, B.; Srinivasan, R.; Melesse, A.M. Modeling of Sediment Yield from Anjeni-Gauged Watershed, Ethiopia Using SWAT Model 1. JAWRA. J. Am. Water Resour. Assoc. 2010, 46, 514–526. [Google Scholar] [CrossRef]
  49. Jiang, T.; Kundzewicz, Z.W.; Su, B. Changes in monthly precipitation and flood hazard in the Yangtze River Basin, China. Int. J. Climatol. 2008, 28, 1471–1481. [Google Scholar] [CrossRef]
  50. Spignesi, S.J. Catastrophe! The 100 Greatest Disasters of All Time; Citadel: New York, NY, USA, 2005. [Google Scholar]
  51. Ye, Q.; Glantz, M.H. The 1998 Yangtze Floods: The Use of Short-Term Forecasts in the Context of Seasonal to Interannual Water Resource Management. Mitig. Adapt. Strateg. Glob. Chang. 2005, 10, 159–182. [Google Scholar] [CrossRef]
  52. Chen, J.Y.; Xu, C.H.; Liu, H.B. A Study of the Cataclysm Flood in Yangtze River in 1998 and Its Cause. J. CUN Nat. Sci. Ed. 2000, 9, 134–143. [Google Scholar]
  53. Zhu, M.; Zhang, Z.X.; Zhu, B.; Kong, R.; Zhang, F.Y.; Tian, J.X.; Jiang, T. Population and Economic Projections in the Yangtze River Basin Based on Shared Socioeconomic Pathways. Sustainability 2020, 12, 4202. [Google Scholar] [CrossRef]
Figure 1. Map of the upper Yangtze River basin and the Cuntan hydrological station in the western China.
Water 13 00299 g001
Figure 2. Percentage changes (%) in annual mean precipitation from CMIP5 multi-model ensemble (MME) over the upper Yangtze River Basin (UYRB) for the time of (a) 1771–1800, (b) 1871–1900, (c) 2070–2099 under RCP2.5, (d) 2070–2099 under RCP4.5, and (e) 2070–2099 under RCP8.5 scenarios relative to the reference period 1971–2000.
Water 13 00299 g002
Figure 3. Changes in precipitation (%) and temperature (°C) from each of the four global climate models (GCM) and their MME for the UYRB as a whole during all time periods relative to the reference period.
Water 13 00299 g003
Figure 4. Changes in mean temperature (°C) for the time of (a) 1771–1800, (b) 1871–1900, (c) 2070–2099 under RCP2.5, (d) 2070–2099 under RCP4.5, and (e) 2070–2099 under RCP8.5 scenarios relative to the reference period 1971–2000.
Water 13 00299 g004
Figure 5. Percentage changes in mean discharge (%) from each of the four hydrological models (HMs) forced by each four GCMs during all time periods relative to the reference period.
Water 13 00299 g005
Figure 6. Relationship between mean discharge change and precipitation change under all time periods.
Water 13 00299 g006
Table 1. List of 4 CMIP5 models used in our study.
Model NameModeling CenterOriginal Resolution
GFDL-ESM2MGeophysical Fluid Dynamics Laboratory (GFDL)/USA2.5° × 2°
IPSL-5 CM5ALRL’Institut Pierre-Simon Laplace (IPSL)/France3.75° × 1.875°
HadGEM2-ESHandley Centre for Climate Prediction and Research, Met Office/United Kingdom1.875° ×1.25°
MIROC5Agency for Marine-Earth Science and Technology, Atmosphere and Ocean Research Institute, and National Institute for Environment Studies/Japan2.8125° × 2.8125°
Table 2. The criteria for simulation capacity of hydrological models during calibration and validation periods.
PeriodCriterionHBVSWATSWIMVIC
Calibration
(1971–1980)
NSE0.810.810.860.74
R20.860.810.850.94
PBIAS (%)0.406.6125.10−18.82
Validation
(1981–1990)
NSE0.760.790.770.71
R20.850.800.830.92
PBIAS (%)1.072.0019.72−9.88
Table 3. Percentage changes (%) in extreme flood events with different return intervals for each of the four GCMs during all time periods relative to reference period.
GCMsReturn Period (Years)1771–18001871–19002070–2099
RCP2.6
2070–2099
RCP4.5
2070–2099
RCP8.5
GFDL-ESM2M5−2.51.58.714.213.6
10−13.0−8.34.12.015.9
20−20.0−15.10.9−6.317.7
50−26.7−21.7−2.1−14.119.7
100−30.4−25.5−3.8−18.521.0
IPSL-CM5A-LR511.21.9−2.413.911.8
1011.92.6−1.622.813.1
2012.53.3−1.130.313.9
5012.94.2−0.538.514.5
10013.24.9−0.243.814.8
HadGEM2-ES512.61.717.123.945.4
1014.8−0.821.025.754.2
2017.4−2.625.127.762.3
5021.2−4.430.530.472.1
10024.0−5.534.432.579.0
MIROC557.714.617.632.454.3
107.023.025.133.755.0
206.330.532.034.254.6
505.639.340.434.153.3
1005.045.346.233.852.0
Table 4. The return years of the 1998 peak flood discharge at Cuntan station within the UYRB for the 1971–2000 reference period and 2070–2099 under three RCP scenarios. The unit is year.
GCMs1971–20002070–2099
RCP2.6
2070–2099
RCP4.5
2070–2099
RCP8.5
GFDL-ESM2M10.553.94.5
IPSL-CM5A-LR8.49.14.85.1
HadGEM2-ES155.412.39.84.1
MIROC5509.717.313.54.5
Publisher’s Note: MDPI stays neutral with regard to jurisdictional claims in published maps and institutional affiliations.

