Article

A Systemic Analysis of the Environmental Impacts of Gold Mining within the Blyde River Catchment, a Strategic Water Area of South Africa

by
Itumeleng M Selebalo
1,
Mary C Scholes
2 and
Jai K Clifford-Holmes
3,4,*
1
School of Animal, Plant, and Environmental Sciences, University of the Witwatersrand, Johannesburg 2000, South Africa
2
School of Animal, Plant, and Environmental Sciences in System Analysis, University of the Witwatersrand, Johannesburg 2000, South Africa
3
Association for Water and Rural Development (AWARD), P.O. Box 1919, Hoedspruit, Limpopo 1380, South Africa
4
Institute for Water Research (IWR), Rhodes University, P.O. Box 96, Grahamstown 6140, South Africa
*
Author to whom correspondence should be addressed.
Water 2021, 13(3), 301; https://doi.org/10.3390/w13030301
Submission received: 18 December 2020 / Revised: 10 January 2021 / Accepted: 11 January 2021 / Published: 26 January 2021
(This article belongs to the Section Water Resources Management, Policy and Governance)

Abstract

:
Exploratory modelling of the impact of gold mining on groundwater in a strategic water area of South Africa was undertaken. A systems dynamics (SD) model was developed to simulate the impact of gold mining on water quality, focusing on groundwater contamination risk, within the context of competing developmental priorities around water resource development and the socio-economic gains from gold mining. The model also identified interventions to minimise the impacts by the year 2040. The study area was the Blyde River Catchment (BRC), which is part of the Olifants Water Management Area in South Africa. This area is an important contributor, currently and in the future, to freshwater flows and groundwater in the Olifants River Catchment, which is one of South Africa’s most economically important catchments. The model development process included a causal loop diagram­–based problem conceptualisation, followed by the drawing of stock-flow diagrams and the determining of model parameters based on a combination of background literature, data from environmental impact assessments, and from the national Department of Water and Sanitation. The model showed the potential environmental risks of gold mine wastewater production and interventions to minimise these risks. The most effective intervention identified to reduce the risk of groundwater contamination was the development and use of synthetic-lined tailings dams. The baseline simulation result of sulphate loading of 5430 t/year can be reduced by 3070 t/year to give a simulated sulphate load of 2270 t/year in 2040 using this intervention. In comparison, the simulated wastewater recycling intervention only reduced the sulphate load to 4630 t/year and the wastewater treatment interventions to 3420 t/year. This project contributes to the exploratory modelling of an understudied region of the Olifants River Catchment that is a crucial provider of freshwater flows to the Olifants, which is threatened by increasing gold mining in the upper BRC. The SD model highlighted the importance of protecting the dolomitic aquifers in the BRC for the long term sustainability of the catchment, which is particularly important if groundwater development occurs.

1. Introduction

Global water systems, which are responsible for sustaining the natural environment, development and rapid population growth, are under stress due to increased demand and pollution [1]. South Africa is one of the many countries that are experiencing water scarcity, which is defined as being unable to meet the particular region’s water requirements [2]. According to the national Department of Water and Sanitation, water scarcity in South Africa is the result of a combination of factors, such as the country’s semi-arid climate, increasing population growth, demographic changes, urbanisation, industry, agriculture, and the ineffective management of water resources [3]. In addition, environmental degradation at a catchment scale, as a result of anthropogenic activities, has played a part in the decline in the quantity and quality of water resources in South Africa. The National Water Resources Strategy (NWRS2, second edition) aims to ensure the management of the resource to facilitate growth, development, and socio-economic priorities equitably and sustainably [4]. The research presented in this paper addresses one of the three objectives of the strategy, which is ‘To ensure that water is protected, used, developed, conserved, managed, and controlled sustainably and equitably’ [4]. One of the strategic themes included in this objective is the protection of strategic water source areas (SWA), which are areas that supply a disproportionately large amount of the country’s mean annual runoff relative to their surface area while contributing substantially to groundwater recharge [5,6,7,8] (see Figure 1A). The significance of SWA or mountain catchment areas was emphasised in Chapter 13 of the Rio Earth Summit’s Agenda 21 and in the 2030 Agenda of the sustainable development goals (SDGs), which call for water access for all while promoting sustainable management of water resources [9,10,11].
This paper reports on the impacts of gold mining on groundwater in the Blyde River Catchment (BRC), which is part of the Mpumalanga Drakensburg SWA (Figure 1). A system dynamics (SD) model was constructed to analyse the potential risk for groundwater and to determine which interventions would enhance the mitigation of impacts and the protection of groundwater to ensure the long-term sustainability of the water supply in this SWA. SD is a methodology which also enables environmental analysis, focusing on the progression of environmental impacts over time. The models can be informed by environmental analysis techniques, such as Environmental Impact Assessments (EIAs), to establish a better understanding and analysis of the risks associated with mining in this area. The methodology also allows for various scenarios to be assessed, which could include the impacts of introducing new mitigation interventions to reduce the potential groundwater contamination risks. Therefore, analysing the impacts of land uses, such as mining, on hydrology within a catchment area contributes to effective watershed management strategies, water resources planning, and water conservation measures [12].

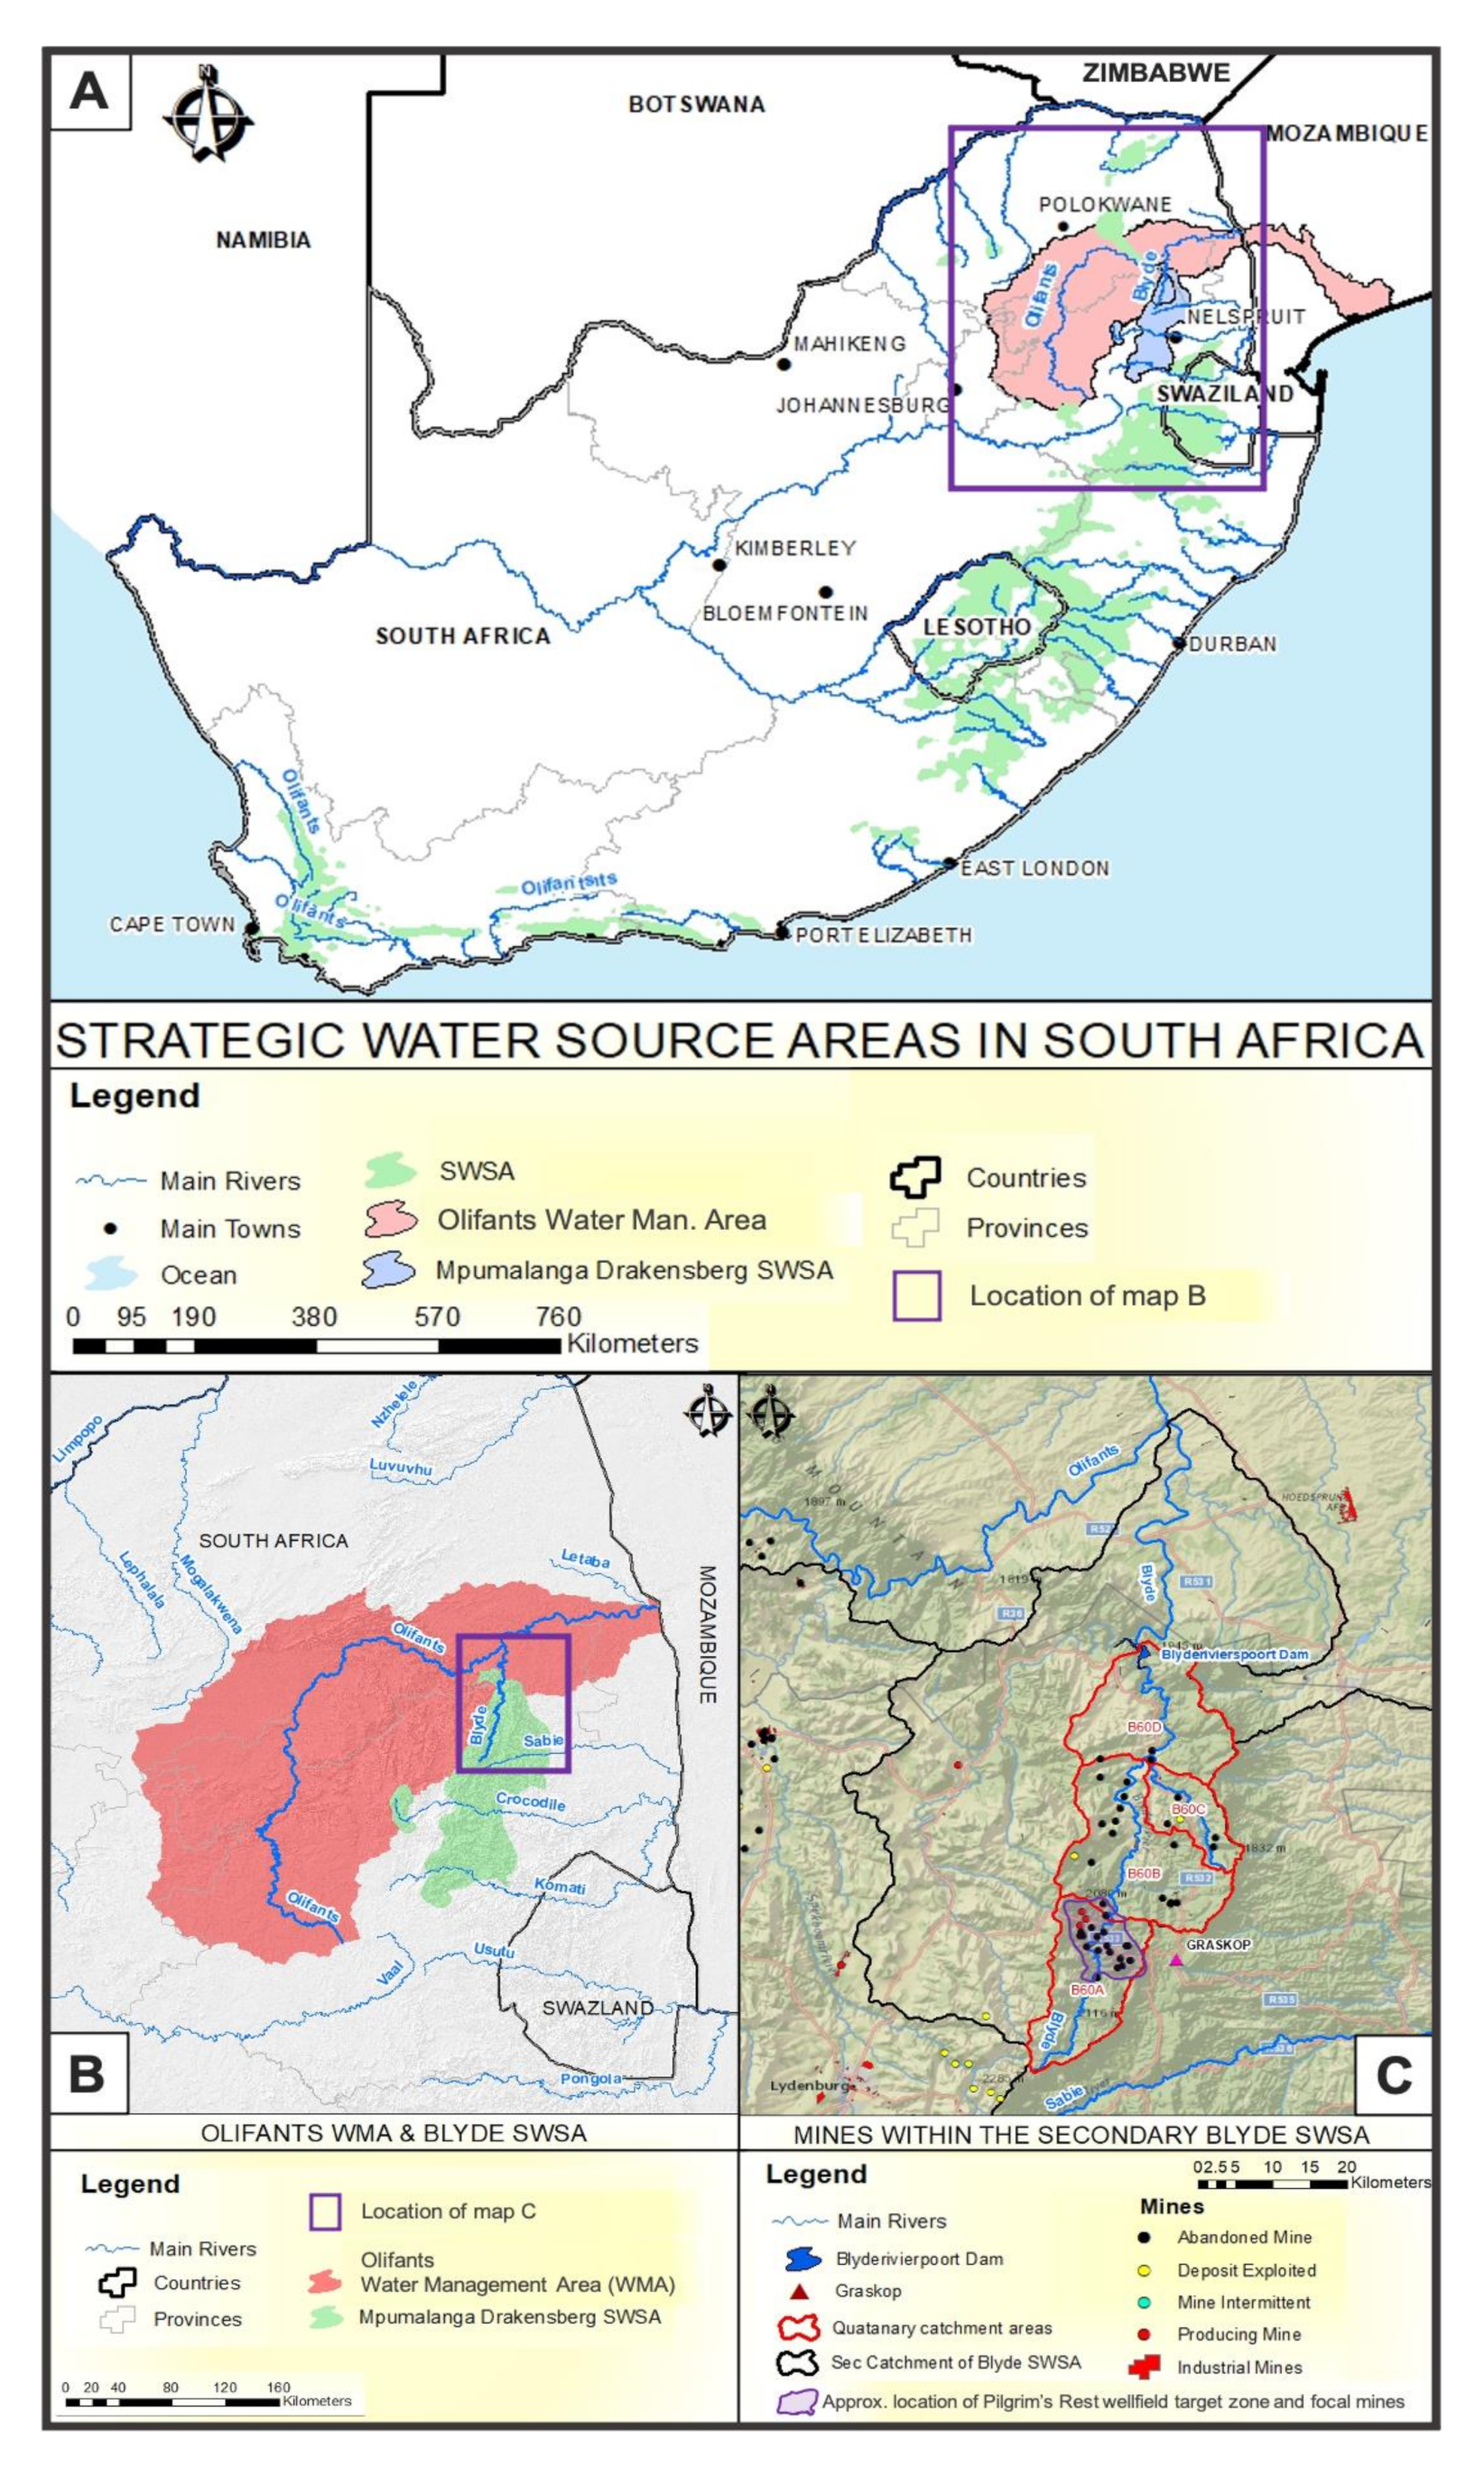
1.1. Introduction to the Blyde River Catchment, a Strategic Water Area of South Africa

The study area is the Blyde River Catchment (BRC), which is a sub-catchment of the Olifants River Catchment/basin of the Olifants Water Management Area (OWMA) (see Figure 1A,B). The study area comprises the B60A–D quaternary (hydrological) catchments, as determined by the South African Department of Water and Sanitation( Figure 1C) [13]. In this study, SD modelling is used to understand and represent the interaction between mining operations and the surrounding environment, simulating the dynamic behaviour of environmental risks that may arise from mining within the BRC and the impacts of these risks on groundwater resources. The concern for groundwater quality in this region is because it is envisaged that the BRC will be able to provide good quality water of sufficient quantity to the Olifants River Catchment (ORC).
A reconciliation strategy (and associated studies) is a means of reconciling current (and projected future) water deficits in a catchment. The latest reconciliation strategy for the ORC was published in September 2015, which updated an earlier reconciliation study undertaken between 2009–2011 [14], which had recognised that interventions were required to reconcile the available supply. The strategy proposed eight interventions that were divided into two broad categories: (1) interventions aimed at reducing water requirements; and (2) interventions aimed at increasing system yield. Out of the eight interventions, developing groundwater is the single largest proposed intervention (with a potential yield of 70 million m3 per year (mcm/year)). The protection of groundwater—both from contamination and any additional abstraction—is therefore critical for the functionality of the catchment [15]. The most recent study which looked at the feasibility of developing groundwater resources by utilising the Malmani subgroup dolomites indicated that the groundwater potential contribution could be 39.5 mcm/year [16]. This is 30.5 mcm/year less than what was initially estimated, leaving the reconciliation strategy with a significant shortfall. There are also a number of concerns surrounding the cost of moving this water to the areas that need it. While groundwater development is feasible, it is not as significant a resource as was expected and will come at a great expense [13]. This highlights the need to keep the available groundwater as free from pollution as possible.

1.2. The Potential Impacts of Mining on Groundwater Resources

Gold mining contributes to both the decline in water quality and quantity through sulphide contamination from mine wastewater. The impacts of mining on water quality are dependent on the mineralogy and geochemistry of the mined ore body. These impacts have been investigated through research and the requirements for EIAs in mine operations [17]. Mining can affect water quality in various stages of the mine’s life, including ore mining, processing, mine closure, and post-mine closure. Mine excavation exposes rock material to oxygen and water which results in the increase in oxidation, weathering rates, and the mobilisation of potential pollutants such as toxic metals and solutes like sulphides and arsenic [18]. Pollutants seep into the freshwater environment from waste rock dumps, tailings storage, and walls of mine shafts contribute to contamination of local and regional water supplies [17]. In this study, the processing of the hard rock material takes place at the existing Pilgrims Rest region’s metallurgical plant with tailings facilities, which results in acid leaching [19]. There are two common interventions which are used to minimise the risk of pollution to the groundwater; these include the recycling of wastewater, the inclusion of treatment plants and possible neutralisation approaches, and the lining of the tailing dams. Traditionally, tailings dams are lined with clay, but synthetic liners are being used more frequently when new tailings dams are being constructed [20].
This paper demonstrates the value of using systems dynamics modelling to analyse the feedbacks and interconnections between mining and the broader environment and assess the feasibility of various interventions to mitigate the impact of mining, with a particular focus on the impact of mining activities on groundwater.

2. Materials and Methods

2.1. System Dynamics Modelling Approach

System dynamics (SD) is the understanding of the relationship between integrated systems elements and how they impact each other’s behaviour [21]. The integration of systems elements is done by the incorporation of concepts such as stocks, flows, feedbacks, and delays, enabling the analysis of the dynamic behaviour of the system elements over time [22]. The approach is used to describe, model, simulate, and analyse complex systems with multiple interacting elements in terms of processes, information, organisational boundaries, and strategies [23]. The state of water resources (such as reduced flows, water insecurity, or low water availability in a catchment) cannot be attributed to one factor; instead, the state of water resources is a result of complex interactions of socio-economic, ecological, and political factors [21,24,25]. The SD approach is a technique that can be used in investigating and managing the complexity of hydrological, natural, environmental, and social domains [26]. Hence, the adoption of a systems philosophy in water resources development can enable water conservation, sustainable water use, and water resources protection through analysing, investigating, and supporting the decision-making processes in water systems [26]. The overall use of system dynamics as a form of quantitative policy analysis is increasing within the international water sector, especially in the research areas of regional planning, river basin management, flooding, and irrigation [24,25,27,28]. The use of system dynamics modelling has also been growing within South Africa more broadly [29] and in the use of the approach in the water sector, more specifically [24,30].

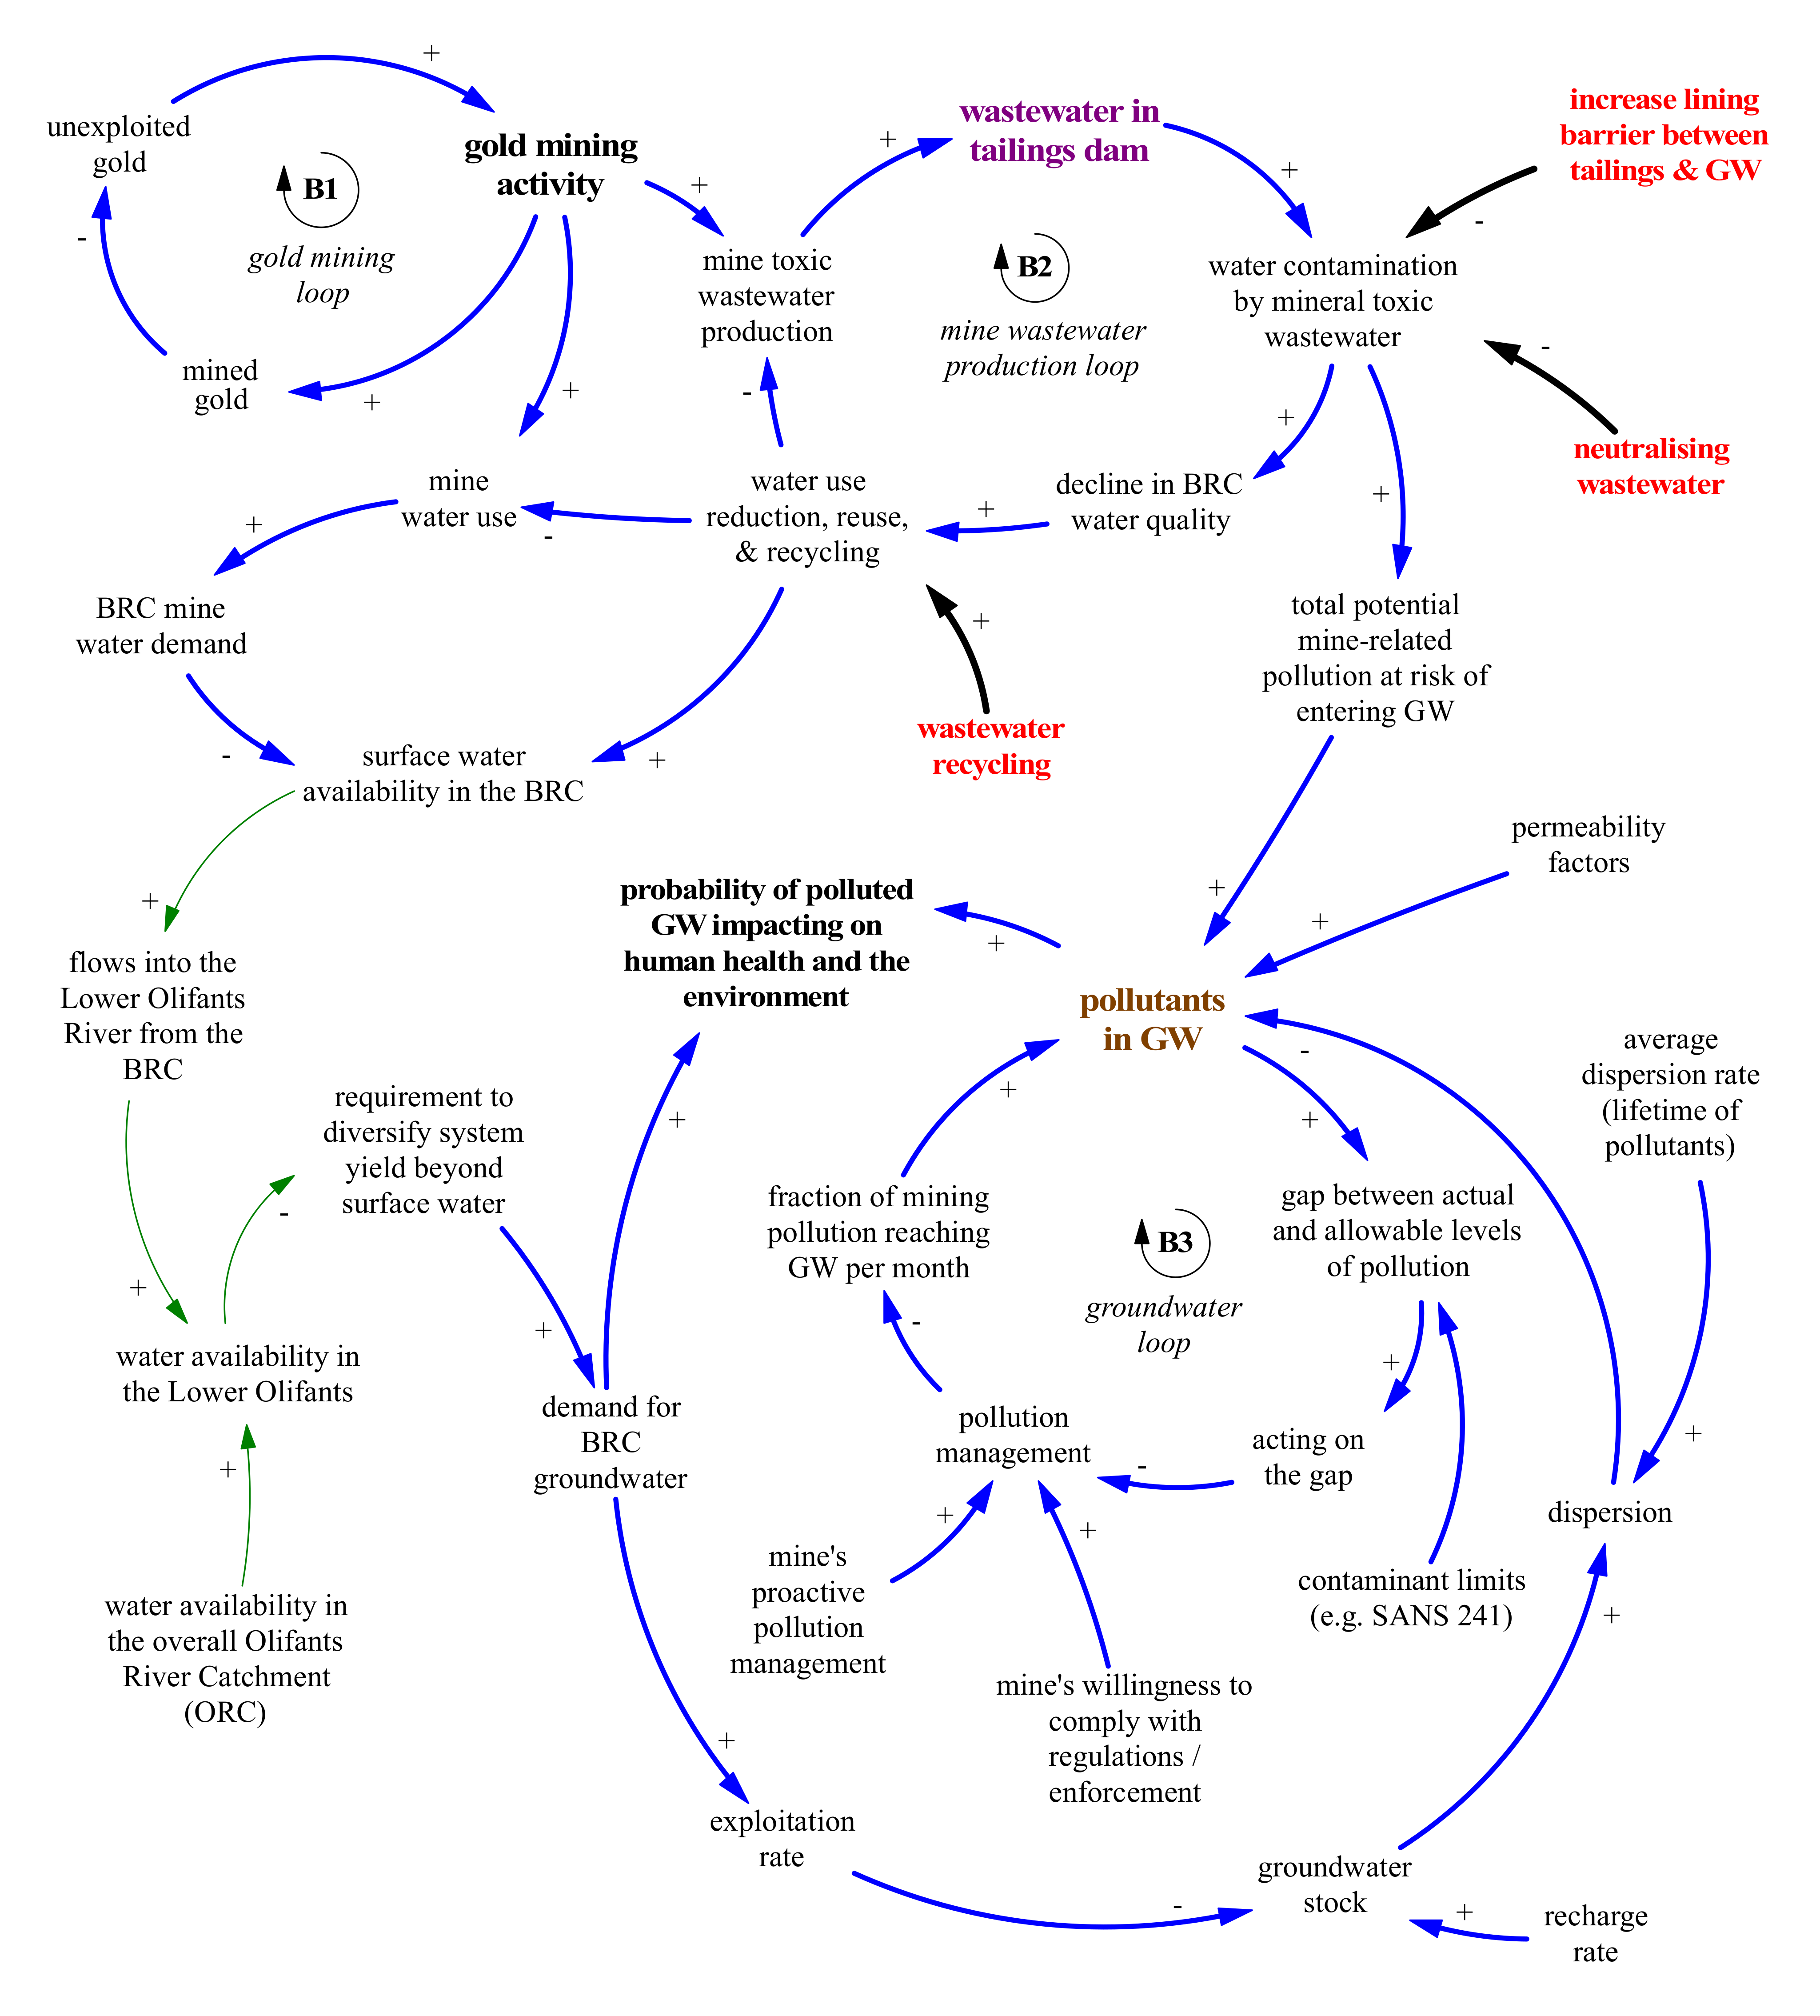
2.2. The Causal Loop Diagram (CLD) of the Problem Conceptualisation

The causal loop diagram (CLD) analytical tool used to represent the relationship between systems variables and dynamic feedback structures was constructed using Vensim modelling software (Ventana Systems Inc. 60 Jacob Gates Road Harvard, MA, 01451, USA, http://www.ventanasystems.com/). The overall structure of the CLD (Figure 2) represents the links between water use in gold mining operations and the broader water resource system. Mining operations require water, which is abstracted from the adjacent streams of the BRC, resulting in a decrease in the volume of water available within the river system. The decrease in the available water in the river is exacerbated by climate change and the ability of the river to supply water to water users downstream during drought events.
The top half of the CLD in Figure 2 introduces impacts of gold mining activities in the BRC, depicting the interaction between mining water use, wastewater and potential pollution, and the associated risks of contamination. Therefore, ‘unexploited gold’ in the BRC drives the ‘mining activity’ (gold ore excavation and gold processing) in the region. Mining activity results in ‘mined gold’ which, in turn, depletes the unexploited gold reserves, forming the gold mining balancing feedback loop (B1). The mine wastewater production balancing loop (B2) represents toxic wastewater production from mining. The oxygenation of sulphide minerals such as pyrite through mining activity can increase contamination concentrations in local water resources. The wastewater in the tailings dams drives a decline in BRC water quality, which drives the potential water reduction, re-use, and recycling. Hence, this can be mitigated by processes that can either reduce the toxicity or reduce the quantity of wastewater generated in the mine. Toxic wastewater increases the potential for groundwater contamination. Contaminant levels are supposed to be managed within nationally recommended contaminant limits. When the actual contaminant levels are higher than these limits, then a gap forms. Closing this gap, either proactively or in response to government-enforced compliance, would serve to reduce the fraction of mining pollution potentially impacting the groundwater in the region, forming the third balancing feedback loop (B3).
Water availability in the Lower Olifants is reduced when the surface water availability in the BRC is reduced by water demands from mining being met. Water availability in the lower Olifants, downstream of the Blyde, is also impacted by the overall drivers, both natural and anthropogenic, that impact water availability in the Olifants River Catchment. In the Olifants River Catchment, this situation has led to the demand for groundwater in the BRC to grow. Increased groundwater demand combines with mining-driven pollutants to increase the overall probability of polluted groundwater impacting human health and the environment. The demand for groundwater increases the ‘exploitation rate’, reducing the ‘groundwater stock’ unless the exploitation rate is carefully managed in relation to the ‘recharge rate’ (see Table 1 for relevant rates). The quantity of groundwater in the groundwater stock impacts the dispersion of pollutants, affecting the lifetime of pollutants in the water body. The less the groundwater stock, the lower the dispersion rates, and the higher the number of pollutants in the groundwater.

2.3. Dynamic Simulation Model Specifications, Settings, and Model Description

2.3.1. Model Specifications and Settings

The model was built in Stella Architect (v.1.9), dedicated system dynamics software developed by iSee Systems©. The model time horizon is a 40-year yearly interval from 2000 to 2040, which accounts for the planned mining period from 2009 onwards whilst allowing for an initial nine years for model calibration purposes. A quarterly delta time (DT) was selected. The DT of 0.25 resulted in a total of 160 time-steps (40 years × 4 time-steps/year), which is well within the established best practice in the SD domain of aiming for a total of <103 time-steps [22] and yet a sufficient number of time-steps to simulate the desired reference mode behaviour. For the evaluation of the differential equations, the Euler integration method was chosen over Runge–Kutta 2 or 4 (RK2 or RK4). Euler integration was deemed sufficiently precise given the combination of functions used in the model and the content of the model. Note that the choice of DT, time-step, and integration method were all tested as part of the model verification and validation procedures (see Section 2.4).
The next four sub-sections describe the structure of the simulation model with reference to the model’s stock-flow diagrams (SFDs). The model structure presented here was developed through the standard SD modelling process of iterating between stages of conceptualising the problem, formulating the model, and running simulations [22,31]. The SFDs represent the accumulation levels in which the integration functions are calculated. The flows in the model structure provide channels of input and output to, and from, the stocks, representing the environmental and technical parameters that influence the accumulation and the depletion of the stocks. The model is described by a sub-model, with a narrative explanation and key equation formulations accompanying the SFDs. A summary table is provided at the end of the model description that details important model parameters and the associated sources of data (see Table 2).

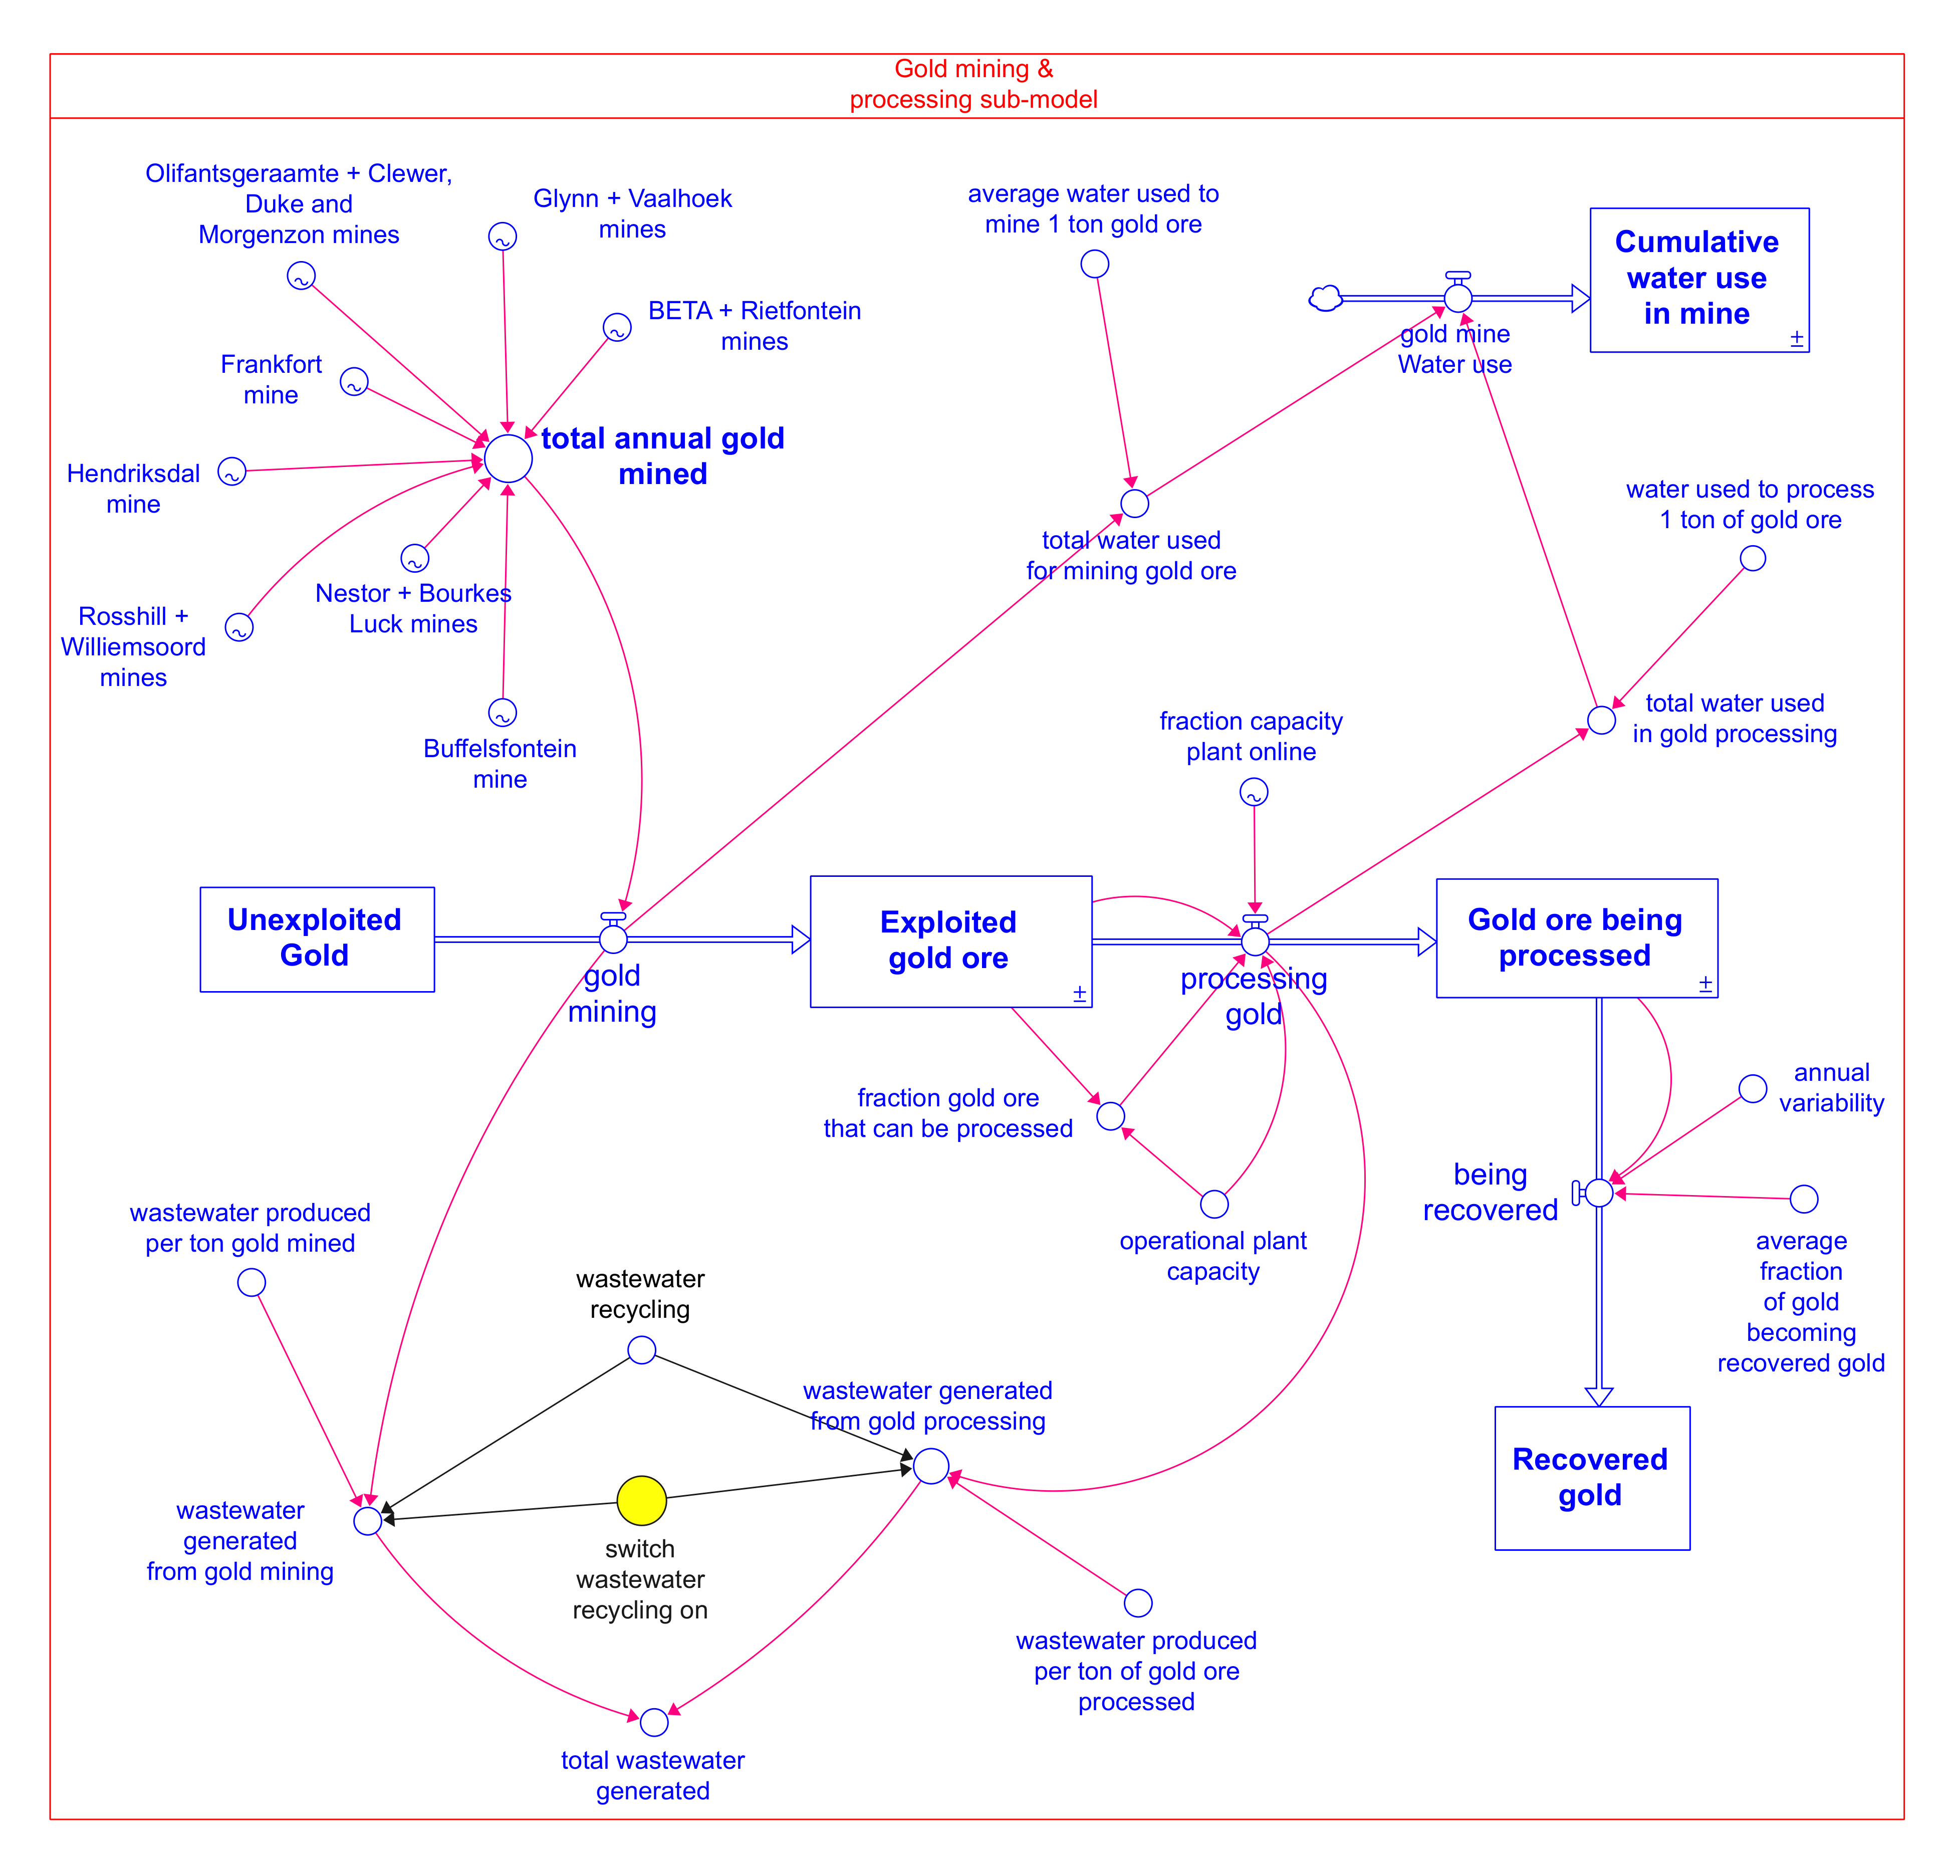
2.3.2. Gold Mining Sub-Model

The mining sub-model is the representation of the mining process that occurs in the Sabie and Pilgrim’s Rest region (see Figure 3). The mining process is explained in the mining plan from the Transvaal Gold Mining Estate (TMGE) competent person’s report and the mining plan [19]. The mining project is planned to mine a total resource estimate of 25,280,000 tonnes in the Sabie and Pilgrim’s Rest regions over the 40-year period in the 13 mines being studied.
The mining sub-model, shown in Figure 3, is a mining chain with four stocks, starting from unexploited gold, which is a limited reserve. This represents the gold mining process in the mine operation. The unexploited gold stock is depleted by the yearly gold mining rate as a function of the total annual gold mined variable. This flows into the exploited gold ore stock which is, in turn, depleted by the gold processing flow that takes place at a gold processing rate, which is a function of processing plant capacity and the fraction of ore processed. This rate influences the accumulation in the third stock in the chain (namely, the gold ore being processed stock) before flowing into the recovered gold stock [19,32,33].

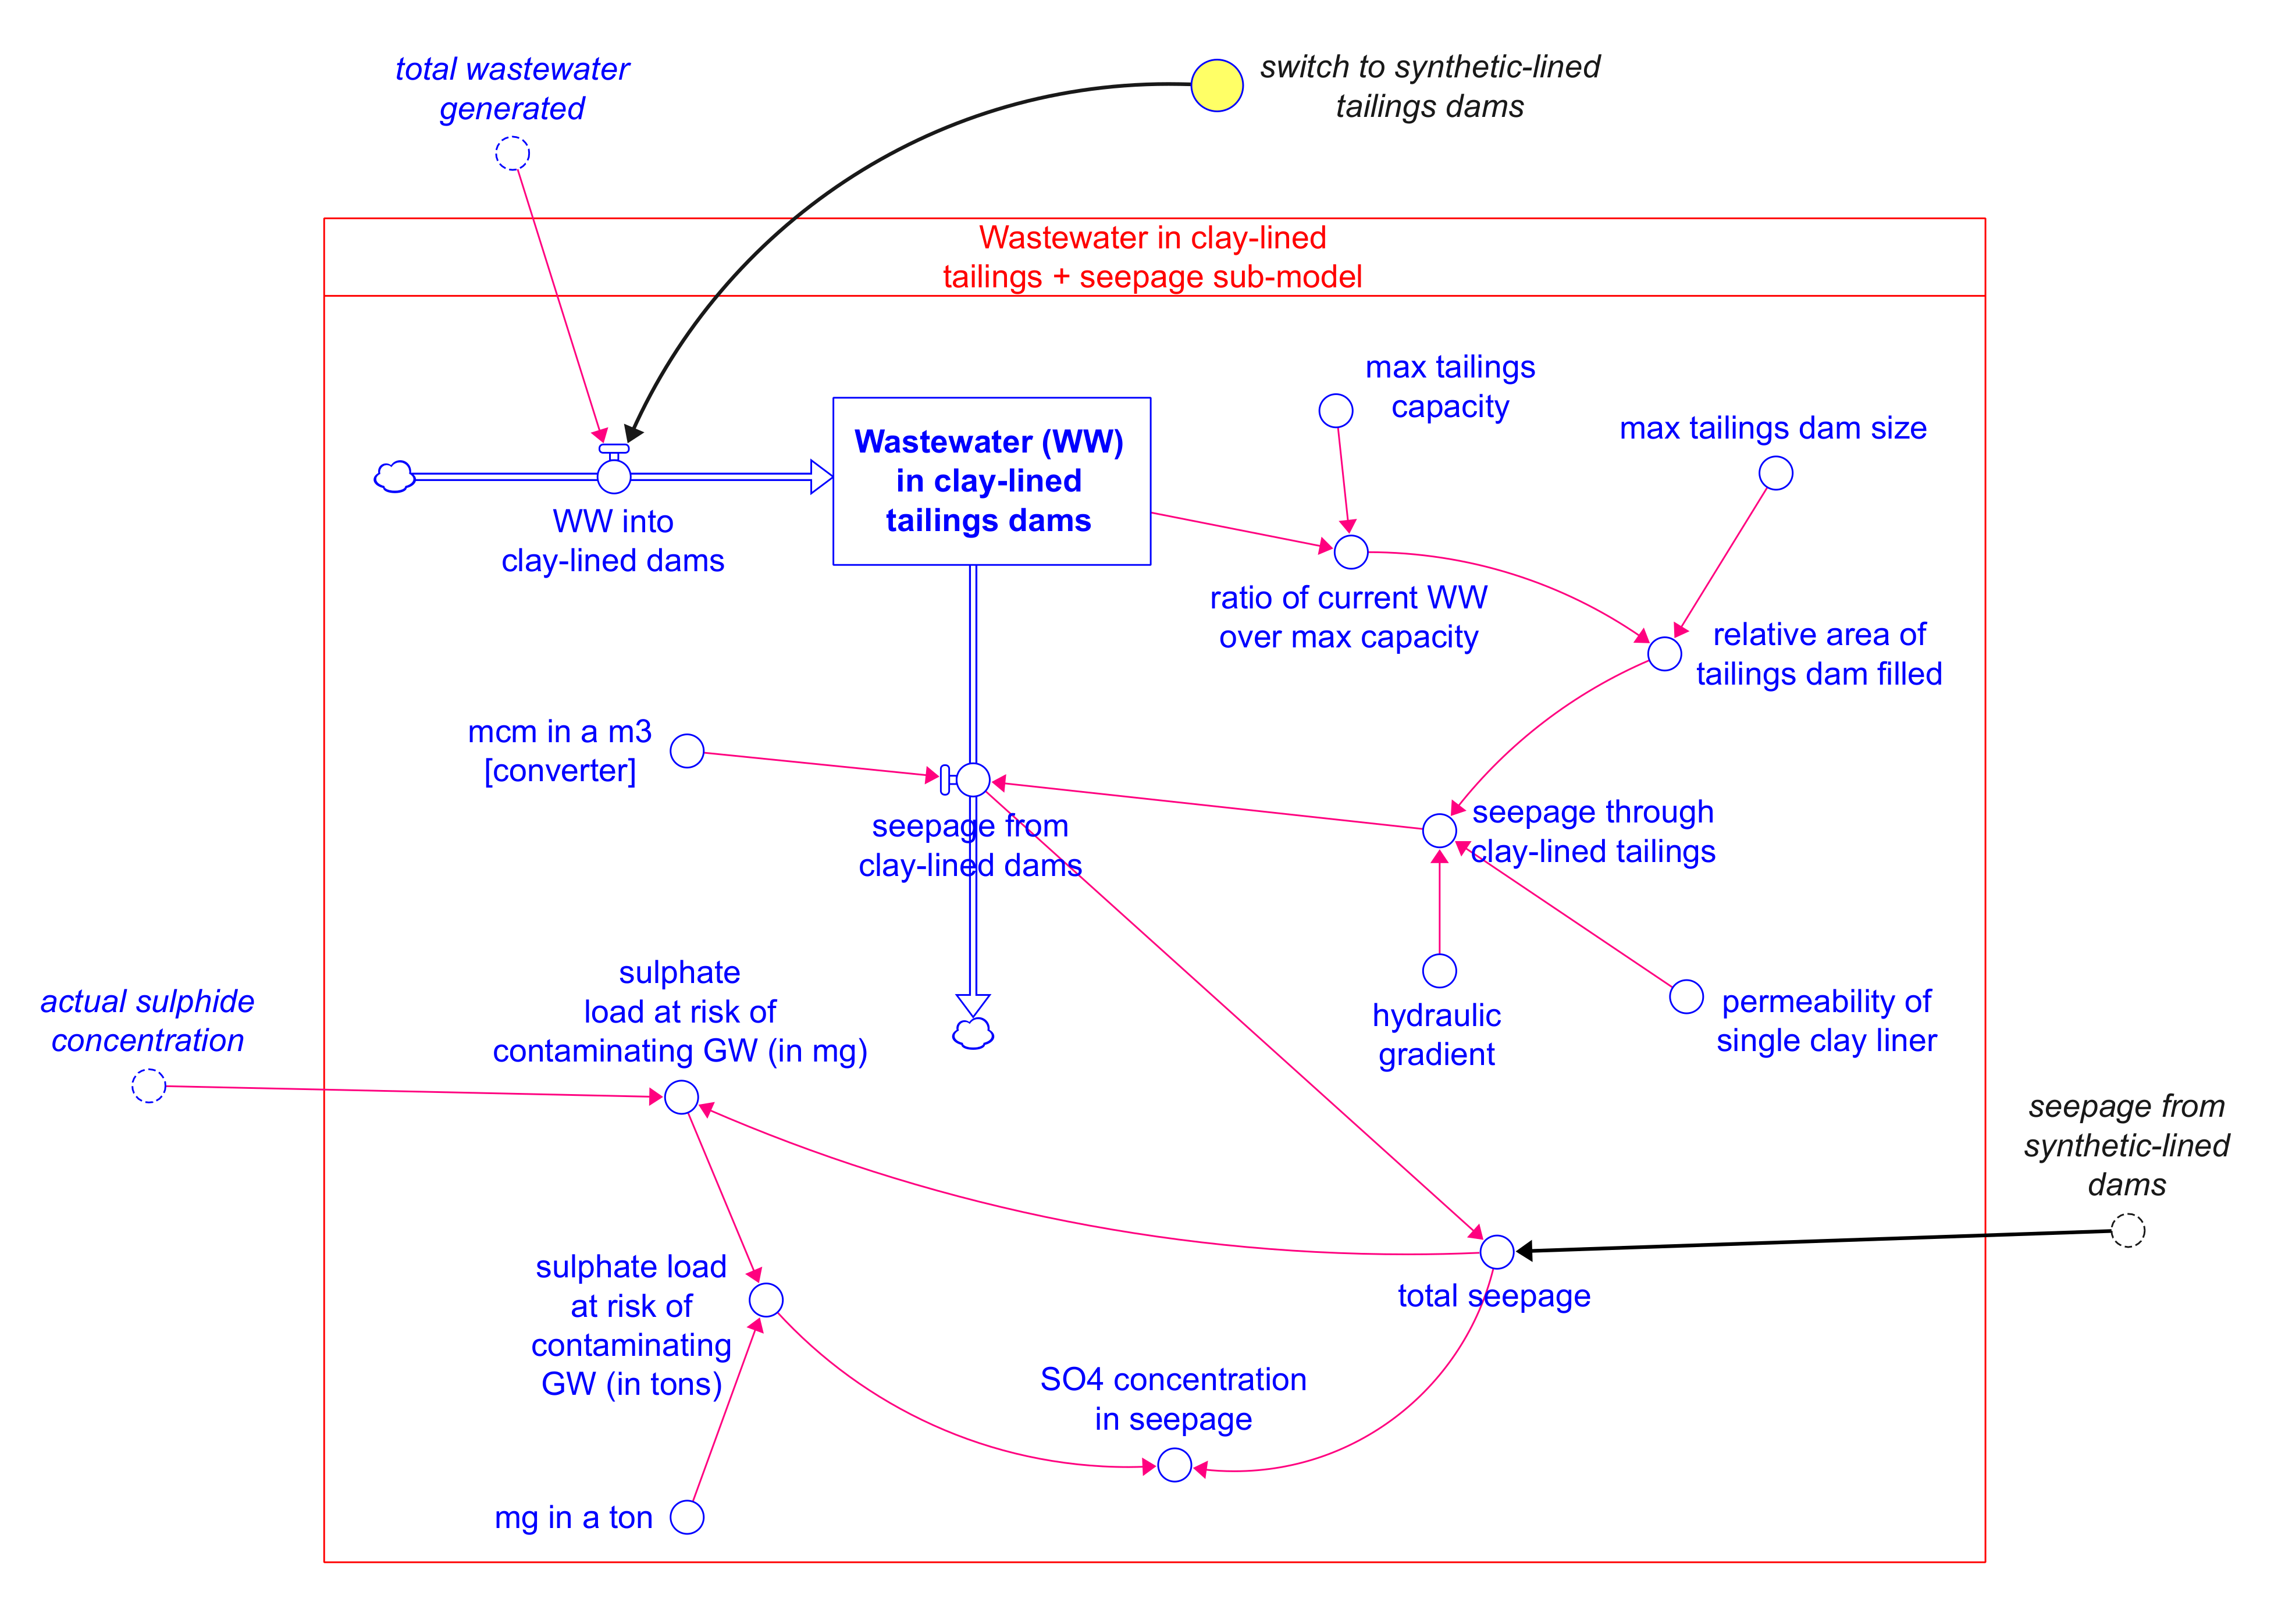
2.3.3. Wastewater Management and Seepage Sub-Model

The wastewater component of this sub-model represents wastewater produced in the mining process (see Figure 4). The model is built with the assumption that wastewater produced during mining and processing is discharged into the tailing dams. This sub-model is based on the amount of water produced per tonne of ore mined during the mining stage and the amount of wastewater discharged from the processing stage of the mining sub-model, which is the total wastewater generated (TWG) (see Figure 3). The Wastewater in clay-lined dams (WWD) stock represents the total amount of water produced and discharged into the tailing dams. The flow of wastewater (WW) into clay-lined dams ( r W W C ) represents the amount of wastewater produced from mining and gold processing that is discharged into the tailing dam. This flow represents the inflow of wastewater from the mine operation into the stock, and the outflow in this stock is represented by seepage from clay-lined dams   r S .
Seepage control by clay-lined tailing dams, which is the standard practice, is shown in the second main part of the sub-model shown in Figure 4. Clay lining has high permeability relative to the synthetic dam liners, which is an intervention aimed to reduce seepage in the tailings dam that is tested in the model (the full model equations for this intervention are detailed in Table S2). The mitigation intervention is onset by the switch to synthetic-liner tailing dams variable ( s w s y n t h ) . Therefore, s w s y n t h is equal to zero when the synthetic-liner is not implemented, and the switch is equal to 1 when this mitigation measure is implemented hence reducing permeability in the tailings dam. Whether any wastewater flows into the stock of wastewater in synthetic-lined tailings dams is determined by the inflow of wastewater into synthetic-lined dams (rwws), as per Equation (1):
r w w s =   IF ( s w s y n t h = 1 )   THEN IF   TIME > 2021   THEN   T W G   ELSE   0 ELSE   0
Potential seepage chemistry in the mine area was determined through leach testing of the goldfields in Sabie and Pilgrim’s Rest regions, as reported in Rudzani et al. [34]. The results concluded that the sulphide concentration is the highest contaminant concentration in tailing wastewater in this region. Hence, the contaminant concentration in the model is based on the sulphate concentration in addition to the pollution plume simulation done in this area. Sulphide concentration is used as the indicator pollutant in the plume due to the high sulphate concentrations measured in groundwater near the tailings dams [34].

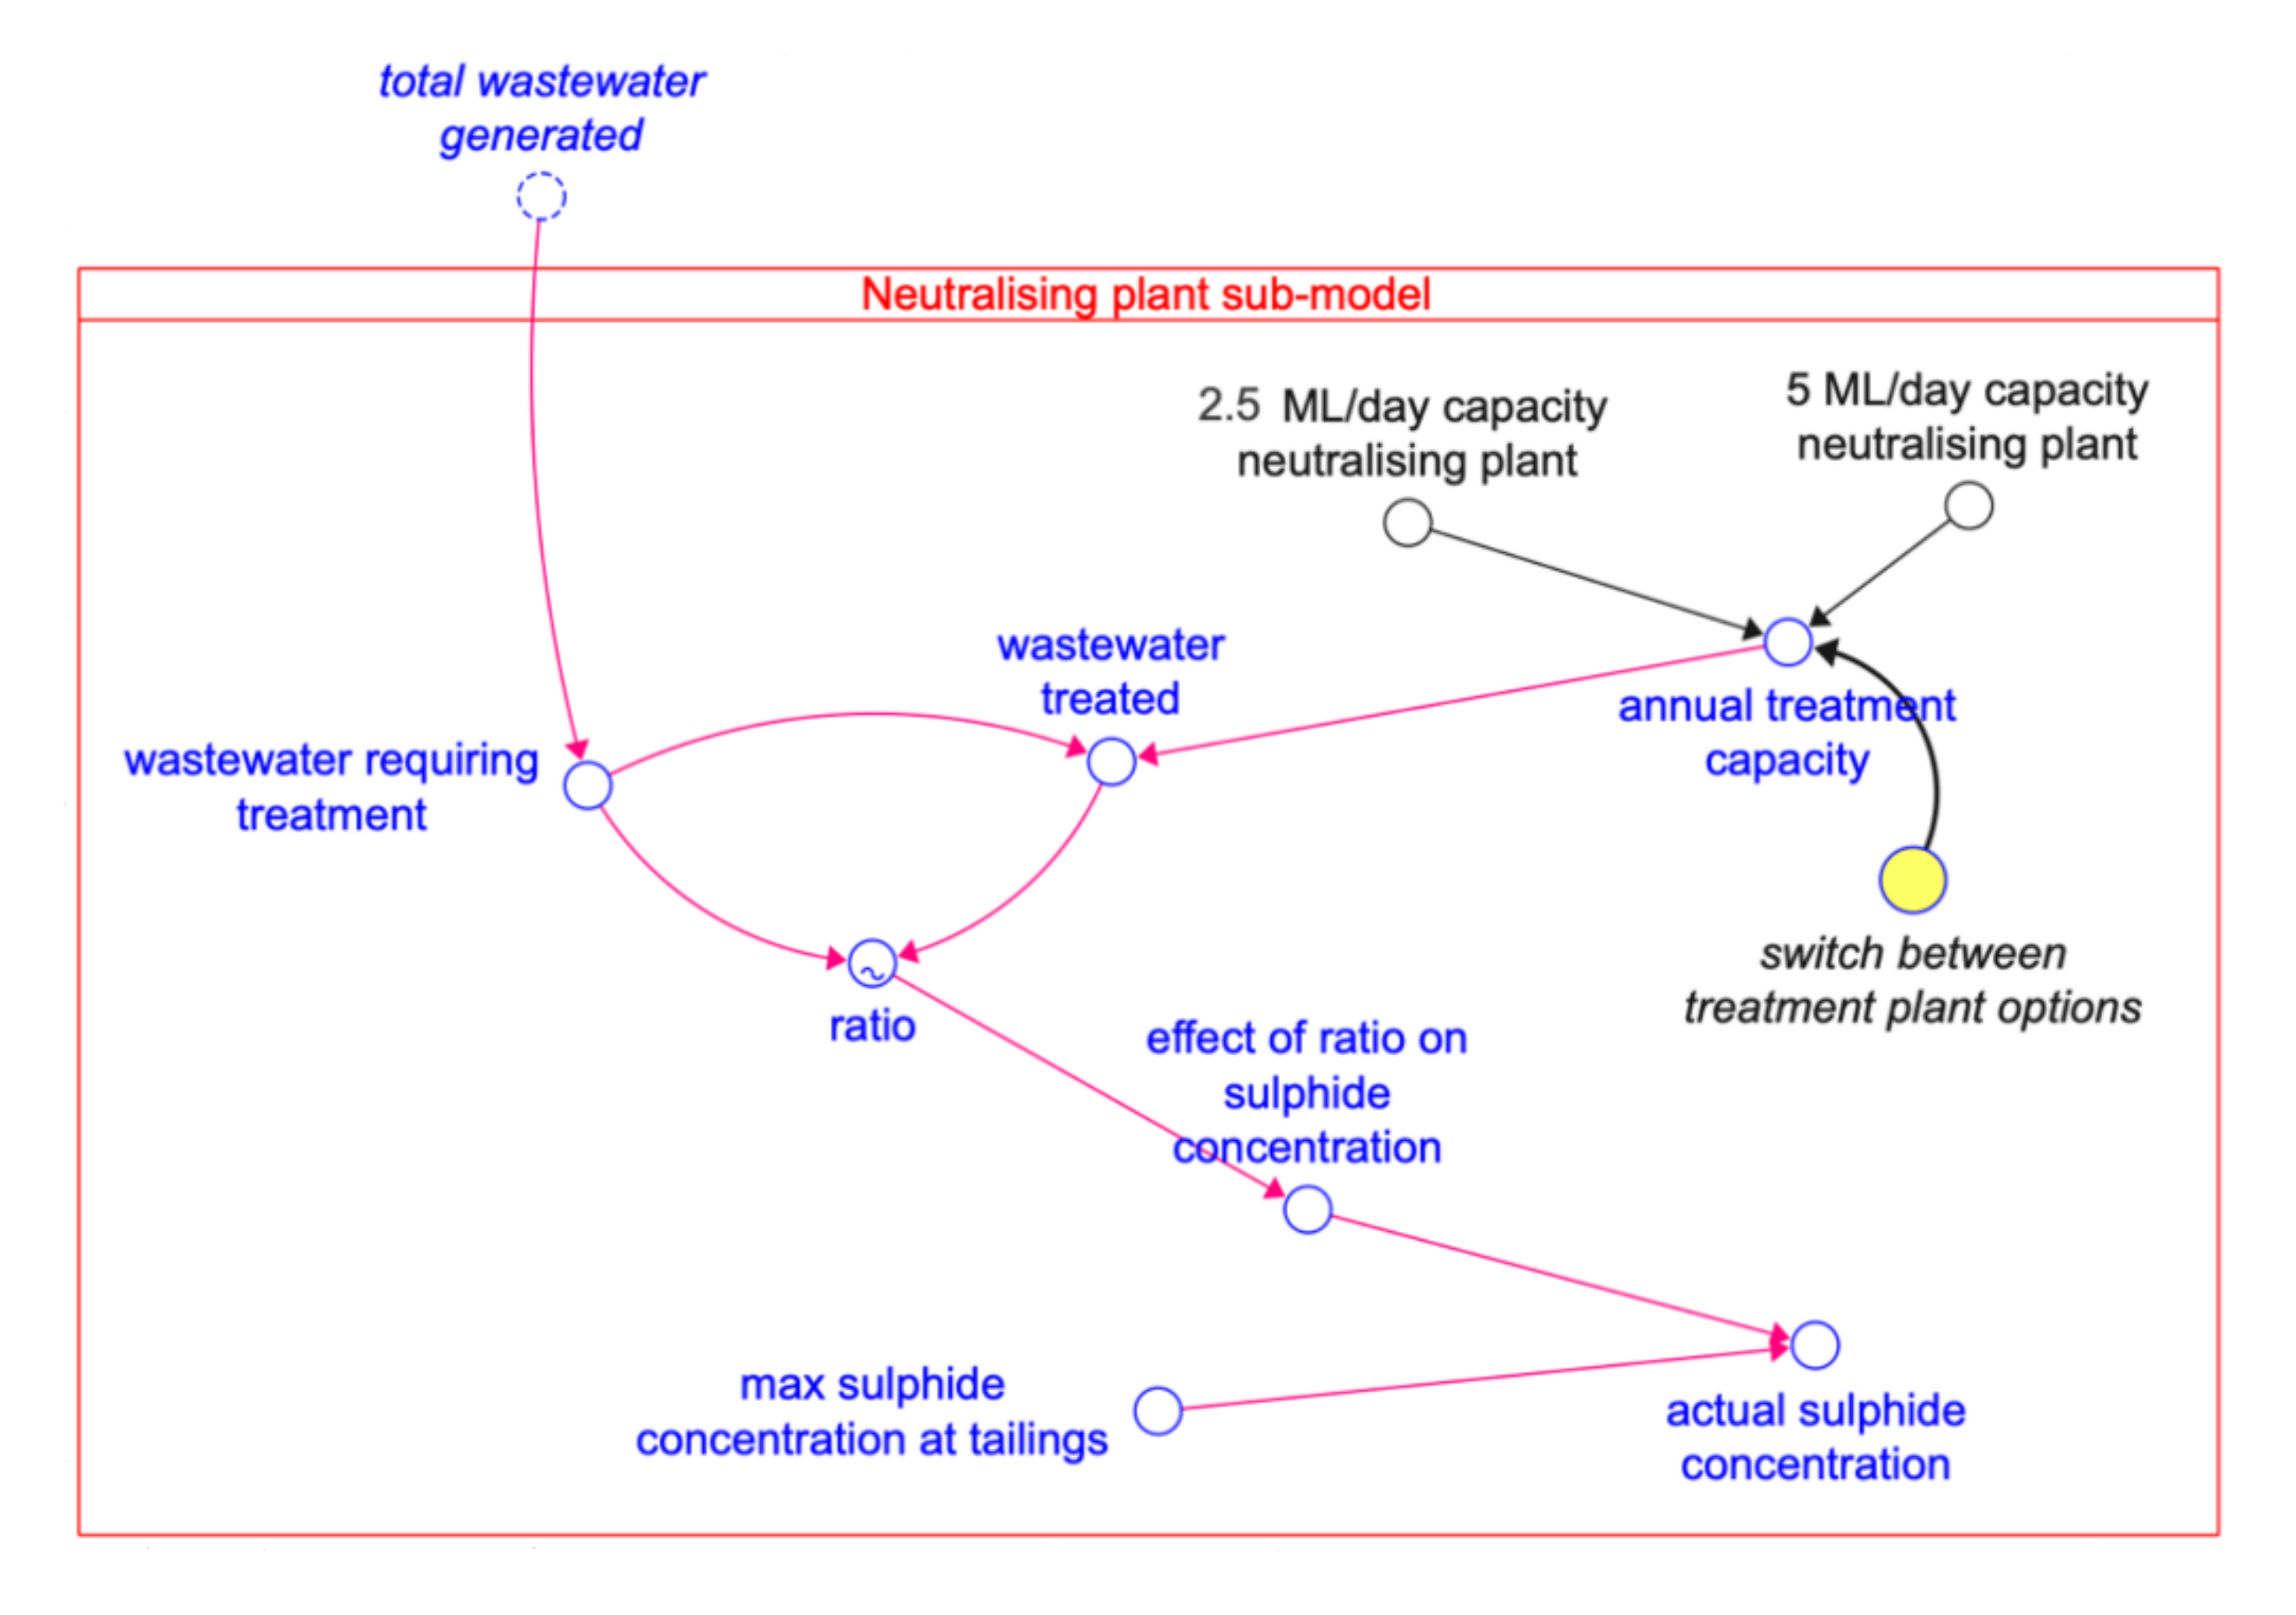
2.3.4. Neutralising Plant Sub-Model

Sulphate loads can be reduced via neutralising processes managed through a treatment plant, which is simulated via the model structure shown in Figure 5. The variable wastewater treated (WWT) is calculated using the quantity of wastewater requiring treatment (WRT), which is equal to the total wastewater generated (TWG) (see Figure 3), and the annual treatment capacity (ATC) according to the logic in Equation (2):
W W T = IF   W R T < A T C   THEN   W R T   ELSE   A T C
The conditional IF THEN ELSE function in Equation (2) uses the ATC to constrain the quantity of wastewater treated WWT. The ATC is adjusted by a switch between treatment plant options ( s w t r e a t ) that either (a) leaves treatment capacity at zero; (b) activates a 2.5 megalitres per day (ML/d) capacity neutralising plant (Plnt1); or (c) activates a 5 megalitre per day (ML/d) capacity neutralising plant (Plnt2).
The ratio of how much wastewater is treated (WWT) over how much wastewater is required to be treated (WRT) drives the actual sulphide concentration. This is modelled via a simplistic effect based on the logic that a higher ratio of ( W W T W R T ) means that less wastewater is left untreated; when the ratio of ( W W T W R T ) is low, then more wastewater is left untreated. This logic establishes an inverse relationship between the ratio and its effect on sulphide concentration used to drive the actual sulphide concentration, which, in turn, affects the sulphide concentration of seepage into the groundwater.

2.3.5. Groundwater (GW) Sub-Model

Mining and groundwater resource development in the BRC are conflicting activities that require trade-offs. Mining activity carries the risk of groundwater contamination, which reduces the contribution to the groundwater resource in the Pilgrim’s Rest region and, in turn, affects the overall supply strategy for the Olifants River Water Supply System (ORWSS). The groundwater sub-model (see Figure 6) represents the amount of groundwater in the Pilgrim’s Rest region. The stock inflow is represented by the aquifer recharge rate which is the rate at which water accumulates in the aquifer (note that the actual variability in the recharge rate is excluded from the model), with an average recharge rate derived from the groundwater assessments reported in the South African national Department of Water and Sanitation (DWS) [13,16]. The stock is reduced by three outflows which account for the current groundwater use, the potential groundwater water use in the proposed water resource development project, and the aquifer discharge, which is the rate at which water moves through the region.
The values used in the groundwater sub-model are derived from the DWS assessment summarised in Table 1.
The groundwater that is at risk of contamination from mining is quantified using a simple risk factor derived from how much groundwater is abstracted and the ratio of the seepage concentration over the South African National Standard (SANS) 241 limit [33]. The higher the ratio and the more groundwater that is abstracted, the greater the risk of groundwater contamination by gold mining posed to groundwater development in the region. This risk factor is used as an indicator within the exploratory model, as noted in the results section that follows.

2.4. Model Validation and Documentation

Following Groesser and Schwaninger [38], model validity is understood as ‘the property a model has of adequately reflecting the system being modelled, contingent on model purpose’ (p. 157). The model described here was subjected to multiple tests of model validity in accordance with the best practices recommended by Barlas [39], Rahmandad and Sterman [40], and Ford [22]. Table 3 outlines the six model validation tests employed in this study, divided into two test categories, with the associated purpose and requirements for passing each validation test listed alongside the specific tools and procedures employed in this study.
Model documentation follows the best practices and guidelines stipulated by Rahmandad and Sterman [40] and Monks et al. [41]. The model itself is available on the iSee Exchange model repository (https://exchange.iseesystems.com/models/player/jai/brc-sd-model) and all model settings, equations, and values are detailed in the Supplementary Materials (Tables S1 and S2), enabling full reproduction of the model and the results presented in this paper.

3. Results

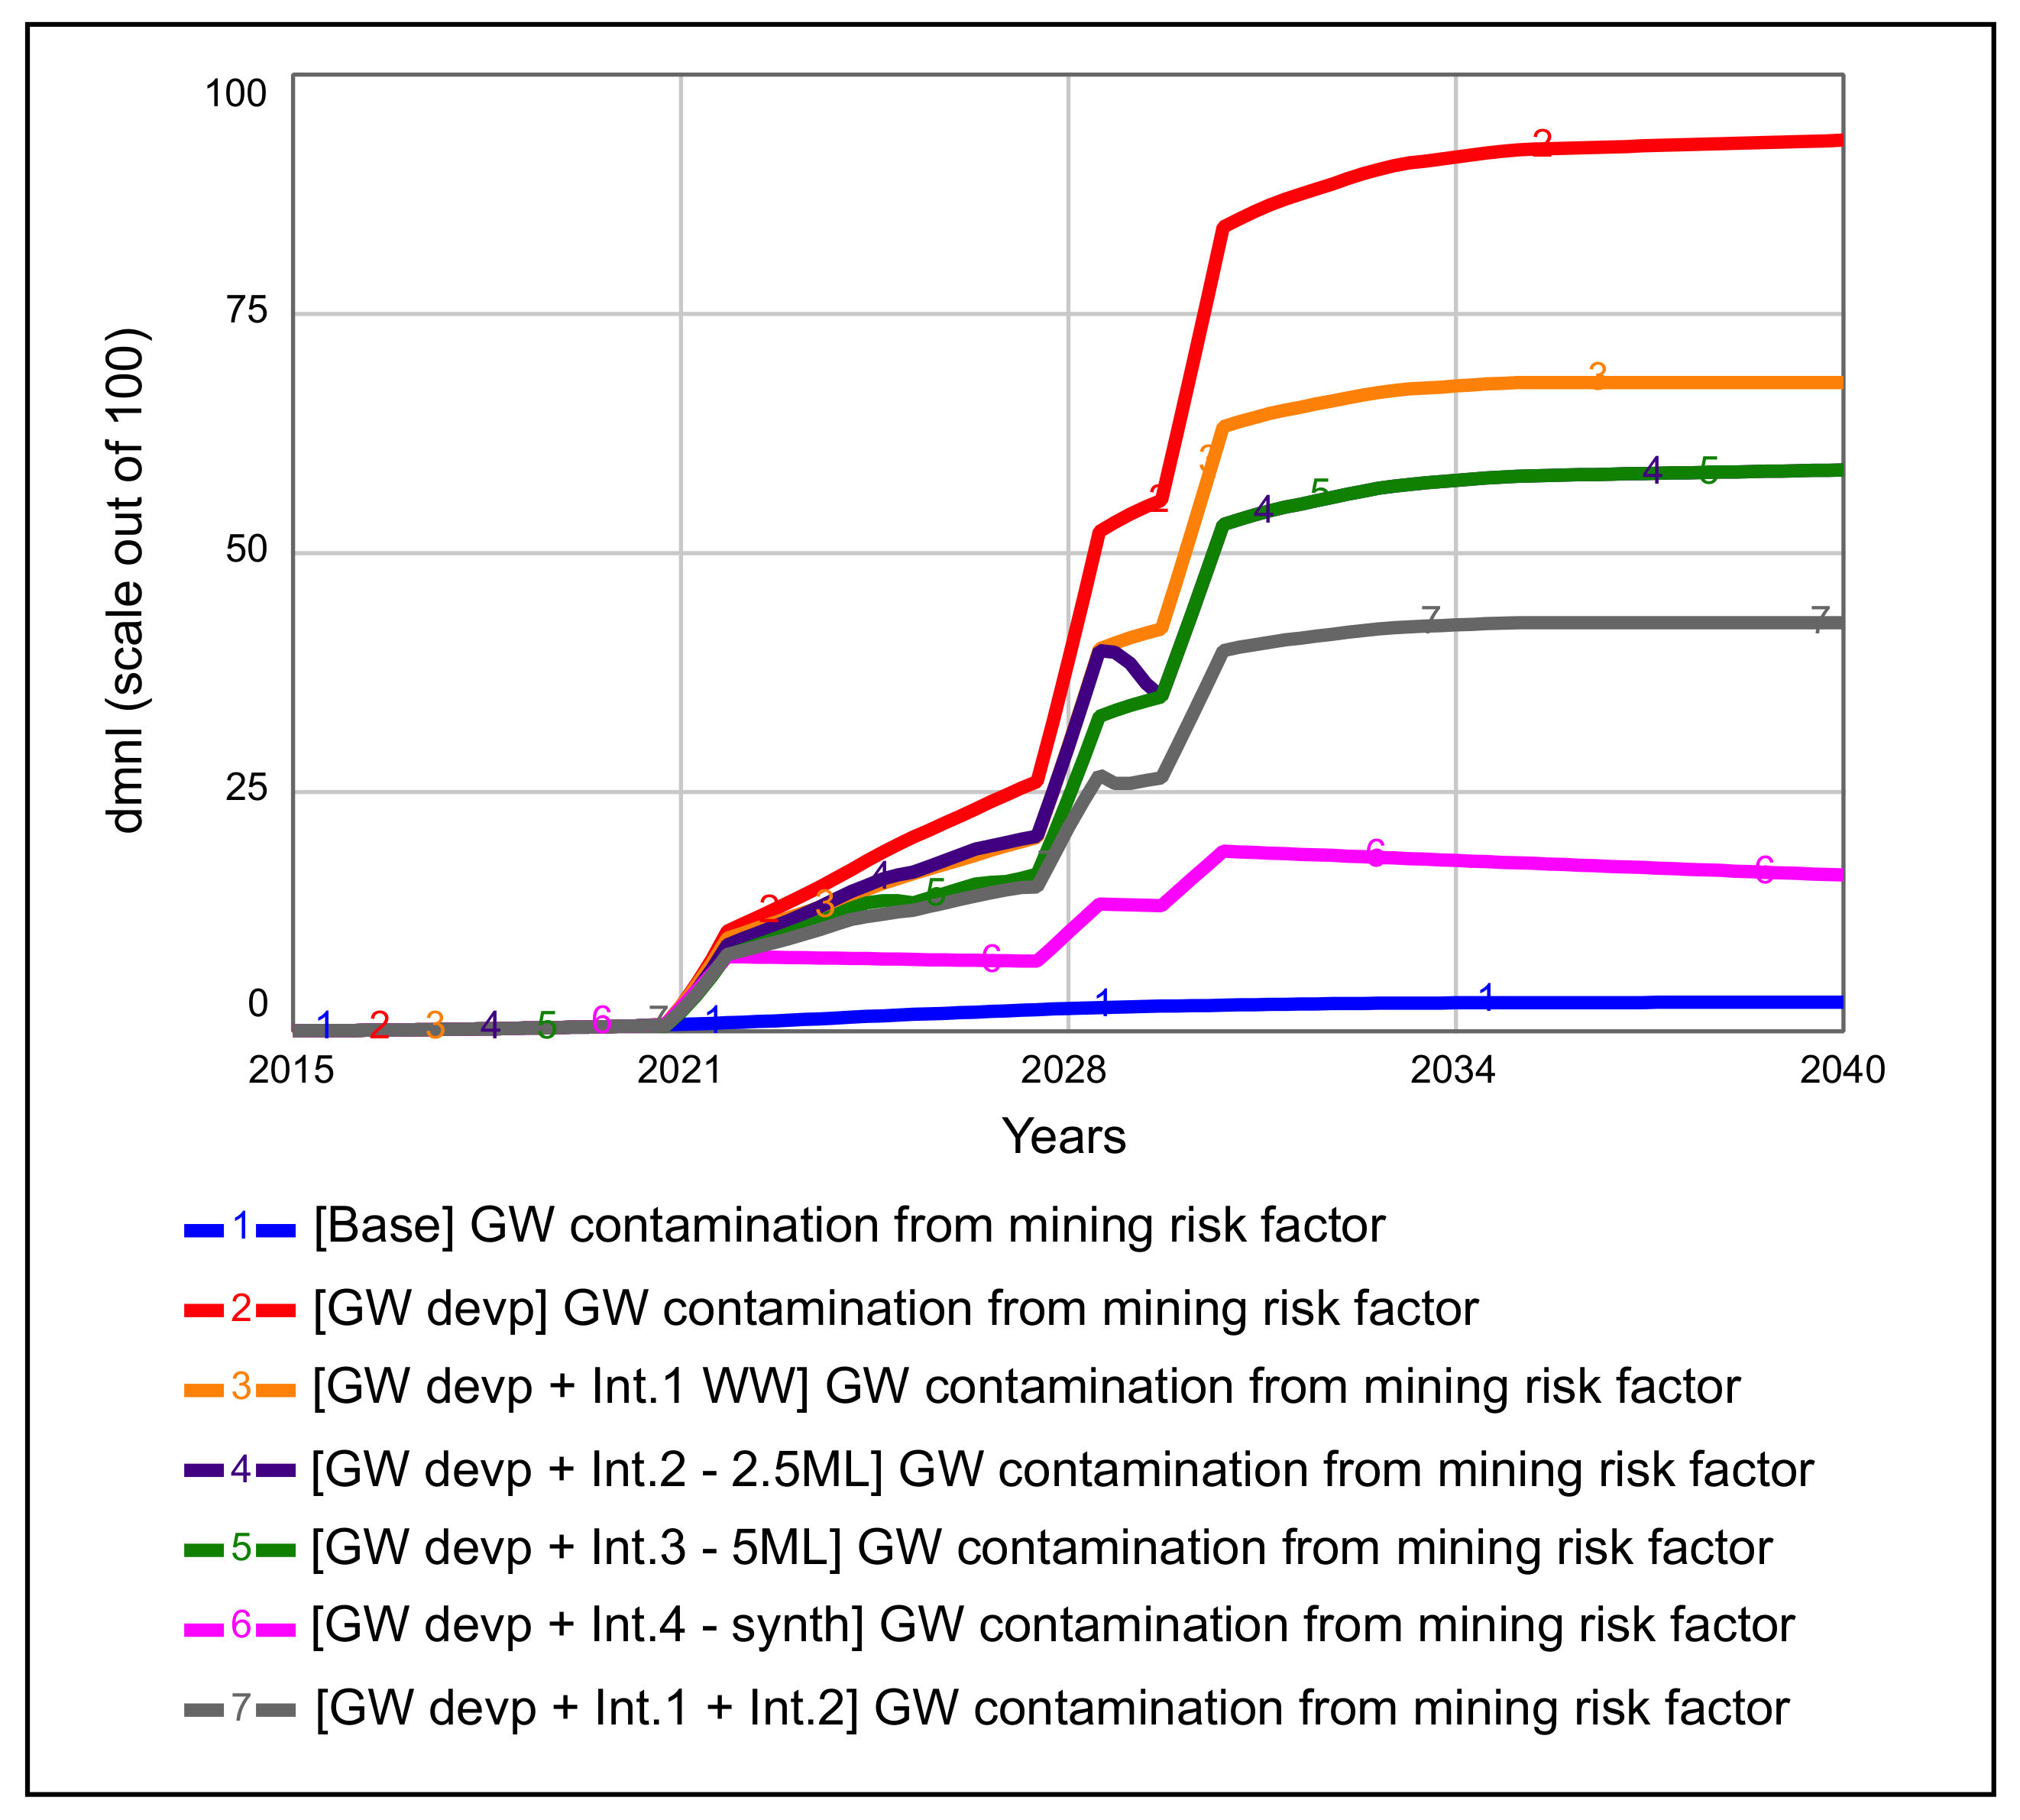
3.1. Testing and Comparing the Efficacy of Interventions

The simulation results of these interventions and scenarios are represented by time series graphs which aim to compare baseline conditions and the impact of mitigation intervention scenarios on groundwater contamination risk (see Table 4). The scenario of groundwater (GW) resource development in the Pilgrim’s Rest region of the BRC is then simulated, with the efficiency of each of the four interventions tested under a scenario of groundwater resource development.

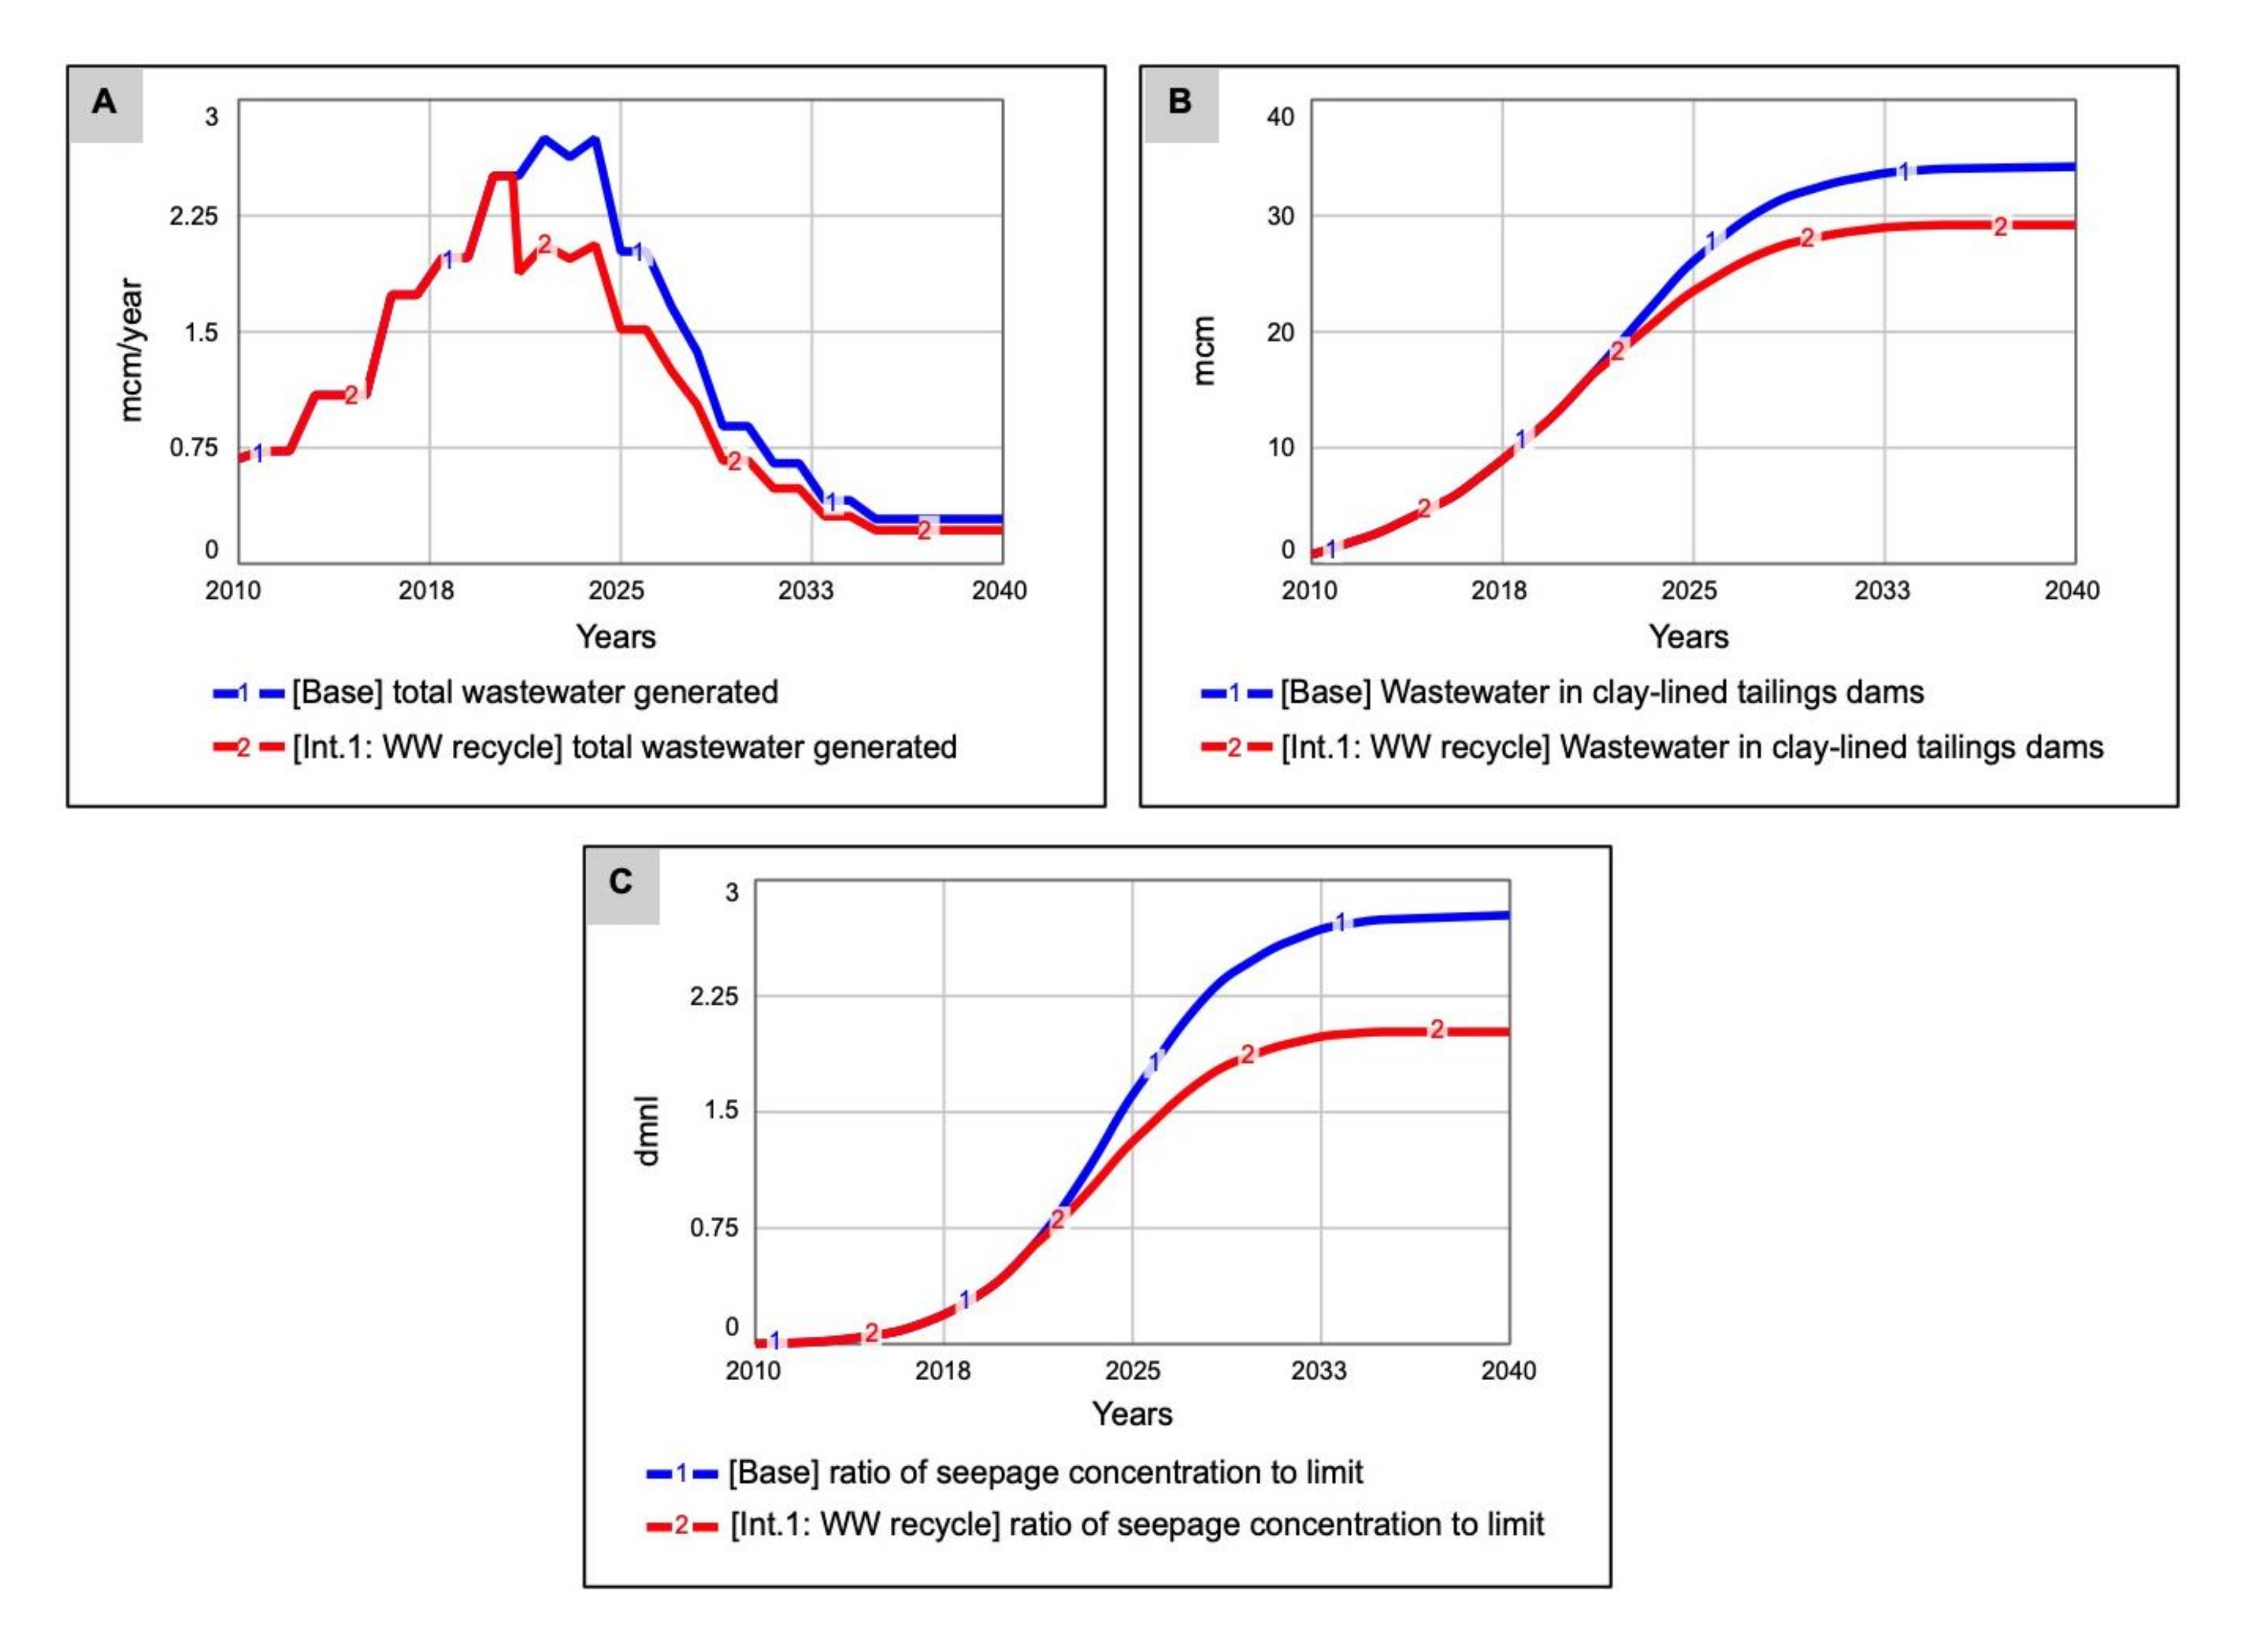
3.1.1. Intervention 1: Wastewater Recycling (Int.1: WW Recycle)

Simulation results for the wastewater recycling intervention are presented in three time-series graphs in the composite Figure 7 below. Figure 7A shows the change in the annual flows of ‘total wastewater generated’, which is the sum of ‘wastewater generated from gold mining’ and ‘wastewater generated from gold processing’ (see Figure 3 and associated text for description of the model’s structure).
Intervention 1 WW recycling simulates a 25% reduction of the wastewater generated by gold mining and gold processing that is destined for the tailings storage dam (because 25% of the wastewater generated is recycled). The 25% reduction starts in 2021, decreasing the ‘total wastewater generated’ from 2.51 mcm/year in the Base run to 1.88 mcm/year. Figure 7B represents wastewater accumulation in the clay-lined tailings dams. Initially, the curve shows no difference, but in 2025, the difference between the Base run and the Int.1 is 2.6 mcm and increases to 4.3 mcm by 2030 (Base run = 32.5; Int.1 = 28.2 mcm). Figure 7C represents the ratio of seepage concentration compared to the SANS241 limit. The effects of the Base run are evident in 2033when the seepage concentration is 270% of the above the SANS241imit compared with 200% in the Int.1 run in which wastewater recycling is taking effect (showing a change of 70% in the seepage concentration).

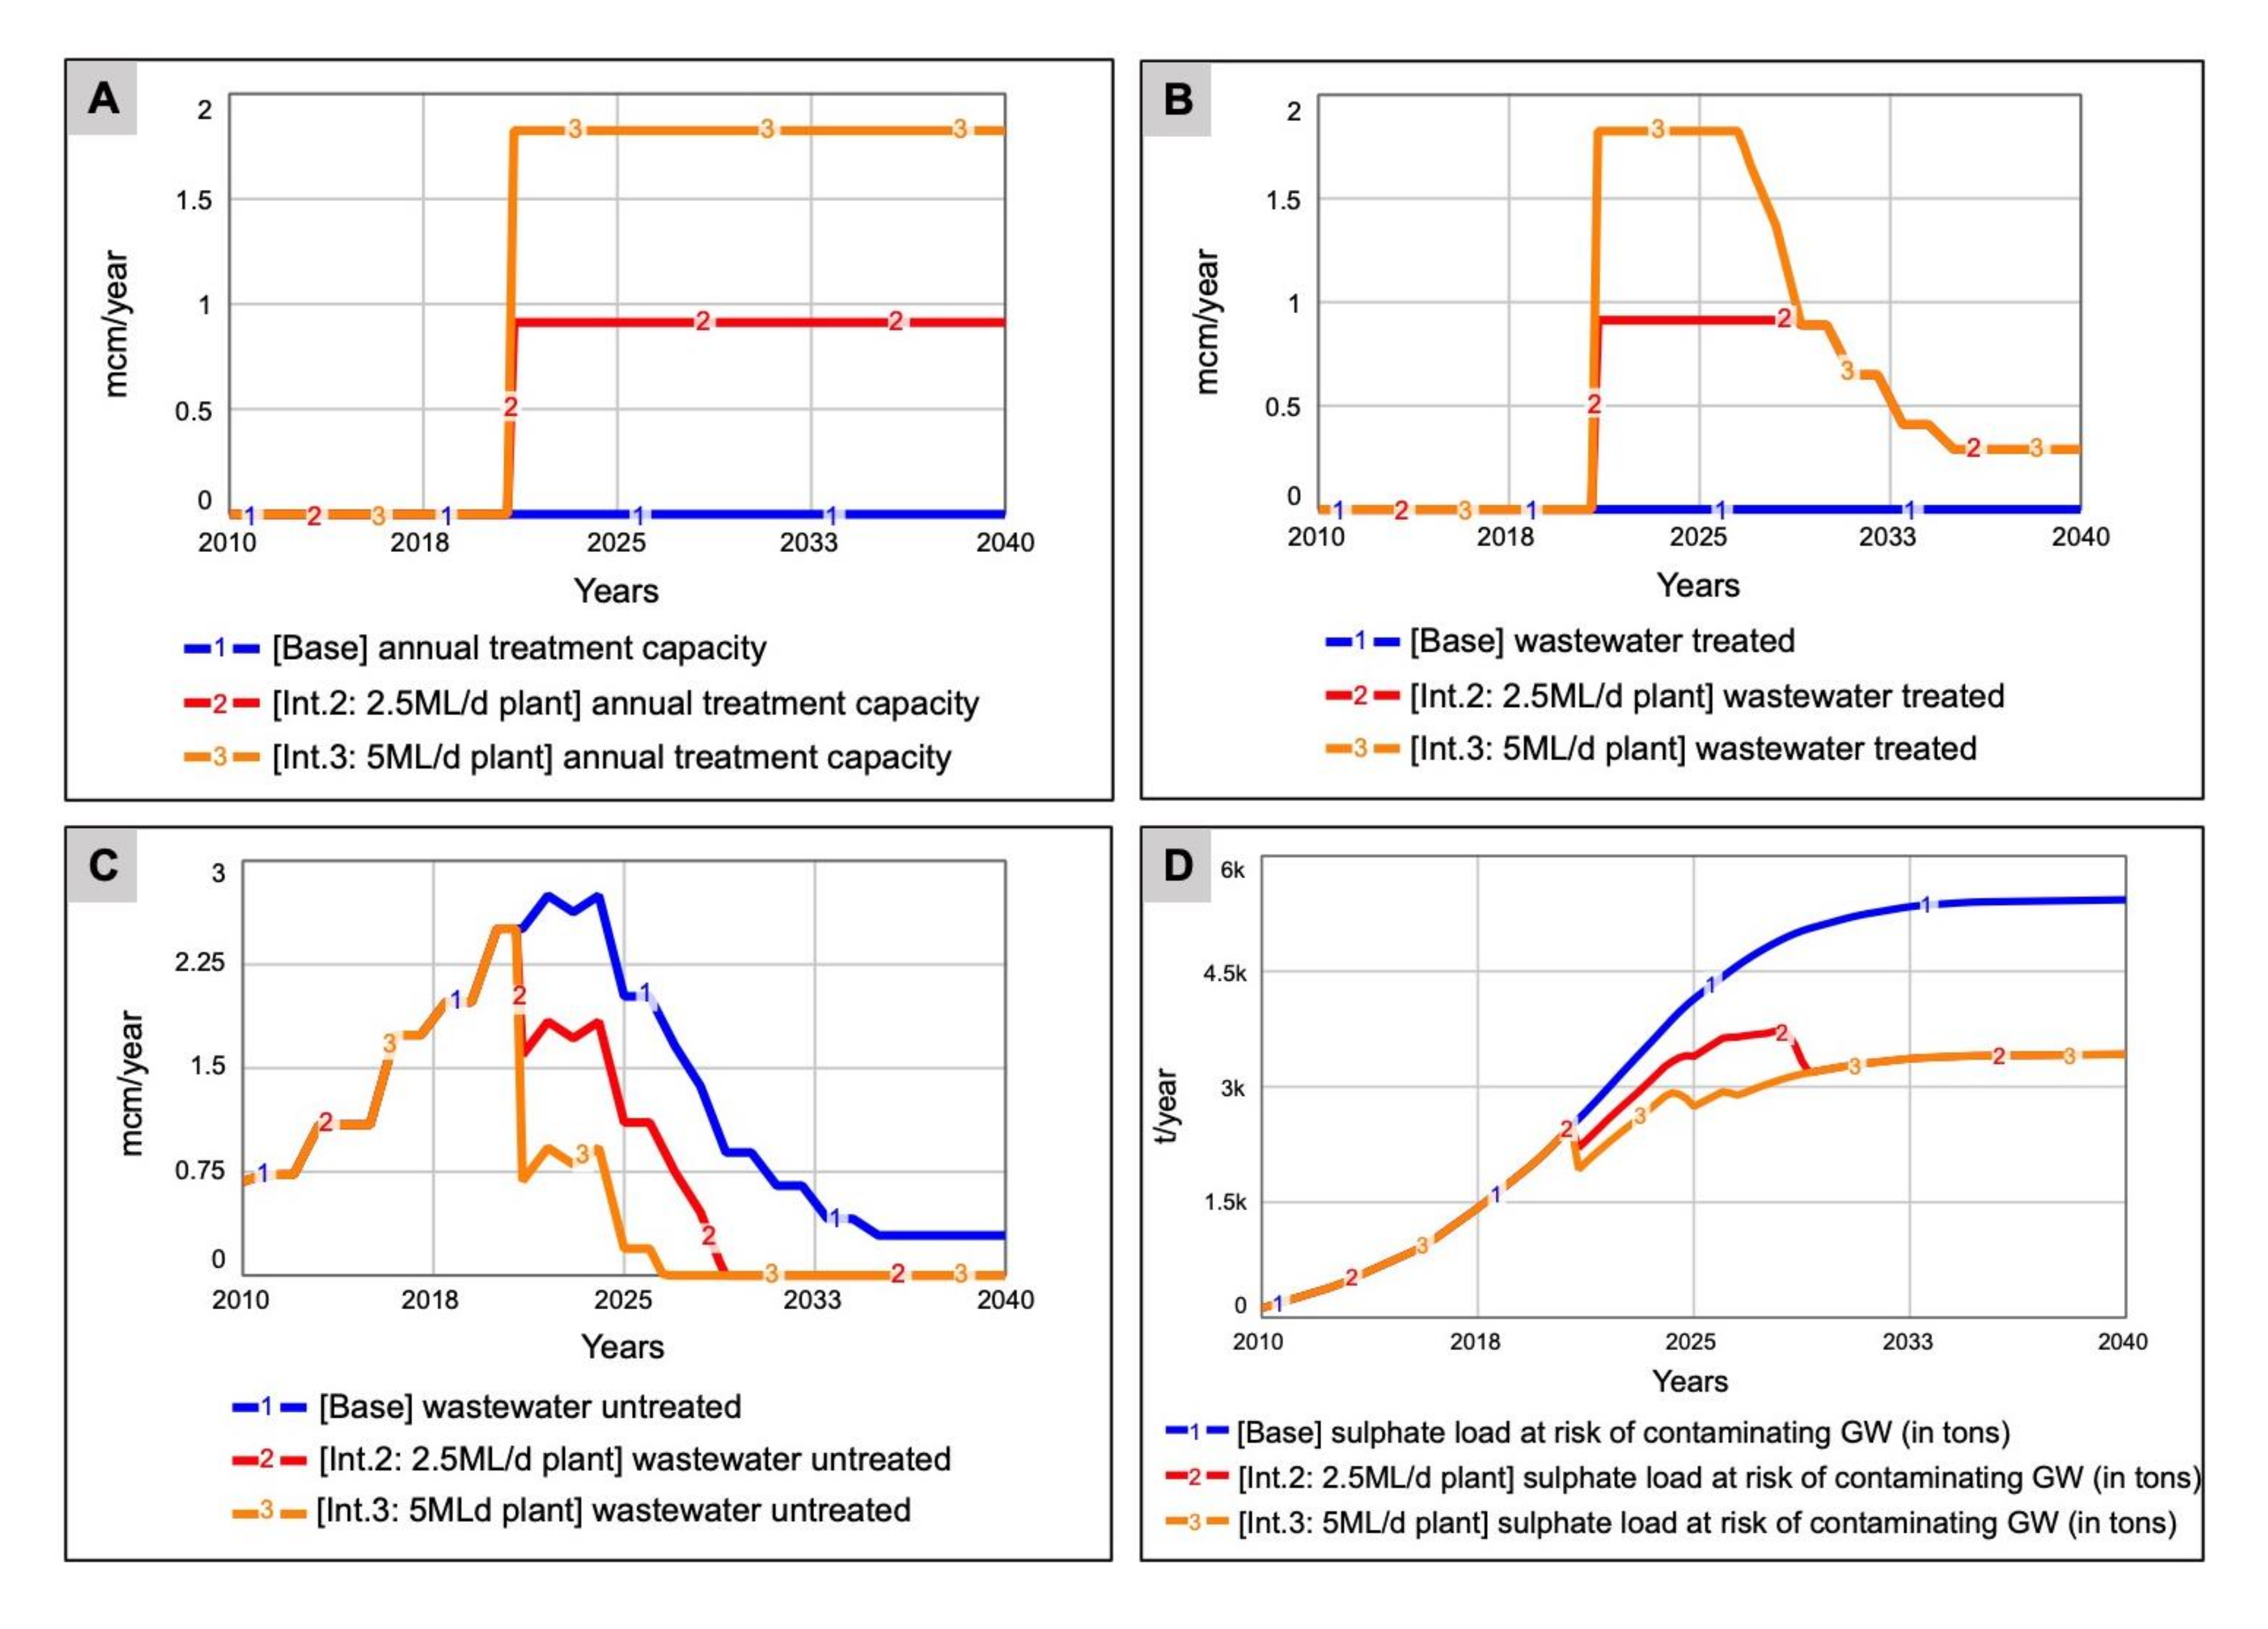
3.1.2. Intervention 2 (Int.2) and Intervention 3 (Int.3): Testing Two Capacities of Wastewater Neutralisation Treatment Plants

Interventions 2 and 3 test two capacities of a wastewater neutralisation treatment plant (see Figure 8 for details). These interventions decrease the amount of wastewater produced in the mine operation. The treated wastewater is that amount of water discharged from the mine operation into tailings dams. Figure 8A shows the model behaviour of the variable ‘annual treatment capacity’ and Figure 8B,C compare the quantity of wastewater treated and the water left untreated, respectively.
The simulation results depict the decrease in the amount of untreated wastewater generated in the mine. In Figure 8B, no wastewater is treated in the Base run. However, when the interventions are implemented, treated wastewater increases to 0.9125 mcm/year in Intervention 2 (Int.2) and to 1.825 mcm/year in Intervention 3 (Int.3) (see Figure 8B) with an associated decline in the quantity of wastewater left untreated (see Figure 8C). Figure 8D compares the rise in the sulphate load, calculated in t/year, that is generated by gold mining in the Pilgrim’s Rest region, which is at risk of contaminating groundwater (GW). The sulphate load in the Base simulation keeps rising, stabilising at ~5300 t/year by 2033 in the Base run compared to ~3300 t/year in 2033 in both the Int.2 and Int.3 runs. Note that the difference between the resulting sulphate loads from the two capacities of treatment plants is minor.

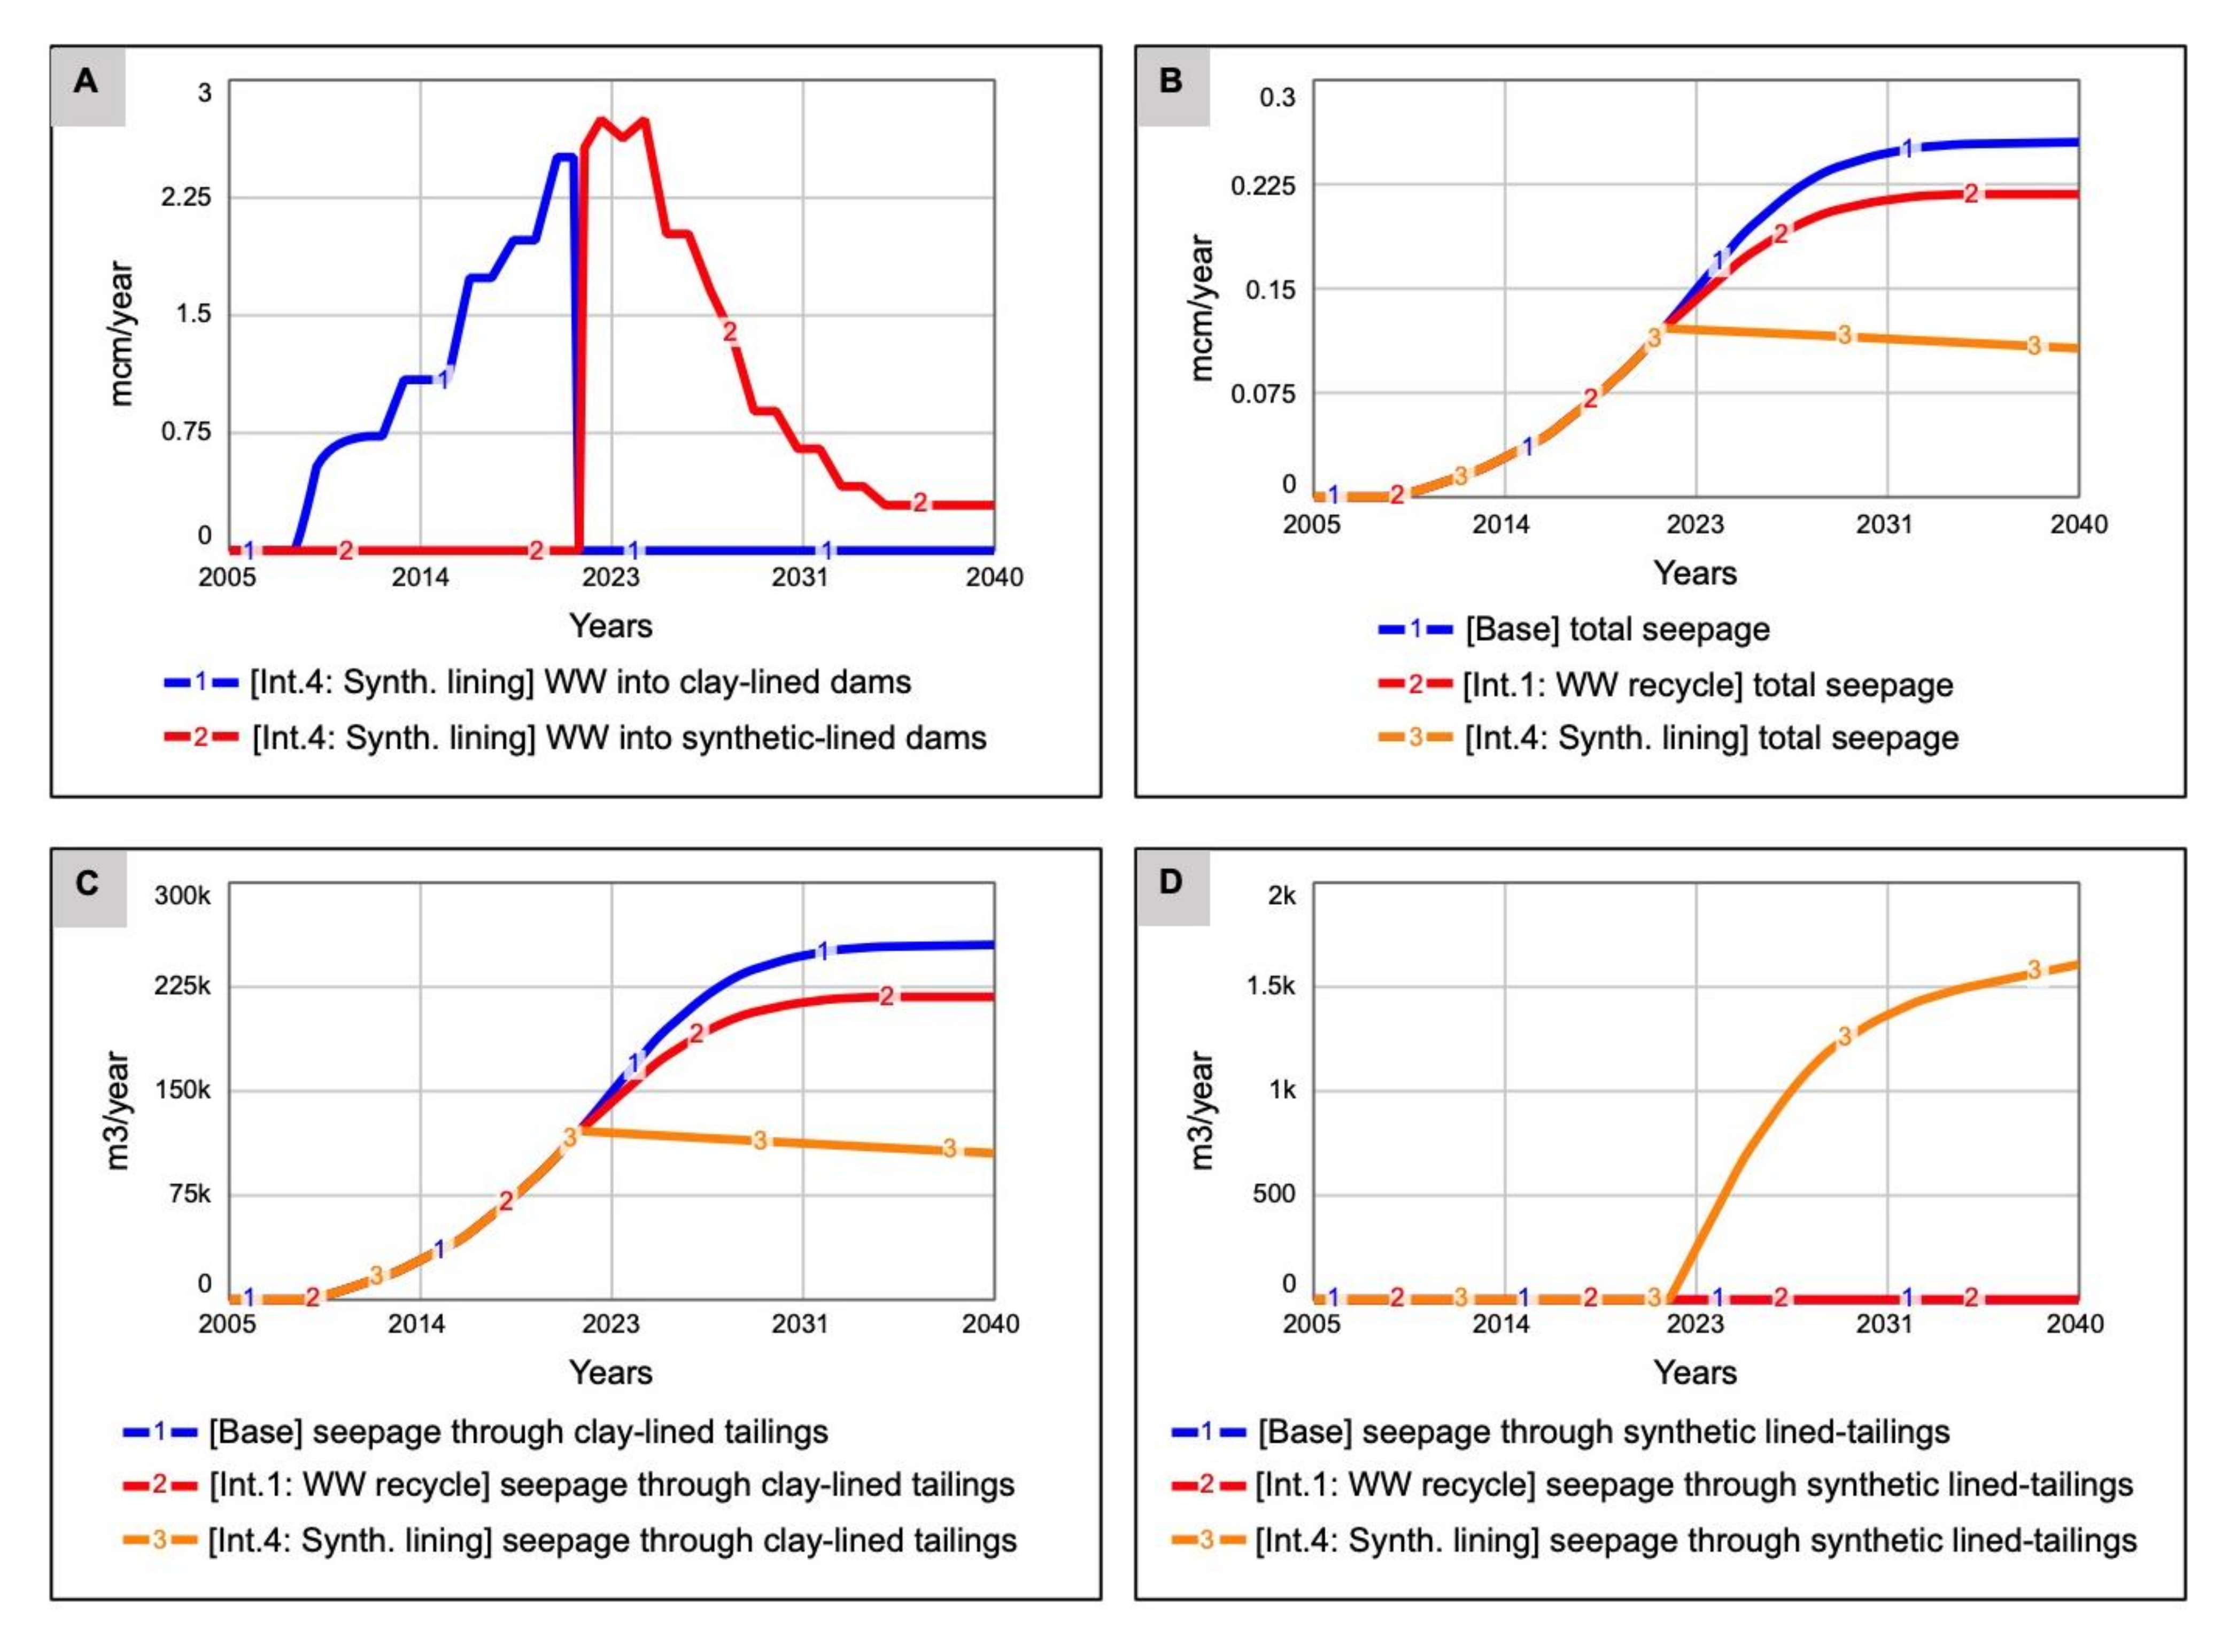
3.1.3. Intervention 4 (Int.4): Minimising Seepage via a Synthetic-Lined Tailings Dam

Simulation results for minimising seepage intervention through synthetic lining are presented in four time-series graphs in the composite Figure 9, below. The fourth intervention simulates an intervention to reduce contamination of groundwater by directly reducing the seepage from new tailings dams that are lined with synthetic liners that have a lower permeability factor than the single clay-liners used as standard.
Figure 9A shows the result of this intervention (Int.4: synth. Lining) in terms of how the inflows into the clay-lined tailings dams grow until 2021 and then drop to zero from 2021 onward as all-new wastewater flows are redirected to the synthetic-lined tailings dams. Figure 9B compares the ‘total seepage’ across three runs, namely the Base run, the Int.1: WW recycle run, and the Int.4—synth. lining run. The highest quantity of seepage, in mcm/year, is in the Base run, and it is reduced by ~10% in the Int.1 run with wastewater recycling. The lowest seepage (Line 3) is from Int.4, which shows declining total seepage from a high of 0.121mcm/year in 2021 down to 0.107 mcm/year in 2040. When comparing Figure 9C,D, it can be noted that the majority of the seepage continues to seep from the existing wastewater in the clay-lined tailings dams (line 3 in Figure 9C). Although the seepage quantity does grow from the synthetically lined tailings dams, (line 3 in Figure 9D), the scale is very different (around 1500 m3/year in Figure 9D versus around 100,000 m3/year in Figure 9C).

3.1.4. The Implication of Intervention Scenarios of Groundwater Resource Development

This sub-section presents the simulation results of the scenario of groundwater resource development (GW devp) in the Pilgrim’s Rest region of the BRC, with the efficiency of each of the four interventions tested under a scenario of groundwater resource development. A total of six curves are represented with the final results presented in Figure 10. The second variable on the graph represents the quantity of groundwater at risk of contamination from the mine (‘at risk GW’—line 2), based on the amount of water planned to be exploited in the well fields of Pilgrim’s Rest region. Line 3 represents the ‘GW contamination from mining risk factor’, measured as a dimensionless index scaled out of 100 (the higher the risk factor, the more groundwater is at risk). The ratio is therefore a fraction of the amount of groundwater developed and the potential wastewater emanating from the gold mine facility as a result of seepage, hence the greater the amount of wastewater, the greater the contamination risk to groundwater developed in the region. The interventions aim to mitigate this risk by reducing the seepage of contaminants into the groundwater resources.
Line 1 represents the base condition before groundwater development, hence indicating a low risk. An increase in groundwater risk is indicated in line 3 of Figure 10, which shows a simulated run of groundwater development combined with Intervention 1: wastewater recycling [GW devp + Int.1 WW]. Line 3 run shows that if groundwater development occurs and wastewater recycling begins, then the maximum risk factor drops from ~92/100 to ~67/100 for the last five years of the simulation period (2035–2040). Line 4 shows the results of the simulated run for GW development combined with Intervention 2 (a 2.5 ML/d treatment plant) [GW devp + Int.2–2.5 ML] and line 5 shows the results of the simulated run for GW development combined with Intervention 3 (a 5 ML/d treatment plant) [GW devp + Int.3–5 ML]. The peak difference is in 2028 when the [GW devp + Int.2—2,5ML] run produces a risk factor of ~40/100 and the [GW devp + Int.3–5ML] run produces a risk factor of ~33/100. From 2029 onwards, the different capacity plants have exactly the same result on the GW risk factor.
The most effective intervention that reduces the GW risk factor is Intervention 4: synthetically lined tailings dams, shown in Line 6 and simulation run [GW devp + Int.4—synth] in Figure 10. In this scenario in which GW development is occurring alongside the lining intervention, the peak risk factor is 18.8/100 in 2030 and is reduced to 16.3/100 in 2040. The building of new synthetically lined tailings dams would be both costly and would be subject to required environmental planning approval. For this reason, it is more likely that multiple other interventions that are less resource and bureaucracy-intensive would be combined. One such combination is presented in the seventh simulation run (line 7 of Figure 10), which presents the results of groundwater resource development together with two other interventions (GW devp + Int.1 + Int.2). The combination of wastewater recycling (Int.1) and the smaller treatment plant (Int.2) gives a risk factor of ~42/100 for 2032–2040.

4. Discussion and Conclusions

The South African Water Act of 1998 [42] was ground-breaking legislation and is often hailed globally as being rigorous and fair. Water is a limiting resource in South Africa, and it is currently fully allocated across the various sectors including maintaining the ecological reserve. Any additional use in the future would mean redistribution across the sectors, therefore it is imperative that water is used wisely and complies with the concepts of sustainable development. Strategic water areas substantially contribute to the economy by sustaining water for people, industry, and most importantly, the natural environment. Strategic water areas (SWAs) provide a disproportionate amount of water to the system relative to their size and therefore require careful management that should be driven by evidence on the various trade-offs of land and water use. This paper analysed the environmental risks of gold mining on water resources in the BRC over time, focusing on the groundwater resources in the upper reaches of the BRC by developing a systems perspective of the activities. The process of systems analysis and system dynamics (SD) modelling acknowledges the complex nature of water resources. The complex nature of the South African water sector and the value of systems thinking and modelling in achieving sustainable water resource management have been noted by multiple authors (e.g., [24,43,44]). The establishment of conflicting activities such as mining and groundwater development in the Pilgrim’s Rest region creates a complex situation in which multiple developmental goals are in tension, namely, gold mining, with the associated socio-economic and financial benefits, environmental impacts, and groundwater development, which requires good-quality groundwater of a sufficient quantity in order to meet the requirements.
In this research, SD modelling was used to analyse the impacts identified in Environmental Impact Assessments (EIAs) commissioned by the Transvaal Gold Mining Estate (TGME), the company which used to own the mining rights in the region. As noted by Lagnika et al. [23], although mining companies identify environmental risks and formulate mitigation measures in their EIAs and environmental management plans, environmental impacts typically persist during and after the mine operations. Hence, despite the cautionary measures made during mine planning, environmental impacts still occur before operations, and this puts the BRC at risk of a decrease in water quantity and quality. The modelling was undertaken with the assumption that the mining production will take place as indicated in the mine production plans. The planned timeframe is used in the model to simulate the effect of mining as planned. The model does not account for possible delays or challenges that might hinder the establishment of the mines. The baseline analysis depicts the annual tonnage, for the 13 mines, over the full simulation period from 2000 to 2040. The mining operations will take place at different times with an average yearly tonnage of 240,000 tonnes per mine from a total resource estimate of 25.28 million tons of gold-bearing ore. These are hypothetical predictions of trends that act as a reference point for change in the system and how scenarios of intervention and mitigation can change the behaviour of the system over time. The model runs show that the activities of the mining operations peak between 2022 and 2025, and yet the contamination levels and the sulphate loading peak in 2040, the last year of the simulation. The mitigation measures identified in the TGME mine’s EIA report were meant to protect and reduce the impacts on groundwater resources and to achieve environmental protection during the mine lifecycle [19,32,33]. All mitigation measure interventions show a lag time in the order of 10–13 years before the risk of groundwater contamination starts reducing. Two indicators are used to show this lag time: firstly, the sulphate load that is at risk of contaminating groundwater (GW), measured in t/year, and secondly, the ratio of seepage concentration to the SANS241 limit set for potable water, measured as a dimensionless ratio. In synthesis, the recycling wastewater intervention scenario shows that the highest sulphate load of 4500 t/year occurs in 2040, followed by the treatment plant intervention which has sulphate load of 3250 t/year. In the period between 2021 and 2029, the full capacity of the 5 ML/d treatment plant is utilised, which is reflected in the lower sulphate load (3100 t/year vs. 3600 t/year). It is noteworthy that after 2029, the 2.5 ML/d and the 5 ML/d plants have the same effect on sulphate load and the ratio of seepage concentration to SANS241 limit, reflecting the fact that the quantity of wastewater requiring treatment can be met by the smaller-sized plant for the majority of the simulation period. The intervention most effective in lowering the sulphate load stemming from mining in the Pilgrim’s Rest region and therefore reducing the risk to groundwater is the development and use of synthetic-lined tailings dams.
The final section of the results clearly shows that groundwater is at risk of contamination. The different runs of the scenarios with the component of groundwater development introduced using stepped increases that begin in 2022 until 2040 shows how the groundwater contamination risk factor increases along with the stepped groundwater development. A worst-case scenario, with no mitigation measures, shows rapid contamination, however, it is unlikely to be the case. As discussed in the previous sections, some of the mitigations cannot be introduced due to cost and feasibility. For this reason, it is more likely that multiple other interventions that are less resource and bureaucracy-intensive would be combined, the scenario run that was most promising showed that the combination of wastewater recycling and the smaller treatment plant (Int.2) gives a result of a risk factor of ~42/100 for 2032–2040. The Pilgrim’s Rest region of the BRC can potentially supply critical quantities of groundwater of good quality through the proposed groundwater development project. An overall catchment hydrological study is needed, particularly in the light of climate change. Whilst the eastern parts of South Africa are expected to receive approximately the same amounts of total annual rainfall, droughts and extreme events will be more frequent, markedly impacting the variability associated with the hydrological cycle and the recharge of aquifers [45]. One of the limitations of this study is that the focus of the model is on groundwater impacts and excludes both surface water dynamics and the dynamics of interflow between surface and groundwater. The reconciliation strategy for the Olifants River Catchment (ORC) published in 2015, showed that interventions were necessary to meet the gap between supply and demand [14]. It was suggested that groundwater development had a potential of 70 mcm/year with the expectation that it would mostly be sourced from the Malmani subgroup dolomites which indicated that the groundwater potential contribution only could be 39.5 mcm/year [16]. This is 30 mcm/year less than what was initially estimated, leaving the reconciliation strategy with a significant shortfall. Therefore, the protection of the groundwater from contamination and any additional abstraction is critical for the functionality of the Olifants River Water Supply System (ORWSS).
According to work done by Le Maitre et al. [8] on the ‘Identification, Delineation and Importance of the Strategic Water Source Areas of South Africa, Lesotho and Swaziland for Surface Water and Groundwater’, poor groundwater quality is often used as motivation to not use the resource. This can potentially compromise the use of SWA groundwater to augment water supply at a larger scale for the Olifants Water Management Area (OWMA). The simulation results reveal that mining activity in the BRC can potentially have adverse effects on water quality, driven by a range of mining-related activities, including particular types of mining, discharges of pollutants, and malfunctioning wastewater treatment plants. These impacts must be managed effectively, properly assessed through compliance monitoring, and mitigated and restricted in cases where water resource protection is not achieved. The potential for groundwater contamination is exacerbated by the fact that the well-field target zones in the Pilgrim’s Rest region occur in the same area as TGME gold mines. The ‘Feasibility Plan for Groundwater Resource Development of the Malmani Dolomites within the Olifants River Water Supply System’ emphasises the significance of ensuring that the aquifers in the well-field target zones in the Pilgrim’s Rest region sustain their integrity [16]. Le Maitre et al. [8] investigated the susceptibility of South Africa’s aquifers, and these were mapped nationally as groundwater vulnerability, separated into categories ranging from very low to very high. The aquifers in BRC have high vulnerability; hence aquifer protection is a priority during the implementation of the ongoing gold mining in the Sabie and Pilgrim’s Rest regions. A key recommendation in the ‘Feasibility Plan’ is to develop an aquifer protection plan to support sustainable groundwater abstraction from the region. The feedbacks and interconnections between mining and the broader environment demonstrate why systems analysis is required for any protection plan. This paper demonstrates the value of using systems dynamics modelling to analyse the problem and assess the feasibility of various interventions. Sustaining high-quality water in catchments is critical for the well-being of many South Africans as well as maintaining the proud history of the mining industry in the country.

Supplementary Materials

The following are available online at https://www.mdpi.com/2073-4441/13/3/301/s1: Table S1: Model specifications and run settings; Table S2: Full model description.

Author Contributions

Conceptualization: I.M.S. and J.K.C.-H.; Formal analysis: I.M.S. and J.K.C.-H.; Funding acquisition, M.C.S.; Investigation: I.M.S.; Methodology: I.M.S. and J.K.C.-H.; Project administration: M.C.S.; Resources: M.C.S.; Software: J.K.C.-H.; Supervision: M.C.S. and J.K.C.-H.; Visualization: I.M.S. and J.K.C.-H.; Writing—original draft: I.M.S., M.C.S., and J.K.C.-H.; Writing—review and editing: I.M.S., M.C.S., and J.K.C.-H. All authors have read and agreed to the published version of the manuscript.

Funding

Funding was provided through the Department of Science and Technology (DST)/National Research (NRF) South African Research Chairs Initiative (SARChI) research chair in Systems Analysis, held by Professor Mary Scholes at the University of the Witwatersrand, Johannesburg.

Institutional Review Board Statement

This study did not require ethical approval at the institutional level.

Informed Consent Statement

Not applicable.

Data Availability Statement

Applicable data has been available via the supplementary materials and the online version of the model.

Acknowledgments

Colleagues, lecturers, and fellow students to IS in the School of Animal, Plant and Environmental Science for support throughout her research; Teun Sluijs for the modelling support he provided to IS; the Association for Water and Rural Development (AWARD) for funding IS’s internship (under the directorship of Sharon Pollard); Hugo Retief for provision of water resource data and Jan Graf for information about mining in the Blyde River Canyon; IS’s internship at AWARD was under the USAID: RESILIM-O project, which was funded by the United States Agency for International Development (USAID) under USAID/Southern Africa RESILIENCE IN THE LIMPOPO BASIN PROGRAM (RESILIM)—Cooperative Agreement number AID-674-A-13-00008. The RESILIM-O sub-programme was focused on the Olifants River Catchment and was implemented by AWARD in collaboration with project partners. The composite map in Figure 1 was developed by Marthie Schoeman with editing by JCH; provision of shape files by Mandy Lombard of Nelson Mandela University gratefully acknowledged.

Conflicts of Interest

The authors declare no conflict of interest.

References

  1. du Plessis, A. Water as an Inescapable Risk. In Current and Future Water Scarcity and Stress; Springer: Berlin/Heidelberg, Germany, 2019; pp. 13–25. [Google Scholar] [CrossRef]
  2. Muller, M.; Schreiner, B.; Smith, L.; Koppen, B.V.; Sally, H.; Aliber, M.; Cousins, B.; Tapela, B.; Van Der Merwe-botha, M.; Karar, E.; et al. Water Security in South Africa; DBSA Development Planning Division Working Paper Series No.12; Development Bank of Southern Africa: Johannesburg, South Africa, 2009. [Google Scholar]
  3. Department of Water and Sanitation (DWS). Integated Water Quality Management Strategy. In Water Quality Management Policies and Strategies for South Africa; Report Number (2); Department of Water and Sanitation: Pretoria, South Africa, 2017; p. 116. [Google Scholar]
  4. Department of Water and Sanitation (DWS). National Water Resource Strategy: Water for an Equitable and Sustainable Future, 2nd ed.; Department of Water and Sanitation: Pretoria, South Africa, 2013.
  5. Mkhonza, A. Improving the Legal Protection of Strategic Water Source Areas: A South African Perspective. In Law/Environment/Africa: Publication of the 5th Symposium | 4th Scientific Conference | 2018 of the Association of Environmental Law Lecturers from African Universities in cooperation with the Climate Policy and Energy Security Programme for Sub-Saharan Africa of the Konrad-Adenhaur-Stiftung and UN Environment; Kameri-Mbote, P., Paterson, A., Ruppel, O.C., Orubebe, B.B., Kam Yogo, E.D., Eds.; Nomos Verlagsgesellschaft mbH & Co. KG: Baden-Baden, Germany, 2019; pp. 453–478. [Google Scholar]
  6. Nel, J.; Colvin, C.; Maitre, D.L.; Smith, J.; Haines, I. South Africa’s Strategic Water Source Areas; WWF South Africa: Cape Town, South Africa, 2013. [Google Scholar]
  7. Nel, J.; Le Maitre, D.C.; Roux, D.J.; Colvin, C.; Smith, J.S.; Smith-Adao, L.B.; Maherry, A.; Sitas, N. Strategic Water Source Areas for Urban Water Security: Making the Connection between Protecting Ecosystems and Benefiting from Their Services. Ecosyst. Serv. 2017, 28, 251–259. [Google Scholar] [CrossRef]
  8. Le Maitre, D.C.; Seyler, H.; Holland, M.; Smith-Adao, L.; Nel, J.; Maherry, A.; Witthüser, K. Identification, Delineation and Importance of the Strategic Water Source Areas of South Africa, Lesotho and Swaziland for Surface Water and Groundwater; Report to the Water Research Commission (WRC Report No. TT 754/1/18); Water Research Commission: Pretoria, South Africa, 2018.
  9. UNCED. Chapter 13 of Agenda 21. In Proceedings of the United Nations Conference on Environment and Development, Rio de Janeiro, Brazil, 3–14 June 1992; p. 300. [Google Scholar]
  10. UN. Transforming Our World: The 2030 Agenda for Sustainable Development; Division for Sustainable Development Goals: New York, NY, USA, 2015. [Google Scholar]
  11. Viviroli, D.; Weingartner, R. The Hydrological Significance of Mountains: From Regional to Global Scale. Hydrol. Earth Syst. Sci. 2004, 8, 1017–1030. [Google Scholar] [CrossRef] [Green Version]
  12. Gyamfi, C.; Ndambuki, J.M.; Salim, R.W. Hydrological Responses to Land Use/Cover Changes in the Olifants Basin, South Africa. Water 2016, 8, 588. [Google Scholar] [CrossRef]
  13. Department of Water and Sanitation (DWS). Feasibility Plan for Groundwater Resource Development of the Malmani Dolomites within the Olifants River Water Supply System: Final ORWSS Dolomite Groundwater Resource Development Project Report; Prepared by Dylan Blake, Kornelius Riemann, Fanie Botha, Luke Towers, David McGibbon, Lunga Nolakana, Jannie Weitz, Rui Hugman, Sinawo Jack and Eddie Wise of Umvoto Africa Pty (Ltd.) on behalf of DWS Directorate: Water Resources Planning Systems (D: WRPS); Department of Water and Sanitation: Pretoria, South Africa, 2018.
  14. Department of Water and Sanitation (DWS). Olifants River Water Supply System Reconciliation Strategy 2015; Olifants River Water Supply System Reconciliation Strategy (Continuation Phase 1): (WP 10575). P WMA 04/B50/00/8715. Report by C. Talanda, B. Haasbroek and P. van Rooyen of WRP and Hydrosol for DWS: Directorate: National Water Resource Planning; Department of Water and Sanitation: Pretoria, South Africa, 2015.
  15. Bates, G.; Beruvides, M.; Fedler, C.B. System Dynamics Approach to Groundwater Storage. Water 2019, 11, 1907. [Google Scholar] [CrossRef] [Green Version]
  16. Department of Water and Sanitation (DWS). Feasibility Plan for Groundwater Resource Development of the Malmani Dolomites within the Olifants River Water Supply System: ORWRSS Dolomite Groundwater Resource Development Feasibility and Implementation Plan; Prepared by Fanie Botha, Dylan Blake, and Kornelius Rieman of Umvoto Africa Pty (Ltd.) on behalf of DWS Directorate: Water Resources Planning Systems (D: WRPS), Report No.: P WMA 04/B50/00/9016/4/2; Department of Water and Sanitation: Pretoria, South Africa, 2018.
  17. Younger, P.L.; Wolkersdorfer, C. Mining Impacts on the Fresh Water Environment: Technical and Managerial Guidelines for Catchment-Focused Remediation. Mine Water Environ. 2004, 23, 1–80. [Google Scholar] [CrossRef]
  18. Klohn, E.J. Seepage Control for Tailings Dams. In Proceedings, First International Conference on Mine Drainage; Miller Freeman Publications: San Francisco, CA, USA, 1979; pp. 671–672. [Google Scholar]
  19. Muller, C.; van Heerden, D.; Odendaal, N.; Engelmann, U.; Clemente, D. An Independent Competent Persons’ Report on the TGME Gold Project, Mpumalanga Province, South Africa; Minxcon (Pty) Ltd.: Roodepoort, South Africa, 2012; Volume 9. [Google Scholar]
  20. Gassner, F.; Wrench, B. Lined Storage Facilities for Mine Waste—Considerations and Benefits. In Proceedings of the First International Seminar on the Reduction of Risk in the Management of Tailings and Mine Waste, Australian Centre for Geomechanics, Perth, Australia, 29 September–1 October 2010; pp. 275–281. [Google Scholar]
  21. Simonovic, S.P. Managing Water Resources: Methods and Tools for a Systems Approach; UNESCO and Earthscan: Paris, France; London, UK, 2009. [Google Scholar]
  22. Ford, A. Modeling the Environment, 2nd ed.; Island Press: Washington, DC, USA, 2009. [Google Scholar]
  23. Lagnika, S.B.; Hausler, R.; Glaus, M. Modeling or Dynamic Simulation: A Tool for Environmental Management in Mining? J. Integr. Environ. Sci. 2017, 14, 1–19. [Google Scholar] [CrossRef] [Green Version]
  24. Clifford-Holmes, J.K.; Slinger, J.H.; Palmer, C.G. Using System Dynamics Modeling in South African Water Management and Planning. In System Dynamics Models for Africa’s Developmental Planning; Simelane, T., Brent, A.C., Eds.; Africa Institute of South Africa (AISA): Pretoria, South Africa, 2017. [Google Scholar]
  25. Carnohan, S.A.; Clifford-Holmes, J.K.; Retief, H.; McKnight, U.S.; Pollard, S. Climate Change Adaptation in Rural South Africa: Using Stakeholder Narratives to Build System Dynamics Models in Data-Scarce Environments. J. Simul. 2020, 1–18. [Google Scholar] [CrossRef]
  26. Mashaly, A.F.; Fernald, A.G. Identifying Capabilities and Potentials of System Dynamics in Hydrology and Water Resources as a Promising Modeling Approach for Water Management. Water 2020, 12, 1432. [Google Scholar] [CrossRef]
  27. Winz, I.; Brierley, G.; Trowsdale, S. The Use of System Dynamics Simulation in Water Resources Management. Water Resour. Manag. 2009, 23, 1301–1323. [Google Scholar] [CrossRef]
  28. Stave, K.A. Participatory System Dynamics Modeling for Sustainable Environmental Management: Observations from Four Cases. Sustainability 2010, 2, 2762–2784. [Google Scholar] [CrossRef] [Green Version]
  29. Brent, A.C.; Musango, J.K.; Smit, S.; Pillay, N.S.; Botha, A.; Louw, R.; Roper, S.; Simelani, T.; Clifford-Holmes, J.K.; Pretorius, L. Utilization of System Dynamics in Southern Africa: A Systematic Review. Syst. Res. Behav. Sci. 2017, 34, 657–670. [Google Scholar] [CrossRef]
  30. Clifford-Holmes, J.K. Fire and Water: A Transdisciplinary Investigation of Water Governance in the Lower Sundays River, South Africa. Ph.D. Thesis, Rhodes University, Grahamstown, South Africa, 2015. [Google Scholar]
  31. Sterman, J.D. Business Dynamics: Systems Thinking and Modeling for a Complex World; Irwin McGraw-Hill: Boston, MA, USA, 2000. [Google Scholar]
  32. Globesight Pty Ltd. Draft Environmental Management Programme Report for the Proposed “TGME Mine Development Project (10167)”; Report by F. Pieterse for Globesight (Pty) Ltd. Postnet Suite 25, Private Bag X06; Globesight Pty Ltd.: Helderkruin, South Africa, 2017. [Google Scholar]
  33. Globesight Pty Ltd. Draft Environmental Management Programme Report for the Proposed “TGME Mine Development Project (10161)”; Report by F. Pieterse for Globesight (Pty) Ltd. Postnet Suite 25, Private Bag X06; Globesight Pty Ltd.: Helderkruin, South Africa, 2017. [Google Scholar]
  34. Rudzani, L.; Gumbo, J.R.; Yibas, B.; Novhe, O. Geochemical and Mineralogical Characterization of Gold Mine Tailings for the Potential of Acid Mine Drainage in the Sabie-Pilgrim’s Rest Goldfields, South Africa. In Proceedings of the 9th International Conference on Research in Chemical, Agricultural, Biological and Environmental Sciences (RCABES-2017), Parys, South Africa, 27–28 November 2017. [Google Scholar] [CrossRef]
  35. Acheampong, M.A.; Paksirajan, K.; Lens, P.N. Assessment of the Effluent Quality from a Gold Mining Industry in Ghana. Environ. Sci. Pollut. Res. 2013, 20, 3799–3811. [Google Scholar] [CrossRef] [PubMed]
  36. Department of Water and Sanitation (DWS). Benchmarks for Water Conservation and Water Demand Management (WC/WDM) in the Mining Sector; Department of Water and Sanitation: Pretoria, South Africa, 2016.
  37. Geldenhuys, A.J.; Maree, J.P.; De Beer, M.; Hlabela, P. An Integrated Limestone/Lime Process for Partial Sulphate Removal. J. South Afr. Inst. Min. Metall. 2003, 103, 345–354. [Google Scholar]
  38. Groesser, S.N.; Schwaninger, M. Contributions to Model Validation: Hierarchy, Process, and Cessation. Syst. Dyn. Rev. 2012, 28, 157–181. [Google Scholar] [CrossRef]
  39. Barlas, Y. Formal Aspects of Model Validity and Validation in System Dynamics. Syst. Dyn. Rev. 1996, 12, 183–210. [Google Scholar] [CrossRef]
  40. Rahmandad, H.; Sterman, J.D. Reporting Guidelines for Simulation-Based Research in Social Sciences. Syst. Dyn. Rev. 2012, 28, 396–411. [Google Scholar] [CrossRef] [Green Version]
  41. Monks, T.; Currie, C.S.M.; Onggo, B.S.; Robinson, S.; Kunc, M.; Taylor, S.J.E. Strengthening the Reporting of Empirical Simulation Studies: Introducing the STRESS Guidelines. J. Simul. 2019, 13, 55–67. [Google Scholar] [CrossRef]
  42. Rowlston, B. Water Law in South Africa: From 1652 to 1998 and Beyond. In Sustainable Use of South Africa’s Inland Waters: A Situation Assessment of Resource Directed Measures 12 Years after the 1998 National Water Act; King, J., Pienaar, H., Eds.; Water Research Commission: Gezina, Pretoria, South Africa, 2011; pp. 19–47. [Google Scholar]
  43. Pollard, S.; Biggs, H.; Du Toit, D.R. A System Framework for Context-Based Decision Making in Natural Resource Management: Reflections on an Integrative Assessment of Water and Livelihood Security Outcomes Following Policy Reform in South Africa. Ecol. Soc. 2014, 19, 63. [Google Scholar] [CrossRef] [Green Version]
  44. Clifford-Holmes, J.K.; Palmer, C.G.; de Wet, C.J.; Slinger, J.H. Operational Manifestations of Institutional Dysfunction in Post-Apartheid South Africa. Water Policy 2016, 18, 998–1014. [Google Scholar] [CrossRef]
  45. Scholes, R.J.; Scholes, M.C.; Lucas, M.C. Climate Change: Briefings from Southern Africa; Wits University Press: Johannesburg, South Africa, 2015. [Google Scholar]
Figure 1. (A) Map of South Africa, with all strategic water (source) areas (SWSA); (B) the Olifants Water Management Area (WMA) in relation to the Mpumulanga Drakensberg SWSA; and (C) detail of the mines in the secondary Blyde SWSA.
Water 13 00301 g001
Figure 2. Causal loop diagram (CLD) showing the overall problem conceptualisation and the system boundary. Arrows connect two or more variables of interest and are causal links that run in the stated direction. ‘+’ = a positive relationship, indicating that the causality runs in the same direction (i.e., an increase in variable A will cause an increase in variable B and vice versa); ‘–’ = a negative relationship, indicating that the causality runs in the opposite direction (i.e., an increase in variable A will cause a decrease in variable B and vice versa). The variables connected by the thin green arrows pertain to surface water management and are conceptually included in the rationale for groundwater resource development, but surface water is not empirically modelled in the simulation model. The balancing feedback loops are numbered Bn and labelled. The variables in red font with black arrows show select intervention points in the system. BRC = Blyde River Canyon; GW = groundwater.
Water 13 00301 g002
Figure 3. Sub-model 1 represents the gold mining and gold processing sub-model. Variables with the ‘~’ symbol denote either graphical functions or where a LOOKUP data table is behind the variable.
Water 13 00301 g003
Figure 4. Sub-model 2 represents the wastewater in clay-lined tailings dam and seepage sub-model.
Water 13 00301 g004
Figure 5. Sub-model 3 represents the neutralising treatment plant sub-model. Variables with the ‘~’ symbol denote either graphical functions or where a LOOKUP data table is behind the variable.
Water 13 00301 g005
Figure 6. Sub-model 4 represents groundwater (GW) in Pilgrim’s Rest and GW contamination risk from gold mining. Variables with the ‘~’ symbol denote either graphical functions or where a LOOKUP data table is behind the variable.
Water 13 00301 g006
Figure 7. Comparative runs of the baseline simulation (Base) against Intervention 1 wastewater recycling (Int.1: WW recycle). (A): total wastewater generated; (B) wastewater in clay-lined tailings dams; and (C) ratio of seepage concentration to limit (the ratio is dimensionless hence dmnl). Note that the x-axis is shortened to only display the results from 2010–2040 in order to enhance the legibility of the result.
Water 13 00301 g007
Figure 8. Results for Interventions 2 and 3 (Int.2 and Int.3) which compare two neutralisation treatment plants. Int.2 = a treatment plant with a capacity of 2.5 megalitres per day (ML/d); Int.3 = a treatment plant with a capacity of 5 megalitres per day (ML/d). (A) shows the annual treatment capacity; (B) compares the quantities of wastewater treated and (C) compares the quantities of wastewater left untreated; (D) shows the relative sulphate loads at risk of contaminating groundwater (GW). Note that the x-axis is shortened to only display the results from 2010–2040 in order to enhance the legibility of the results.
Water 13 00301 g008
Figure 9. Simulation runs for Intervention 4: synthetic-lined tailings dam. (A) shows the flow, in mcm/year, of wastewater into the clay-lined dams and the synthetic-lined dams. (B) compares the ‘total seepage’, in mcm/year, of the Base run against Int.1 and Int.4. (C) does the same as (B) but focuses on the seepage from the clay-lined tailings dam, calculated in m3/year. (D) does the same as (B) and (C) but focuses on the seepage from synthetic-lined tailings dams. Note that the x-axis is shortened to only display the results from 2005–2040 in order to enhance the legibility of the results.
Water 13 00301 g009
Figure 10. The final comparison of scenarios of groundwater development in relation to the four interventions. The variable displayed is the cumulative ‘GW contamination from mining risk factor’, measured as a dimensionless index (dmnl) scaled out of 100 (the higher the risk factor, the more groundwater abstracted for the BRC is at risk). Note that the x-axis is shortened to only display the results from 2015–2040 in order to enhance the legibility of the results.
Water 13 00301 g010
Table 1. Groundwater (GW) values for the Pilgrim’s Rest–Blyde well field target zone (WFTZ) used in the groundwater sub-model to inform the recharge rate, current use, discharge rate, and potential/planned use. (mcm = million cubic meters). Source: adapted from [13] (p. 26).
Well Field Target ZoneRecharge Rate (mcm/Year)Discharge (mcm/Year)GW Current Use (mcm/Year)GW Potential (mcm/Year)
Pilgrim’s Rest–Blyde34.728.40.226
Table 2. Details of important parameter values used in the system dynamics (SD) model along with the data sources.
Model Variable/Initial ValueValueUnitsDescription/References
Sub-model: 1
Unexploited gold25.28 × 106TThis value is the total mineral resource estimate in the production profile of the Transvaal Gold Mining Estate (TGME) mine plan [19] (p. 36).
Operational plant capacity 42 × 104t/yearThis represents the capacity of the main plant located in the Pilgrim’s Rest region [19]
Average fraction of recovered gold (gold grade) 3.3 × 10⁻⁶g/tThis is the grade of gold resource in the Sabie and Pilgrim’s Rest regions. This value is determined by the mining company. [19]
Wastewater produced per tonne gold mined 1 × 10⁻⁶mcm/tAmount of wastewater generated in mining. This is an assumption based on an estimated amount of dewatering done in a typical mine shaft
Wastewater generated per tonne gold processed6.893 × 10−8mcm/tAmount of wastewater generated in gold processing. The data for the amount of water processed is derived from the research done by Acheampong et al. [35] on the treatment plant of similar characteristic as the plant that will be used in the TGME mine project [35] (p. 3800).
Wastewater recycling0.25%Calculated against benchmarks used by the South African national Department of Water and Sanitation (DWS) in their report for water demand management in mining in South Africa (SA) (Table D:2 ‘water use efficiency for gold mines’, p. 58) [36]
Sub-model: 2
Max tailing dam size 100,000m2This is the area of the tailings area. This is indicated in the mine plan and Environmental Impact Assessment (EIA) report for this mine project [19]
Max tailings Capacity40McmThis parameter is the proposed capacity of the tailing dam that be constructed on the mine site. This is indicated in the mine plan and EIA report for this mine project [33] (p. 36).
Hydraulic gradient for (dolomite aquifer) 0.2592432 * × 365 m/yearThis value is determined from aquifer data provided in the hydrogeological specialist report in the EIA reporting for this project [33] (p. 27).
Permeability of single clay liners 0.31536m/dayClay lining is a much cheaper and commonly used lining method in mining [20] (p. 28).
Permeability of synthetic liners0.0031536m/yearThe value is drawn from [20] (p. 28).
Sub-model: 3
Max. sulphate concentration at tailings21,269mg/LThis refers to the estimated average sulphate concentration in seepage that can emanate from the tailings facilities in the mines located in this region. This value is estimated from leach testing done on historical tailing facilities and geological material from the mine area done for the hydrogeological specialist report in the EIA reporting for this project [33] (p. 37).
This value is converted into million tonnes per million cubic meters in the model = 21 269 × 109 tonnes/MCM
2.5 ML/d capacity neutralising plant 0.9124mcm/year The parameter for the water neutralisation plant capacity is extrapolated from work done by [35] (p. 3800) on the treatment plant of similar characteristics
The effect of the treatment plant on sulphate concentration is extrapolated from work done by Geldenhuys et al. [37] on the effect of lime treatment on acid mine drainage.
5 ML/d capacity neutralising plant1.825mcm/year
Sub-model: 4
Groundwater in (Pilgrim’s Rest region)11.9mcmDWS ‘Feasibility Plan for Groundwater Resource Development of the Malmani Dolomites within the Olifants River Water Supply System’ (ORWRSS Dolomite Groundwater Resource Development Feasibility and Implementation Plan) [16].
SANS 241 limit500t/mcmThis South African National Standard (SANS) no.241 is derived from the hydrogeological specialist report that formed part of the EIA report for TGME [33] (p. 50). The actual limit of 500 mg/L is converted from mg/L to t/mcm in order to maintain unit consistency.
Table 3. Model validation tests employed in this study.
Test CategoryTestGeneric Purpose and Requirements Specific Tools and Procedures Employed in This Study
1Direct structure confirmation testStructure and boundary assessment testsThe model structure does not contradict knowledge about the structure of the real-world system.Model structure and boundary were compared with existing literature; the model was checked to ensure that basic laws (e.g., conservation of mass) were adhered to.
2Parameter confirmation testThe parameter values reflect relevant descriptive and numerical knowledge of the system. All parameter values have real-world equivalents.Model parameter values were compared with existing literature.
3Dimensional consistency testAll equations are dimensionally consistent without the use of parameters that have no real-world meaning.Model equations were inspected and unit analysis was carried out throughout the model development process; units were verified using the ‘Unit check’ function in Stella Architect.
4Extreme conditions testKey equations make sense when inputs take on extreme values.The results of key model indicators were assessed when initial conditions and parameters were pushed to extreme minimum and maximum values.
5Indirect structure confirmation testIntegration error testThe model results are not sensitive to the choice of time step or numerical integration method.The time-steps were increased and decreased and different integration methods (Euler, Runge–Kutta 2, Runge–Kutta 4) were tested for associated changes in the model behaviour/
6Behaviour sensitivity analysisTo assess how ‘sensitive’ a model is to changes in parameter values in order to see how the model responds.Model parameters were adjusted (by +/−25% and +/−50%) and model behaviour was observed, checking for behaviour reproduction with changes only in amplitude.
Table 4. Description of simulation runs of intervention scenarios.
InterventionDescription of Parameters
Baseline conditions (Base run)The baseline scenarios are simulated without mitigations to reduce the impact of GW contamination risk as a result of mining activity.
1. Wastewater recycling (Int.1: WW recycle)This intervention aims to decrease the amount of wastewater produced in the mine operation.
2. Treatment plant 1 = 2.5 ML/day (Int.2: 2.5 ML)A neutralisation treatment plant with a daily throughput (i.e., daily capacity) of 2.5 ML/day. This process aims to decrease contaminant concentrations in wastewater produced in the mine operation.
3. Treatment plant 2 (Int.3: 5 ML/dayA neutralisation treatment plant with a daily throughput of 5 ML/day.
4. Synthetic lined Tailings dam (Int.4: Synth. Lining)The construction of a new tailings storage dam that has a synthetic liner (different from the existing tailings dam that has a single clay liner).
Publisher’s Note: MDPI stays neutral with regard to jurisdictional claims in published maps and institutional affiliations.

