
Spatial-Temporal Change of Actual Evapotranspiration and the Causes Based on the Advection–Aridity Model in the Weihe River Basin, China


1
State Key Laboratory of Soil Erosion and Dryland Farming on the Loess Plateau, Institute of Soil and Water Conservation, Northwest A&F University, Yangling 712100, China
2
State Key Laboratory of Soil Erosion and Dryland Farming on the Loess Plateau, Institute of Soil and Water Conservation, Chinese Academy of Sciences & Ministry of Water Resources, Yangling 712100, China
3
Yangtze Soil Conservation Monitoring Center, Changjiang Water Resources Commission, Wuhan 430010, China
*
Author to whom correspondence should be addressed.
Water 2021, 13(3), 303; https://doi.org/10.3390/w13030303
Submission received: 10 November 2020
/
Revised: 20 January 2021
/
Accepted: 20 January 2021
/
Published: 27 January 2021
(This article belongs to the Section Hydrology)
Abstract
:Evapotranspiration is a key process between the atmospheric hydrological cycle and the energy cycle, which has a great significance in understanding climate change and the rational use of water resources, especially for the Weihe River basin (WRB) (a basin in China experiencing a shortage of water resources). We investigated the spatial-temporal change of actual evapotranspiration (ETa) based on the daily meteorological variables of 22 meteorological stations and the annual streamflow of three hydrological stations from 1970 to 2018 in the WRB. The contributions of key meteorological variables to ETa changes and the sensitivity coefficient are also quantified. The temporal trends of ETa showed an increasing trend from 1970 to 2018, and the spatial distribution of ETa increased from northwest to southeast in the WRB. Increasing trends were detected in the multi-year average, spring, and winter, but only a few stations passed the significance test. Summer and autumn showed a decreasing trend, but this trend was not significant. Solar radiation is the most sensitive meteorological variable, followed by vapor pressure, wind speed, and mean temperature. Vapor pressure contributes the most to ETa changes, followed by solar radiation. In general, vapor pressure (relative humidity) is the dominant meteorological factor affecting ETa in the WRB. In addition to meteorological factors, the ETa is also affected by combined and complicated factors caused by precipitation and human activities. As an important part of the hydrological cycle, ETa has important research significance for water resources management, economy, agriculture, and ecology and results of this study may be helpful to further clarify the climate change and human activities impacts on the basin hydrological cycle.
1. Introduction
Evapotranspiration is a complex hydrological process, which closely links surface water balance and energy balance and is an important component of the hydrological process and energy cycle in the ecosystem [1]. It is estimated that with land surface evapotranspiration of more than 6 × 10⁴ km3, nearly 70% of the precipitation on land will return to the atmosphere in the form of evapotranspiration each year [2]. The changes in climate factors and terrestrial surfaces (vegetation and soil characteristics) are the most direct factors affecting evapotranspiration during the hydrological cycle [3,4]. Accurately estimating the changes in ETa and the attribution of different meteorological factors to ETa is significant for the research of regional climate change, water resource management, and the construction of water conservancy projects. Almost every aspect of forestry, agriculture, and water resource allocation is related to terrestrial and water surface evapotranspiration [5,6,7,8]. Therefore, the study of the regular patterns and mechanisms related to evapotranspiration is becoming increasingly important.
In recent centuries, the global climate has experienced a significant warming trend, and the issue of climate change has drawn much attention from the public, academic circles, and governments [9]. The fifth report of the IPCC noted that during the years from 1880 to 2012, the global average temperature on land and sea increased by 0.85 °C. According to paleo climatological data, the years from 1983 to 2012 may have been the warmest in the past 1400 years [10]. In this context, it is believed that global warming will dry out the surface atmosphere and increase the evapotranspiration of the soil surface and the crop, which will cause a series of water cycle changes [1,11]. A large number of current results show that there has been a continuous decrease in the evapotranspiration of evaporating pans around the world. The rate of this decrease was about −1~−5 mm·a−10 in the past 50 years [12,13,14]. The potential evapotranspiration (ETp) in many countries and regions also shows a decreasing trend, while the temperature shows an increasing trend: Italy [15], India [16], Australia [17], Israel [12], New Zealand [18], the Canadian Prairies [19], and Japan [20], as well as some regions of China, have observed the same phenomenon [21,22,23]. Roderick (2002) called this the “evapotranspiration paradox” for the first time, as a hydrological phenomenon featuring a significant increase in air temperature accompanying a significant decrease in evapotranspiration [24]. The same phenomenon was also reported in studies on the analysis of ETp and the actual evapotranspiration ETa, such as the reference evapotranspiration in the middle and southwest areas of the Yellow River Basin [25]; potential and pan evapotranspiration in the Changjiang (Yangtze River) catchment [26]; ETp in the eastern plain area of the Aksu River Basin [27]; ETa in the pearl river basin [28]; and ETa in the Yangtze River [29]. The results of existing studies showed that the attributions of different factors to the trend of evapotranspiration are inconsistent among different studies. Some studies reported solar radiation was the dominant factor for the decrease of evapotranspiration in the Iran [30], northeast India [31] and middle-lower Yellow River Plain [25]; Liu [32] observed a decrease of evapotranspiration in the Haihe River Basin attributed to wind speed; and some other studies reported that relative humidity is the dominant factor decreasing evapotranspiration in the Aksu and Heihe River Basins [27,33]. In addition, Irmak et al. [34] and Jung et al. [35] found that limited moisture supply could be the dominant factor driving changes in ETa.
During the past several decades, considerable attention has been given to the tendency, spatiotemporal distribution, and influencing factors of pan evapotranspiration (ETpan) and ETp. Only a few studies have focused on the long-term changes and driving factors of ETa changes, and it is difficult to obtain sufficient and reliable data for ETa at a large scale using fixed meteorological observatories. The current estimation of ETa mainly relies on model estimations and satellite data because lysimeters are costly to install and maintain [36,37]. The water balance method is also used to estimate the ETa, but it cannot be applied to situ measurements and needs mass data (e.g., the water consumption of human activities); moreover, some data are not available to the public. Therefore, this method cannot be used in the spatial analysis of ETa [38]. In 1963, Bouchet first outlined the complementary hypothesis that the relationship between ETa and evapotranspiration capacity (ETp) in a given area are complementary [39]. This complementary relationship states that, over areas at a regional scale and away from any sharp environmental discontinuities, the external energy will remain unchanged. With adequate water status, the process of ETa will increase with an increase of the water supply; under this condition, ETa will eventually equal ETp, which is defined as wet surface evapotranspiration (ETw) [40]. Once ETa decreases as the water supply becomes less abundant, the air becomes drier, and the excess energy heats up the atmosphere, leading to an increase in ETp and excess energy equal to the increase in ETp—i.e., the results of the complementary relationship between ETp and ETa. This phenomenon can be applied to estimate ETa with routinely recorded weather data without the need for additional, less common measurements of the moisture status of the vegetation or soil. As one of the relevant methods, the Advection–Aridity (AA) model has been verified in many regions [40,41,42]. This method relies solely on routine meteorological observations. Local temperature and humidity gradients in the atmospheric boundary layer respond to—and obviate the necessity for information regarding—the conditions of moisture availability at the surface. These models bypass the complex and poorly understood soil–plant processes and thus do not require data on soil moisture, stomatal resistance properties of the vegetation, or any other aridity measures, nor do they require the local calibration of parameters, beyond those built into the models. Therefore, this method is the practical and easier preferred method relatively used in the calculate of ETa.
The Weihe River Basin (WRB) is located in the transition area from semi-arid to semi-humid in an economically developed area in Northwest China, which is also an ecologically fragile area. In recent years, under the influence of climate warming and human activities, the ecological environment of the basin has been rapidly degraded. Most of the existing studies on hydrology and water resources have been done on precipitation [43,44], runoff [45], and ETp in this basin [46,47], with few studies on ETa. Therefore, the main objectives of this study were to (i) analyze the spatial distribution and temporal variation of ETa; (ii) quantitatively assess the impacts of climate variables on ETa, including the degree of sensitivity and contributions of meteorological factors; and (iii) determine the dominant climatic variables that affect the changes of ETa. The results derived from this study will help us better estimate and analyze the spatial and temporal variations of ETa in this region. This study provides a foundation for understanding the causes of drought and flooding, developing scientific irrigation processes and protecting ecological systems, and improving the utilization rate of water resources in this basin.
2. Study Area and Dataset
2.1. Study Area
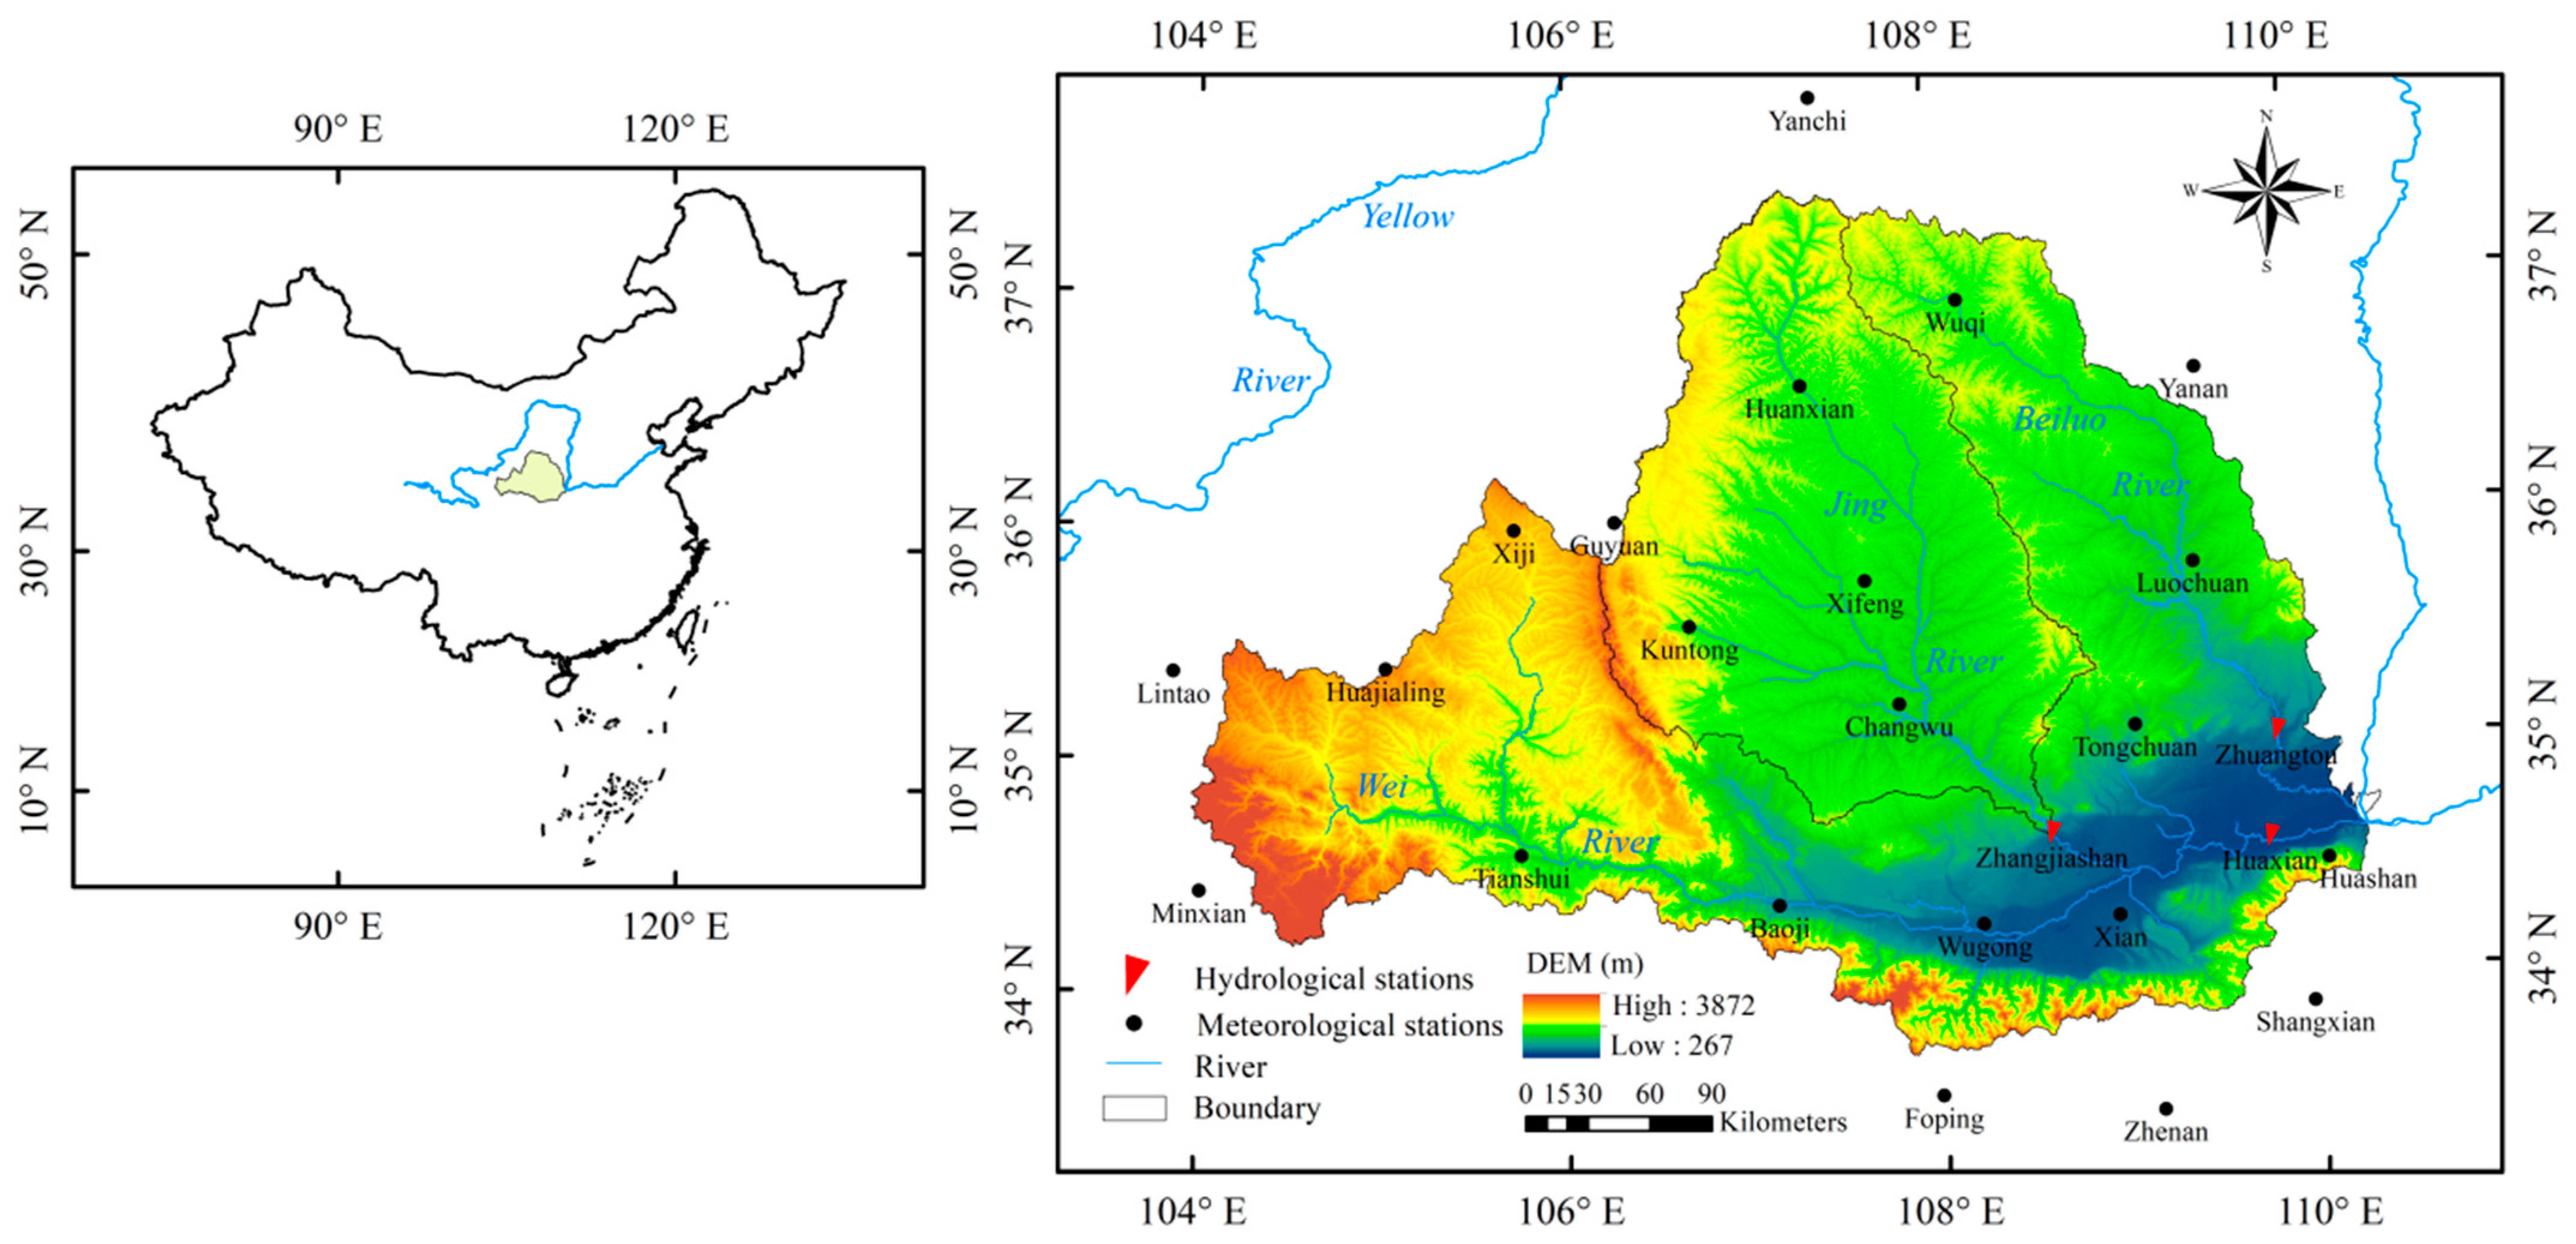
As the largest tributary of the Yellow River, the WRB is located in the lower midstream of the Yellow River. The total area is approximately 1.348 × 10⁵ km2, and the main stream is 818 km in length. The basin originates from the Niaoshu Mountain of Gansu Province and Baiyu Mountain in the north, reaches Tongguan in the east and the Qinling Mountains in the south, and flows through the three provinces of Shaanxi, Gansu, and Ningxia. The basin is divided into three larger sub-basins with distinct geographic and climatic conditions: the Wei River, the Jing River, and the Beiluo River, known as the Jing-Luo-Wei Region. Among them, the Wei River has the largest area, 7.23 × 10⁴ km2, and is located to the south of the whole basin with a long east–west direction belonging to the Guanzhong Plain. Jing River is the next largest, with an area of 4.54 × 10⁴ km2, and is located on the north bank. The smallest area is the Beiluo River, 2.69 × 10⁴ km2, located in the eastern part of the whole basin and accounting for 20% of the total basin area. The Wei River Basin is located in the transition zone between arid and humid regions. It belongs to a typical continental monsoon climate, making it dry and cold in winter and humid and hot in summer. The average annual rainfall in the area is 572 mm. The interannual variation of the rainfall is large, and the distribution is uneven during the year, mainly in summer (July–October), accounting for more than 60% of the annual rainfall. In winter (December–February), the rainfall is scarce, accounting for about 4% of the annual rainfall (Figure 1).
2.2. Data Sets
In this study, meteorological data from 22 national meteorological stations, provided by the National Meteorological Information Centre of China (NMIC) (https://www.nmic.cn/), including the daily average/maximum/minimum temperature, relative humidity, sunshine duration, wind speed, and precipitation during 1970–2018, were used in this study to estimate the ETa in the WRB. These data were verified by the NMIC before being issued. Detailed information about these stations and datas are given in Table 1 and Table 2. The division of seasons is based on the meteorological weather seasons—that is, spring runs from March to May, summer from June to August, autumn from September to November, and winter from December to February of the following year.
The hydrological data in this study include the annual streamflow during 1970–2018 from three hydrological stations provided by the Yellow River Water Resources Commission. The Huaxian station belongs to the main stream of Wei River, the Zhuangtou station belongs to the Beiluo River, and the Zhangjiashan station belongs to the Jing River. Detailed information on the hydrological stations is shown in Table 3.
3. Methodology
3.1. Evapotranspiration Estimation
Based on the complementary hypothesis proposed by Bouchet in 1963, Brutsaert and Stricker [47] provided a conceptual model based on the hypothetical non-advective evaporative power of the air, where the excess power in ETp is equal to the deficit of power in ETa. The evapotranspiration under this condition is defined as wet environment evapotranspiration (ETw), which provides the complementary relationship between ETa and ETp in Equation (1). This relationship provides an index of the aridity of the atmosphere in a given region. Therefore, this approach is referred to herein as the “Advection–Aridity” (AA) model, which is applied to calculate the ETa in the basin:
This equation can be used to calculate the annual, monthly [48], and daily ETa [47], as well as the ETa for shorter time steps. For example, Parlange and Katul reported changes in ETa over 20 min time steps [49]. The ETp is calculated by the following equation originally proposed by Penman [50] for a free water surface:
where ∆ is the slope of the saturation vapor pressure curve of the air temperature calculated using the mean air temperature, which is an important parameter for describing vaporization and used in the equations for calculating the ETp from climatic data. is the psychometric constant and kept constant for each location, given by
where P is the atmospheric pressure, Rn is the net radiation near the surface expressed as the equivalent vaporization rate, which is the difference between the incoming net shortwave radiation and the outgoing net longwave radiation. Ea is the drying power of the air, which, in general, can be written as
where , ea are the vapor pressure at the evaporating surface and the vapor pressure in the atmosphere above, respectively; is a function of the horizontal wind velocity; and is the wind speed at a height of r meters above the ground surface. The data of the wind speed measured by the China Meteorological Observatory stations are generally taken at a height of 10 m (U10), which needs to be converted into a wind speed at a height of 2 m, which can be described as [50]
In Equation (1), Morton (1976) proposed calculating the wet environment evapotranspiration () with the Priestley–Taylor formula [51], where is the Priestley–Taylor evapotranspiration coefficient, the value of α depends on the surface vegetation coverage and regional micro-meteorological conditions, and α has a highly nonlinear relationship with soil moisture content, as well as significant temporal and spatial variability. The value ranges from 0.72 in the forest environment to 1.57 under strong advection conditions. Therefore, α generally adopts adjusted values in different areas:
by combining Equations (2) and (5), ETa can be written as
Next, we calibrate α in the AA model according to the closed basin water balance formula and then calculate the annual actual evapotranspiration (ETa) of the entire basin as
where P, R are the annual precipitation, the net stream flow at the basin outlet, this can be calculated through the outlet runoff of three control hydrological stations in this basin divided by the area controlled by the stations (catchment areas), and is the water storage changes in a catchment, respectively. Here, the change in water storage is negligible in a given water year. Considering that α has the characteristics of time and spatial variation, the different sub-areas are calibrated separately. The values of α were determined by the minimum relative error between the multiyear average ETa estimated by the AA model and the multiyear average ETa calculated by the water balance method. The relative error of the parameter calibration can be expressed as:
where ETWB is the actual multi-year average evapotranspiration calculated by the water balance method, and is the actual multi-year average evapotranspiration calculated by the AA model. Here, 1970–1994 is the calibration period, and 1995–2018 is the verification period.
The calculated ETa is analyzed in both time and space. In the spatial analysis, the interpolation method was used to realize the conversion of point data to area data of meteorological factors. The Kriging interpolation method was applied in this study since the uneven distribution of meteorological stations. Compared with inverse distance weighted and spline methods, Kriging is mainly used for the interpolation analysis of uneven points, and the ordinary Kriging interpolation method is the most commonly used method in geoscience statistics, and also has more applications in the spatial analysis of meteorological factors.
3.2. Trend Detection
Non-parametric Mann–Kendall rank correlation tests were used to detect the trend changes of ETa [52,53]. This method does not require the data to have the characteristics of a normal distribution. Instead, it requires the sequence to be random and independent, so the probability distribution is equivalent and not disturbed by a few outliers. A positive value of Z indicates an upward trend, while a negative Z value indicates a downward trend. This can relatively objectively determine the trend of long-term sequence data changes and is widely used in hydrology [54,55].
3.3. Sensitivity Analysis
The sensitivity coefficient of ETa is an important index used to measure the impact of climate factors, such as the mean temperature (Tmean), wind speed (U2), solar radiation (Rs), and actual vapor pressure (ea), on ETa. Different variables in the Penman–Monteith model have different meanings, so the sensitivity coefficient can be used to make each factor dimensionless and thereby compare the relationship between different climatic factors. To understand the influence of different factors on ETa, the dimensionless sensitivity coefficient defined by the dimensionless partial derivative with respect to the independent factors is used in this study. McCuen (1974) and Beven (1979) transformed the partial derivative into a non-dimensional form to determine the sensitivity of the variables:
where SVi is the sensitivity coefficient, and Vi is the ith variable. The sensitivity coefficient represents the variable of ETa caused by changes in meteorological factors. A positive value of SVi indicates that ETa increases with increases in the meteorological factor, and vice versa. This method has been widely used in evapotranspiration studies [22,23,32,54].
3.4. Trend Attribution
The contribution amount of each meteorological variable to evapotranspiration can be expressed as the partial derivative of ETa to the factor multiplied by the slope of the factor change and can be calculated by the following total differential equation [32]:
If we let TRy = dy/dt and TRi = dxi/dt be the long-term trends in y and xi, then Equation (10) can be rewritten as
If TRy and TRi are estimated as the slope of the linear regression for y and xi against time t, C(xi) can then be estimated as the contribution of xi to the long-term trend in y, which is exactly the product of the partial derivative and long-term trend in xi:
This can be simplified to
where the left side of the equation represents the change in ETa during the study period, and the right side is the sum of the contributions of the four meteorological factors. Here, C(U2), C(Rn), C(Tmean), and C(ea) represent the contributions of U2, Rs, Tmean, and ea contributed to the long-term ETa changes, respectively. If the contribution value is positive, the ETa increased with the long-term changes of the meteorological variables, and if the contribution value is negative, then the result is the opposite.
In addition, the contribution rate of a meteorological factor to the long-term trend of ETa is
where P(x) is the contribution rate of a meteorological factor to the long-term trend of ETa.
4. Results and Discussion
The hydrological and precipitation data were available from 1970 to 2018 for the whole basin, these data were used for calibration only and the results listed in Table 4. The calibration period was selected from 1970 to 1994, and the validation period was from 1995 to 2018 for the Wei River basin. Considering that the model parameters varied spatially, the Wei River Basin was divided into three larger sub-areas, the Wei River, Jing River, and Beiluo River, to calibrate the model parameters, respectively. The value of α ranged from 0.5 to 1.5, with a step size of 0.01, taking the α when the relative error between the multi-year ETa calculated by the AA model and the multi-year ETa calculated by the water balance reached the minimum. The AA model calibration results are shown in Table 3. The values of α in the Wei River, Jing River, and Beiluo River are 0.93, 0.88, and 0.96, respectively. Compared with the calibration period, the relative error of ETa in the validation period ranged within ±10% in three sub-areas. Meanwhile, the absolute errors during calibration period were 26.04 in Jing River, −14.59 in Beiluo River, −2 in Wei River, the absolute error in the validation period ranged with −5.36–−0.46 in three sub-basins. Consequently, the ETa estimated by the AA model was reasonable.
4.1. Temporal Change
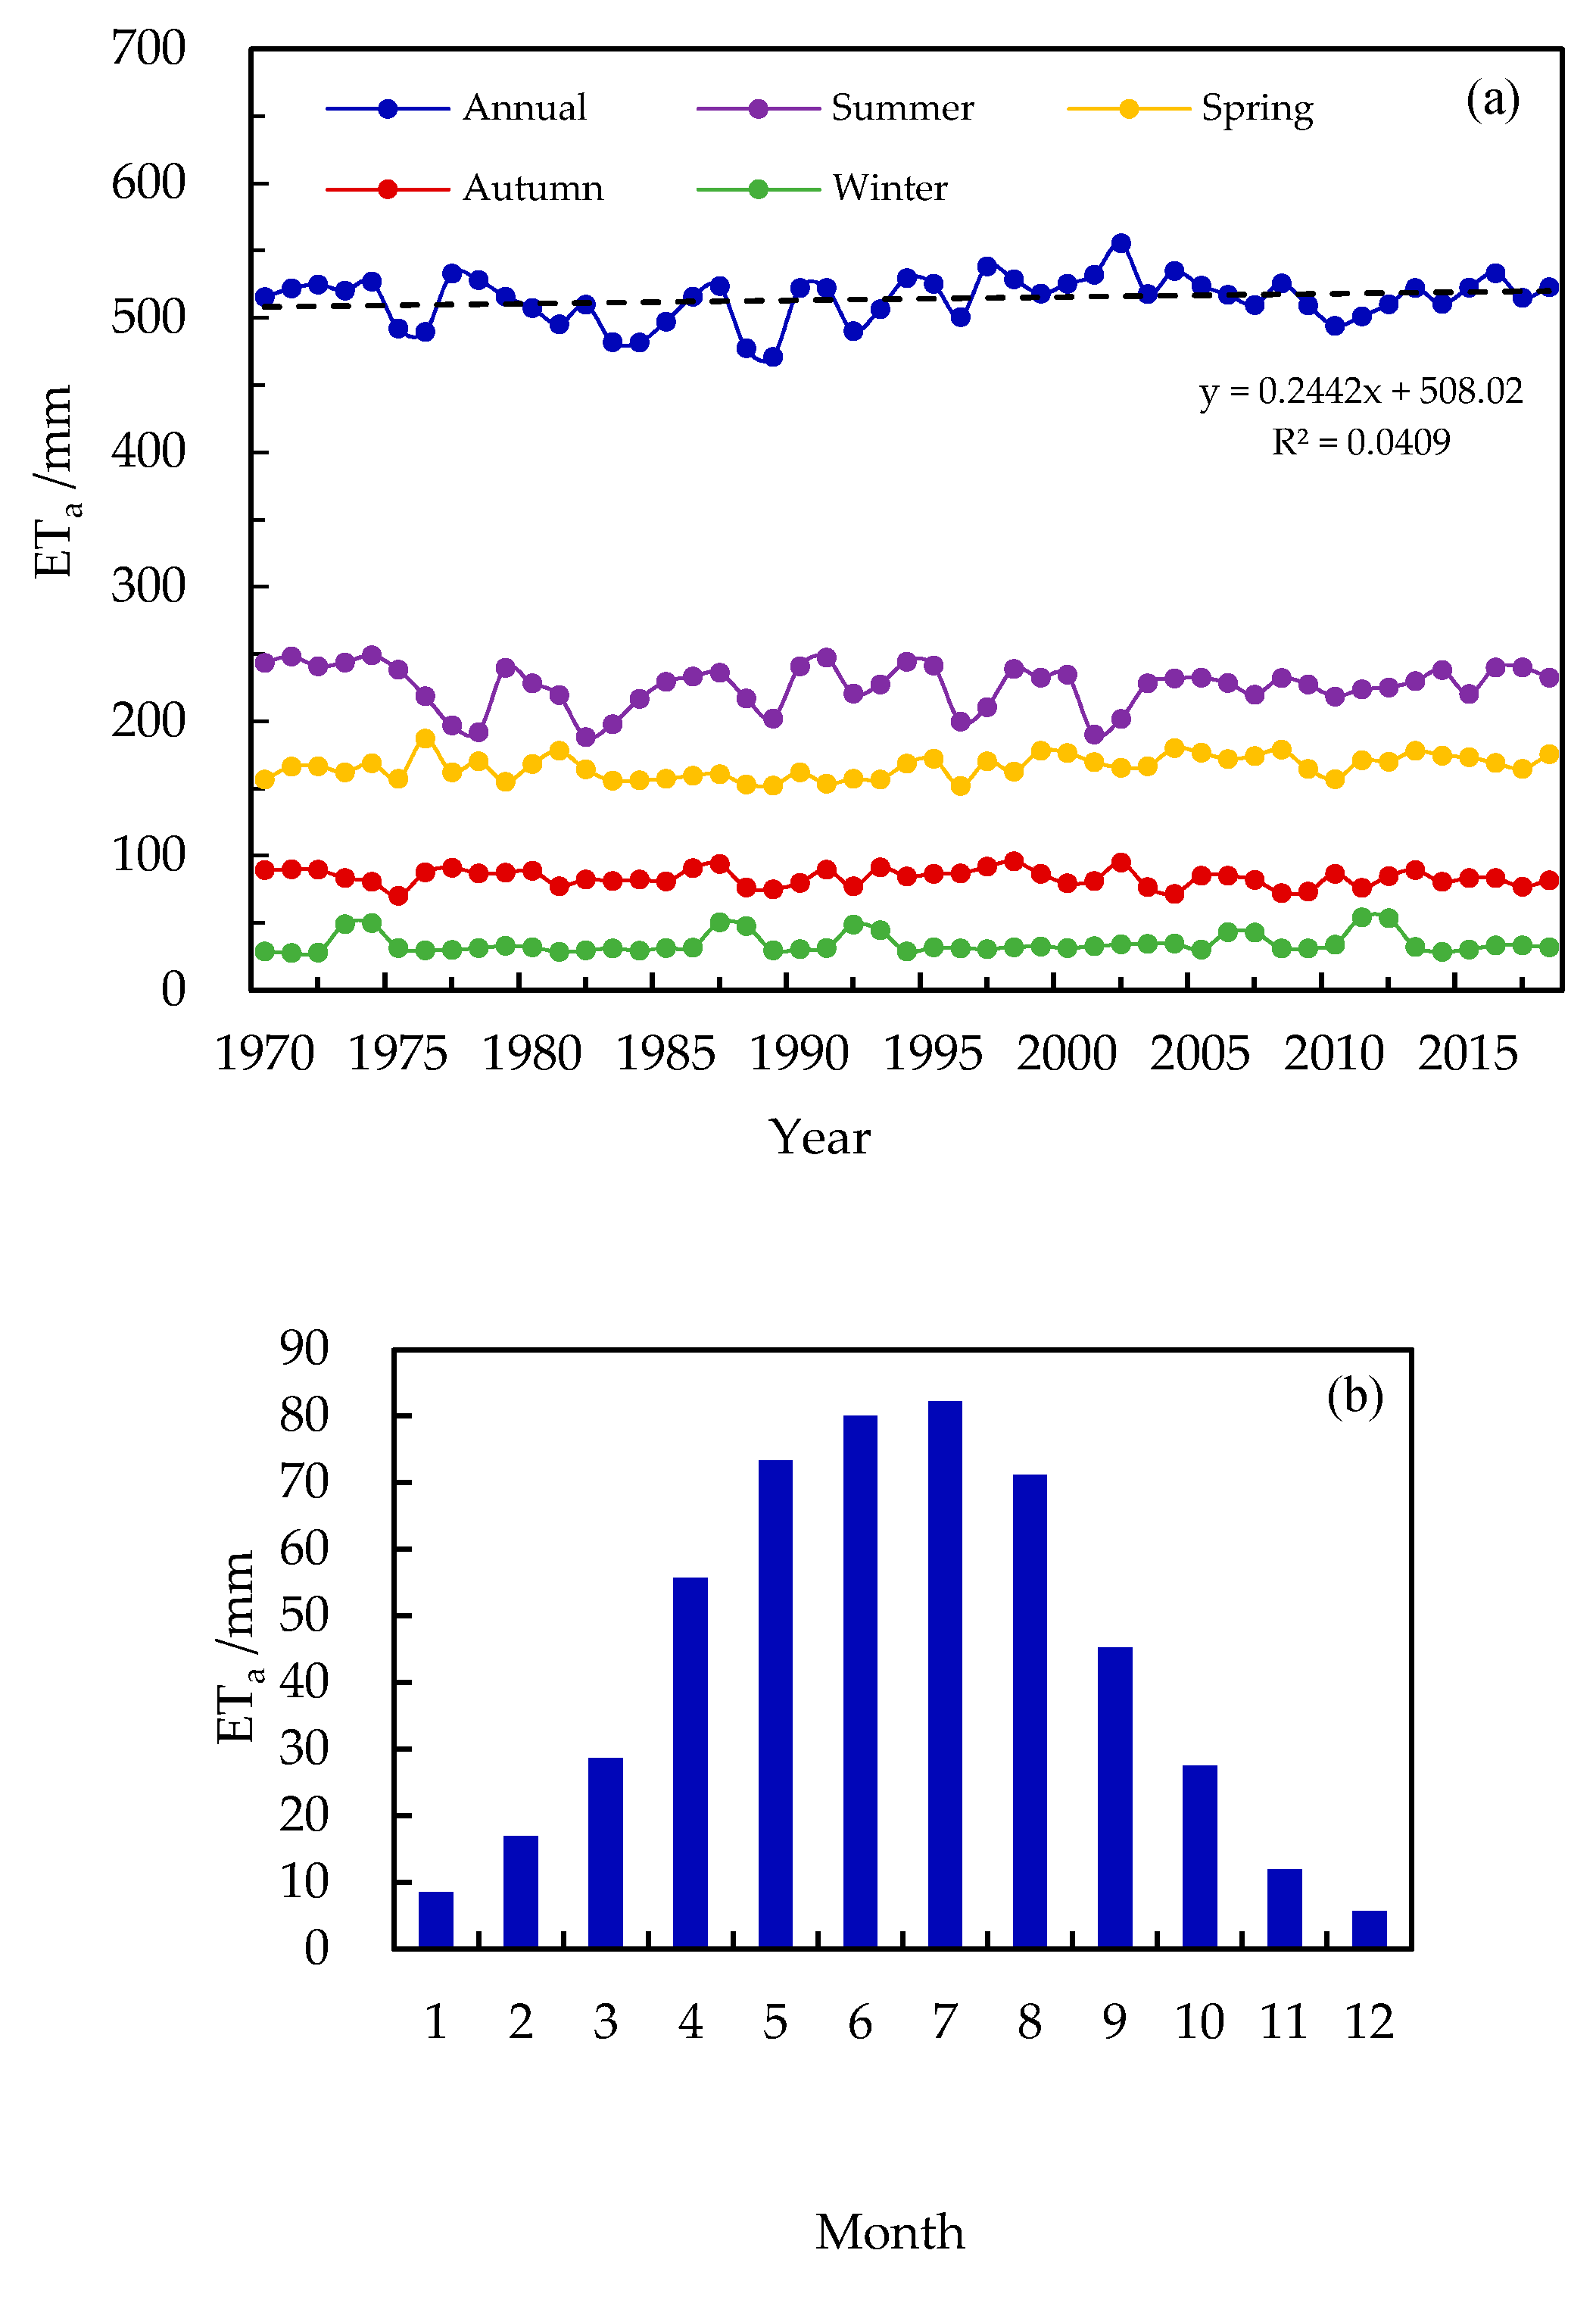
The temporal changes in annual and seasonal ETa from 1970–2018 are given in Figure 2a. The annual average ETa in the WRB was 522.73 mm, with an insignificant increasing trend from 1970 to 2018. The averages of ETa for spring, summer, autumn, and winter were 166.32 mm, 226.1 mm, 83.87 mm, and 34.77 mm, respectively, accounting for 31.82%, 43.25%, 16.04%, and 6.65% of the annual ETa. The seasonal ETa also showed an insignificant increasing trend over the study period, except for the ETa in autumn, which showed an insignificant decreasing trend. The inter-annual variation of ETa showed that the ETa increased from January to July but decreased from August to December, with the largest ETa from April to September (Figure 2b).
4.2. Spatial Distribution of Seasonal and Annual ETa
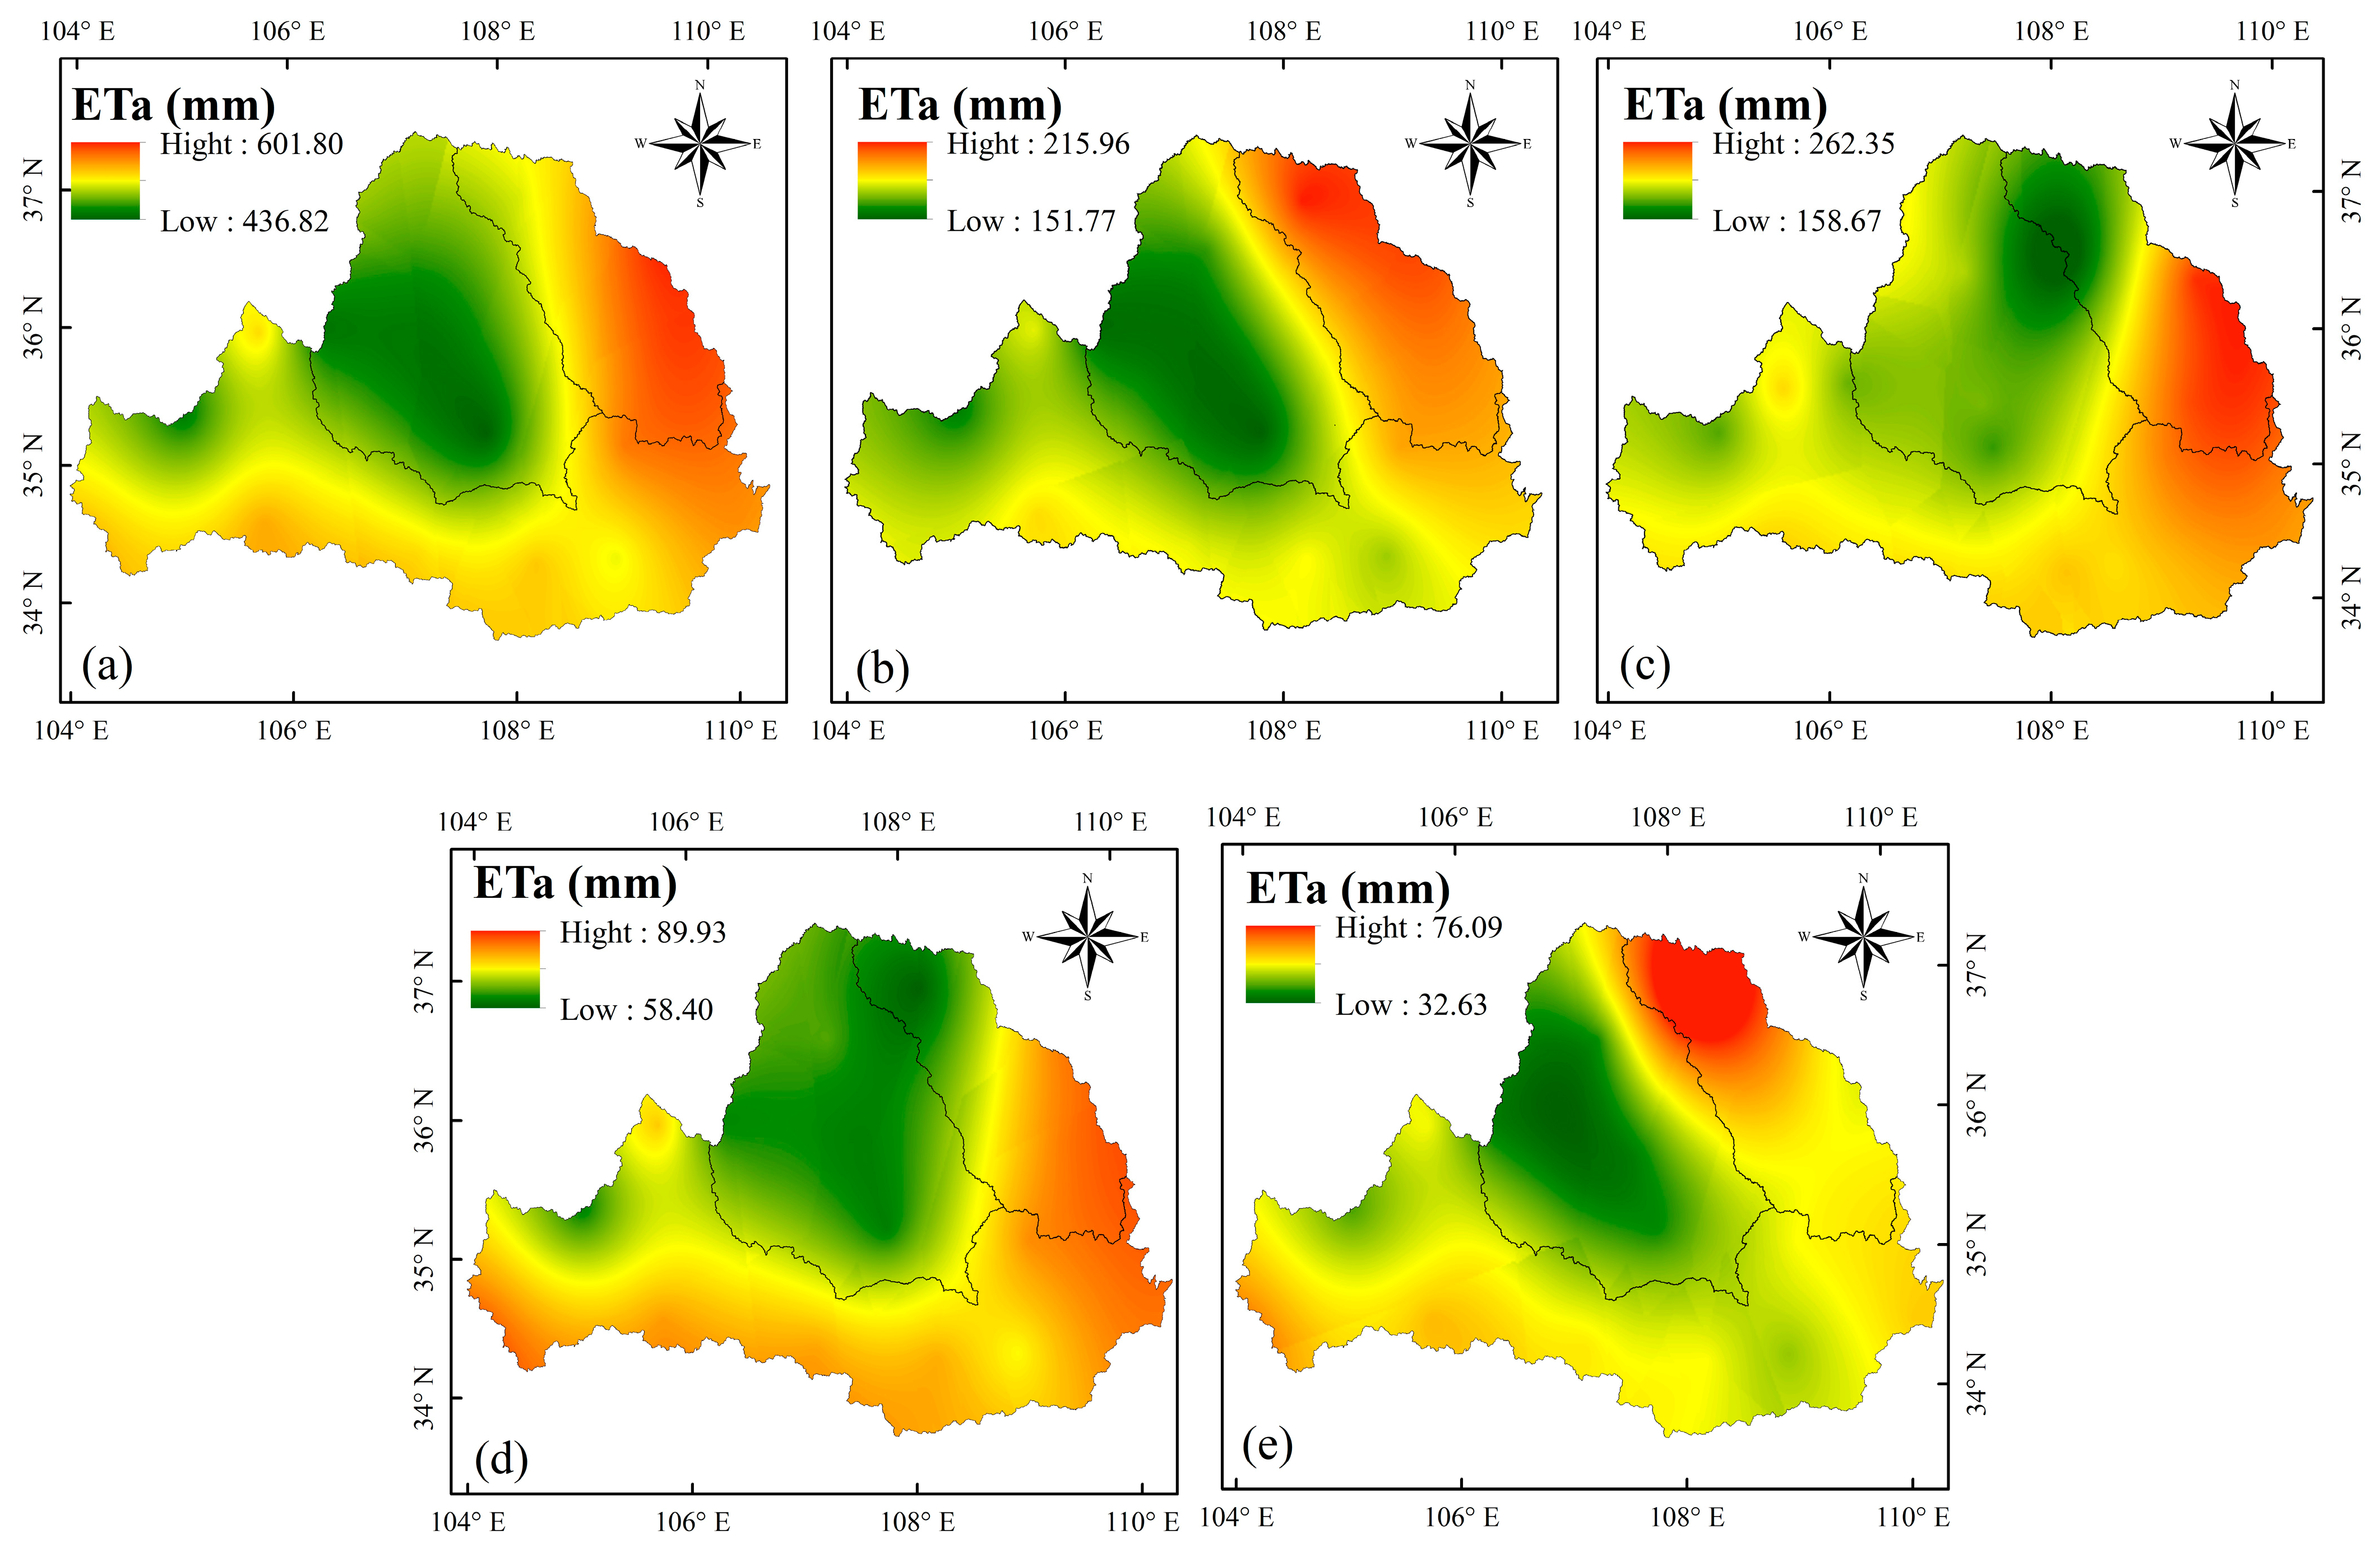
The spatial distribution of seasonal and annual ETa in the WRB is shown in Figure 3, based on data interpolated by the Ordinary Kriging interpolation method (a method widely used in geoscience statistics [52]) from 22 meteorological stations during 1970–2018. The mean annual ETa ranged from 436.8 mm to 601.8 mm, with the high annual ETa values distributed in the eastern part of the whole basin and the southern part of the Wei River and low annual ETa values mostly found in the western and central areas of the WRB. The ETa decreased from southeast to northwest in the WRB. The distribution patterns of seasonal ETa were similar to the annual patterns, which were roughly consistent in different regions. In summer and autumn, the distribution of ETa was basically consistent with the spatial changes in the annual ETa values. In spring and winter, higher ETa values were found in the eastern part of the whole basin, while lower ETa was observed in the central and northwestern areas of the whole basin, decreasing from east to west. The annual, summer, and autumn distributions of ETa seem to be related to the elevation change of the basin. The ETa value was found to be higher at lower altitudes and lower at higher altitudes.
In spring, summer, and autumn, ETa was higher in the east and south of the basin and lower in the central and western regions. In the east of the basin is the Beiluo River, which was the first demonstration site for the implementation of the Grain for Green program in China. This area has high forest coverage, and its interception evaporation and vegetation transpiration increase with the increasing of large-scale vegetation restoration. The south of the basin near the north of the Qinling Mountains belongs to a warm temperate semi-humid climate zone. There are a large number of warm temperate deciduous broad-leaved forests in the area with good vegetation coverage. In addition, the Guanzhong Plain lies in the southern part of the basin, which is one of the major grain-producing areas in Shaanxi province; the farmland irrigation also leads to an increase of ETa. Therefore, the increase in cultivated land and woodland have enhanced the ETa in the east and south of the basin. Some studies have shown that vegetation restoration resulted in an increase of the ETa in the Loess Plateau [56]. The land type in the west and north is mainly grassland, and the evapotranspiration in grassland is less than that in woodland and cultivated land. Grassland is less disturbed by human activities than other types, so the ETa change is relatively constant in the west and north of the basin. The decrease of ETa in the northern part of the basin is also related to a decrease in sunshine and wind to a certain extent [57]. Compared with other seasons, the ETa decreased in winter in the central and eastern basins, mainly due to the low temperature decreasing the vegetation transpiration and water demands in agricultural irrigation regions.
4.3. The Trends of ETa Change
The trend of ETa tested by the Mann–Kendall method is shown in Figure 4. Here, the trend of ETa for the WRB is characterized by complicated spatial variability. The annual ETa increased at 17 stations, with six (27%) stations significant at a 95% confidence level (the values of MK test over the 2.76). The annual ETa decreased at five stations, mainly distributed in the southern part of the basin. In spring, the ETa increased significantly at 22 stations, with 11 of those stations dominated by significant increasing trends at a 95% confidence level. In summer, the ETa of the 16 stations presented a decreasing trend, but most of them presented no obvious significance. Most stations in the autumn presented an increasing trend, mainly distributed in the upper area of Jing River and the northern part of the whole basin, accounting for 59% of all stations, but the significance was not very high. For the winter, the ETa increased at 20 stations (10 of which were statistically significant at a 95% confidence level, accounting for 45.5% of all stations), whereas only two stations decreased with a low-significance confidence level.
In terms of the different watersheds, the ETa on the main stream of the Wei River mainly increased in spring and winter, the Beiluo River showed an increasing trend in other seasons (except for summer and autumn), and the Jing River showed an increasing trend in other seasons, except for summer.
4.4. Impact Factors of ETa
4.4.1. Sensitivity of the ETa to Meteorological Variables
The average annual values of the sensitivity coefficients for the mean temperature, solar radiation, wind speed, and vapor pressure were −0.02, 0.30, 0.16, and −0.18 over the whole basin, respectively (Table 5). These results indicate that solar radiation is the most sensitive meteorological variable for ETa changes, followed by vapor pressure, wind speed, and mean temperature in this basin. Annually, the ETa showed a positive correlation with the mean temperature, solar radiation and wind speed and a negative correlation with the vapor pressure, indicating that the ETa increases with an increase of mean temperature and vapor pressure but decreases with a decrease of solar radiation and/or wind speed. For example, when mean temperature, solar radiation, and wind speed increased by 10% and vapor pressure reduced by 10%, ETa will increase by 0.02%, 0.3%, 0.16%, and 0.18%, respectively. Seasonally, spring and winter are the most sensitive to solar radiation and wind speed, while summer and autumn are the most sensitive to solar radiation and vapor pressure. In general, both years and seasons are the most sensitive to solar radiation and the least sensitive to mean temperature. Another study also confirmed that solar radiation [58,59] and relative humidity [35,60] are the most sensitive factors affecting evapotranspiration changes in some regions, such as most parts of China [61,62], the Upper Heihe River Basin [63], and India [16]. Recently, Zhao (2018) [64] reported that relative humidity is the most sensitive meteorological variable for evapotranspiration changes in the north, northeast, and northwest of China, followed by wind speed, while in central, southwest, and eastern China, relative humidity is the most sensitive factor, followed by solar radiation. Fan Junliang (2016) showed that hours of sunshine is the most sensitive factor in plateau areas, while relative humidity is the most sensitive factor in temperate continental climate zones, temperate monsoon climate zones, and subtropical monsoon climate zones [65]. Therefore, the changes in evapotranspiration and sensitivity to different meteorological factors are quite different in different regions.
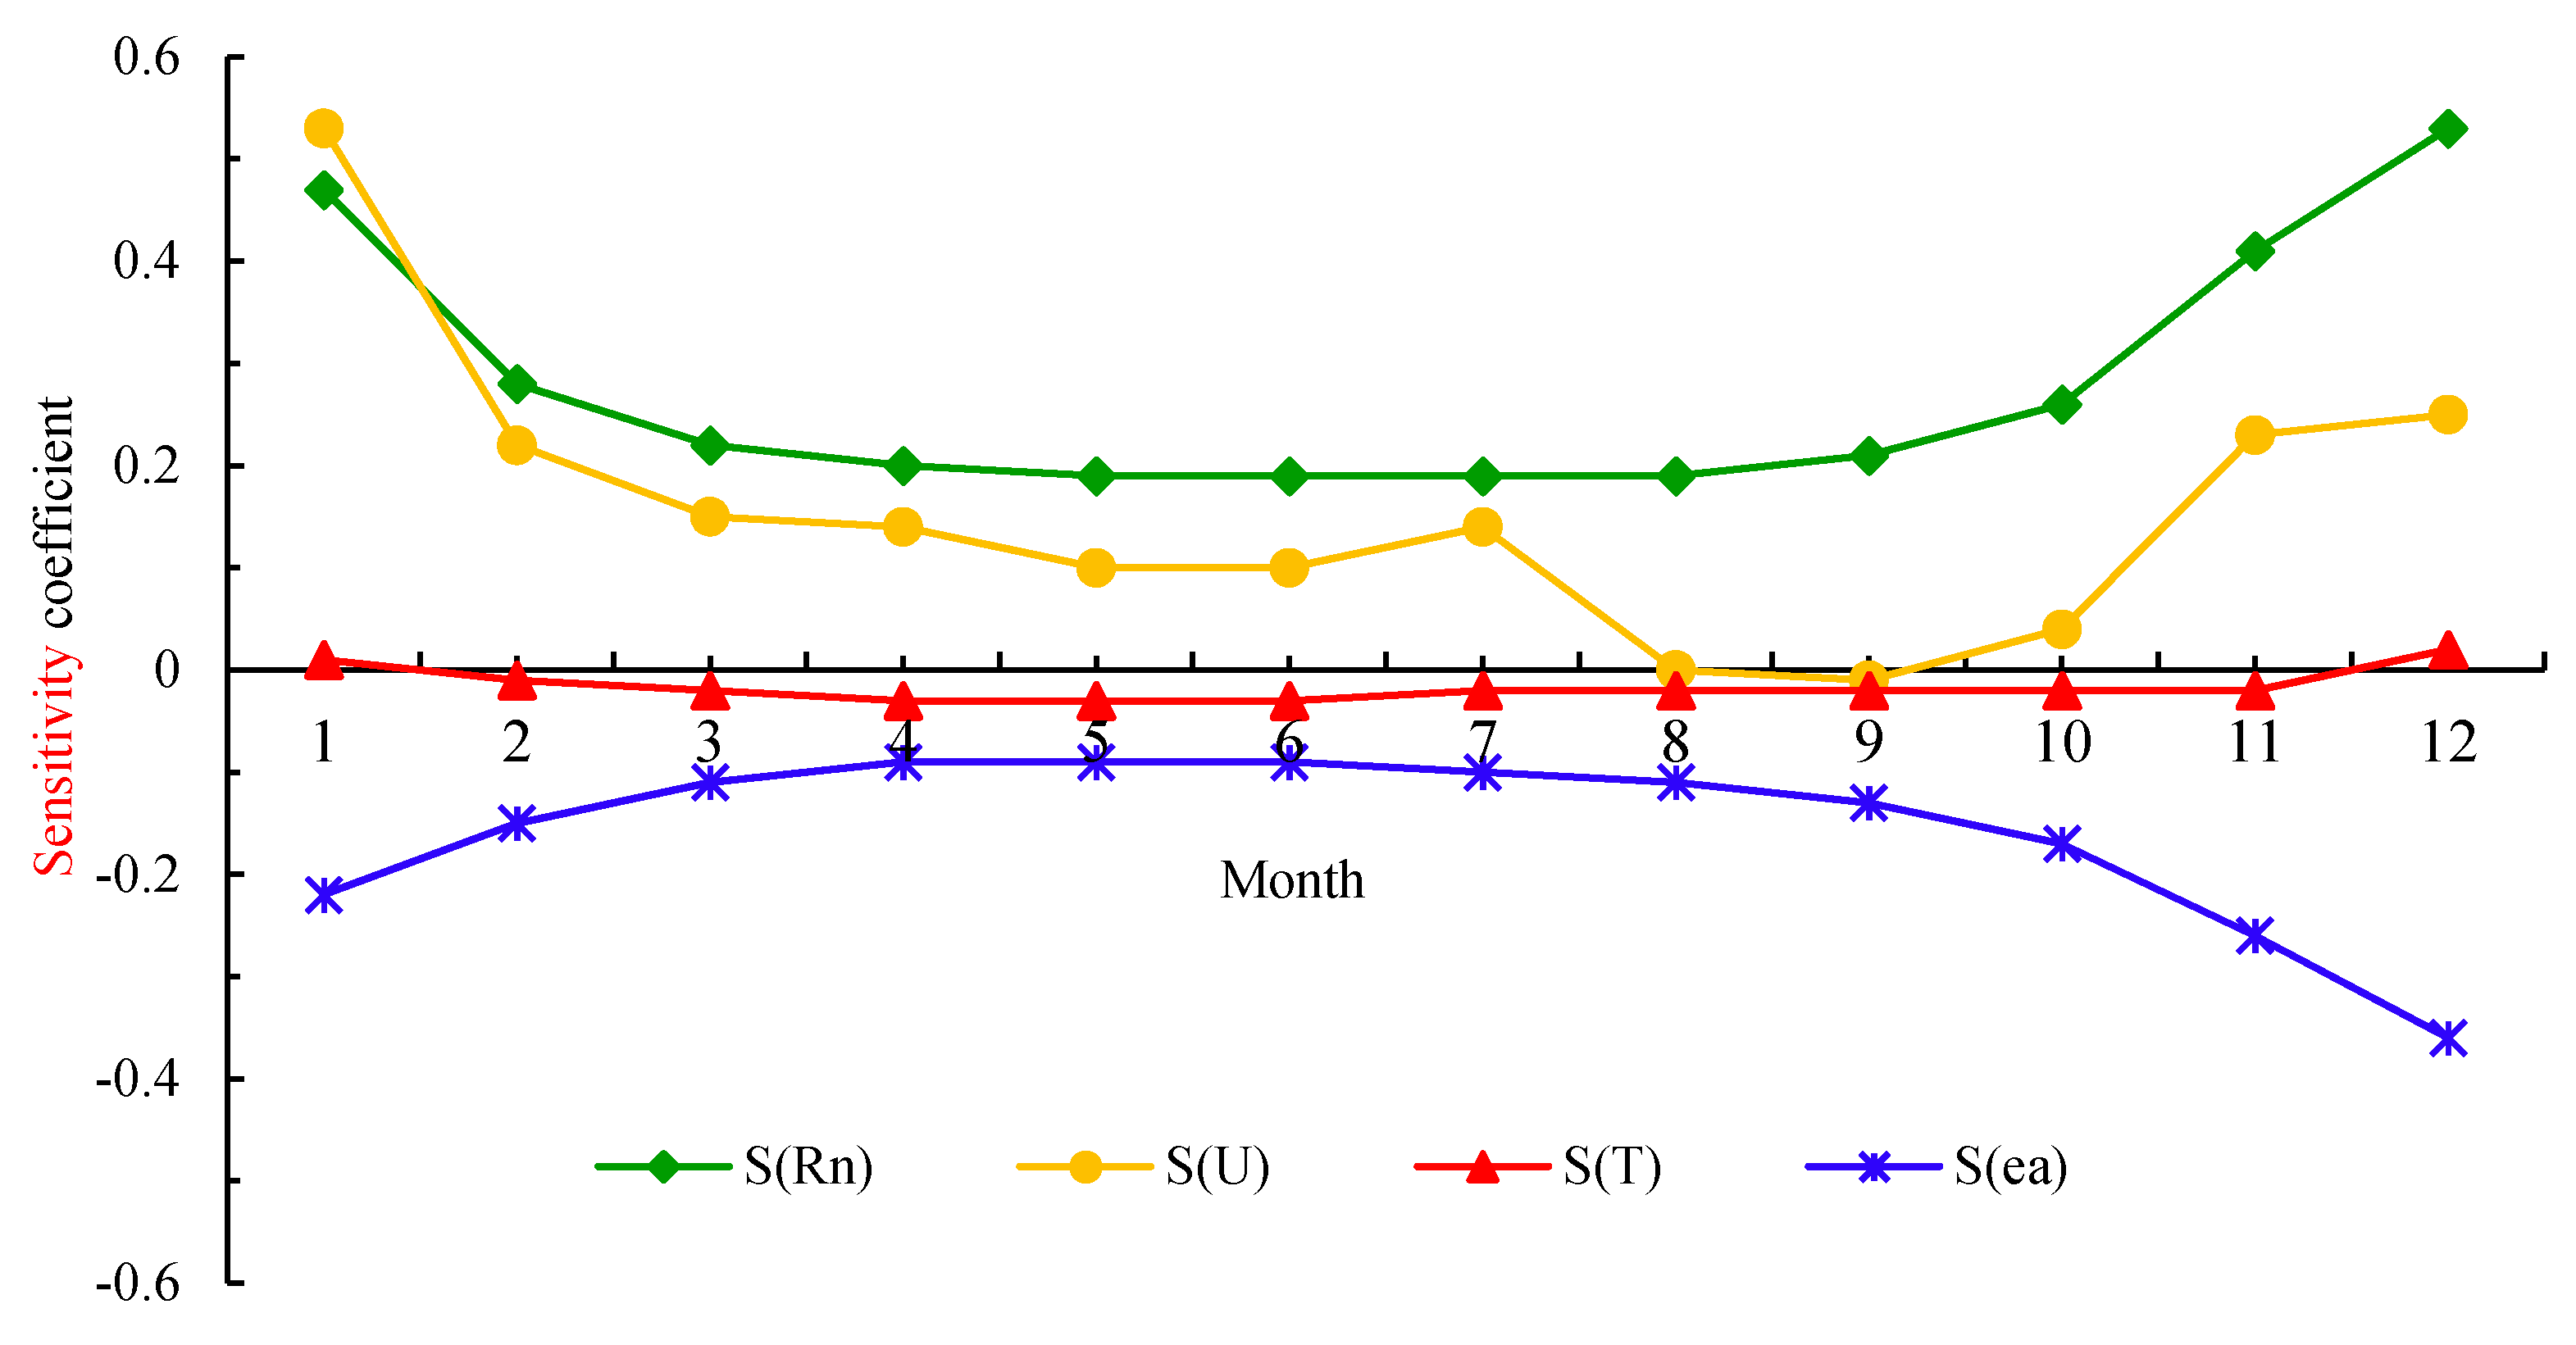
The monthly sensitivity coefficients of the meteorological variables showed that the sensitivity coefficients of ETa to solar radiation and wind speed are positive, indicating that ETa experiences an increasing trend with an increase in solar radiation and wind speed (Figure 5). The ETa sensitivity coefficient to solar radiation is between 0.19 and 0.53, with the maximum in December and the minimum in August. The sensitivity coefficient to wind speed is between −0.01 and 0.53, with the maximum and minimum values in January and August, respectively. The sensitivity coefficients of ETa to mean temperature and vapor pressure all have negative values (except for the positive temperatures in December), indicating that the ETa decreases with an increase in mean temperature and vapor pressure during the year. The sensitivity coefficient of ETa to mean temperature is between −0.03 and 0.02. The maximum occurs in December, and the minimum occurs in June. The sensitivity coefficient to vapor pressure is between −0.36 and 0.09; the maximum occurs in June, and the minimum occurs in December. In addition, the change curve for the sensitivity coefficient of ETa to solar radiation and vapor pressure changes symmetrically.
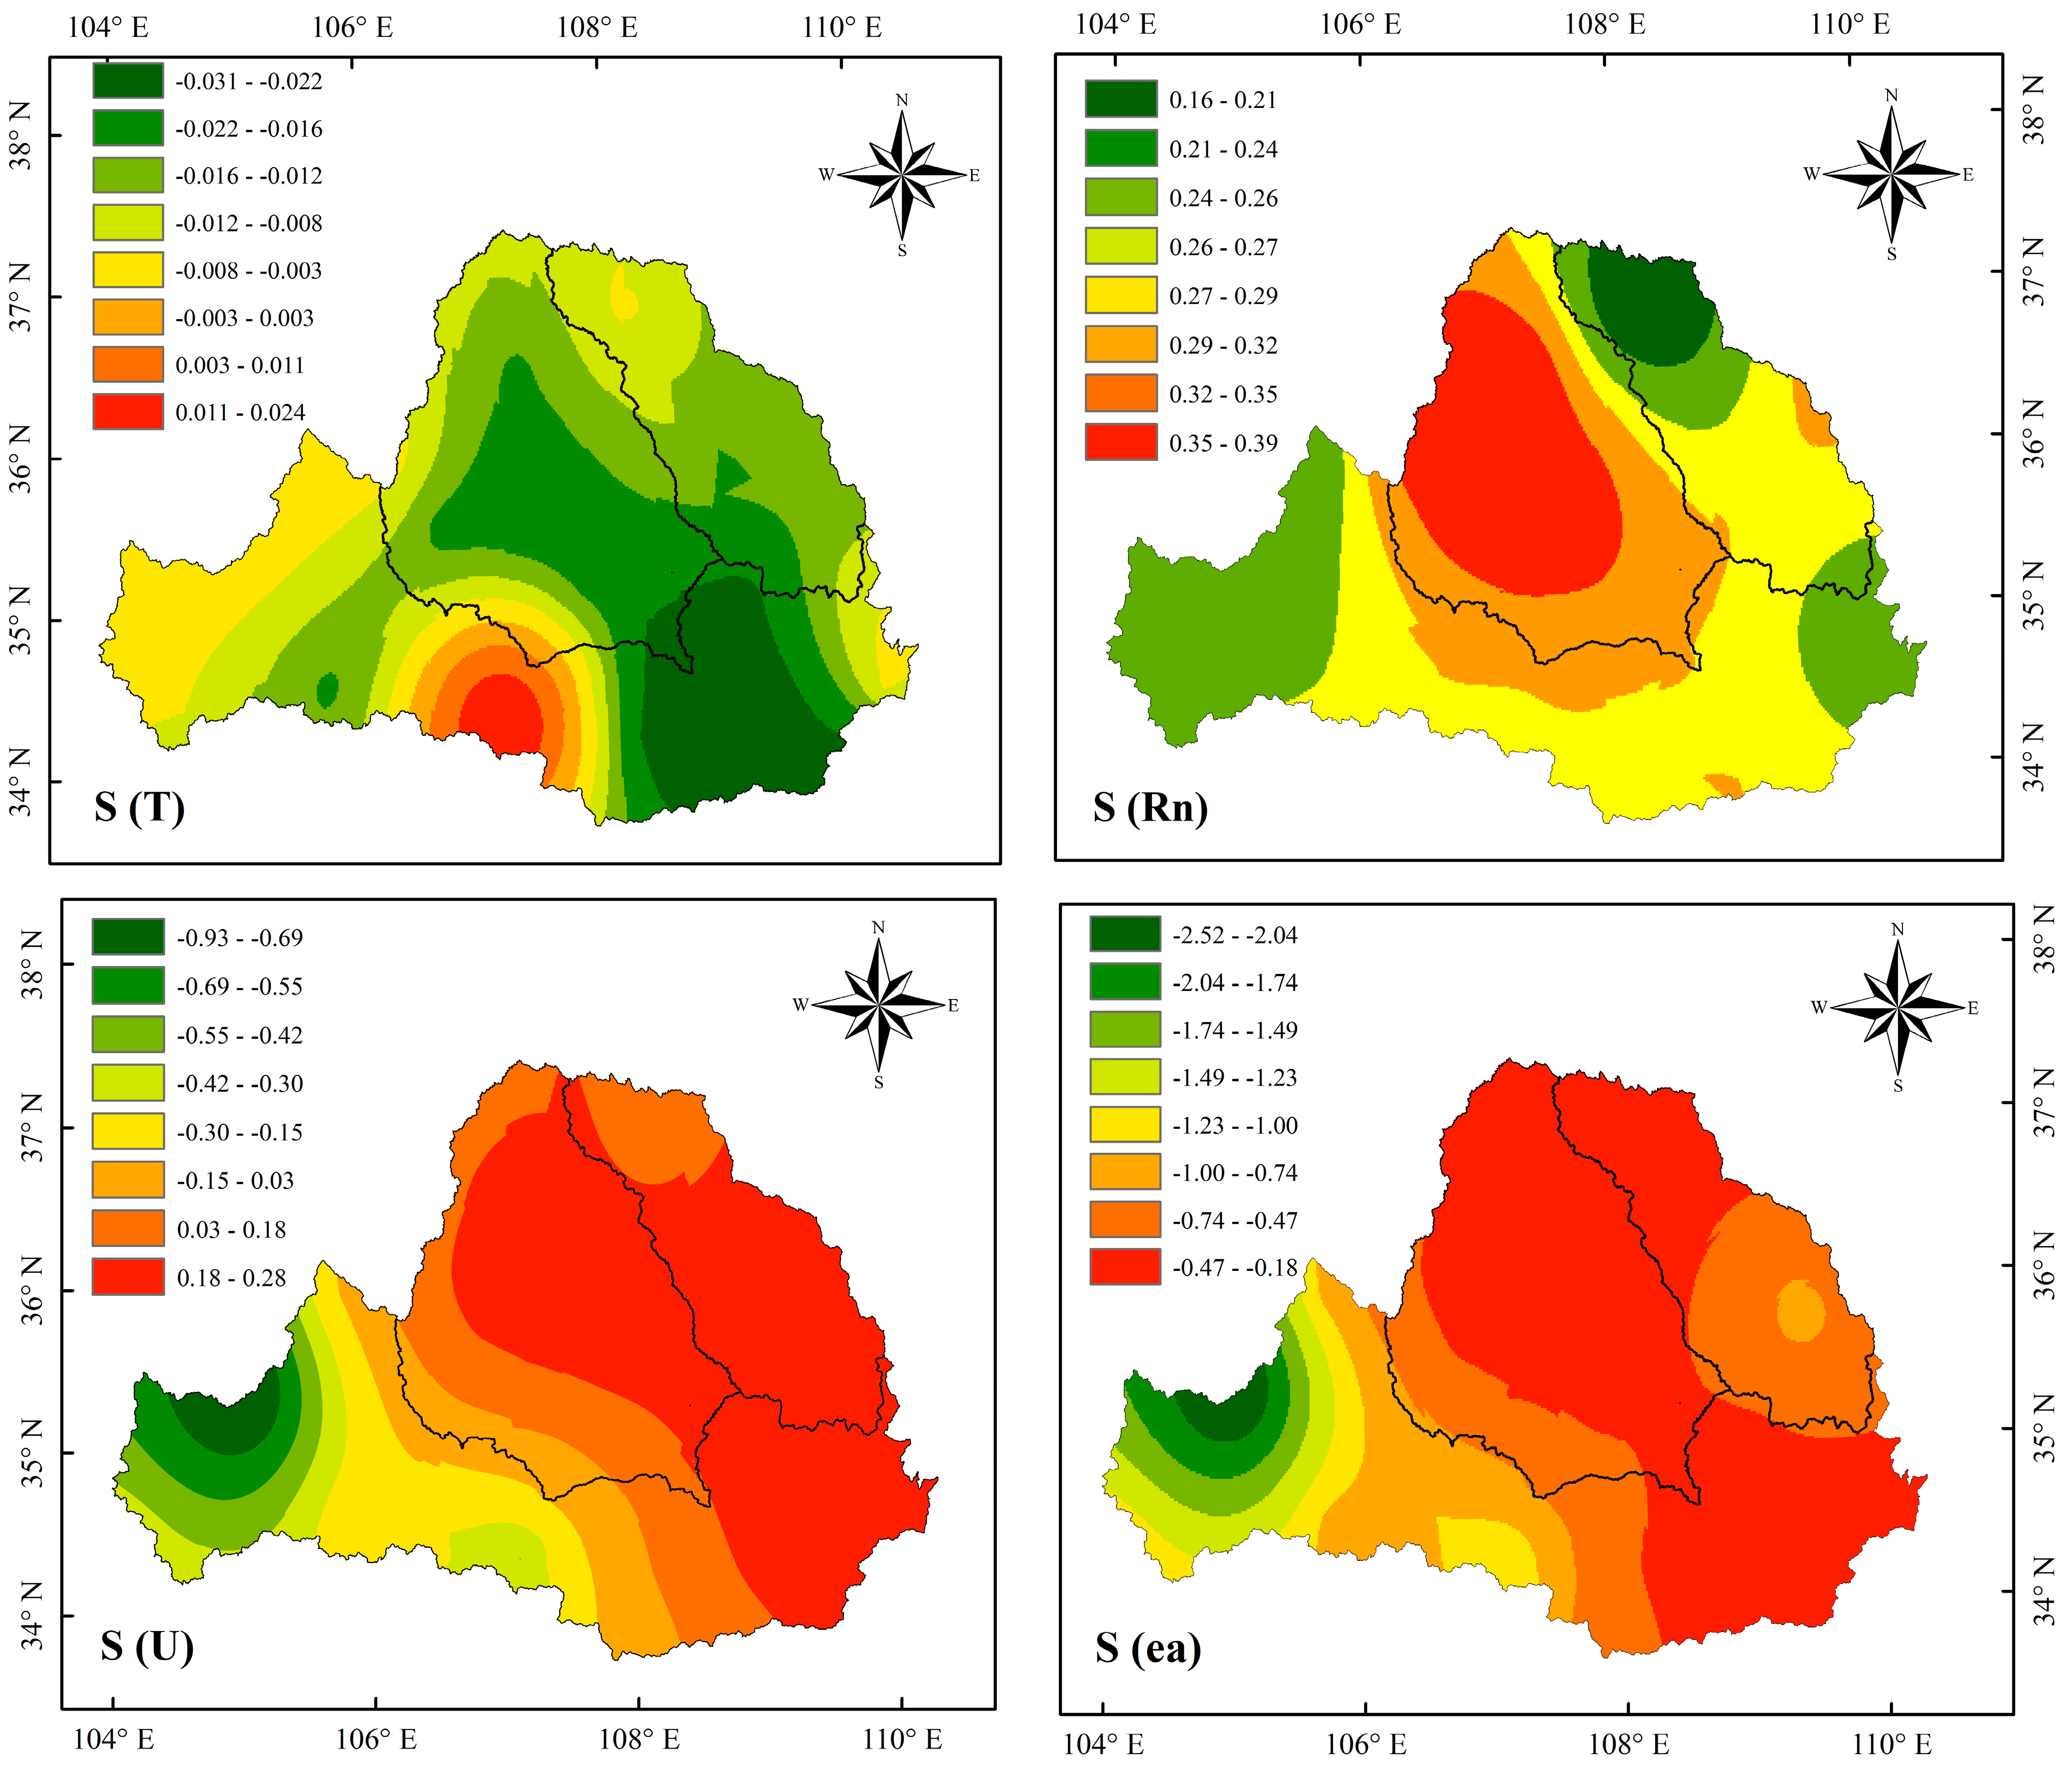
The spatial distribution of the annual sensitivity coefficient of the ETa in the WRB from 1970 to 2018 is shown in Figure 6. The sensitivity of ETa to different meteorological variables has a certain zone distribution. Based on the distribution analysis of the ETa to the mean temperature sensitivity coefficient, the sensitivity coefficient value is distributed between −0.03 and 0.02. The high-value areas mainly occur around the Baoji station and the main stream of the Wei River, where the sensitivity coefficient values are positive, while the rest of the stations in the basin have negative values, and low-value areas are mainly distributed in the southeast of the basin. Based on the distribution analysis of the ETa for the solar radiation sensitivity coefficient S(Rn), the sensitivity coefficients are mainly distributed between 0.16 and 0.39; the high value areas are mainly distributed in the upper reaches of the Jing River, and the sensitivity coefficients of the whole basin all have positive values, indicating that the ETa of the entire basin increases with an increase in solar radiation. The low-value areas are mainly distributed around Wuqi station in the upper reaches of Beiluo River, with an area smaller than the high-value area. In addition, a similar spatial distribution of sensitivity value changes can be observed for wind speed and vapor pressure, which have a coherent spatial pattern, and both show a decreasing trend from west to east. The high-value areas are mainly located in the middle east of the basin, while the low-value areas are located in the west side of the basin. The high-value areas of wind speed and vapor pressure account for nearly half of the basin’s area.
4.4.2. Contribution of the ETa to Climatic Variables
Table 6 shows the contributions of each meteorological variable to ETa changes. Annually, the increase in mean temperature and vapor pressure should have led to −0.0033 and −0.0001 mm·a−1 decreases in ETa, respectively; however, the decreases of solar radiation and wind speed instead yielded −0.0058 and −0.0006 mm·a−1 decreases in ETa. The total contribution of different meteorological variables led to a decrease of −0.0046 mm·a−1 in ETa. It is thus concluded that solar radiation is the dominant factor decreasing the annual ETa. The contribution rates of mean temperature, solar radiation, wind speed, and vapor pressure to the long-term trends for annual ETa were 2.79%, 12.69%, 12.89%, and 71.64%, respectively. This indicates that in the long term, solar radiation is the most crucial factor (except autumn) for ETa changes over the WRB, followed by vapor pressure, wind speed, and mean temperature.
Seasonally, the contributions of each meteorological variable in summer and autumn (the warm season) are larger than those in spring and winter, and the total contributions of each season are negative, except for winter. The contribution of each factor in the first half of the year was greater than that in the second half of the year, indicating that the ETa changes in the basin were mainly affected by the summer and autumn. For annual contributions, solar radiation was found to be the dominant factor affecting the seasonal contributions to ETa in the study area, except for autumn, followed by vapor pressure, mean temperature, and wind speed. For example, in spring, the mean temperature, solar radiation, vapor pressure, and wind speed led to a 0.0024, −0.0082, 0.0011, and −0.0104 mm·a−1 decrease in ETa, respectively. Wind speed, on the other hand, showed a positive effect on ETa. This effect was offset by decreases in the mean temperature, solar radiation, and vapor pressure. The combined effects of the four meteorological factors resulted in a −0.0199 mm·a −1 decrease in ETa. Based on the contribution rates of different meteorological variables to the long-term trends in seasonal and annual ETa, vapor pressure was found to be the dominant factor (except in autumn) for ETa changes over the WRB, followed by solar radiation, wind speed, and mean temperature.
The sensitivity coefficient of ETa to meteorological factors refers to the changes of ETa caused by the unit changes of the meteorological variables, while the actual contributions of these variables to the changes of ETa also depend on their own variability. Therefore, whether or not a single meteorological variable is the main factor affecting the changes in long-term ETa depends on the combined effect of the sensitivity of this meteorological variable to ETa and the slopes of the variable itself. For example, although vapor pressure is the second-most sensitive variable to annual ETa changes in this region, it presents the largest impact (contribution) to ETa changes compared to other climatic variables in spring. Generally, solar radiation is the dominant factor affecting the changes in annual ETa, followed by vapor pressure.
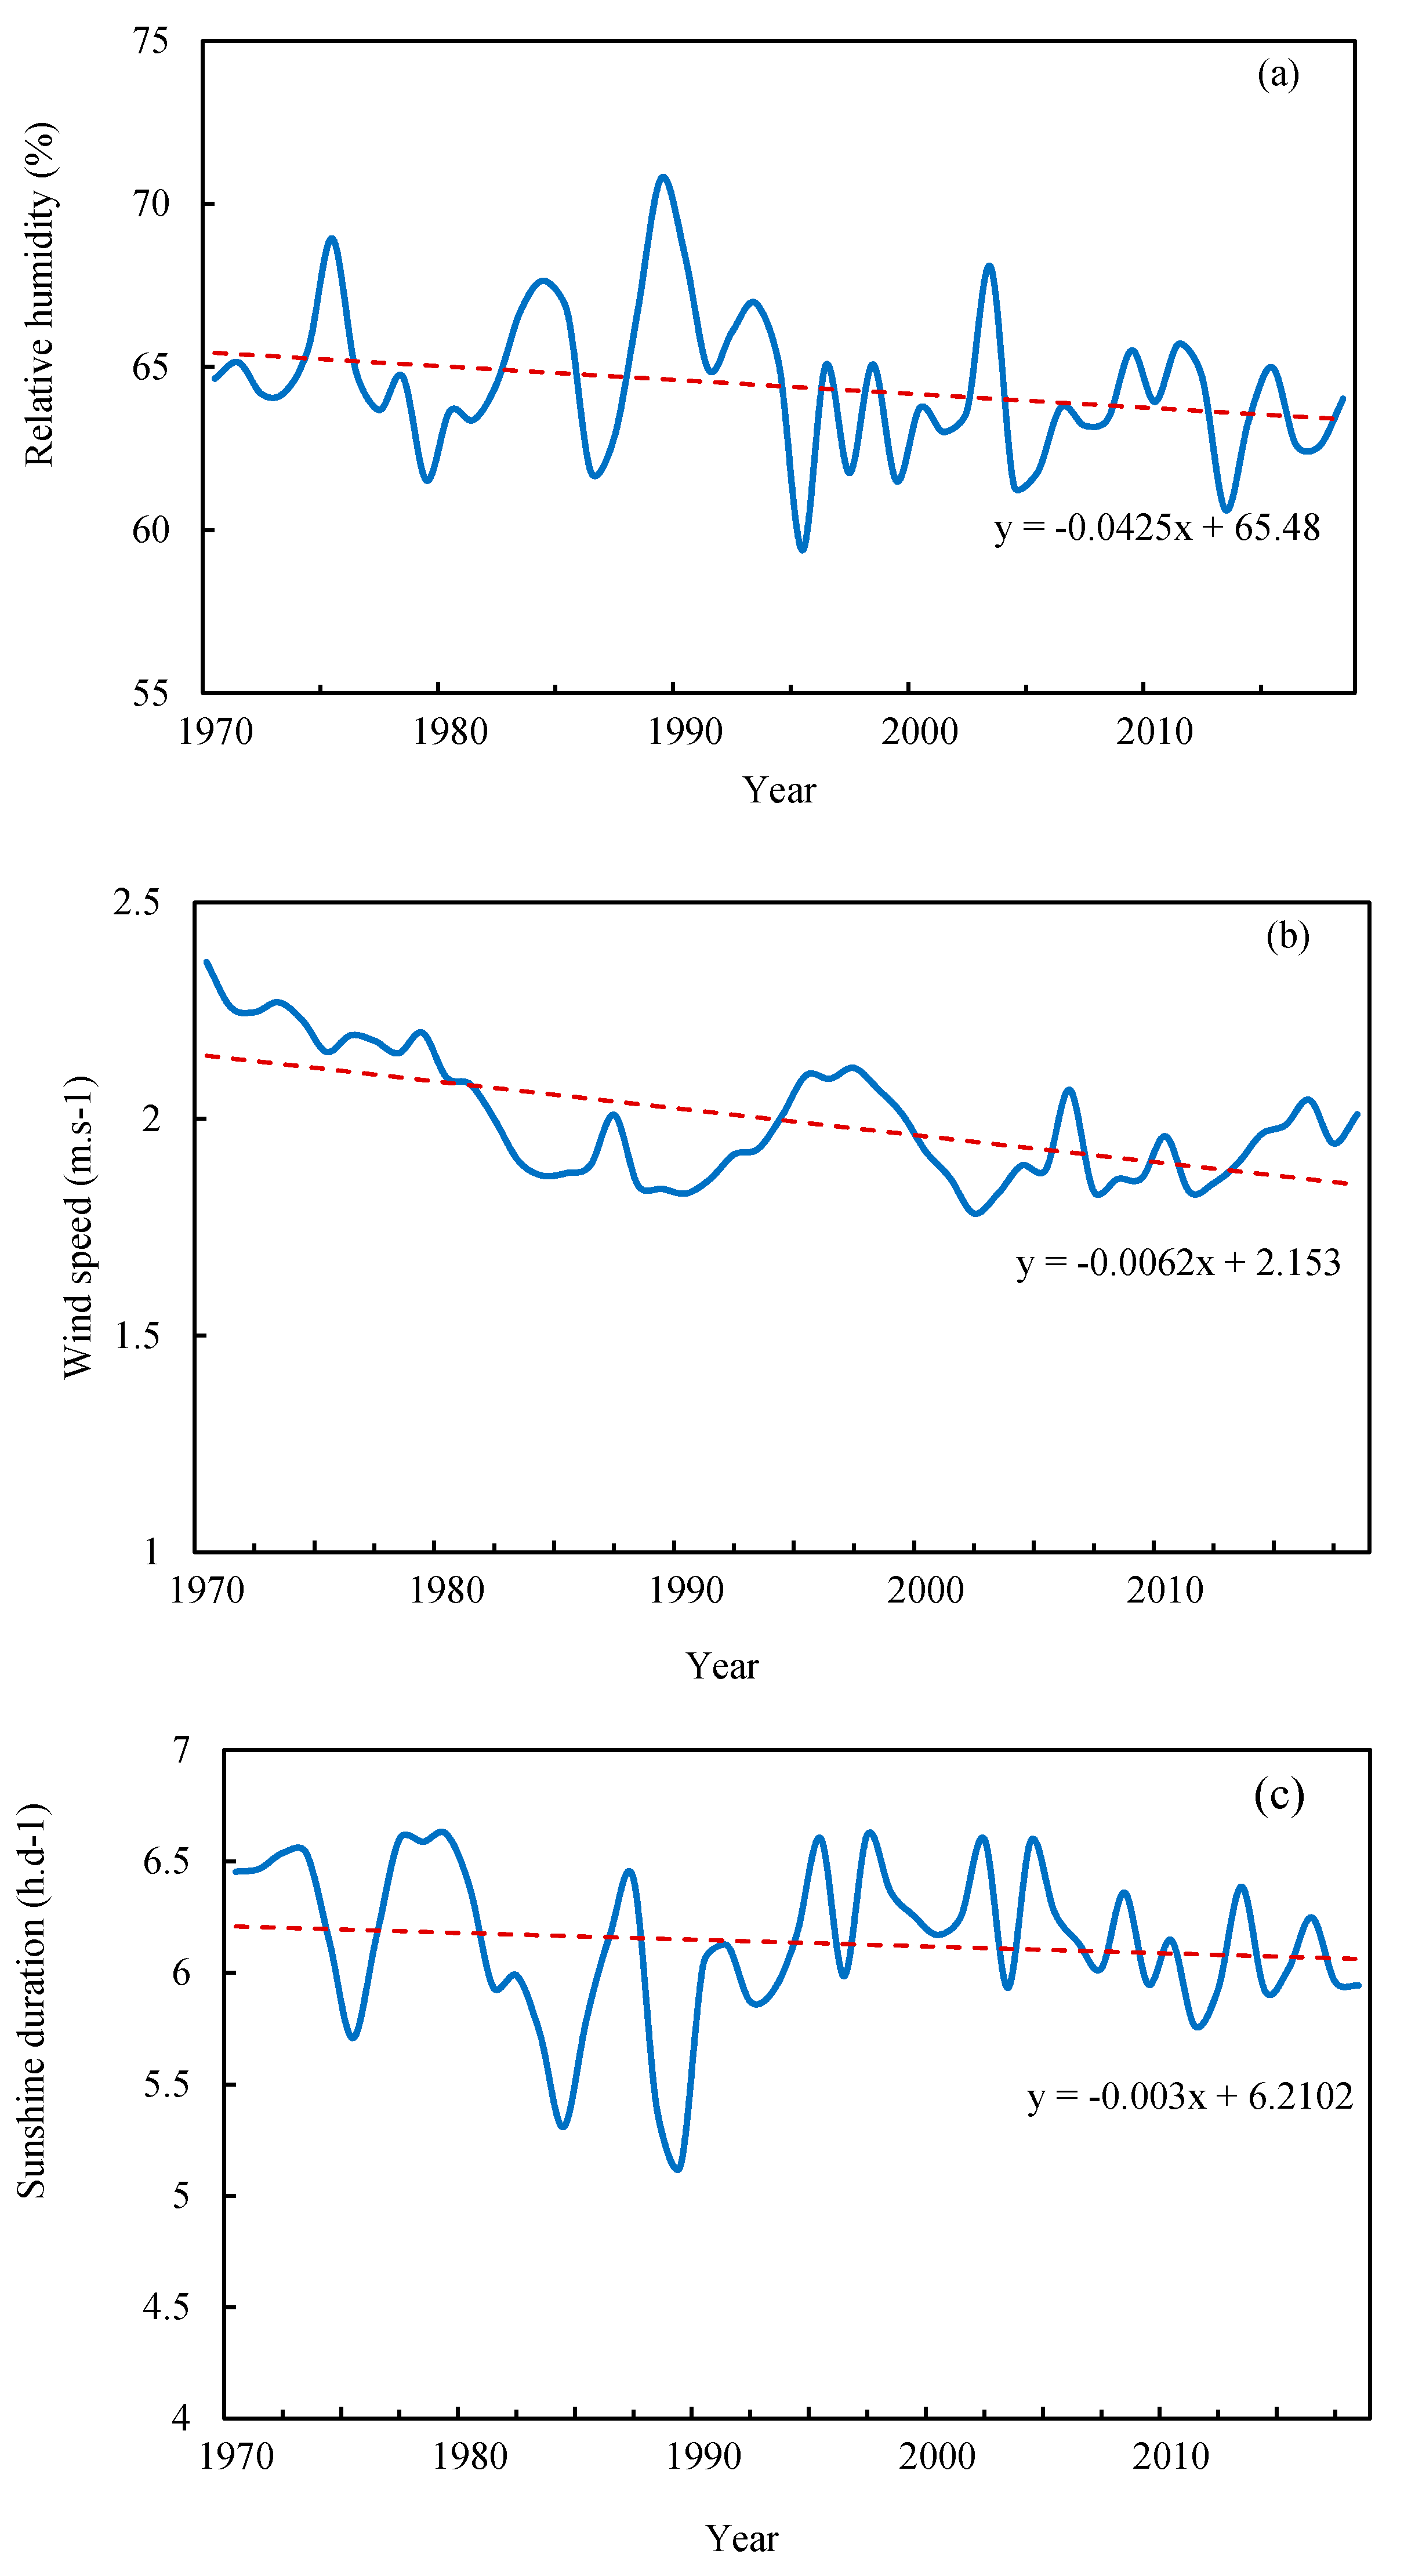
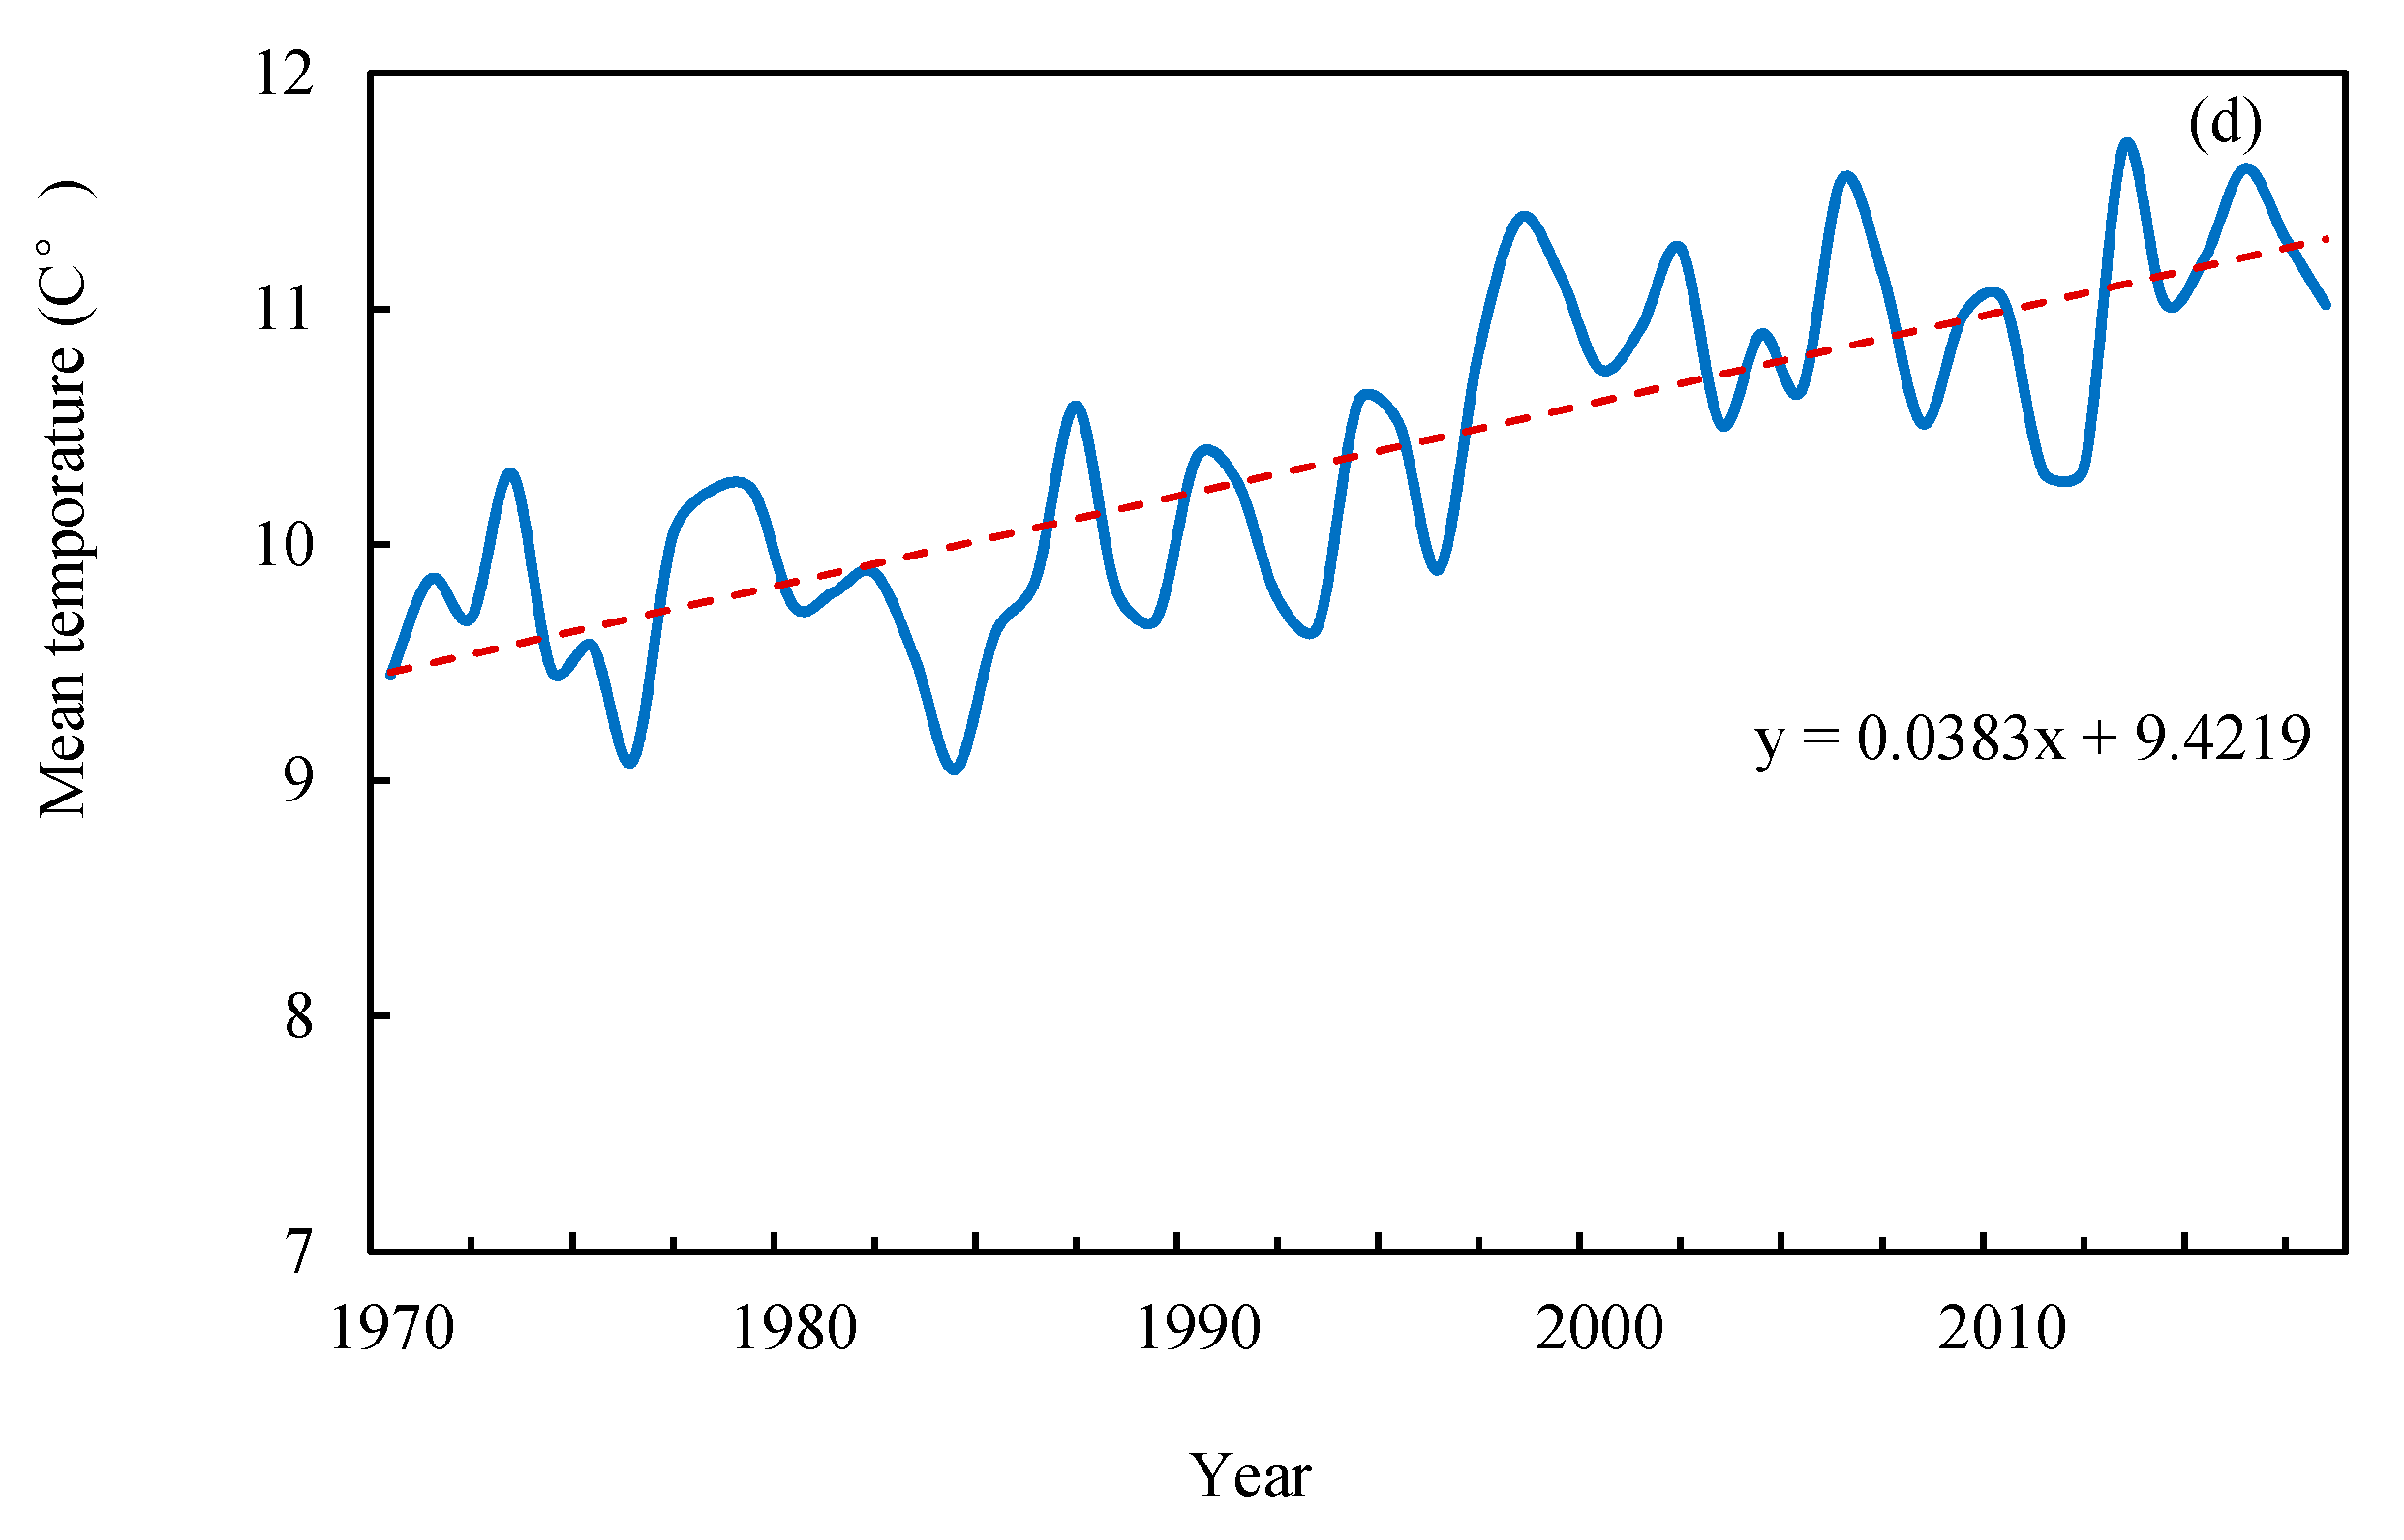
Overall, the change of different meteorological variables during 1970-2018 showed in Figure 7, it can be concluded from the above analyses that the increasing vapor pressure or decreasing relative humidity is primarily responsible for the ETa changes in the WRB. The relative humidity is mainly determined by the vapor pressure, so the relative humidity is the dominant meteorological factor that affects the ETa in the WRB. Similarly, differences in the controlling climatic factors have also been identified in many other regions. Jung et al. (2010) [35] and Marshall (2012) [66] found that the general global average annual evapotranspiration increased from 1982 to 1997, but after the strongest El Niño phenomenon happened in 1998 the global evapotranspiration growth trend seems to have stopped, and the global average land evapotranspiration decreased. This change in evapotranspiration is mainly due to the moisture limitations in the southern hemisphere, especially the weakening of water vapor sources in Africa and Australia (Jung et al., 2010) [35]. On the other hand, this study region located in the southeast portion of the Yellow river, where the moisture introduced by the southeast monsoon from the South China sea and/or Bohai combined with topographic factors can directly influence the relative humidity [58]. Relative humidity is affected by vapor pressure, and saturated vapor pressure has a direct relationship with temperature. Therefore, increasing the temperature would lead to increasing the saturated vapor pressure, further causing a decrease in relative humidity and eventually an increase in evapotranspiration. Zhang (2011) [67] also found that relative humidity is the most sensitive factor for changes in the reference evapotranspiration in northwest China and attributed the decrease in relative humidity in NW China to increases in precipitation. NW China is characterized by an arid climate, and a reduction in precipitation will cause an increase in relative humidity.
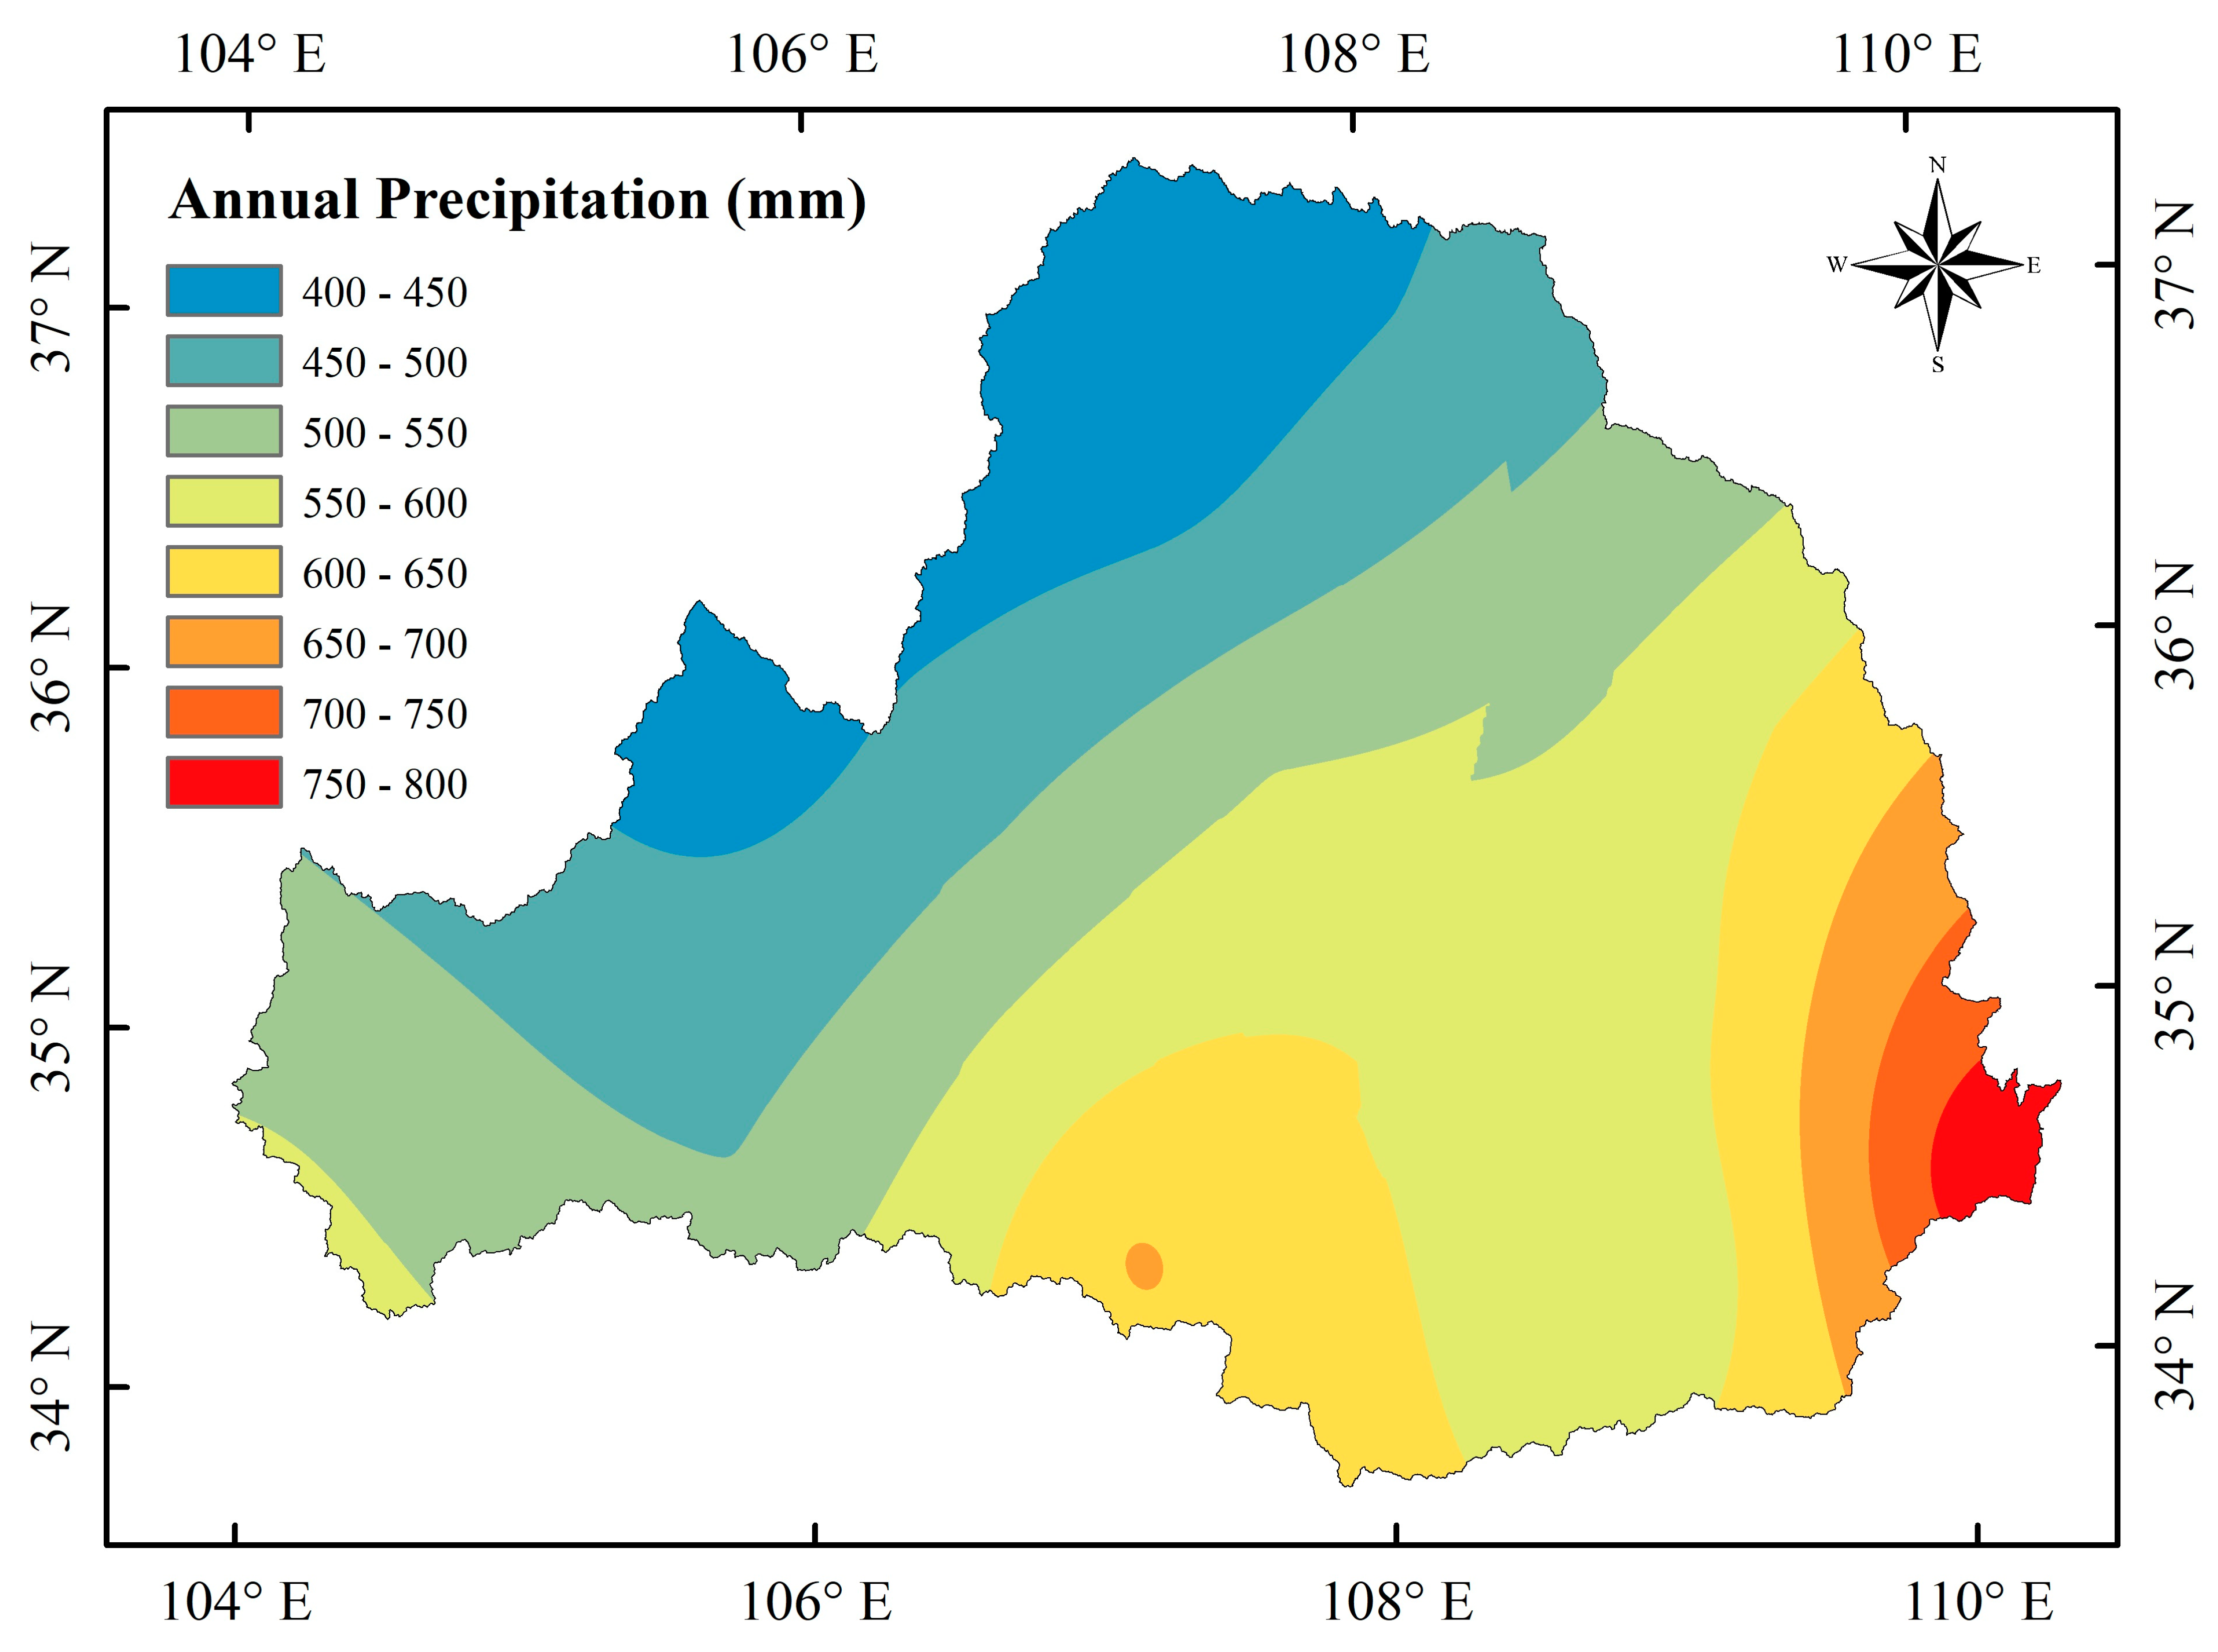
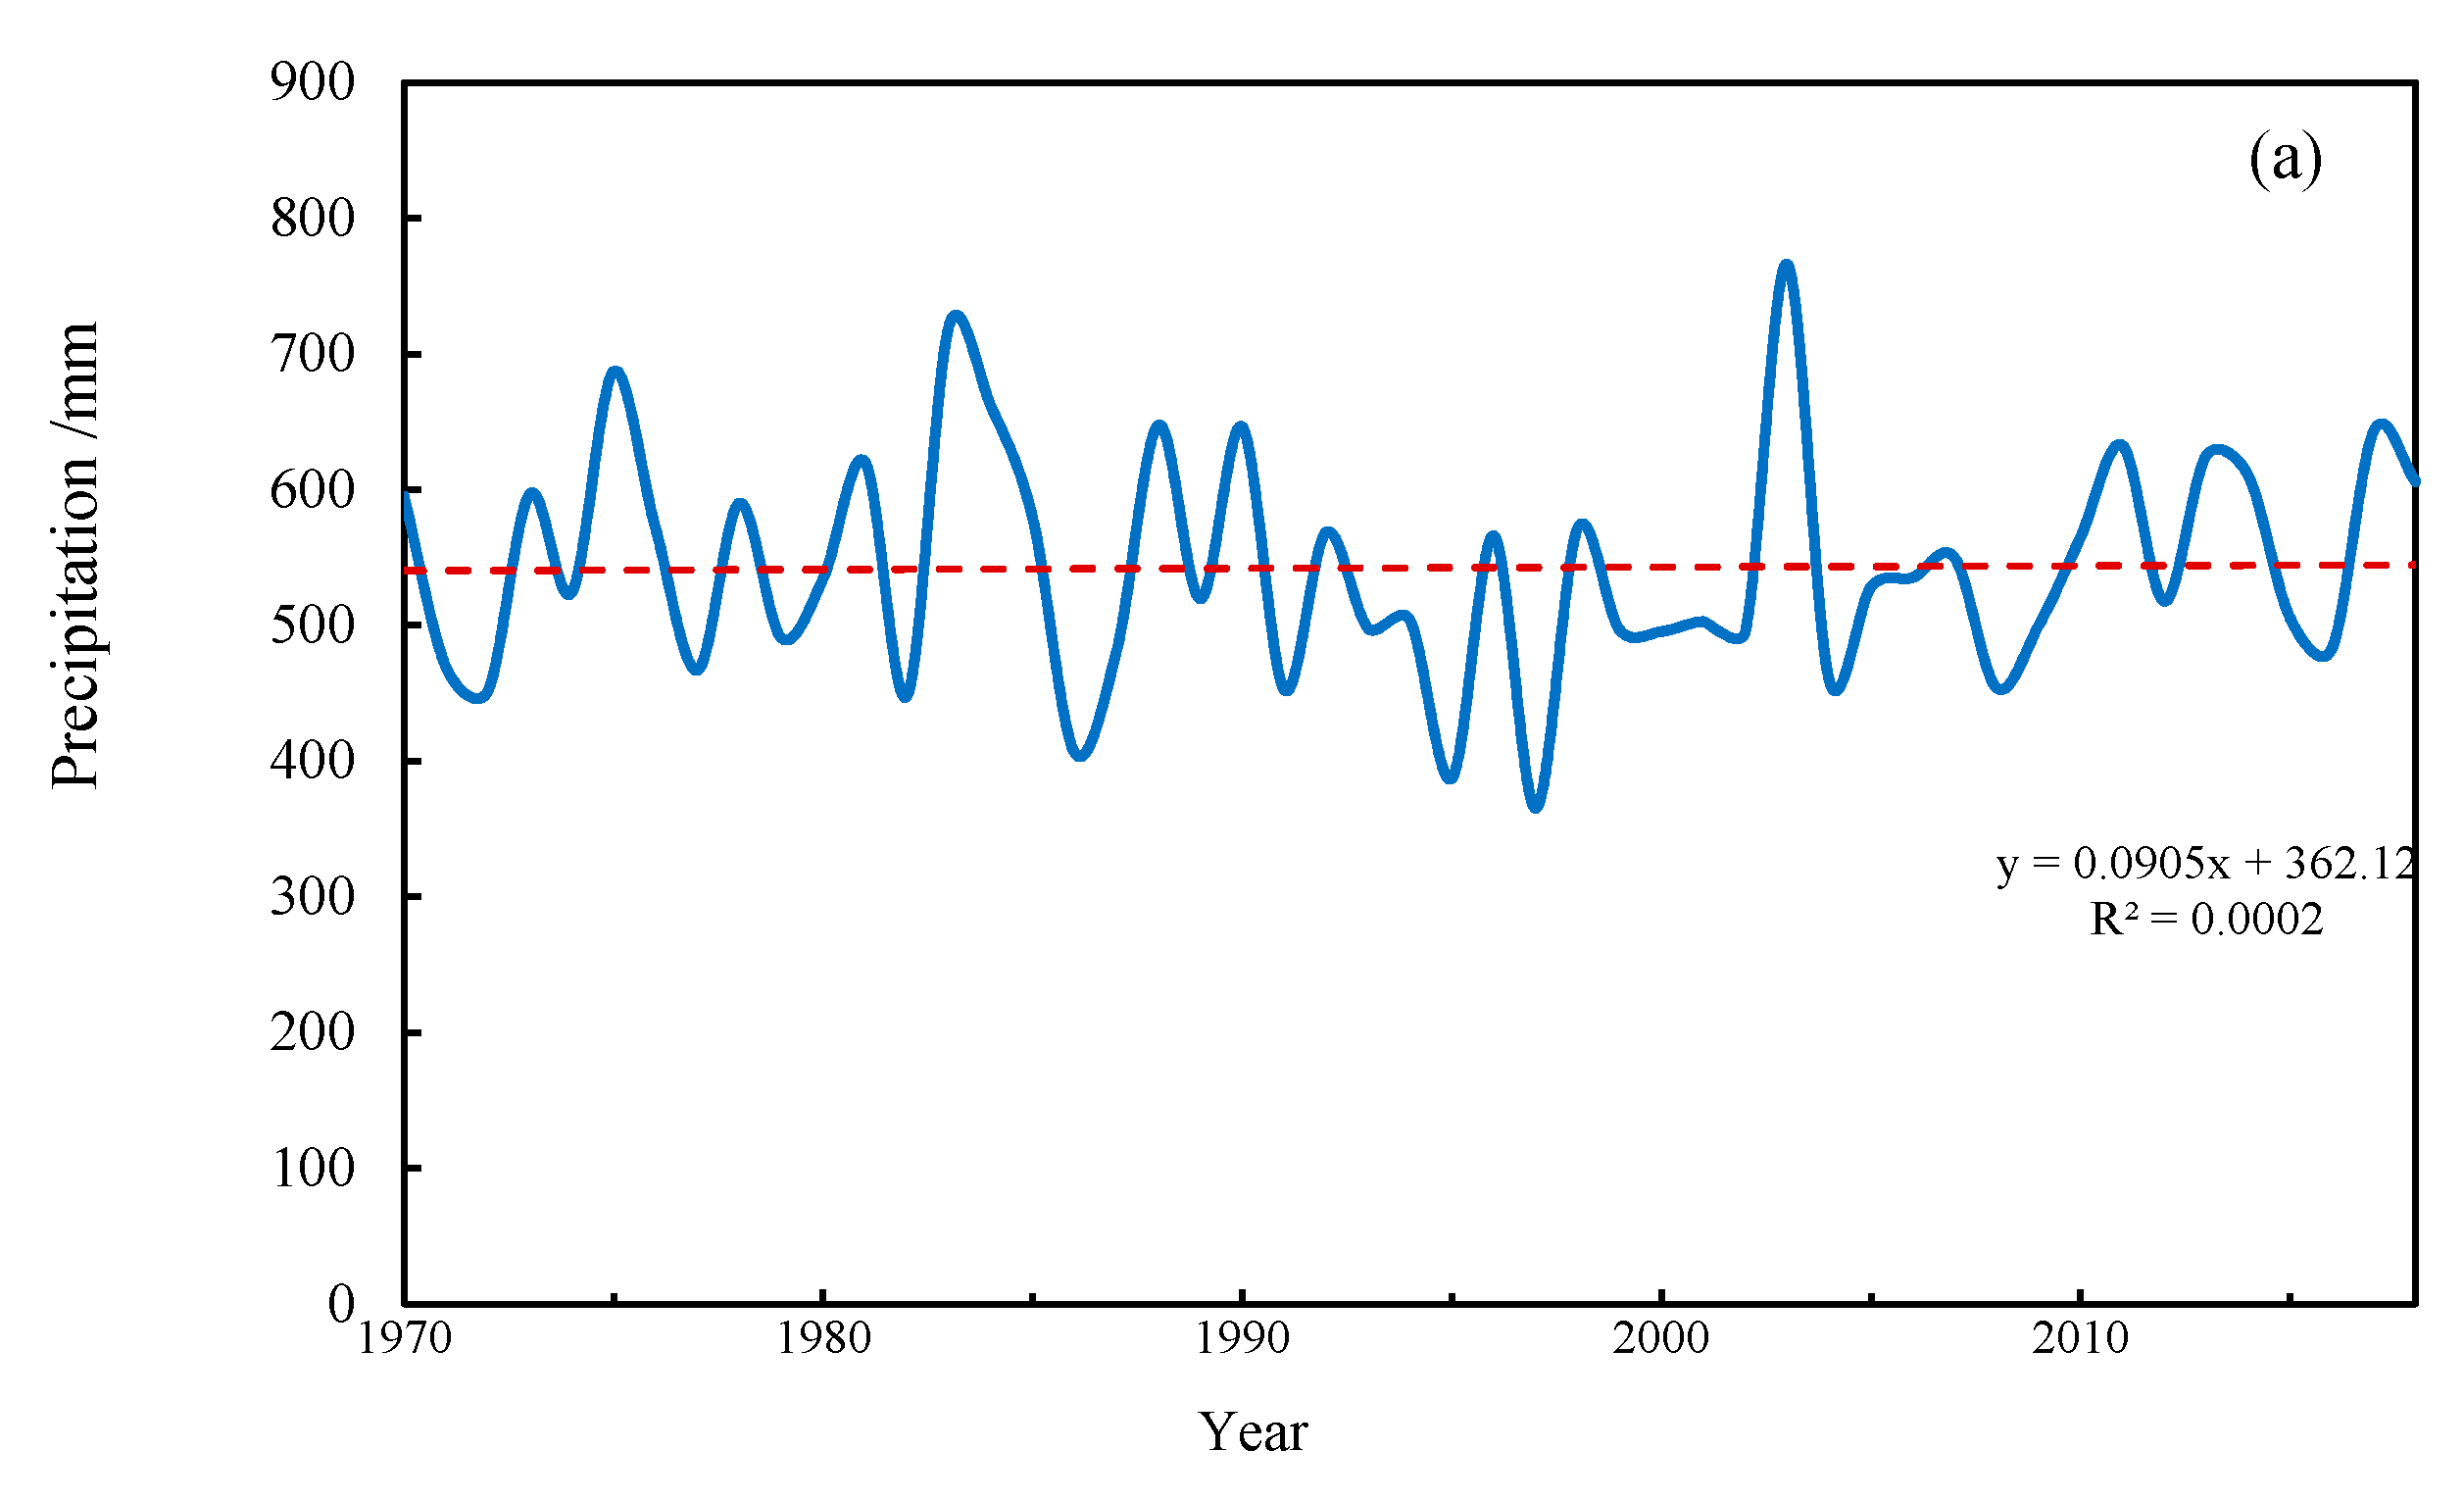
Based on the previous results, it can be seen that the total contribution of meteorological factors to the ETa changes is negative, but the ETa in this study area is increasing. Therefore, the factors affecting the changes of ETa in the WRB are complicated and comprehensive and are caused by a combination of climatic conditions and land surface conditions. Changes in precipitation are also closely related to changes in ETa. Similar to the changes in the average multi-year ETa, the precipitation changes also showed a slight increase (Figure 8). The spatial distribution of precipitation in the WRB is shown in Figure 9a, where it can be seen that precipitation in the WRB decreases from southeast to northwest. Similar changes can be observed in the average multi-year, summer, and autumn ETa values. The precipitation in the WRB is mainly concentrated in summer and autumn, especially from June to August, indicating the ETa in summer and autumn, to a certain extent, is affected by precipitation.
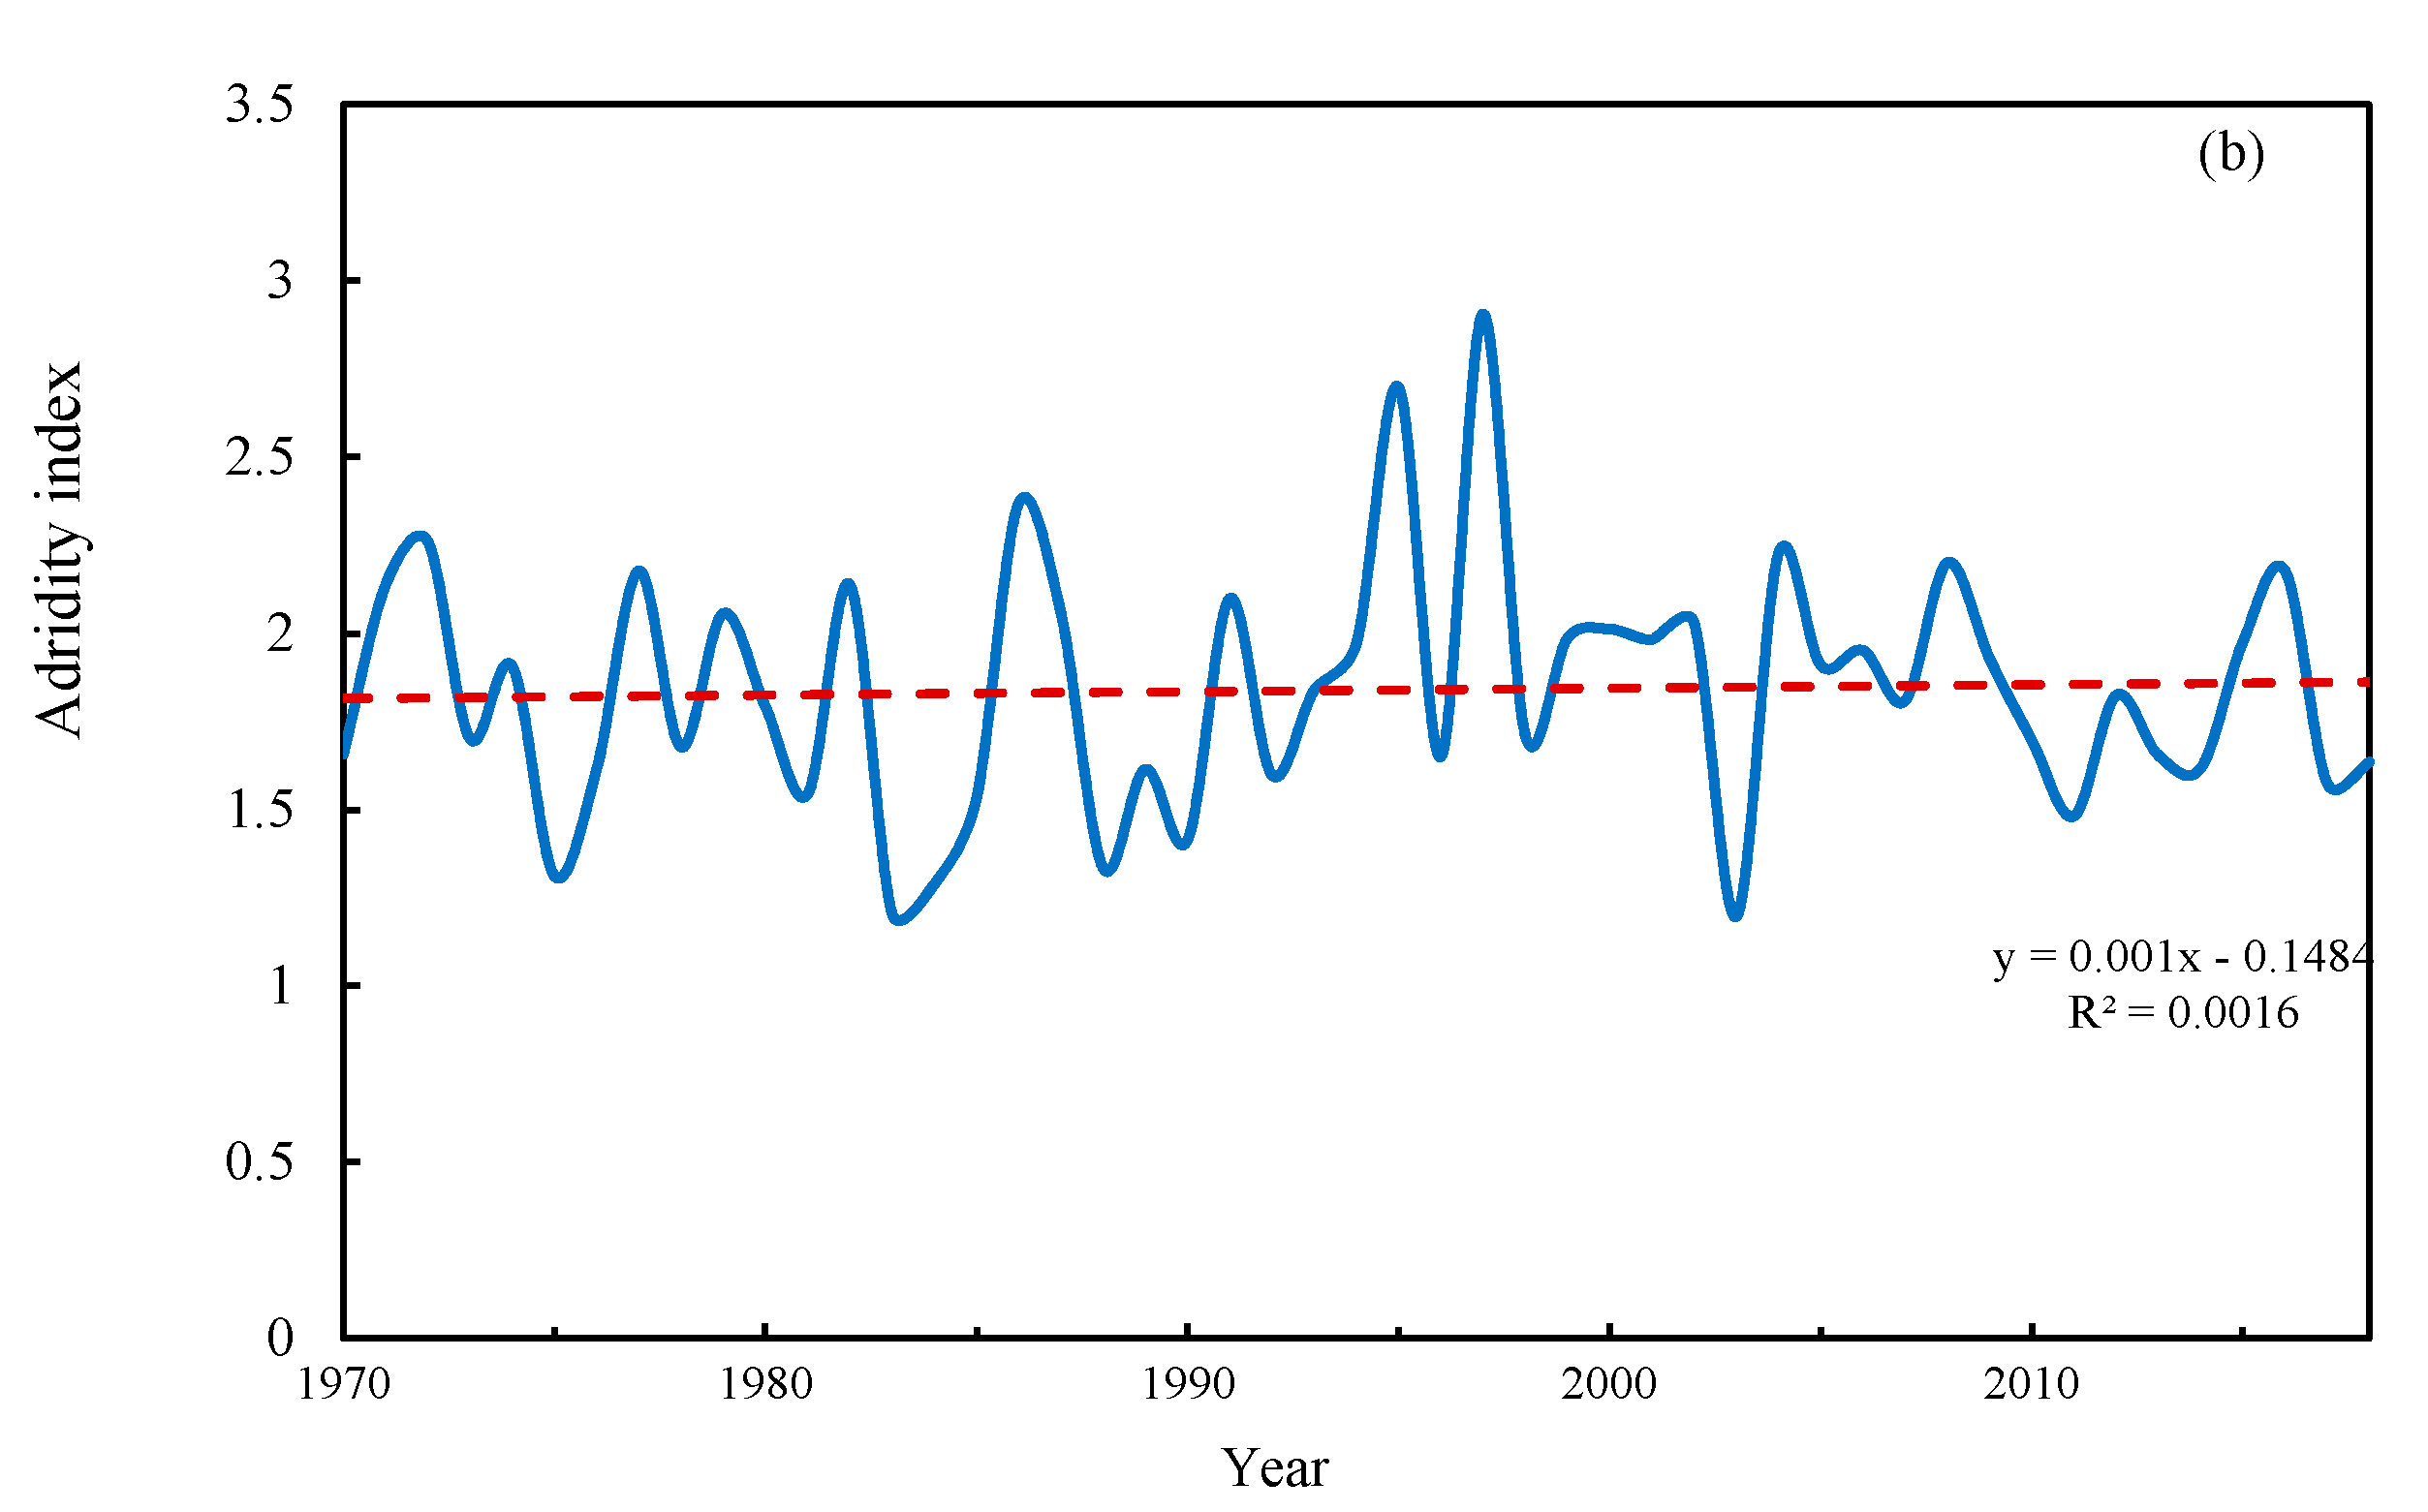
Rainfall mainly promotes evapotranspiration in two ways. On the one hand, it increases soil water content [68]. The decline in global land surface evapotranspiration from 1998 to 2008 was mainly due to the decrease of soil moisture [35]. On the other hand, rainfall can also promote vegetation growth. Using Pearson’s correlation analysis, the correlation between precipitation and ETa in the whole basin reached a significance level of 0.01 (p = 0.50), and the ETa increased with an increase in precipitation. Evapotranspiration plays an important role in water and energy balance, and changes in evapotranspiration will also cause changes in the hydrological cycle. The Adridity index (AI) is usually used to evaluate the wet and dry state of a basin and is commonly expressed as the ratio of potential evapotranspiration to precipitation [69]. It can be seen from Figure 9b that the climate in this basin is experiencing a state of long-term drought (AI greater than 1), although the AI presents opposite characteristics of change compared to the precipitation, as the overall trend of change is relatively gentle. There was, however, a significant increase in 1997 and 1995, mainly due to the decrease in rainfall during this period.
Some studies have also shown that vegetation change is another important factor affecting the changes of evapotranspiration in a watershed [70]. Since 1999, China has implemented a series of ecological restoration projects to alleviate ecological deterioration, such as surface water loss, soil erosion, land desertification, and grassland degradation. In particular, the implementation of large-scale Grain for Green and Nature Forest Protection programs resulted in the rapid restoration of vegetation in the WRB. The local climate has, therefore, changed, and the increase in the coverage of large areas of vegetation has further led to a rapid increase in local evapotranspiration [65]. Effective vegetation restoration resulted in a significant increase in evapotranspiration in the northeast and central parts of Xilinguole League, China [71]. Under the influence of the Grain for Green programs, the evapotranspiration in different catchments showed an increasing trend with the increase of vegetation coverage in the Loess Plateau of China. At the same time, these activities also caused changes in land use types in the watershed; likewise, the changes in evapotranspiration under different landscape patterns are different. Zhou et al. (2019) [56] estimated the ETa of the Loess Plateau through MODIS data and found that the annual average evapotranspiration of different land use types in the Loess Plateau is forest land > farmland > grassland. The irrigation area of farmland is another important evapotranspiration area. Large areas of irrigated farmland (accounting for 72% of Shaanxi Province) and low-efficiency irrigation measures (flood irrigation) have caused a large amount of water to experience evapotranspiration.
In this study, the ETa values estimated by the AA model were calibrated via the annual scale water balance method. The calculation of the runoff depth in terms of water balance was mainly based on the runoff data in the China Hydrological Yearbook. However, in this study we can only use the existing data to estimate the runoff depth, and some data are not available to the public. Therefore, without affecting the estimation, we used the water balance to estimate the runoff depth. Meanwhile, the measured runoff in recent years deviated from the “natural” runoff gradually, since the specific water amount used in reservoir storage and drainage, agricultural irrigation, and industrial domestic applications is difficult to estimate. In addition, this study focused on an analysis of the ETa changes in the WRB based on meteorological factors but did not consider the adjustment of the crop planting belt, growth period changes, urban layout, or other related aspects caused by changes of meteorological factors.
5. Conclusions
This study calculated the ETa of the WRB with the AA model based on complementary assumptions, and the water balance method was used to calibrate the parameters of the model. The estimated ETa was in good agreement with the ETa calculated by the water balance formulation. The ETa in this basin showed a slight increasing trend in the long-term, and the spatial pattern of ETa was shown to increase from northwest to southeast. In terms of spatial changes over the years, except for some stations in the southern part of the basin, the remaining stations showed a significant increase. Solar radiation is the most sensitive meteorological variable for ETa changes in the basin, followed by actual vapor pressure, wind speed, and temperature. Actual vapor pressure is the meteorological variable that contributes the most to ETa changes, followed by solar radiation. This indicates that the actual vapor pressure is the dominant factor that affects ETa changes in the basin, in addition to climatic conditions, they are also affected by factors such as precipitation and landscape. This study provided a quantitative method to determine the relationship between meteorological variables and ETa. The results are vital for understanding the effects of climate and human activity on hydrological processes and provides important information for water resources management in China. However, due to the uncertainty and limitations of the study, to some extent there is still much work needed to obtain a more accurate actual evapotranspiration model. In the future, further research into the utilization forms of water resources in the basin and the issues related to climate resource changes and their environmental effects is needed.
Author Contributions
Conceptualization, X.M., P.G., and R.X.; methodology, X.M., P.G., R.X.; formal analysis, P.G., C.G.; resources, R.X., P.G.; data curation, R.X. and P.G.; writing—original draft preparation, R.X.; writing—review and editing, R.X., P.G., C.G.; visualization, R.X.; supervision, R.X., P.G., C.G.; project administration, X.M., P.G.; funding acquisition, P.G. All authors have read and agreed to the published version of the manuscript.
Funding
This research was funded by National Key Research and Development Program of China, Grant/Award Number: 2016YFC0501707.
Institutional Review Board Statement
Not applicable.
Informed Consent Statement
Not applicable.
Data Availability Statement
The daily series of meteorological data used in this study are avaliable on National Meteorological Information Centre of China (NMIC) (https://www.nmic.cn/), while the data sharing of runoff are not applicable.
Acknowledgments
The authors acknowledge contributions from all members of the project team.
Conflicts of Interest
The authors declare no conflict of interest.
References
- Ohmura, A.; Wild, M. Is the Hydrological Cycle accelerating? Science 2002, 298, 1345–1346. [Google Scholar] [CrossRef]
- Eckhardt, K. How to construct recursive digital filters for baseflow separation. Hydrol. Process. 2005, 19, 507–515. [Google Scholar] [CrossRef]
- Potter, N.J.; Zhang, L. Water balance variability at the interstorm timescale. Water Resour. Res. 2007, 43, 5405. [Google Scholar] [CrossRef] [Green Version]
- Budyko, M.I. Climate and Life; Academic Press: San Diego, CA, USA, 1974. [Google Scholar]
- Fatichi, S.; Ivanov, V.Y. Interannual variability of evapotranspiration and vegetation productivity. Water Resour. Res. 2014, 50, 3275–3294. [Google Scholar] [CrossRef]
- Javadian, M.; Behrangi, A.; Smith, W.K.; Fisher, J.B. Global Trends in Evapotranspiration Dominated by Increases across Large Cropland Regions. Remote Sens. 2020, 12, 1221. [Google Scholar] [CrossRef] [Green Version]
- Ning, T.; Li, Z.; Feng, Q.; Chen, W.; Li, Z. Effects of forest cover change on catchment evapotranspiration variation in China. Hydrol. Process. 2020, 34, 2219–2228. [Google Scholar] [CrossRef]
- Wang, D.; Alimohammadi, N. Responses of annual runoff, evaporation, and storage change to climate variability at the watershed scale. Water Resour. Res. 2012, 48, 5546. [Google Scholar] [CrossRef] [Green Version]
- Trenberth, K.E.; Dai, A.; van der Schrier, G.; Jones, P.D.; Barichivich, J.; Briffa, K.R.; Sheffield, J. Global warming and changes in drought. Nat. Clim. Chang. 2013, 4, 17–22. [Google Scholar] [CrossRef]
- Aminzadeh, M.; Roderick, M.L.; Or, D. A generalized complementary relationship between actual and potential evaporation defined by a reference surface temperature. Water Resour. Res. 2016, 52, 385–406. [Google Scholar] [CrossRef] [Green Version]
- Aminzadeh, M.; Or, D. The complementary relationship between actual and potential evaporation for spatially heterogeneous surfaces. Water Resour. Res. 2017, 53, 580–601. [Google Scholar] [CrossRef]
- Cohen, S.; Ianetz, A.; Stanhill, G. Evaporative climate changes at Bet Dagan, Israel, 1964–1998. Agric. For. Meteorol. 2002, 2, 83–91. [Google Scholar] [CrossRef]
- Hobbins, M.T.; Ramirez, J.A.; Brown, T.C. Trends in pan evaporation and actual evapotranspiration across the conterminous US: Paradoxical or complementary? Geophys. Res. Lett. 2004, 31, 13. [Google Scholar] [CrossRef] [Green Version]
- Tebakari, T.; Yoshitani, J.; Suvanpimol, C. Time-Space Trend Analysis in Pan Evaporation over Kingdom of Thailand. J. Hydrol. Eng. 2005, 10, 205–215. [Google Scholar] [CrossRef]
- Moonena, A.C.; Ercoli, L.; Mariotti, M.; Masonib, A. Climate change in Italy indicated by agrometeorological indices over 122 years. Agric. For. Meteorol. 2002, 111, 13–27. [Google Scholar] [CrossRef]
- Chattopadhyay, N.; Hulme, M. Evaporation and potential evapotranspiration in India under conditions of recent and future climate change. Agric. For. Meteorol. 1997, 87, 55–73. [Google Scholar] [CrossRef]
- Roderick, M.L.; Farquhar, G.D. Changes in Australian pan evaporation from 1970 to 2002. Int. J. Climatol. 2004, 24, 1077–1090. [Google Scholar] [CrossRef]
- Roderick, M.L.; Farquhar, G.D. Changes in New Zealand pan evaporation since the 1970s. Int. J. Climatol. 2005, 25, 2031–2039. [Google Scholar] [CrossRef]
- Burn, D.H.; Hesch, N.M. Trends in evaporation for the Canadian Prairies. J. Hydrol. 2007, 336, 61–73. [Google Scholar] [CrossRef]
- Asanuma, H.; Hishiya, T.; Komiyama, M. Efficient separation of hydrophobic molecules by molecularly imprinted cyclodextrin polymers. J. Incl. Phenom. Macrocycl. Chem. 2004, 50, 51–55. [Google Scholar] [CrossRef]
- Cong, Z.T.; Yang, D.W.; Ni, G.H. Does evaporation paradox exist in China? Hydrol. Earth Syst. Sci. 2009, 13, 357–366. [Google Scholar] [CrossRef] [Green Version]
- Yin, Y.; Wu, S.; Chen, G.; Dai, E. Attribution analyses of potential evapotranspiration changes in China since the 1960s. Theor. Appl. Climatol. 2009, 101, 19–28. [Google Scholar] [CrossRef]
- Zuo, D.; Xu, Z.; Yang, H.; Liu, X. Spatiotemporal variations and abrupt changes of potential evapotranspiration and its sensitivity to key meteorological variables in the Wei River basin, China. Hydrol. Process. 2012, 26, 1149–1160. [Google Scholar] [CrossRef]
- Roderick, M.L.; Farquhar, G.D. The Cause of Decreased Pan Evaporation over the Past 50 Years. Science 2002, 298, 1140–1141. [Google Scholar]
- Wang, W.; Shao, Q.; Peng, S.; Xing, W.; Yang, T.; Luo, Y.; Yong, B.; Xu, J. Reference evapotranspiration change and the causes across the Yellow River Basin during 1957–2008 and their spatial and seasonal differences. Water Resour. Res. 2012, 48, 113–122. [Google Scholar] [CrossRef]
- Xu, C.Y.; Gong, L.; Jiang, T.; Chen, D.; Singh, V.P. Analysis of spatial distribution and temporal trend of reference evapotranspiration and pan evaporation in Changjiang (Yangtze River) catchment. J. Hydrol. 2006, 327, 81–93. [Google Scholar] [CrossRef]
- Shouhong, Z.; Chang, S.; Suxia, L.; Yang, S.; Xingguo, M.; Chun, Z. Assessing the Impact of Climate Change on Reference Evapotranspiration in Aksu River Basin. Acta Geogr. Sin. 2010, 65, 1363–1370. [Google Scholar]
- Cao, G.; Han, D.; Song, X. Evaluating actual evapotranspiration and impacts of groundwater storage change in the North China Plain. Hydrol. Process. 2014, 28, 1797–1808. [Google Scholar] [CrossRef]
- Yanjun, W.; Tong, J.; Bo, L. Trends of Estimated and Simulated Actual Evapotranspiration in the Yangtze River Basin. Acta Geogr. Sin. 2010, 65, 1079–1088. [Google Scholar]
- Blatchford, M.L.; Mannaerts, C.M.; Njuki, S.M.; Nouri, H.; Zeng, Y.; Pelgrum, H.; Wonink, S.; Karimi, P. Evaluation of WaPOR V2 evapotranspiration products across Africa. Hydrol. Process. 2020, 34, 3200–3221. [Google Scholar] [CrossRef]
- Jhajharia, D.; Shrivastava, S.K.; Sarkar, D.; Sarkar, S. Temporal characteristics of pan evaporation trends under the humid conditions of northeast India. Agric. For. Meteorol. 2009, 149, 763–770. [Google Scholar] [CrossRef]
- Zheng, H.X.; Liu, X.M.; Liu, C.M.; Dai, X.Q.; Zhu, R.R. Assessing contributions to panevaporation trends in Haihe River Basin, China. J. Geophys. Res.-Atmos. 2009, 114, D24105. [Google Scholar] [CrossRef] [Green Version]
- Ninga, M.; Naianga, W.; Penglonga, W.; Yanmengb, S.; Chunyua, D. Temporal and Spatial Variation Characteristics and Quantification of the Affect Factors for Reference Evapotranspiration in Heihe River Basin. J. Nat. Resour. 2012, 27, 975–989. [Google Scholar]
- Irmak, S.; Kabenge, I.; Skaggs, K.E.; Mutiibwa, D. Trend and magnitude of changes in climate variables and reference evapotranspiration over 116-yr period in the Platte River Basin, central Nebraska–USA. J. Hydrol. 2012, 420–421, 228–244. [Google Scholar] [CrossRef]
- Jung, M.; Reichstein, M.; Ciais, P.; Seneviratne, S.I.; Sheffield, J.; Goulden, M.L.; Bonan, G.; Cescatti, A.; Chen, J.; de Jeu, R.; et al. Recent decline in the global land evapotranspiration trend due to limited moisture supply. Nature 2010, 467, 951–954. [Google Scholar] [CrossRef] [PubMed]
- Shaomin, L.; Rui, S.; Zhongping, S.; Xiaowen, L.; Changming, L. Comparision of different complementary relationship models for regional evapotranspiration estimation. Acta Geogr. Sin. 2004, 59, 331–340. [Google Scholar]
- Yanjun, W.; Liu, B.; Zhai, J.; Su, B.; Luo, Y.; Zhang, Z. Relationship Between Potential and Actual Evaporation in Yangtze River Basin. Adv. Clim. Chang. Res. 2011, 7, 1673–1719. [Google Scholar]
- Hartmann, H.; Su, B.; Jiang, T.; Tao, H.; Sun, H.; Li, X.; Jian, D. Estimation of Actual Evapotranspiration by the Complementary Theory-Based Advection–Aridity Model in the Tarim River Basin, China. J. Hydrometeorol. 2018, 19, 289–303. [Google Scholar]
- Nakken, M. Wavelet analysis of rainfall–runoff variability isolating climatic from anthropogenic patterns. Environ. Model. Softw. 1999, 14, 283–295. [Google Scholar] [CrossRef]
- Morton, F.I. Operational estimates of areal evapotranspiration and their significance to the science and practice of hydrology. J. Hydrol. 1983, 66, 1–76. [Google Scholar] [CrossRef]
- Ramı´rez, J.A.; Hobbins, M.T. Observational evidence of the complementary relationship in regional evaporation lends strong support for Bouchet’s hypothesis. Geophys. Res. Lett. 2005, 32, L15401. [Google Scholar] [CrossRef] [Green Version]
- Yang, D.; Sun, F.; Liu, Z.; Cong, Z.; Lei, Z. Interpreting the complementary relationship in non-humid environments based on the Budyko and Penman hypotheses. Geophys. Res. Lett. 2006, 33, 33. [Google Scholar] [CrossRef]
- Han, H.; Hou, J.; Huang, M.; Li, Z.; Xu, K.; Zhang, D.; Bai, G.; Wang, C. Impact of soil and water conservation measures and precipitation on streamflow in the middle and lower reaches of the Hulu River Basin, China. Catena 2020, 195, 1–10. [Google Scholar] [CrossRef]
- Wang, Y.; Lu, H.; Wang, K.; Wang, Y.; Li, Y.; Clemens, S.; Lv, H.; Huang, Z.; Wang, H.; Hu, X.; et al. Combined high- and low-latitude forcing of east Asian monsoon precipitation variablity in the Pliocene warm period. Sci. Adv. 2020, 6, eabc2414. [Google Scholar] [CrossRef] [PubMed]
- Gao, P.; Geissen, V.; Ritsema, C.J.; Mu, X.; Fei, W. Impact of climate change and anthropogenic activities on stream flow and sediment discharge in the Wei River basin, China. Hydrol. Earth Syst. Sci. 2013, 17, 961–972. [Google Scholar] [CrossRef] [Green Version]
- Guo, A.; Chang, J.; Wang, Y.; Huang, Q.; Guo, Z.; Li, Y. Development of a partial copula-based algorithm for disclosing variability of dependence structures between hydro-meteorological factors under consideration of covariate-effect. J. Hydrol. 2020, 583. [Google Scholar] [CrossRef]
- Brutsaert, W.; Stricker, H. An Advection-Aridity Approach to Estimate Actual Regional Evapotranspiration. Water Resour. Res. 1979, 15. [Google Scholar] [CrossRef]
- Morton, F.I. Estimating Evaporation and Transpiration from Climatological Observations. J. Appl. Meteorol. 1975, 14, 488. [Google Scholar] [CrossRef] [Green Version]
- Parlange, M.B.; Katul, G.G. Estimation of the diurnal variation of potential evaporation from a wet bare soil surface. J. Hydrol. 1992, 132, 71–89. [Google Scholar] [CrossRef] [Green Version]
- Penman, H.L.; Keen, B.A. Natural evaporation from open water, bare soil and grass. Proc. R. Soc. Lond. Ser. A. Math. Phys. Sci. 1948, 193, 120–145. [Google Scholar]
- Priesstley, C.H.B.; Taylor, R.J. On the Assessment of Surface Heat Flux and Evaporation Using Large-Scale Parameters. Mon. Weather Rev. 1972, 100, 81–92. [Google Scholar] [CrossRef]
- Mann, H.B. Nonparametric tests against trend. Econometrica 1945, 13, 245–259. [Google Scholar] [CrossRef]
- Kendall, M.G. Rank Correlation Measures; Charles Griffin: Oxford, UK, 1975. [Google Scholar]
- Gao, P.; Deng, J.; Chai, X.; Mu, X.; Zhao, G.; Shao, H.; Sun, W. Dynamic sediment discharge in the Hekou-Longmen region of Yellow River and soil and water conservation implications. Sci. Total Env. 2017, 578, 56–66. [Google Scholar] [CrossRef]
- Zhao, G.; Mu, X.; Wen, Z.; Wang, F.; Gao, P. Soil Erosion, Conservation, And Eco-Environment Changes In the Loess Plateau of China. Land Degrad. Dev. 2013, 24, 499–510. [Google Scholar] [CrossRef]
- Zhou, Z.; Sun, W.; Mu, X.; Gao, P.; Zhao, G.; Song, X. Temporal and Spatial Pattern of Actual Evapotranspiration in the Loess Plateau from 2001 to 2017. Yellow River 2019, 41, 76–84. [Google Scholar]
- Chong, J.; Fei, W.; Sijie, L.; Xingmin, M.; Rui, L.; Yanxu, L.; Chong, J. Evaporation paradox in the northern and southern regions of the Qinling Mountains. Acta Ecol. Sin. 2013, 33, 844–855. [Google Scholar] [CrossRef] [Green Version]
- Liu, Q.; Yang, Z.; Cui, B.; Sun, T. The temporal trends of reference evapotranspiration and its sensitivity to key meteorological variables in the Yellow River Basin, China. Hydrol. Process. 2010, 24, 2171–2181. [Google Scholar] [CrossRef]
- Liu, X.; Zheng, H.; Zhang, M.; Liu, C. Identification of dominant climate factor for pan evaporation trend in the Tibetan Plateau. J. Geogr. Sci. 2011, 21, 594–608. [Google Scholar] [CrossRef]
- McVicar, T.R.; Van Niel, T.G.; Li, L.T.; Roderick, M.L.; Rayner, D.P.; Ricciardulli, L.; Donohue, R.J. Wind speed climatology and trends for Australia, 1975–2006: Capturing the stilling phenomenon and comparison with near-surface reanalysis output. Geophys. Res. Lett. 2008, 35, L20403. [Google Scholar] [CrossRef] [Green Version]
- Fan, Z.-X.; Thomas, A. Decadal changes of reference crop evapotranspiration attribution: Spatial and temporal variability over China 1960–2011. J. Hydrol. 2018, 560, 461–470. [Google Scholar] [CrossRef]
- Xu, Y.; Xu, Y.P.; Wang, Y.F.; Wu, L.; Li, G.; Song, S. Spatial and temporal trends of reference crop evapotranspiration and its influential variables in Yangtze River Delta, eastern China. Theor. Appl. Climatol. 2017, 130, 945–958. [Google Scholar] [CrossRef]
- Luo, K.; Tao, F.; Deng, X.; Moiwo, J.P. Changes in potential evapotranspiration and surface runoff in 1981-2010 and the driving factors in Upper Heihe River Basin in Northwest China. Hydrol. Process. 2017, 31, 90–103. [Google Scholar] [CrossRef]
- Zhao, Y.; Liu, Y.; LI, J.; Lliu, X. Spatial and Temporal Variation of Potential Evapotranspiration and Its Sensitivity to Meteorological Factors in China from 1960 to 2013. Desert Oasis Meteorol. 2018, 22, 3–14. [Google Scholar]
- Fan, J.; Wu, L.; Zhang, F.; Xiang, Y.; Zheng, J. Climate change effects on reference crop evapotranspiration across different climatic zones of China during 1956–2015. J. Hydrol. 2016, 542, 923–937. [Google Scholar] [CrossRef]
- Marshall, M.; Funk, C.; Michaelsen, J. Examining evapotranspiration trends in Africa. Clim. Dyn. 2012, 38, 1849–1865. [Google Scholar] [CrossRef]
- Zhang, Q.; Xu, C.-Y.; Chen, X. Reference evapotranspiration changes in China: Natural processes or human influences? Theor. Appl. Climatol. 2010, 103, 479–488. [Google Scholar] [CrossRef]
- Legesse, D.; Vallet-Coulomb, C.; Gasse, F. Hydrological response of a catchment to climate and land use changes in Tropical Africa: Case study South Central Ethiopia. J. Hydrol. 2003, 275, 67–85. [Google Scholar] [CrossRef]
- Arora, V.K. The use of the aridity index to assess climate change effect on annual runoff. J. Hydrol. 2002, 265, 164–177. [Google Scholar] [CrossRef]
- Cao, Q.; Yu, D.; Georgescu, M.; Han, Z.; Wu, J. Impacts of land use and land cover change on regional climate: A case study in the agro-pastoral transitional zone of China. Environ. Res. Lett. 2016, 10, 124025. [Google Scholar] [CrossRef]
- Yu, D.; Li, X.; Cao, Q.; Hao, R.; Qiao, J. Impacts of climate variability and landscape pattern change on evapotranspiration in a grassland landscape mosaic. Hydrol. Process. 2019, 34, 1035–1051. [Google Scholar] [CrossRef]
Figure 1.
Location of the Weihe River Basin.

Figure 2.
The variation of the annual, seasonal and monthly ETa in the Weihe River Basin from 1970 to 2018. (a): Annual and seasonal; (b): Monthly.
Figure 2.
The variation of the annual, seasonal and monthly ETa in the Weihe River Basin from 1970 to 2018. (a): Annual and seasonal; (b): Monthly.

Figure 3.
Spatial distribution of annual and seasonal ETa in the Weihe River Basin ((a): Annual, (b): Spring, (c): Summer, (d): Autumn, (e): Winter).
Figure 3.
Spatial distribution of annual and seasonal ETa in the Weihe River Basin ((a): Annual, (b): Spring, (c): Summer, (d): Autumn, (e): Winter).

Figure 4.
The values of Mann–Kendall test results of the ETa during 1970–2018 ((a): Annual, (b): Spring, (c): Summer, (d): Autumn, (e): Winter).
Figure 4.
The values of Mann–Kendall test results of the ETa during 1970–2018 ((a): Annual, (b): Spring, (c): Summer, (d): Autumn, (e): Winter).

Figure 5.
Variation of monthly mean sensitivity coefficient in Weihe River Basin.

Figure 6.
Spatial distribution of the mean annual sensitivity coefficients of the Weihe River Basin.
Figure 6.
Spatial distribution of the mean annual sensitivity coefficients of the Weihe River Basin.

Figure 7.
Annual trends of ((a): Relative humidity, (b): Wind speed, (c): Sunshine duration, (d): Mean temperature) in Weihe River Basin.
Figure 7.
Annual trends of ((a): Relative humidity, (b): Wind speed, (c): Sunshine duration, (d): Mean temperature) in Weihe River Basin.


Figure 8.
Spatial distribution of average precipitation from 1960–2018 in Weihe River Basin.

Figure 9.
Variation of average precipitation and Adridity index from 1960–2018 in Weihe River Basin. (a): average precipitation; (b): Adridity index.
Figure 9.
Variation of average precipitation and Adridity index from 1960–2018 in Weihe River Basin. (a): average precipitation; (b): Adridity index.


Table 1.
Information for the National Meteorological Observatory Stations used in this study.
| Sub Basins | Station Number | Station Name | Longitude (°E) | Latitude (°N) | Altitude (m) | Catchment Area (km2) |
|---|---|---|---|---|---|---|
| Wei River | 52986 | Lintao | 35.37 | 103.87 | 1886.6 | 0.16 |
| 52996 | Huajialing | 35.38 | 105.02 | 2450.6 | 0.72 | |
| 56093 | Minxian | 34.43 | 104.02 | 2314.6 | 0.38 | |
| 57143 | Shangxian | 33.87 | 109.97 | 742.2 | 0.08 | |
| 57134 | Foping | 33.52 | 107.98 | 1791.8 | 0.11 | |
| 57144 | Zhenan | 33.43 | 109.15 | 985.6 | 0.01 | |
| 57006 | Tianshui | 34.58 | 105.75 | 1141.7 | 0.93 | |
| 57036 | Xian | 34.27 | 108.95 | 410.0 | 0.72 | |
| 57016 | Baoji | 34.35 | 107.13 | 612.4 | 0.85 | |
| 53903 | Xiji | 35.97 | 105.72 | 1901.3 | 0.42 | |
| 57034 | Wugong | 34.25 | 108.22 | 505.4 | 0.79 | |
| 57046 | Huashan | 34.48 | 110.08 | 2064.9 | 0.51 | |
| Jing River | 53821 | Huanxian | 36.57 | 107.30 | 1543.6 | 1.09 |
| 53923 | Xifeng | 35.73 | 107.63 | 1421.9 | 0.93 | |
| 53929 | Changwu | 35.20 | 107.80 | 1206.3 | 0.92 | |
| 53915 | Kuntong | 35.55 | 106.67 | 1346.6 | 0.99 | |
| 53723 | Yanchi | 37.80 | 107.38 | 1347.8 | 0.10 | |
| 53817 | Guyuan | 36.00 | 106.27 | 1753.2 | 0.34 | |
| Beiluo River | 53738 | Wuqi | 36.92 | 108.17 | 1331.4 | 1.05 |
| 53845 | Yanan | 36.60 | 109.47 | 957.1 | 0.28 | |
| 53942 | Luochuan | 35.77 | 109.42 | 1158.3 | 1.02 | |
| 53947 | Tongchuan | 35.08 | 109.07 | 978.9 | 1.00 | |
| 57046 | Huashan | 34.48 | 110.08 | 2064.9 | 0.51 |
Table 2.
Characteristics of meteorological and hydrological data in Wei River Basin.
| Decades | Streamflow (108 m3) | Precipitation (mm) | Wind Speed (m/s) | Average Temperature (°C) | Relative Humidity | Sunshine Duration (h) | ||
|---|---|---|---|---|---|---|---|---|
| Huaxian | Zhuangtou | Zhangjiashan | ||||||
| 1970–1979 | 59.41 | 6.08 | 17.43 | 541.78 | 2.22 | 9.79 | 64.75 | 6.38 |
| 1980–1989 | 79.13 | 7.39 | 17.02 | 558.79 | 1.94 | 9.75 | 65.47 | 5.83 |
| 1990–1999 | 43.79 | 7.11 | 14.02 | 506.45 | 1.99 | 10.44 | 64.42 | 6.20 |
| 2000–2010 | 45.04 | 5.01 | 9.28 | 526.77 | 1.88 | 10.92 | 63.75 | 6.23 |
| 2010–2018 | 55.04 | 5.78 | 11.38 | 573.34 | 1.94 | 11.06 | 63.62 | 6.03 |
| Mean | 56.51 | 6.29 | 13.87 | 540.78 | 2.22 | 9.79 | 64.75 | 6.38 |
| Max | 131.00 (1983) | 13.09 (1988) | 26.05 (1975) | 760.97 (2003) | 2.36 (1970) | 11.69 (2013) | 70.79 (1989) | 6.62 (1979) |
| Min | 16.83 (1997) | 3.09 (1973) | 4.51 (2000) | 369.49 (1997) | 1.78 (2002) | 9.04 (1984) | 59.38 (1995) | 5.13 (1989) |
| SD | 25.92 | 2.44 | 5.39 | 82.30 | 0.14 | 0.69 | 2.21 | 0.34 |
SD: Standard Deviation.
Table 3.
Basic information of the hydrological station in the study area.
| Hydrological Stations | Sub-Basins | Longitude (°E) | Latitude (°N) | Catchment Area (km2) |
|---|---|---|---|---|
| Huaxian | Wei River | 34°35′ | 109°46′ | 106,500 |
| Zhuangtou | Beiluo River | 35°02′ | 109°50′ | 25,600 |
| Zhangjiashan | Jing River | 34°38′ | 108°36′ | 43,200 |
Table 4.
The Advection–Aridity (AA) model calibration results in the Weihe River Basin.
| Sub-Areas | Hydrological Station | Area (km2) | α | Calibration Period (1970–1997) Annual Mean ETa (mm) | Validation Period (1998–2018) Annual Mean ETa (mm) | ||||||
|---|---|---|---|---|---|---|---|---|---|---|---|
| Water Balance | AA Model | Absolute Error | Relative Error (%) | Water Balance | AA Model | Absolute Error | Relative Error (%) | ||||
| Wei River | Huaxian | 63,300 | 0.93 | 525.83 | 527.84 | −2.00 | −3.1 | 526.33 | 528.97 | −2.46 | −2.5 |
| Jing River | Zhangjiashan | 43,200 | 0.88 | 489.67 | 463.63 | 26.04 | 2.4 | 450.25 | 450.89 | −0.64 | −4.1 |
| Beiluo River | Zhuangtou | 25,600 | 0.96 | 559.18 | 573.77 | −14.59 | −4.4 | 545.78 | 551.41 | −5.63 | −4.3 |
Table 5.
The mean Sensitivity coefficients for mean temperature, solar radiation, wind speed, vapor pressure in the whole basins of Wei River Basin, which were represented as S(T), S(Rn), S(U) and S(ea), respectively.
Table 5.
The mean Sensitivity coefficients for mean temperature, solar radiation, wind speed, vapor pressure in the whole basins of Wei River Basin, which were represented as S(T), S(Rn), S(U) and S(ea), respectively.
| Variables | Spring | Summer | Autum | Winter | Annual |
|---|---|---|---|---|---|
| S(T) | 0.003 | 0.003 | 0.002 | −0.001 | 0.020 |
| S(Rn) | 0.214 | 0.195 | 0.281 | 0.486 | 0.300 |
| S(U) | 0.124 | 0.070 | 0.102 | 0.329 | 0.160 |
| S(ea) | −0.141 | −0.111 | −0.153 | −0.324 | −0.180 |
Table 6.
Contributions of meteorological variables to the long-term trend in ETa.
| Period | Contribution | ||||
|---|---|---|---|---|---|
| C(T) | C(Rn) | C(U2) | C(ea) | C(ETa) | |
| Spring | −0.0024 | −0.0082 | 0.0011 | −0.0104 | −0.0199 |
| Summer | −0.0006 | 0.0099 | −0.0002 | −0.0024 | −0.0153 |
| Autumn | −0.0001 | −0.0085 | −0.0002 | −0.0072 | −0.0160 |
| Winter | 0.0004 | −0.0091 | −0.0001 | 0.0057 | 0.0485 |
| Annual | −0.0001 | −0.0058 | −0.0006 | −0.0033 | −0.0046 |
| Period | Proportional Contribution (%) | ||||
| P(T)/% | P(Rn)/% | P(U2)/% | P(ea)/% | Psum | |
| Spring | 12.05 | 41.16 | −5.48 | 52.28 | 100.00 |
| Summer | 3.60 | −64.33 | 1.46 | 159.27 | 100.00 |
| Autumn | 0.79 | 52.94 | 1.36 | 44.92 | 100.00 |
| Winter | 0.90 | −18.69 | −0.21 | 118.01 | 100.00 |
| Annual | 2.79 | 12.69 | 12.89 | 71.64 | 100.00 |
Note: C(T), C(Rn), C(ea) and C(U2) respectively represent the contribution of the average temperature, net solar radiation, actual water vapor pressure and wind speed to the long-term trend of ETa, C(ETa) represents the sum of the contribution of the four meteorological factors over the years; P(T), P(Rn), P(ea) and P(U2) represent the contribution rate of mean temperature, net solar radiation, actual water vapor pressure and wind speed to the long-term trend of ETa, respectively; Psum are the total contribution rate of average temperature, net solar radiation, actual water vapor pressure and wind speed to the long-term trend of ETa.
Publisher’s Note: MDPI stays neutral with regard to jurisdictional claims in published maps and institutional affiliations. |
© 2021 by the authors. Licensee MDPI, Basel, Switzerland. This article is an open access article distributed under the terms and conditions of the Creative Commons Attribution (CC BY) license (http://creativecommons.org/licenses/by/4.0/).
Share and Cite
MDPI and ACS Style
Xu, R.; Gao, P.; Mu, X.; Gu, C. Spatial-Temporal Change of Actual Evapotranspiration and the Causes Based on the Advection–Aridity Model in the Weihe River Basin, China. Water 2021, 13, 303. https://doi.org/10.3390/w13030303
AMA Style
Xu R, Gao P, Mu X, Gu C. Spatial-Temporal Change of Actual Evapotranspiration and the Causes Based on the Advection–Aridity Model in the Weihe River Basin, China. Water. 2021; 13(3):303. https://doi.org/10.3390/w13030303
Chicago/Turabian StyleXu, Ruirui, Peng Gao, Xingmin Mu, and Chaojun Gu. 2021. "Spatial-Temporal Change of Actual Evapotranspiration and the Causes Based on the Advection–Aridity Model in the Weihe River Basin, China" Water 13, no. 3: 303. https://doi.org/10.3390/w13030303
Note that from the first issue of 2016, this journal uses article numbers instead of page numbers. See further details here.