
Adsorption of Metals to Particles in Urban Stormwater Runoff—Does Size Really Matter?


1
Institute for Sanitary Engineering, Water Quality and Solid Waste Management, University of Stuttgart, Bandtäle 2, 70569 Stuttgart, Germany
2
Institute of Urban Water Management, Department of Civil Engineering, Technical University of Kaiserslautern, 67663 Kaiserslautern, Germany
*
Author to whom correspondence should be addressed.
Water 2021, 13(3), 309; https://doi.org/10.3390/w13030309
Submission received: 15 December 2020
/
Revised: 20 January 2021
/
Accepted: 21 January 2021
/
Published: 27 January 2021
(This article belongs to the Special Issue Rainwater Management in Urban Areas)
Abstract
:The parameter total suspended solids (TSS) is often used to evaluate the need for stormwater treatment or to assess the effectiveness of treatment measures. The purpose of this study is to analyze the value and the limitations of this approach using metals as an example. They are of major concern due to their accumulating effects in the environment. Data of a monitoring campaign at a stormwater treatment facility is evaluated. TSS, organic matter and the associated metals (Cr, Cu, Zn, Cd, and Pb) were analyzed in four different particle size fractions (<63 µm, 63–125 µm, 125–250 µm, and 250–2000 µm). While the highest event meant concentrations for all metals were found in the smallest fraction, a rather uniform particulate bound metal concentration (mass of metal per mass of particulate matter) over the first three particle size fractions was detected. Total metal loads correlated well with TSS even better with TSS < 63 µm. However, the removal efficiency in terms of the reduction of the total metal load was not reflected sufficiently by the TSS or TSS < 63 µm removal efficiency.
1. Introduction
Industrialization, population growth, and the increasing urbanization in the last decades have negative impacts on the water resources. Particularly urban surface waters are directly affected by anthropogenic activities that can influence the hydromorphology as well as the water quality [1].
Urban stormwater runoff has been recognized as a major pathway of a vast number of pollutants [2,3]. The pollution of urban runoff varies depending on the catchment area and the anthropogenic activities within that catchment. Pollutants usually monitored in urban stormwater runoff include organic matter, metals, nutrients, organic micropollutants, pathogenic microorganisms, and solids (particulate matter) [4]. The pollution of urban stormwater runoff has different points of origin. It is traffic related (e.g., tyre wear particles, break wear, and fluid leakage), it contains materials from dry and wet atmospheric deposition or substances which can be released from roofs or buildings that are all washed off during a rain-event [5,6]. Studies showed that the pollutants in urban stormwater are mainly bound to particles [7,8,9]
Particles found in stormwater runoff are of different origin. In addition to traffic related activities [6,10,11], surrounding soil [12,13] as well as wet and dry atmospheric deposition [14,15] are the main sources. There have been multiple investigations regarding the concentration of TSS in stormwater runoff from different surfaces. There are variations of several orders of magnitude between different catchments. The highest concentrations can be found in street and highway runoff [16,17]. In addition to the mere occurrence of solids, their particle size distribution (PSD) plays a very important role in urban stormwater runoff and needs to be considered as a crucial parameter due to the fact that it has a significant influence on the adsorption of pollutants like metals and polycyclic aromatic hydrocarbons (PAH) [18,19]. A possible reason for this may be the relationship between particle size and specific surface area [20].
However, metals are transported in the aqueous phase as well. The partitioning is complex and impacted by several factors like the variability of TSS concentrations, PSD, pH of rainfall and of runoff matrix, alkalinity, residence time, hydrologic phenomena, and urban surface conditions [21]. The majority of technical solutions for the treatment of urban stormwater runoff are based on the physical principles of sedimentation or filtration, for example settling tanks, detention ponds or retention soil filters (RSF). With regards to the dominating role of solids in urban runoff this seems appropriate. However, the performance of these treatment systems is sensitive to the PSD. In terms of separating the fine particle size fraction sedimentation becomes less efficient [22]. Concerning the classical end-of-pipe emission reduction of pollutants in urban stormwater runoff, a good knowledge about the partitioning of these substances within different particle size fractions is of particular importance [23,24].
Among the objectives of this study is to investigate whether the particle fraction <63 µm is more contaminated with metals than the coarse fraction. The reasons are new regulations on stormwater management in Germany in which the requirement of stormwater treatment is based on TSS < 63 µm [25]. Another objective is to evaluate whether the retention of metals is sufficiently reflected by the retention of total suspended solids in a treatment facility.
For this purpose, data from a monitoring campaign at a stormwater treatment facility were analyzed. In this campaign, the particle size distribution of the total suspended solids was investigated in addition to the amount of total suspended solids. Most previous studies focus on road deposited solids or runoff from streets and motorways. In contrast, the samples examined in this study were taken from a central rainwater treatment plant of an industrial area comprising various types of surfaces. Furthermore, the rain events were sampled in large-volume sampling containers (approximately 1000 L), which means that a much larger quantity of solids was available for further laboratory analysis than, for example, in the investigation of road dust samples or samples from the use of automatic samplers to create pollutographs.
2. Materials and Methods
2.1. Site Description
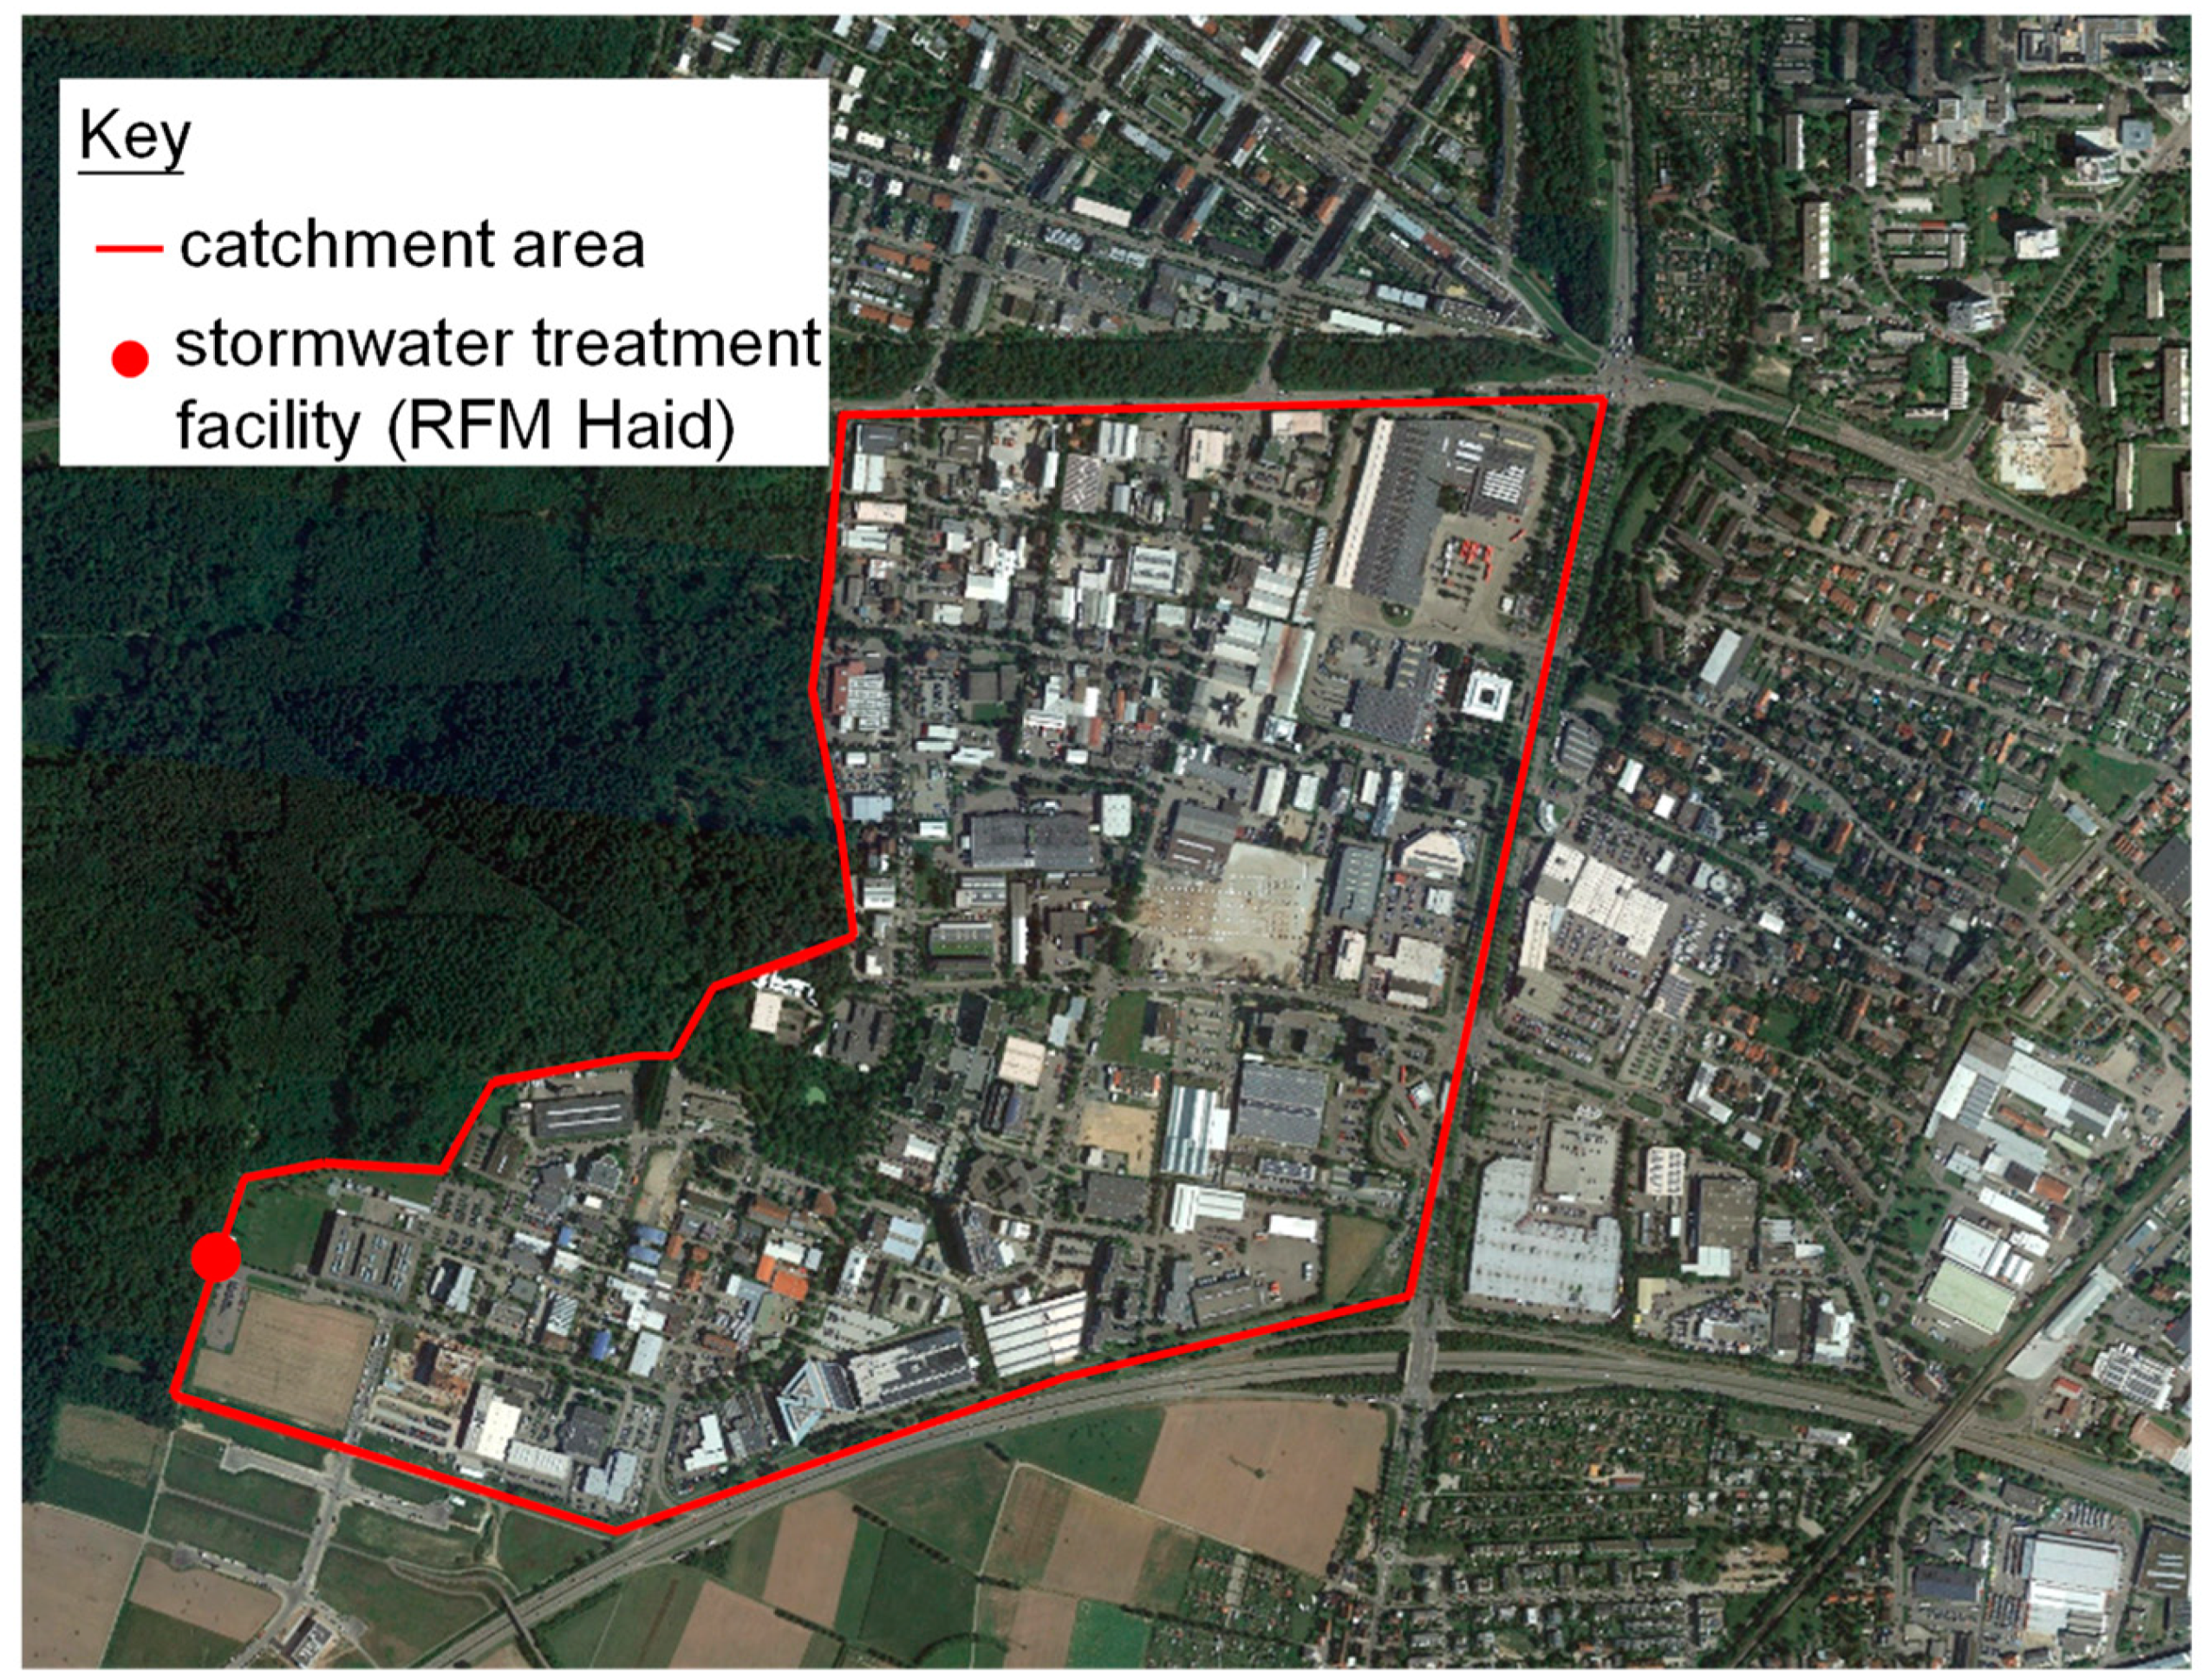
The monitored catchment area consists of the “Freiburg Haid” industrial park with an area of 110.3 ha. It is located in the city of “Freiburg im Breisgau” in the southwest of Germany. The area is enclosed by major roads in the north, east, and south. To the west, the area is bordered by forest and agricultural land. About 400 companies from various sectors are located in the industrial park. Worth mentioning is the presence of a gas station with an attached car wash. The main business areas are the automobile, health, and solar industries. The urban development is characterized by industrial and small commercial buildings, most of which are equipped with flat roofs. There are green surfaces between paved roads and built-up areas. The catchment area shows a low slope (<1%) and has a paved area of about 70.6 ha which corresponds to a degree of pavement of 0.7. The average daily traffic volume (ADT) is estimated to 9000–17,000 vehicles per day [26]. The entire catchment area is served by a separate drainage system. At the end of the stormwater sewer network (location of the treatment plant, also see Figure 1) the sewer has a diameter of DN 2000 with a slope of 5‰ over a length of 1000 m and is part of the stormwater treatment facility.
2.2. Stormwater Treatment Facility
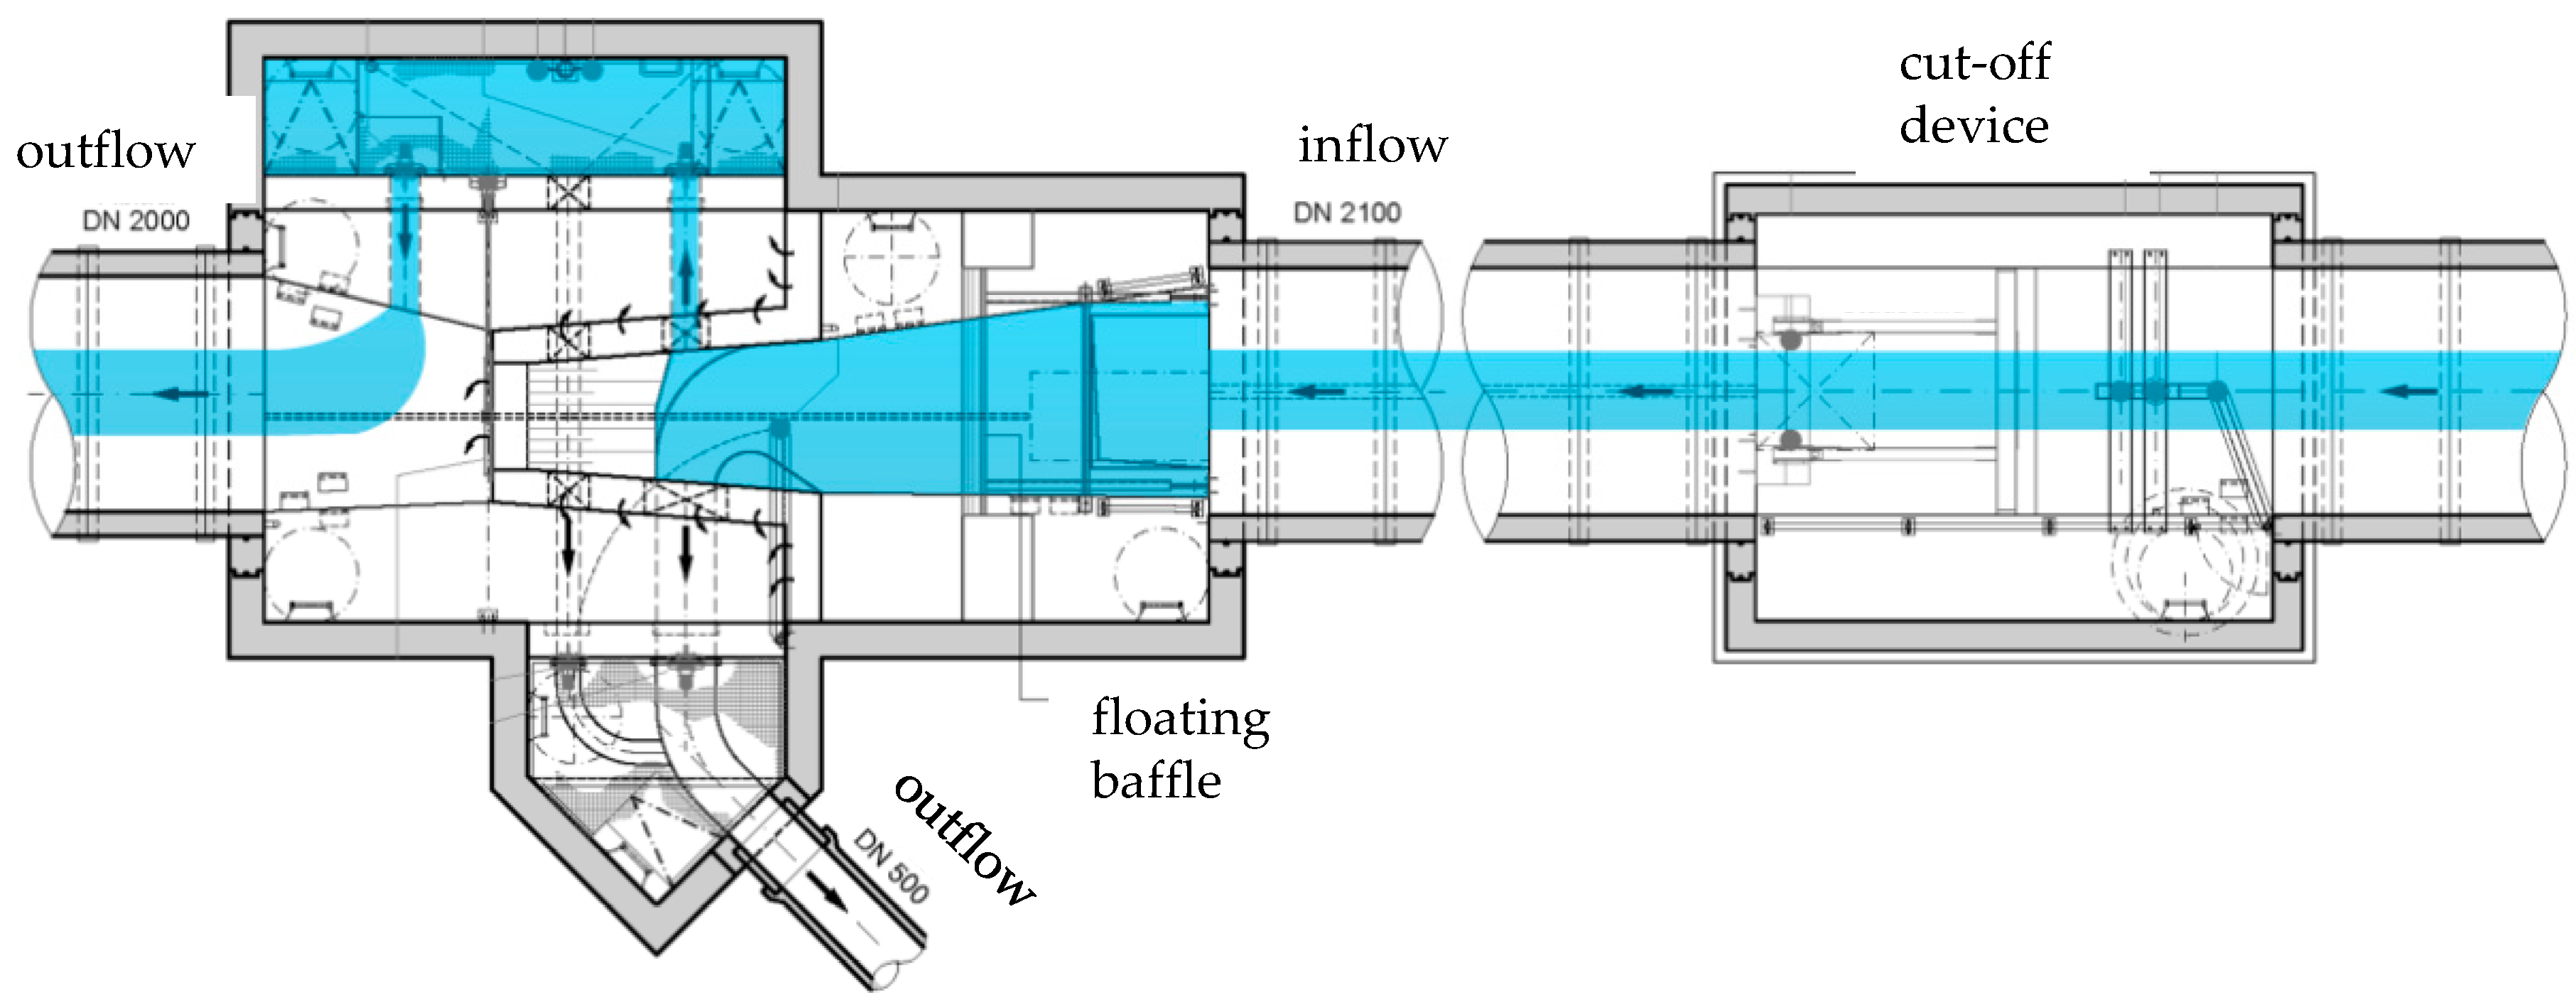
The sampled rainwater treatment facility “RFM Haid” is a pilot plant of its type. It resembles a storage sewer with overflow. In contrast to a classic stormwater sedimentation tank, the RFM Haid uses the existing volume in the stormwater sewer. A weir (h = 2.2 m) is installed in the structure, which has a sluice gate (h = 1 m). This is the core element of the treatment facility and allows discharging treated stormwater into the receiving water body after the impoundment of the inflowing stormwater and a certain sedimentation time (about six hours). During dry weather conditions, the existing infiltration water is lead through a bypass with an integrated oil separator. About 400 m upstream of the treatment facility a manhole with an automated cut-off device is located. At the beginning of a storm event the cut-off device (h = 0.75 m) closes and a total volume of about 85 m3 of stormwater is impounded for flushing purposes. After a storm event and the complete discharge of the stormwater sewer between both structures, the barrier is opened, and the retained water flushes the sewer as well as parts of the treatment facility. This water is also discharged into the foul sewer.
Functioning
To better understand the origin of the data used for this study the functioning principles of the monitored stormwater treatment facility are explained shortly. In dry weather conditions all aggregates in the RFM-Haid are in the base position. The cut-off device upstream is open, in the treatment facility, the valves to the bypass are open, therefore the inflowing infiltration water is led to the receiving water body (this state can be seen in Figure 2). At the beginning of a storm event, the valves to the bypass in the stormwater treatment facility and the cut-off device upstream are closed. Storm events are detected by a rain sensor at the RFM Haid and additionally by a water level measurement in the inlet structure (water level >0.2 m for more than 30 s). At first the stormwater runoff is held back by the cut-off device. When it is overflowed (after approximately 85 m3), the stormwater is impounded in the treatment facility and in the stormwater sewer. If the stormwater runoff exceeds another approximately 1000 m3, the weir in the treatment facility is overflowed and the water is directly discharged to the receiving water body (overflow). Floating material is retained by a floating baffle. After the storm event, all aggregates remain in their position until the water level has lowered to the top level of the weir. After the sedimentation period of 6 h, the sluice gate is opened, and the treated stormwater is discharged towards the receiving water body (clearwater discharge). Subsequently, the valve to the foul sewer is opened to discharge the remaining water of approximately 245 m3 into the foul sewer (effluent). As soon as the water level falls below 0.3 m, the cut-off device upstream is opened and the storm sewer as well as parts of the treatment facility are flushed. After the completion of the cleaning cycle described above, all aggregates are returned to their initial position (dry weather conditions).
2.3. Samples Collection
In this monitoring campaign the two, respectively three flows leaving the treatment facility were sampled using two submersible pumps. One pump was suspended in a floating position shortly before the weir crest in order to sample the overflow and the clearwater discharge as precisely as possible. The second pump was mounted on the bottom before the valve to the foul sewer to sample the effluent from the treatment facility. In order to get samples representing the mean of the total rain event, sampling was performed volume proportional to the runoff and was realized by a pump controller, which integrates measured flows over time and activates the pumps when a certain volume has been discharged. A flow measurement system based on ultrasound cross correlation was installed behind the weir in the continuing stormwater sewer and its signal was transmitted to the pump controller. The sampling was performed in large-volume sampling tanks with a volume of 700–1000 L. Overflow, clearwater discharge, and effluent were sampled in separate sampling tanks. The floating pump was activated for 16 s after a volume 36 m3 has been discharged and a subsample of about 25 L was taken. To sample the effluent volume proportionally, water levels were defined on the basis of a geometric model of the treatment plant [27], according to which a constant volume of approximately 40 m3 was discharged. The pump was then activated for 18 s and a subsample of about 32 L was taken. It was ensured that the flushing of the facility was also covered by the sampling. It is assumed that the volume of the subsamples is constant for both pumps.
Emptying of Sampling Tanks
Once the pumps filled the corresponding sampling tanks during a rain event, the solids were extracted after a sedimentation period of 1–3 days. Before the extraction of the solids, water level, temperature, pH value, and electrical conductivity were measured. The volume in the sampling tanks was calculated from the water level. As a first step, the supernatant water was carefully drained from the containers until a residual volume of approximately 10 L is left. Representative sub-samples were taken from the drained supernatant water in order to determine the proportion of non-settable solids contained in the supernatant water as well as its pollutant concentration. All settled solids in the remaining volume of the tank (approximately 10–15 L) were thoroughly remobilized and then collected in a smaller sampling container by a thorough rinsing of the tank. This sample contains all particles from the sampling tank. The samples then were transported to the laboratory of the Institute for Sanitary Engineering, Water Quality, and Waste Management (ISWA) at the University of Stuttgart and examined.
2.4. Laboratory Analyses and Methods
In the laboratory, the volume of the samples was measured then the coarse particles were separated by sieving (>2.0 mm). The separated coarse material was washed thoroughly to rinse off the smaller particles adhering to them. The rinsed particles were returned to the initial sample, the coarse material was dried to constant mass at 105 °C and weighed. The sample then was fractionated by wet sieving into the particle size classes <63 µm, 63–125 µm, 125–250 µm, and 250–2000 µm. Before each sieving, the sample was dispersed using a dissolver stirrer (IKA®-Werke GmbH, Staufen, Germany) for approximately 30 s. Membrane-filtered supernatant water from the corresponding sampling tanks was used for the wet sieving. This water was also used for thorough backwashing of the respective sieves. The resulting samples of different particle size classes (volume approximately 5–15 L) were then homogenized individually in a mixing reactor and divided for the analysis of total suspended solids (TSS) and the metal analysis.
TSS concentrations were determined as average of five individual replicates. The determination of the TSS concentration for the respective particle size fractions was carried out by vacuum filtration using 0.45 µm membrane filters (Sartorius). The filters were also dried to constant mass at 105 °C and weighted.
Metals were analyzed in dissolved and homogenized (dissolved + particulate) phase for each sample of the different particle size fractions). The homogenized samples (10 mL) were digested as triplicate determinations in two runs each with 5 mL HNO3 and 2 mL H2O2 (30%) in a microwave program (MLS Ethos, 1600W, 10 min heating, 20 min holding temperature at 210 °C) following DIN EN 16173 (2012) to analyze the acid soluble fraction of metals. The digest was filtered (2–4 µm, Macherey-Nagel MN 640 d, ash-free) and determined as concentration in mg L−1 in an inductively coupled plasma mass spectrometer (ICP-MS, Perkin Elmer Nexion 2000) (DIN EN ISO 17294-2 2017). The instrument was matrix-matched calibrated before each measurement and a certified reference material (CRM BCR-723 “Road Dust” and NIST 1640a) was analyzed as quality control. The recovery rates of the elements were in the range of 90 to 110% (N = 16; percentual standard deviation 1.5–5.0%). Analytical results of CRMs used can be found as Supplementary Material (Table S1). The analysis of the dissolved phase followed the same methodology; however, the samples were filtered prior to the digestions.
The particulate-bound concentration then was calculated from the difference between the two analyzed phases. The analyzed metals are chromium (Cr), copper (Cu), zinc (Zn), cadmium (Cd), and lead (Pb) as they are typical constituents derived from anthropogenic, in particular vehicular activities [8,28,29]
2.5. Evaluation Methods
2.5.1. Event Mean Concentration (EMC) and Event Load
Stormwater runoff events show significant variation in the constituent concentrations not only in between different stormwater runoff events, but also within the same runoff event. The first flush phenomenon for example is well known and often discussed [30,31,32]. Due to that fact, a single index, the event mean concentration (EMC) is generally used to describe the constituent load transported by a stormwater runoff event [21]. It is a flow-weighted averaged concentration calculated as the total constituent load (mass) divided by the total volume of the stormwater runoff event [33].
In this study the total constituent load is defined as the sum of the sampled flows (overflow, clearwater discharge, and effluent). The same applies for the total volume of the stormwater runoff event. The analyzed samples give a mean concentration of the respective volume sampled; therefore, by multiplying the concentration with the volume, the total mass of the respective flow can be estimated. This principle can be applied to TSS as well as the analyzed metals.
2.5.2. Treatment Efficiency
The definition of an efficiency enables the comparison of the inflowing load and the load in the overflow to the water body. In this way, different treatment facility can be compared in terms of their treatment performance. In general, the load M results from the product of the determined concentration c and the respective volume V for a corresponding time period. The calculation of the load efficiency is generally based on the following formula:
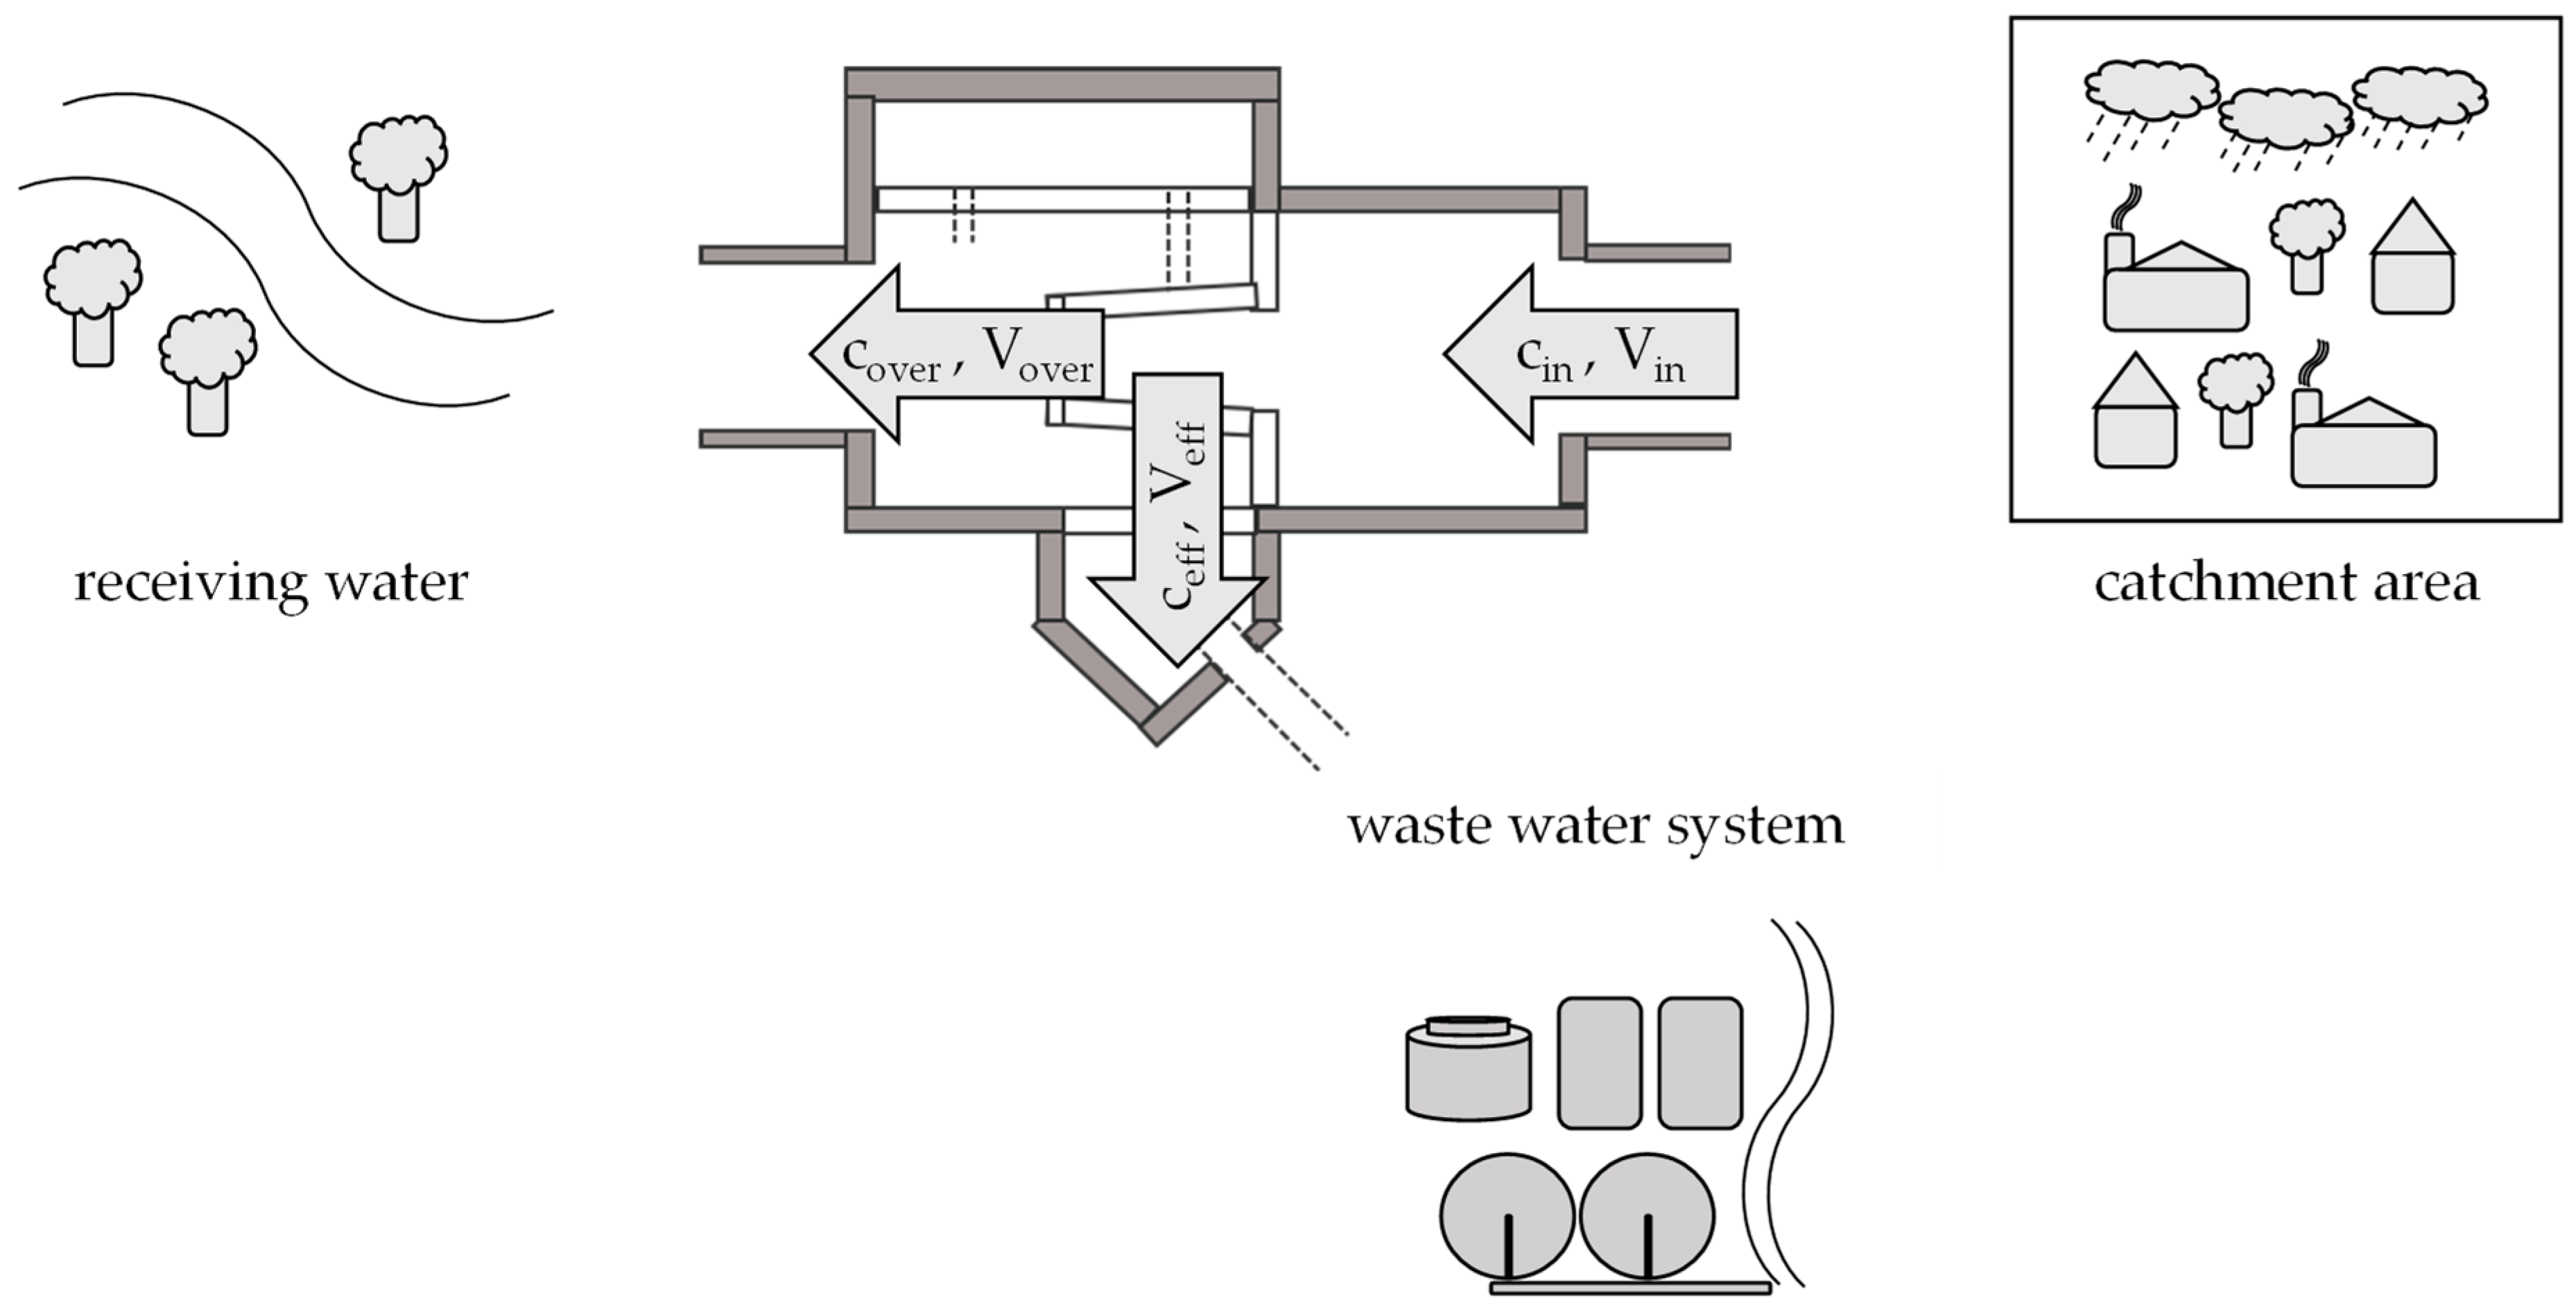
where ηM is defined as the treatment efficiency and Mover represents the total mass of a constituent reaching the receiving water and Min the total mass of a constituent coming into the treatment facility. Respectively cover as constituent concentration flowing to the receiving water and Vover the according volume. cin and vin the same but in the inlet to the facility.
Because of the described sampling in this study the treatment efficiency for monitored stormwater treatment facility is calculated as follows:
where additionally to Formula (1) Meff stands for the total mass of a constituent in the effluent to the foul sewer and ceff and Veff for the respective constituent concentration and the volume of the effluent. Figure 3 gives an overview of the relevant flows.
2.5.3. Partitioning—Conceptual Model
Partitioning typically results from sorption and desorption processes of a substance in a two phases system. In this study, the partitioning of metals results from the interaction between the dissolved fraction and the particulate-bound fraction, without consideration of the colloidal fraction. To evaluate the predominant metal phase the partitioning indices fd and fp, the dissolved fraction and the particulate fraction respectively, can be calculated as
with cd as the dissolved metal concentration in (dissolved metal mass/volume) and cp as the particulate metal concentration (particulate metal mass/volume), Md and Mp are the dissolved and particulate masses, respectively. Therefore, the partitioning indices are dimensionless. If fp shows a value >0.5, the tendency is towards the particulate metal fraction.
With the assumption of linear kinetics, the equilibrium partitioning coefficient Kd expresses the ratio between the metal concentration “sorbed” to particulate matter (PM) and the dissolved concentration [34]. Therefore, it can be used to evaluate the distribution between particulate and dissolved metals. Kd is calculated as follows:
with cs as “sorbed” concentration in (mass of metal/mass of PM) and m as mass of PM. Typically cs is expressed in mg kg−1 as it is equal to a part per million. Hence, Kd is usually given as liter per kilogram.
2.6. Statistical Analysis and Data Presantation
To evaluate the linear correlations, the Pearson correlation coefficient (r) is used in this study. In order to determine the significance of the correlations, p-values are determined using the two-tailed Student’s t-distribution. The correlation is assumed significant if the calculated p-value is smaller than the level of significance of 0.05.
For data presented as boxplots, the following applies: the whiskers correspond to the minimum and maximum, the box itself corresponds to the interquartile range (lower end first quartile, upper end third quartile), the line in the box represents the median and the cross the arithmetic mean. Outliers, represented as circles, are recognized as such, if they deviate upwards or downwards from the box by 1.5 times the interquartile range.
3. Results and Discussion
The data presented hereafter have been collected over a monitoring period from March 2018 to January 2019. In total 22 rain events have been sampled within 17 sampling events. The sampling event “2018_1213” consists of two, “2019_0108” of three rain events. All other sampling events correspond to single rain events. The rain duration of the sampled events was between 1 and 34.3 h, the total rainfall volume was between 0.3 and 14.4 mm with a rain intensity between 0.1 and 2.1 mm/h. Event specific data can be found as Supplementary Material (Table S2). Overall, 14% of the total stormwater runoff was retained by the treatment facility.
3.1. Particle Size Distribution
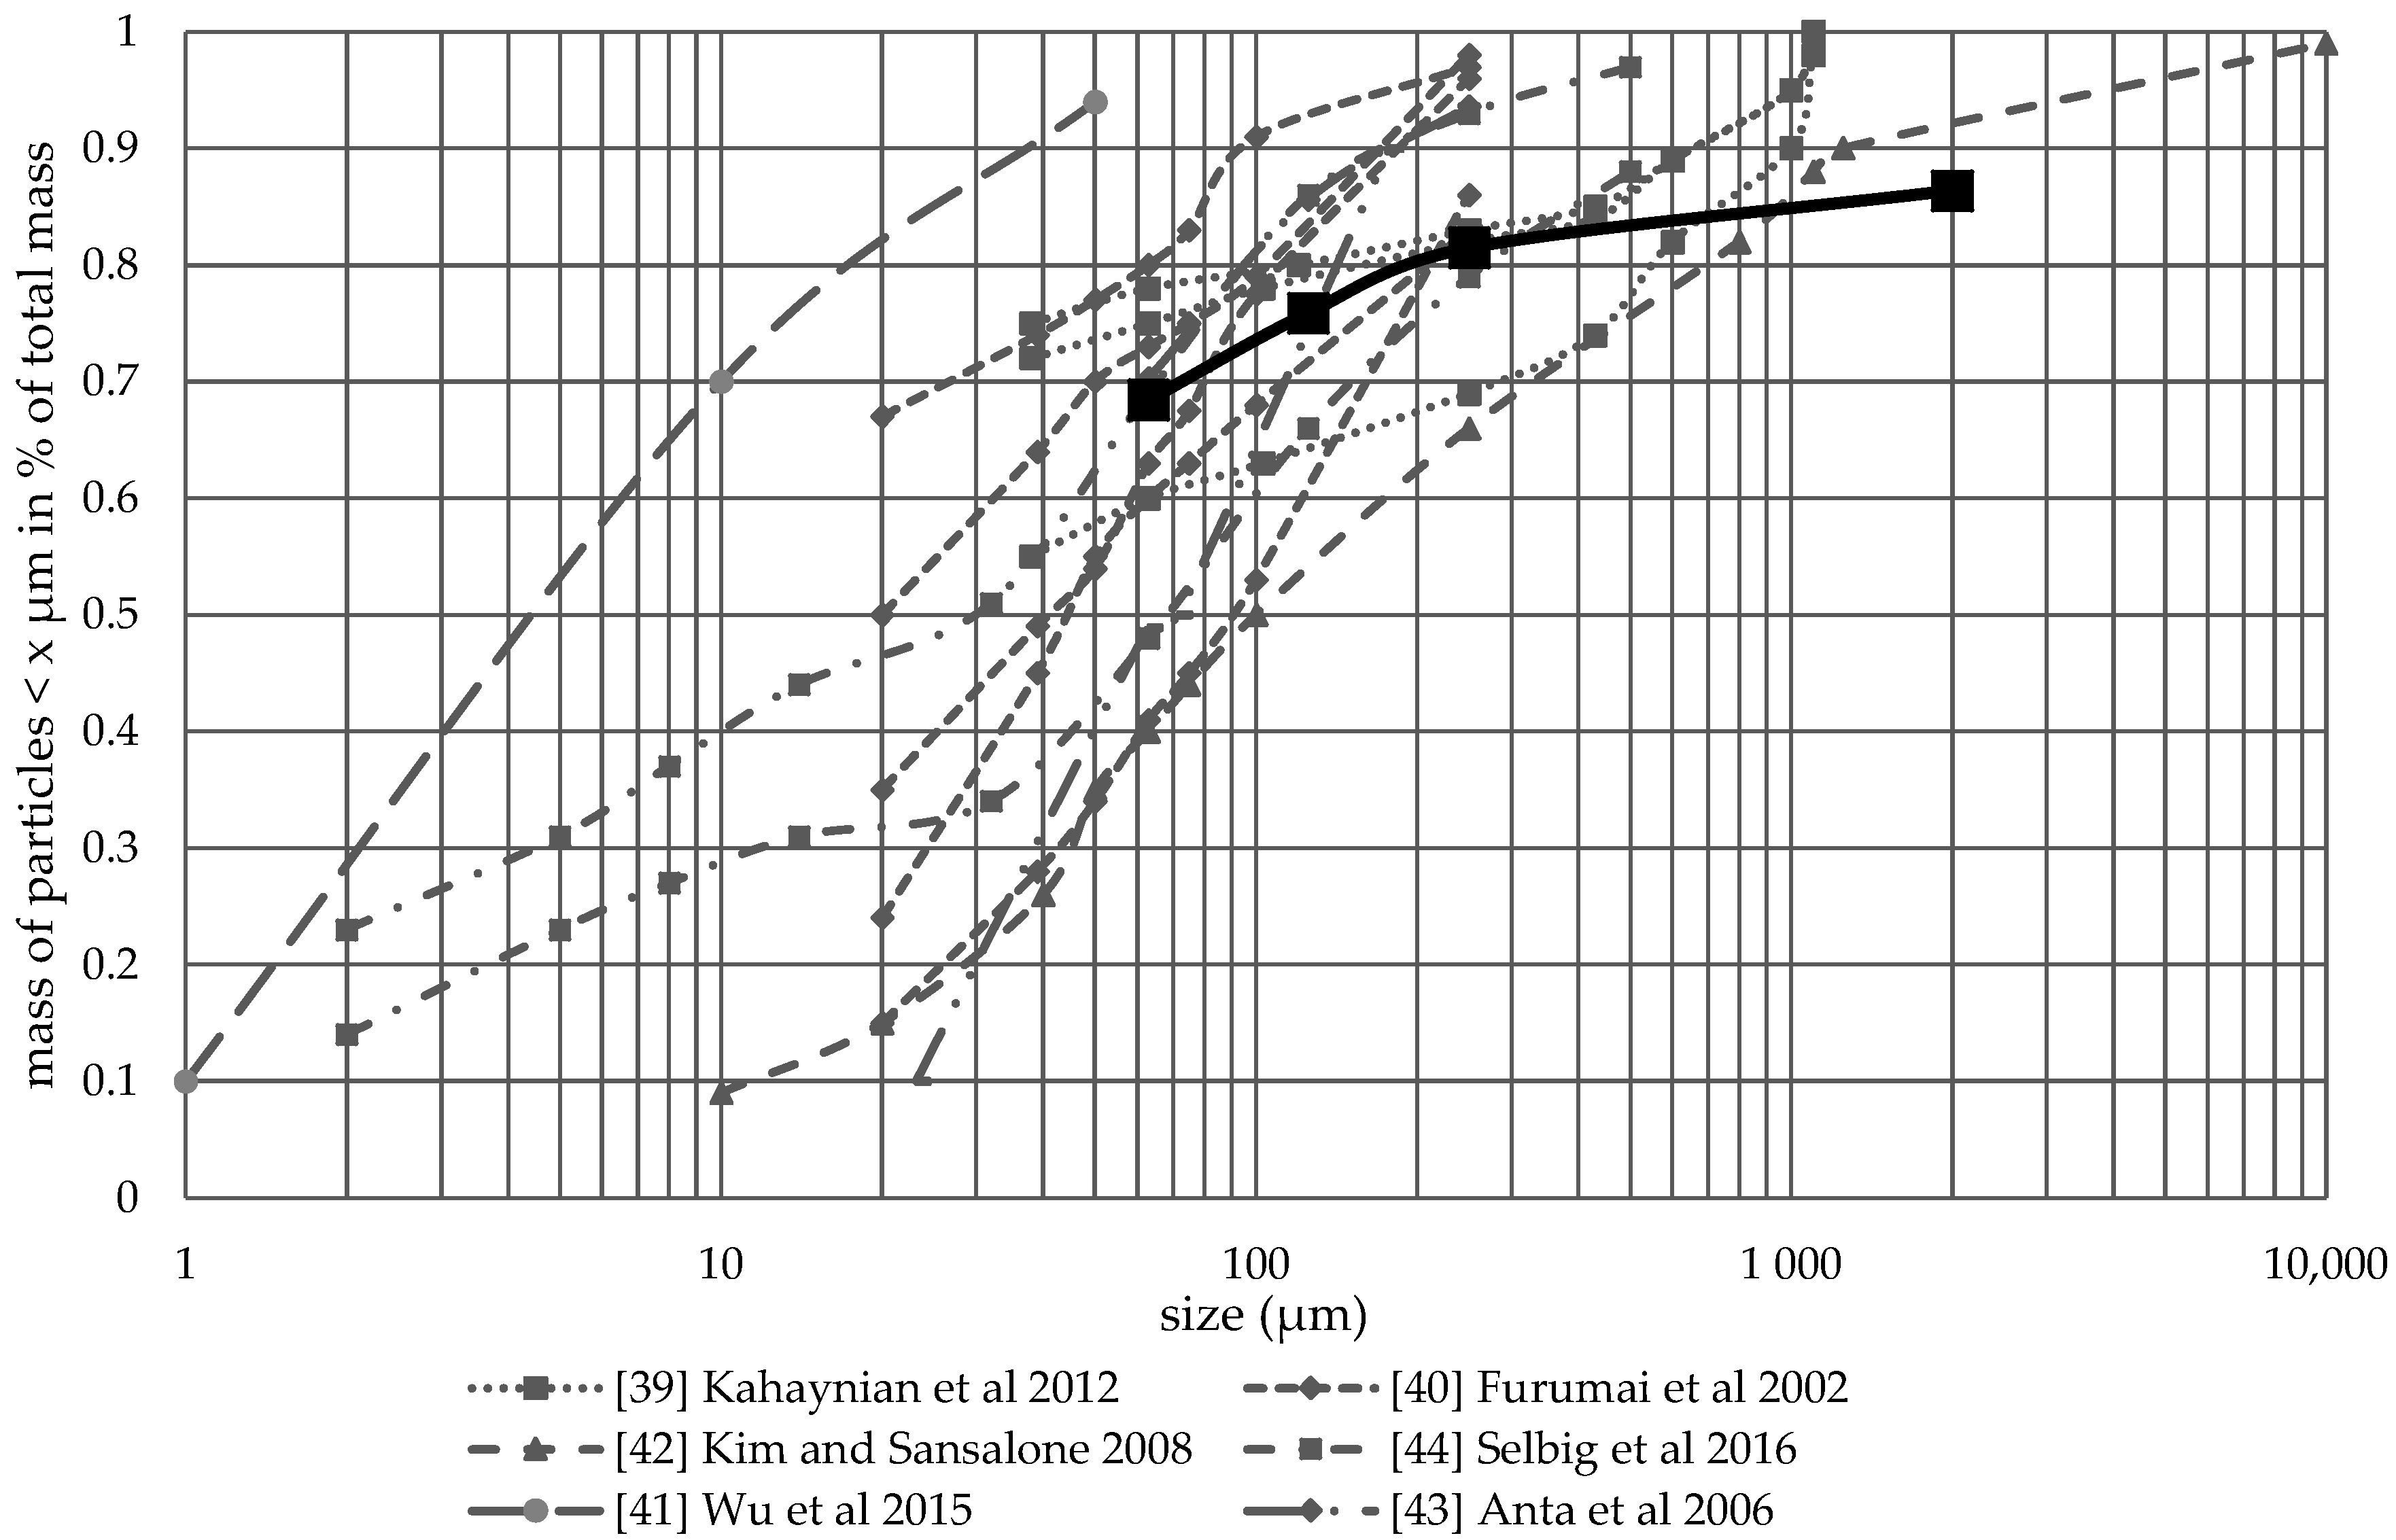
Figure 4 shows the particle size distribution (PSD) on the basis of the total load of all 17 sampling events. In this study, 68% of the solids mass was smaller than 63 µm, 75% smaller than 125 µm, 81% smaller than 250 µm, and 86% smaller than 2 mm. The cited studies were chosen because they investigated the PSD of road runoff. A comparison with road deposited solids (RDS) would lead to a wrong interpretation as the PSD from RDS differ significantly from road runoff due the fact that road runoff is washed off from surfaces and thereby influenced by different surface properties (e.g., roughness or slope) as well as by different rain characteristics [35,36,37]. This results in a finer PSD of road runoff than it is found in RDS [38]. The PSD of the cited studies was determined by wet sieving [39,40,41], by laser diffraction [22,42,43], and a combination of wet sieving (particles > 32 μm) and Coulter-counter measurement (particles < 32 μm) [44]. Compared to the other studies, the PSD of the Freiburg Haid catchment shows a relatively high number of fine particles (<63 µm) as well as gross solids (>2 mm).
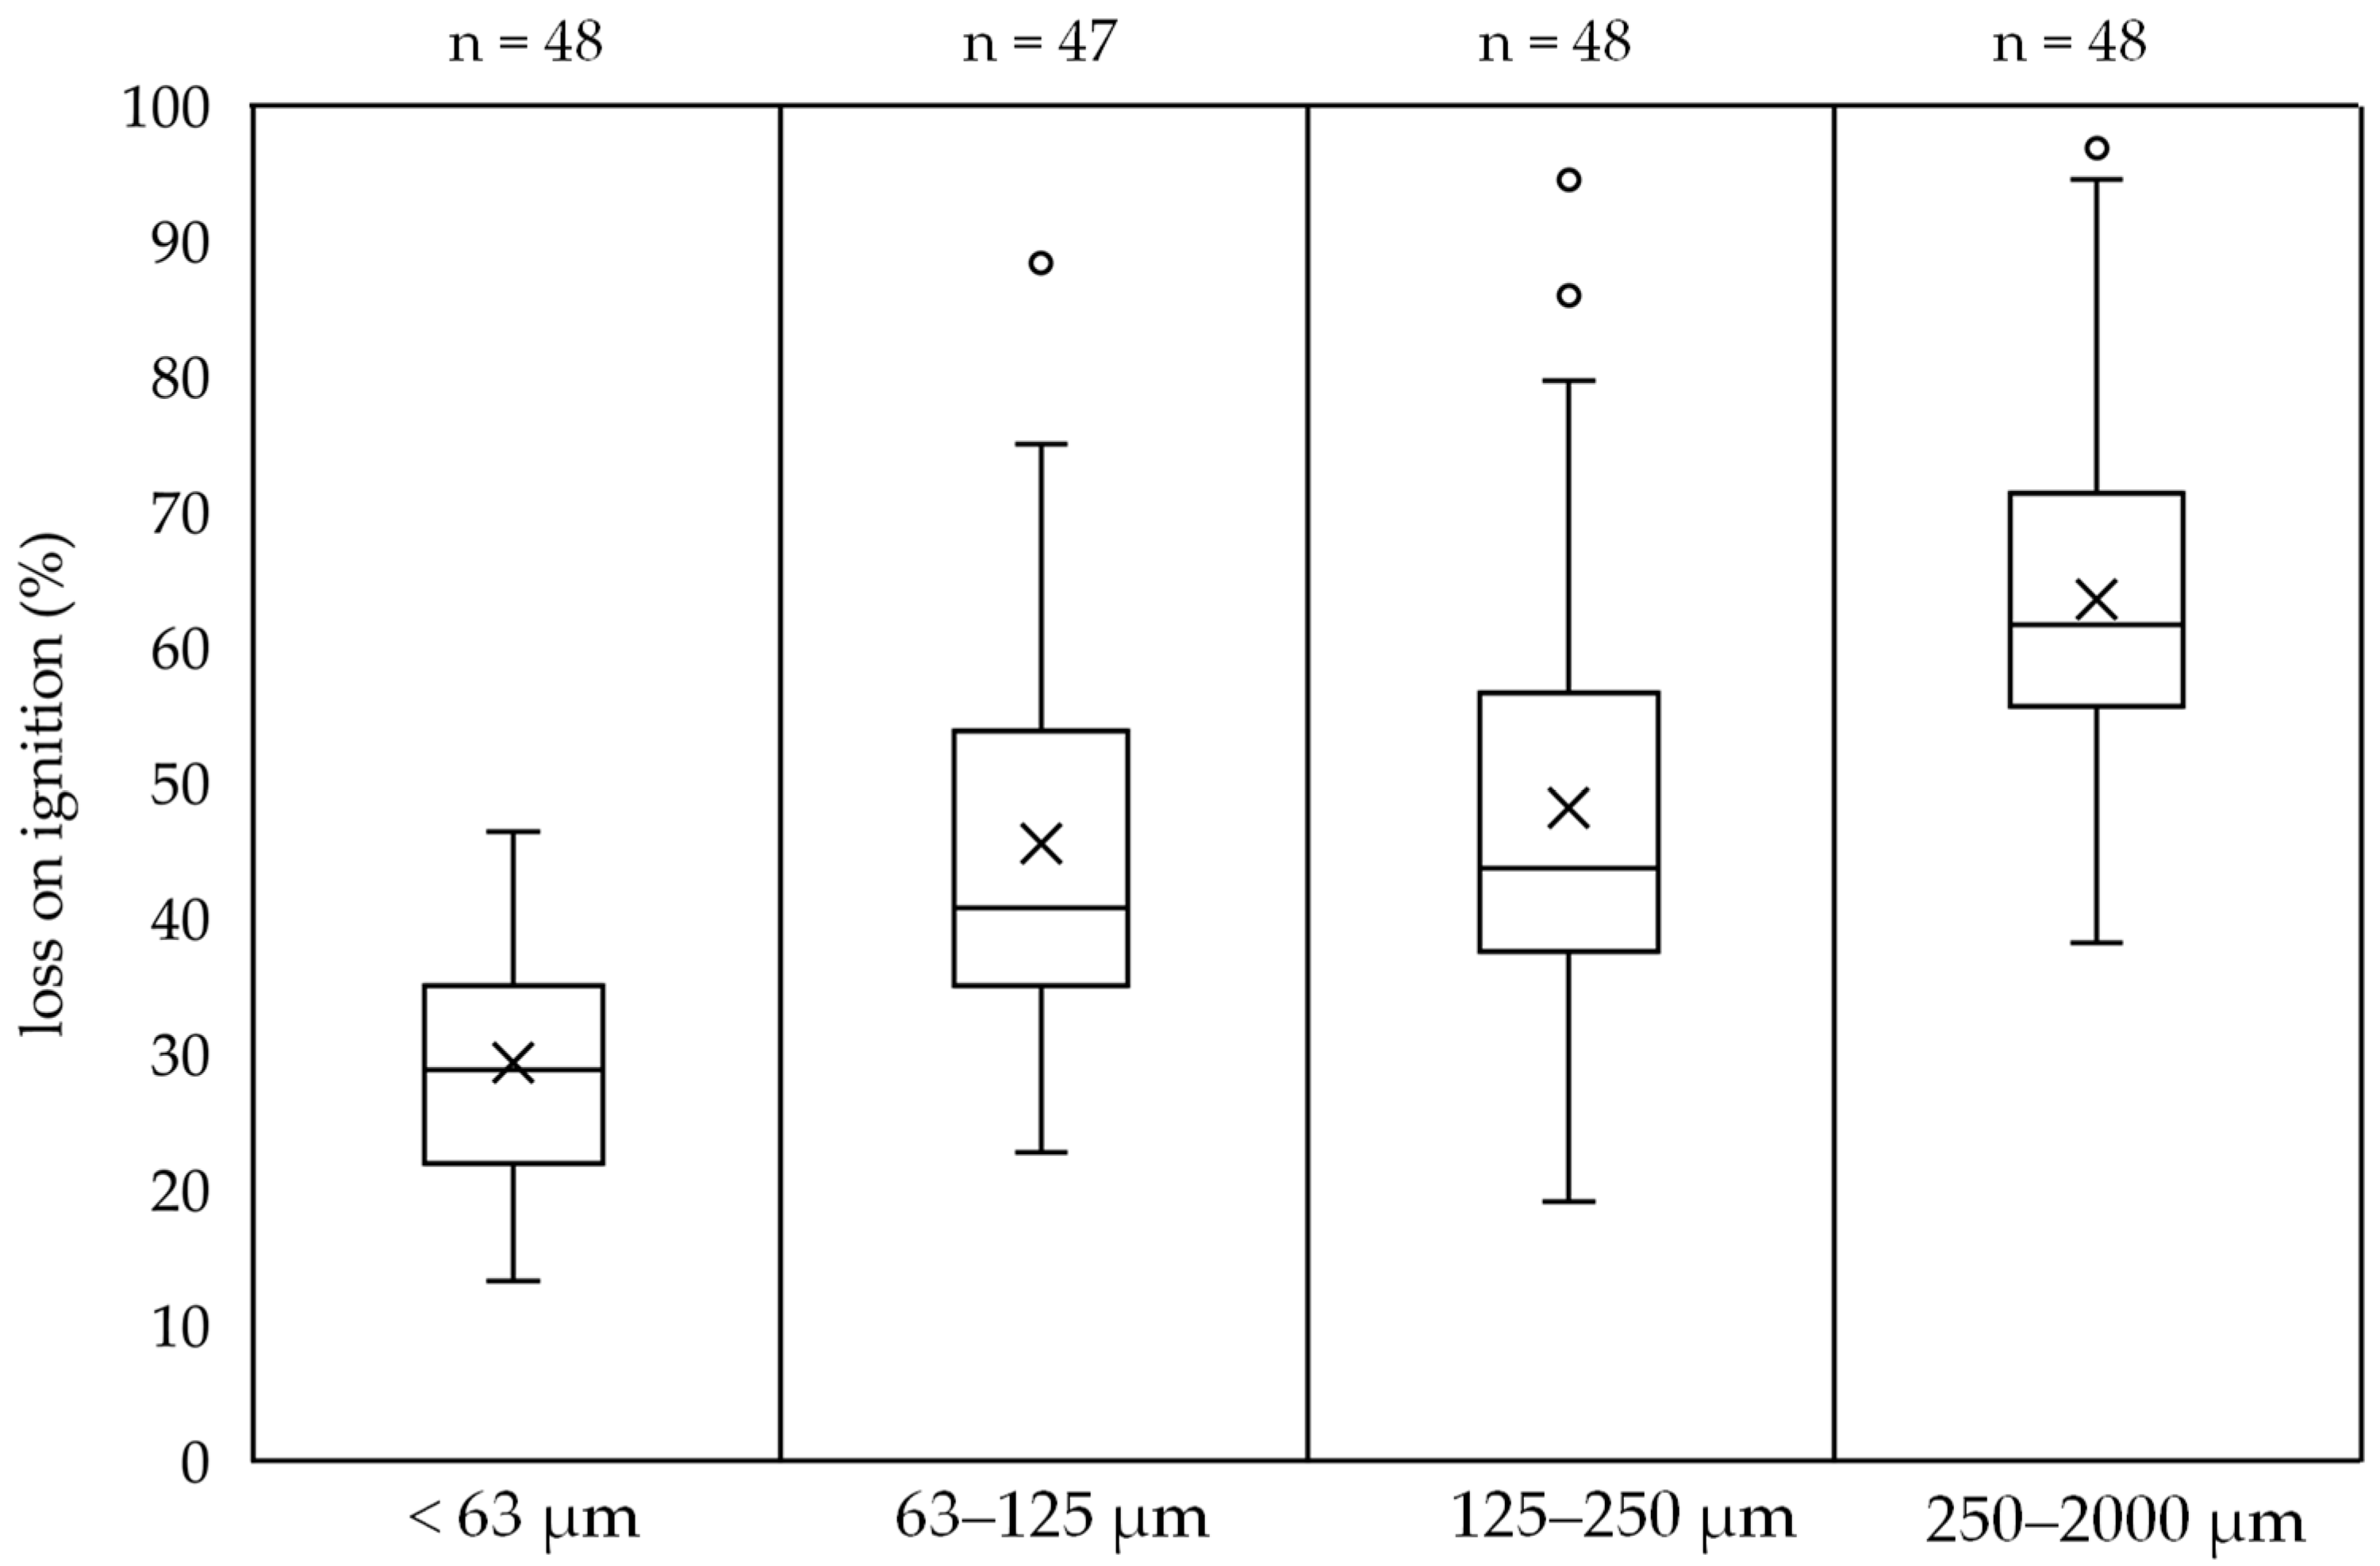
3.2. Loss on Ignition
To further gain more insight into the particle size fractions, the loss on ignition was analyzed for all samples. When the solids are incinerated at 550 °C, only the mineral fractions remain. Thus, the mass fraction lost through ignition corresponds to the organic fraction of the sample. Solids with a high organic content tend to have poorer settling behavior due to the increased tendency to flocculate [45,46]. Therefore, information on the organic content is also of great interest with regard to the treatment efficiency of stormwater treatment plants. Furthermore, particles with a high organic content have an increased adsorption capacity [47,48]. Figure 5 shows the loss on ignition of the individual solid fractions. The loss on ignition of the <63 µm fraction is the lowest at approximately 30%. The loss on ignition increases with increasing particle size. In the largest fraction, it is approximately 62%. Due to an error in the sample handling the number of samples of fraction 63–125 deviates from the others.
3.3. Event Mean Concentrations of TSS and Metals
Table 1 summarizes the EMC values for the analyzed size fractions. For the investigated metals, the dissolved and the total fraction (dissolved and particulate-bound) is also given. In terms of TSS total means the particle size fractions as a whole (0.45 µm to 2000 µm). For each parameter, the minimum, maximum, mean, median and standard deviation (SD) values of the EMC observed across the monitoring campaign are illustrated. Furthermore, the mean treatment efficiency of the investigated stormwater treatment facility is given. For TSS the highest concentrations can be found in the smallest size fraction. However, this fraction shows the highest variation and as suspected the lowest treatment efficiency. The same trend can be seen for the metals as well. It needs to be mentioned that Cd and Pb were very often not quantifiable in the dissolved fraction. About 70% of the analyzed samples were lower than 0.1 µg L−1 (limit of quantification). For Cr, about 7% of the dissolved values were not quantifiable. However, for calculating the EMC, the total load, and the removal efficiency respectively, 0.5 times LOQ was used. The sampling event specific EMC data and treatment efficiency data can be found as supplementary material (Tables S3 and S4).
Cadmium and Pb are listed as priority substances in the Water Framework Directive (WFD) of the European Union [49]. Therefore, there are existing concentration values defined as environmental quality standards (EQS) which should not be exceeded in surface waters. Those EQS values are given as annual average (AA-EQS) or as maximum allowable concentration (MAC-EQS). For Cd, the MAC-EQS of 0.45 µg L−1 was exceeded two times and the AA-EQS of 0,08 µg L−1 was exceeded by each sampled event. For Pb, the MAC-EQS of 14 µg L−1 was exceeded three times and the AA-EQS of 1.2 µg L−1 was exceeded within 16 of 17 sampling events. Although Pb content in surface runoff has shown a decreasing trend since the use of unleaded petrol [8], elevated concentrations can still be found in some areas. Lead in runoff originates mainly from geogenic sources, but due to the past use of Pb in petrol and the resulting increased emissions, there are still many persisting Pb compounds that can enter surface runoff, e.g., through dust drifts from the soil [50]. Cadmium comes from brake and especially tyre wear [51]. Depending on the traffic load, this can lead to high concentrations in urban runoff. It needs to be mentioned that a direct comparison of the substance concentrations with the EQS values should take into account that, depending on the size of the water body, a significant dilution may occur.
Comparing to the concentrations shown by Brombach et al. [52], who compiled a vast database for separate as well as combined sewer systems, the concentrations in this study can be considered as low. For example, the median TSS concentration of separate systems and storm sewers is given as 141 mg/l whereas the median EMC in this study is 33 mg L−1. The median Zn concentration of 275 µg L−1 is the same as stated in this database the other metal concentrations show lower values.
With regard to the treatment efficiency, it can be seen that the efficiency also decreases with decreasing particle size. In the particle size <63 µm, only 21–28% of the investigated substances are retained, whereas in the 250–2000 µm range the treatment efficiency is between 71 and 83%. This trend is to be expected for sedimentation-based treatment facilities. The treatment efficiency for the dissolved fraction of the investigated metals is between 0.11 and 0.20. For the total metal retention (particulate + dissolved), values between 0.21 and 0.34 are shown. The retention of dissolved metals is similar to the runoff volume retained by the treatment plant.
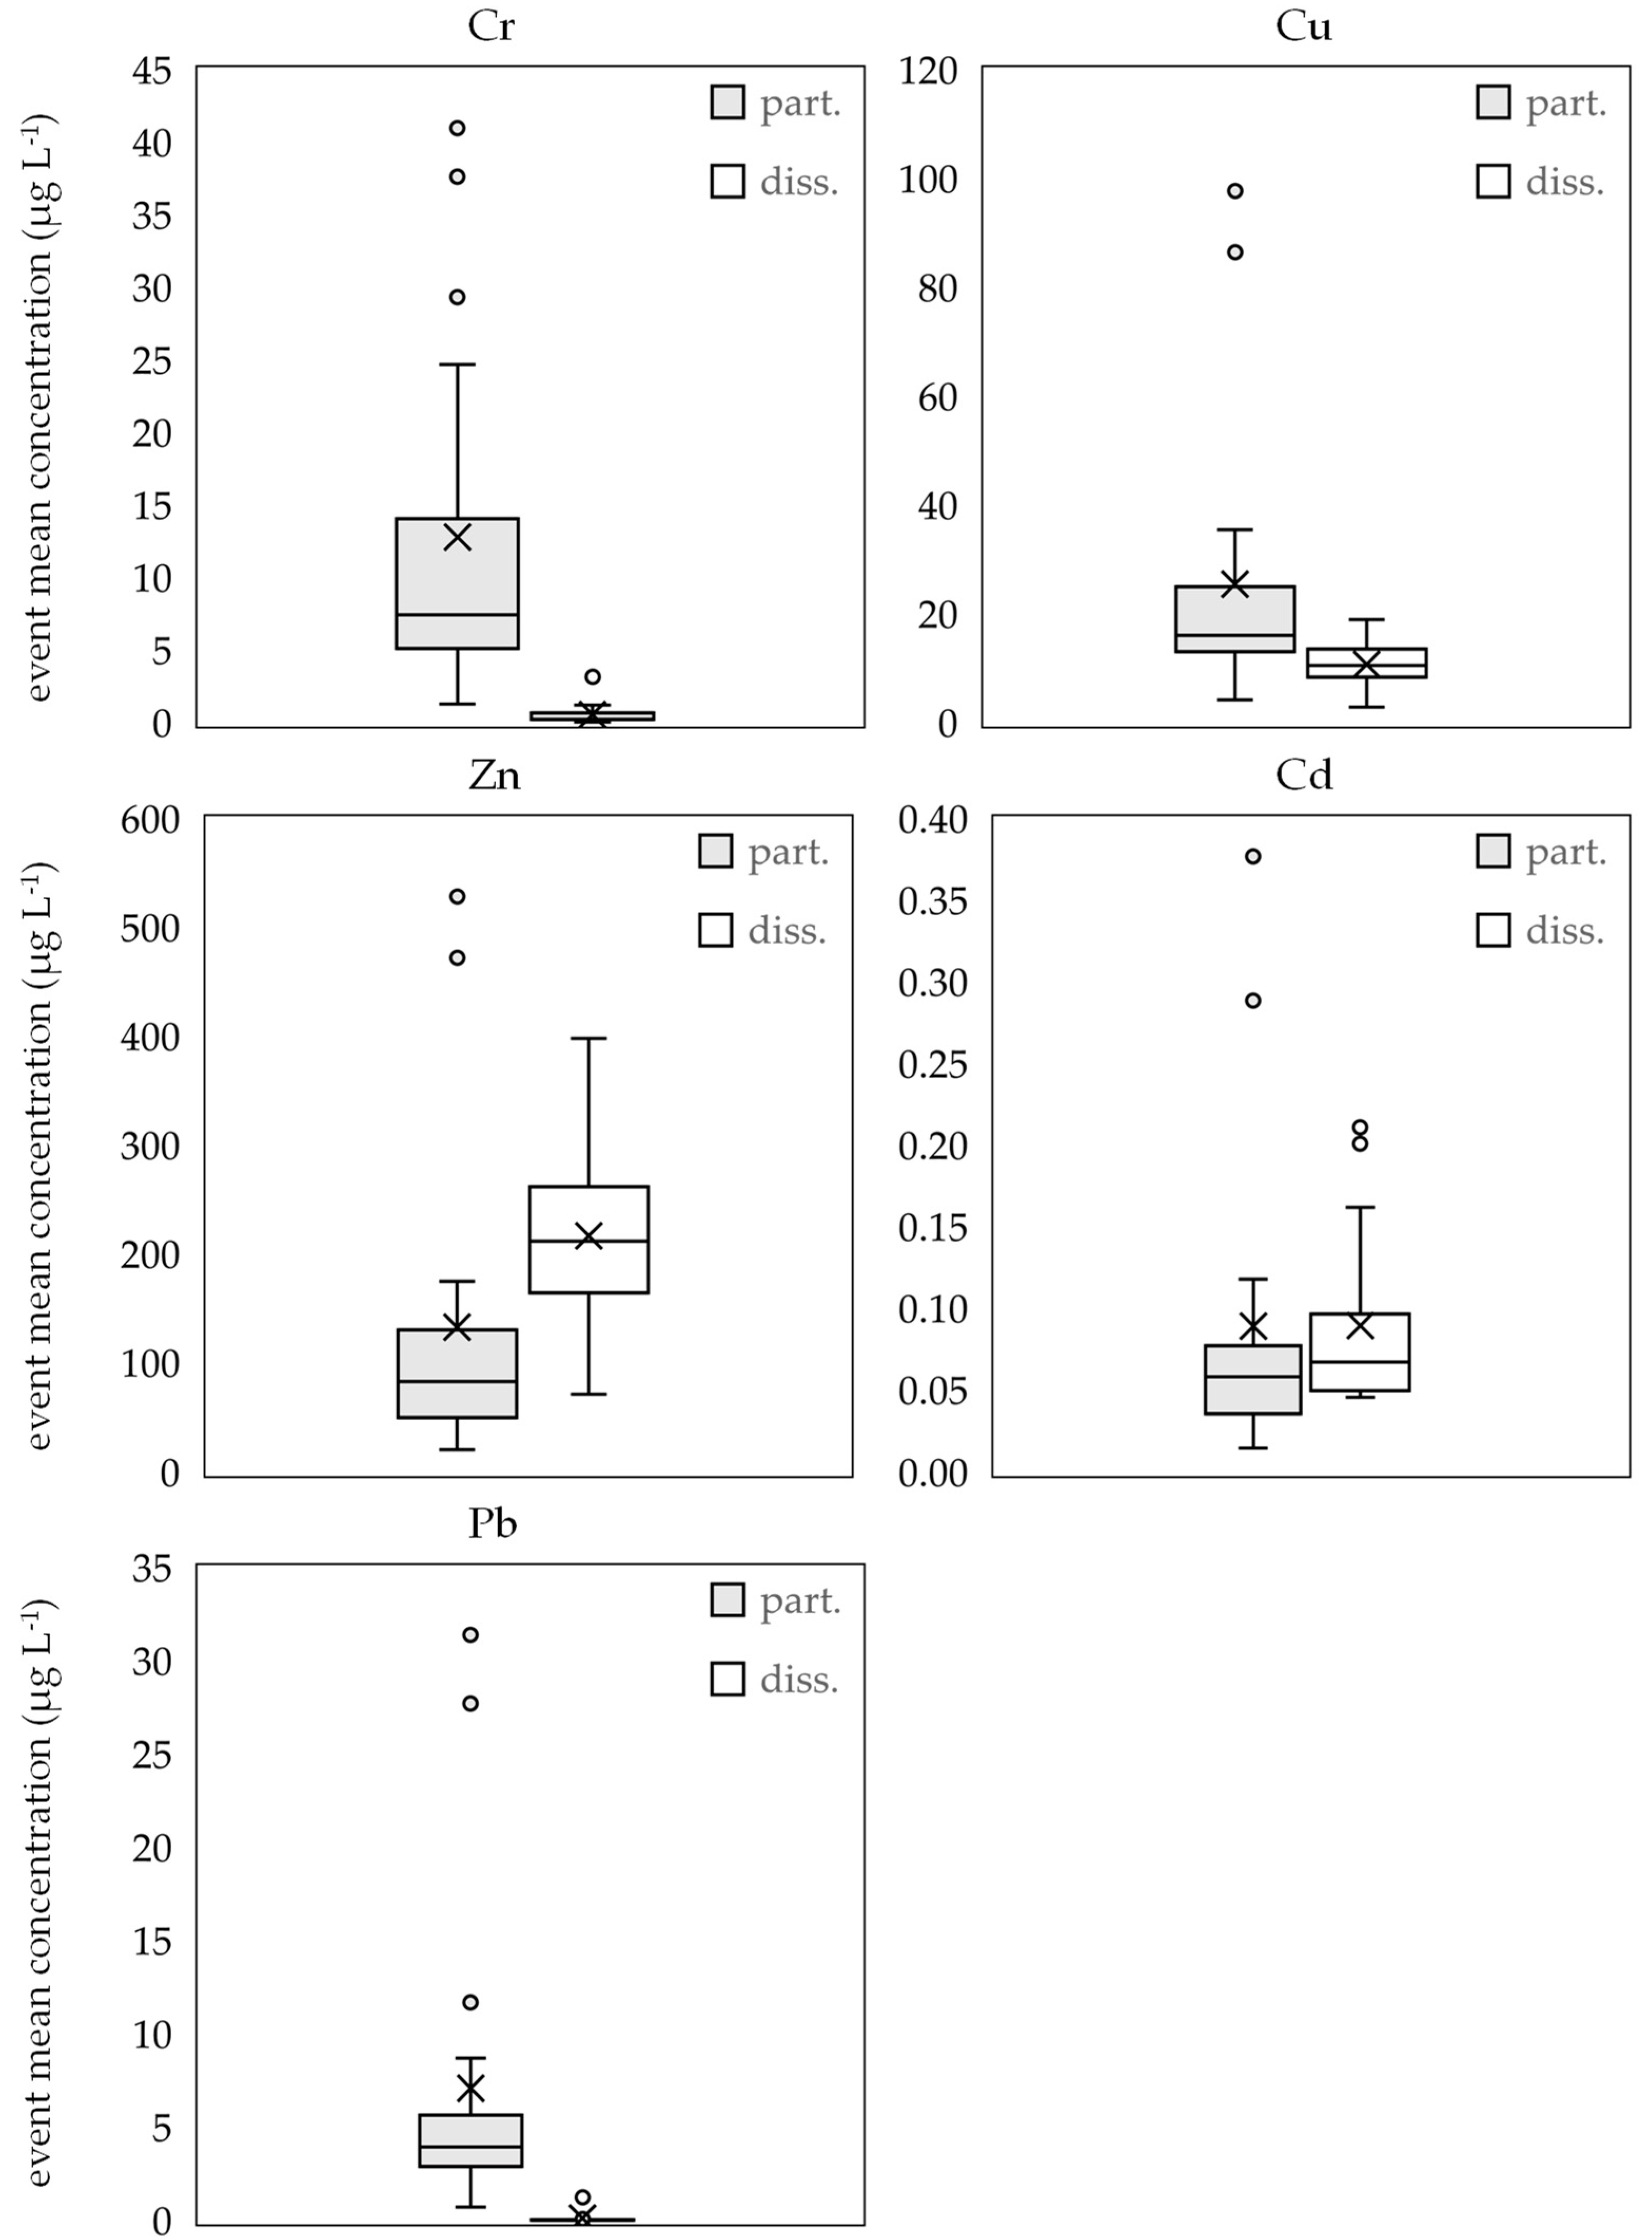
Figure 6 shows the distribution of particulate-bound (grey boxplots) and dissolved (white boxplots) event mean concentrations for the examined metals. These results show that for Cr, Cu, and Pb the particulate phase is significantly higher than the aqueous phase in which Cu shows the highest values of the three metals. Zinc shows the highest concentrations overall, but contrary to the other metals the dissolved concentrations exceed the particulate one significantly. For Cd, the distribution between particulate and aqueous phase is more equal, However, the significance of this comparison must be viewed critically, as a large proportion of the values are not measured but calculated, as mentioned before. Zinc also shows the widest interquartile range of all analyzed metals for both the particulate and dissolved phase. The particulate EMC shows a minimum of 21 µg L−1 and a maximum of 175 µg L−1, for the dissolved EMC the values range from 71 µg L−1 to 399 µg L−1. This behavior indicates a high variability in the partitioning process shown in the next section. Huber et al. [8] also found a high variability of Zn in urban runoff from traffic areas compared to other metals. Gnecco et al. [53] investigates the fate of Zn, Cu, and Pb in urban runoff from paved source areas with different usage. In their study, Zn showed an even higher variability. In the particulate fraction, the values ranged within three orders of magnitude over the different catchments. While TSS concentrations vary considerably at the investigated areas, the metals associated with storm runoff show significant concentrations across the different sites. They raise the question whether TSS is sufficient as the single index parameter to represent the total metal loads, including dissolved and particulate-bound fractions.
3.4. Partitioning of Metals
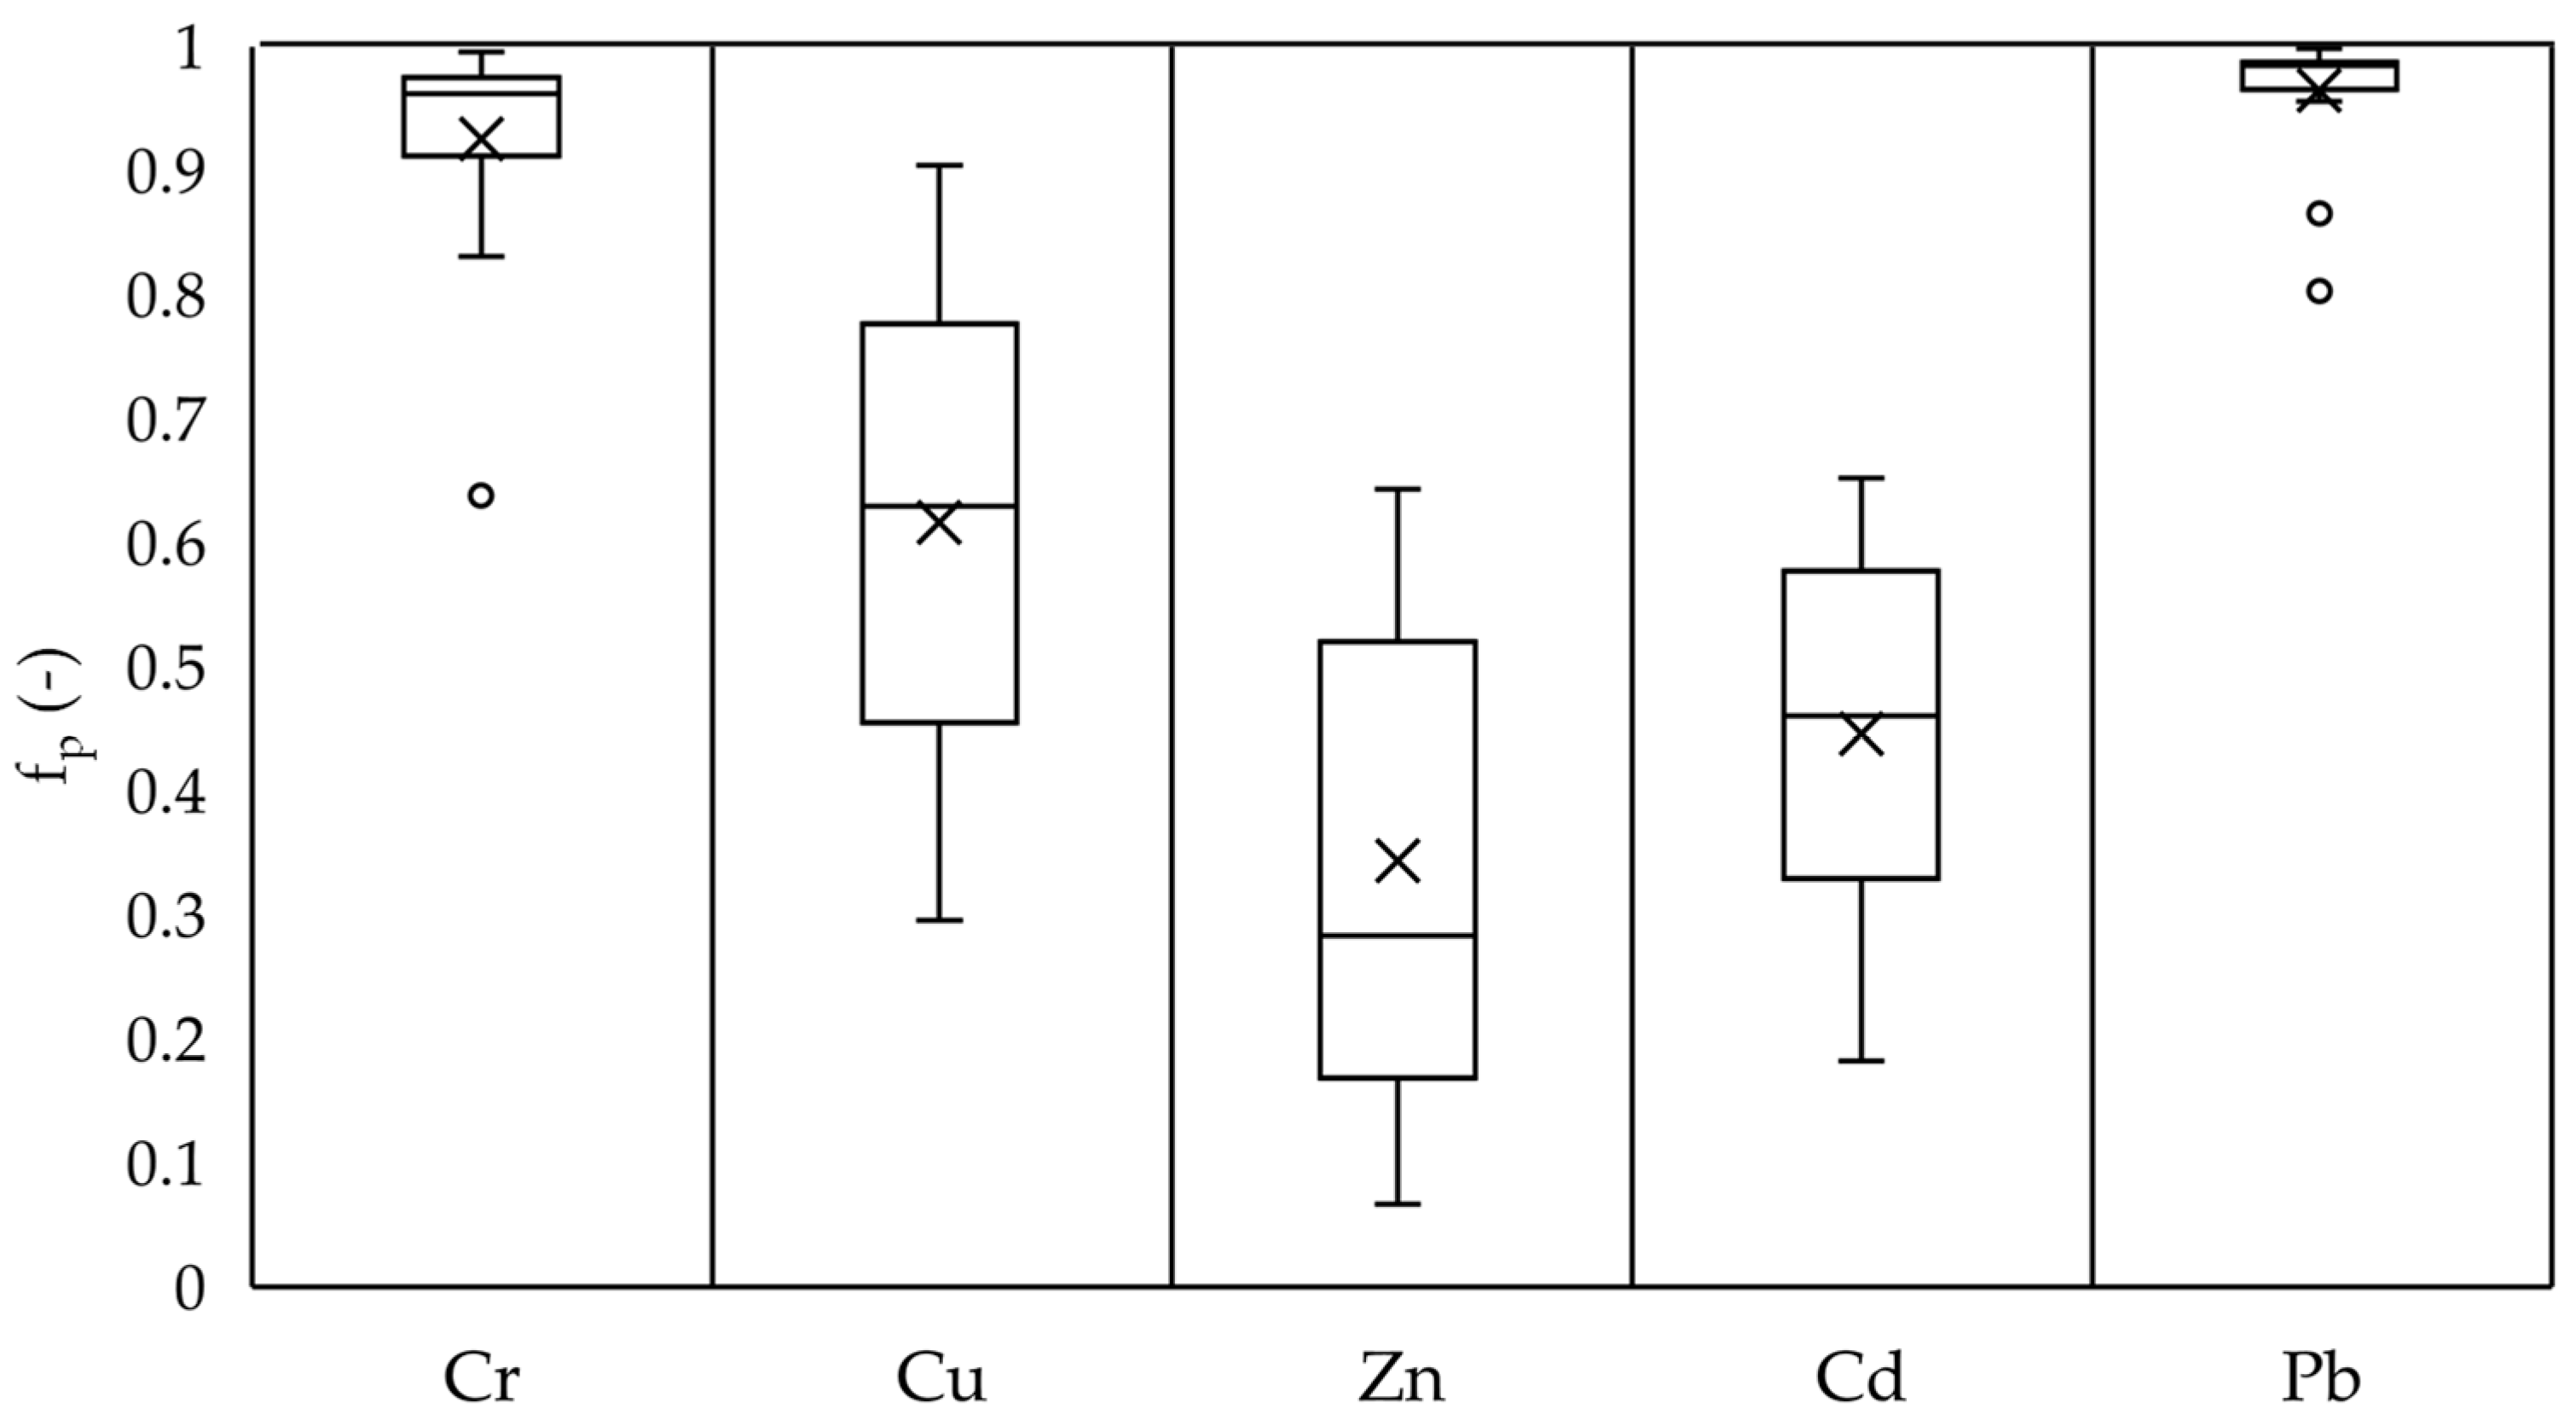
Studies on the transport behavior of metals in surface runoff highlight the relevance of metal partitioning in the mass transport (e.g., [24,53,54]). Furthermore knowledge about the partitioning of metals is crucial for the planning and design of adequate stormwater treatment measures [23,24]. Therefore, in the conducted monitoring campaign all collected samples were analyzed in the dissolved and homogenized (diss. + part.) phase, which allows getting the particulate-bound phase, by subtraction. In general, the partitioning of metals in stormwater can be influenced by different factors. Predominantly by the pH value of the rainfall or the runoff matrix, the type and quantity of PM, the solubility of the metal as well as the pavement residence time [21]. The larger the catchment, the higher the residence time therefore the tendency toward the particulate phase is increased due to the longer contact time between metals and PM. Figure 7 shows the distribution of the particulate fraction index fp for the investigated metals on event basis. It clearly can be seen, that Pb shows the highest affinity for particulate-bound fraction with fp values between 0.80 and 0.99 and an average of 0.97 followed by Cr with an average of 0.93. Copper as well shows an affinity towards particulate-bound transport. However, in 5 out of the 17 events the partitioning index is lower than 0.5. In these events, the tendency was towards the aqueous phase. For all sampled events, the pH was in the neutral range between 6.8 and 7.6. Therefore, the shift of Cu towards the dissolved fraction cannot be explained with an acidic runoff matrix. It could rather be due to the comparatively low TSS concentrations of these sampling events (9–27.7 mg/L) [53]. Cadmium shows a median value of 0.46 therefore no clear partitioning tendency can be deduced. A clear trend for the aqueous phase is shown by Zn. The values range from 0.18 to 0.65 and therefore Zn also shows the biggest interquartile range which can be interpreted that Zn has a high mobility. Jayarathne et al. [50] studied the mobility of metals using sequential extraction. They found a similar trend for metals even from different land uses. The order was as follows in relation to the exchangeable geochemical fraction (also referred to as effective bioavailable or mobile fraction): Cd > Zn > Cu > Pb > Cr. For industrial land use the position of Cd and Zn are changed.
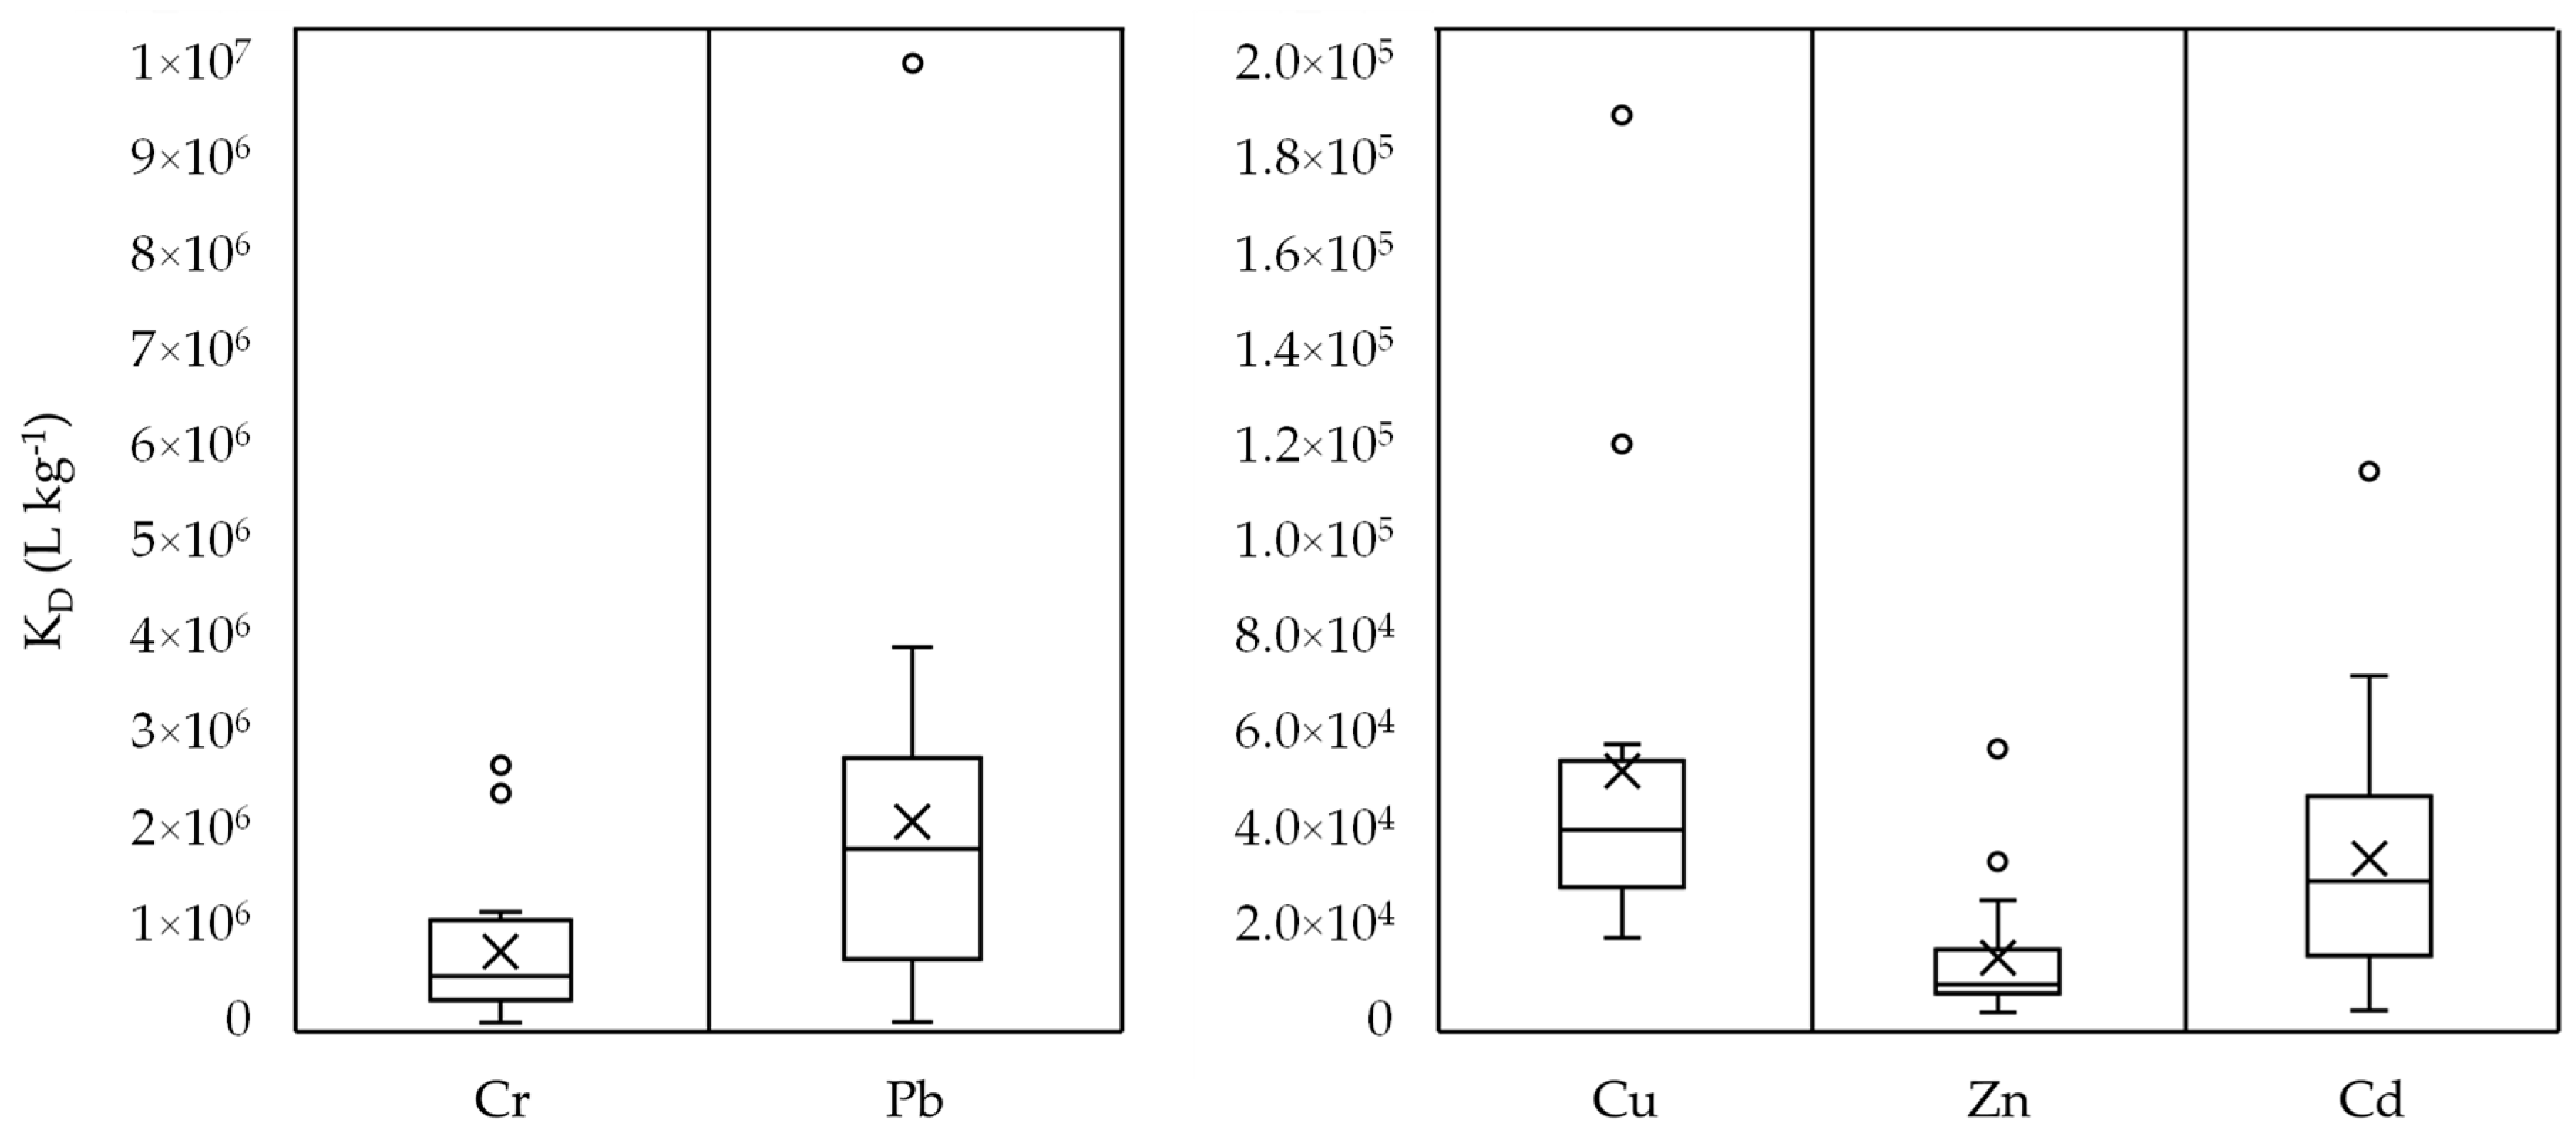
Figure 8 shows the distribution of the corresponding equilibrium partitioning coefficients. Here as well the highest values can be seen for Pb and Cr that supports their high affinity for the particulate-bound phase as it is often documented in the literature. A large dataset of heavy metal contamination in traffic areas examined by Huber et al. [8] highlights that Pb is mostly transported particulate-bound whereas Cu and Zn show a more intermediate behavior. This is also applicable to the results of this study, as can be seen from the Kd values for Cu and Zn. Cadmium could be added to this list as it shows similar values as Cu and shows a high mobility in stormwater runoff even at low concentrations [50]. The order of metals in relation to the highest affinity for particulate phase in this study is: Pb > Cr > Cu > Cd > Zn. This is almost the opposite to the before mentioned order of highest metal mobility.
The results of this study show, that metals in urban runoff are transported particulate bound as well as in the dissolved fraction and therefore in other more polluted catchments an extensive stormwater treatment requires a combination of sedimentation or filtration for the particulate-bound fraction as well as an adsorption step for the dissolved fraction.
3.5. Particle Size Relationship of Metals
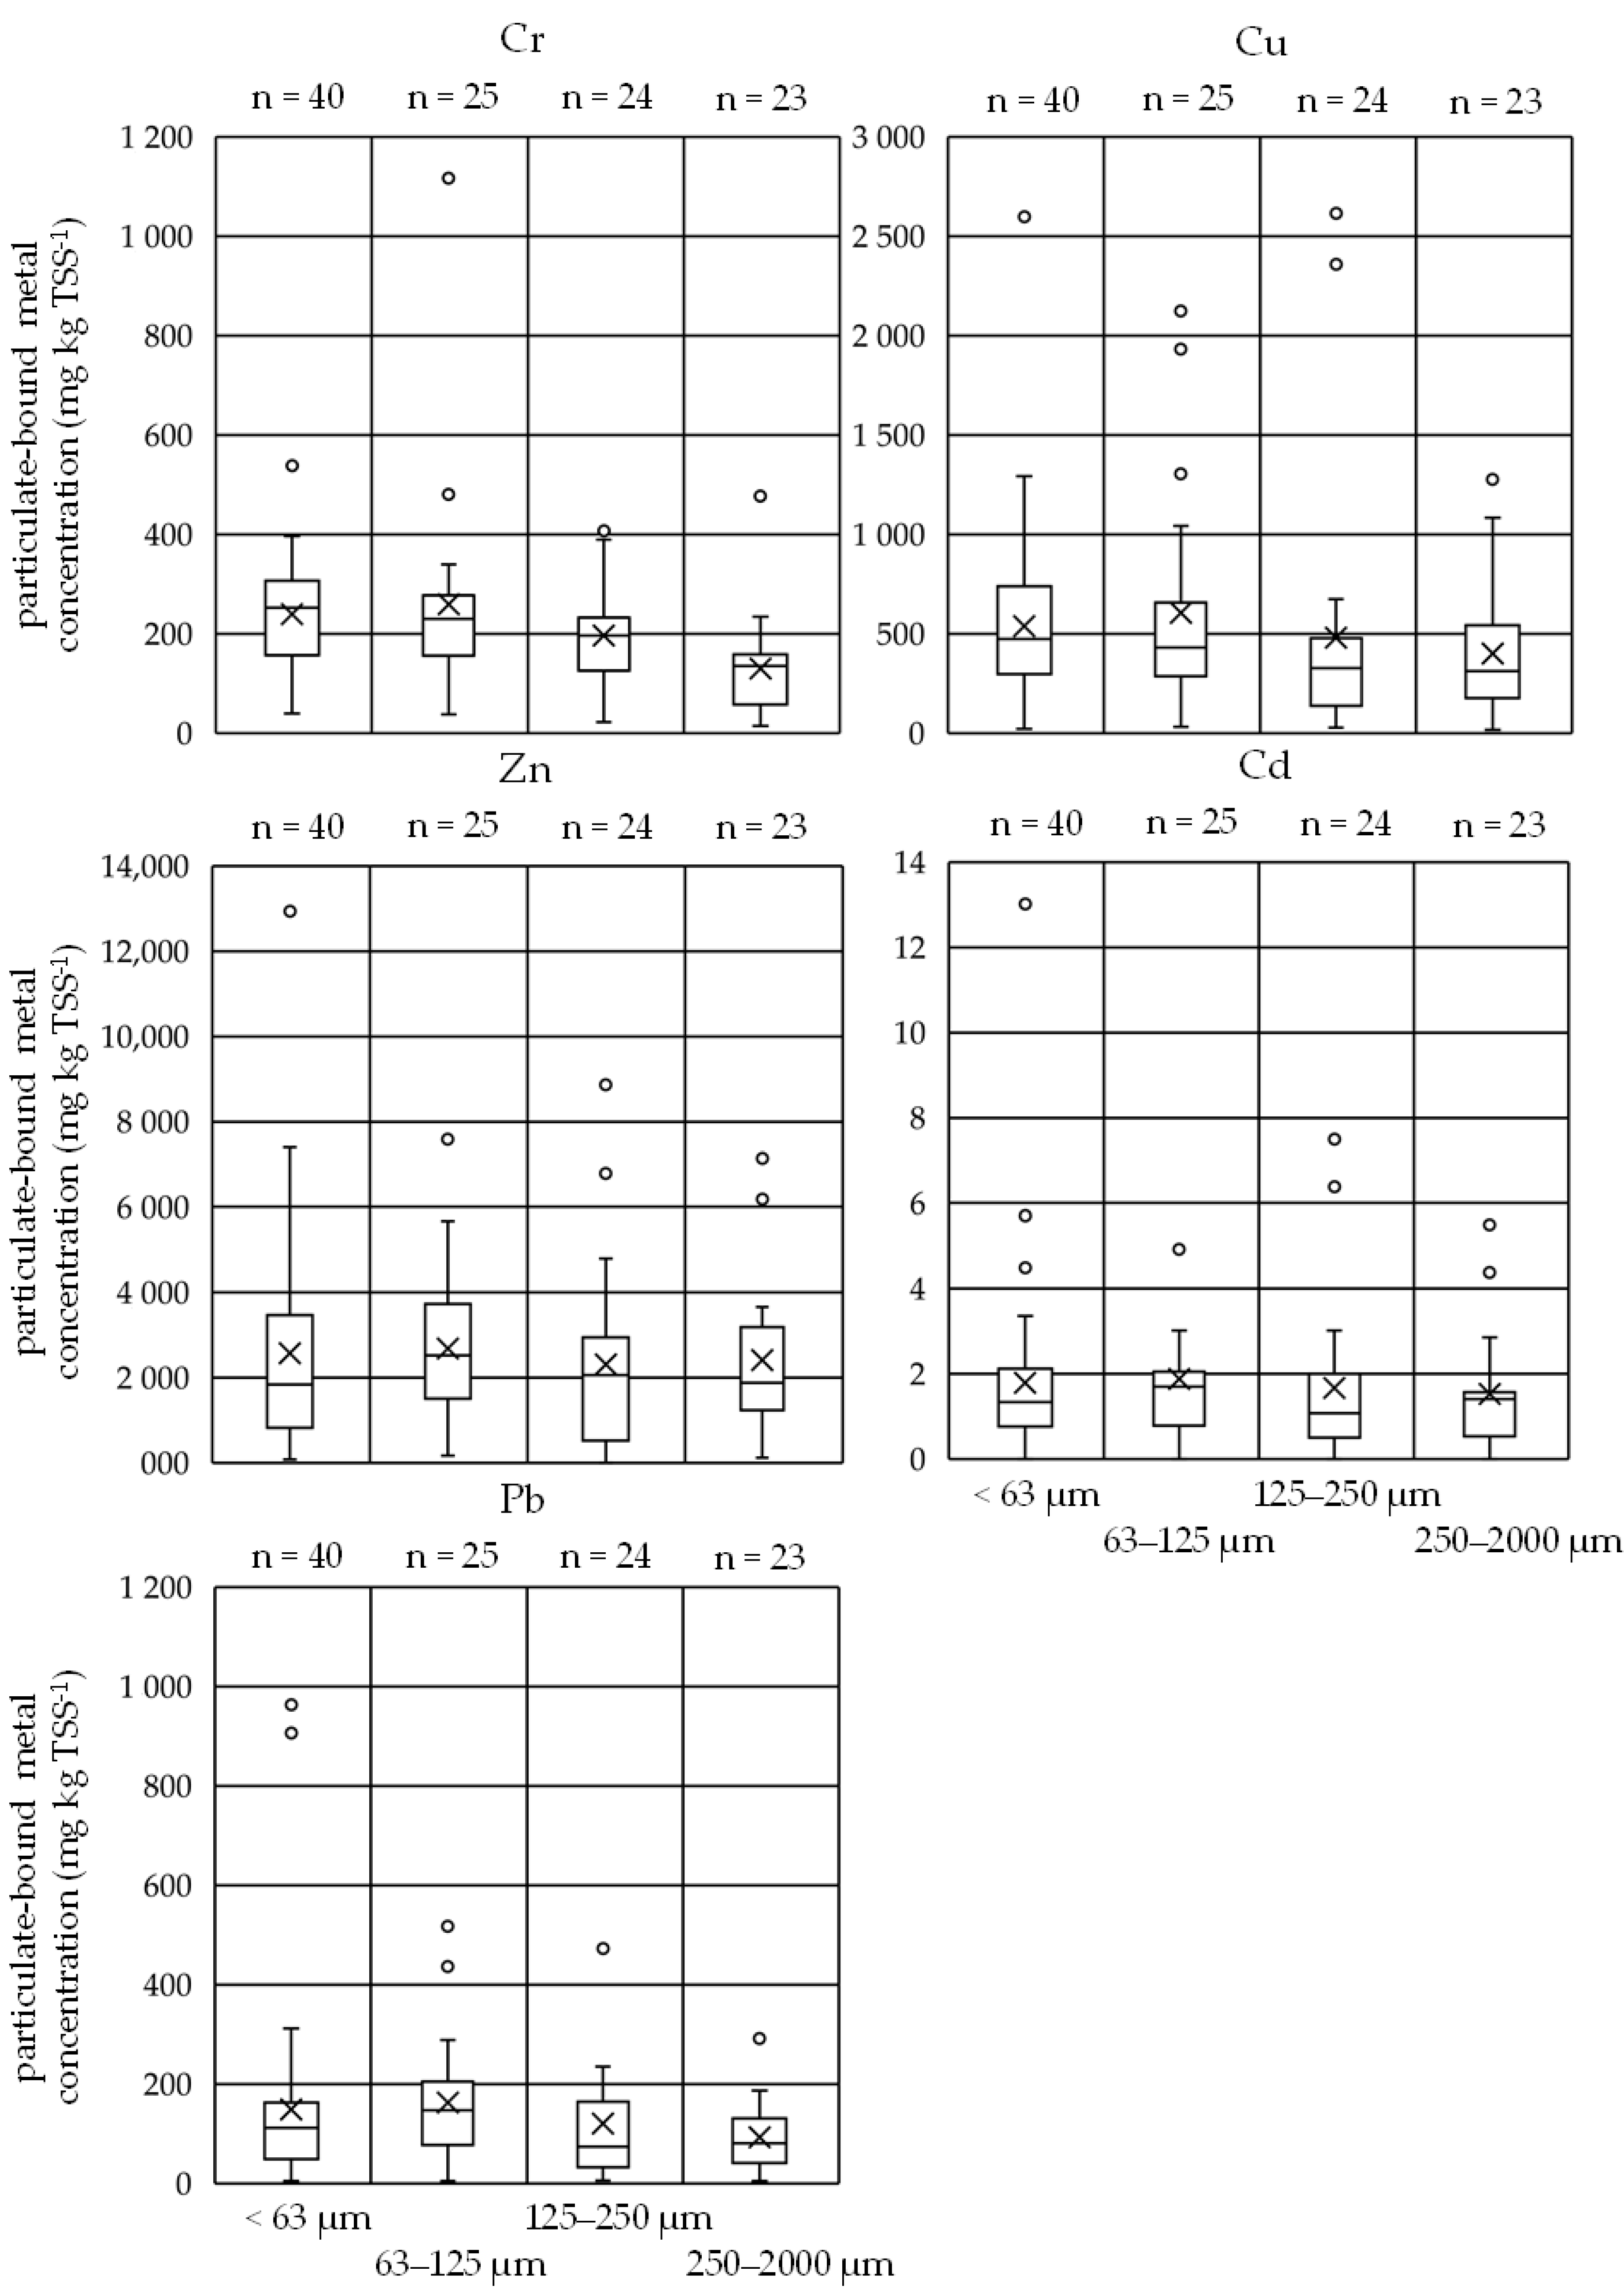
In literature, it is often suggested that the smallest particles are contaminated the most [50,55,56,57,58]. As already shown in Table 1, in this study the highest event mean concentrations for all of the investigated metals can be found in the size fraction 0.45–63 µm. However, TSS also shows the highest concentrations in this particle size fraction. Therefore, the particulate bound metal concentration as mass of metal per mass of particulate matter was further investigated on a sample basis. The results can be seen in Figure 9. Contrary to the common understanding, that the fine fraction is loaded disproportionally high with pollutants, the particulate matter in this study shows rather uniform particulate bound metal concentrations over the first three particle size fractions. The median concentration in the largest particle size fraction shows lower values. However, this fraction is by far the widest. Chromium is the sole metal that clearly shows an inverse relation between metal concentration and particle size, when referring to the median values. Copper has similar concentrations for <63 µm and 63–125 µm and slightly lower concentrations in the fraction 125–250 µm and 250–2000 µm. A similar trend can be seen for Cd. Zinc and Pb both show higher concentrations in the fraction of 125–250 µm. Across all particle size fractions, the metal concentrations are in the following order: Zn > Cu > Cr > Pb > Cd. A most recent similar study in China on metals associated with road dust, shows comparable uniform results over the particle size fraction of <75 µm, 75–125 µm, and 125–250 µm but with a different order: Cr > Zn > Cu > Pb > Cd [59]. Interestingly, Pb and Cu change their positions in the 500–1000 µm size class. The different order can possibly be explained by the catchment. Zn is often used in building materials (e.g., for roofs) and paints (e.g., for facades) [51] and therefore it is more likely to be found in the stormwater runoff of the catchment in this study than in road dust.
The shown distribution of particulate bound metal concentration over different particle size fractions could be explained by the organic content of the PM. In Figure 5 it can be seen that the organic content increase with the particle size. Therefore it could be assumed that the particle size fraction <63 µm has a high adsorption potential due to its relatively large specific surface area [60], whereas the pollutants adsorb to the larger particle size fractions to an equal extent due to the higher organic content [61,62,63]. Niu et al. [59] also mention that the size fraction content changed depending on element and land use. For example, in industrial areas the investigated metals tend to be more associated with coarser particles. Although the particle size fractions investigated in this study, show a uniform distribution of particulate bound metal concentration, the highest metal load comes with the particle size fraction <63 µm (highest EMC and highest amount of particles, see Table 1 and Figure 4).
3.6. Suitability of TSS as a Proxy for Metal Contamination
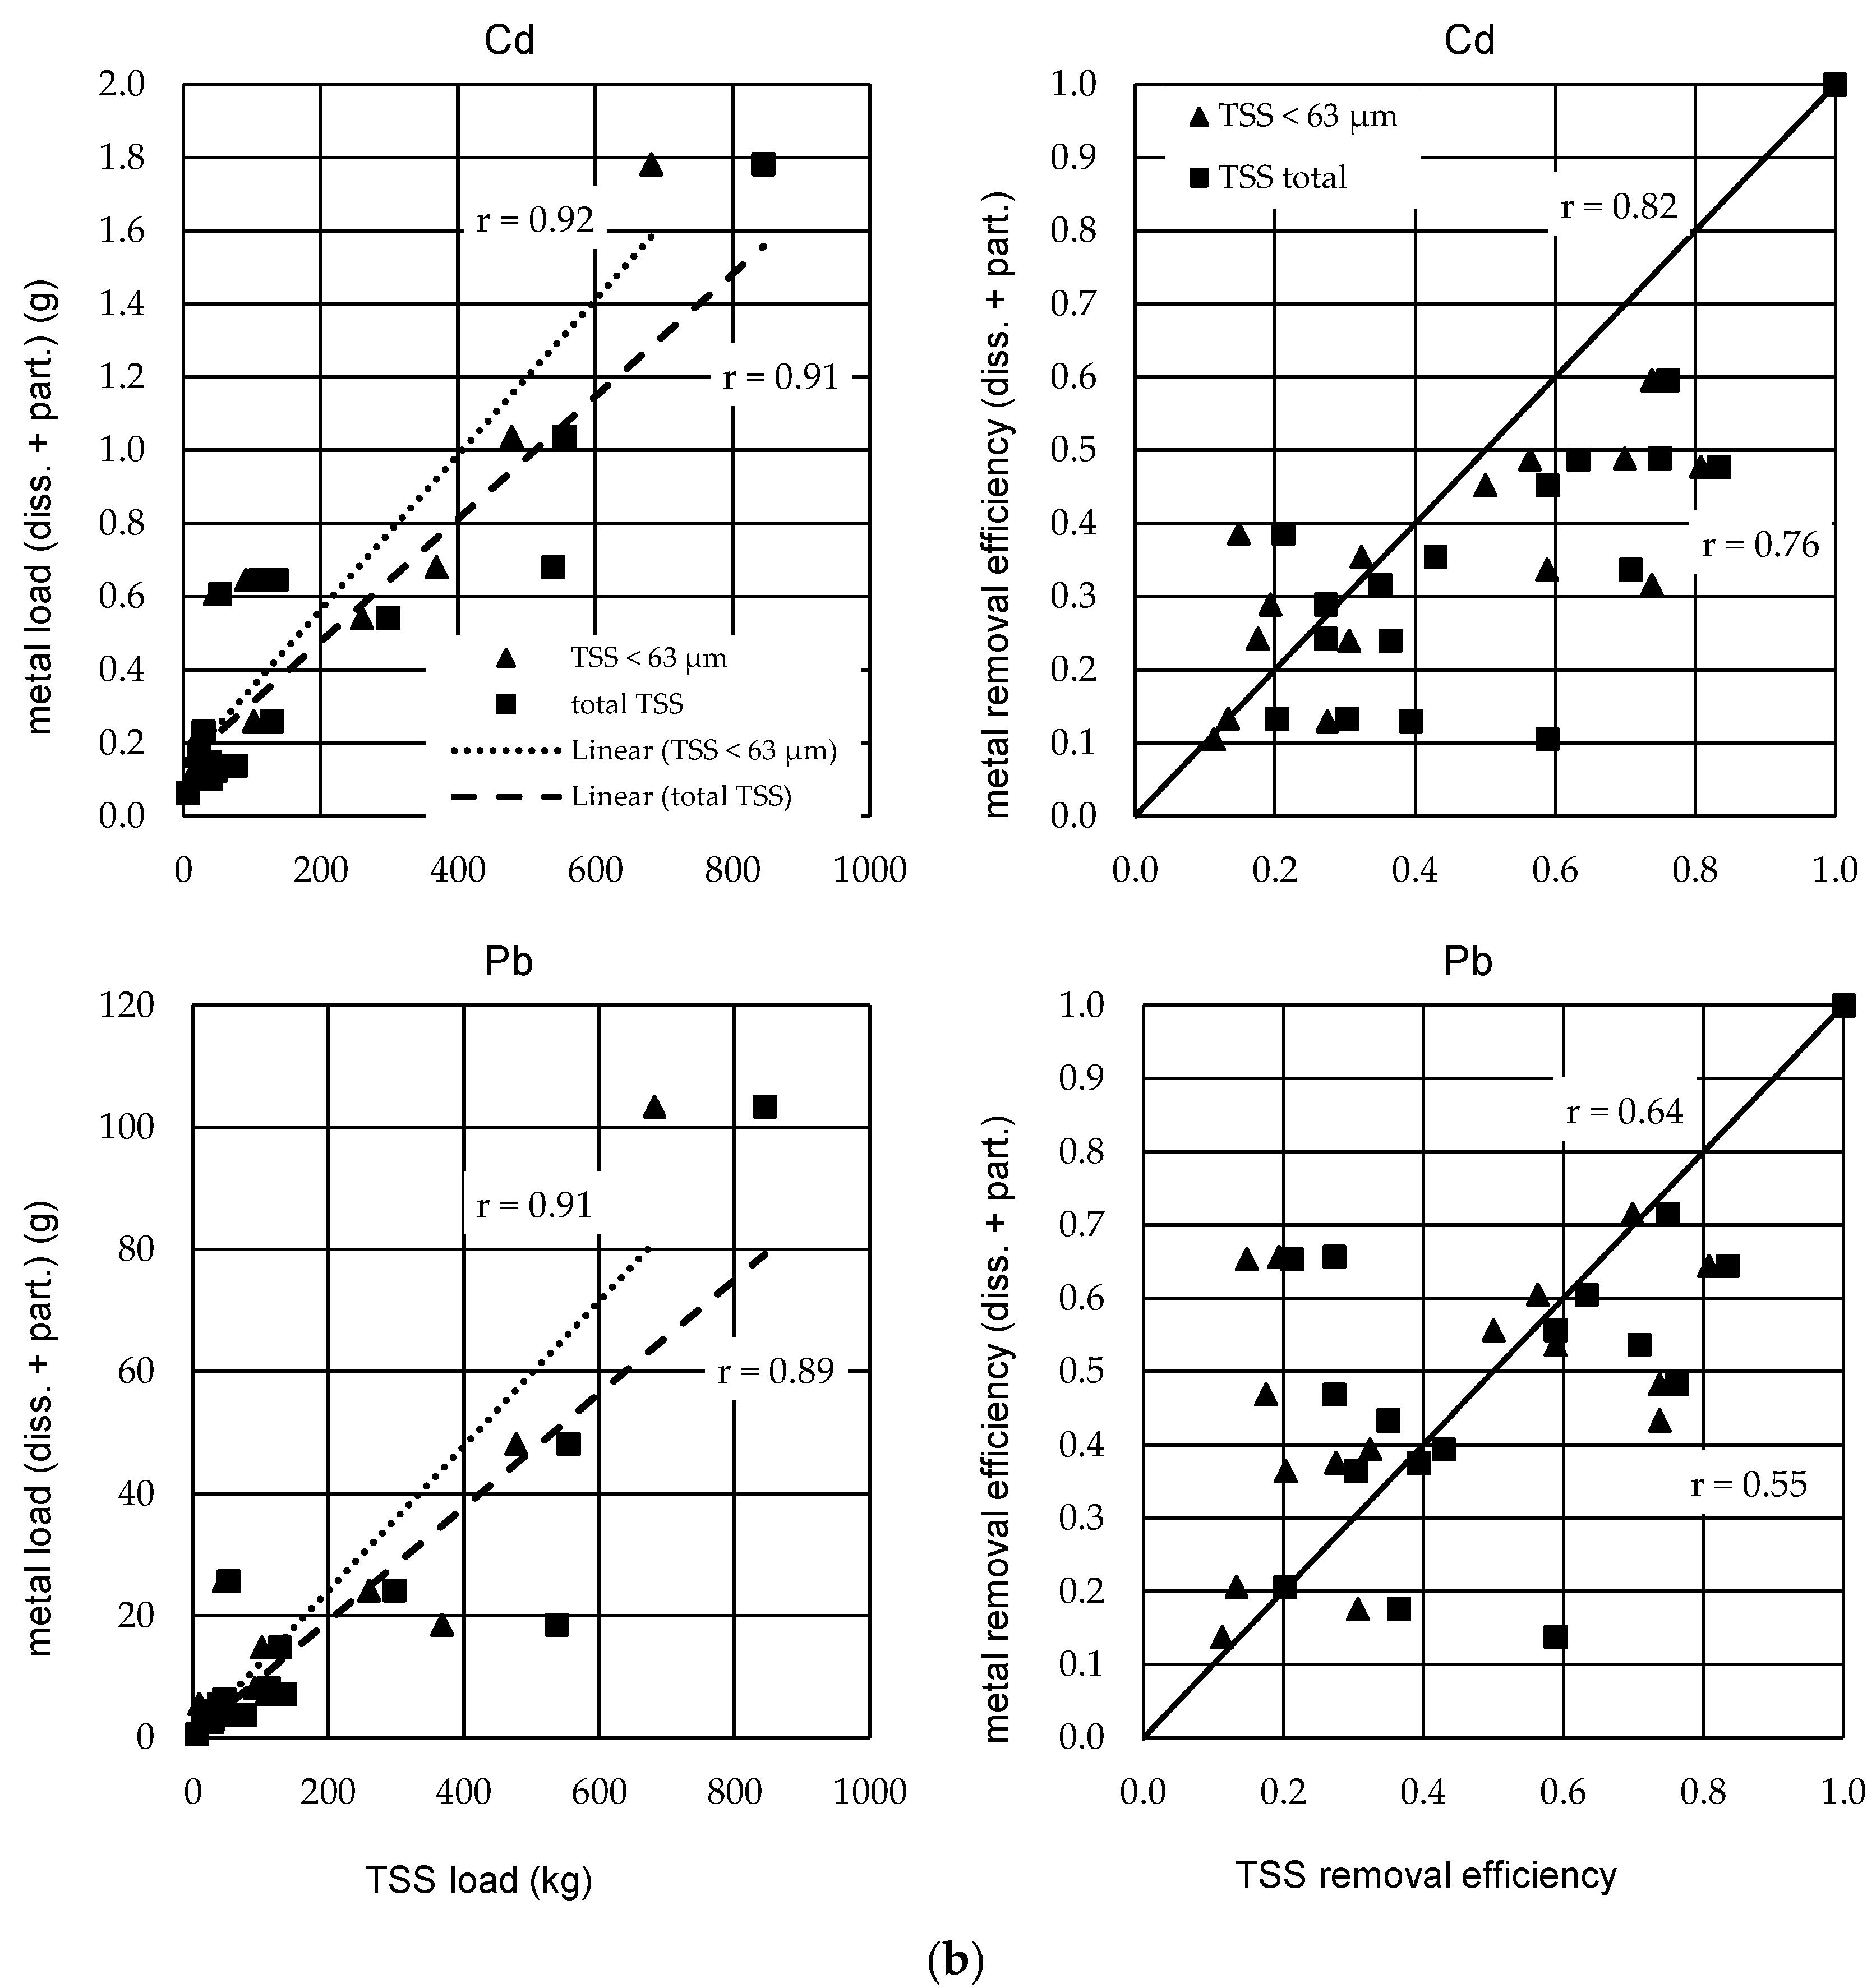
Metal contamination in urban stormwater runoff is mostly transported by PM washed off from different surfaces [7,8]. It is therefore obvious to use the particulate matter parameter TSS as a substitute for particulate-bound contamination in urban stormwater runoff. The correlations of the metal loads (dissolved + particulate) with the particulate matter loads in Figure 10a,b are also supporting this approach. However, in view of the partitioning of different metals between the aqueous and solid phases, which is heavily dependent on site-specific conditions (see Section 3.5), the question arises as to whether the assumption, that with the removal of TSS a significant amount of particulate pollutants can be removed as well, is generally correct. Hence, the assumption should also apply to the effectiveness of treatment plants, since it depends on these how much of the pollution of the urban runoff ultimately reaches the aquatic environment. Here in particular, the distribution of metals in different particle size fractions is of particular importance. Classical sedimentation-based treatment plants show a rather poor treatment performance with regard to small solids. In this case, the metal contamination actually released into the environment would be underestimated if the solids were used in their entire particle size distribution as a substitute parameter. However, the limitation of a substitute parameter to the fine fraction is accompanied by the issue that the analysis of this fraction is extremely complex and can already be influenced by many factors during sampling as well as during the analysis steps in the laboratory [64].
In the following, the data collected in this study at the investigated stormwater treatment plant will be used to further elaborate the suitability of TSS as a substitute for metal contamination. Figure 10a,b compare the already mentioned positive correlation of metal load and particulate matter load with the respective correlation of the treatment efficiency. On the right side of the figures, the y-axis shows the event-based retention efficiency of the plant for the entire metal load (dissolved + particulate). This is compared to the retention efficiency of the particulate fraction shown on the x-axis. The particle size fractions 0.45–2000 µm (total TSS) and <63 µm (TSS < 63 µm) are shown. The Pearson correlation coefficient (r) is also shown as evaluation criterion. The particle size class <63 µm was selected because according to current guidelines in Germany the quantity of this fraction determines whether stormwater runoff requires treatment [25].
As already mentioned, the metal load correlates well with the load of PM for almost all metals investigated. Pearson correlation coefficients (r) ranging from 0.82 to 0.94. In particular higher r values are obtained for the <63 µm size fraction, underlining the German decision. For Cr, the correlation with total TSS is slightly better. However, it needs to be mentioned that as for the correlation shown in the left site of the figures, the differences between total TSS and TSS < 63 µm are minor. Zn, as was to be expected due to its documented tendency towards the aqueous phase, shows the worst correlation. The p-values of this correlation are ranging from 8.22 × 10⁻¹⁰ to 5.63 × 10⁻⁵. They are smaller than 0.05 (level of significance) and therefore the correlation is assumed significant. The correlated loads and the individual p-values are listed in the supplementary material (Tables S5 and S6).
If looking at the correlations in the right section of the figures, a slightly different picture emerges. Pearson correlation coefficients ranging from 0.55 to 0.89 with p-values ranging from 1.33 × 10⁻⁶ to 2.36 × 10⁻². It can be seen that although the metal load is closely related to the solid load, the retention efficiency of the metal load is significantly different from the retention efficiency of the solid load. The drawn line represents the bisector, making it more obvious that the removal efficiency of the total metal load is overestimated by both total TSS and TSS < 63 µm. This effect can be explained due to a certain proportion of the metals being transported in the aqueous phase.
In summary, on basis of the conducted research, it can be noted that TSS provides a sufficiently good representation of metals in terms of transported load. The limitation to the fine fraction of TSS could be even more appropriate, but in terms of the practicability with regard to sampling campaigns, it might be questionable. However, the representation of metals by TSS in terms of treatment efficiency is not sufficient. Moreover, in order to fully understand these relationships, due to the different impacts on partitioning as well as the uncertainties in estimating treatment efficiencies [65], further data from different catchment areas with different treatment facilities is needed.
4. Conclusions
The paper evaluated the results of a monitoring campaign at a central stormwater treatment facility with regard to the load of metals in the urban stormwater runoff. The aim was to test TSS and TSS < 63 µm as surrogate parameters for metal pollution in urban stormwater runoff.
The results of the study show that metal occurrence is represented by TSS to a certain extent and slightly better by TSS < 63 µm. The particulate bound metal concentrations (mass of metal per mass of particulate matter) of the finest fraction with metals does not differ greatly from the coarser particle fractions up to 250 µm. However, due to the high percentage of TSS < 63 µm in surface runoff this fraction also transports the largest percentage of metal loads (74–79%). This leads to low sedimentation efficiency with respect to metals. Furthermore, a relevant part of the metals is transported dissolved. If the reduction of metal emissions is of highest priority, sedimentation-based cleaning systems are not sufficient. In such cases, combinations of processes are needed.
Possible starting points for further research would be to investigate if the distribution of the metals over the particle size fractions is significantly influenced by their origin or application (e.g., specific particle sizes of brake abrasion, etc.). This would help to gain further insight into the adsorption of metals to particles of specific size fractions. Another research task would be to evaluate whether TSS as a proxy can also be used to compare different catchment areas or to draw conclusions from one to the other.
Supplementary Materials
The following are available online at https://www.mdpi.com/2073-4441/13/3/309/s1, Table S1. average recovery rates of certified reference material (CRM BCR-723 “Road Dust” and NIST 1640a, Table S2. characteristics of sampled rain events, Table S3. Sample specific event mean concentrations, pH, and temperature, Table S4. Sample specific treatment efficiencies for TSS, Cr, Cu, Zn, Cd and Pb, Table S5. TSS and total metal loads (particulate + dissolved). TSS loads given in kg and metal loads given in g, Table S6. Person correlation coefficients (r), t-test values and p-values for the correlation of TSS/TSS < 63 µm and total metal (particulate + dissolved) loads as well as TSS/TSS < 63 µm and mean metal treatment efficiencies (particulate + dissolved).
Author Contributions
Conceptualization, P.B., U.D., and B.K.; investigation, P.B. and B.K.; data curation, P.B.; writing—original draft preparation, P.B.; writing—review and editing, U.D.; visualization, P.B.; supervision, U.D.; project administration, U.D. and P.B.; funding acquisition, U.D. and P.B. All authors have read and agreed to the published version of the manuscript.
Funding
This research was funded by the Ministry of the Environment, Climate Protection, and the Energy Sector Baden-Württemberg, 407/2016.
Institutional Review Board Statement
Not applicable.
Informed Consent Statement
Not applicable.
Data Availability Statement
The data presented in this study are available on request from the corresponding author. The data are not publicly available due to privacy.
Acknowledgments
We would like to thank the Ministry of the Environment, Climate Protection, and the Energy Sector Baden-Württemberg for its financial support. We are grateful to Michael Mündlein and Christian Roth of bnNETZE GmbH for their constant and kind support before and during the measurements in Freiburg. We would also like to thank the many student employees, the workshop team of the teaching and research sewage treatment plant (LFKW) as well as the laboratory staff of the Institute for Sanitary Engineering, Water Quality, and Waste Management (ISWA) of the University of Stuttgart.
Conflicts of Interest
The authors declare no conflict of interest. The funders had no role in the design of the study; in the collection, analyses, or interpretation of data; in the writing of the manuscript, or in the decision to publish the results.
References
- Larsen, T.A.; Hoffmann, S.; Lüthi, C.; Truffer, B.; Maurer, M. Emerging solutions to the water challenges of an urbanizing world. Science 2016, 352, 928–933. [Google Scholar] [CrossRef]
- Makepeace, D.K.; Smith, D.W.; Stanley, S.J. Urban stormwater quality: Summary of contaminant data. Crit. Rev. Environ. Sci. Technol. 1995, 25, 93–139. [Google Scholar] [CrossRef]
- Holten Lützhøft, H.-C.; Eriksson, E.; Donner, E.; Wickman, T.; Banovec, P.; Mikkelsen, P.S.; Ledin, A. Quantifying Releases of Priority Pollutants from Urban Sources. Proc. Water Environ. Fed. 2009, 2009, 5873–5891. [Google Scholar] [CrossRef]
- Hvitved-Jacobsen, T.; Vollertsen, J.; Nielsen, A.H. Urban and Highway Stormwater Pollution. Concepts and Engineering; CRC Press; Taylor & Francis: Boca Raton, FL, USA, 2010; ISBN 1439826854. [Google Scholar]
- Davis, A.P.; Shokouhian, M.; Ni, S. Loading estimates of lead, copper, cadmium, and zinc in urban runoff from specific sources. Chemosphere 2001, 44, 997–1009. [Google Scholar] [CrossRef]
- McKenzie, E.R.; Money, J.E.; Green, P.G.; Young, T.M. Metals associated with stormwater-relevant brake and tire samples. Sci. Total Environ. 2009, 407, 5855–5860. [Google Scholar] [CrossRef] [Green Version]
- Gromaire, M.C.; Garnaud, S.; Gonzalez, A.; Chebbo, G. Charecterisation of urban runoff pollution in Paris. Water Sci. Technol. 1999, 39, 1–8. [Google Scholar] [CrossRef]
- Huber, M.; Welker, A.; Helmreich, B. Critical review of heavy metal pollution of traffic area runoff: Occurrence, influencing factors, and partitioning. Sci. Total Environ. 2016, 541, 895–919. [Google Scholar] [CrossRef]
- Grant, S.B.; Rekhi, N.V.; Pise, N.R.; Reeves, R.L.; Matsumoto, M.; Wistrom, A.; Moussa, L.; Bay, S.; Kayhanian, M. A Review of the Contaminants and Toxicity Associated with Particles in Stormwater Runoff. Terminology 2003, 2, 2. [Google Scholar]
- Gunawardana, C.; Egodawatta, P.; Goonetilleke, A. Role of particle size and composition in metal adsorption by solids deposited on urban road surfaces. Environ. Pollut. 2014, 184, 44–53. [Google Scholar] [CrossRef] [Green Version]
- Drapper, D.; Tomlinson, R.; Williams, P. Pollutant Concentrations in Road Runoff: Southeast Queensland Case Study. J. Environ. Eng. 2000, 126, 313–320. [Google Scholar] [CrossRef]
- Zhang, H.; Wang, Z.; Zhang, Y.; Ding, M.; Li, L. Identification of traffic-related metals and the effects of different environments on their enrichment in roadside soils along the Qinghai-Tibet highway. Sci. Total Environ. 2015, 521–522, 160–172. [Google Scholar] [CrossRef] [PubMed]
- Qian, P.; Zheng, X.; Zhou, L.; Jiang, Q.; Zhang, G.; Yang, J. Magnetic Properties as Indicator of Heavy Metal Contaminations in Roadside Soil and Dust along G312 Highways. Procedia Environ. Sci. 2011, 10, 1370–1375. [Google Scholar] [CrossRef] [Green Version]
- Sabin, L.D.; Lim, J.H.; Stolzenbach, K.D.; Schiff, K.C. Contribution of trace metals from atmospheric deposition to stormwater runoff in a small impervious urban catchment. Water Res. 2005, 39, 3929–3937. [Google Scholar] [CrossRef] [PubMed]
- Wang, Q.; Liu, M.; Li, Y.; Liu, Y.; Li, S.; Ge, R. Dry and wet deposition of polycyclic aromatic hydrocarbons and comparison with typical media in urban system of Shanghai, China. Atmos. Environ. 2016, 144, 175–181. [Google Scholar] [CrossRef]
- Bannerman, R.T.; Owens, D.W.; Dodds, R.B.; Hornewer, N.J. Sources of pollutants in Wisconsin stormwater. Water Sci. Technol. 1993, 28, 241–259. [Google Scholar] [CrossRef]
- Lygren, E.; Gjessing, E.; Berglind, L. Pollution transport from a highway. Sci. Total Environ. 1984, 33, 147–159. [Google Scholar] [CrossRef]
- Bian, B.; Zhu, W. Particle size distribution and pollutants in road-deposited sediments in different areas of Zhenjiang, China. Environ. Geochem. Health 2009, 31, 511–520. [Google Scholar] [CrossRef]
- Li, H.; Shi, A.; Zhang, X. Particle size distribution and characteristics of heavy metals in road-deposited sediments from Beijing Olympic Park. J. Environ. Sci. 2015, 32, 228–237. [Google Scholar] [CrossRef]
- Gunawardana, C.; Goonetilleke, A.; Egodawatta, P.; Dawes, L.; Kokot, S. Source characterisation of road dust based on chemical and mineralogical composition. Chemosphere 2012, 87, 163–170. [Google Scholar] [CrossRef] [Green Version]
- Sansalone, J.J.; Buchberger, S.G. Partitioning and First Flush of Metals in Urban Roadway Storm Water. J. Environ. Eng. 1997, 123, 134–143. [Google Scholar] [CrossRef]
- Charters, F.J.; Cochrane, T.A.; O’Sullivan, A.D. Particle size distribution variance in untreated urban runoff and its implication on treatment selection. Water Res. 2015, 85, 337–345. [Google Scholar] [CrossRef] [PubMed]
- Hilliges, R.; Schriewer, A.; Helmreich, B. A three-stage treatment system for highly polluted urban road runoff. J. Environ. Manag. 2013, 128, 306–312. [Google Scholar] [CrossRef] [PubMed]
- Maniquiz-Redillas, M.; Kim, L.-H. Fractionation of heavy metals in runoff and discharge of a stormwater management system and its implications for treatment. J. Environ. Sci. 2014, 26, 1214–1222. [Google Scholar] [CrossRef]
- DWA/BWK. Arbeitsblatt DWA-A 102-2/BWK-A 3-2 Grundsätze zur Bewirtschaftung und Behandlung von Regenwetterabflüssen zur Einleitung in Oberflächengewässer–Teil 2: Emissionsbezogene Bewertungen und Regelungen; Deutsche Vereinigung für Wasserwirtschaft, Abwasser und Abfall: Hennef, Germany, 2020; ISBN 9783968620466. [Google Scholar]
- Garten- und Tiefbauamt der Stadt Freiburg—Abteilung Verkehrsplanung. Radverkehrskonzept Freiburg 2020. Anhang 3—Maßnahmenbeschreibungen. 2012. Available online: https://www.freiburg.de/pb/site/Freiburg/get/params_E-1121863396/431691/08b_Beschreibungen.pdf (accessed on 15 December 2020).
- Schmiedgruber, M. Erstellung Eines Bilanzmodells für Eine Regenwasserbehandlunsanlage. Bachelor’s Thesis, Universität Stuttgart, Stuttgart, Germany, 2015. [Google Scholar]
- Charters, F.J.; Cochrane, T.A.; O’Sullivan, A.D. Characterising urban zinc generation to identify surface pollutant hotspots in a low intensity rainfall climate. Water Sci. Technol. 2017, 76, 1370–1377. [Google Scholar] [CrossRef]
- Egodawatta, P.; Ziyath, A.M.; Goonetilleke, A. Characterising metal build-up on urban road surfaces. Environ. Pollut. 2013, 176, 87–91. [Google Scholar] [CrossRef] [Green Version]
- Bertrand-Krajewski, J.-L.; Chebbo, G.; Saget, A. Distribution of pollutant mass vs. volume in stormwater discharges and the first flush phenomenon. Water Res. 1998, 32, 2341–2356. [Google Scholar] [CrossRef]
- Deletic, A. The first flush load of urban surface runoff. Water Res. 1998, 32, 2462–2470. [Google Scholar] [CrossRef]
- Lee, J.H.; Bang, K.W.; Ketchum, L.H.; Choe, J.S.; Yu, M.J. First flush analysis of urban storm runoff. Sci. Total Environ. 2002, 293, 163–175. [Google Scholar] [CrossRef]
- Huber, W.C. Contaminant transport in surface water. In Handbook of Hydrology, 6th ed.; Maidment, D.R., Ed.; McGraw-Hill: New York, NY, USA, 1997; ISBN 0070397325. [Google Scholar]
- Thomann, R.V.; Mueller, J.H. Principles of Surface Water Quality Modeling and Control; Harper & Row, Publishers: New York, NY, USA, 1987; ISBN 9780060466770. [Google Scholar]
- Hong, Y.; Bonhomme, C.; Le, M.-H.; Chebbo, G. New insights into the urban washoff process with detailed physical modelling. Sci. Total Environ. 2016, 573, 924–936. [Google Scholar] [CrossRef]
- Zhao, H.; Li, X. Understanding the relationship between heavy metals in road-deposited sediments and washoff particles in urban stormwater using simulated rainfall. J. Hazard. Mater. 2013, 246–247, 267–276. [Google Scholar] [CrossRef]
- Vaze, J.; Chiew, F.H. Experimental study of pollutant accumulation on an urban road surface. Urban Water 2002, 4, 379–389. [Google Scholar] [CrossRef]
- Gelhardt, L.; Huber, M.; Welker, A. Development of a Laboratory Method for the Comparison of Settling Processes of Road-Deposited Sediments with Artificial Test Material. Water Air Soil Pollut. 2017, 228, 849. [Google Scholar] [CrossRef]
- Kayhanian, M.; McKenzie, E.R.; Leatherbarrow, J.E.; Young, T.M. Characteristics of road sediment fractionated particles captured from paved surfaces, surface run-off and detention basins. Sci. Total Environ. 2012, 439, 172–186. [Google Scholar] [CrossRef] [PubMed]
- Furumai, H.; Balmer, H.; Boller, M. Dynamic behavior of suspended pollutants and particle size distribution in highway runoff. Water Sci. Technol. 2002, 46, 413–418. [Google Scholar] [CrossRef] [PubMed]
- Wu, J.; Ren, Y.; Wang, X.; Wang, X.; Chen, L.; Liu, G. Nitrogen and phosphorus associating with different size suspended solids in roof and road runoff in Beijing, China. Environ. Sci. Pollut. Res. Int. 2015, 22, 15788–15795. [Google Scholar] [CrossRef] [PubMed]
- Sansalone, J.J.; Kim, J.-Y. Suspended particle destabilization in retained urban stormwater as a function of coagulant dosage and redox conditions. Water Res. 2008, 42, 909–922. [Google Scholar] [CrossRef] [PubMed]
- Anta, J.; Peña, E.; Suárez, J.; Cagiao, J. A BMP selection process based on the granulometry of runoff solids in a separate urban catchment. Water SA 2006, 32, 419–428. [Google Scholar] [CrossRef] [Green Version]
- Selbig, W.; Fienen, M.; Horwatich, J.; Bannerman, R.T. The Effect of Particle Size Distribution on the Design of Urban Stormwater Control Measures. Water 2016, 8, 17. [Google Scholar] [CrossRef] [Green Version]
- Droppo, I.G.; Irvine, K.N.; Jaskot, C. Flocculation/aggregation of cohesive sediments in the urban continuum: Implications for stormwater management. Environ. Technol. 2002, 23, 27–41. [Google Scholar] [CrossRef]
- Tisdall, J.M.; Oades, J.M. Organic matter and water-stable aggregates in soils. J. Soil Sci. 1982, 33, 141–163. [Google Scholar] [CrossRef]
- Karickhoff, S.W.; Brown, D.S.; Scott, T.A. Sorption of hydrophobic pollutants on natural sediments. Water Res. 1979, 13, 241–248. [Google Scholar] [CrossRef]
- Lepom, P.; Brown, B.; Hanke, G.; Loos, R.; Quevauviller, P.; Wollgast, J. Needs for reliable analytical methods for monitoring chemical pollutants in surface water under the European Water Framework Directive. J. Chromatogr. A 2009, 1216, 302–315. [Google Scholar] [CrossRef] [PubMed]
- Directive 2013/39/EU of the European Parliament and of the Council of 12 August 2013 Amending Directives 2000/60/EC and 2008/105/EC as Regards Priority Substances in the Field of Water Policy. 2013. Available online: https://eur-lex.europa.eu/eli/dir/2013/39/oj (accessed on 25 January 2021).
- Jayarathne, A.; Egodawatta, P.; Ayoko, G.A.; Goonetilleke, A. Geochemical phase and particle size relationships of metals in urban road dust. Environ. Pollut. 2017, 230, 218–226. [Google Scholar] [CrossRef] [PubMed]
- Welker, A. Schadstoffströme im Urbanen Wasserkreislauf—Aufkommen und Verteilung, Insbesondere in den Abwasserentsorgungssystemen. Habilitation; TU Kaiserslautern: Kaiserslautern, Germany, 2005. [Google Scholar]
- Brombach, H.; Weiss, G.; Fuchs, S. A new database on urban runoff pollution: Comparison of separate and combined sewer systems. Water Sci. Technol. 2005, 51, 119–128. [Google Scholar] [CrossRef]
- Gnecco, I.; Palla, A.; Sansalone, J.J. Partitioning of zinc, copper and lead in urban drainage from paved source area catchments. J. Hydrol. 2019, 578, 124128. [Google Scholar] [CrossRef]
- Gunawardana, C.; Egodawatta, P.; Goonetilleke, A. Adsorption and mobility of metals in build-up on road surfaces. Chemosphere 2015, 119, 1391–1398. [Google Scholar] [CrossRef] [Green Version]
- Xanthopoulos, C.; Hahn, H.H. Pollutants attached to particles from drainage areas. Sci. Total Environ. 1990, 93, 441–448. [Google Scholar] [CrossRef]
- Sartor, J.D.; Boyd, G.B.; Agardy, F.J. Water Pollution Aspects of Street Surface Contaminants. J. Water Pollut. Control Fed. 1974, 46, 458–467. [Google Scholar]
- Sansalone, J.J.; Buchberger, S.G. Characterization of solid and metal element distributions in urban highway stormwater. Water Sci. Technol. 1997, 36, 155–160. [Google Scholar] [CrossRef]
- Roger, S.; Montrejaud-Vignoles, M.; Andral, M.; Herremans, L.; Fortune, J. Mineral, physical and chemical analysis of the solid matter carried by motorway runoff water. Water Res. 1998, 32, 1119–1125. [Google Scholar] [CrossRef]
- Niu, S.; Song, X.; Yu, J.; Wang, X.; Liana, J. Particle Size Dependent Heavy Metals in Road Dusts from Maanshan City, China. KSCE J. Civ. Eng. 2020, 24, 1411–1423. [Google Scholar] [CrossRef]
- Andral, M.C.; Roger, S.; Montréjaud-Vignoles, M.; Herremans, L. Particle Size Distribution and Hydrodynamic Characteristics of Solid Matter Carried by Runoff from Motorways. Water Environ. Res. 1999, 71, 398–407. [Google Scholar] [CrossRef]
- Charlesworth, S.M.; Lees, J.A. The distribution of heavy metals in deposited urban dusts and sediments, Coventry, England. Environ. Geochem. Health 1999, 21, 97–115. [Google Scholar] [CrossRef]
- Robertson, D.; Taylor, K.; Hoon, S. Geochemical and mineral magnetic characterisation of urban sediment particulates, Manchester, UK. Appl. Geochem. 2003, 18, 269–282. [Google Scholar] [CrossRef]
- Lair, G.J.; Gerzabek, M.H.; Haberhauer, G. Sorption of heavy metals on organic and inorganic soil constituents. Environ. Chem. Lett. 2007, 5, 23–27. [Google Scholar] [CrossRef]
- Baum, P.; Benisch, J.; Blumensaat, F.; Dierschke, M.; Dittmer, U.; Gelhardt, L.; Gruber, G.; Grüner, S.; Heinz, E.; Hofer, T.; et al. AFS63—Harmonisierungsbedarf und Empfehlungen für die labortechnische Bestimmung des neuen Parameters. In Regenwasser in Urbanen Räumen; Aqua Urbanica Trifft RegenwasserTage: Landau in der Pfalz, Germany, 2018; ISBN 978-3-95974-086-9. [Google Scholar]
- Langeveld, J.G.; Liefting, H.J.; Boogaard, F.C. Uncertainties of stormwater characteristics and removal rates of stormwater treatment facilities: Implications for stormwater handling. Water Res. 2012, 46, 6868–6880. [Google Scholar] [CrossRef] [Green Version]
Figure 1.
Catchment area of the monitored stormwater treatment facility. Industrial park “Freiburg Haid”.
Figure 1.
Catchment area of the monitored stormwater treatment facility. Industrial park “Freiburg Haid”.

Figure 2.
Technical drawing of the stormwater treatment facility with all aggregates in the initial position (dry weather conditions).
Figure 2.
Technical drawing of the stormwater treatment facility with all aggregates in the initial position (dry weather conditions).

Figure 3.
Schematic of the monitored stormwater treatment facility and it relevant flows (inflow, overflow and effluent). The flow to the receiving water consists of overflow and clearwater discharge.
Figure 3.
Schematic of the monitored stormwater treatment facility and it relevant flows (inflow, overflow and effluent). The flow to the receiving water consists of overflow and clearwater discharge.

Figure 4.
Comparison of particle size distribution. All cited studies investigated the particle size distribution of road runoff.
Figure 4.
Comparison of particle size distribution. All cited studies investigated the particle size distribution of road runoff.

Figure 5.
Distribution of the loss on ignition (LoI) on sample basis in four different particle size fractions (<63 µm, 63–125 µm, 125–250 µm, and 250–2000 µm).
Figure 5.
Distribution of the loss on ignition (LoI) on sample basis in four different particle size fractions (<63 µm, 63–125 µm, 125–250 µm, and 250–2000 µm).

Figure 6.
Distribution of metal event mean concentrations on an event basis (n = 17) distinguished between particulate-bound and dissolved fraction.
Figure 6.
Distribution of metal event mean concentrations on an event basis (n = 17) distinguished between particulate-bound and dissolved fraction.

Figure 7.
Distribution of the particulate fraction, fp, for chromium (Cr), copper (Cu), zinc (Zn), cadmium (Cd), and lead (Pb) on event basis (n = 17).
Figure 7.
Distribution of the particulate fraction, fp, for chromium (Cr), copper (Cu), zinc (Zn), cadmium (Cd), and lead (Pb) on event basis (n = 17).

Figure 8.
Equilibrium partitioning coefficient Kd (L kg−1) on event basis (n = 17). On the left for the metals chromium (Cr) and Lead (Pb). On the right for the metals copper (Cu), zinc (Zn), and cadmium (Cd).
Figure 8.
Equilibrium partitioning coefficient Kd (L kg−1) on event basis (n = 17). On the left for the metals chromium (Cr) and Lead (Pb). On the right for the metals copper (Cu), zinc (Zn), and cadmium (Cd).

Figure 9.
Distribution of particulate-bound metal concentrations in (mg “metal” kg TSS−1) per sample for the metals chromium (Cr), copper (Cu), zinc (Zn), cadmium (Cd), and lead (Pb) in four different particle size fractions (<63 µm, 63–125 µm, 125–250 µm, and 250–2000 µm).
Figure 9.
Distribution of particulate-bound metal concentrations in (mg “metal” kg TSS−1) per sample for the metals chromium (Cr), copper (Cu), zinc (Zn), cadmium (Cd), and lead (Pb) in four different particle size fractions (<63 µm, 63–125 µm, 125–250 µm, and 250–2000 µm).

Figure 10.
(a). Left: Correlation between total metal load (y-axis) and TSS load (x-axis) for <63 µm and total TSS (see key in first diagram). Right: Correlation between metal removal efficiency (y-axis) and TSS removal efficiency for <63 µm and total TSS. Line represents bisector, r values <63 µm top, r values total TSS bottom both for chromium (Cr), copper (Cu), zinc (Zn). (b). Same content as 10a.but for cadmium (Cd) and lead (Pb).


Table 1.
Descriptive statistics of solids, heavy metals, and mean treatment efficiency in the respective particle size fractions for samples collected in 2018 (n = 17). For metals, “total” includes the dissolved and the particulate-bound fraction. With SD as Standard Deviation and as mean treatment efficiency.
| TSS (mg L−1) | ||||||
| Min | Max | Mean | Median | SD | ||
| <63 µm | 7.52 | 191 | 43.2 | 27.4 | 44.6 | 0.21 |
| 63–125 µm | 0.54 | 23.6 | 5.58 | 2.66 | 6.5 | 0.46 |
| 125–250 µm | 0.50 | 87.6 | 8.28 | 2.05 | 20.4 | 0.48 |
| 250–2000 µm | 0.39 | 108 | 16.1 | 4.10 | 31.3 | 0.71 |
| total | 8.95 | 237 | 63.4 | 33.4 | 66.9 | 0.28 |
| Cr (µg L−1) | ||||||
| min | max | mean | median | SD | ||
| <63 µm | 1.19 | 27.2 | 9.47 | 6.52 | 7.76 | 0.23 |
| 63–125 µm | <0.1 | 7.56 | 1.49 | 0.56 | 2.18 | 0.38 |
| 125–250 µm | <0.1 | 5.57 | 0.98 | 0.31 | 3.70 | 0.52 |
| 250–2000 µm | <0.1 | 9.05 | 0.90 | 0.30 | 2.06 | 0.83 |
| total | 1.60 | 41.9 | 13.4 | 8.82 | 12.2 | 0.28 |
| dissolved | <0.1 | 3.19 | 0.61 | 0.28 | 0.73 | 0.20 |
| Cu (µg L−1) | ||||||
| min | max | mean | median | SD | ||
| <63 µm | 1.75 | 65.4 | 17.9 | 13.2 | 15.2 | 0.27 |
| 63–125 µm | 0.16 | 19.2 | 3.48 | 1.33 | 5.33 | 0.44 |
| 125–250 µm | <0.1 | 13.0 | 2.00 | 0.81 | 3.70 | 0.46 |
| 250–2000 µm | <0.1 | 18.2 | 2.18 | 0.81 | 4.12 | 0.73 |
| total | 14.3 | 108 | 36.3 | 26.3 | 26.6 | 0.28 |
| dissolved | 3.00 | 19.1 | 10.8 | 10.7 | 3.97 | 0.16 |
| Zn (µg L−1) | ||||||
| min | max | mean | median | SD | ||
| <63 µm | 14.7 | 323 | 92.9 | 61.1 | 83.7 | 0.26 |
| 63–125 µm | 1.40 | 131 | 18.0 | 8.07 | 32.4 | 0.47 |
| 125–250 µm | 1.24 | 63.7 | 9.13 | 4.35 | 14.8 | 0.51 |
| 250–2000 µm | 0.96 | 105 | 13.1 | 4.95 | 24.0 | 0.80 |
| total | 157 | 835 | 350 | 276 | 180 | 0.21 |
| dissolved | 71.3 | 399 | 217 | 212 | 87.6 | 0.14 |
| Cd (µg L−1) | ||||||
| min | max | mean | median | SD | ||
| <63 µm | <0.1 | 0.21 | <0.1 | <0.1 | <0.1 | 0.24 |
| 63–125 µm | <0.1 | <0.1 | <0.1 | <0.1 | <0.1 | 0.54 |
| 125–250 µm | <0.1 | <0.1 | <0.1 | <0.1 | <0.1 | 0.49 |
| 250–2000 µm | <0.1 | <0.1 | <0.1 | <0.1 | <0.1 | 0.72 |
| total | <0.1 | 0.58 | 0.18 | 0.12 | 0.14 | 0.23 |
| dissolved | <0.1 | 0.21 | <0.1 | <0.1 | <0.1 | 0.15 |
| Pb (µg L−1) | ||||||
| min | max | mean | median | SD | ||
| <63 µm | 0.20 | 18.7 | 4.64 | 3.11 | 4.69 | 0.28 |
| 63–125 µm | <0.1 | 6.64 | 0.99 | 0.37 | 1.72 | 0.44 |
| 125–250 µm | <0.1 | 3.90 | 0.57 | 0.19 | 1.03 | 0.45 |
| 250–2000 µm | <0.1 | 11.3 | 0.92 | 0.18 | 2.61 | 0.80 |
| total | 0.88 | 31.5 | 7.27 | 4.03 | 8.82 | 0.34 |
| dissolved | <0.1 | 1.28 | 0.15 | <0.1 | 0.29 | 0.11 |
Publisher’s Note: MDPI stays neutral with regard to jurisdictional claims in published maps and institutional affiliations. |
© 2021 by the authors. Licensee MDPI, Basel, Switzerland. This article is an open access article distributed under the terms and conditions of the Creative Commons Attribution (CC BY) license (http://creativecommons.org/licenses/by/4.0/).
Share and Cite
MDPI and ACS Style
Baum, P.; Kuch, B.; Dittmer, U. Adsorption of Metals to Particles in Urban Stormwater Runoff—Does Size Really Matter? Water 2021, 13, 309. https://doi.org/10.3390/w13030309
AMA Style
Baum P, Kuch B, Dittmer U. Adsorption of Metals to Particles in Urban Stormwater Runoff—Does Size Really Matter? Water. 2021; 13(3):309. https://doi.org/10.3390/w13030309
Chicago/Turabian StyleBaum, Philipp, Bertram Kuch, and Ulrich Dittmer. 2021. "Adsorption of Metals to Particles in Urban Stormwater Runoff—Does Size Really Matter?" Water 13, no. 3: 309. https://doi.org/10.3390/w13030309
Note that from the first issue of 2016, this journal uses article numbers instead of page numbers. See further details here.