
Effects of Vegetation Restoration on Regional Soil Moisture Content in the Humid Karst Areas—A Case Study of Southwest China


1
School of Geography and Environmental Science, Guizhou Normal University, Guiyang 550001, China
2
Ministry of Ecology and Environment Center for Satellite Application on Ecology and Environment, Beijing 100094, China
3
International Environmental Cooperation Center, Beijing 100035, China
*
Author to whom correspondence should be addressed.
Water 2021, 13(3), 321; https://doi.org/10.3390/w13030321
Submission received: 13 December 2020
/
Revised: 16 January 2021
/
Accepted: 22 January 2021
/
Published: 28 January 2021
(This article belongs to the Special Issue Effects of Land Use and Climate Changes on Water Resources)
Abstract
:Soil moisture is one of the restricting factors in the humid karst areas, which feature strong spatial heterogeneity. However, current research about the effects of vegetation restoration on soil moisture content have mainly focused on plot scale and slope scale, while these effects still remain unclear at regional scale in this area. Taking Southwest China as a case study and based on the land parameter data record (LPDR) and enhanced vegetation index (EVI) data set during 2002–2018, this study analyzed the spatiotemporal variation characteristics of vegetation and soil moisture content, and evaluated the effects of vegetation restoration on regional soil moisture content dynamics in paired years with similar precipitation conditions. The results showed that the EVI generally increased at a rate of 0.035/10a during 2002–2018, while the soil moisture was dominated by a drying trend at a variation rate of −0.0006 (cm3/cm3)/10a. The increasing trend of EVI accounted for 90.90% across the study area, whereas the decreasing trend of soil moisture accounted for 51.66%, and the increasing trend of soil moisture accounted for 48.34%. In addition, the decreasing trend of soil moisture coupled with an increasing trend of EVI distributed in most of the study area, especially in the homogenous limestone area. Our results demonstrate that there were remarkable vegetation restoration efforts in a series of ecological restoration projects, which resulted in a drying trend of the regional soil moisture content in the humid karst areas. The results suggest that it is necessary to consider reasonable vegetation planting density and suitable revegetation types to balance the relationship between vegetation water consumption and soil moisture supplementation in vegetation restoration practice in the humid karst areas.
1. Introduction
Soil water plays an important role in the terrestrial water cycle and the soil−plant−atmosphere continuum (SPAC), it is a key parameter in the hydrological and climatic models [1,2]. Due to the wide distribution and high chemical dissolution of the bedrock such as the carbonate rocks, these are usually characterized by numerous fissures and rich underground channels in the humid karst areas. The soil layers are very thin and with low water-holding capacity: most precipitation and surface water immediately infiltrate into the underground. Therefore, the soil moisture is usually deficient, which results in it being one of the restricting factors for vegetation restoration, crop growth and ecological construction in the humid karst areas [3,4,5].
Against the background of the karst’s fragile ecological environment, the soil erosion and rocky desertification were serious in the humid karst areas [6,7,8]. In recent decades, to protect the local ecological conditions, the state and local governments in China have launched a series of ecological restoration projects, including the Natural Forest Protection Project, the Grain for Green Project, and the Karst Rocky Desertification Comprehensive Control and Restoration Project [9,10,11,12]. Although there was remarkable regional vegetation restoration in this area, it also greatly changed local hydrological processes such as evapotranspiration and rainfall interception, and ultimately directly or indirectly affected the soil moisture content [13,14]. Therefore, the study of the effects of vegetation restoration on soil moisture content is of key importance for the management of water resources and vegetation restoration practices, and agricultural industrialization in the humid karst areas.
At present, the effects of vegetation restoration on soil moisture content in the humid karst areas have received increasing attention, and previous studies have mainly focused on the plot scale and slope scale. On the plot scale, the results of many researchers indicated that the soil moisture content was high in the grassland stage. For example, Li et al. found that the soil moisture content in grassland was higher than that in farmland [15]. Zhou et al. pointed out that, influenced by the characteristics of grassland such as shallow root systems, large vegetation coverage and slow water evaporation resulted in the grassland showed higher soil moisture holding capacity than bare land, woodland and shrubland [16]. On the slope scale, most of the results showed that the soil moisture content varied in different vegetation restoration stages. For example, Chen et al. found that the soil moisture content of forested land was higher than that of shrubland and grassland [17]. Chen et al. found that the soil moisture content of shrubland was higher than that of cultivated land and artificial forested land [18]. The publication by Sun et al. pointed out that soil moisture content was highest in shrubland, followed by cultivated land and grass land, lowest in forested land [19].
Influenced by the complex topography and diverse niche types of the ecological environment, the distribution of soil moisture content and its influential factors in the humid karst areas are features of strong spatial heterogeneity [20,21,22,23]. However, these conclusions obtained by field observations conducted at plot scale and slope scale can only represent the conditions of soil moisture content on a small scale and in a short time period, so they are unclear and fail to clarify the characteristics of the effects of vegetation restoration on soil moisture content in the humid karst areas at regional scale [24,25,26]. Therefore, it is necessary to study the effects of vegetation restoration on soil moisture content at regional scale, which is vital for vegetation restoration practices in humid karst areas.
In general, few studies have researched the effects of vegetation restoration on soil moisture content carried out at the regional scale in humid karst areas. Based on soil moisture content from reanalysis and ground stations, Deng et al. found that the soil moisture content was dominated by a drying trend during 1982–2015 [27]. In addition, the soil moisture content under different land cover types showed highest in forest, followed by wetland, agriculture, grassland, sparse vegetation, urban and bare area. Overall, soil moisture content experienced a decreasing trend in 1979–2017, with the soil moisture content of agricultural land and forest areas significantly reduced [28]. However, these studies mainly focused on the characteristics of the soil moisture content differences under different land cover types, which did not represent the process of vegetation restoration. Generally, the effects of vegetation restoration on regional soil moisture content are still unclear in humid karst areas.
Therefore, the purpose of this manuscript is to explore the effects of vegetation restoration on soil moisture content at the regional scale in humid karst areas. Based on the soil moisture content, EVI, and precipitation data set during 2002–2018, the spatiotemporal variation characteristics of EVI, soil moisture content, and precipitation were first analyzed. Then, the effects of vegetation afforestation on regional soil moisture content were quantitatively evaluated under similar precipitation conditions. The results of this study may not only provide scientific reference for evaluating the regional soil moisture-carrying capacity of vegetation restoration in humid karst areas, but also provide scientific guidance for further practices of vegetation planting density and spatial layout in the ecological construction.
2. Materials and Methods
2.1. Study Area
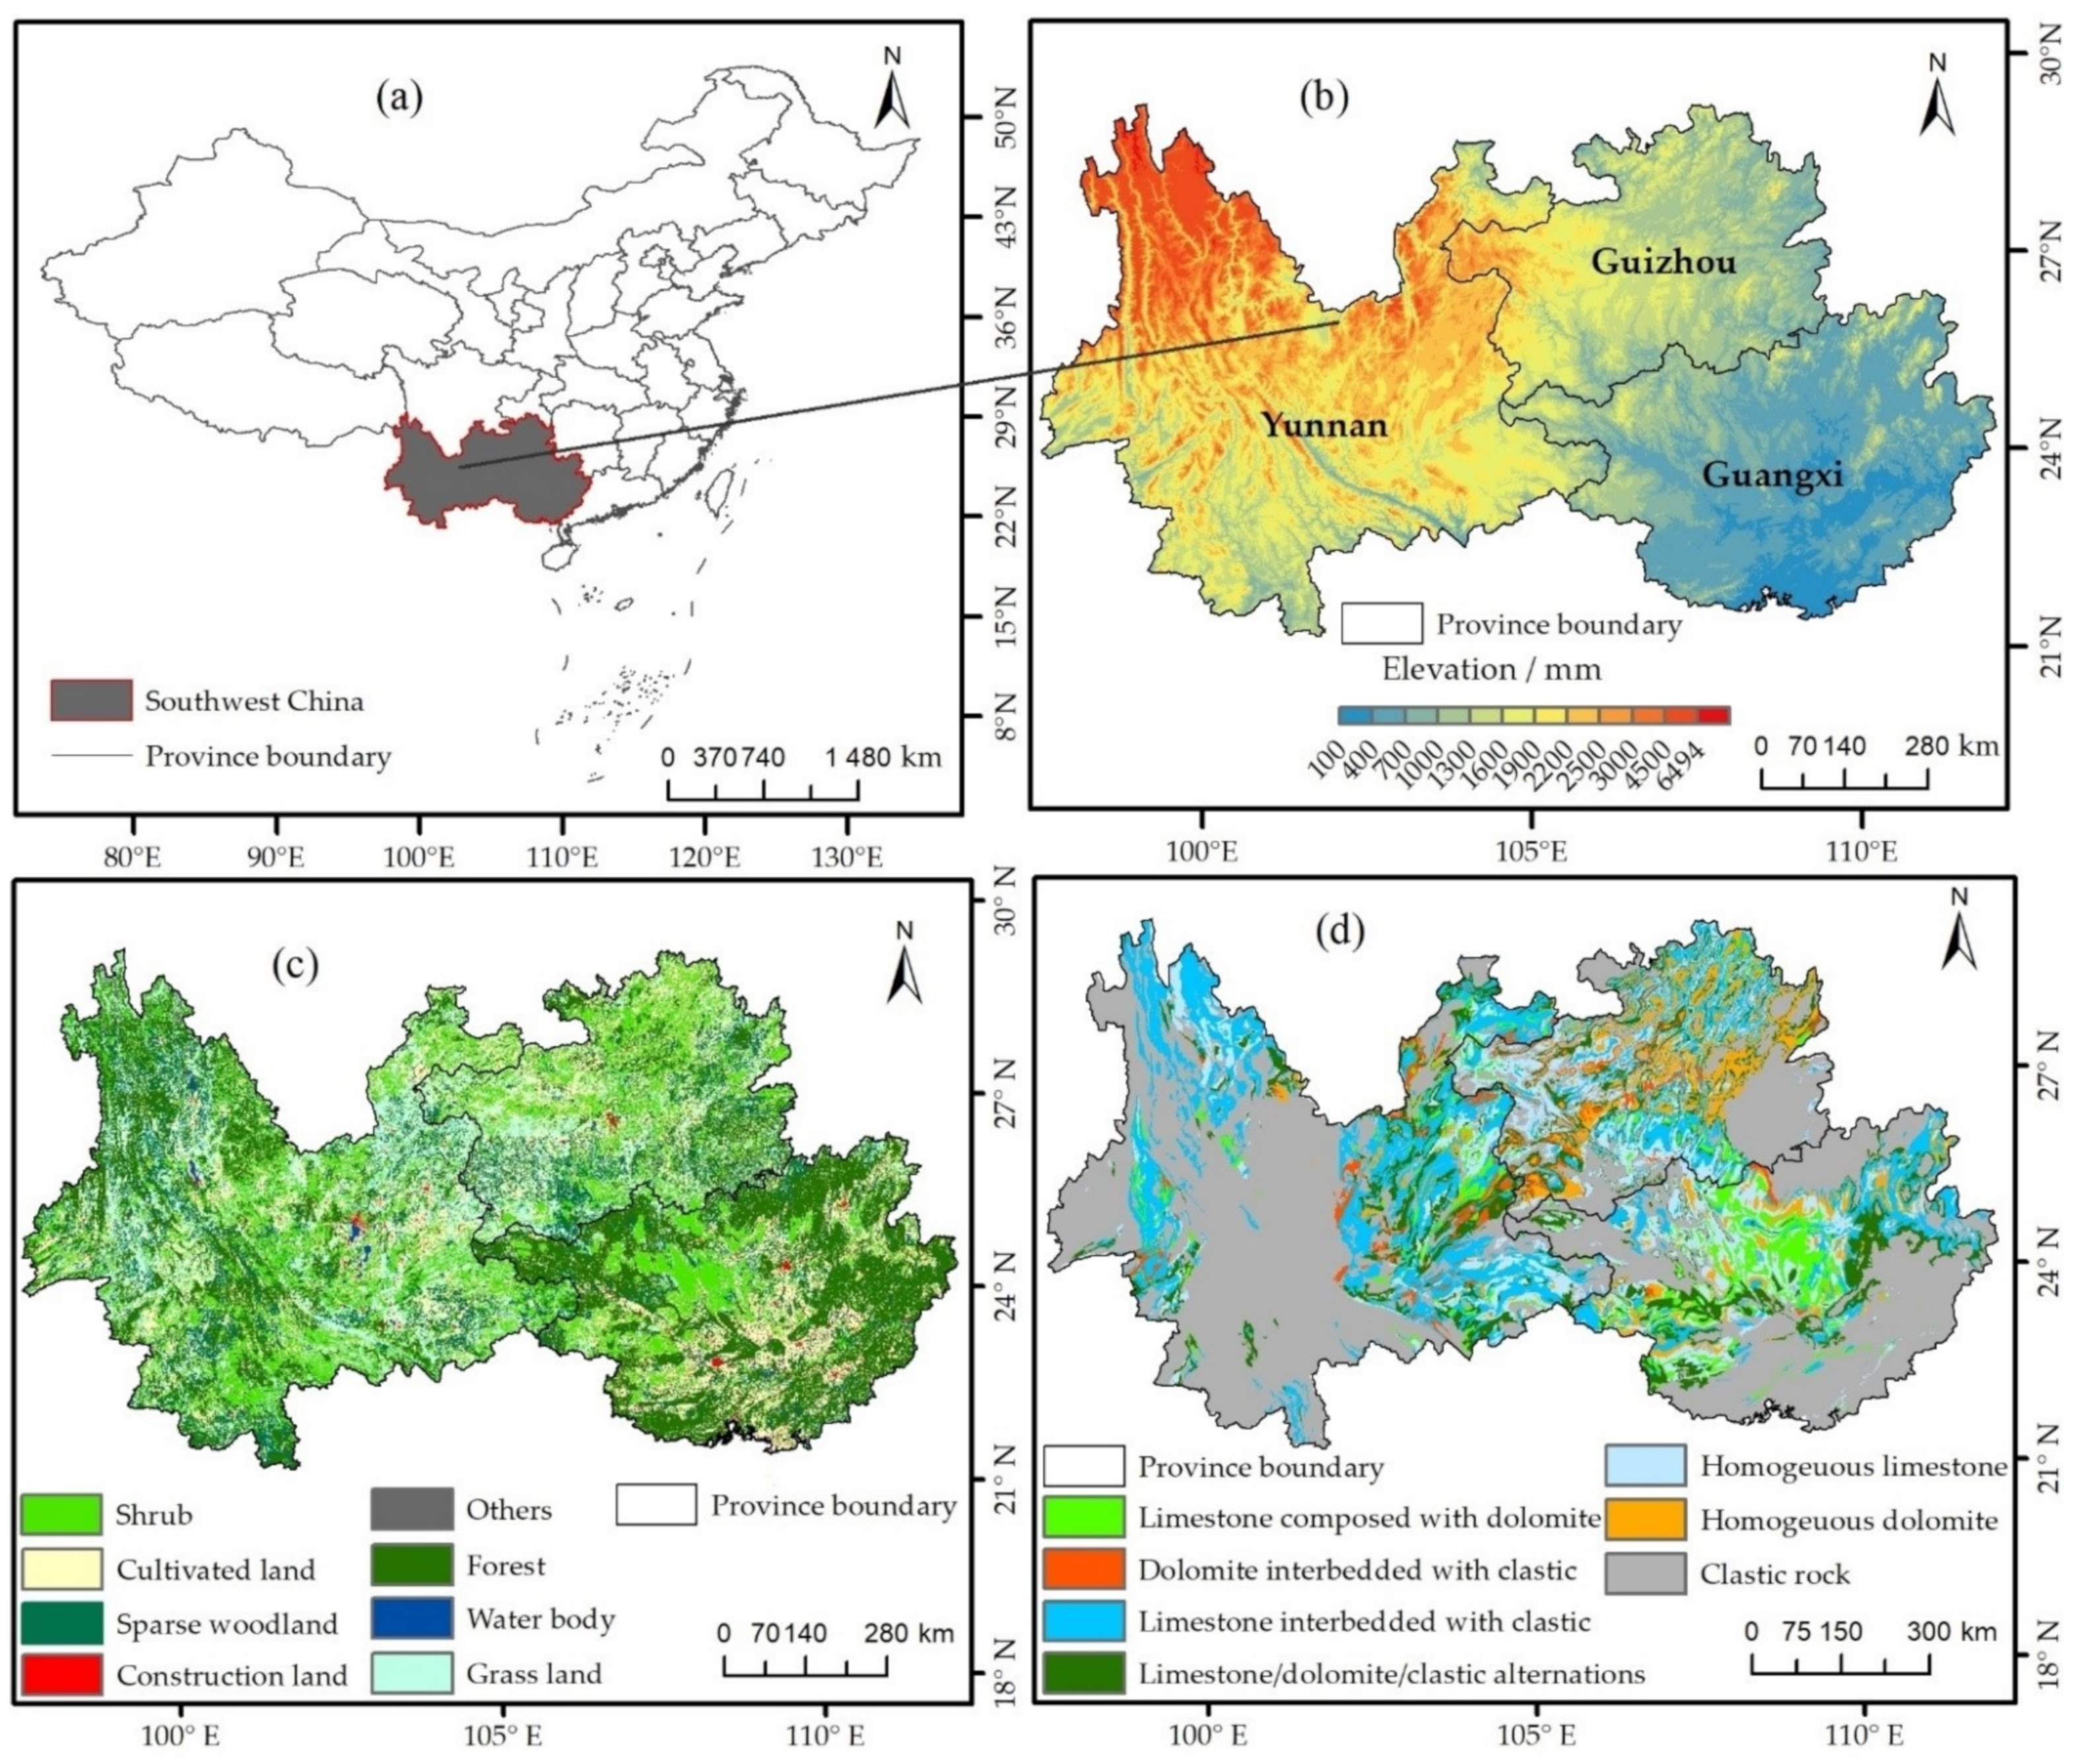
The karst areas account for 12% of the total land surface, and the typical humid karst areas are mainly distributed in southwest China. Therefore, this study has taken Southwest China as a case study, which includes the Yunnan and Guizhou Provinces and the Guangxi Zhuang Autonomous Region, China (97.5–112° E, 21.1–29.2° N). The total land area is 796,773 km2, and the elevation of the study area generally decreases from northwest to southeast (Figure 1a). The bedrock is dominated by pure carbonate (25%) and impure carbonate (23%) whereas the bedrock for the rest of the region consists of clastic rocks. The lithologies are dominated by limestone and dolomite, and the regional soil mainly contains Haplic Alisols. This region experiences a subtropical humid monsoon climate, annual average temperature is 17.6 ℃ and annual precipitation is 1021 mm [9,29]. The temperature and precipitation generally decrease from the southeast to the northwest.
2.2. Data and Processing
2.2.1. Soil Moisture Data
Soil moisture content in the study area was measured based on the land parameter data record (LPDR) Version 2 data set, which was generated using calibrated microwave brightness temperature (Tb) records from the Advanced Microwave Scanning Radiometer for Earth Observing System (EOS) (AMSR-E) on the National Aeronautics and Space Administration (NASA) EOS Aqua satellite, and the Advanced Microwave Scanning Radiometer 2 (AMSR2) sensor on the JAXA GCOM-W1 satellite [30].
The surface (~0–1 cm depth) volumetric soil moisture data were obtained from the Equal-Area Scalable Earth Grid projection (EASE-Grid) with a spatial resolution of 25 km for all the channels, the files are in tif format, the metric is cm3/cm3, and the range is 0–1 [30]. These data sets are acquired twice daily, i.e., once during the ascending track (satellite passage at 13:30 local time) and once during the descending track (satellite passage at 01:30 local time). The fill value is −999. More detailed information is available at https://nsidc.org/data/NSIDC-0451/versions/2.
Humid karst areas usually experience cloudy and rainy days, compared to the optical remote sensing data, the microwave remote sensing data are not susceptible to weather conditions. Furthermore, even though most of them have low spatial resolution, they usually cover a long time series (2002–2018). Therefore, the LPDR V2 data set was used for characterizing the soil moisture content changes in the humid karst areas. Additionally, this data set has been used for monitoring soil moisture content from global to regional scale, including that in China [31,32].
2.2.2. Enhanced Vegetation Index Data
Compared with Normalized Difference Vegetation Index (NDVI) and other vegetation index data sets that have mixed pixel phenomena in vegetation inversion in high vegetation cover areas, the EVI data set is more applicable to monitor vegetation cover change in high vegetation cover areas. Therefore, in this study, the EVI data set (https://ladsweb.modaps.eosdis.nasa.gov/search/) was used to analyze the vegetation changes in the humid karst area of Southwest China. The EVI (2002–2018) derived from MOD13A3 products, with temporal and spatial resolutions of 16 days and 1 km, respectively. The original Moderate Resolution Imaging Spectroradiometer (MODIS) EVI data set was converted to tif format using the MODIS Reprojection Tools software and defined to the Albers Equal-area Conic projection, World Geodetic System 1984 ellipsoid and with a spatial resolution of 25 km.
2.2.3. Precipitation Data
The monthly precipitation data set was downloaded from the China Meteorological Science Data Sharing Service Network (http://data.cma.cn/). The annual precipitation data were calculated from the monthly precipitation data recorded at 82 standard meteorological stations within and surrounding the study area. The spatial precipitation data were obtained by the inverse distance weighting interpolation method. The spatial precipitation data was defined as the Albers Equal-area Conic projection and WGS1984 ellipsoid, and with a spatial resolution of 25 km. The basic information of these data sets can be found in Table 1.
2.3. Methodology
2.3.1. Temporal Variation Characteristics of EVI and Soil Moisture Content
The temporal variations of the annual average EVI and soil moisture content were calculated using the least squares linear regression model.
where the y represents the annual average EVI, or soil moisture content, x represents the year, a is the regression intercept, and b is the regression trend (slope).
2.3.2. Classification of EVI and Soil Moisture Content Variation Trend Patterns
Based on the linear regression analysis method, the variation trend patterns of EVI and soil moisture content were calculated according to the slope of linear regression equation. The detailed algorithms of the slope are as follows:
where s is the slope of the EVI or soil moisture content variation trend in each pixel, i is the year, n is the number of years during the study period (n = 17), and Ei is the value of EVI of soil moisture content in year i. When s = 0, EVI or soil moisture content does not experience obvious change during the study period. When s > 0, EVI or soil moisture content experience an increasing trend during the study period; When the s < 0, EVI or soil moisture content experience a decreasing trend during the study period. When s ≠ 0, the F test is used to identify the significance of EVI or soil moisture content variation trend. As shown in Table 2, the EVI and soil moisture content variation trend patterns were divided into 8 classes.
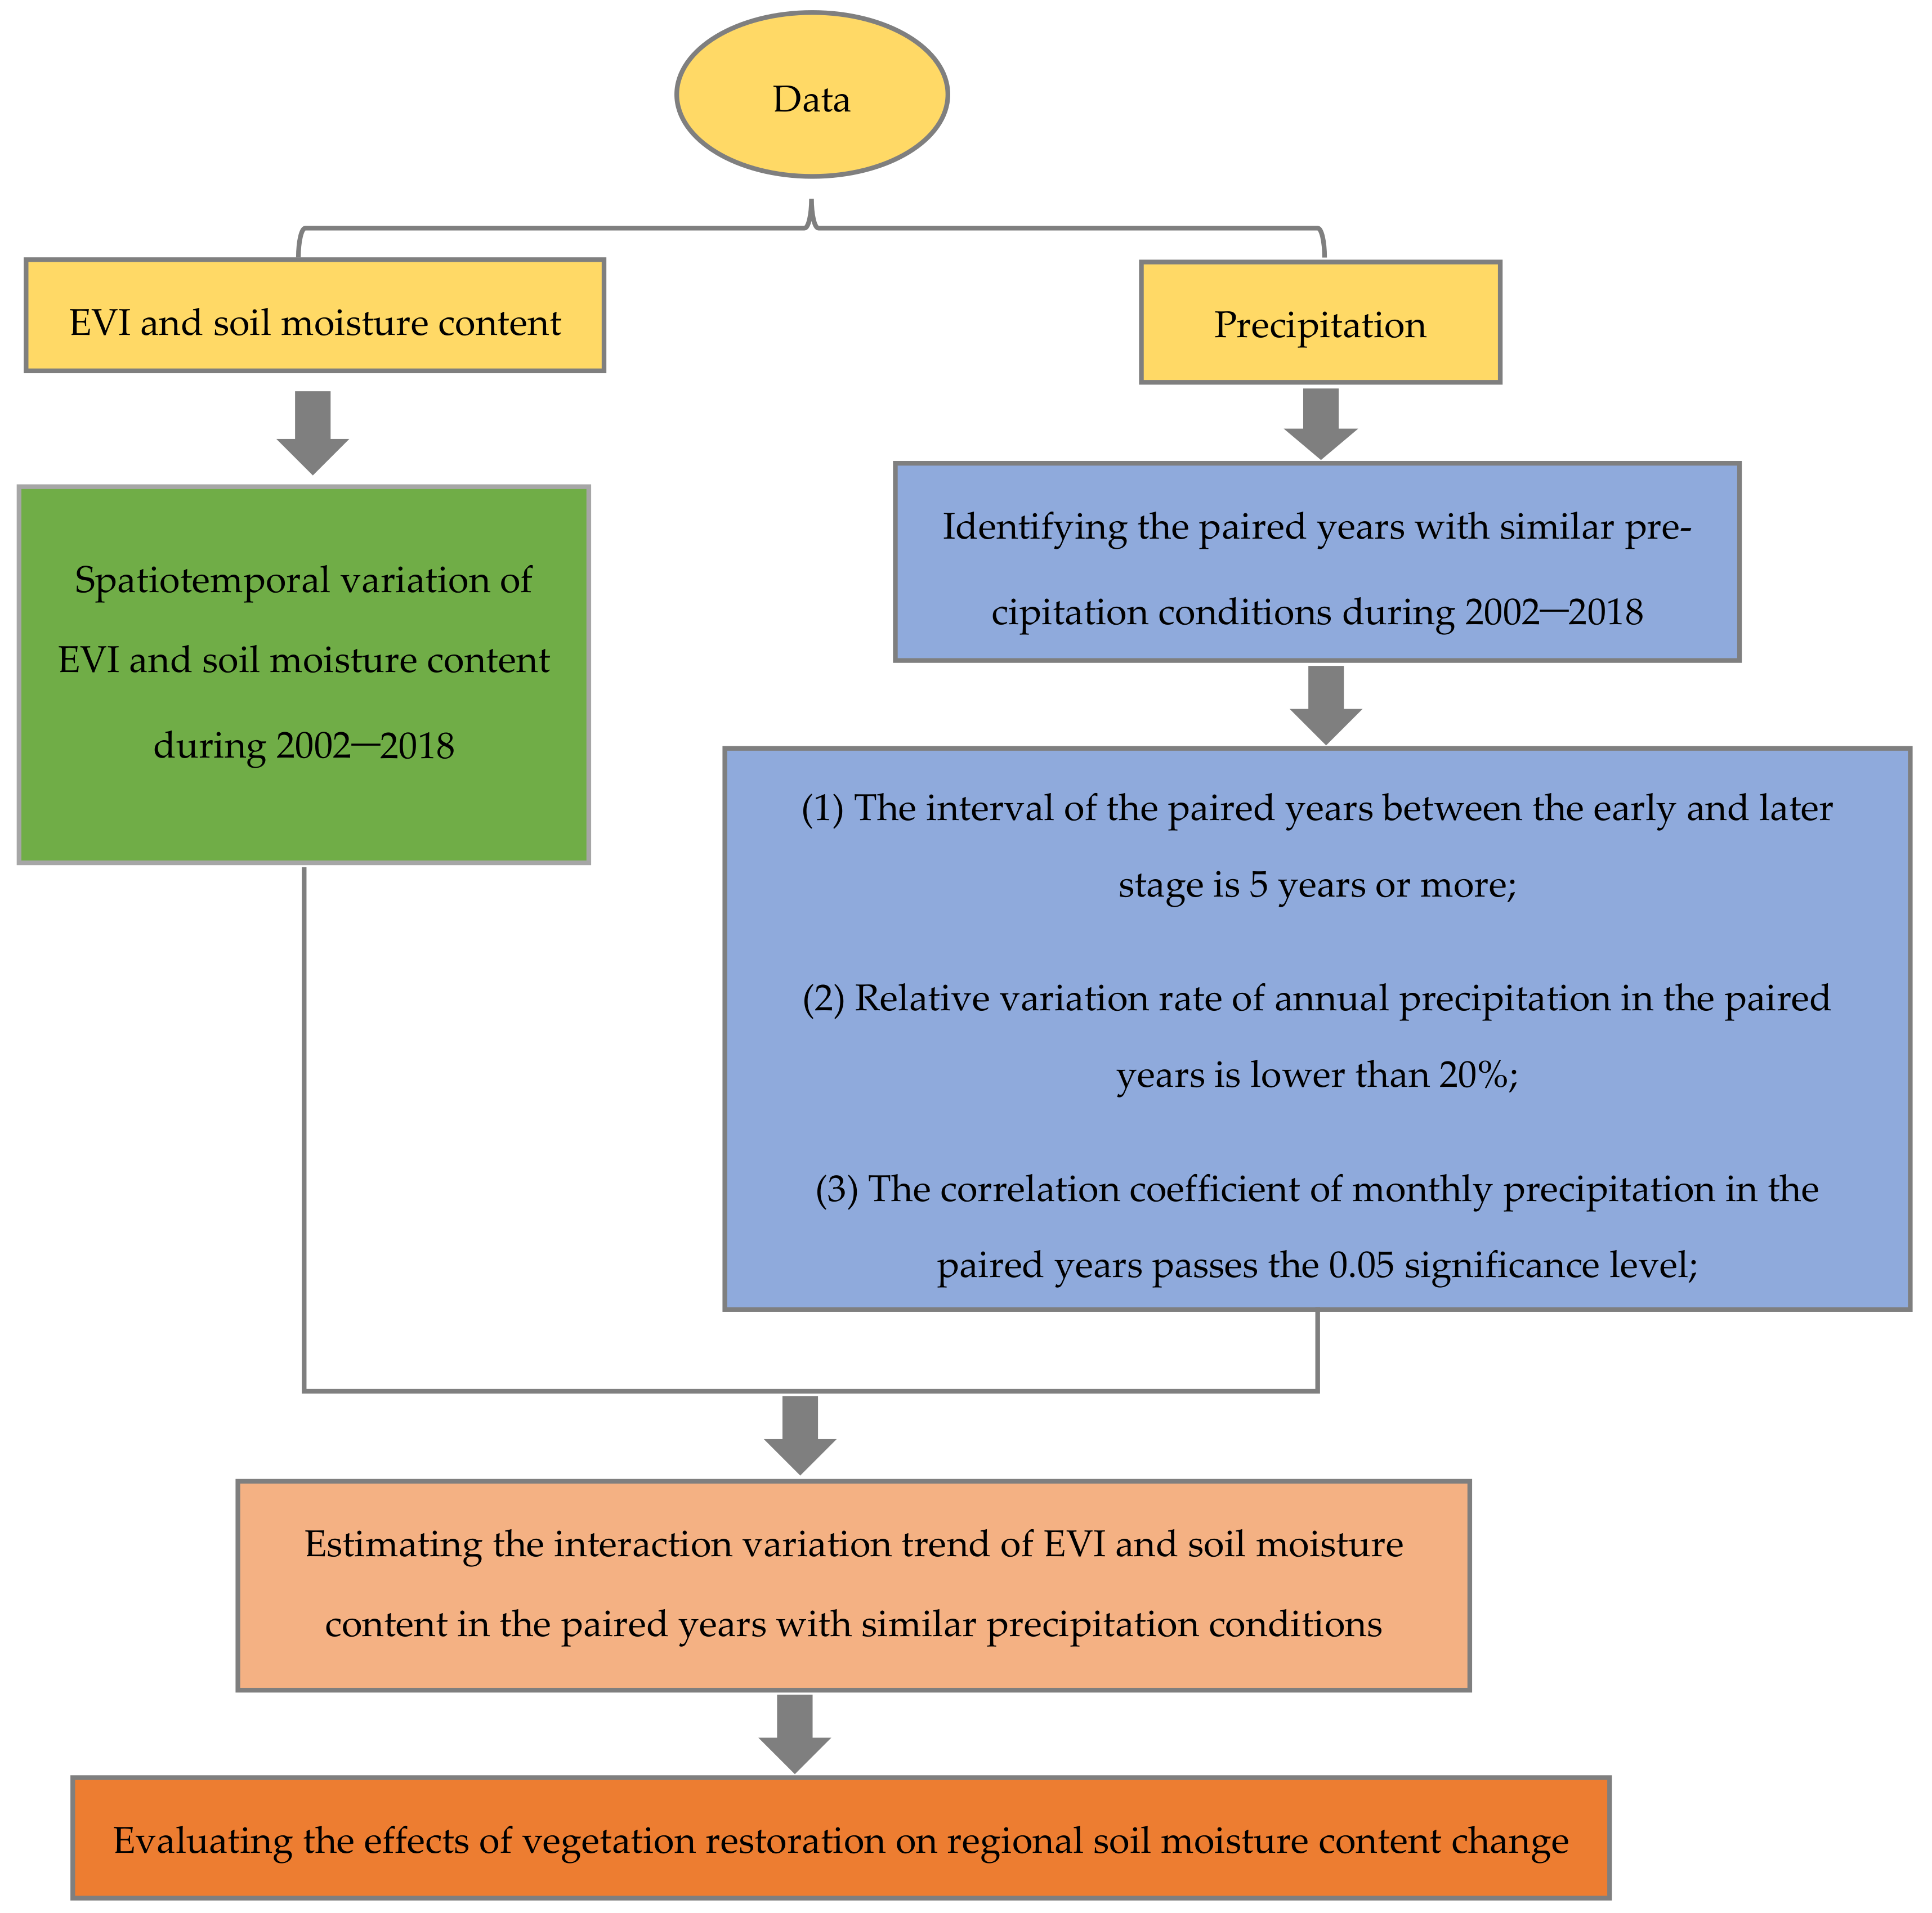
2.3.3. Identifying the Paired Years with Similar Precipitation Conditions
Because precipitation is a critical factor affecting soil moisture content in this work, the method of identifying paired years with similar precipitation conditions was used to eliminate the effects of precipitation when evaluating the effects of vegetation afforestation on regional soil moisture-content change. This method is widely used in the study published by Wang et al. [33,34,35]. In general, the paired years with similar precipitation conditions were defined by a similar amount of precipitation and a similar precipitation process and there is an interval of years between early stage and later stage. The similar amount of precipitation means the annual average precipitation is similar in the paired years, it is dependent on the difference of annual average precipitation. The smaller the difference in annual average precipitation in the paired years, the more similar is the amount of precipitation. The similar precipitation process means the monthly precipitation pattern is similar in the paired years, it is dependent on the correlation relationship of monthly precipitation in the paired years. The closer the correlation coefficient (r) is to 1, the more similar the precipitation process is.
In this study, the precipitation data during 2002–2018 was firstly grouped into 78 paired years, the interval of the paired years was 5 years or more (such as 2002 and 2007). Then, these paired years were selected by similar amounts of precipitation, which were calculated with the low relative variation rate of annual average precipitation between early stage and later stage of vegetation restoration. Then, the similar precipitation processes were defined according to the correlation coefficient (r) of monthly precipitation in these paired years with similar amounts of precipitation. If the correlation coefficient passed the 0.05 significance level, they were featured by similar precipitation processes. The relative variation rate of annual average precipitation and the correlation coefficient of monthly precipitation can be calculated as:
where Ri is the relative variation rate of annual average precipitation in paired year i, Pa and Pb are the annual average precipitation before and after vegetation restoration, respectively. r is the correlation coefficient of monthly precipitation between early stage and later stage, n is the number of variables, xi is the monthly precipitation in the early stage, yi is the monthly precipitation in the later stage, x is the average monthly precipitation in the early stage, is the average monthly precipitation in the later stage.
2.3.4. Analysis of the Interaction Variation Trend of EVI and Soil Moisture Content in Paired Years with Similar Precipitation Condition
The interaction variation trend of EVI and soil moisture content under similar precipitation conditions was calculated by the differences of EVI or soil moisture content at the similar precipitation pixel in the paired years between early stage and later stage. A more detailed description of interaction variation trend can be calculated as follows:
where Δx is the difference of EVI or soil moisture content in the paired years between the early stage and the later stage. xa is the EVI or soil moisture content in the early stage, xa is the EVI or soil moisture content in the early stage, i is the number of paired years. When i = 1, a = 2002, b = 2007; When I = 2, a = 2003, b = 2008; by that analogy, when i = 78, a = 2002, b = 2018. As shown in Table 3, the interaction variation trend of EVI and soil moisture content was divided into 4 classes. Figure 2 presents a flow chart of this study.
3. Results
3.1. Spatiotemporal Variation Characteristics of EVI and Soil Moisture Content
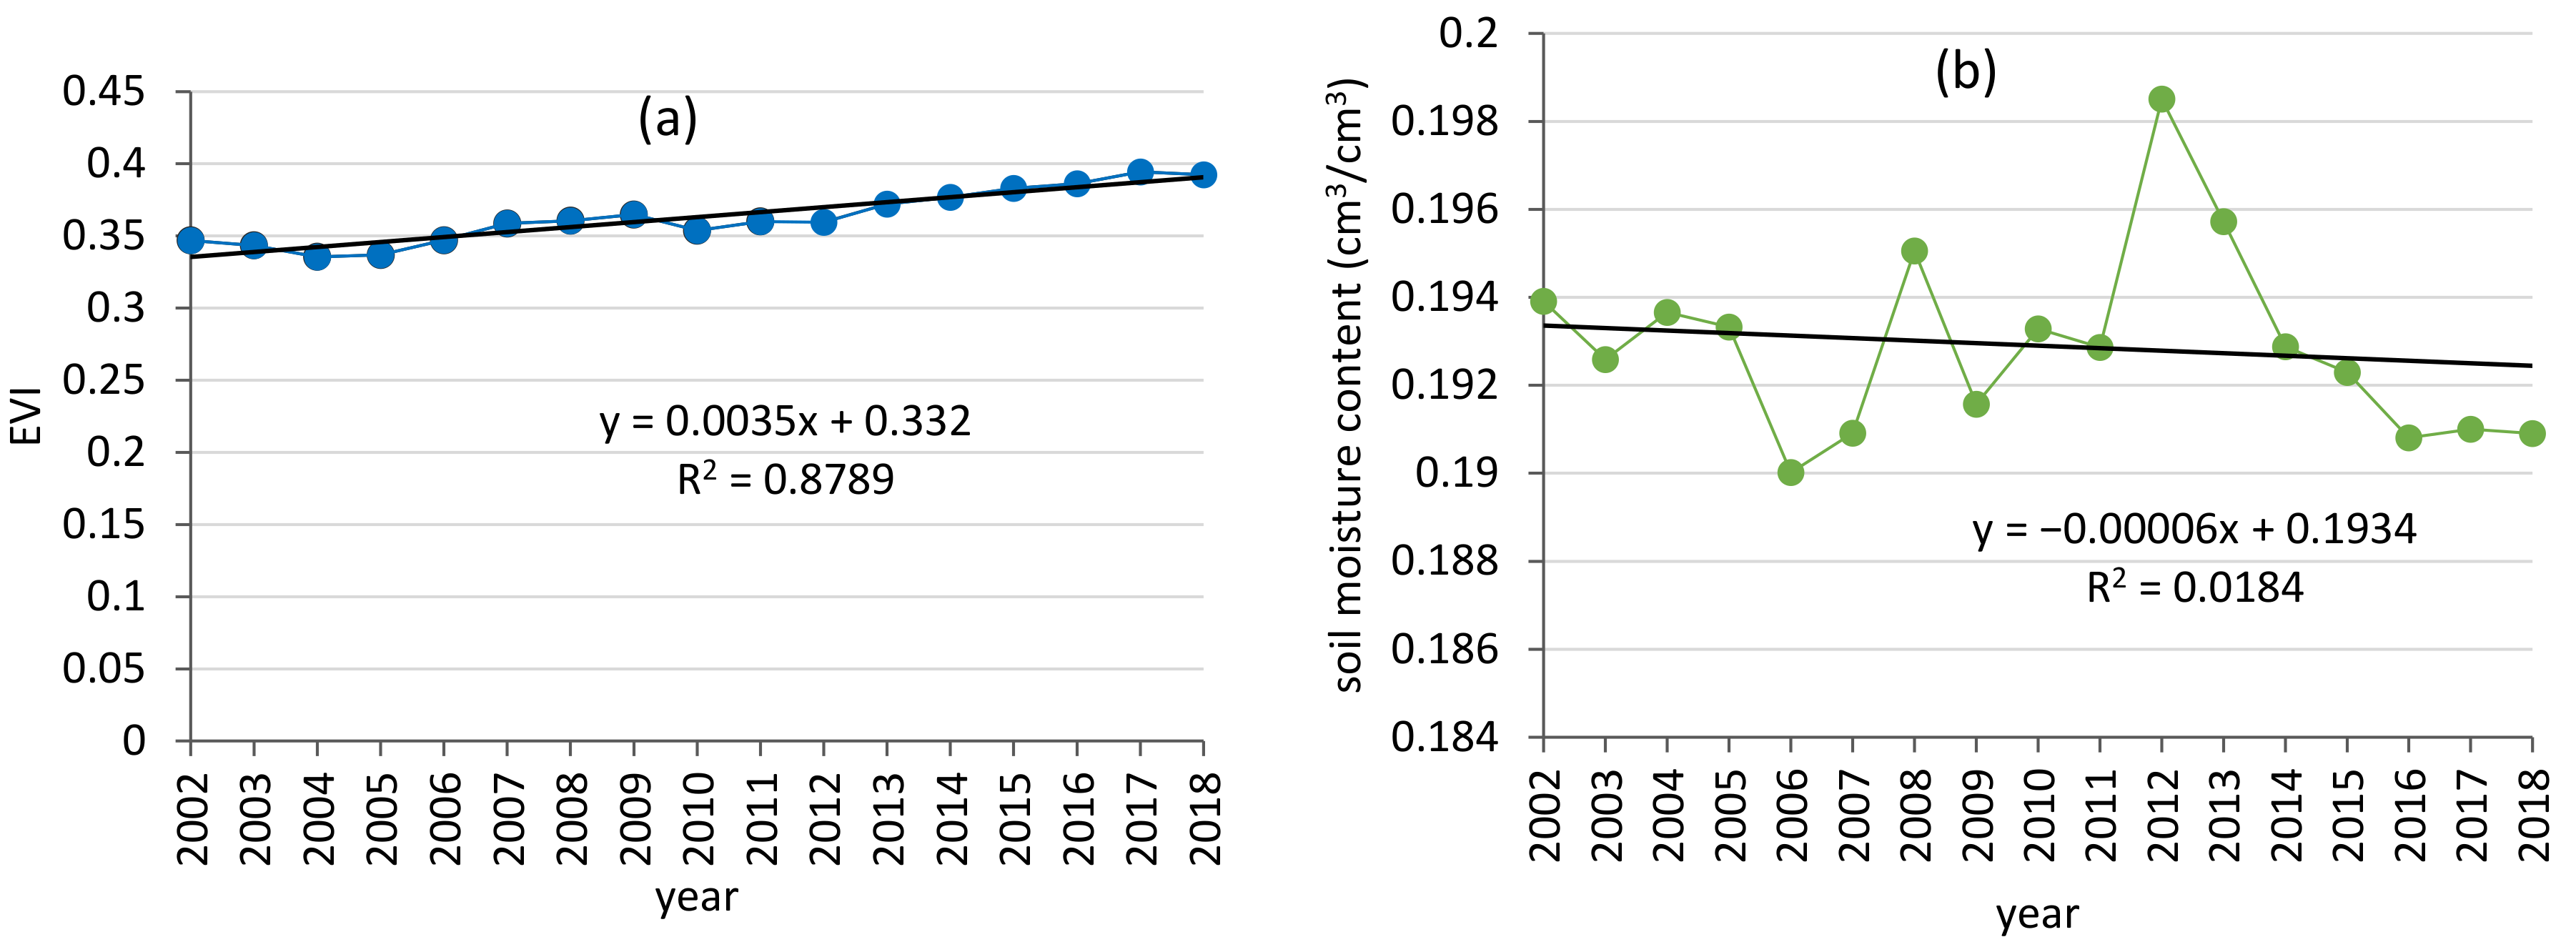
During the 2002–2018 period, the EVI and soil moisture content generally increased at the rates of 0.035 /10a and −0.0006 (cm3/cm3)/10a, respectively. The annual average EVI experienced an increasing trend during 2002–2011 and exhibited an accelerated increasing trend during 2012–2018, the highest and lowest EVI were observed in 2017 and 2004, respectively (Figure 3a). The annual average soil moisture content decreased during 2002–2011 before exhibiting an accelerated downward trend during 2012–2018, the highest and lowest soil moisture content were observed in 2012 and 2006, respectively (Figure 3b). It was found that the accelerated increasing trend of EVI correspond to the accelerated downward trend of soil moisture content during 2012–2018. Generally, the results indicate that with the implementation of a series of ecological restoration projects such as the Grain for Green project, which largely improved the vegetation coverage but was coupled with a drying trend of regional soil moisture content, the drying trend accelerated especially during 2011–2018.
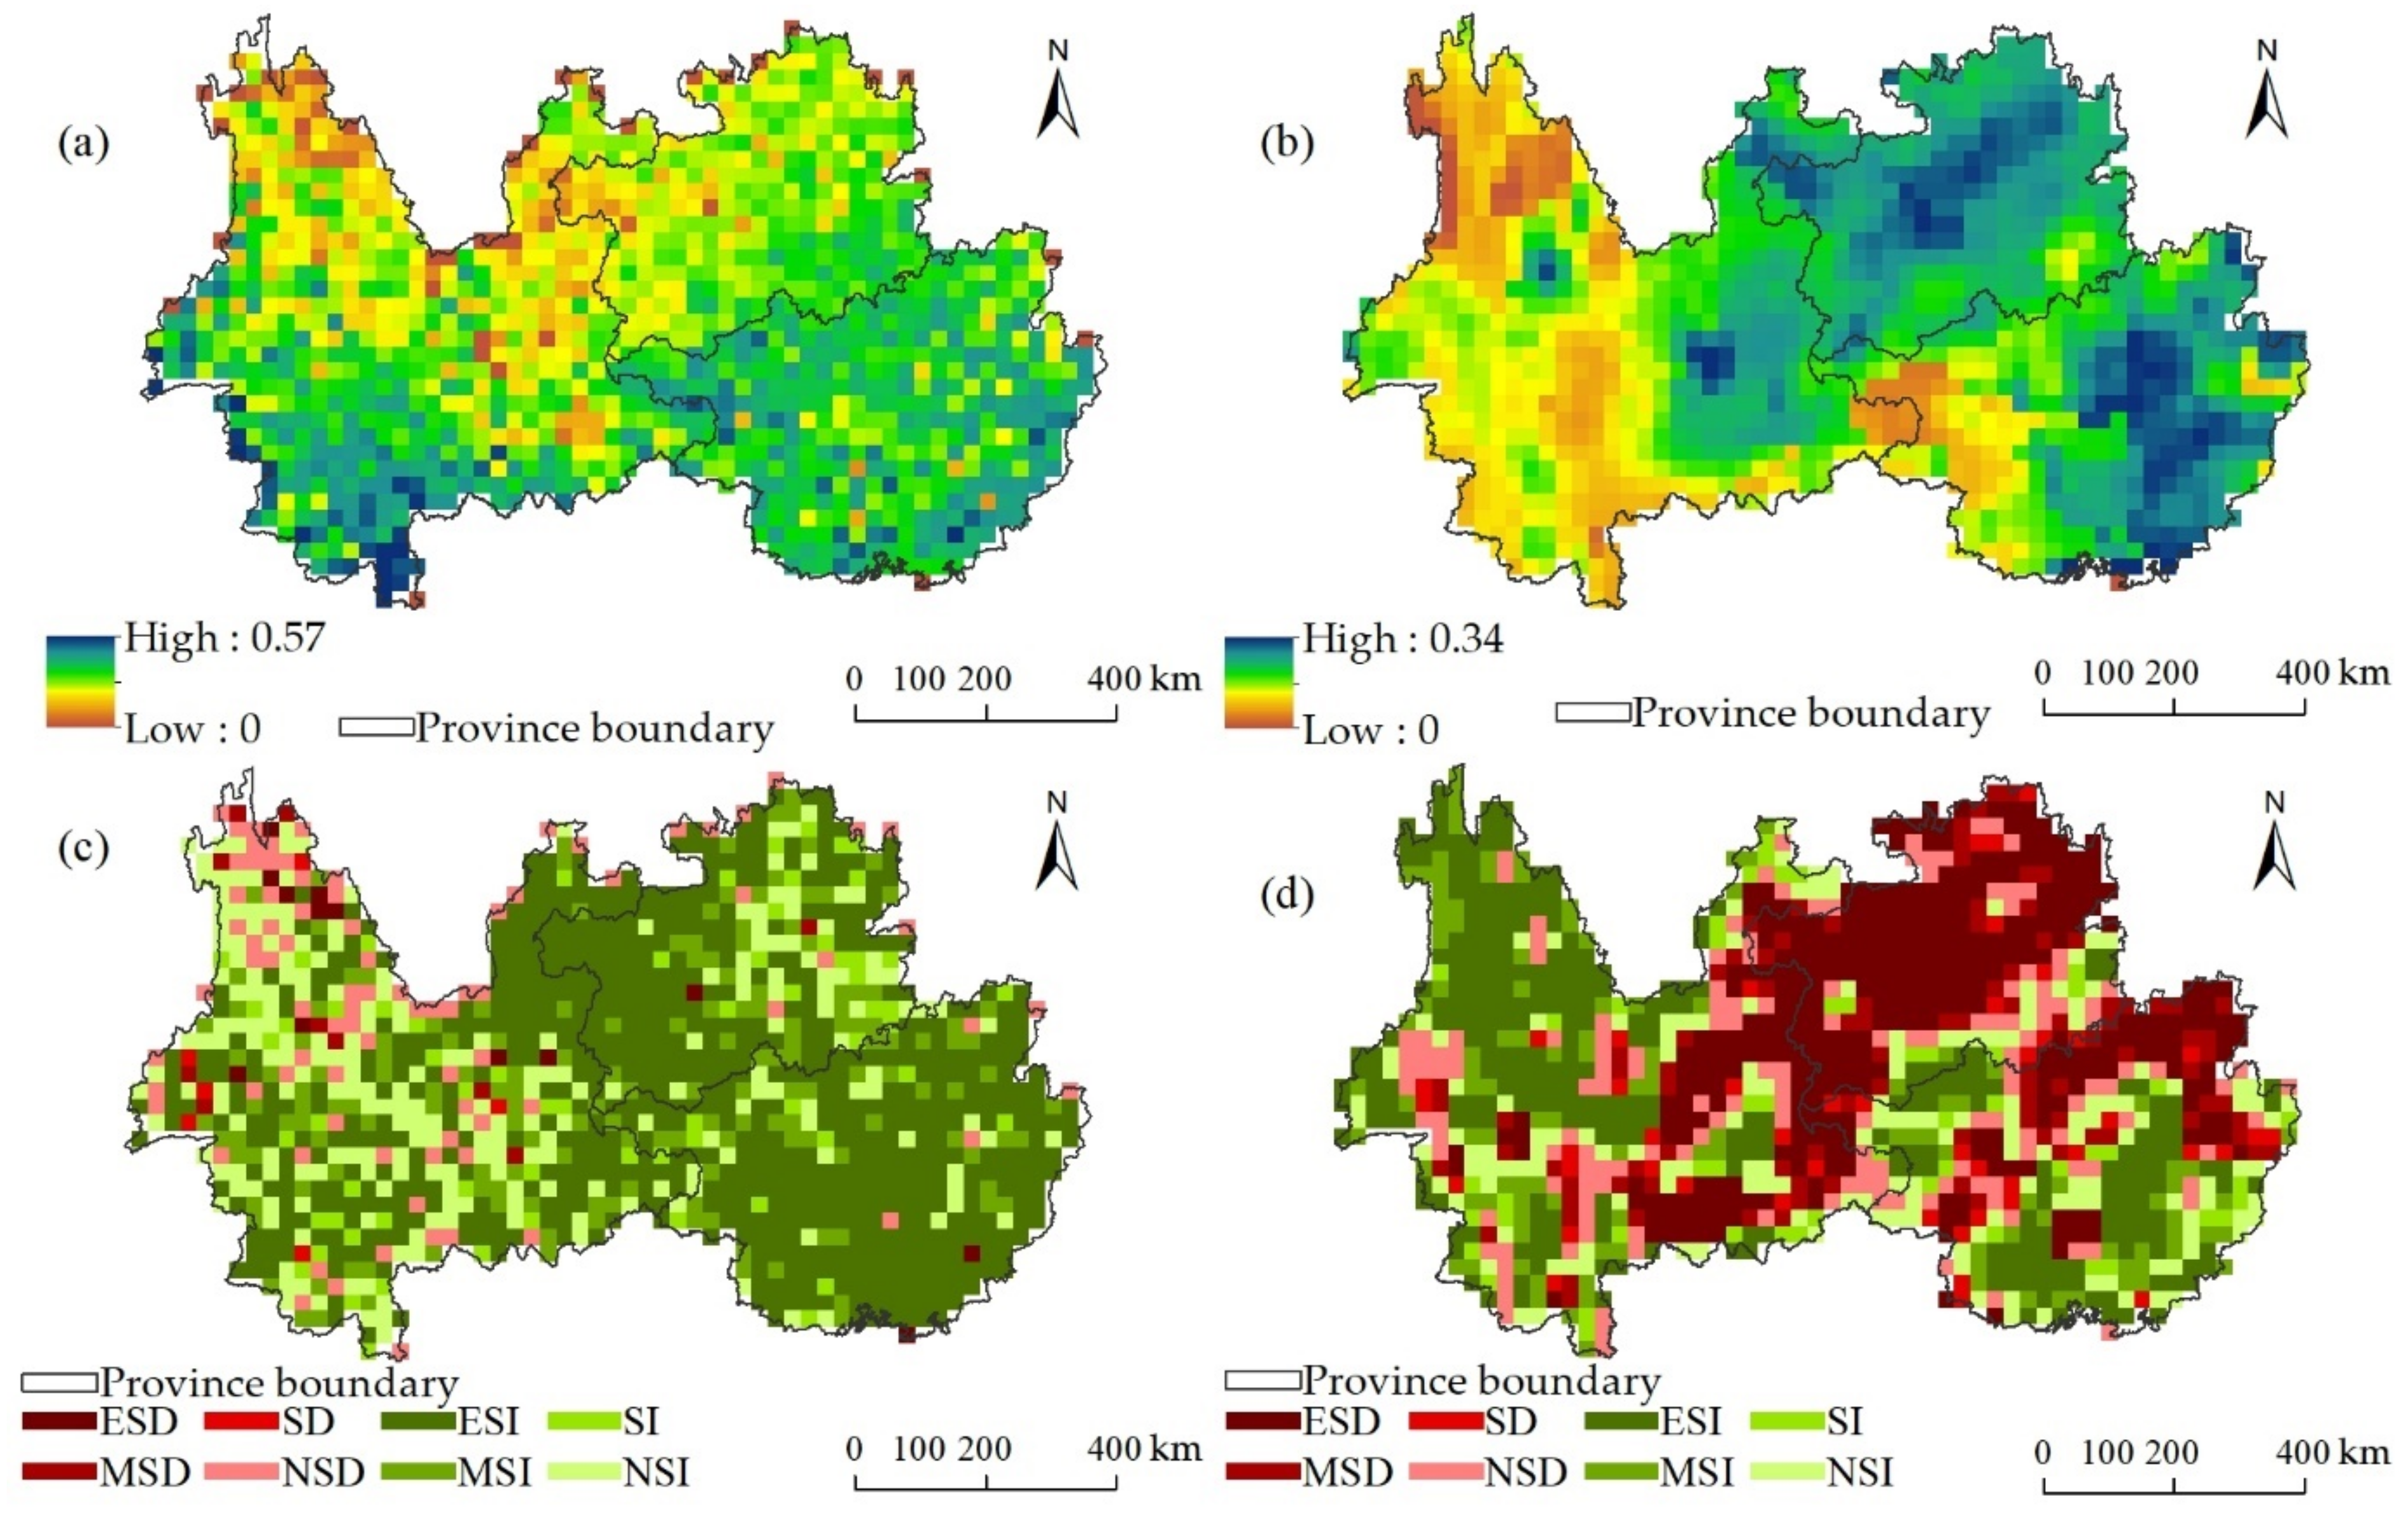
As shown in Figure 4a, the high EVI was mainly distributed in the east and south of the study area, while the low EVI was distributed in the center and north of the study area. The results in Figure 4b show that the high soil moisture content was mainly distributed in the east of the study area, while the low soil moisture content was mainly distributed in the west of the study area. According to the results in Table 4 and Figure 4c, the EVI mainly exhibited an increasing trend, which accounted for 90.90% across the study area. The significantly increased EVI accounted for 54.19% and was mainly distributed from the center to the northeast of the study area whereas the decreased soil moisture content accounted for 51.66% of the study area, while the increased soil moisture content accounted for 48.34% (Table 4). The significantly decreased soil moisture content accounted for 26.66% and was mainly distributed in the center and northeast of the study area (Figure 4d), where the EVI mainly experienced a significantly increasing trend. In general, the results showed that the regional differences in variation trend of EVI corresponded to the regional differences in the variation trend of the soil moisture content across the region, which illustrated that the vegetation cover exhibited an obvious increasing trend but corresponded to a significant reduction in soil moisture content.
3.2. Spatiotemporal Variation Characteristics of Precipitation
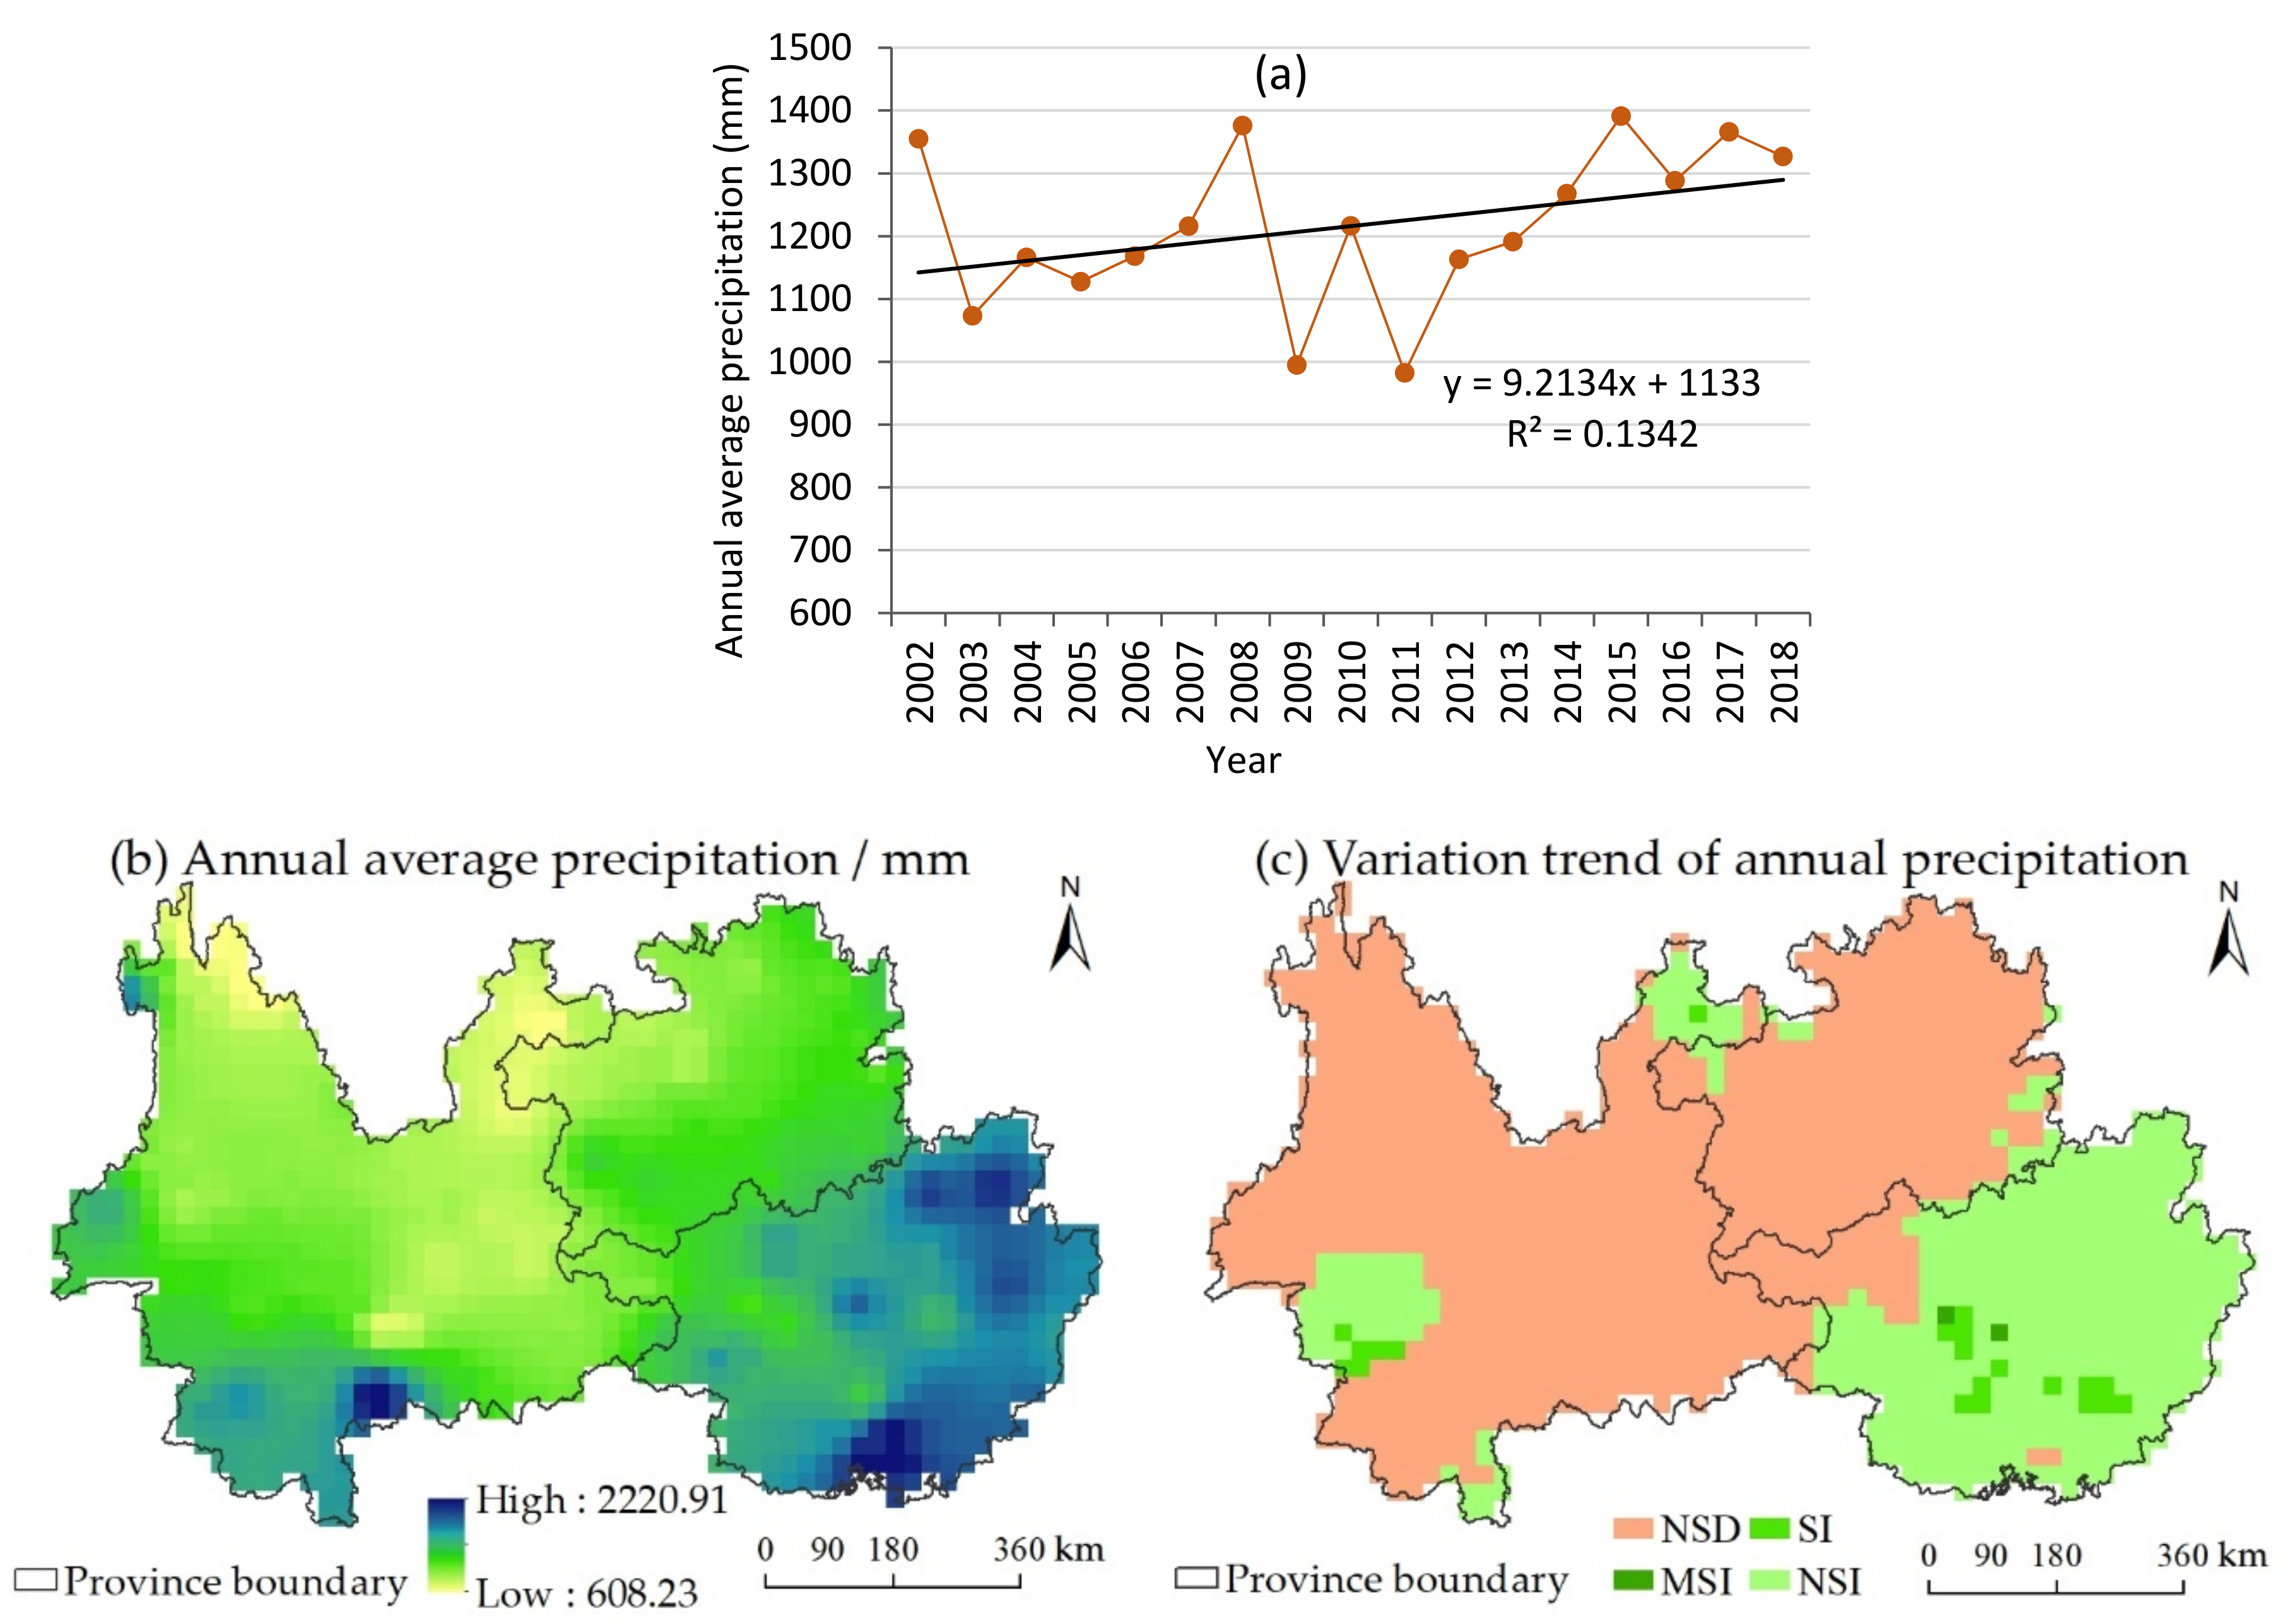
The annual average precipitation generally exhibited an unstable increasing trend at a variation rate of 92.134 mm/10a during 2002–2018, the highest and lowest precipitation were observed in 2015 and 2011 with 1391.21 and 982.51, respectively (Figure 5a). The annual average precipitation featured obvious spatial heterogeneity, it generally decreases from the southeast to the northwest of the study area (Figure 5b). The results in Figure 5c and Table 5 show that the nonsignificant decreasing trend accounted for 76.71% across study area, while the nonsignificant increase accounted for 29.98%. Generally, the annual average precipitation did not exhibit an obvious temporal variation trend during 2002–2018 but exhibited obvious regional differences across the study area.
3.3. Interaction Variation Trend of EVI and Soil Moisture Content in the Paired Years with Similar Precipitation Conditions
As shown in Table 6, among of the 78 paired years, there were 25 paired years with similar precipitation conditions individually accounting for more than 20%. In general, there was little area under similar precipitation conditions across the study area. The interaction variation trend of EVI and soil moisture content in the paired years with similar precipitation conditions accounting for more than 10% of the study area is shown in bold in Table 6. Generally, the results showed that the variation trend of decreased soil moisture content coupled with increased EVI accounted for a greater proportion than the other variation trends, which demonstrated that the remarkable vegetation restoration has resulted in a drying trend of the regional soil moisture content in humid karst areas.
4. Discussion
4.1. Cause of Negative Effects of Vegetation Restoration on Regional Soil Moisture Content
Many previous studies have analyzed the effects of vegetation restoration on regional soil moisture content; however, it is still unclear whether vegetation restoration positively or negatively influences the soil moisture content. Some of the previous studies pointed out that vegetation restoration has a positive correlation with soil moisture content. Because the plant canopy can decrease the land surface temperature, reduce the soil evaporation and increase the precipitation infiltration, these factors finally improve the soil moisture content [36]. In the present study, we found that vegetation restoration has contributed to a drying trend of regional soil moisture content, which is in line with most previous studies undertaken in the karst areas [37,38,39]. For example, the similar study published by Kovačič et al. [40], in which they pointed out that multidecadal vegetation overgrowth significantly contributed to the reduction in the karst soil moisture content. Another study suggests that the increasing trend in global leaf area index (LAI), documented by Zhu et al. [41], could be reflected in the significant impact on groundwater recharge and on the partitioning between green and blue water, which finally resulted in a drying trend of soil moisture content in the karst areas.
The reasons for the negative effects of vegetation restoration on regional soil moisture content in humid karst areas are possibly caused by this: due to the bedrock being characterized by high penetrability and many fissures in humid karst areas, once the precipitation reaches the land surface, it immediately infiltrates underground. So, although precipitation in humid karst areas is abundant, surface water resources are in short supply due to the special hydrogeological structures, and there are insufficient water resources, in particular little soil water, for vegetation restoration consumption. With large-scale vegetation restoration, the increasing leaf area will lead to more canopy interception, water consumption and evapotranspiration, which largely decrease the soil moisture content. At the same time, due to the litter layer, the soil moisture is not easily supplemented by precipitation, which results in a reduction in soil moisture. Consequently, vegetation restoration leads to a drying trend of the regional soil moisture content.
4.2. The Effects of Vegetation Restoration on Soil Moisture Content Varied Under Different Lithological and Climatological Conditions
According to Figure 1c and Figure 4d, the extremely significant decreasing trend in the soil moisture was mainly distributed in the homogenous limestone area [42]. The nonsignificant decrease and nonsignificant increasing trend of soil moisture content was mainly distributed in the homogenous dolomite area, while the extremely significant increasing trend of soil moisture content was mainly distributed in the clastic rock. The reason might be that the homogenous limestone area mainly consists of highly soluble mineral components, such as calcium carbonate [42]. These components are easily dissolved by rainwater, which leads to the formation of crevices within the bedrock surface [43], these crevices limit the retention of water and subsequently result in low soil moisture content, thus vegetation restoration might extensively decrease the soil moisture content. The homogenous dolomite areas mainly consist of magnesium carbonate and usually feature a thick soil layer, which can not only hold more water but also is beneficial for vegetation growth. Thus, vegetation restoration will not lead to an obvious influence on soil moisture change. However, in the clastic rock areas, where the land surface is distributed by a thicker soil layer and higher water-holding capacity [44], the vegetation restoration does not lead to a reduction in soil moisture content, but also can accumulate the precipitation to increase the soil moisture content.
In addition, precipitation generally decreased from the southeast to the northwest of the study area (Figure 5b). The soil moisture change in the humid karst areas was mainly due to precipitation, and the results showed the high precipitation distribution in the southeast, where the main increasing trend of soil moisture content was distributed. Generally, it was found that the spatial distribution of soil moisture content was explained by the lithology and precipitation, thus the effects of vegetation restoration on soil moisture content might be different under different lithology and precipitation conditions. Therefore, the results suggest that the effects of vegetation restoration on soil moisture content under different lithological and climatological conditions should not be ignored in future vegetation restoration practices in humid karst areas.
4.3. Reasons for Differences in Effects of Vegetation Restoration on Soil Moisture Content in Different Spatial Scales
According to the conclusions in previous studies, the effects of vegetation restoration on soil moisture content showed significantly different characteristics in different spatial scales, these effects particularly varied at plot scale and slope scale. The reasons may be as follows: on the one hand, because the comparisons between experimental groups are inconsistent and most of the observation experiments are mixed with external environmental factors, such as plant community structures, topographic features, and climatic conditions. These interactions impact the various influential factors on soil moisture content and can easily lead to different research results. On the other hand, due to the influences of the strong heterogeneity of the ecological environment and the thin and discontinuous soil layer, the soil moisture and its influential factors feature strong spatial heterogeneity and vary in different spatial scales in the humid karst areas. Therefore, the conclusions are significantly different on the effects of vegetation restoration on soil moisture content in different spatial scales. Thus, against the background of the greening of the Earth, the humid karst area has been confirmed to be one of the remarkable vegetation restoration efforts in the world. Therefore, it is important to conduct the study on the effects of vegetation restoration on soil moisture at regional scale. As such, the results of the present study can provide knowledge of the effects of vegetation restoration on soil moisture content at the regional scale, and be of key importance for balancing the relationship between the water needs of vegetation and the water supplies of the soil in further vegetation restoration practices in humid karst areas.
4.4. The Rationality and Limitation of the Method to Define Similar Precipitation Conditions
With a series of Ecological Restoration Projects that have greatly improved landsurface vegetation cover, how to quantitatively analyze the impact of vegetation restoration on soil moisture content has become the hot topic in recent years. Precipitation was a critical factor affecting soil moisture content, and showed different spatiotemporal variation characteristics in the early and later stages of vegetation restoration. Therefore, the influence of precipitation should be eliminated when analyzing the soil moisture content changes in different periods. Since the paired years with similar climate conditions was proposed, it has been widely applied to separate the influence of human activities from climate factors on river runoff and sediment discharge. In previous studies, similar precipitation conditions were identified by a similar amount of precipitation and similar processes of precipitation in the paired years between early and later stages. However, there is still no uniform determination of this method, including similar amount of precipitation, similar process of precipitation and interval year in the paired years.
In this study, we defined the similar precipitation conditions with three rules that need to be simultaneously applied: first, the interval year in the paired years is ≥5 years; second, the relative variation rate of annual precipitation in the paired years is ≤20%; third, the correlation coefficient between monthly precipitation in the paired years should pass the significance level of 0.05. Based on the method of the paired years with similar precipitation conditions, this study evaluated the effects of vegetation restoration on soil moisture by eliminating the influence of precipitation by pixel scale. Compared with the previous studies, this method in the present study can not only reveal the effects of vegetation restoration on regional soil moisture content more accurately, but also is of great significance for future soil moisture content research and vegetation restoration practices.
4.5. The Contribution and Application of the Present Study
Influenced by the fragile ecological environment, of which the resulting soil moisture content is the main restricting factor in the humid karst areas. In recent years, due to the influence of accelerating climate change and the implementation of a series of ecological restoration projects, although the vegetation coverage has been greatly increased, it has also greatly changed the spatiotemporal soil moisture content. Against the unique geological and hydrological background, such as thin soil layer and space mismatch between soil and rocks, soil moisture content is a feature of strong spatial heterogeneity in the humid karst areas. However, the conclusions in previous research were mainly conducted at plot scale and slope scale, consequently, these conclusions also varied in different studies and are unclear at the regional scale. In the present study, our results reveal that vegetation restoration has led to a drying trend of the regional soil moisture content in humid karst areas during 2002–2018, which is not conducive to vegetation restoration and increases the risk of drought in this area. Therefore, the findings suggest that in the future practice of vegetation restoration in humid karst areas, we should pay attention to balancing the relationship between vegetative water consumption and soil moisture content. According to the different land surface climate conditions, choosing appropriate vegetation types and controlling reasonable vegetation planting density can realize sustainable vegetation restoration. Although this study selected Southwest China as a case study area, the results of this study can be transferred to other similar studies aiming to evaluate the effects of vegetation restoration on soil moisture.
In this study, the effects of vegetation reconstruction on regional soil moisture content were analyzed under similar precipitation conditions, which can be good for eliminating the influence of precipitation conditions, so as to make the research results more scientific and convincing. There are some limitations in our present study, for example, due to the land cover types in humid karst regions usually being characterized by strong spatial heterogeneity, the soil layer is shallow and discontinuous so the soil moisture varied even in the case of 1 km2 areas. However, the remote sensing data in our study with a spatial resolution of 25 km, low spatial resolution remote sensing images bring errors into the land surface conditions because a single pixel covers a larger area and there are a lot of mixed pixels. Therefore, the surface soil moisture content might be different within one pixel, which has limitations for the monitoring of actual soil moisture content conditions in the humid karst areas. Although the present study looks at the effects of vegetation restoration on regional soil moisture content by controlling similar precipitation condition, there are still some differences of precipitation in the paired years between early and later stages of vegetation afforestation, which could impact the accuracy of this study results. Despite some limitations to our present study, in general, the results of the present study can reveal the effects of vegetation restoration on regional soil moisture content in humid karst areas, and can also provide important references for the management of water resources, vegetation restoration practices and agricultural industrialization at regional scale in future.
5. Conclusions
The effects of vegetation restoration on soil moisture content have mainly focused on plot scale and slope scale, while these effects still remain unclear at regional scale in this area. Our research quantitatively investigated the spatiotemporal variation characteristics of EVI and soil moisture content in the humid karst areas, and explored the effects of vegetation restoration on regional soil moisture content in paired years with similar precipitation conditions. The results showed that the remarkable vegetation restoration has resulted in a drying trend of the soil moisture content at the regional scale in humid karst areas. Therefore, we suggest that the relationship between the water consumption of vegetation growth and the supply of soil moisture should be fully considered in future practices of vegetation restoration. Furthermore, when returning farmlands to forests, the lithology conditions should be considered and a suitable planting density should be selected, rather than blindly pursuing high-density vegetation coverage. This study is not only useful for the acknowledgement of the effects of vegetation restoration on regional soil moisture content changes in the humid karst areas of Southwest China, but also could of key importance for balancing the relationship between water consumption of vegetation growth and soil moisture supplies, which can make a contribution to the sustainable vegetation restoration practices in humid karst areas.
Author Contributions
X.W. and Q.Z. conceived and wrote the manuscript; M.C. and Y.W. polished the language of the manuscript. All authors have read and agreed to the published version of the manuscript.
Funding
This work was funded by the Joint Fund of the National Natural Science Research Center of Guizhou province [grant number U1812401]; the National Science Foundation of China [grant numbers 41761003], the Basic Research Program of Guizhou Province [grant number Qiankehe Jichu [2019]1433 & [2017]1131].
Institutional Review Board Statement
Not applicable.
Informed Consent Statement
Not applicable.
Data Availability Statement
Not applicable.
Acknowledgments
We are deeply grateful to the reviewers for his/her insight and careful review.
Conflicts of Interest
The authors declare no conflict of interest.
References
- An, W.; Li, Z.; Wang, S.; Wu, X.; Lu, Y.; Liu, G.; Fu, B. Exploring the effects of the “Grain for Green” program on the differences in soil water in the semi-arid Loess Plateau of China. Ecol. Eng. 2017, 107, 144–151. [Google Scholar] [CrossRef]
- Ye, L.; Fang, L.; Shi, Z.; Deng, L.; Tan, W. Spatio-temporal dynamics of soil moisture driven by “Grain for Green” program on the Loess Plateau, China. Agric. Ecosyst. Environ. 2019, 269, 204–214. [Google Scholar] [CrossRef]
- Hartmann, A.; Goldscheider, N.; Wagener, T.; Lange, J.; Weiler, M. Karst water resources in a changing world: Review of hydrological modeling approaches. Rev. Geoph. 2014, 52, 218–242. [Google Scholar] [CrossRef]
- He, Z.; Liang, H.; Yang, Z.; Huang, F.; Zeng, X. Water system characteristics of Karst river basins in South China and their driving mechanisms of hydrological drought. Nat. Hazards 2018, 92, 1155–1178. [Google Scholar] [CrossRef]
- Berthelin, R.; Rinderer, M.; Andreo, B.; Baker, A.; Kilian, D.; Leonhardt, G.; Lotz, A.; Lichtenwoehrer, K.; Mudarra, M.; Padilla, I.Y.; et al. A soil moisture monitoring network to characterize karstic recharge and evapotranspiration at five representative sites across the globe. Geosci. Instrum. Method. Data Syst. 2020, 9, 11–23. [Google Scholar] [CrossRef] [Green Version]
- Wang, S.-J.; Liu, Q.-M.; Zhang, D.-F. Karst rocky desertification in southwestern China: Geomorphology, landuse, impact and rehabilitation. Land Degrad. Dev. 2004, 15, 115–121. [Google Scholar] [CrossRef]
- Jiang, Z.; Lian, Y.; Qin, X. Rocky desertification in Southwest China: Impacts, causes, and restoration. Earth-Sci. Rev. 2014, 132, 1–12. [Google Scholar] [CrossRef]
- Berthelin, R.; Hartmann, A. The Shallow Subsurface of Karst Systems: Review and Directions. In Eurokarst 2018, Besançon, Advances in Karst Science; Bertrand, C., Denimal, S., Steinmann, M., Renard, P., Eds.; Springer: Cham, Switzerland, 2020; pp. 61–68. [Google Scholar]
- Tong, X.; Wang, K.; Yue, Y.; Brandt, M.; Liu, B.; Zhang, C.; Liao, C.; Fensholt, R. Quantifying the effectiveness of ecological restoration projects on long-term vegetation dynamics in the karst regions of southwest China. Int. J. Appl. Earth Obs. Geoinf. 2017, 54, 105–113. [Google Scholar] [CrossRef] [Green Version]
- Tong, X.; Brandt, M.; Yue, Y.; Horion, S.; Wang, K.; Keersmaecker, W.D.; Tian, F.; Schurgers, G.; Xiao, X.; Luo, Y.; et al. Increased vegetation growth and carbon stock in China karst via ecological engineering. Nat. Sustain. 2018, 1, 44–50. [Google Scholar] [CrossRef]
- Brandt, M.; Yue, Y.; Wigneron, J.P.; Tong, X.; Tian, F.; Jepsen, M.R.; Xiao, X.; Verger, A.; Mialon, A.; Al-Yaari, A.; et al. Satellite-Observed Major Greening and Biomass Increase in South China Karst During Recent Decade. Earth’s Future 2018, 6, 1017–1028. [Google Scholar] [CrossRef]
- Chen, C.; Park, T.; Wang, X.; Piao, S.; Xu, B.; Chaturvedi, R.K.; Fuchs, R.; Brovkin, V.; Ciais, P.; Fensholt, R.; et al. China and India lead in greening of the world through land-use management. Nat. Sustain. 2019, 2, 122–129. [Google Scholar] [CrossRef] [PubMed]
- Jia, X.; Shao, M.; Zhu, Y.; Luo, Y. Soil moisture decline due to afforestation across the Loess Plateau, China. J. Hydrol. 2017, 546, 113–122. [Google Scholar] [CrossRef]
- Yu, B.; Liu, G.; Liu, Q. Effects of land use changes for ecological restoration on soil moisture on the Chinese Loess Plateau: A meta-analytical approach. J. For. Res. 2018, 31, 443–452. [Google Scholar] [CrossRef]
- Li, X.; Xu, X.; Liu, W.; He, L.; Zhang, R.; Xu, C.; Wang, K. Similarity of the temporal pattern of soil moisture across soil profile in karst catchments of southwestern China. J. Hydrol. 2017, 555, 659–669. [Google Scholar] [CrossRef]
- Zhou, Q.; Sun, Z.; Liu, X.; Wei, X.; Peng, Z.; Yue, C.; Luo, Y. Temporal Soil Moisture Variations in Different Vegetation Cover Types in Karst Areas of Southwest China: A Plot Scale Case Study. Water 2019, 11, 1423. [Google Scholar] [CrossRef] [Green Version]
- Chen, X.; Zhang, Z.; Chen, X.; Shi, P. The impact of land use and land cover changes on soil moisture and hydraulic conductivity along the karst hillslopes of southwest China. Environ. Earth Sci. 2009, 59, 811–820. [Google Scholar] [CrossRef]
- Chen, H.; Zhang, W.; Wang, K.; Fu, W. Soil moisture dynamics under different land uses on karst hillslope in northwest Guangxi, China. Environ. Earth Sci. 2010, 61, 1105–1111. [Google Scholar] [CrossRef]
- Sun, Z. Effects of Vegetation Restoration on Soil Moisture on Slopes in Karst Area and Its Influencing Factors; Guizhou Normal University: Guiyang, China, 2020. (In Chinese) [Google Scholar]
- Li, S.; Ren, H.D.; Xue, L.; Chang, J.; Yao, X.H. Influence of bare rocks on surrounding soil moisture in the karst rocky desertification regions under drought conditions. Catena 2014, 116, 157–162. [Google Scholar] [CrossRef]
- Li, X.; Xu, X.; Liu, W.; Xu, C.; Zhang, R.; Wang, K. Prediction of profile soil moisture for one land use using measurements at a soil depth of other land uses in a karst depression. J. Soils Sediments 2019, 19, 1479–1489. [Google Scholar] [CrossRef]
- Zhao, Z.; Shen, Y.; Wang, Q.; Jiang, R. The temporal stability of soil moisture spatial pattern and its influencing factors in rocky environments. Catena 2020, 187, 104418. [Google Scholar] [CrossRef]
- Yang, J.; Chen, H.; Nie, Y.; Wang, K. Dynamic variations in profile soil water on karst hillslopes in Southwest China. Catena 2019, 172, 655–663. [Google Scholar] [CrossRef]
- Xie, S.Y.; Ren, W. Soil Moisture Characteristics in Karst Area with Different Land Use Types. Agric. Sci. Technol. 2013, 14, 1856–1860. [Google Scholar]
- Wang, S.; Chen, H.S.; Fu, Z.; Wang, K. Temporal stability analysis of surface soil water content on two karst hillslopes in southwest China. Environ. Sci. Pollut. Res. 2016, 23, 25267–25279. [Google Scholar] [CrossRef] [PubMed]
- Luo, W.; Xu, X.; Liu, W.; Liu, M.; Li, Z.; Peng, T.; Xu, C.; Zhang, Y.; Zhang, R. UAV based soil moisture remote sensing in a karst mountainous catchment. Catena 2019, 174, 478–489. [Google Scholar] [CrossRef]
- Deng, Y.; Wang, S.; Bai, X.; Luo, G.; Wu, L.; Chen, F.; Wang, J.; Li, Q.; Li, C.; Yang, Y.; et al. Characteristics of soil moisture storage from 1979 to 2017 in the karst area of China. Geocarto Int. 2019, 1–15. [Google Scholar] [CrossRef]
- Deng, Y.; Wang, S.; Bai, X.; Luo, G.; Wu, L.; Chen, F.; Wang, J.; Li, Q.; Li, C.; Yang, Y.; et al. Spatiotemporal dynamics of soil moisture in the karst areas of China based on reanalysis and observations data. J. Hydrol. 2020, 585, 124744. [Google Scholar] [CrossRef]
- Zhou, Q.; Luo, Y.; Zhou, X.; Cai, M.; Zhao, C. Response of vegetation to water balance conditions at different time scales across the karst area of southwestern China—A remote sensing approach. Sci. Total Environ. 2018, 645, 460–470. [Google Scholar] [CrossRef]
- Du, J.; Kimball, J.S.; Jones, L.A.; Kim, Y.; Glassy, J.; Watts, J.D. A global satellite environmental data record derived from AMSR-E and AMSR2 microwave earth observations. Earth Syst. Sci. Data 2017, 9, 791–808. [Google Scholar] [CrossRef] [Green Version]
- Du, J.; Jones, L.A.; Kimball, J. Daily Global Land Surface Parameters Derived from AMSR-E and AMSR2; version 2; NASA National Snow and Ice Data Center Distributed Active Archive Center: Boulder, CO, USA, 2017.
- Du, J.; Kimball, J.S.; Jones, L.A. Passive Microwave Remote Sensing of Soil Moisture Based on Dynamic Vegetation Scattering Properties for AMSR-E. IEEE Trans. Geosci. Remote Sens. 2015, 54, 1–12. [Google Scholar] [CrossRef]
- Wang, F.; Mu, X.-M.; Li, R.; Jiao, J.-Y. Change Characteristic of the Runoff and Sediment Under the Similar Precipitation Condition in the Beiluohe River. J. Water Resour. Water Eng. 2008, 19, 36–40. (In Chinese) [Google Scholar]
- Wang, Q.; Li, R.; Wang, F.; Gao, P. Impact of Human Activities on Runoff and Sediment Change of Yanhe River Based on the Similar Precipitation Condition. Bull. Soil Water Conserv. 2010, 30, 16–20. (In Chinese) [Google Scholar]
- Wang, L.; Wang, F.; Li, P. Relationship between vegetation restoration and soil moisture on the Loess Plateau. Res. Soil Water Conserv. 2017, 24, 180–193. (In Chinese) [Google Scholar]
- Wang, L.; Wei, S.; Wu, F. Soil water environment and vegetation growth in the hilly and gully region of the Loess Plateau: A case study of Yangou Catchment. Acta Ecol. Sin. 2009, 29, 1543–1553. (In Chinese) [Google Scholar]
- Wang, Y.; Shao, M.; Liu, Z. Large-scale spatial variability of dried soil layers and related factors across the entire Loess Plateau of China. Geoderma 2010, 159, 99–108. [Google Scholar] [CrossRef]
- Zhang, C.; Qi, X.; Wang, K.; Zhang, M.; Yue, Y. The application of geospatial techniques in monitoring karst vegetation recovery in southwest China: A review. Prog. Phys. Geog. 2017, 41, 450–477. [Google Scholar] [CrossRef]
- Sarrazin, F.; Hartmann, A.; Pianosi, F.; Rosolem, R.; Wagener, T. V2Karst V1. 1: A parsimonious large-scale integrated vegetation–recharge model to simulate the impact of climate and land cover change in karst regions. Geosci. Model Dev. 2018, 11, 4933–4964. [Google Scholar] [CrossRef] [Green Version]
- Kovačič, G.; Petrič, M.; Ravbar, N. Evaluation and Quantification of the Effects of Climate and Vegetation Cover Change on Karst Water Sources: Case Studies of Two Springs in South-Western Slovenia. Water 2020, 12, 3087. [Google Scholar] [CrossRef]
- Zhu, Z.; Piao, S.; Myneni, R.B.; Huang, M.; Zeng, Z.; Canadell, J.G.; Ciais, P.; Sitch, S.; Friedlingstein, P.; Arneth, A.; et al. Greening of the Earth and its drivers. Nat. Clim. Chang. 2016, 6, 791–795. [Google Scholar] [CrossRef]
- Jiang, Z.; Liu, H.; Wang, H.; Peng, J.; Meersmans, J.; Green, S.M.; Quine, T.A.; Wu, X.; Song, Z. Bedrock geochemistry influences vegetation growth by regulating the regolith water holding capacity. Nat. Commun. 2020, 11, 2392. [Google Scholar] [CrossRef]
- Auler, A.S.; Smart, P.L. The influence of bedrock-derived acidity in the development of surface and underground karst: Evidence from the Precambrian carbonates of semi-arid northeastern Brazil. Earth Surf. Process. Landf. 2003, 28, 157–168. [Google Scholar] [CrossRef]
- Milodowski, D.T.; Mudd, S.M.; Mitchard, E.T.A. Erosion rates as a potential bottom-up control of forest structural characteristics in the Sierram Nevada Mountains. Ecology 2015, 96, 31–38. [Google Scholar] [CrossRef] [PubMed] [Green Version]
Figure 1.
(a) The location, (b) elevation, (c) land use and cover, and (d) lithology of the study area.
Figure 1.
(a) The location, (b) elevation, (c) land use and cover, and (d) lithology of the study area.

Figure 2.
The flow chart of evaluating the effects of vegetation restoration on regional soil moisture content in the humid karst areas.
Figure 2.
The flow chart of evaluating the effects of vegetation restoration on regional soil moisture content in the humid karst areas.

Figure 3.
Temporal variation of (a) the annual average EVI and (b) the soil moisture content in the humid karst areas during 2002–2018.
Figure 3.
Temporal variation of (a) the annual average EVI and (b) the soil moisture content in the humid karst areas during 2002–2018.

Figure 4.
Distribution of (a) the annual average EVI/(b) soil moisture content (cm3/cm3) and (c) multiyear temporal variation trend of annual EVI/(d) soil moisture content in the humid karst areas during 2002–2018 (ESD represents extremely significant decrease; MSD represents more significant decrease; SD represents significant decrease; NSD represents nonsignificant decrease; ESI represents extremely significant increase; MSI represents more significant increase; SI represents significant increase; NSI represents nonsignificant increase, more detailed description of the classes can be found in Table 2).

Figure 5.
(a) Temporal variation, (b) spatial distribution of the annual average precipitation and (c) the spatial distribution variation trend of annual average precipitation (the abbreviations are the same as for Figure 4) in the humid karst areas during 2002–2018.
Figure 5.
(a) Temporal variation, (b) spatial distribution of the annual average precipitation and (c) the spatial distribution variation trend of annual average precipitation (the abbreviations are the same as for Figure 4) in the humid karst areas during 2002–2018.


Table 1.
The information of the soil moisture, EVI, and precipitation.
| Parameter | Time Range | Spatial Resolution | Temporal Resolution | URL |
|---|---|---|---|---|
| Soil moisture content | 2002–2018 | 25 km | daily | https://nsidc.org/data/NSIDC-0451/versions/2 |
| EVI | 2002–2018 | 1 km | monthly | https://ladsweb.modaps.eosdis.nasa.gov/ |
| Precipitation | 2002–2018 | 25 km | monthly | http://data.cma.cn/ |
Table 2.
Division of EVI and soil moisture content variation trend patterns.
| Classes | Combination Scenario | Patterns |
|---|---|---|
| I | s < 0, p < 0.01 | extremely significant decrease (ESD) |
| II | s < 0, 0.01 ≤ p < 0.05 | more significant decrease (MSD) |
| III | s < 0, 0.05 ≤ p < 0.1 | significant decrease (SD) |
| IV | s < 0, p ≥ 0.1 | nonsignificant decrease (NSD) |
| V | s > 0, p < 0.01 | extremely significant increase (ESI) |
| VI | s > 0, 0.01 ≤ p < 0.05 | more significant increase (MSI) |
| VII | s > 0, 0.05 ≤ p < 0.1 | significant increase (SI) |
| VIII | s > 0, p ≥ 0.1 | nonsignificant increase (NSI) |
Notes: s is the slope of linear regression analysis; p is the significance of variation trend.
Table 3.
Division of EVI variation trend coupling with soil moisture content variation trend patterns in the paired years under similar precipitation conditions.
Table 3.
Division of EVI variation trend coupling with soil moisture content variation trend patterns in the paired years under similar precipitation conditions.
| Classes | Combination Scenario | Patterns |
|---|---|---|
| I | Δxs < 0, Δxe > 0 | soil moisture content decrease while EVI increase (− +) |
| II | Δxs < 0, Δxe < 0 | soil moisture content decrease while EVI decrease (− −) |
| III | Δxs > 0, Δxe < 0 | soil moisture content increase while EVI decrease (+ −) |
| IV | Δxs > 0, Δxe > 0 | soil moisture content increase while EVI increase (+ +) |
Notes: Δxs is the difference in soil moisture content between the early stage and the later stage, Δxe is the difference in EVI between the early stage and the later stage.
Table 4.
The area and proportion of soil moisture content and EVI changes in the humid karst areas during 2002–2018.
Table 4.
The area and proportion of soil moisture content and EVI changes in the humid karst areas during 2002–2018.
| Variation Trend | EVI | Soil Moisture Content | ||||
|---|---|---|---|---|---|---|
| Area (104 km2) | Proportion (%) | Area (104 km2) | Proportion (%) | |||
| Extremely significant decrease | 0.81 | 1.03 | 9.10 | 21.06 | 26.66 | 51.66 |
| More significant decrease | 0.63 | 0.79 | 5.88 | 7.44 | ||
| Significant decrease | 0.38 | 0.47 | 2.88 | 3.64 | ||
| Nonsignificant decrease | 5.38 | 6.80 | 11.00 | 13.92 | ||
| Extremely significant increase | 42.81 | 54.19 | 90.90 | 18.75 | 23.73 | 48.34 |
| More significant increase | 10.38 | 13.13 | 6.25 | 7.91 | ||
| Significant increase | 4.06 | 5.14 | 3.19 | 4.03 | ||
| Nonsignificant increase | 14.56 | 18.43 | 10.00 | 12.66 | ||
Table 5.
The area and proportion of precipitation variation trend in the humid karst areas during 2002–2018.
Table 5.
The area and proportion of precipitation variation trend in the humid karst areas during 2002–2018.
| Variation Trend | Precipitation | ||
|---|---|---|---|
| Area (104 km2) | Proportion (%) | ||
| Extremely significant decrease | 0 | 0 | 67.71 |
| More significant decrease | 0 | 0 | |
| Significant decrease | 0 | 0 | |
| Nonsignificant decrease | 53.50 | 67.71 | |
| Extremely significant increase | 0 | 0 | 32.29 |
| More significant increase | 0.13 | 0.16 | |
| Significant increase | 1.70 | 2.15 | |
| Nonsignificant increase | 23.69 | 29.98 | |
Table 6.
The proportion (%) of similar precipitation conditions and interaction variation trends of EVI and soil moisture content in the paired years with similar precipitation conditions in the humid karst areas during 2002–2018 (“− +” means soil moisture content decreased while EVI increased, “− −” means soil moisture content decreased while EVI decreased, “+ −” means soil moisture content increased while EVI decreased, “+ +” means soil moisture content increased while EVI increased, a more detailed description of the classes can be seen in Table 3).
| Interval Time of Paired Years | Paired Years | The Proportion of Similar Precipitation Conditions | The Ratio of Soil Moisture Content and EVI Changes under Similar Precipitation Conditions | Interval Time of Paired Years | Paired Years | The Proportion of Similar Precipitation Conditions | The Ratio of Soil Moisture Content and EVI Changes under Similar Precipitation Conditions | ||||||
|---|---|---|---|---|---|---|---|---|---|---|---|---|---|
| − + | − − | + − | + + | − + | − − | + − | + + | ||||||
| 5 | 2002–2007 | 33.69 | 12.75 | 11.94 | 4.69 | 4.31 | 9 | 2002–2011 | 5.12 | 3.81 | 0.56 | 0.75 | 0 |
| 2003–2008 | 3.31 | 1.25 | 0.81 | 1.06 | 0.19 | 2003–2012 | 40.94 | 18.19 | 9.44 | 9.81 | 3.5 | ||
| 2004–2009 | 20.89 | 10.25 | 8.38 | 1.13 | 1.13 | 2004–2013 | 21.25 | 6.31 | 11.88 | 1.25 | 1.81 | ||
| 2005–2010 | 31.26 | 7.06 | 15.63 | 2.44 | 6.13 | 2005–2014 | 16.95 | 6.5 | 7.13 | 1.69 | 1.63 | ||
| 2006–2011 | 19.75 | 10.81 | 3.06 | 5.25 | 0.63 | 2006–2015 | 18.2 | 8.63 | 3.69 | 4.88 | 1 | ||
| 2007–2012 | 21.44 | 7.06 | 1.38 | 11.69 | 1.31 | 2007–2016 | 40.75 | 16.81 | 14.25 | 6.38 | 3.31 | ||
| 2008–2013 | 24.2 | 9.69 | 6.69 | 4.44 | 3.38 | 2008–2017 | 49.82 | 18.63 | 25.06 | 3.38 | 2.75 | ||
| 2009–2014 | 21.26 | 7.38 | 4.19 | 7.63 | 2.06 | 2009–2018 | 2.25 | 0.81 | 0.56 | 0.44 | 0.44 | ||
| 2010–2015 | 11.94 | 3.5 | 5.25 | 2.44 | 0.75 | 10 | 2002–2012 | 27.69 | 10.81 | 7.06 | 6.69 | 3.13 | |
| 2011–2016 | 7.63 | 2.13 | 2.75 | 1.31 | 1.44 | 2003–2013 | 26.94 | 11.63 | 9.31 | 4 | 2 | ||
| 2012–2017 | 14.51 | 0.94 | 11.25 | 0.44 | 1.88 | 2004–2014 | 13.38 | 3.06 | 8.44 | 0.44 | 1.44 | ||
| 2013–2018 | 24.13 | 6.69 | 12.25 | 1.63 | 3.56 | 2005–2015 | 18.5 | 8.31 | 5.56 | 3.38 | 1.25 | ||
| 6 | 2002–2008 | 38.64 | 18.13 | 9.94 | 6.19 | 4.38 | 2006–2016 | 30.06 | 12 | 14.69 | 2.06 | 1.31 | |
| 2003–2009 | 30.57 | 8.88 | 13.44 | 4.25 | 4 | 2007–2017 | 32.69 | 13 | 14.19 | 3.56 | 1.94 | ||
| 2004–2010 | 32 | 2.88 | 21.06 | 1.25 | 6.81 | 2008–2018 | 51.13 | 19.75 | 24.25 | 3.94 | 3.19 | ||
| 2005–2011 | 22.25 | 10.56 | 8.31 | 2.25 | 1.13 | 11 | 2002–2013 | 27.12 | 14 | 7.81 | 4 | 1.31 | |
| 2006–2012 | 30.88 | 16.06 | 3.63 | 10 | 1.19 | 2003–2014 | 22.27 | 10.38 | 4.38 | 5.88 | 1.63 | ||
| 2007–2013 | 21.94 | 12.44 | 3.31 | 4.63 | 1.56 | 2004–2015 | 10.38 | 2.56 | 6.25 | 0.88 | 0.69 | ||
| 2008–2014 | 30.87 | 6.06 | 15.5 | 3 | 6.31 | 2005–2016 | 27.45 | 9.63 | 15.25 | 0.94 | 1.63 | ||
| 2009–2015 | 5.26 | 1.19 | 0.88 | 2.56 | 0.63 | 2006–2017 | 21.69 | 10.94 | 8.5 | 1.69 | 0.56 | ||
| 2010–2016 | 32.57 | 11.19 | 16.31 | 2.63 | 2.44 | 2007–2018 | 45.56 | 19.25 | 17.31 | 4.75 | 4.25 | ||
| 2011–2017 | 1.25 | 0.31 | 0.56 | 0.13 | 0.25 | 12 | 2002–2014 | 28.25 | 11.31 | 13.63 | 1.06 | 2.25 | |
| 2012–2018 | 26.19 | 1.5 | 21.5 | 0.13 | 3.06 | 2003–2015 | 9.45 | 2.75 | 3.69 | 2.63 | 0.38 | ||
| 7 | 2002–2009 | 3.25 | 0.81 | 1.56 | 0.38 | 0.5 | 2004–2016 | 39.06 | 13.94 | 19.31 | 3.31 | 2.5 | |
| 2003–2010 | 37.01 | 9.38 | 15.13 | 5.19 | 7.31 | 2005–2017 | 17.19 | 9 | 6 | 1.5 | 0.69 | ||
| 2004–2011 | 8.75 | 2 | 6 | 0.19 | 0.56 | 2006–2018 | 28.13 | 12.75 | 13.13 | 1.5 | 0.75 | ||
| 2005–2012 | 31.52 | 17.38 | 5.88 | 6.13 | 2.13 | 13 | 2002–2015 | 30 | 10 | 14.56 | 2.81 | 2.63 | |
| 2006–2013 | 42.94 | 25.31 | 6.88 | 9.56 | 1.19 | 2003–2016 | 20.45 | 6.63 | 12 | 0.63 | 1.19 | ||
| 2007–2014 | 15.32 | 5.88 | 6.06 | 1.19 | 2.19 | 2004–2017 | 12.56 | 5.81 | 5.19 | 1.31 | 0.25 | ||
| 2008–2015 | 46.06 | 12.81 | 22.94 | 4 | 6.31 | 2005–2018 | 28.32 | 10.75 | 16 | 0.44 | 1.13 | ||
| 2009–2016 | 5.13 | 1.81 | 2 | 0.63 | 0.69 | 14 | 2002–2016 | 37.26 | 13.25 | 16.69 | 4.69 | 2.63 | |
| 2010–2017 | 18.82 | 5.75 | 10.63 | 1.44 | 1 | 2003–2017 | 6.32 | 1.88 | 3.81 | 0.44 | 0.19 | ||
| 2011–2018 | 1.76 | 0.38 | 0.56 | 0.38 | 0.44 | 2004–2018 | 31.5 | 12.31 | 15.38 | 2.31 | 1.5 | ||
| 8 | 2002–2010 | 24.19 | 7.44 | 8.94 | 4.75 | 3.06 | 15 | 2002–2017 | 37.26 | 14.13 | 19.06 | 2.38 | 1.69 |
| 2003–2011 | 29.56 | 13.75 | 6.75 | 6.5 | 2.56 | 2003–2018 | 9.88 | 2.06 | 7.13 | 0.25 | 0.44 | ||
| 2004–2012 | 24.07 | 9.19 | 10.19 | 2.25 | 2.44 | 16 | 2002–2018 | 49.87 | 19.31 | 25.94 | 3.06 | 1.56 | |
| 2005–2013 | 32.57 | 16.75 | 9.69 | 4.5 | 1.63 | ||||||||
| 2006–2014 | 27.38 | 13.75 | 6.75 | 5.19 | 1.69 | ||||||||
| 2007–2015 | 20.07 | 6.38 | 10.5 | 1.56 | 1.63 | ||||||||
| 2008–2016 | 29.51 | 10.94 | 12.13 | 3.75 | 2.69 | ||||||||
| 2009–2017 | 3.12 | 0.81 | 1.56 | 0.5 | 0.25 | ||||||||
| 2010–2018 | 31.19 | 9 | 19.69 | 1.25 | 1.25 | ||||||||
Publisher’s Note: MDPI stays neutral with regard to jurisdictional claims in published maps and institutional affiliations. |
© 2021 by the authors. Licensee MDPI, Basel, Switzerland. This article is an open access article distributed under the terms and conditions of the Creative Commons Attribution (CC BY) license (http://creativecommons.org/licenses/by/4.0/).
Share and Cite
MDPI and ACS Style
Wei, X.; Zhou, Q.; Cai, M.; Wang, Y. Effects of Vegetation Restoration on Regional Soil Moisture Content in the Humid Karst Areas—A Case Study of Southwest China. Water 2021, 13, 321. https://doi.org/10.3390/w13030321
AMA Style
Wei X, Zhou Q, Cai M, Wang Y. Effects of Vegetation Restoration on Regional Soil Moisture Content in the Humid Karst Areas—A Case Study of Southwest China. Water. 2021; 13(3):321. https://doi.org/10.3390/w13030321
Chicago/Turabian StyleWei, Xiaocha, Qiuwen Zhou, Mingyong Cai, and Yujuan Wang. 2021. "Effects of Vegetation Restoration on Regional Soil Moisture Content in the Humid Karst Areas—A Case Study of Southwest China" Water 13, no. 3: 321. https://doi.org/10.3390/w13030321
Note that from the first issue of 2016, this journal uses article numbers instead of page numbers. See further details here.