Article

Study of the Influence of Temperature on Boron Concentration Estimation in Desalinated Seawater for Agricultural Irrigation

by
David Escarabajal-Henarejos
1,
Dolores Parras-Burgos
2,*,
Laura Ávila-Dávila
1,
Francisco Javier Cánovas-Rodríguez
3 and
José Miguel Molina-Martínez
1
1
Agromotic Engineering and the Sea Research Group, Universidad Politécnica de Cartagena, 30202 Cartagena, Spain
2
Department of Structures, Construction and Graphic Expression, Universidad Politécnica de Cartagena, 30202 Cartagena, Spain
3
Electrical Engineering and Renewable Energies Group, Department of Automation, Electrical Engineering and Electronic Technology, Universidad Politécnica de Cartagena, 30202 Cartagena, Spain
*
Author to whom correspondence should be addressed.
Water 2021, 13(3), 322; https://doi.org/10.3390/w13030322
Submission received: 21 November 2020 / Revised: 22 January 2021 / Accepted: 25 January 2021 / Published: 28 January 2021

Abstract

:
After several decades, the incorporation of desalinated seawater into agricultural areas with scarce water resources has become one of the main water supply strategies. Compared to the several currently available desalination techniques, reverse osmosis (RO) is now the reference technology because it lowers energy uses and production costs. Nevertheless, its main limiting factor lies in the membranes used for this system not efficiently retaining boron, which is a problem because the concentration of this element in seawater is high. For 3 years, the present work analysed the impact of seawater temperature on the kinetic parameters of boron rejection in an RO system to establish their annual behaviour and the existing correlation between both parameters. A comparison was made using the values simulated in the projection software provided by the manufacturer of the membranes. The obtained results indicated a high correlation, and the R2 correlation coefficients came very close to the unity. Nonetheless, this correlation lowered with time due to typical membrane ageing and compaction because of the system’s continuous operation. Under the tested working conditions and by applying analysed temperature intervals, it was impossible to reach the 0.3 mg·L−1 boron concentration value that ensures lack of crop toxicity. Thus, incorporating other boron reduction techniques is necessary.

1. Introduction

Boron is considered one of the seven essential micronutrients for normal plant development. The favourable effect of boron on plant growth was observed for the first time by [1] and its main physiological effects have been related to cell wall development and resistance, cell division, fruit set and seed development, transport of sugars, and the stimulation or inhibition of specific metabolic pathways [2].
Plant boron absorption is controlled by the boron level in soil solution, which is a passive (nonmetabolic) process that depends directly on the transpiration rate. The range of boron concentrations in soil solution at which plants can suffer adverse effects is very narrow (0.3–1.0 mg·L−1) [3,4,5]. Lack of this micronutrient in plants can lead to floral bud malformation, dry shoots, wilting, poor pollen viability, inhabited seed development, slow root development or other symptoms depending on how severe boron deficiency is [6,7,8,9,10].
Conversely, high boron concentrations can also cause toxicity symptoms that may affect commercial crop performance when visible symptoms are very serious [11]. These symptoms consist mostly in reduced root growth as cell division diminishes, delayed shoot and root growth, inhibited photosynthesis, low chlorophyll levels in leaves, etc. In most cases, toxicity systems ruled by boron are marginal chlorosis, leaf necrosis or even defoliation, and can end in plants dying [12,13,14]. The previously described phytotoxicity effects are due mainly to using irrigation water contaminated by high boron concentrations.
In areas with limited water resources, seawater desalination is usually resort to supply water for both human and agricultural uses given its endless water resource condition and it not being subject to climate variations. Of all the desalination techniques available today, reverse osmosis (RO) has become the reference technology to desalinate seawater, also because of its low energy use and production costs compared to other available technologies.
This technology is based on a salts solution-diffusion process performed by means of high-efficiency semipermeable membranes, used to retain the main ions present in seawater responsible for its high salinity (sodium, chlorides, magnesium, sulphates, etc.), with retention rates that are similar to or higher than 99% [15].
Nevertheless, applying water desalinated by RO implies one main limiting factor: the employed membranes do not retain most of the boron in water (over 95%), which is a problem because the concentration of this element in seawater is high [16]. The boron concentration in seawater in south Europe can reach up to 4.5 mg·L−1 [15], with slightly higher values (approx. 4.8 mg·L−1) in the Mediterranean [4], which can even reach 7 mg·L−1 in the Persian Gulf [17]. Given the high concentrations of boron present in sea water [14], despite the fact that RO membrane technology achieves high boron retention efficiencies (over 90%) [18], the permeated water obtained has high concentrations, above the limits recommended for its application in irrigation; this fact is becoming the main limiting factor.
Moreover, the boron concentration in seawater desalinated by RO presents no homogeneity over time as it is conditioned by: (i) temporal factors like ageing and compacted membranes, associated with less efficient boron retention; (ii) RO system management factors, such as operating pressure or the pH of the water that feeds membranes and (iii) factors related to climate variations, mainly seawater temperature, which is the main conditioning factor to bear in mind when establishing different scenarios to design RO systems [19].
The Spanish and European boron standard for drinking water is 1 mg·L−1 [14,20]. However, this value is too high to ensure lack of crop toxicity, and its concentration should be lower to 0.3 mg·L−1 [21]. Therefore, seawater desalinated by RO must be submitted to additional treatments [22,23] that are sufficiently efficient in meeting boron concentration requirements. One such treatment involves applying a second RO stage, controlling the feedwater pH, using ionic exchange resins or, as a last resource, a mixture with continental waters to lower the high boron concentration [24].
Of all the factors that affect boron retention efficiency, seawater temperature directly influences water and ions diffusion through semipermeable membranes [24,25]. Hence, variations in temperature can bring about changes in salt rejection efficiency by affecting the pressure at which the system works [26]. Therefore, the aim of this work is to study the influence of temperature on the kinetic parameters of boron rejection in an RO system by determining the seasonality of the process and establishing the existing correlation between both parameters to estimate the boron concentration in desalinated seawater for agricultural irrigation.

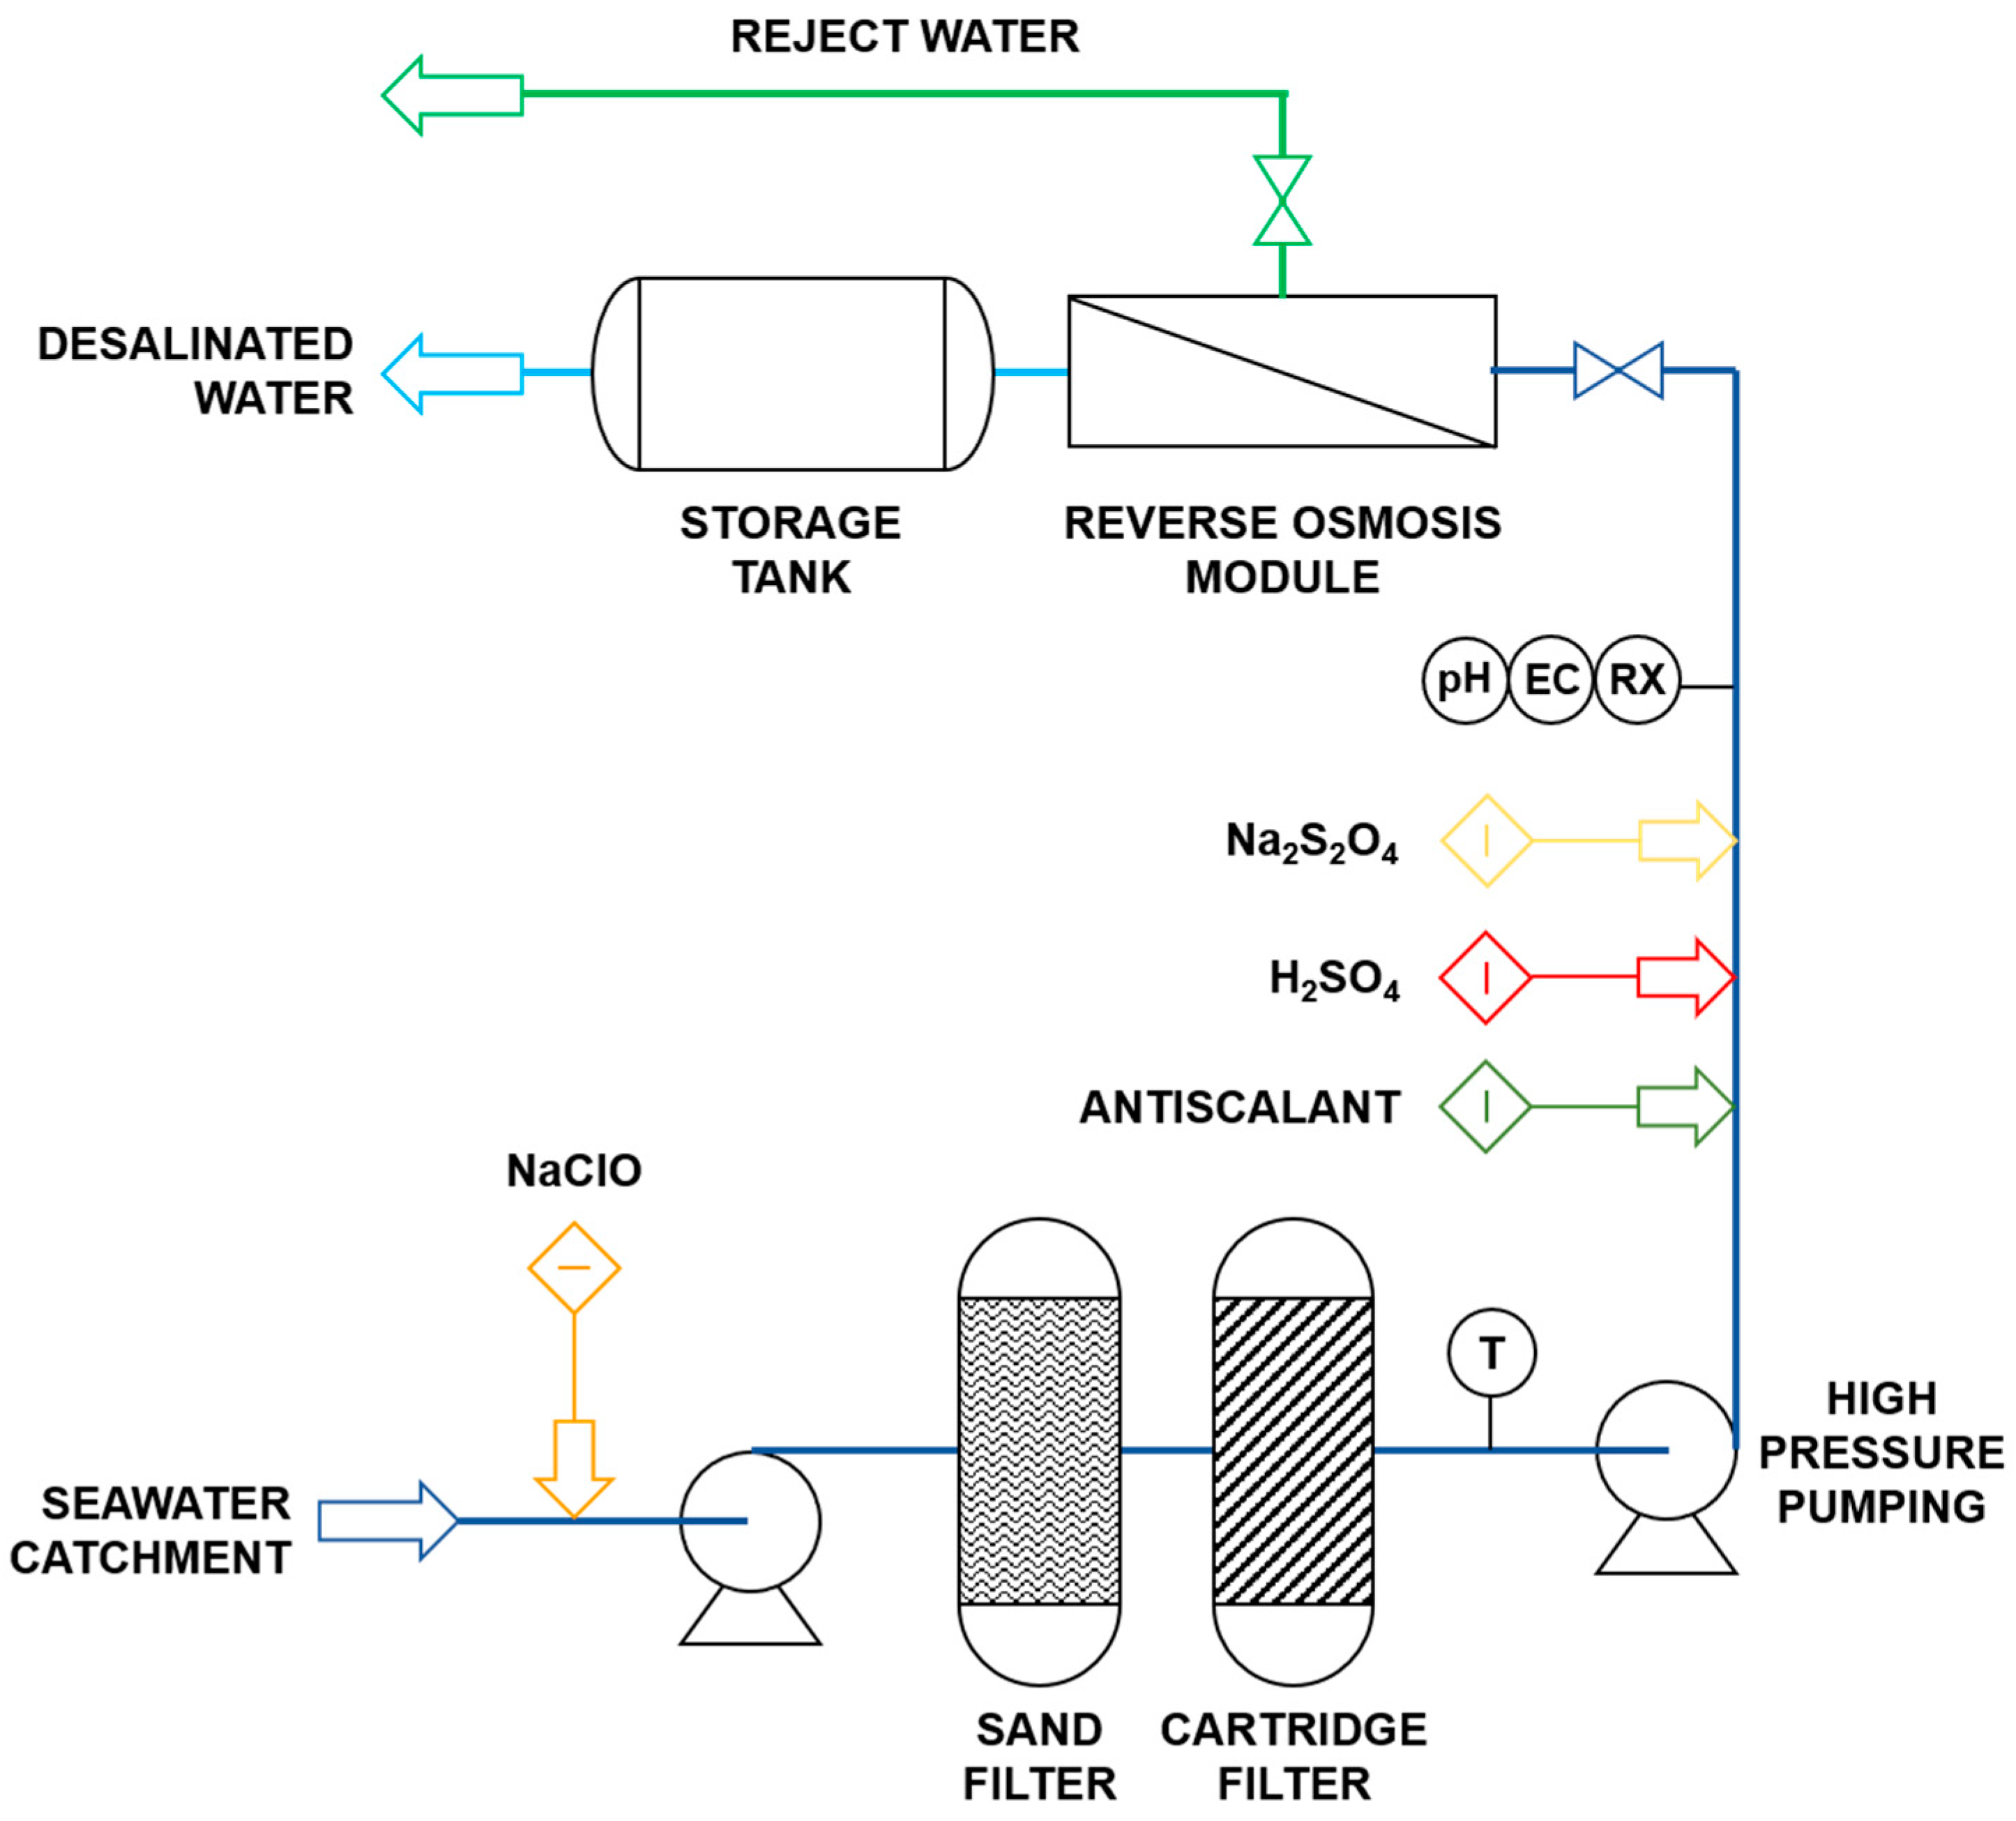
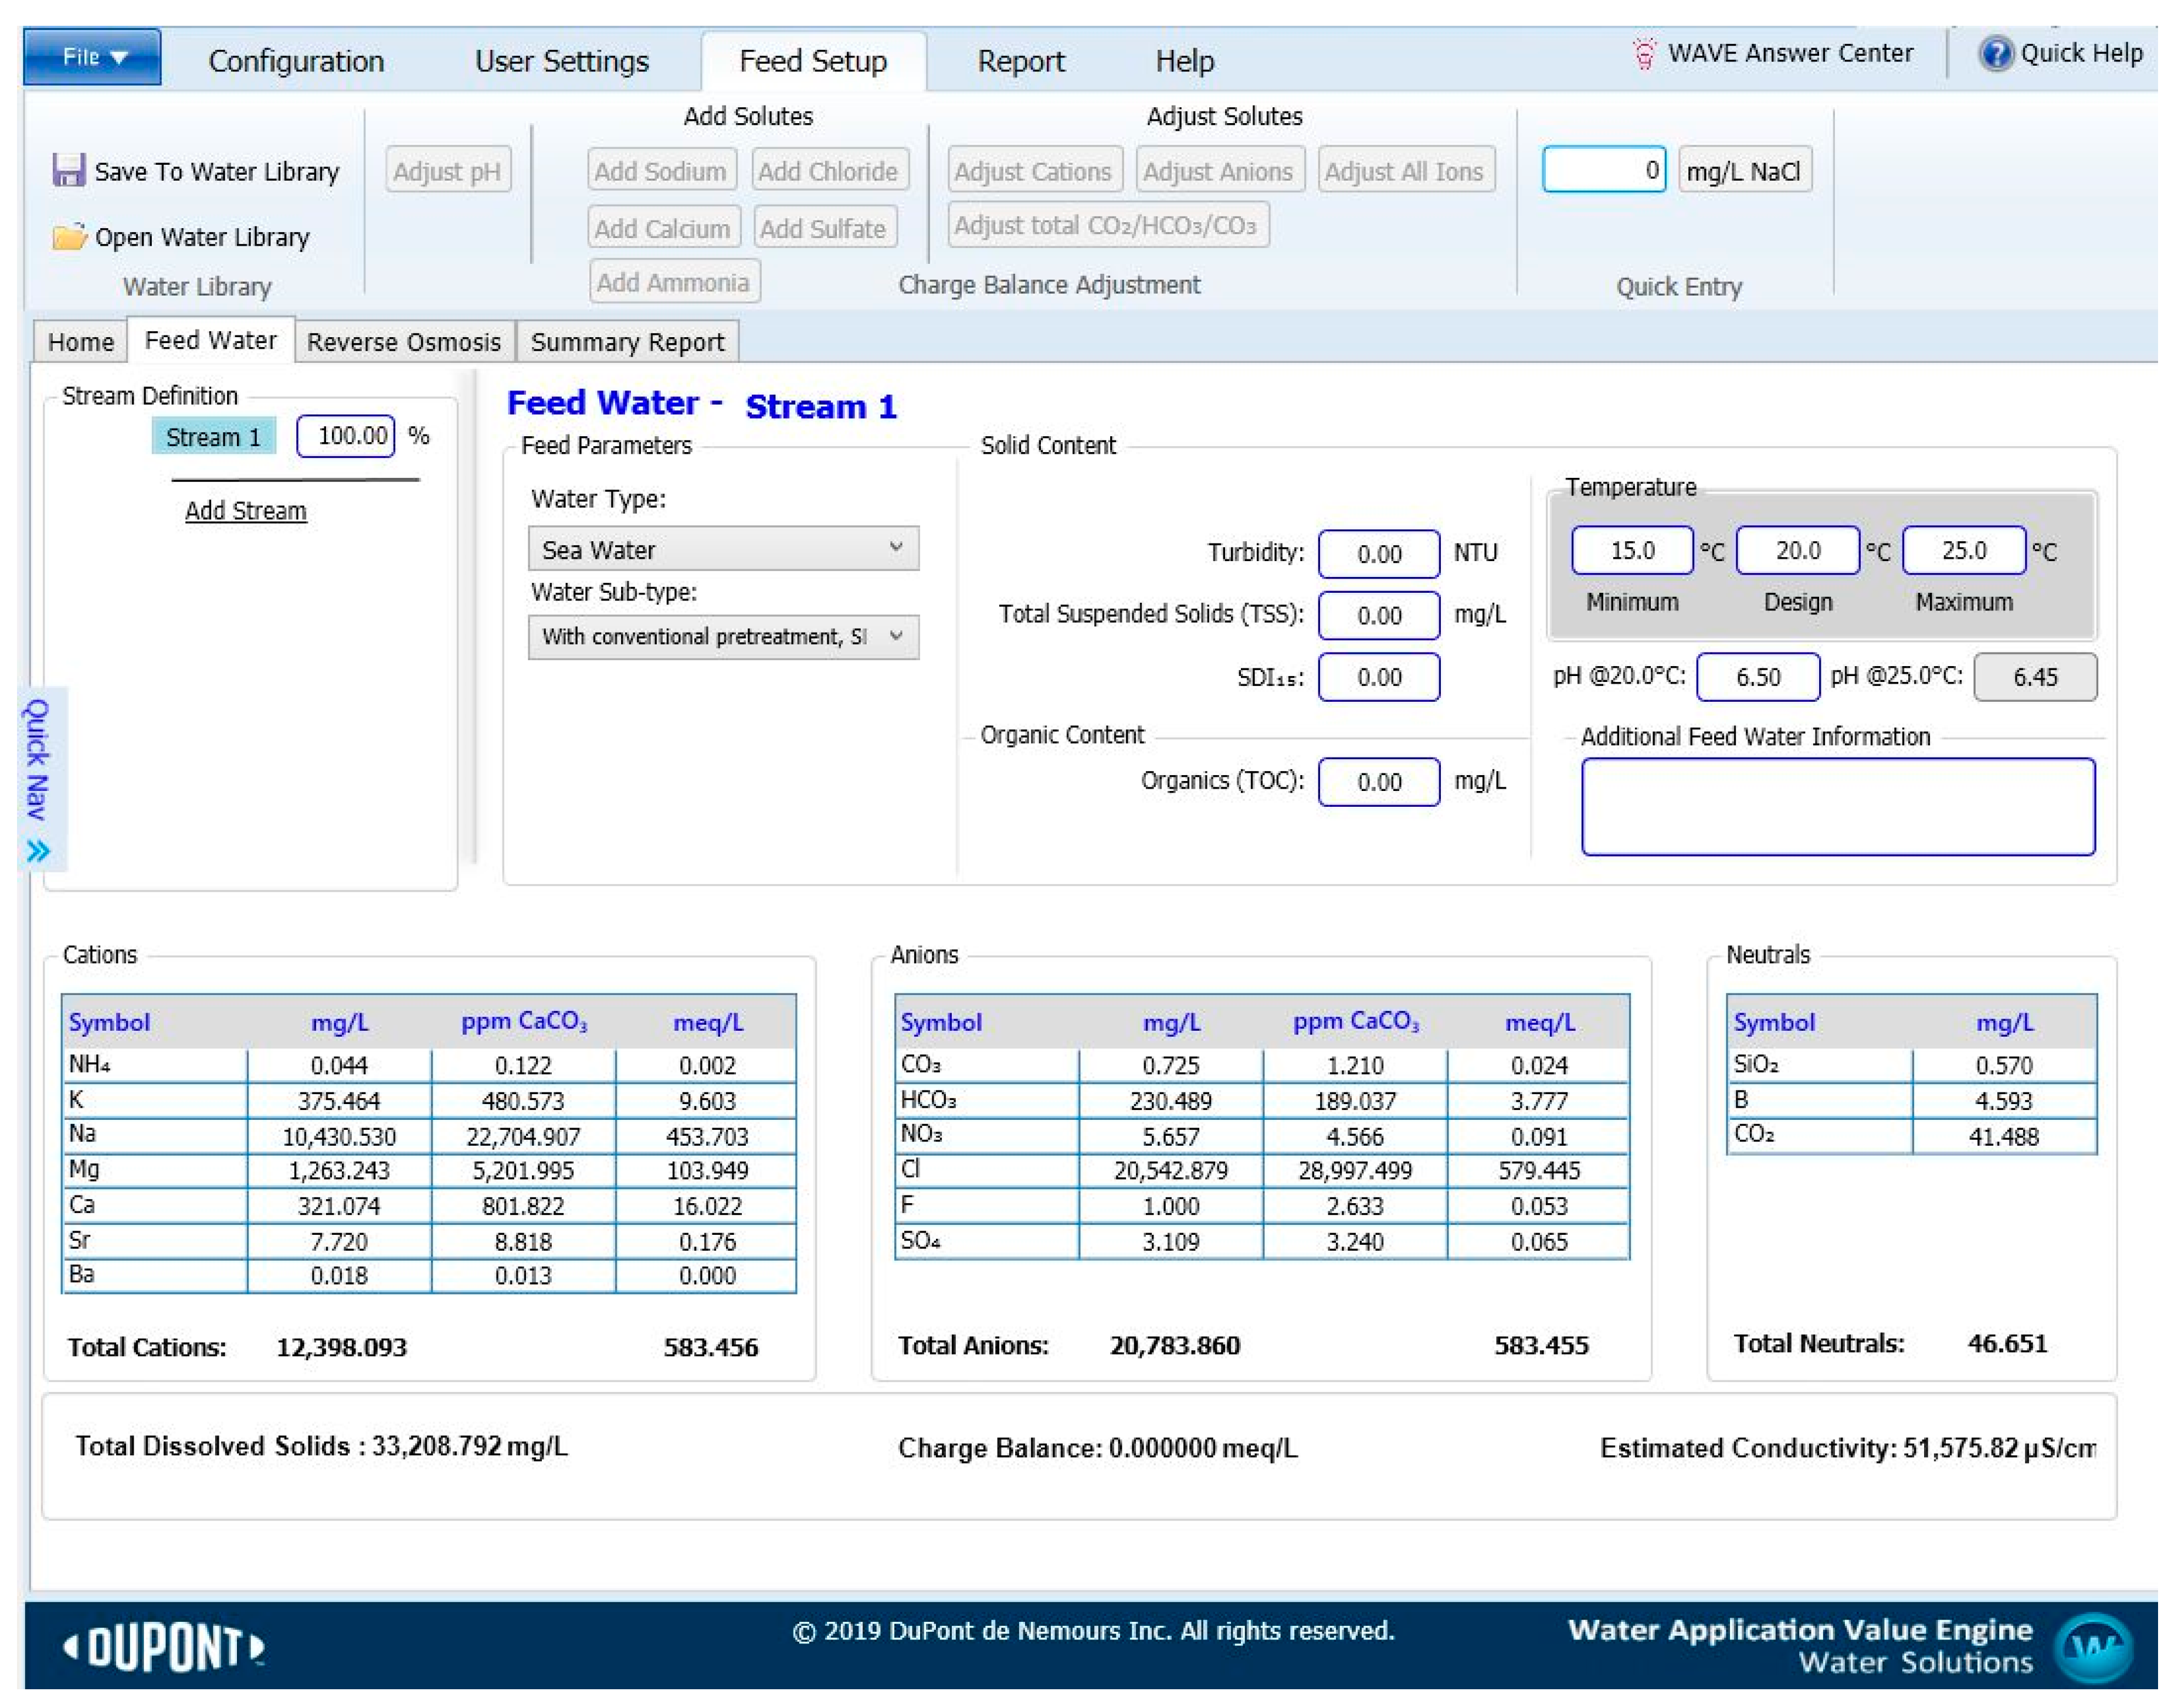
2. Materials and Methods
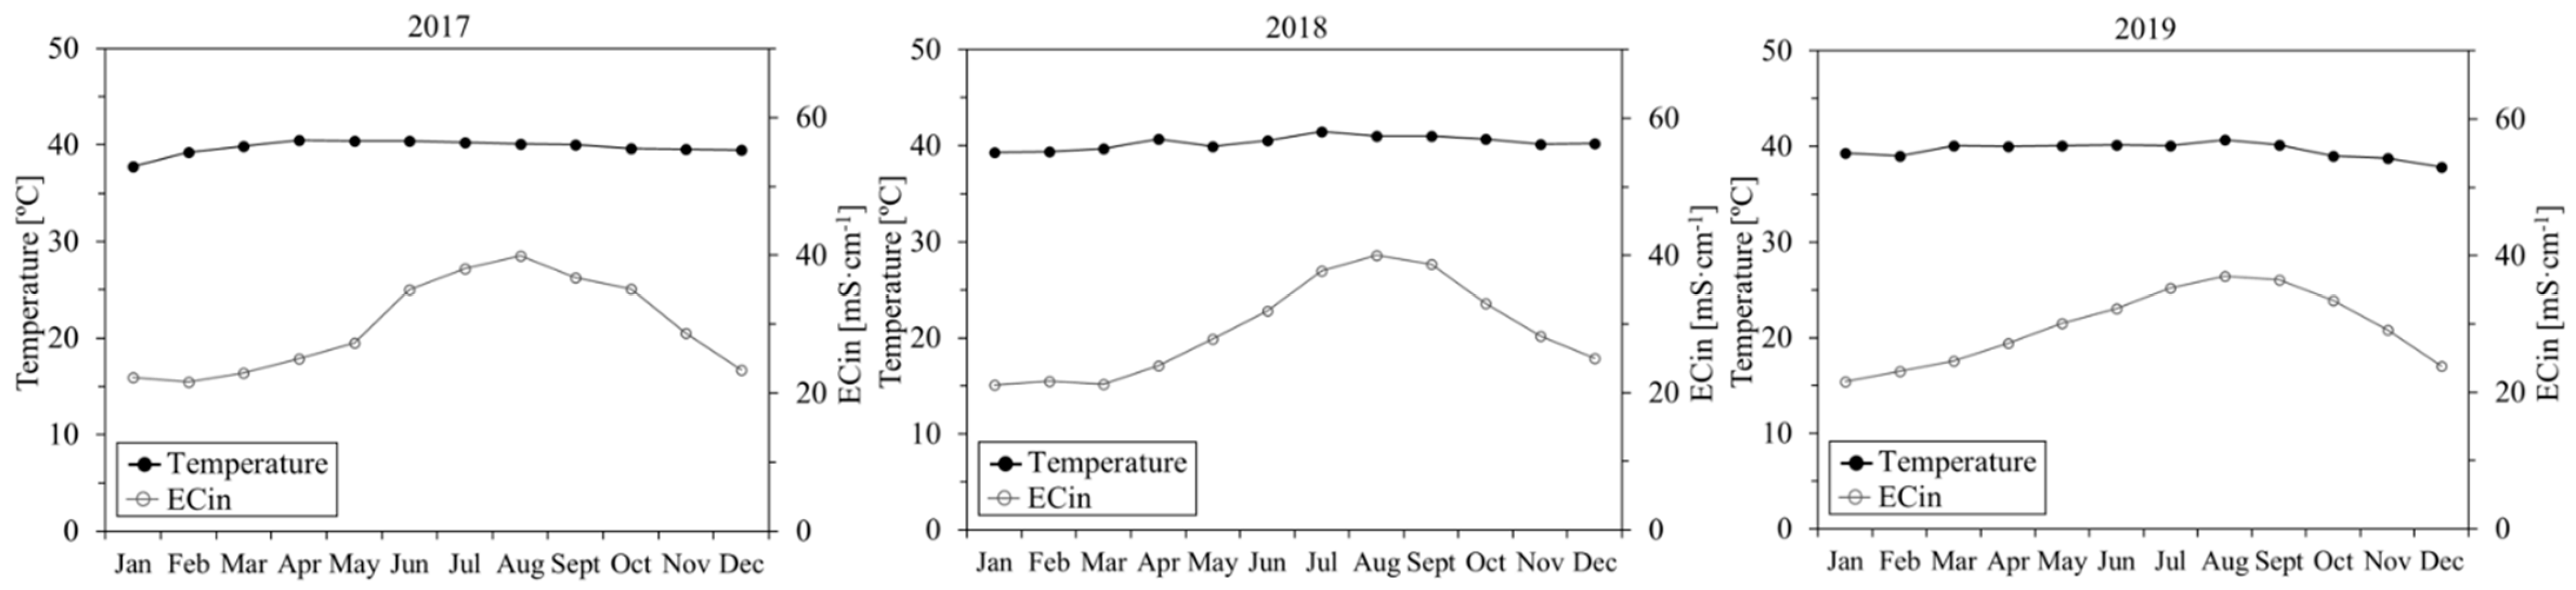
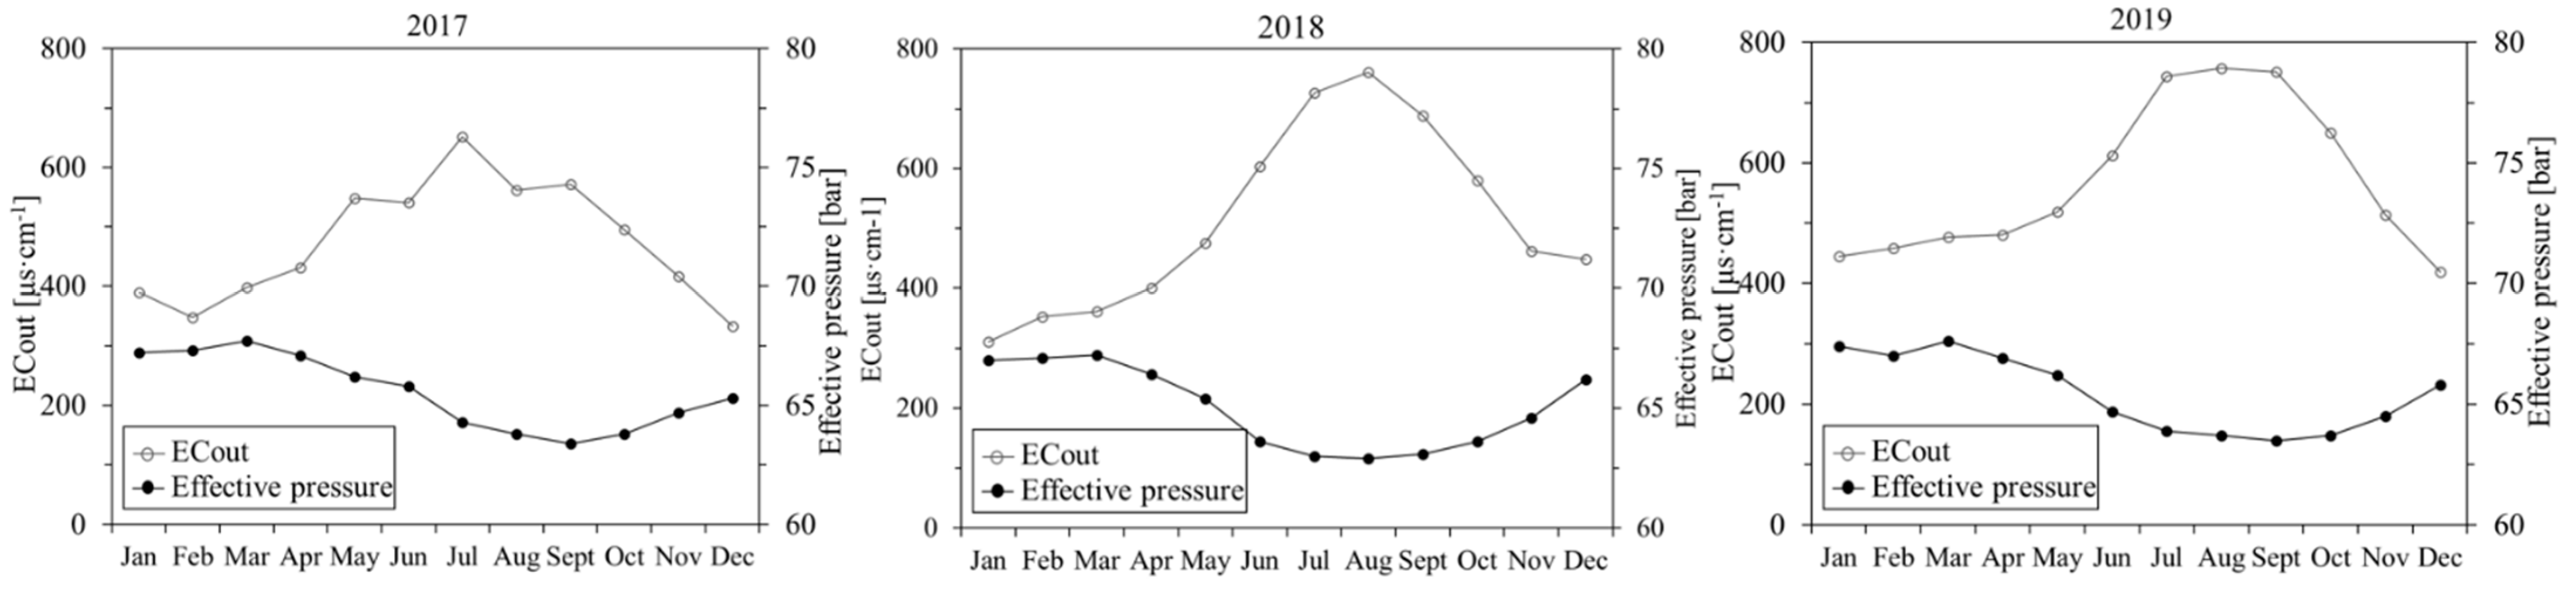
The experimental trials took place in 2017, 2018 and 2019 with a continuous pilot-scale RO system (Figure 1). Seawater was obtained via open collection and was disinfected by dosing sodium hypochlorite at a dose of 1 mg·L−1 to avoid the biological fouling of RO membranes. In order to control colloidal fouling, feedwater was physically treated by filtration on a volcanic sand and siliceous sand bed in a first stage and then with polypropylene-wound cartridges in a second stage, which gave a filtering selectivity of 5 µm. Finally, 0.8 mg·L−1 of an antiscalant chemical agent (PermaTreat PC-1020T of ECOLAB Inc., St. Paul, MN, USA) was added.
Before high-pressure pumping, a chemical pretreatment was performed, which consists in dosing sodium metabisulphite at a concentration of 1 mg·L−1 to remove residual chlorine and to, thus, protect the RO membrane from oxidation given this element’s poor tolerance to chloride (<0.1 mg·L−1). To prevent calcium carbonate precipitation in membranes, seawater pH was left at 6.5 throughout testing by dosing 98%/99% sulphuric acid at a dose of 25 mg·L−1.
Feedwater was driven by a piston pump model 281 of brand CAT PUMPS, a high-pressure module equipped with seven membranes (8” outer diameter) with high salt (99.8%) and boron (92%) rejection of the brand Dow FilmTec Co. (Midland, MI, USA), model SW30HRLE-440i, which operates at a feedwater flow of 7000 L·h−1 and 70 bar pressure, obtaining a total recovery of the system R = 0.495, defined according to Equation (1):
R = Q p Q f
where Qp is the permeate flow and Qf is the feed flow to the system [27].
In order to provide the system with a permeated water reservoir to displace seawater from the RO membranes (in the event of system shutdown and/or cleaning), a continuous storage tank of permeated water with a capacity of 500 L was provided.
The system’s set of instruments was made up of three devices to measure pH, electric conductivity (EC) and redox potential (fitted on the pressure line to the RO membranes); a PT-100 temperature probe (fitted on the high-pressure pump’s intake line to control and regulate the physicochemical parameters of feedwater); a pressure transmitter on the pump’s driveline and another on the permeate water line to accomplish effective pressure in the system as the difference between both measurements and three rotameters to control and regulate feedwater, permeate water and rejected water flows.
The boron content in the obtained seawater was monitored by UV–visible spectrophotometry using the HACH laboratory DR3900 spectrophotometer model and HACH model LCK307 boron test cuvettes, which allow boron concentrations between 0.05 and 2.5 mg·L−1 to be measured.
At the same time, as the experimental data were acquired, the pilot system’s performance was simulated in a computer to determine the expected boron concentration and rejection efficiency, provided by the manufacturer of the RO membranes, with the WAVE computer package (Water Application Value Engine) of DUPONT (version 1.72.724). The WAVE is a new modelling software program that integrates three of the leading technologies (ultrafiltration, reverse osmosis and ion exchange resin) into one comprehensive platform. The WAVE software is based on the diffusion model and integrates the equations of that model for the simulation of a flow of molecules through a semipermeable membrane and is used to design and simulate the operation of water treatment systems using the UF, RO and IER component technologies [28]. Figure 2 and Figure 3 show the input parameters in the WAVE software for the 2019 simulation.

3. Results

During our trial period (years 2017, 2018 and 2019), no significant variations were detected in both the physical parameters and chemical composition of feedwater. The concentrations of the main compounds responsible for water salinity (sodium and chlorides) had practically constant mean values of 11,890 and 20,553 mg·L−1, respectively. As seen in Figure 1, the feedwater EC values were always higher than 54 mS·cm−1, except in January 2017 and December 2019, when they were 52.93 and 52.95 mS·cm−1, respectively, as a result of the rainwater inputs to the sea from heavy rainfall in these 2 months. Moreover, and as expected, the annual feedwater temperature range was 15.5–28.5 °C in 2017, 15.1–28.6 °C in 2018 and 15.5–26.4 °C in 2019 (Figure 4), which led to considerable variations in the permeate water characteristics.
No significant variations were observed in the boron concentration of feedwater in the 3 years that the trial lasted, with mean annual values of 4.95, 4.78 and 4.61 mg·L−1 for 2017, 2018 and 2019, respectively. This amount of boron in feedwater allowed a balance to be struck between boric acid and the borate ion, where the predominate species was boric acid regardless of the boron source being boric acid or one of the borates because boric acid is easily dissolved in water (solubility of 55 g·L−1 at 298 K), where it acts like a very weak Lewis acid (pKa = 9.2 at a temperature of 298 K).
The creation of a basic means meant that the predominate species was the borate ion, which is best rejected by RO membranes [23]. Nonetheless, this proved incompatible with the requirement to operate at an acidic pH to avoid fouling membranes as a result of carbonates precipitating on membrane surfaces. This justified having to constantly maintain the feedwater pH at 6.5 throughout the trial.
Table 1 provides the monthly values recorded for temperature, EC, boron concentration in seawater and the effective pressure at which the system operated. This was obtained as the difference between feed pressure and permeate pressure, which, in turn, determined the system’s real rejection efficiency.
Figure 5 represents the monthly EC evolution of permeate water and the effective pressure during the 3 years the trial lasted. The EC of the permeate water reached a minimum 311 µS·cm−1 at the lowest temperature (15.1 °C) and 761 µS·cm−1 when the temperature was at its highest (28.6 °C). This variation was expected as a rise in temperature in RO membranes diminishes their salt rejection efficiency. For the EC of permeate water, a major interannual difference was observed in the values recorded in 2017 and those recorded in 2018 and 2019 as a result of typical membrane ageing and compaction. The biological fouling of RO membranes was ruled out as an acidic pH for feedwater was maintained throughout testing. This implies that for similar temperature values in hotter months (July and August), the permeate water EC was higher in permeate water in 2018 and 2019.
During our 3-year study period, the effective pressure applied in the RO process performed similarly. The highest effective pressure values were obtained in those months when the feedwater temperature was lower, with a mean value of approximately 67.1 bar for all 3 study years. This value progressively dropped to 63.2 bar in hot months, which allowed the process’ energy costs to lower. This performance responds to a higher feedwater temperature, which favours the diffusion process through membranes and leads to higher permeate flow, but worse water quality, when the EC and boron concentration are higher (Figure 5).

4. Discussion

In the work carried out by Hung et al. [29], the influence of feed water temperature on the different kinetic parameters of solutes transport through the membrane was studied. It was demonstrated that membrane permeability is the main parameter involved in the transport process of the different solutes, which, in turn, depends on the chemical composition of the membrane. On the other hand, Hyung et al. [30] studied the behaviour of boron retention mechanisms in RO systems based on different operating conditions; however, the results obtained by both authors are based on the application of the theoretical solution-diffusion model and not on data obtained experimentally. In the present work, carried out under specific operating conditions, the experimental results obtained from boron concentrations in the permeated water were related to the variable temperature of the feed water by means of a simple linear regression analysis (Figure 6). For the years analysed, determination coefficients R2 were obtained very close to unity (0.97, 0.95 and 0.88 for 2017, 2018 and 2019, respectively), which shows that feed water temperature is a parameter capable of predicting boron concentration in permeated water quite accurately, based on experimental modelling and development of equations, since boron is a compound that must be determined a posteriori. Although the duration of the study is relatively short in comparison with the useful life of the RO membranes (which can be extended to 20 years, depending on the quality of the seawater and the maintenance and operation carried out on it), an annual decrease in this dependence can be observed in the reduction in the coefficients of determination R2, which is due to ageing, fouling and compaction of the membrane, effects that are not considered by other authors [29,30,31]. These effects influence the temperature-boron ratio due to the alteration of the hydraulic characteristics of the membrane (due to its exhaustion), as well as the active layer of the membrane, as a result of the chemical products used for its microbiological cleaning and conservation.
Parallel to the experimental development, a simulation of the RO system was carried out using DUPONT’s WAVE software. The simulation used the initial chemical composition values of seawater obtained in 2017, given their low variability, and only the concentration of boron in the seawater was modified. This simulation also shows the dependence between the water temperature and the boron concentration in the desalinated water, as the software is based on the theoretical model of solution-diffusion. However, in all the simulated scenarios, given the conservative nature of the manufacturer, the estimated boron concentration values were higher than those obtained experimentally (Figure 6), providing an overall boron rejection efficiency lower than that actually obtained (Figure 7). This overestimation was more pronounced in the hottest months (April–September: 31.65% annual average) and lower in the coldest (October–March: 22.02% annual average). Despite the fact that this software allows the establishment of a “Flow Factor” to adjust the theoretical conditions to the real operating conditions of the system, this was not considered in the estimates because the real values of boron concentration in the permeated water were not known. Moreover, this is a parameter established by the RO system designer based on his own experience.
Boron rejection efficiency (Er) did not reach the values provided by the manufacturer of the membranes in any studied month (92%), but obtained efficiency values of about 80–85% in colder months and approximately 70–75% in hotter months. These values agree with those proposed by [32] using a single-pass SWRO (Seawater Reverse Osmosis) system.
The levels of boron in the desalinated water are usually an order of magnitude higher than those in conventional freshwater sources. For example, typical river water has a boron concentration of 0.05 to 0.2 mg·L−1, while source seawater boron levels are usually between 4 and 6 mg·L−1. Desalinated seawater is characterised by a high boron content, mainly due to its low molecular weight. World Health Organization’s drinking water guidelines [33] sets 2.4 mg·L−1 as a reference value; however, in agricultural irrigation application, this value can be toxic for large number of crops, because high boron concentrations are known to have a negative impact on the yield, size and colour of different crops [12,13,14,34]. Thus, different authors such as Maas [35], Muñoz et al. [36] and Yermiyahu et al. [21] consider 0.3 mg·L−1 as the maximum recommended value, which guarantees the absence of problems due to boron toxicity in irrigation water.
The tests have been carried out with a single-pass SWRO system and the obtained boron content of desalinated seawater was within the range for this type of system (usually between 0.7 and 1.5 mg·L−1) [37,38]. In a single-pass SWRO system, such as the one used in the tests and according to the estimates made, feed water temperature values in the range of 6–8 °C would allow the recommended value of 0.3 mg·L−1 to be reached; a range that is unattainable in a natural way. Two-pass SWRO system typically produce water with boron levels between 0.3 and 0.5 mg·L−1, however, there is still a need for additional water quality polishing processes, and the treatments must ensure that there are no boron toxicity problems. Among the treatments to achieve adequate boron rejection, the pH adjustment by addition of a base (typically sodium hydroxide) or the use of ion exchange, activated carbon adsorption, advanced oxidation, etc should be emphasized. These water quality polishing steps can sometimes double the costs of desalinated water compared to the costs associated with drinking water production, and these costs can only be borne by higher value-added crops [39].

5. Conclusions

The feedwater temperature in an RO system is a parameter with a direct effect that very much depends on the boron concentration in desalinated water. For 3 years, the present work studied the relation between both parameters, and the R2 correlation coefficients came very close to the unit (0.97, 0.95 and 0.88 for 2017, 2018 and 2019, respectively). Nonetheless, we found that typical membrane ageing, and compaction reduced the correlation between both parameters, even when membranes were not subjected to biological fouling because the pH of feedwater was also acidic. We also verified that under our testing conditions, and by applying the analysed temperature intervals, it was impossible to reach the 0.3 mg·L−1 boron concentration value that ensures lack of crop toxicity. Thus, incorporating other boron reduction techniques is necessary if the purpose of these flows is agricultural irrigation.
Boron rejection efficiency displayed inverse performance to that of the feedwater temperature, which lowered with rising temperatures. The analysed rejection efficiency values were around 80–85% in colder months and roughly 70–75% in hotter months, but the theoretical values provided by the manufacturer of the membranes were not obtained in any case (92%). The analysis that compared the experimental data obtained with the projection software (WAVE, Water Application Value Engine) used by the manufacturer of membranes indicated its conservative nature because boron concentrations were always higher than those actually recorded in all cases and, consequently, rejection efficiency values were lower.

Author Contributions

Conceptualization, D.E.-H.; methodology, D.E.-H. and D.P.-B.; software, D.E.-H.; validation, F.J.C.-R. and J.M.M.-M.; formal analysis, F.J.C.-R.; investigation, D.E.-H., L.Á.-D. and D.P.-B.; resources, J.M.M.-M.; data curation, D.E.-H. and L.Á.-D.; Writing—Original draft preparation, D.E.-H.; Writing—Review and editing, D.P.-B. and J.M.M.-M.; visualization, D.P.-B.; supervision, project administration and funding acquisition, J.M.M.-M. All authors have read and agreed to the published version of the manuscript.

Funding

This research received no external funding.

Institutional Review Board Statement

Not applicable.

Informed Consent Statement

Not applicable.

Data Availability Statement

Data is contained within the article.

Conflicts of Interest

The authors declare no conflict of interest.

References

  1. Agulhon, P.H. Présence et utilité du bore chez les végétaux. Nutr. Rev. 1988, 46, 353–355. [Google Scholar] [CrossRef] [PubMed]
  2. Bolaños, L.; Lukaszewski, K.; Bonilla, I.; Blevins, D. Why boron? Plant Physiol. Biochem. 2004, 42, 907–912. [Google Scholar] [CrossRef] [PubMed]
  3. Grieve, C.M.; Grattan, S.R.; Maas, E.V. Plant salt tolerance. In ASCE Manual and Reports on Engineering Practice No. 71 Agricultural Salinity Assessment and Management; Wallender, W.W., Tanji, K.K., Eds.; ASCE: Reston, VA, USA, 2012; pp. 405–459. [Google Scholar]
  4. Hilal, N.; Kim, G.; Somerfield, C. Boron removal from saline water: A comprehensive review. Desalination 2011, 273, 23–35. [Google Scholar] [CrossRef]
  5. Saif, Y.; Almansoori, A. Synthesis of reverse osmosis desalination network under boron specifications. Desalination 2015, 371, 26–36. [Google Scholar] [CrossRef]
  6. Camacho-Cristóbal, J.J.; Anzellotti, D.; González-Fontes, A. Changes in phenolic metabolism of tobacco plants during short-term boron deficiency. Plant Physiol. Biochem. 2002, 40, 997–1002. [Google Scholar] [CrossRef]
  7. Molassiotis, A.; Sotiropoulos, T.; Tanou, G.; Diamantidis, G.; Therios, I. Boron-induced oxidative damage and antioxidant and nucleolytic responses in shoot tips culture of the apple rootstock EM 9 (Malus domestica Borkh). Environ. Exp. Bot. 2006, 56, 54–62. [Google Scholar] [CrossRef]
  8. Novoa, M.A.; Miranda, D.; Melgarejo, L.M. Efecto de las deficiencias y excesos de fósforo, potasio y boro en la fisiología y el crecimiento de plantas de aguacate (Persea americana, cv. Hass). Rev. Colomb. Cienc. Hortícolas 2018, 12, 293–307. [Google Scholar] [CrossRef]
  9. Warncke, D.D. Ameliorating internal black spot in cranberry bean seed with boron application. Commun. Soil Sci. Plant Anal. 2005, 36, 775–781. [Google Scholar] [CrossRef]
  10. Yu, X.; Bell, P. Boron and lime effects on yield and deficiency symptoms of rice grown in greenhouse on acid typic glossaqualf. J. Plant Nutr. 2002, 25, 2591–2602. [Google Scholar] [CrossRef]
  11. Reid, R. Update on boron toxicity and tolerance in plants. In Advances in Plant Animal Boron Nutrition; Xu, F., Goldbach, H.E., Brown, P.H., Bell, R.W., Fujiwara, T., Hunt, C.D., Goldberg, S., Shi, L., Eds.; Springer: Dordrecht, The Netherlands, 2007; pp. 83–90. [Google Scholar]
  12. Ben-Gal, A.; Shani, U. Effect of excess boron on tomatoes under salinity stress. Plant Soil 2002, 247, 211–221. [Google Scholar] [CrossRef]
  13. Nable, R.O.; Bañuelos, G.S.; Paull, J.G. Boron toxicity. Plant Soil 1997, 193, 181–198. [Google Scholar] [CrossRef]
  14. Zarzo, D.; Campos, E.; Terrero, P. Spanish experience in desalination for agriculture. Desalination Water Treat. 2013, 51, 53–66. [Google Scholar] [CrossRef]
  15. Li, S.; Li, Z. Reverse osmosis and forward osmosis in desalination membrane systems. In Current Trends and Future Developments on (Bio-) Membranes; Elsevier: Amsterdam, The Netherlands, 2020; pp. 281–303. [Google Scholar] [CrossRef]
  16. Shaffer, D.L.; Yip, N.Y.; Gilron, J.; Elimelech, M. Seawater desalination for agriculture by integrated forward and reverse osmosis: Improved product water quality for potentially less energy. J. Membr. Sci. 2012, 415, 1–8. [Google Scholar] [CrossRef]
  17. Duranceau, S.J.; Pfeiffer-Wilder, R.J.; Douglas, S.A.; Peña-Holt, N.; Watson, I.C. Post-Treatment Stabilization of Desalinated Water; Water Research Foundation: Alexandria, VA, USA, 2011. [Google Scholar]
  18. Wang, S.; Zhou, Y.; Gao, C. Novel high boron removal polyamide reverse osmosis membranes. J. Membr. Sci. 2018, 554, 244–252. [Google Scholar] [CrossRef]
  19. Latorre, M. El Boro En La Desalación; Experiencia en la Planta de Valdelentisco: Murcia, Spain, 2010. [Google Scholar]
  20. BOE. Real Decreto 140/2003, de 7 de Febrero, Por el Que se Establecen los Criterios Sanitarios de la Calidad del Agua de Consumo Humano (Spain); Official State Bulletin: Madrid, Spain, 2003. [Google Scholar]
  21. Yermiyahu, U.; Tal, A.; Ben-Gal, A.; Bar-Tal, A.; Tarchitzky, J.; Lahav, O. Rethinking desalinated water quality and agriculture. Science 2007, 318, 920–921. [Google Scholar] [CrossRef]
  22. Bonnélye, V.; Sanz, M.; Francisci, L.; Beltran, F.; Cremer, G.; Colcuera, R.; Laraudogoitia, J. Curacao, Netherlands Antilles: A successful example of boron removal on a seawater desalination plant. Desalination 2007, 205, 200–205. [Google Scholar] [CrossRef]
  23. Taniguchi, M.; Fusaoka, Y.; Nishikawa, T.; Kurihara, M. Boron removal in RO seawater desalination. Desalination 2004, 167, 419–426. [Google Scholar] [CrossRef]
  24. Landsman, M.R.; Lawler, D.F.; Katz, L.E. Application of electrodialysis pretreatment to enhance boron removal and reduce fouling during desalination by nanofiltration/reverse osmosis. Desalination 2020, 491, 114563. [Google Scholar] [CrossRef]
  25. Kheriji, J.; Mnif, A.; Bejaoui, I.; Hamrouni, B. Study of the influence of operating parameters on boron removal by a reverse osmosis membrane. Desalination Water Treat. 2015, 56, 2653–2662. [Google Scholar] [CrossRef]
  26. Tu, K.L.; Nghiem, L.D.; Chivas, A.R. Boron removal by reverse osmosis membranes in seawater desalination applications. Sep. Purif. Technol. 2010, 75, 87–101. [Google Scholar] [CrossRef]
  27. Qasim, M.; Badrelzaman, M.; Darwish, N.N.; Darwish, N.A.; Hilal, N. Reverse osmosis desalination: A state-of-the-art review. Desalination 2019, 459, 59–104. [Google Scholar] [CrossRef] [Green Version]
  28. Dupont. WAVE (Water Application Value Engine). Wave Software For Water Treatment Plant Design. Available online: https://www.dupont.com/water/resources/design-software.html (accessed on 29 July 2020).
  29. Hung, P.V.X.; Cho, S.-H.; Moon, S.-H. Prediction of boron transport through seawater reverse osmosis membranes using solution–diffusion model. Desalination 2009, 247, 33–44. [Google Scholar] [CrossRef]
  30. Hyung, H.; Kim, J.-H. A mechanistic study on boron rejection by sea water reverse osmosis membranes. J. Membr. Sci. 2006, 286, 269–278. [Google Scholar] [CrossRef]
  31. Gupta, V.K.; Hwang, S.-T.; Krantz, W.B.; Greenberg, A.R. Characterization of nanofiltration and reverse osmosis membrane performance for aqueous salt solutions using irreversible thermodynamics. Desalination 2007, 208, 1–18. [Google Scholar] [CrossRef]
  32. Martínez, D. Cost of Desalinated Seawater Per RO. In Water Desalination: Technological, Environmental, Legal and Economic Aspects; Fundación Instituto Euromediterráneo del Agua: Murcia, Spain, 2009. (In Spanish) [Google Scholar]
  33. World Health Organization. Guidelines for Drinking Water Quality; World Health Organization: Ginebra, Switzerland, 2011. (In Spanish) [Google Scholar]
  34. Lahav, O.; Kochva, M.; Tarchitzky, J. Potential drawbacks associated with agricultural irrigation with treated wastewaters from desalinated water origin and possible remedies. Water Sci. Technol. 2010, 61, 2451–2460. [Google Scholar] [CrossRef]
  35. Maas, E. Crop salt tolerance. In Agricultural Salinity Assessment Management; Tanji, K.K., Ed.; Amer Society of Civil Engineers: New York, NY, USA, 1990; pp. 262–304. [Google Scholar]
  36. Rodríguez Guerreiro, M.J.; de la Fuente, M.d.M.; Muñoz Camacho, E. Boron toxicity in plants. In Encuentros En La Biología; Universidad de Granada: Granada, Spain, 2002; Volume 5, p. 1. (In Spanish) [Google Scholar]
  37. Cotruvo, J.; Voutchkov, N.; Fawell, J.; Payment, P.; Cunliffe, D.; Lattemann, S. Desalination Technology: Health and Environmental Impacts; CRC Press and IWA Publishing: Boca Raton, FL, USA, 2010. [Google Scholar]
  38. Lahav, O.; Birnhack, L. Post-Treatment of Desalinated Water; Balaban Desalination Publications: L’Aquila, Italy, 2012. [Google Scholar]
  39. Martínez Beltrán, J.; Koo-Oshima, S. Water desalination for agricultural applications. FAO Land Water Discuss. Pap. 2006, 5, 48. Available online: http://www.fao.org/3/a-a0494e.pdf (accessed on 22 January 2021).
Figure 1. Diagram of the reverse osmosis (RO) pilot system used in the test.
Water 13 00322 g001
Figure 2. Screenshot of “Feed Water” (Water Application Value Engine (WAVE) software). 2019.
Water 13 00322 g002
Figure 3. Screenshot of “Reverse Osmosis” (WAVE software). 2019.
Water 13 00322 g003
Figure 4. Annual evolution of feedwater temperature and electric conductivity (ECin) in 2017, 2018 and 2019.
Water 13 00322 g004
Figure 5. Annual evolution of permeate water electric conductivity (ECout) and effective pressure in 2017, 2018 and 2019.
Water 13 00322 g005
Figure 6. Real values and those estimated with the WAVE software of DUPONT of the boron concentration for permeate water according to the feed water temperature in 2017, 2018 and 2019.
Water 13 00322 g006
Figure 7. Real values and those estimated with the WAVE software of DUPONT on boron rejection efficiency according to the feed water temperature in 2017, 2018 and 2019.
Water 13 00322 g007
Table 1. Experimental records of temperature T (°C), electric conductivity (EC) (µS·cm−1), permeate boron concentration B (mg·L−1), effective pressure (Pe) (bar) and boron rejection efficiency (Er) (%) in 2017, 2018 and 2019.
2017T EC B Pe Er2018T EC B Pe Er2019T EC B Pe Er
Jan15.93890.6567.287.1Jan15.13110.6067.087.3Jan15.54450.5967.487.5
Feb15.53470.5667.388.9Feb15.53520.6167.187.5Feb16.54580.6167.088.0
Mar16.43980.6167.787.9Mar15.23610.5967.287.9Mar17.64770.5867.687.7
Apr17.94310.7167.185.4Apr17.14010.7066.484.8Apr19.44810.6266.985.3
May19.55480.7566.285.1May19.94750.7765.483.6May21.55180.7666.283.9
Jun25.05410.9065.882.0Jun22.86040.8863.681.3Jun23.16120.8264.780.9
Jul27.26510.9964.380.3Jul27.07260.9663.079.5Jul25.27440.9563.979.3
Aug28.55620.9963.880.0Aug28.67611.0062.980.0Aug26.47570.9963.780.5
Sep26.35720.9363.481.2Sep27.76880.9863.179.6Sep26.17520.8863.580.3
Oct25.14950.9163.881.7Oct23.65800.9363.680.7Oct23.96500.8563.781.0
Nov20.54160.8264.782.6Nov20.24620.8464.682.7Nov20.85140.7664.583.1
Dec16.73330.6765.385.8Dec17.94480.7566.284.0Dec17.04190.7165.884.2
Publisher’s Note: MDPI stays neutral with regard to jurisdictional claims in published maps and institutional affiliations.

