Article

Evaluating Microbial Interactions of Autotrophs and Heterotrophs in Partial Nitritation/Anammox (PN/A) Process by Experimental and Simulation Analyses

Key Laboratory for Water Quality and Conservation of the Pearl River Delta, Ministry of Education, School of Civil Engineering, Guangzhou University, Guangzhou 510006, China
*
Author to whom correspondence should be addressed.
Water 2021, 13(3), 324; https://doi.org/10.3390/w13030324
Submission received: 23 December 2020 / Revised: 17 January 2021 / Accepted: 22 January 2021 / Published: 28 January 2021
(This article belongs to the Section Wastewater Treatment and Reuse)

Abstract

:
The microbial interactions between autotrophs and heterotrophs by the exchange of microbial products in a partial nitritation/anammox (PN/A) bioreactor were evaluated with both experimental and simulation analyses. Real-time quantitative PCR analysis showed that anammox bacteria (AMX) and ammonium oxidizing bacteria (AOB) made up 56.59% and 8.35% of total bacteria, respectively, while heterotrophs identified as Chloroflexi also constituted a large portion (32.76%) in the reactor, even without an external organic carbon supply. Furthermore, a mathematical model was developed to describe the growth of heterotrophs on soluble microbial products (SMP), which were released from the metabolism of autotrophs. After model calibration and validation, the simulation results were consistent with the experimental observations of the microbial composition and the nitrogenous transformations. According to the model analysis, the bulk oxygen concentration was determined to be the dominant factor governing the reactor performance and biomass fractions in the granule. Increasing granular size could decrease heterotrophic growth, but has little effect on the effluent concentration of SMP. Results of this study could establish a better understanding of eco-physiological interactions of autotrophs and heterotrophs in PN/A process.

Graphical Abstract

1. Introduction

In the past few years, completely autotrophic nitrogen removal via partial nitritation and anaerobic ammonium oxidization (anammox) has been confirmed as an attractive option for nitrogen removal from wastewater due to a significant decrease in operating costs [1,2]. In a partial nitritation/anammox (PN/A) reactor, ammonium is oxidized to nitrite by aerobic ammonium-oxidizing bacteria (AOB) consuming the dissolved oxygen (DO). Subsequently, anammox bacteria (AMX) converts the rest of ammonium and nitrite to nitrogen gas and produce small amounts of nitrate [3].
Most previous fundamental studies about PN/A process have focused solely on the microbial ecology of the autotrophs including AOB, AMX and nitrite-oxidizing bacteria (NOB) [4,5,6,7]. However, the other communities, for instance heterotrophs in this system, have often been neglected. In our previous experiments, it was observed that heterotrophs such as Chloroflexi constitute a large portion in PN/A reactors, even though no organic carbon sources were involved in the influent [8]. It is well known that autotrophs could produce soluble microbial products (SMP) during normal biomass metabolism, which can be consumed by heterotrophs [9,10]. Therefore, more work remains to be done to characterize the role of heterotrophs presented in the PN/A process.
The presence of heterotrophs in PN/A systems might significantly influence the microbial aggregate morphology and the reactor performance. On the one hand, nitrate produced either by AMX or NOB can be removed by denitrification of the heterotrophs with the SMP released by the autotrophs as a carbon source, resulting in a lower nitrogen effluent concentration [11,12]. On the other hand, the heterotrophs that were the most characterized as filamentous bacteria would compete against the autotrophs for electron acceptors (e.g., oxygen) and space, consequently damaging the settling properties and decreasing the solid retention time (SRT) [13]. However, hardly anything has so far been known about the key factors influencing heterotrophic growth in PN/A systems. Hence, there is a great need for better understanding of the interactions between autotrophs and heterotrophs in the PN/A process.
Mathematical modeling has proven to be a powerful tool for testing our understanding of reaction mechanism, as well as for helping us to predict and optimize process performance. Hao et al. [14] developed a mathematical model describing the PN/A process, and furthermore analyzed the sensitivity of various parameters to the reactor performance. Volcke et al. [15] assessed the effect of the granule size distribution on the performance of a granular sludge reactor for autotrophic nitrogen removal with one-dimensional biofilm models. However, these models only considered the biological conversion processes of autotrophs (i.e., AOB, AMX and NOB) but ignored the existence of heterotrophs in PN/A processes. Therefore, the objective of this work is (1) to investigate the microbial compositions of the PN/A process by real-time quantitative PCR, and then (2) to develop a multi-species, multi-component mathematical model to quantify and evaluate the eco-physiological interactions through the exchange SMP between autotrophs and heterotrophs in the PN/A process, and, in particularly, (3) to explore the effects of process parameters on the growth of heterotrophs in the PN/A process.

2. Materials and Methods

2.1. Reactor Operation and Sampling

A 2 L lab-scale sequencing batch reactor (SBR) was operated at 33 °C for 140 days and seeded with denitrification sludge from a pilot-scale anaerobic filter located in Harbin, China. The bioreactor was fed with synthetic wastewater containing ammonium (as (NH4)2SO4), inorganic carbon source (as NaHCO3), and microelement solution. The air flow rate during the aeration period was manually adjusted to maintain the dissolved oxygen (DO) concentration around 0.2 to 0.4 mg O2 L−1. More details on reactor operation were described in Chu et al. [8]. Biomass was sampled when the maximum nitrogen removal efficiency (85%) was achieved (140 days after inoculation), and immediately stored at −80 °C for subsequent experiments.

2.2. DNA Extraction and qPCR

Total genomic DNA was extracted from 0.30 g of activated sludge using PowerSoil DNA Isolation Kit (MoBio, Carlsbad, CA, USA) as described in the manufacturer’s instructions. Following extraction, the integrity of the DNA was verified by 1% (w/v) gel electrophoresis and the concentration was determined by a UV-Vis spectrophotometer (NanoDrop 2000, Waltham, MA, USA).
Real-time quantitative PCR (qPCR) was used to quantify total bacteria, AMX, AOB, Nitrobacter and Nitrospira with the corresponding primer sets listed in Supplementary Materials Table S1. A 20 μL PCR mixture contained 10 μL of FastStart Universal SYBR Green Master (Roche, Germany), 0.6 μL of each primer, 1 μL of template DNA, and 7.8 μL of double distilled H2O. qPCR was performed on the ABI Prism 7500 system (Waltham, MA, USA). The two-step amplification procedure contains initial denaturation at 95 °C for 10 min, followed by 40 cycles of 95 °C for 15 s and 60 °C for 1 min. The melting curve analysis was used after amplification for assessing the qPCR amplicon length.

2.3. Analytical Methods

The analyses of COD, NH4+-N, NO2-N, NO3-N and VSS were performed in accordance with standard methods [16]. The DO concentration was measured by a dissolved oxygen meter (LDO, Hach, Loveland, CO, USA). Particle size analyses were carried out with a laser diffraction particle size analyzer (Mastersizer 2000, Malvern, UK). The SMP was defined as soluble COD in the supernatant after centrifugation at 6000× g for 15 min due to no organic carbon in the influent.

2.4. Model Development

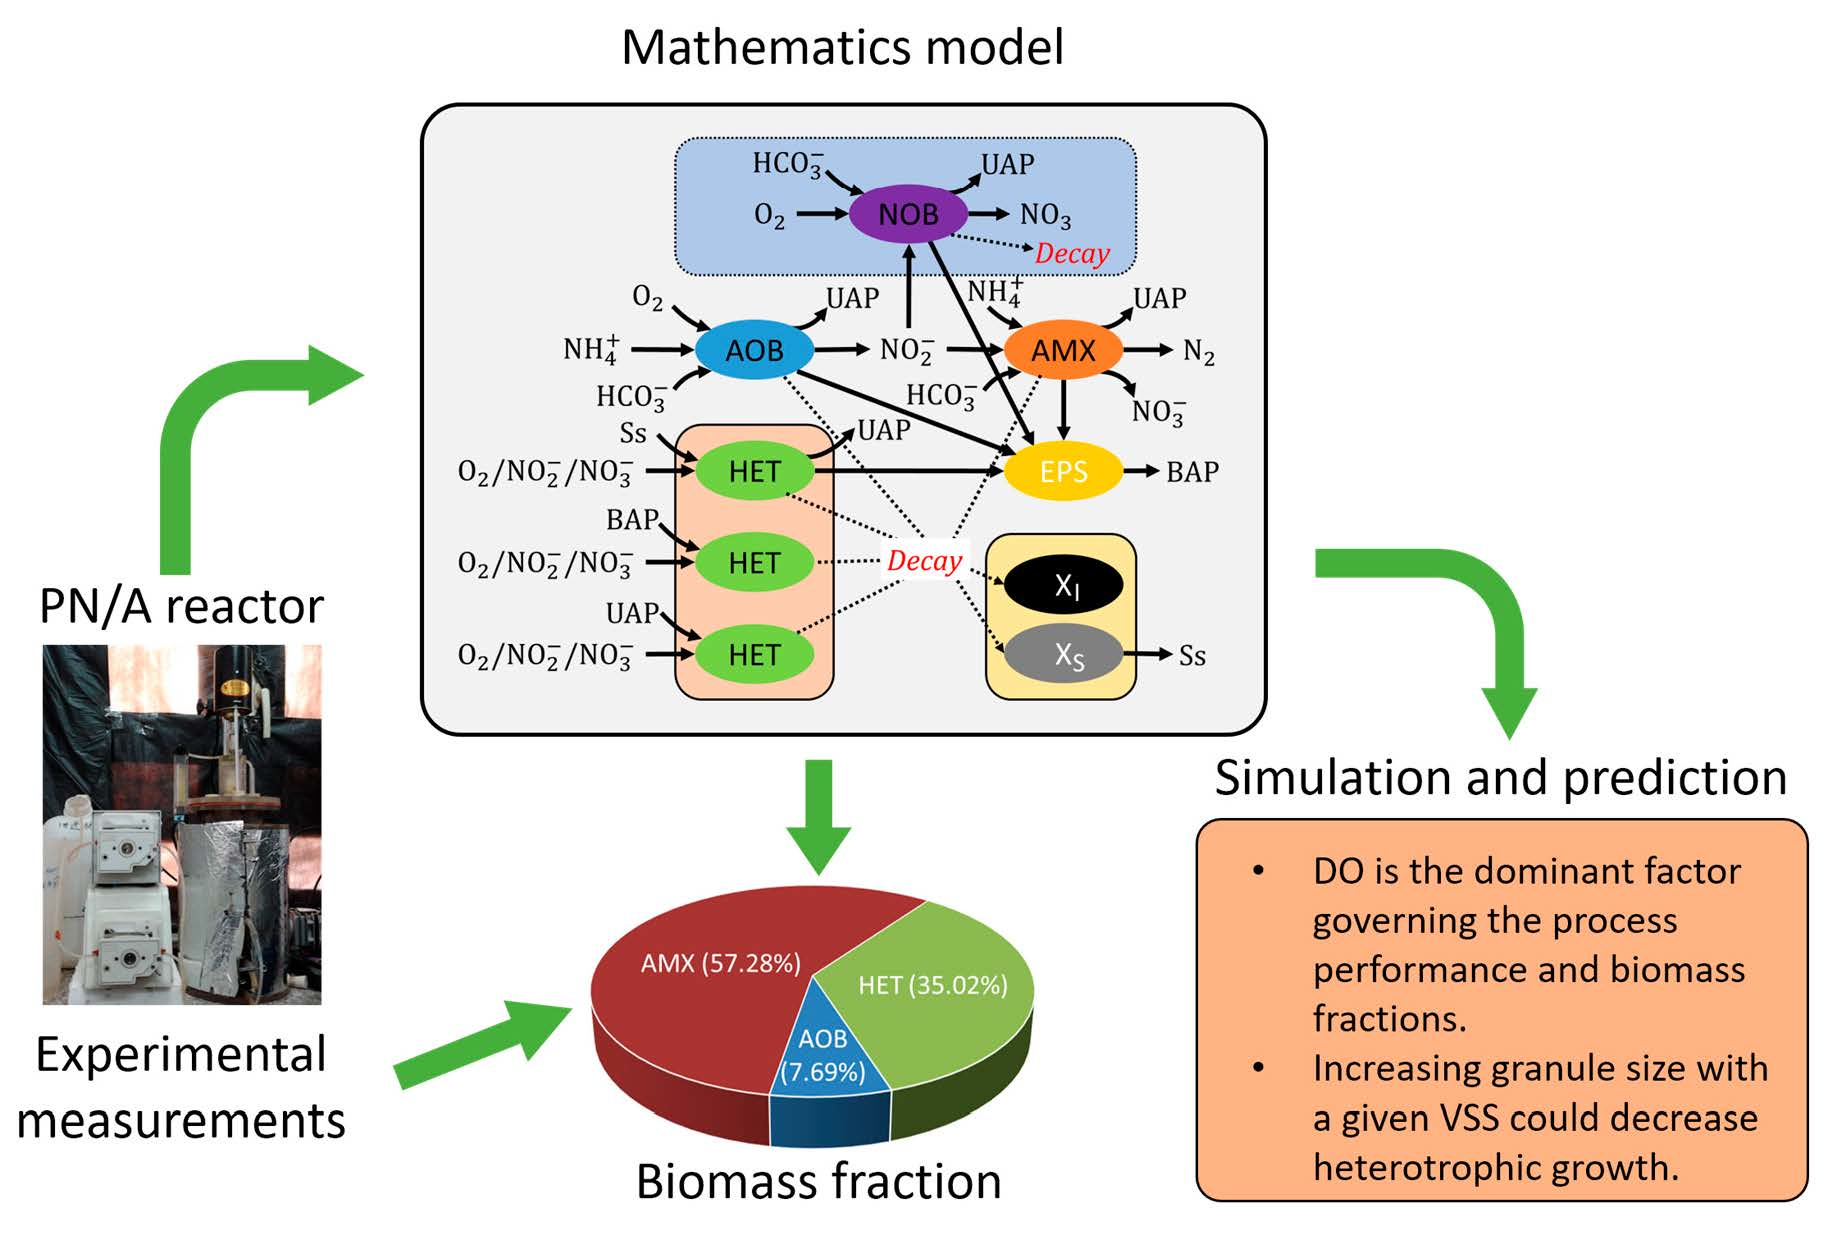
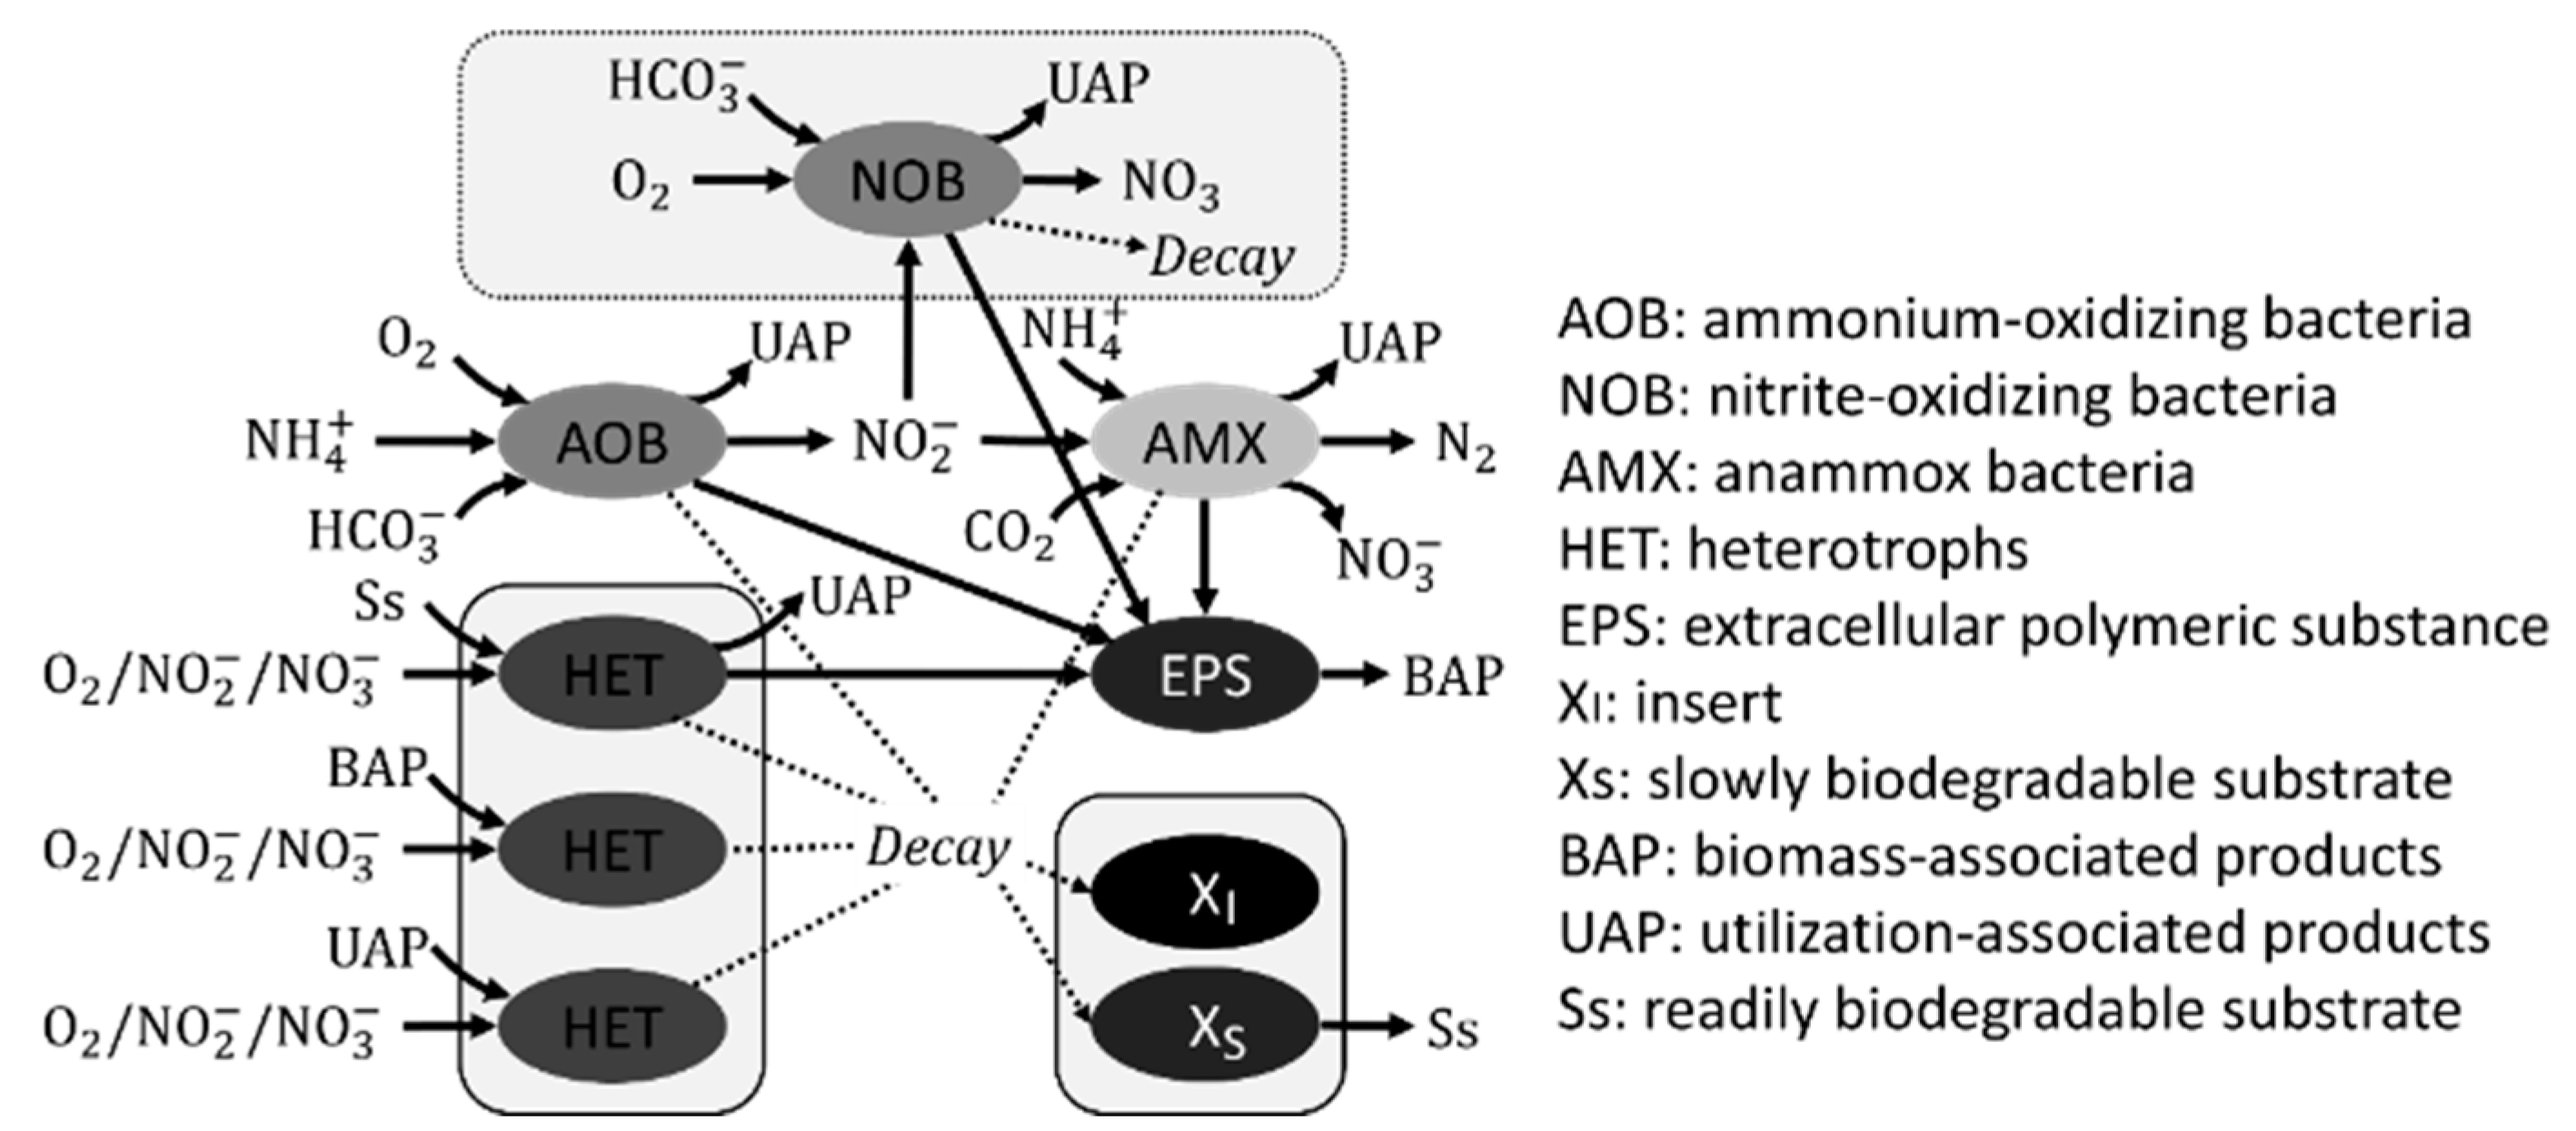
2.4.1. Model Description

A one-dimensional biofilm model was established to explain the behavior of the granular sludge SBR with AQUASIM software package [17]. As shown in Figure S1, in order to simulate the mass transport and conversion processes in the SBR, the model contained three completely mixed compartments and one biofilm compartments. The volume of the completely mixed compartment was set to be variable to simulate the different phases of the SBR cycle. A high fluid circulation rate was adopted to ensure the same bulk liquid concentrations in the two compartments.
The biomass granules were supposed to be spherical in shape and uniform in size, and the value of biofilm porosity was set to 0.75. The number of granules (PN) was assumed constant in time and calculated by
PN = VSS · V R ( 1 θ ) · ρ · ( 4 3 π r 3 ) ,
where VSS is the biomass concentration (g COD m−3), VR is the reactor volume, and θ, ρ, r are the porosity, density, and radius of the granules in steady state, respectively. Parameters regarding granule structure and mass transfer within the granule were listed in Table S2.

2.4.2. Conversion Processes

In the model, the unified theory of Laspidou and Rittmann [18] including kinetics of microbial products formation and consumption was adopted and modified to describe the microbial interactions between autotroph and heterotroph in PN/A process. As can be seen from Figure 1, the developed model described the relationships among seven particulate components and eight dissolved components involving 18 biological conversions. Organic carbon for the growth of the heterotroph was derived from three reactions: autotrophic growth (UAP), biomass decay (Xs hydrolyzed to Ss) and hydrolysis of EPS (BAP). The stoichiometric matrix for the interactions and transformations among model components were listed in Table S3, while the corresponding process rates and stoichiometric and kinetic parameters were presented in Tables S4 and S5, respectively.

2.4.3. Simulation Strategy

The standard simulation was performed under the operational conditions of granule diameter at 0.5 mm, DO at 0.25 mg L−1, and influent ammonium at 500 mg N L−1. The obtained results were then used to verify the model with experimental data. The significance of the results was assessed by variance analysis, in which p < 0.05 was regarded statistically significant and p > 0.05 was regarded statistically insignificant.
The effect of operational conditions including DO concentration and granule size on the heterotrophic growth in the PN/A system was simulated using the validated model. Each simulation was run for at least 1000 days, which was long enough to assure the system close to a steady state.

3. Results

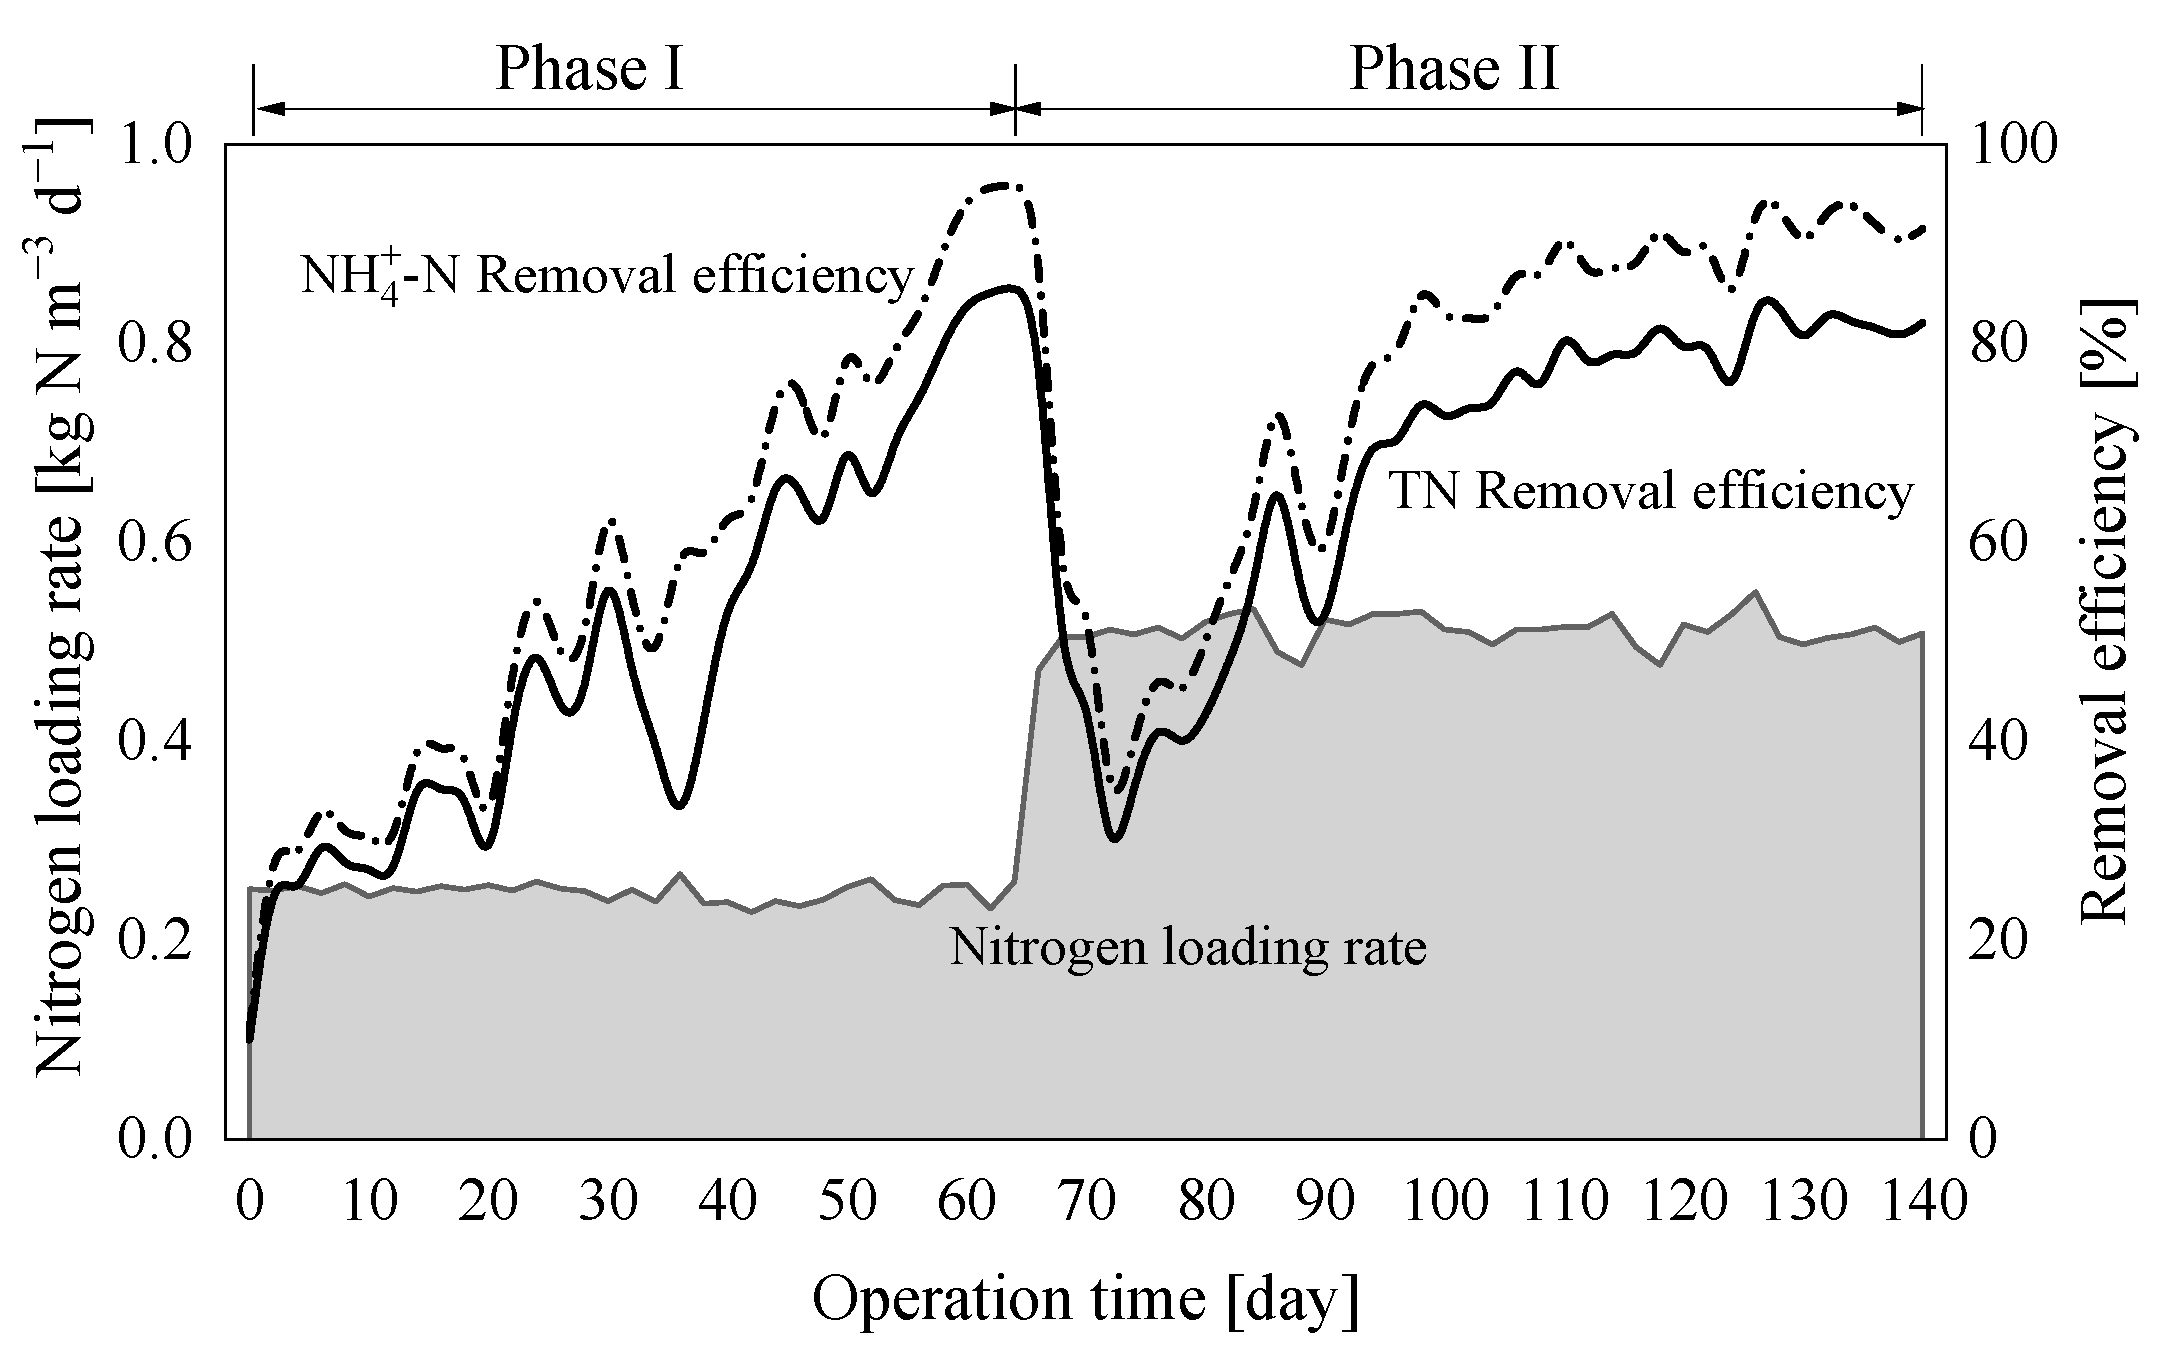
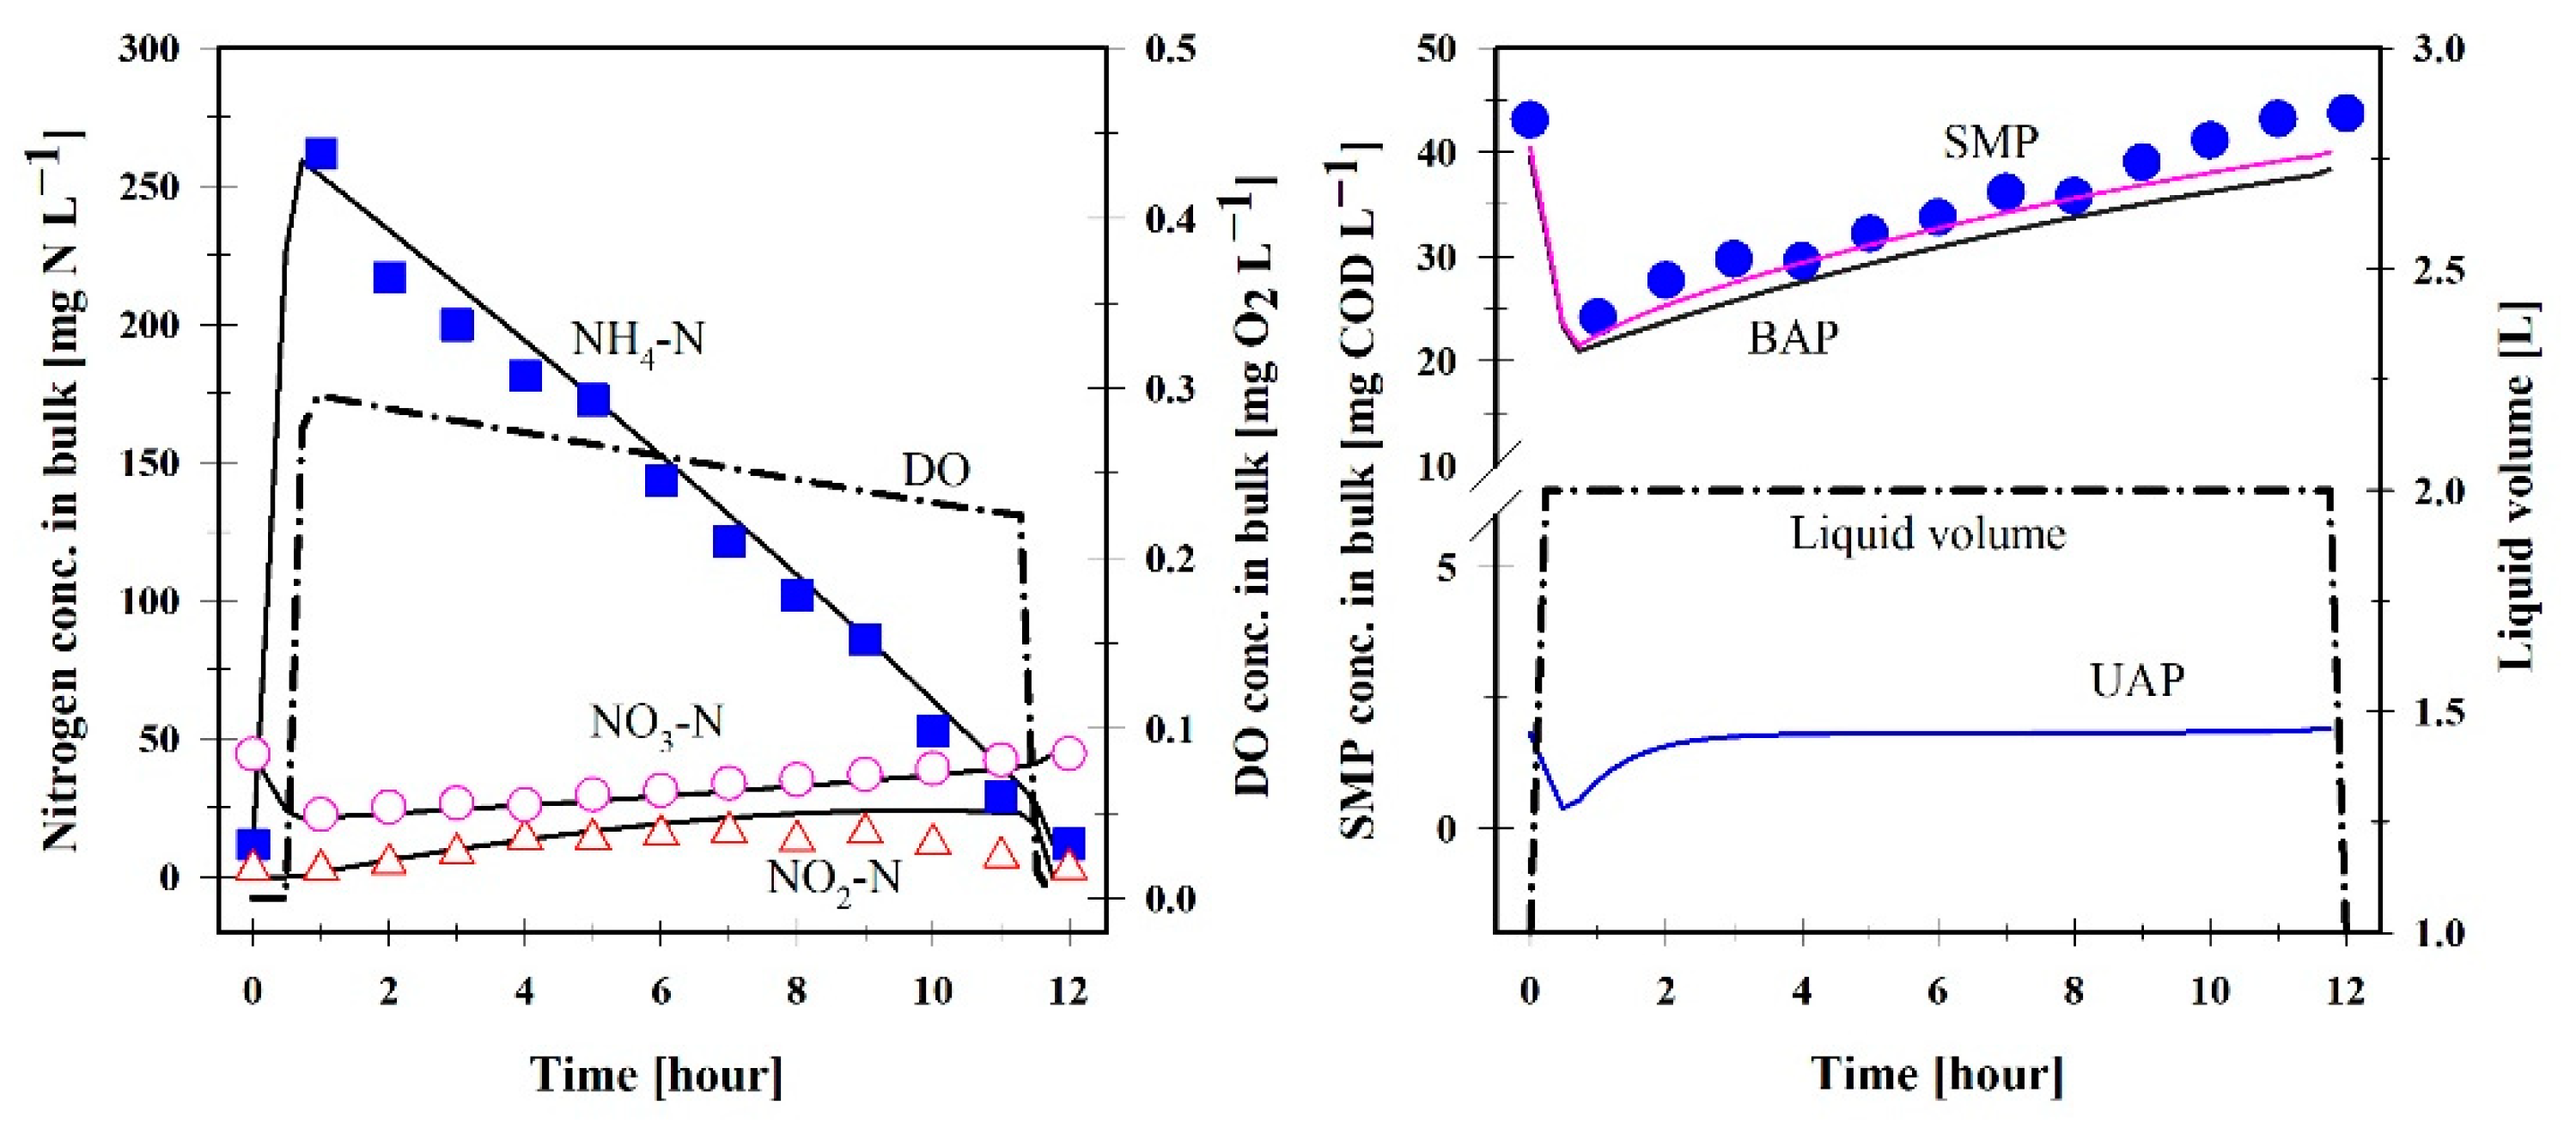
3.1. Reactor Performance
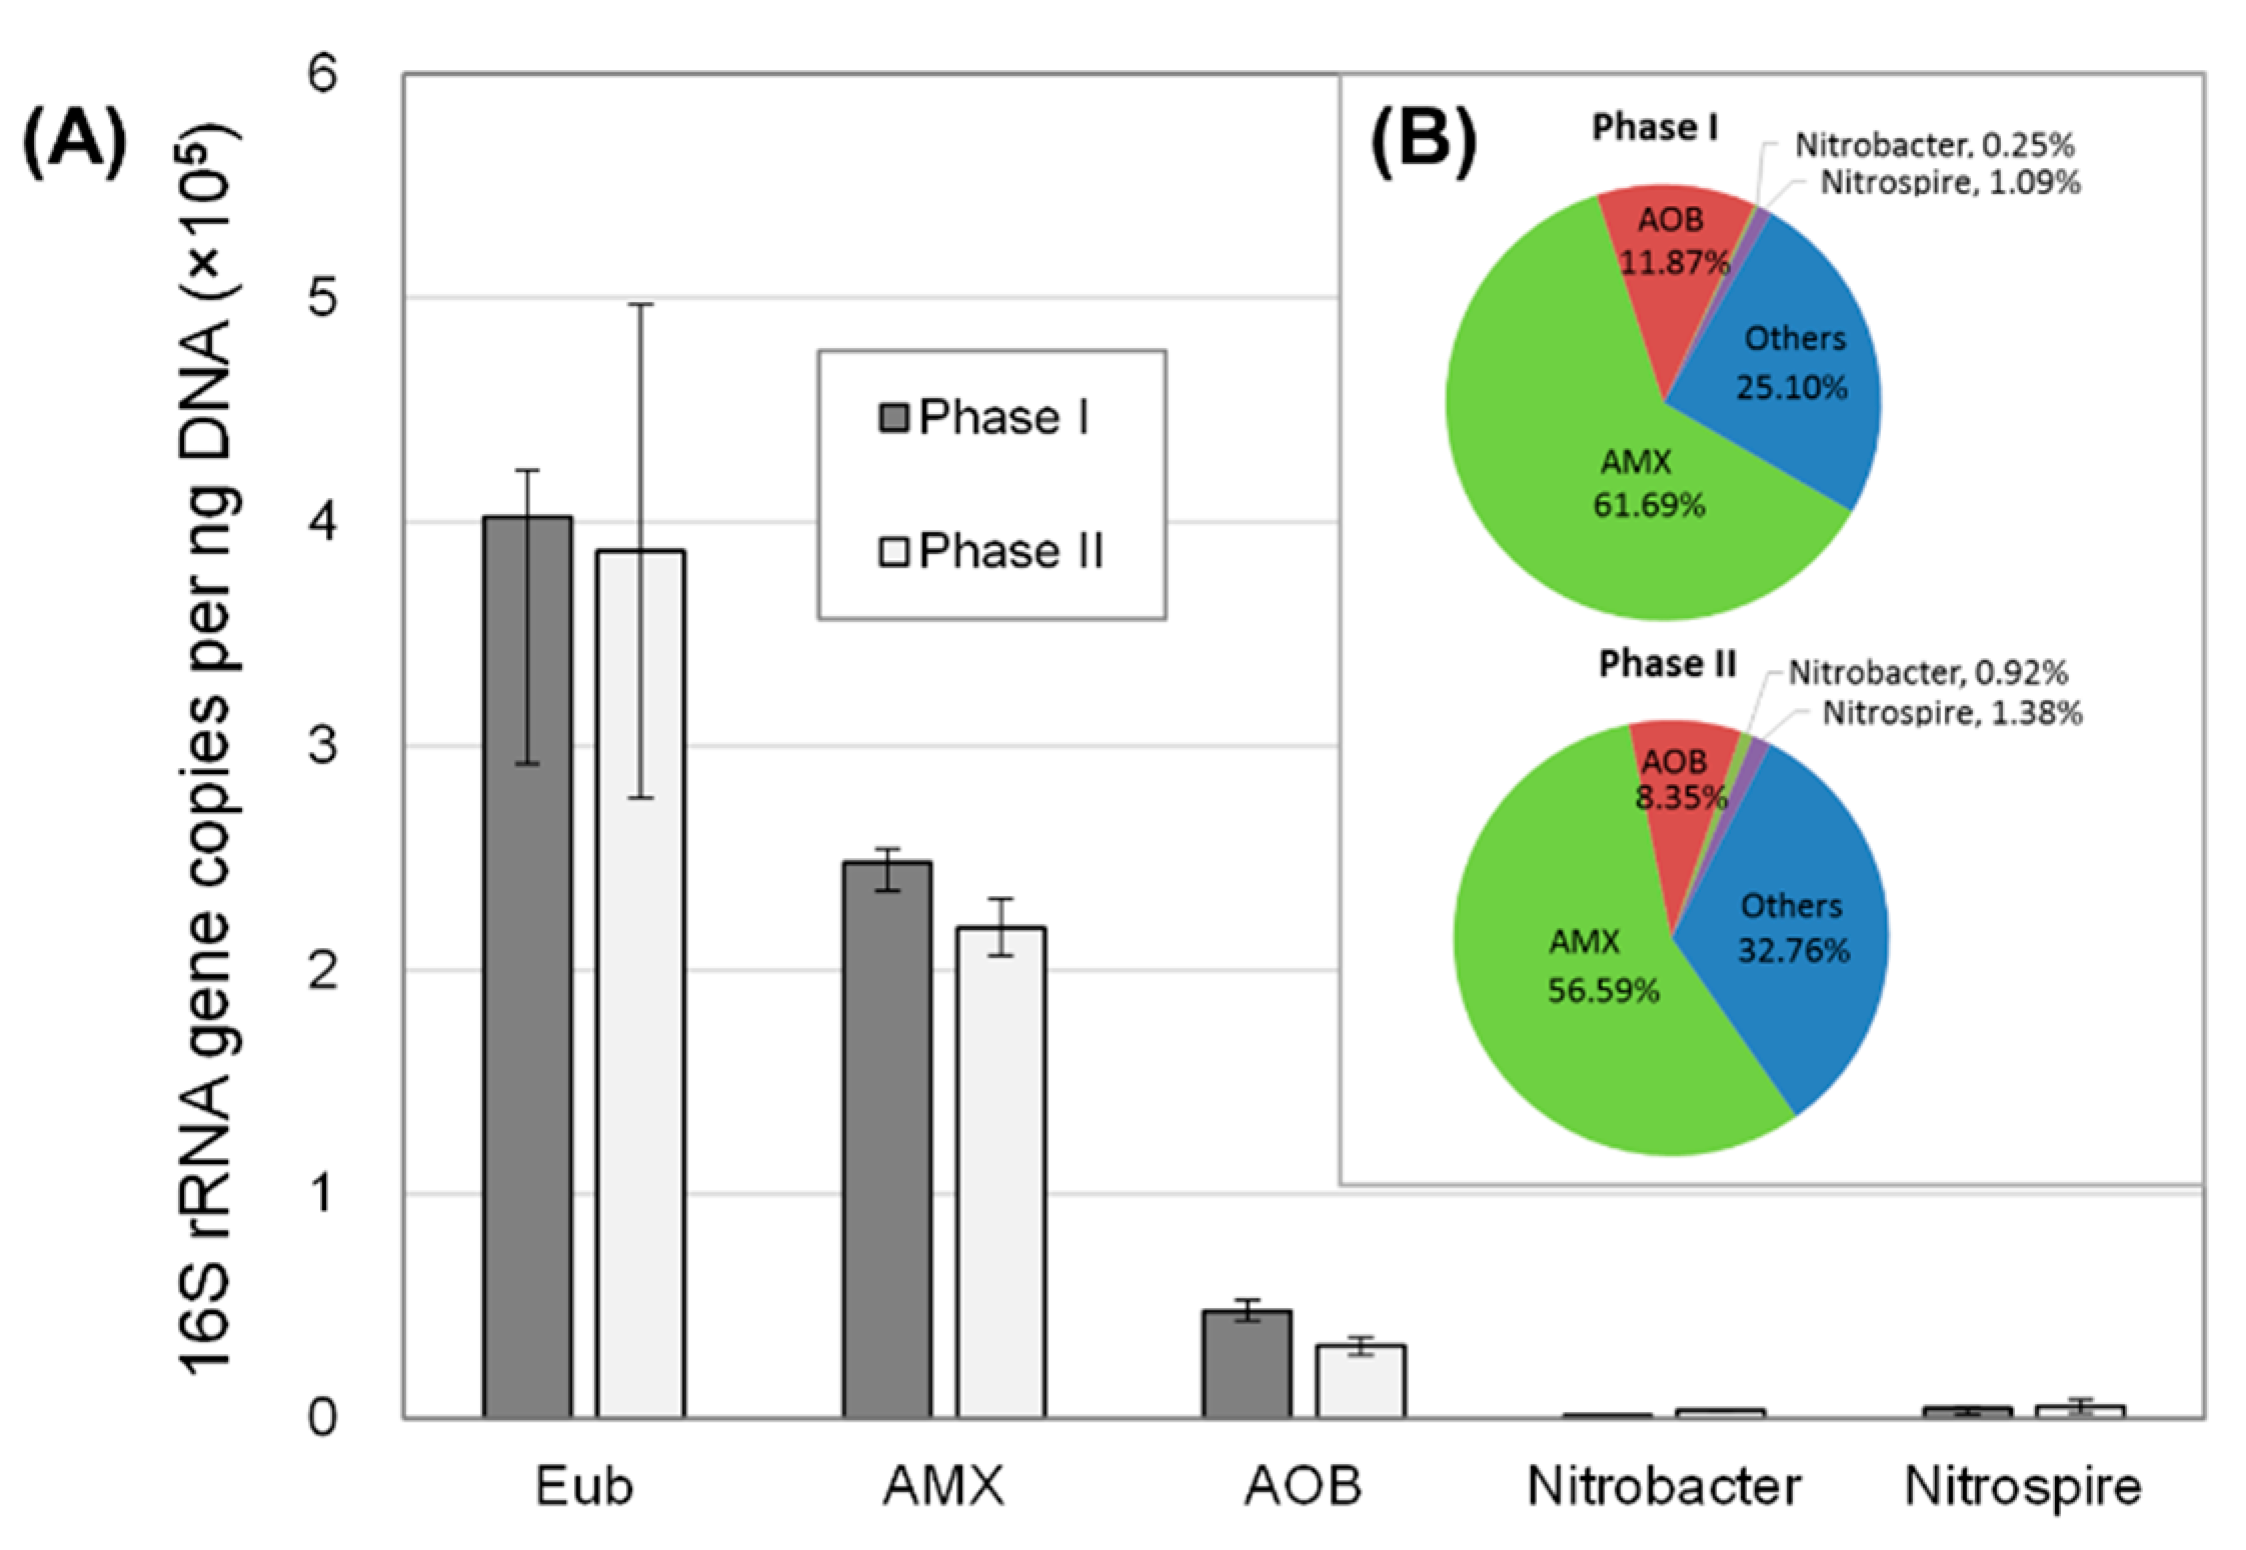
Figure 2 shows the SBR performance over a period of 140 days. In Phase I, NH4+-N and total nitrogen (TN) removal efficiencies gradually increased to 93.2 ± 2.4% and 84.7 ± 3.7%, respectively, when the nitrogen loading rate was around 0.25 kg N m−3 d−1. Then, the hydraulic retention time (HRT) was reduced to one day, while the nitrogen loading rate was increased to 0.50 kg N m−3 d−1, correspondingly (Figure 2, Phase II). The removal efficiencies of NH4+ and TN were decreased sharply, and then got back to 91.6 ± 4.1% and 82.1 ± 2.6%, respectively. Those values were close to the maximum nitrogen removal efficiency (88.9%) that can be obtained in the PN/A system without additional denitrification [3,19]. After 140 days of operation, the biomass concentration inside the reactor stabilized at 4000 g COD m−3. The average diameter of the granules was around 0.5 mm. According to Volcke et al. [15], the density and porosity of the granules in PN/A reactors were 50,000 g COD m−3 and 0.75, respectively. With these data, the number of granules was estimated as 9,700,000 granules.

3.2. qPCR Analysis

The composition of the key functional groups responsible for nitrogen removal, including AOB, AMX and NOB, in the granules was determined by qPCR with various sets of primers (Figure 3). 16S rRNA gene copy numbers of total bacteria, AMX, AOB, Nitrobacter and Nitrospire in the PN/A reactor were about 4.0 × 10⁵, 2.2 × 10⁵, 4.1 × 10⁴, 3.5 × 10³ and 5.3 × 10³ copies per ng DNA, respectively. There is no obvious change of these bacteria between Phase I and Phase II, indicating that the composition of the core microbiome is stable for a PN/A reactor in steady state operation.
The relative abundances of each functional group in the reactor were calculated by dividing the gene copies of each bacterial group by the gene copies of total bacteria and the results were presented as a pie chart in Figure 3b. The results showed that AMX dominated in the biomass, accounting for 56.59% of total bacteria, while the relative abundance of AOB only accounted for 8.35% of total bacteria. The relative abundance of Nitrobacter (0.5%) and Nitrospira (1.2%) can almost be ignored, suggesting that NOB was successfully suppressed, which can be attributed to low oxygen concentration in the reactor. Notably, approximately 32.76% of total bacteria was identified as others, which makes us deduce that they were heterotrophs [8]. SMP secreted by autotrophs were likely to be the energy and carbon sources for the growth of these heterotrophic bacteria.

3.3. Standard Simulation: Model Validation with Experimental Data

The standard simulation was first performed for model calibration and the results of this simulation in steady state are summarized in Table 1, together with experimental measurements. The predicted effluent NH4+-N, NO2-N, NO3-N and SMP levels in Case II (NLR = 0.50 kg N m−3 d−1) maintain 13.18, 0.40, 44.49 and 40.37 mg L−1, respectively, which matched the measured ones very well. Moreover, the active biomass was predicted to include AOB at 7.69%, AMX at 57.28%, HET at 35.02% and NOB at 0.01%, which were confirmed by the results of qPCR.
The model with calibrated parameters was then validated with the variations of NH4+-N, NO2-N, NO3-N and SMP concentrations in the reactor during a typical cycle. As shown in Figure 4, the simulation results matched well with the measured data. The average deviation between the measured data and model predications was less than 4%. These results demonstrated that the calibrated model describes the eco-physiological interactions in the PN/A process satisfactorily. Thus, the calibrated model could be used for model predictions under different conditions.

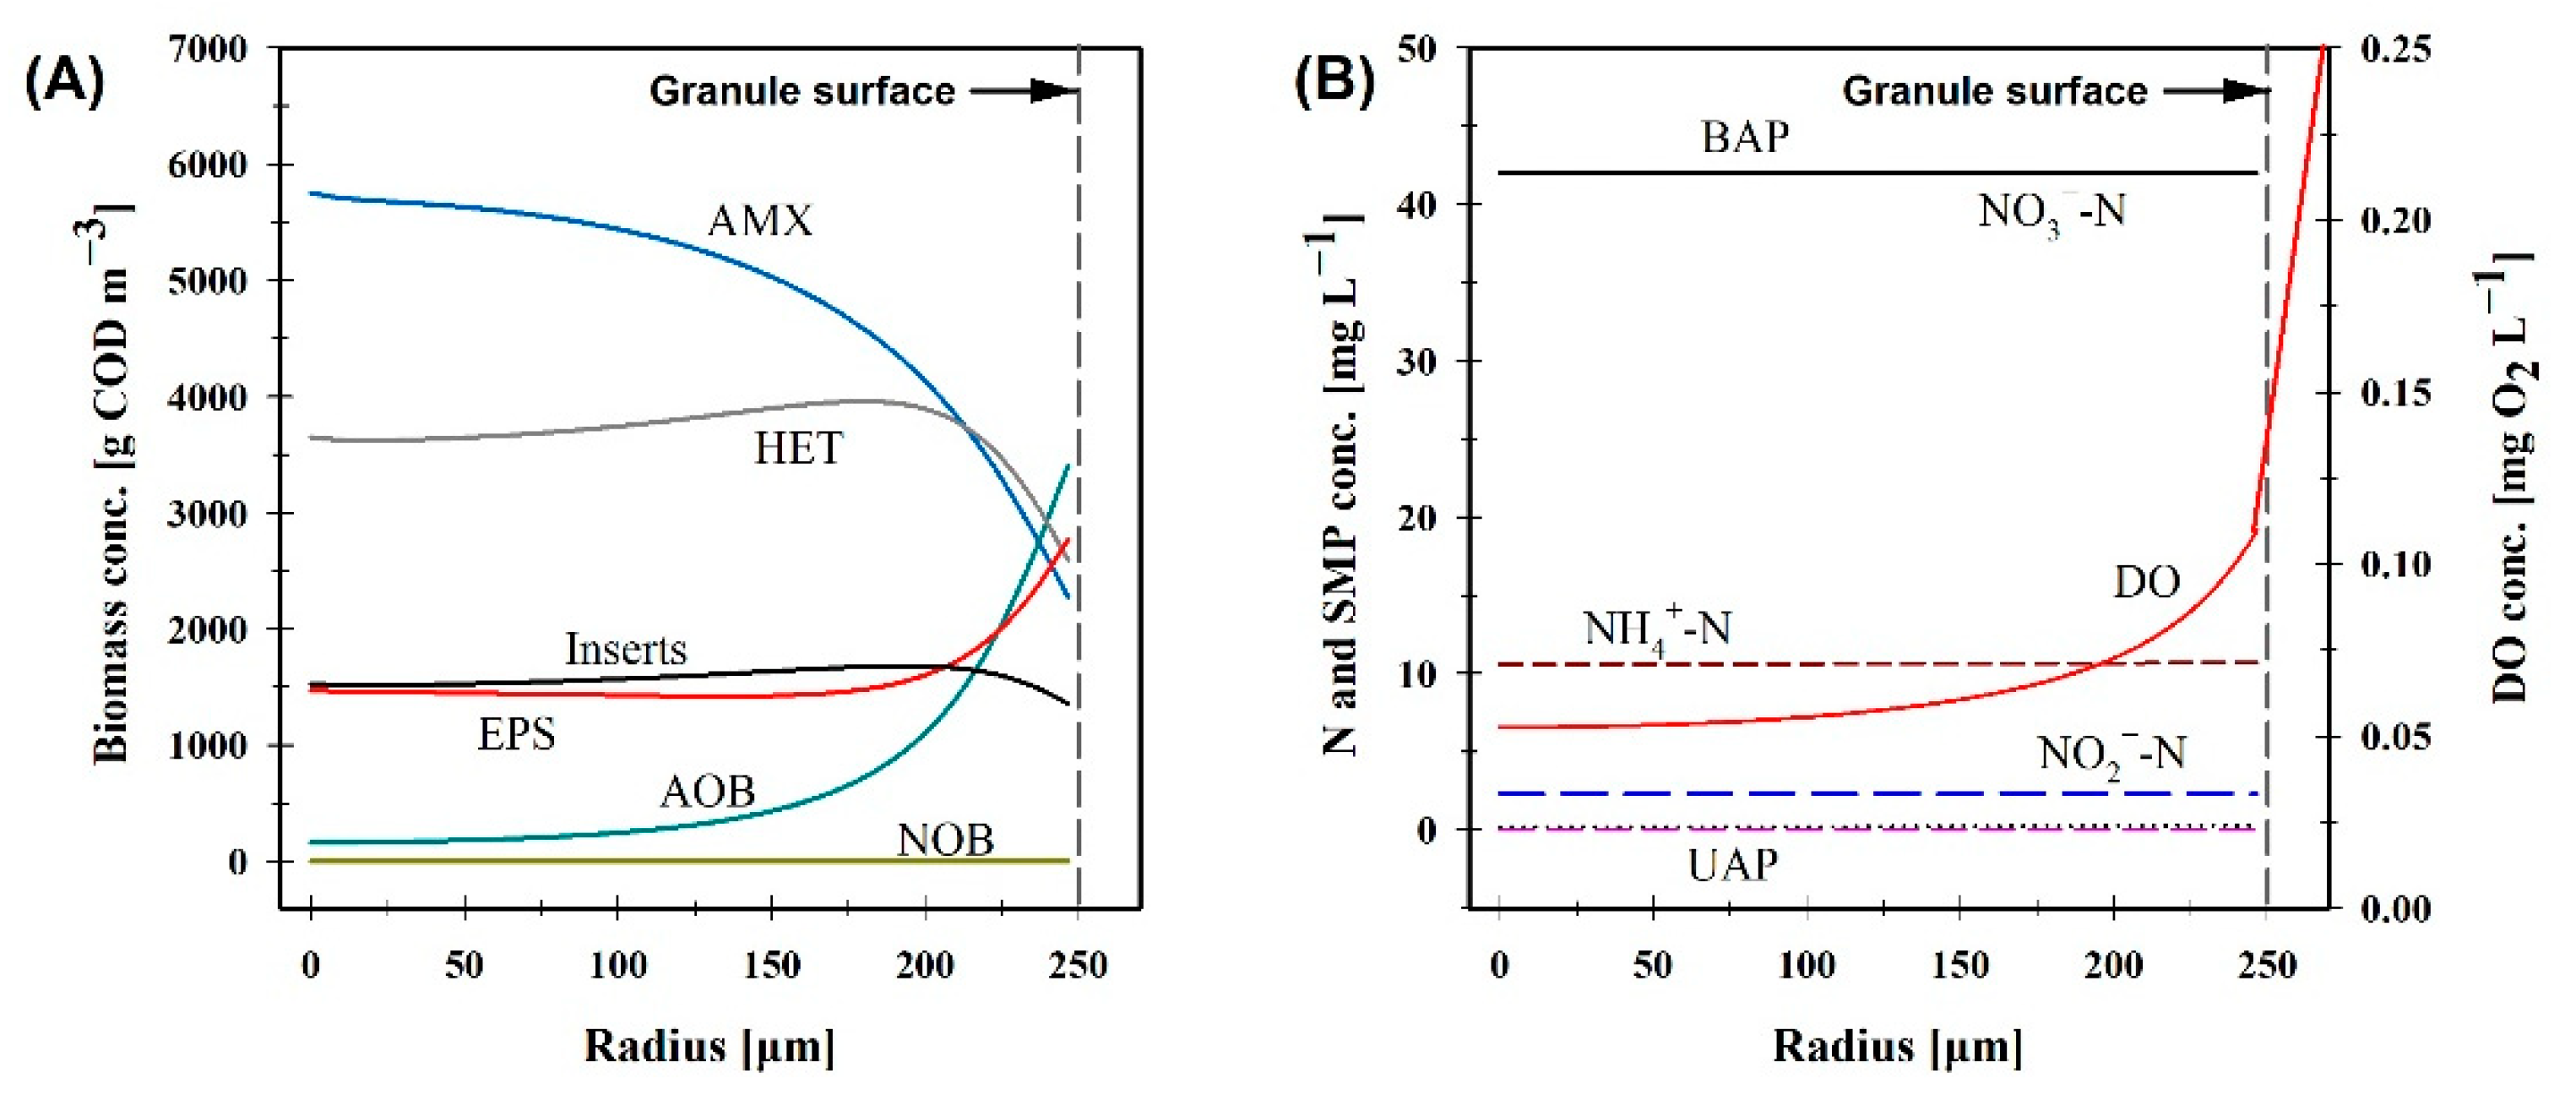
3.4. Evaluation of the Microbial Interactions in the Granules

As shown in Table 1, the mean nitrate concentration in the effluent was about 44 mg N L−1, which was lower than the theoretical value (55.5 mg N L−1) calculated according to the PN/A stoichiometry [20]. It can be reasonably expected that denitrification of heterotrophs relying on SMP released by autotrophs as carbon source would occur in the system under oxygen limited condition. A similar result was also reported in nitrifying granules fed with ammonium as the sole electron donor [21]. Although the formation of SMP enhances the removal efficiency of nitrogen, most of the SMP accumulated in the effluence (40.37 mg L−1) due to the quite slow biodegradation kinetic of BAP.
A large decrease of DO concentration could be observed within the external diffusive boundary layer (Figure 5), which has also been reported by other authors [6,22]. AOB dominated within the first 100 μm below the granule surface, while AMX accumulated in the inner of the granule. Interestingly, AMX still survived in the outermost 100 μm layer of the granule but their proportion decreased distinctly despite DO being present, which has also been observed by FISH in previous studies [23,24]. Heterotrophs were present throughout the granule, suggesting that SMP released by autotrophs can support the heterotrophic growth using oxygen, nitrite or nitrate as electron acceptor.

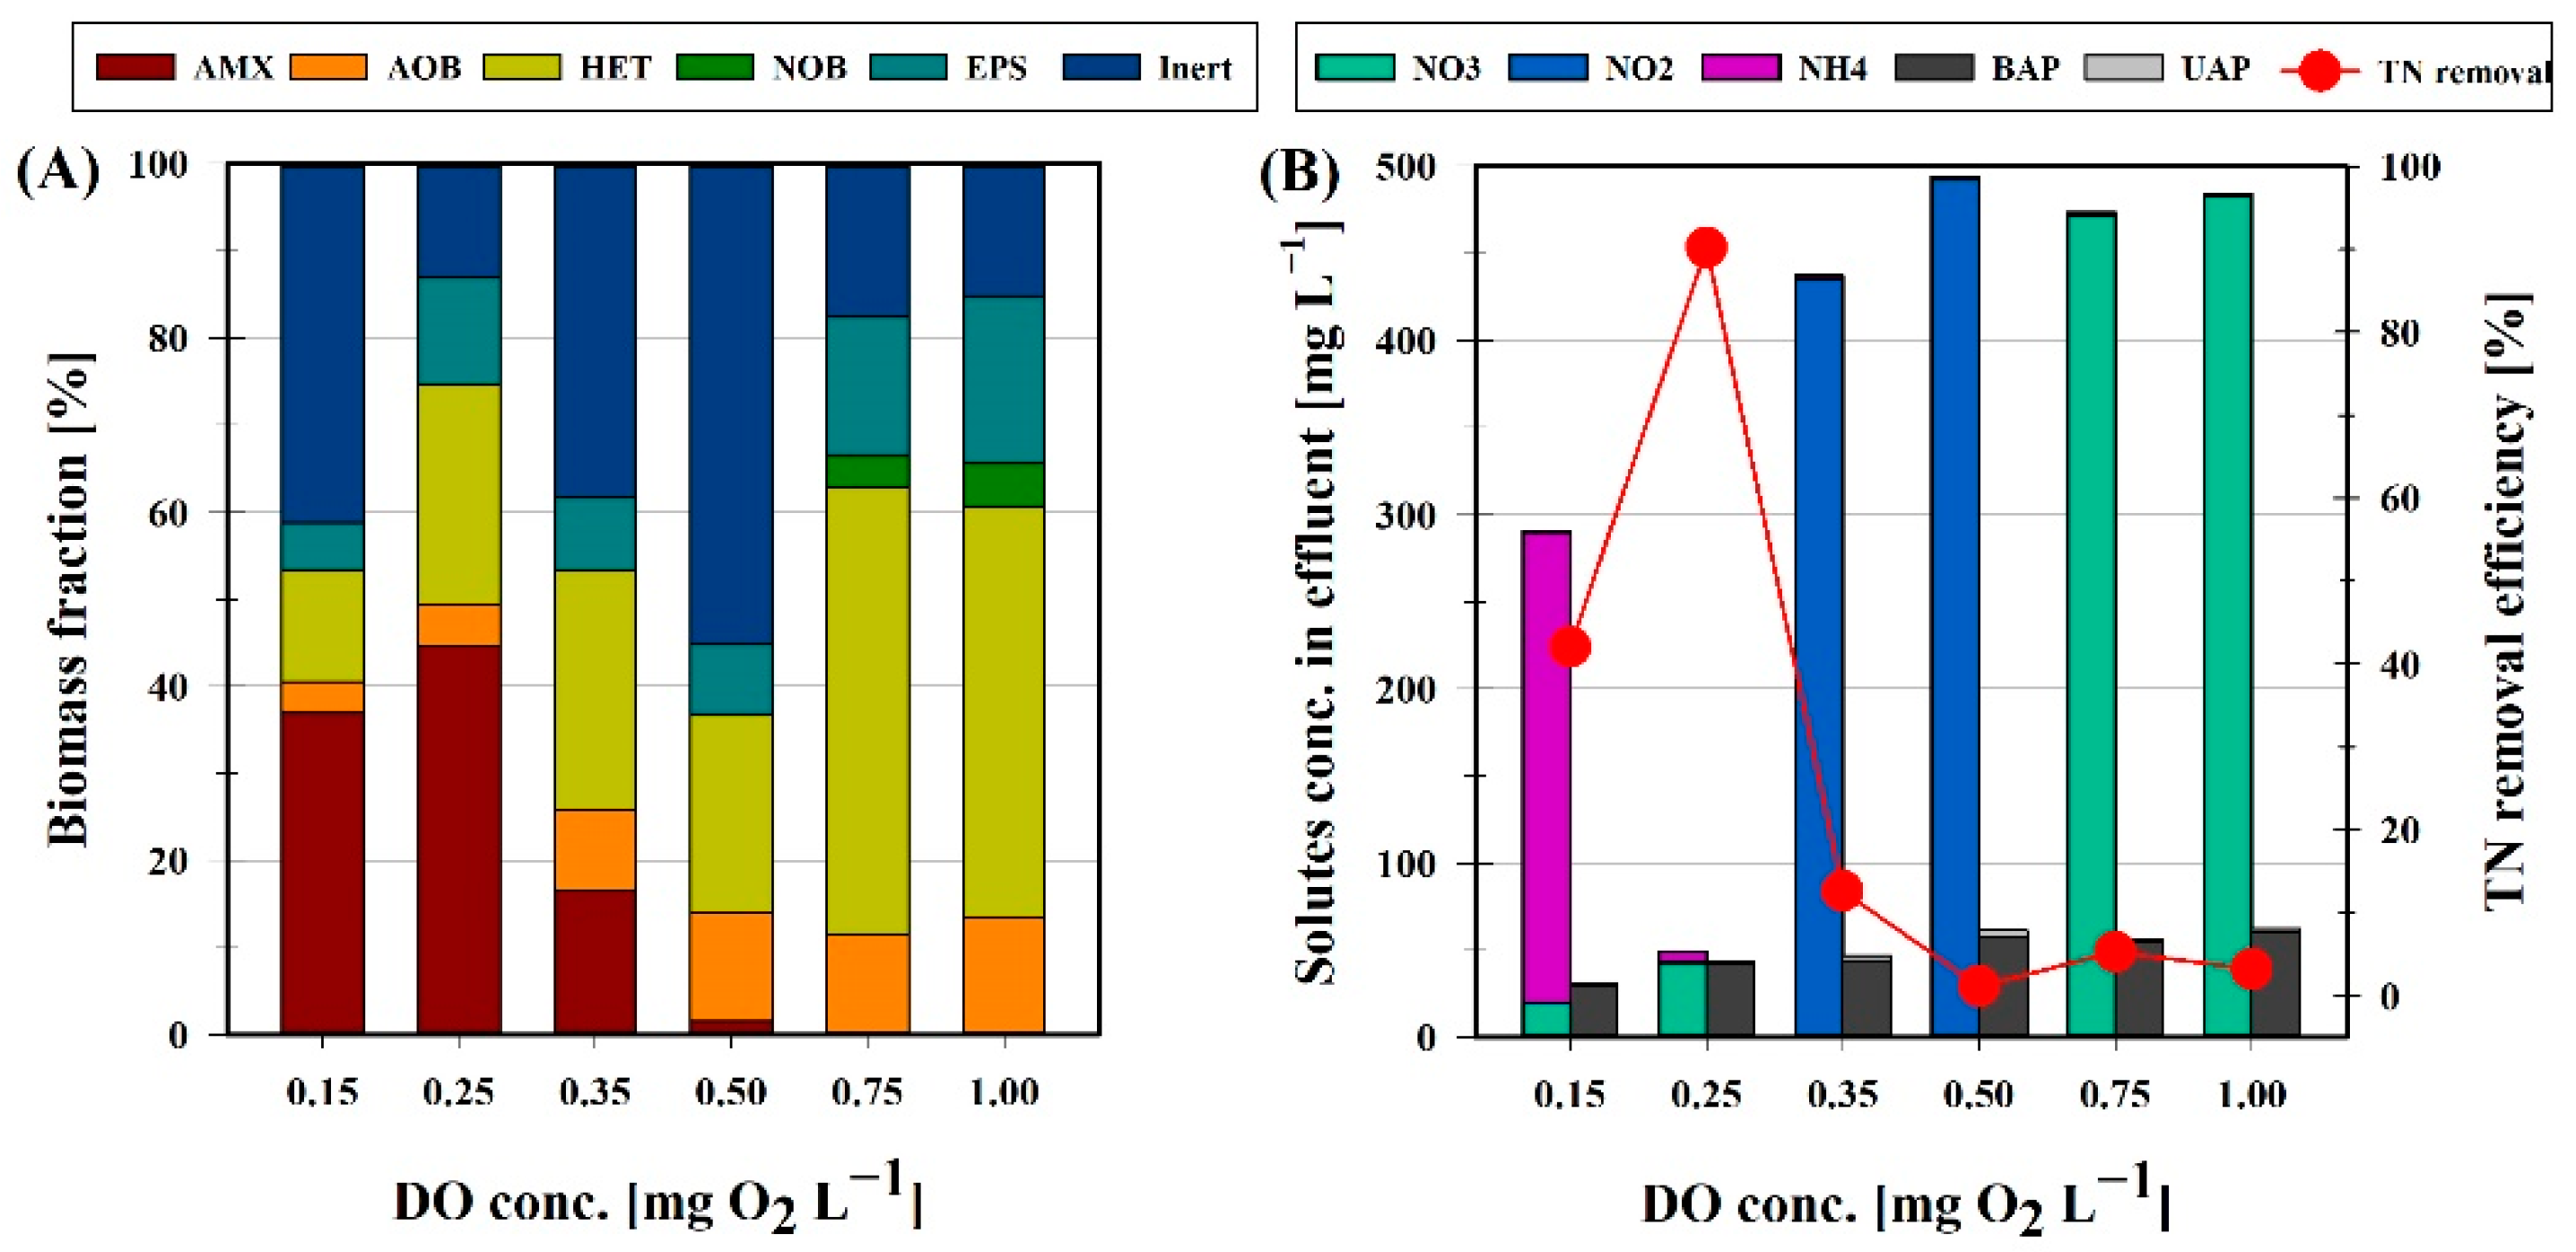
3.5. Effect of Dissolved Oxygen on Heterotrophic Growth

In PN/A processes, DO could be considered as the dominant parameter determining the process performance. Higher DO levels lead to the inhibition of AMX and the development of NOB, whereas a too-low DO levels limit the oxidization of ammonium and reduce the nitrogen removal efficiency [25,26]. Figure 6 summarizes the steady state reactor performance and the biomass fractions in the granule at different bulk liquid oxygen levels. There is a clear peak of nitrogen removal efficiency at 0.25 mg O2 L−1. At this point, the activity balance between AOB and AMX is obtained, and NOB is completely suppressed. At very low DO concentrations (0.15 mg O2 L−1), a fraction of ammonium remains in the effluent due to the oxygen limitation of AOB. Increasing DO concentrations would lead to the inhibition of AMX, and thus result in the increase of nitrite concentration in the effluent. When the DO concentration exceeds 0.75 mg O2 L−1, the nitrate concentration in the effluent increased dramatically, suggesting that NOB could effectively compete with AOB for oxygen and with AMX for nitrite. Besides, the concentration of SMP in the effluent and the fraction of heterotroph in the granule both increased with the increasing of the DO concentration in the bulk liquid. This could be explained by the following reasons. On the one hand, the increased concentration of DO could reduce the competition for oxygen between heterotrophs and autotrophs, and thus promote the heterotrophic growth in the granule. On the other hand, the content of AOB and NOB increased significantly with the increasing DO levels, which could enhance the SMP formation as the growth rates of nitrifier is much higher than that of AMX. The high SMP production should be another reason for the increased growth of heterotroph. It thus can be concluded that the effective control of DO concentration is crucial for the operation of PN/A process.

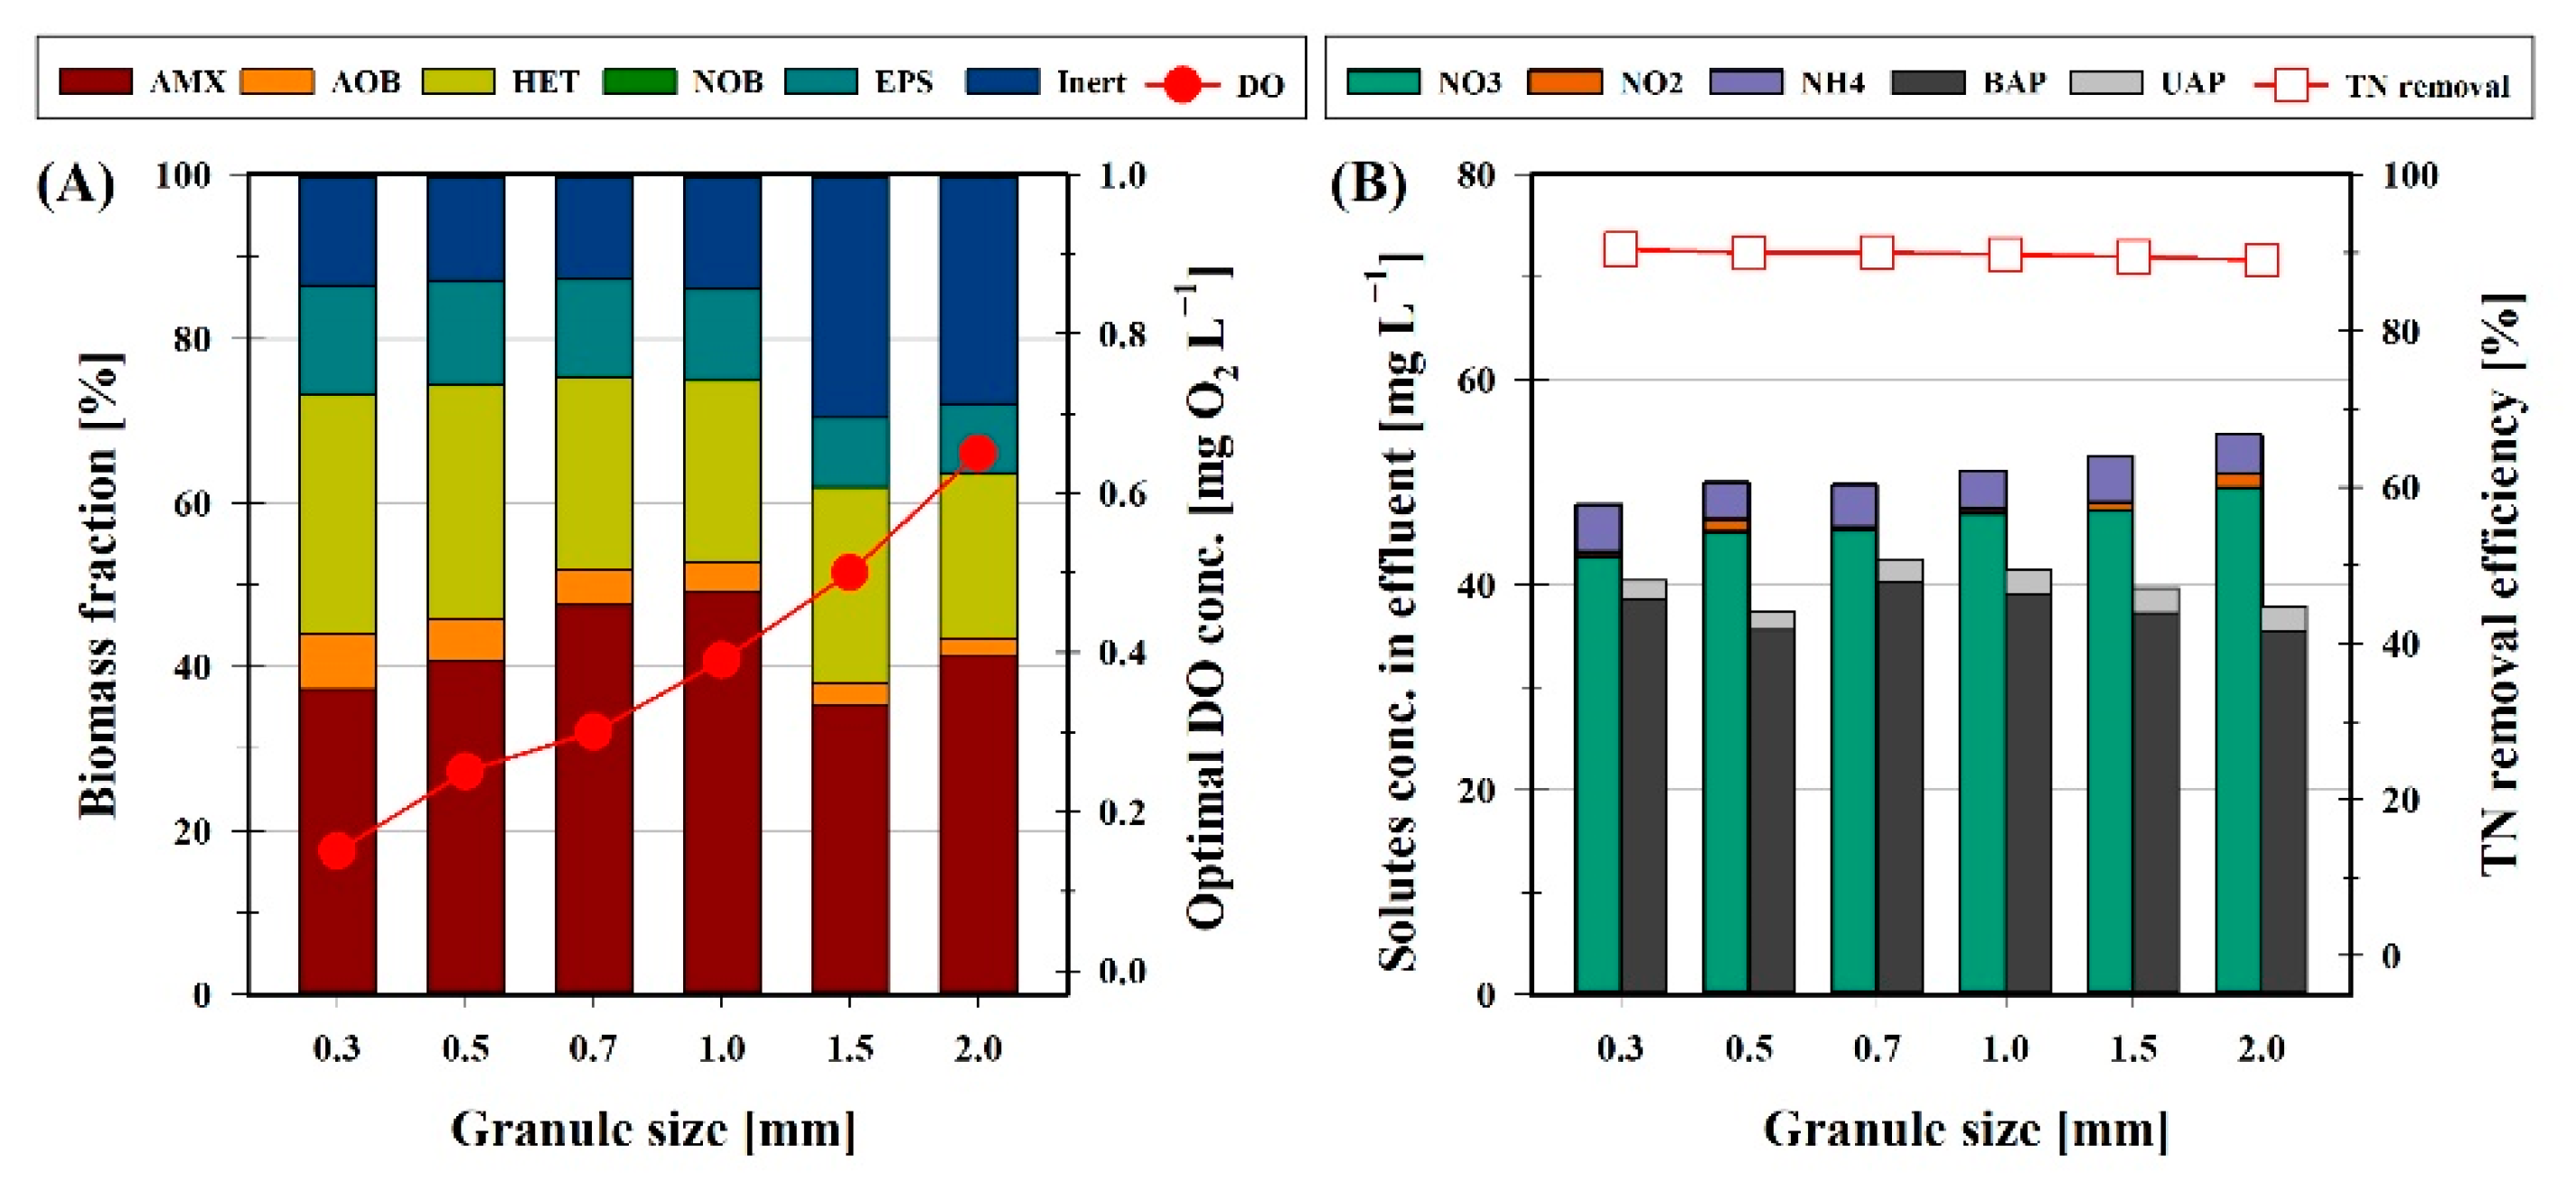
3.6. Effect of Granule Size on Heterotrophic Growth

The depth of oxygen penetration inside the granule is highly dependent on the DO concentration in the bulk liquid and the granule diameter. Consequently, there exists an optimal DO concentration for maximum nitrogen removal efficiency at a certain granule size [27]. In order to evaluate the effect of the granule size on biomass fractions and nitrogen removal, simulations were performed for a broad range of granule diameters. It should be pointed out that the total concentration of granules (VSS) in the reactor has been set constant at 4000 g COD m−3 in these simulations, meaning that the number of granules was varied as the granule diameter.
As shown in Figure 7, it can be observed that a high total nitrogen removal efficiency (>88%) could be achieved for all granule sizes ranging from 0.3 to 2.0 mm by controlling the bulk oxygen concentration within an optimal value. Moreover, as the granule diameter increases, higher bulk oxygen concentrations are needed to achieve maximum nitrogen removal. This can be attributed to the lower surface to volume ratio of spherical particles associated with larger granules, resulting in less aerobic and more anoxic volume.
The fraction of AMX in the granule did not change significantly with increasing granule size, whereas the fractions of AOB and HET decreased slightly (Figure 7A). This can be attributed to the increased oxygen concentration in the bulk liquid associated with larger granules, resulting in a higher activity for AOB and HET. However, little difference is observed for the effluent concentration of SMP at varying granule size (Figure 7B), indicating that the granule size has little influence on the production and biodegradation of SMP. This is mainly because the total biomass concentration (VSS) and ammonium sludge load remains constant in all simulations. It has been demonstrated by a previous study that solids retention time (SRT) and substrate volumetric load can heavily affect the accumulation of SMP [10]. Hence, the simulation results imply that increasing granule size could decrease heterotrophic growth, but hardly improve the effluent concentration of SMP.

4. Conclusions

This study evaluated the microbial interactions between autotrophs and heterotrophs through the exchange of SMP in the PN/A reactor using experimental analyses and mathematical model. The following conclusions could be drawn:
  • The SMP secreted by autotrophs could support the growth of heterotrophs in the PN/A system, whereas most of the SMP (40.37 mg COD L−1) still accumulate in the effluent due to the poor biodegradability.
  • The microbial compositions in the reactor obtained by qPCR showed that AOB, AMX, Nitrobacter, Nitrospira, and heterotrophs accounted for about 8.35%, 56.59%, 0.92%, 1.38%, and 32.76% of the total bacteria, respectively.
  • The bulk oxygen concentration is determined to be the dominant factor governing the process performance and biomass fractions in the granule. Increasing granule size could decrease heterotrophic growth, but has little effect on the effluent concentration of SMP.

Supplementary Materials

The following are available online at https://www.mdpi.com/2073-4441/13/3/324/s1, Table S1: qPCR primers used in this study. Table S2: Biofilm and mass transfer parameters used in this study. Table S3: Stoichiometry matrix for bioconversion processes in the model. Table S4: Kinetic rate expressions for bioconversion processes in the model. Table S5: Kinetic and stoichiometric parameters for bioconversions used in the model. Figure S1: Schematic representation of the mode set-up in AQUASIM.

Author Contributions

Conceptualization, G.L. and Z.C.; methodology, G.L. and X.H.; data curation, J.M.; writing—original draft preparation, G.L.; writing—review and editing, Z.C.; supervision, H.R.; funding acquisition, Z.C. All authors have read and agreed to the published version of the manuscript.

Funding

This work was financially supported by the National Science Foundation of China (51808141), and the Open Research Fund Program of Key Laboratory for Water Quality and Conservation of the Pearl River Delta (0601GD001).

Institutional Review Board Statement

Not applicable.

Informed Consent Statement

Not applicable.

Data Availability Statement

The data presented in this study are available in Supplementary Material.

Conflicts of Interest

The authors declare no conflict of interest.

References

  1. Kumwimba, M.N.; Lotti, T.; Senel, E.; Li, X.Y.; Suanon, F. Anammox-based processes: How far have we come remains? A review by bibliometric analysis. Chemosphere 2020, 238, 21. [Google Scholar]
  2. Cho, S.; Kambey, C.; Nguyen, V.K. Performance of anammox processes for wastewater treatment: A critical review on effects of operational conditions and environmental Stresses. Water 2020, 12, 20. [Google Scholar] [CrossRef] [Green Version]
  3. Vlaeminck, S.E.; De Clippeleir, H.; Verstraete, W. Microbial resource management of one-stage partial nitritation/anammox. Microb. Biotechnol. 2012, 5, 433–448. [Google Scholar] [CrossRef] [PubMed]
  4. Wang, S.P.; Li, J.Y.; Wang, D.; Wang, C.C.; Zheng, J.F.; Qiu, C.S.; Yu, J.J. Start-up of single-stage partial nitritation-anammox micro-granules system: Performance and microbial community dynamics. Environ. Res. 2020, 186, 12. [Google Scholar] [CrossRef] [PubMed]
  5. Zhang, L.; Lv, W.; Li, S.; Geng, Z.; Yao, H. Nitrogen removal characteristics and comparison of the microbial community structure in different anaerobic ammonia oxidation reactors. Water 2019, 11, 230. [Google Scholar] [CrossRef] [Green Version]
  6. Vazquez-Padin, J.; Mosquera-Corral, A.; Campos, J.L.; Mendez, R.; Revsbech, N.P. Microbial community distribution and activity dynamics of granular biomass in a CANON reactor. Water Res. 2010, 44, 4359–4370. [Google Scholar] [CrossRef]
  7. Zhang, X.; Zhang, H.; Ye, C.; Wei, M.; Du, J. Effect of COD/N ratio on nitrogen removal and microbial communities of CANON process in membrane bioreactors. Bioresour. Technol. 2015, 189, 302–308. [Google Scholar] [CrossRef]
  8. Chu, Z.; Wang, K.; Li, X.; Zhu, M.; Yang, L.; Zhang, J. Microbial characterization of aggregates within a one-stage nitritation–anammox system using high-throughput amplicon sequencing. Chem. Eng. J. 2015, 262, 41–48. [Google Scholar] [CrossRef]
  9. Lawson, C.E.; Wu, S.; Bhattacharjee, A.S.; Hamilton, J.J.; McMahon, K.D.; Goel, R.; Noguera, D.R. Metabolic network analysis reveals microbial community interactions in anammox granules. Nat. Commun. 2017, 8, 12. [Google Scholar] [CrossRef] [PubMed]
  10. Ni, B.J.; Zeng, R.J.; Fang, F.; Xie, W.M.; Xu, J.; Sheng, G.P.; Sun, Y.J.; Yu, H.Q. Evaluation on factors influencing the heterotrophic growth on the soluble microbial products of autotrophs. Biotechnol. Bioeng. 2011, 108, 804–812. [Google Scholar] [CrossRef] [PubMed]
  11. Ni, B.J.; Ruscalleda, M.; Smets, B.F. Evaluation on the microbial interactions of anaerobic ammonium oxidizers and heterotrophs in Anammox biofilm. Water Res. 2012, 46, 4645–4652. [Google Scholar] [CrossRef] [PubMed]
  12. Vlaeminck, S.E.; Terada, A.; Smets, B.F.; van der Linden, D.; Boon, N.; Verstraete, W.; Carballa, M. Nitrogen removal from digested black water by one-stage partial nitritaion and anamox. Environ. Sci. Technol. 2009, 43, 5035–5041. [Google Scholar] [CrossRef] [PubMed]
  13. Joss, A.; Salzgeber, D.; Eugster, J.; Konig, R.; Rottermann, K.; Burger, S.; Fabijan, P.; Leumann, S.; Mohn, J.; Siegrist, H. Full-scale nitrogen removal from digester liquid with partial nitritation and anammox in one SBR. Environ. Sci. Technol. 2009, 43, 5301–5306. [Google Scholar] [CrossRef] [PubMed]
  14. Hao, X.D.; Heijnen, J.J.; van Loosdrecht, M.C.M. Sensitivity analysis of a biofilm model describing a one-stage completely autotrophic nitrogen removal (CANON) process. Biotechnol. Bioeng. 2002, 77, 266–277. [Google Scholar] [CrossRef]
  15. Volcke, E.I.; Picioreanu, C.; De Baets, B.; van Loosdrecht, M.C.M. Effect of granule size on autotrophic nitrogen removal in a granular sludge reactor. Environ. Technol. 2010, 31, 1271–1280. [Google Scholar] [CrossRef] [PubMed]
  16. APHA. Standard Methods for the Examination of Water and Wastewater, 21st ed.; American Public Health Association: Washington, DC, USA, 2005. [Google Scholar]
  17. Reichert, P. AQUASIM 2.0: Computer Program for the Identification and Simulation of Aquatic Systems; EAWAG: Dubendorf, Switzerland, 1998. [Google Scholar]
  18. Laspidou, C.S.; Rittmann, B.E. A unified theory for extracellular polymeric substances, soluble microbial products, and active and inert biomass. Water Res. 2002, 36, 2711–2720. [Google Scholar] [CrossRef]
  19. Wett, B. Development and implementation of a robust deammonification process. Water Sci. Technol. 2007, 56, 81–88. [Google Scholar] [CrossRef]
  20. Third, K.A.; Sliekers, A.O.; Kuenen, J.G.; Jetten, M.S.M. The CANON System (Completely Autotrophic Nitrogen-removal Over Nitrite) under Ammonium Limitation: Interaction and Competition between Three Groups of Bacteria. Syst. Appl. Microbiol. 2001, 24, 588–596. [Google Scholar] [CrossRef]
  21. Matsumoto, S.; Katoku, M.; Saeki, G.; Terada, A.; Aoi, Y.; Tsuneda, S.; Picioreanu, C.; van Loosdrecht, M.C.M. Microbial community structure in autotrophic nitrifying granules characterized by experimental and simulation analyses. Environ. Microbiol. 2010, 12, 192–206. [Google Scholar] [CrossRef]
  22. Wilen, B.M.; Gapes, D.; Keller, J. Determination of external and internal mass transfer limitation in nitrifying microbial aggregates. Biotechnol. Bioeng. 2004, 86, 445–457. [Google Scholar] [CrossRef]
  23. Gilbert, E.M.; Muller, E.; Horn, H.; Lackner, S. Microbial activity of suspended biomass from a nitritation-anammox SBR in dependence of operational condition and size fraction. Appl. Microbiol. Biotechnol. 2013, 97, 8795–8804. [Google Scholar] [CrossRef] [PubMed]
  24. Vlaeminck, S.E.; Terada, A.; Smets, B.F.; De Clippeleir, H.; Schaubroeck, T.; Bolca, S.; Demeestere, L.; Mast, J.; Boon, N.; Carballa, M.; et al. Aggregate size and architecture determine microbial activity balance for one-stage partial nitritation and anammox. Appl. Environ. Microb. 2010, 76, 900–909. [Google Scholar] [CrossRef] [PubMed] [Green Version]
  25. Zhang, L.; Liu, M.; Zhang, S.; Yang, Y.; Peng, Y. Integrated fixed-biofilm activated sludge reactor as a powerful tool to enrich anammox biofilm and granular sludge. Chemosphere 2015, 140, 114–118. [Google Scholar] [CrossRef] [PubMed]
  26. Regmi, P.; Miller, M.W.; Holgate, B.; Bunce, R.; Park, H.; Chandran, K.; Wett, B.; Murthy, S.; Bott, C.B. Control of aeration, aerobic SRT and COD input for mainstream nitritation/denitritation. Water Res. 2014, 57, 162–171. [Google Scholar] [CrossRef] [PubMed]
  27. Wang, L.; Zheng, P.; Xing, Y.; Li, W.; Yang, J.; Abbas, G.; Liu, S.; He, Z.; Zhang, J.; Zhang, H.; et al. Effect of particle size on the performance of autotrophic nitrogen removal in the granular sludge bed reactor and microbiological mechanisms. Bioresour. Technol. 2014, 157, 240–246. [Google Scholar] [CrossRef] [PubMed]
Figure 1. Schematic of biological conversion processes taken into account in the model.
Water 13 00324 g001
Figure 2. Reactor performance during the study period.
Water 13 00324 g002
Figure 3. 16S rRNA gene copies (A) and relative abundance (B) of total bacteria (Eub), AMX, AOB, Nitrobacter and Nitrospira in Phase I (day 64) and Phase II (day 118) using real-time quantitative PCR. Error bars indicate the standard deviation of three reactions.
Water 13 00324 g003
Figure 4. Measured concentrations during one cycle of operation (points: NH4-N (■), NO2-N (△), NO3-N (○), SMP (●).) and simulated results with the present model (lines) in the standard case (granule diameter 0.5 mm, DO 0.25 mg L−1, influent ammonium 500 mg N L−1).
Water 13 00324 g004
Figure 5. Spatial distribution of (A) biomass concentrations and (B) solute concentrations along the radius of the granules in the standard case (granule diameter 0.5 mm, DO 0.25 mg L−1, influent ammonium 500 mg N L−1) revealed by model analysis.
Water 13 00324 g005
Figure 6. Biomass fractions (A) and nitrogen removal (B) at different dissolved oxygen concentration level. Simulation results for 0.5 mm of granule diameter, 500 mg N L−1 of influent ammonium.
Water 13 00324 g006
Figure 7. Mode-base analysis for the influence of granule size on heterotrophic growth in the granules: (A) biomass fractions and (B) nitrogen removal. Note that simulations were performed under different granule diameters with corresponding optimal bulk oxygen concentrations.
Water 13 00324 g007
Table 1. Comparison simulated results with experimental data in the standard case a.
Case I: [0.25 kg N m−3 d−1] bCase II: [0.50 kg N m−3 d−1]
Experimental DataSimulated ResultsExperimental DataSimulated Results
Effluent concentration (mg L−1)
Ammonium5.65 ± 3.21 c3.3911.71 ± 5.7113.18
Nitrite1.77 ± 0.650.581.69 ± 1.780.40
Nitrate44.63 ± 2.5046.7443.54 ± 2.1444.49
SMP43.24 ± 5.7141.3244.99 ± 3.4940.37
Biomass fraction d (%)
AOB11.876.738.357.69
AMX61.6961.2456.5957.28
HET25.1032.0332.7635.02
NOB1.34ND e2.300.01
a Standard case: granule diameter 0.5 mm, DO 0.25 mg L−1, influent ammonium 500 mg N L−1. b The total nitrogen removal rates of Case I and Case II were 0.09 and 0.18 kg N kg VSS−1 d−1. c Experimental data are expressed as averages ± standard deviations with 10 days operation. d Biomass fractions were determined by real-time quantitative PCR. e ND, not detected.
Publisher’s Note: MDPI stays neutral with regard to jurisdictional claims in published maps and institutional affiliations.

