
Assessment of Full-Scale Indirect Potable Water Reuse in El Port de la Selva, Spain
by
 , and
, and
Soňa Fajnorová
1,2, 
Christoph Sprenger
3,
Nina Hermes
4,
Thomas A. Ternes
4,
Lluís Sala
5,
Ulf Miehe
3,
Jörg E. Drewes
1 and
Uwe Hübner
1,* 1
Chair of Urban Water Systems Engineering, Technical University of Munich, Am Coulombwall 3, 85748 Garching, Germany
2
Department of Water Technology and Environmental Engineering, University of Chemistry and Technology, Technická 5, 166 28 Prague, Czech Republic
3
Kompetenzzentrum Wasser Berlin gGmbH, Cicerostr. 24, 10709 Berlin, Germany
4
Federal Institute of Hydrology, Am Mainzer Tor 1, 56068 Koblenz, Germany
5
Consorci Costa Brava, Plaça Josep Pla 4, 3er 1a, 17001 Girona, Spain
*
Author to whom correspondence should be addressed.
Water 2021, 13(3), 325; https://doi.org/10.3390/w13030325
Submission received: 23 December 2020
/
Revised: 20 January 2021
/
Accepted: 22 January 2021
/
Published: 28 January 2021
(This article belongs to the Section Wastewater Treatment and Reuse)
Abstract
:In 2015, the town of El Port de la Selva in Spain implemented soil-aquifer treatment (SAT) using tertiary treated wastewater effluents to replenish the local potable aquifer. This study evaluated the initial phase of this indirect potable water reuse system including a characterization of hydraulic conditions in the aquifer and monitoring of microbial contaminants and 151 chemicals of emerging concern (CECs). The combined treatment resulted in very low abundances of indicator bacteria, enteric viruses and phages in the monitoring wells after three days of infiltration and a reduction of antibiotic microbial resistance to background levels of local groundwater. After tertiary treatment, 94 CECs were detected in the infiltration basin of which 15 chemicals exceeded drinking water thresholds or health-based monitoring trigger levels. Although SAT provided an effective barrier for many chemicals, 5 CECs were detected above health-based threshold levels in monitoring wells after short hydraulic retention times. However, additional attenuation is expected due to dilution prior to abstraction via downstream drinking water wells and during granular activated carbon (GAC) filtration, which was recently installed to mitigate residual CECs. Overall, the results demonstrate that indirect potable water reuse can be a reliable option for smaller communities, if related risks from microbial and chemical contaminants are adequately addressed by tertiary treatment and subsequent SAT, providing sufficient hydraulic retention times for pathogen decay and CEC removal.
1. Introduction
Almost 7% of the world population (about 500 million people) currently live in areas where the water demand exceeds the capacity of local water resources and two thirds of the population are exposed to water stress at least for one month a year [1]. Water sources in arid and semi-arid areas are subject to significant pressure especially during spring and summer months, when water demand rises exorbitantly due to tourism and irrigation needs. For Europe, a two-fold increase of water abstraction has been reported during summer months compared to winter periods in recent years [2].
In the context of increasing water stress and scarcity, reuse of treated wastewater effluents has been recognized as a possible alternative water source [3,4,5]. Currently, recycled water is mainly applied in agriculture and landscape irrigation; however, due to the limited freshwater resources, the implementation of planned potable reuse to augment drinking water supplies is increasing worldwide [6,7,8,9].
In contrast to direct potable reuse (DPR), where recycled water is extensively treated and blended with other sources in drinking water facilities or distribution systems, indirect potable reuse (IPR) involves recharge of advanced treated water into an environmental buffer like a surface water reservoir or an aquifer [8]. In addition to mixing with other sources and provision of buffer in case of emergency, the recharge into aquifers can result in additional attenuation of many contaminants [10,11].
El Port de la Selva is a town of 970 inhabitants located at the coast of Costa Brava, Spain. The resident population at Costa Brava increases by a factor of four during summer months due to tourism [12]. The high water consumption during the tourism season leads to rapid decline in groundwater levels of local aquifers with limited capacity. The climate is characterized by long hot and dry summer periods and short and intensive rainfall events occurring usually in September and December. In addition, groundwater quality is challenged by sea water intrusion and pollution at the coast from wastewater discharge. Since El Port de la Selva is not connected to the regional water supply network, its drinking water supply relies on local groundwater resources. The average annual drinking water abstraction in El Port de la Selva of about 400,000 m3 undergoes strong seasonal variation ranging from about 500 m3/day during winter months to 2500 m3/day in summer, and is significantly higher than the average amount of wastewater treated annually (220,000 m3) [13].
Current tertiary treatment and a non-potable reuse infrastructure was designed for street sweeping, non-agricultural irrigation, and infiltration via the dry riverbed to prevent saltwater intrusion in summer months. In November 2015, groundwater recharge during winter months was tested regarding its potential to strengthen the local water reuse strategy with the objectives to (i) replenish local groundwater sources, (ii) protect the aquifer from sea water intrusion, (iii) increase overall reclamation by operating the available advanced treatment system throughout the year, and (iv) demonstrate non-membrane based potable water reuse. It was projected to infiltrate 200 m3/d of tertiary treated effluent during 200–240 d/yr (outside of the tourism season, i.e., the period from October to May), resulting in 40,000–48,000 m3/yr additional supply recharged to the groundwater (about 10% of the abstracted groundwater).
This study provides a comprehensive assessment of the indirect potable reuse practice at El Port de la Selva with a focus on hydraulic characterization of groundwater infiltration and monitoring of health-relevant water quality parameters while employing tertiary water treatment prior to groundwater recharge. The monitoring program included validation of pathogen contamination abatement and the attenuation of chemicals of emerging concern (CECs) and antibiotic microbial resistance. Results from this study provide valuable data on the safety, reliability and benefits of small-scale potable water reuse systems and serve as the basis for an entry-level risk assessment with regard to microbiological and chemical risks.
2. Materials and Methods
2.1. Description of the Wastewater Treatment and Recharge System
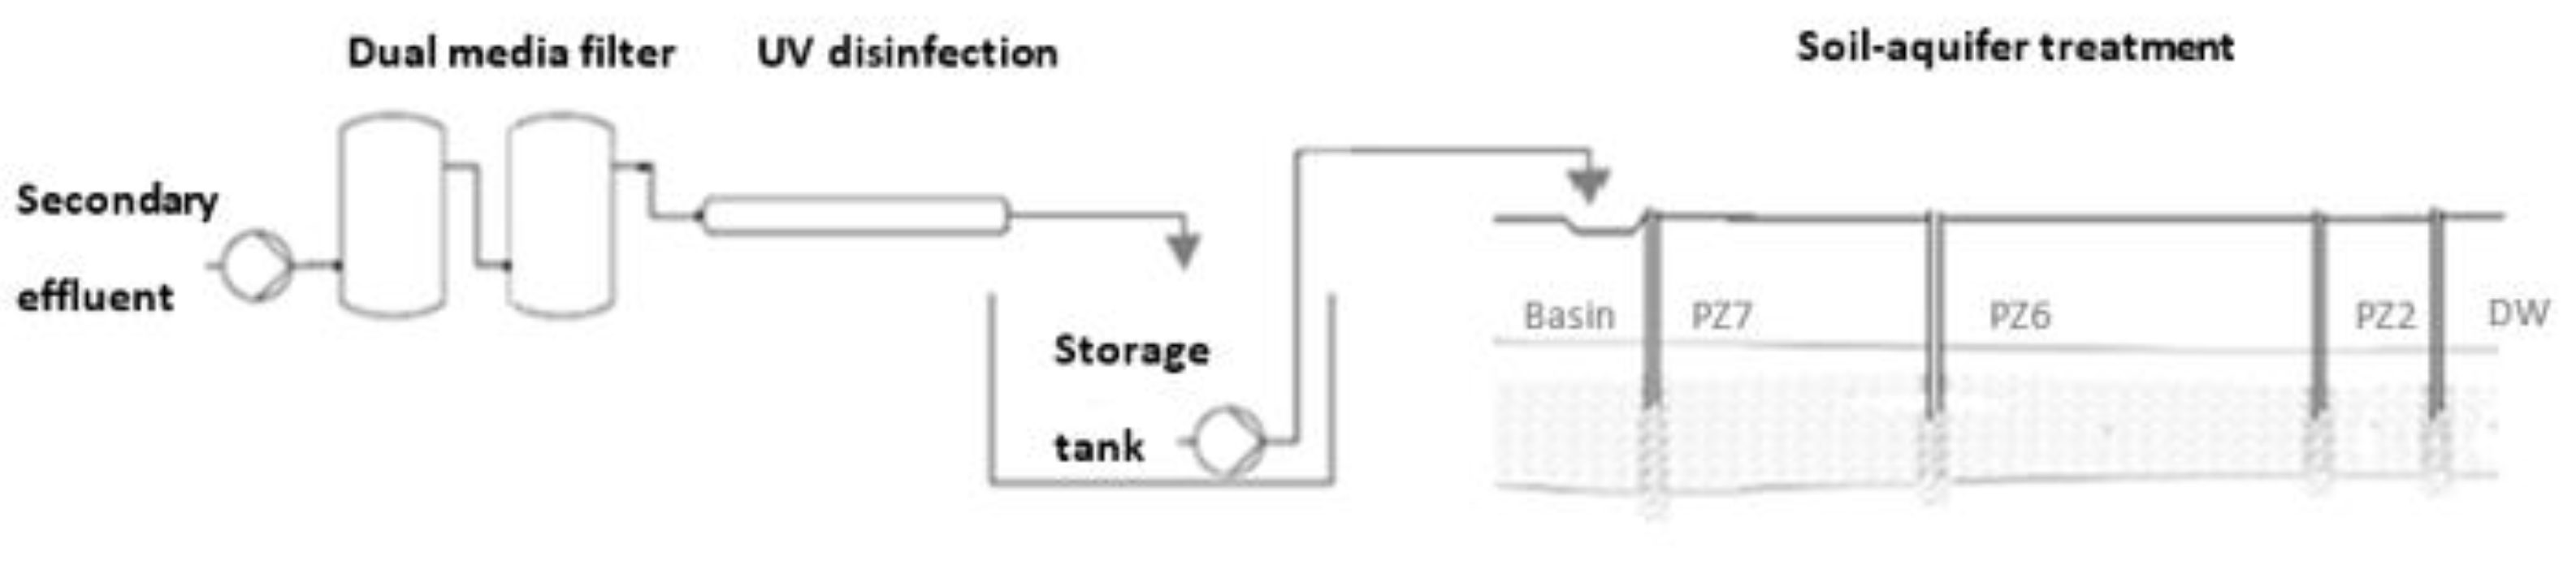
The conventional wastewater treatment in El Port de la Selva (capacity of 10,500 population equivalents (PE)) consists of biological nutrient removal with phosphorus precipitation (ferric chloride) and secondary clarification. The secondary effluent is further treated in a tertiary treatment plant with a capacity of 600 m3/day, equipped with dual-media filtration (with optional pre-coagulation) and UV disinfection (800–820 J/m2, Trojan Technologies UVSWIFT sc B08) [14]. During winter months, tertiary effluent is pumped to an elevated storage tank, from where the recharge basins are fed. An additional granular activated carbon (GAC) filter after dual-media filtration and prior to UV disinfection was employed after the monitoring campaigns conducted for this study to remove residual emerging contaminants prior to recharge. The schematic flow diagram of the advanced treatment and groundwater recharge system is illustrated in Figure 1.
2.2. Site Description of Recharge Area
The infiltration system consisted of three recharge basins with a total infiltration area of 439 m2. Detailed information on the effective recharge area of individual recharge basins is specified in the supporting information (Table S1 and Figure S1). To reduce clogging, the infiltration basins were operated in wet-dry cycles. Only one basin was in operation, while the second was drying, and the third sat dry for at least seven days. As infiltration was interrupted due to exceedance of threshold parameters (see below), the actual drying periods were extended frequently. The bed of each infiltration basin was filled with a 40 cm thick layer of technical sand (grain size diameter d = 0.1–0.35 mm; uniformity d60/d10 < 1.5 mm) [13].
A map of the study area is shown in Figure 2. The recharge basins were located about 1 km upstream of local water supply wells (AM1, AM2). In addition to existing wells in groundwater flow direction (AM1 and AM2) and the coastal well (Bolera), new rotary drilled observation wells (PZ4, PZ6 and PZ7, diameter Ø 86 mm, depth 6–10 m) were installed to monitor infiltration dynamics, hydraulics, and the subsurface removal capacity regarding chemicals of emerging concern (CECs) and microorganisms (i.e., bacteria and viruses). Moreover, a monitoring well (PZ3) was installed up-gradient of the recharge area to determine native groundwater quality.
The alluvial aquifer in El Port de la Selva was characterized based on the piezometer (PZ) drillings at the recharge area. The shallow hydrogeology is a relatively thin (13–14 m) aquifer composed of poorly sorted and poorly rounded metamorphic rocks in gravel and block size, embedded in a matrix of sand and silt. At the bottom of the aquifer, compact plastic clays were encountered of about 5–6 m thickness in PZ7 and PZ6. These alluvial and colluvial deposits of young Pleistocene to Holocene age are characterized by a high unconformity and overlay a metamorphic series of low permeability with local flow through fractures. Grain size analysis of sediment samples from drill cores at the recharge site yielded hydraulic conductivities in the range of 4–600 m/d [15].
2.3. Operation of Recharge Basins/Quality of Recharged Water
Prior to infiltration of recycled water, the operation of the conventional biological wastewater treatment plant was optimized to achieve consistent effluent qualities of <1 mg/L for ammonia-N and <10 mg N/L for total nitrogen. Outside the tourism season sufficient basin capacity (10,500 PE for about 1000 permanent residents) was available to operate the wastewater treatment plant (WWTP) with extended denitrification time to achieve such ambitious targets for a small WWTP. In addition, ferric chloride (20 mg Fe/L) was added into the biological reactor resulting in effluent concentrations of 0.5 mg/L for phosphorous on average. Threshold values in secondary effluent were defined for electrical conductivity (1500 μS/cm), orthophosphate (1.5 mg/L), turbidity (2 NTU), and NH4-N (1 mg/L), as a pre-requisite to operate recharge basins and were continuously monitored using online probes (HACH-Lange).
In addition, a numerical flow model to simulate the migration of recycled water downgradient from the infiltration ponds was established based on rainfall data collected over a period of 3100 days (years 2007–2015), data on pumping rates in water supply wells AM1 and AM2 (one year period), and assumed water infiltration rates of 200 m3/day. Modelling was performed with a 2D Finite Element numerical model to estimate the residence time from the recharge basins to drinking water wells through the alluvial formation using the code FEFLOW [16]. Despite a number of simplifications and assumptions, the numerical model was capable of simulating aquifer response to rainfall events and to pumping in water supply wells with reasonable accuracy. More details on the model boundaries can be found in the report from Zietzschmann et al. [15]. Results from modelling for a three year period with different rainfall rates indicate that the residence times of the infiltrated recycled water in the subsurface to the drinking water wells are between 350 and 447 days. The residence time highly depends on the inter-annual rainfall and may prolong to >950 days for dry years with no rainfall at all. The share of reclaimed water in drinking water wells remains below 14% for all considered scenarios (Supplementary Figure S2) [15].
2.4. System Monitoring and Field Sampling
For hydrological and hydro-chemical assessments, ambient groundwater samples were collected from PZ3 (up-gradient from recharge site) or from PZ6 and PZ7 during times without infiltration. Recharge basin samples were taken from respective active basin and summarized as basin samples. Data from wells PZ6 and PZ7 are summarized as observation well area 1 (close to infiltration basin) while samples from PZ4 represent the observation well area 2. The coastal well Bolera was sampled to characterize the aquifer down-gradient from the drinking water wells (DW, i.e., AM1 and AM2).
Monitoring of system performance was conducted within a total of six comprehensive sampling campaigns carried out during the first two years of system operation. The main objectives of this study phase were (i) to determine travel times and mixing ratio (March 2016) and (ii) to assess the performance of subsurface passage with regards to attenuation of CECs (April 2016, June 2016, May 2017), antibiotic microbial resistance (May 2017), and microbial contaminants including bacteria and viruses (February 2016, April 2016, July 2016, May 2017).
For better comparison of the results, tertiary effluent was always applied to recharge basin 2 during system monitoring. Grab samples were taken from raw sewage, secondary effluent, tertiary effluent, recharge basin 2 feed water, monitoring wells located in observation well area 1 (PZ7, PZ6), and from downstream drinking water wells (DW). For microbial sampling, the groundwater was abstracted by using disinfected equipment and a sterile submersible pump (Geotech SS Geosub, Geotech Environmental Equipment, Inc Denver, CO, USA). The following parameters: pH, temperature, electrical conductivity and dissolved oxygen, were analyzed onsite. When pH and dissolved oxygen signals were stable, samples were collected and placed in cooling boxes for a maximum of 5 h before transfer to the microbial laboratory for analysis.
2.5. Analytical Procedure
2.5.1. Bulk Chemistry
Temperature, pH, dissolved oxygen and electrical conductivity were determined on-site using a handheld HACH HQ40 device in a flow-through cell following standard protocols DIN 38404-C04, DIN EN 38,404 C5, DIN EN 25814, and DIN EN 27,888 C8, respectively. Alkalinity was determined as HCO3 by titration using an acidity test (Merck, Germany). Ammonia, nitrite and nitrate as well as cations and anions were determined using Standard Methods.
2.5.2. Microbiological Parameters
As microbial contaminants vary in characteristics and behavior, guidelines and regulations recommend the assessment of representatives, so-called indicator pathogens from different groups (i.e., protozoa, bacteria, viruses) [6,7]. In this study, indicator microorganisms were quantified using standard methods, i.e., total coliforms [14], Escherichia coli [17,18], Enterococcus faecalis [18,19,20], Clostridium perfringens [21], and Somatic coliphages [22]. For additional analyses of virological parameters (i.e., rotavirus, enterovirus, norovirus, and human adenovirus), water samples were concentrated according to the skimmed milk flocculation protocol [23,24]. The viral concentrations were quantified by qPCR assays following published protocols for human adenovirus (HAdv) [25,26], norovirus GGI (NoV GGI) [27,28], NoV GGII [29,30], enterovirus [31,32], and rotavirus (RoV) [30].
2.5.3. Antimicrobial Resistance
Antimicrobial resistance was assessed based on the abundance of antibiotic resistance genes (ARGs). Samples for ARG analyses were collected into 1 L sterile glass bottles and filtered on site with 0.2 µm acetate cellulose filters (Whatman, NC, Ø 47 mm, 0.2 μm). Processed sample volume size ranged from ≈300 mL (max. filtered volume within 30 min) for tertiary effluent and recharge basin to 1000 mL for groundwater samples. Concentrated DNA was extracted from dried filters using the Dneasy Power Soil Kit (QIAGEN GmbH, Hilden, Germany) and subsequently the gene copy number was quantified by qPCR assay (Bio-Rad CFX96TM qPCR system) with detection limit between 1 and 10 gene copies. A list of analyzed genes and related qPCR primers used in this study is presented in Table 1, and a detailed description of the method is given in the supporting information (Text S1).
2.5.4. Chemical Analysis
Water samples were immediately filtered by 0.45 µm regenerated cellulose filters and stored in a freezer (−20 °C) prior to analysis. Dissolved organic carbon (DOC) was determined by standard High-Temperature Combustion Method (5310B).
Replicates of 50 mL were collected to analyze CECs. The quantification of 153 selected CECs was conducted by high performance liquid chromatography coupled with tandem mass spectrometry (HPLC–MS/MS) with two different methods. Samples from May 2017 were measured according to the method described in detail in the study of Hermes et al. [37]. Briefly, direct-injection LC-MS/MS analysis, split into two detection methods, was performed on a HPLC 1260 Infinity Series equipped with a Zorbax Eclipse Plus C18 column (150 mm × 2.1 mm, 3.5 µm, Agilent Technologies) coupled to a TripleQuad mass spectrometer (6500+, Sciex). A water-acetonitrile gradient was used; for detection method 1, the aqueous phase was buffered with 0.1% formic acid while detection method 2 was buffered with 0.1% acetic acid. Analysis was performed in scheduled multiple reaction monitoring (MRM) mode using deuterium labelled surrogates as internal standards for quantification. All other samples were measured in the certified laboratory of the Berliner Wasserbetriebe (BWB) according to DIN 38407-F36.
3. Results
3.1. Characterization of Groundwater Recharge System
3.1.1. Hydraulic Characterization
Sampling of ambient groundwater in monitoring well PZ3 revealed that the aquifer baseline can be described as oxic, with conductivities around 400 to 500 μS/cm. The large contrast between electrical conductivities of the native groundwater (400–500 μS/cm) and recycled water (800–1500 μS/cm) together with the relatively low reactivity in the subsurface allowed the use of electrical conductivity (EC) as a conservative tracer. Travel time estimations of recharged water during subsurface passage were based on breakthrough curves (BTC) of electrical conductivity measured in PZ6 and PZ7. Normalized BTCs measured in PZ6 and PZ7 from infiltration basin 2 are illustrated in Figure S3 (Supplementary Materials). The arrival of the peak concentration C/Cmax = 1 indicates the predominant travel time and median flow velocity and residence time are defined by breakthrough of 50% of the tracer mass. The determined median residence times from recharge basin 2 were 33.2 h and 57 h in observation wells PZ7 and PZ6, respectively (Table 2). Breakthrough curves and HRT at other observation wells could not be obtained from conductivity data. Hydraulic retention times from the basins to drinking water wells were estimated from initial numerical flow modelling. Depending on rain events and infiltration volumes, they can be expected to vary from 350 to >950 days [15].
3.1.2. Hydrochemistry, Redox Conditions and Nutrients
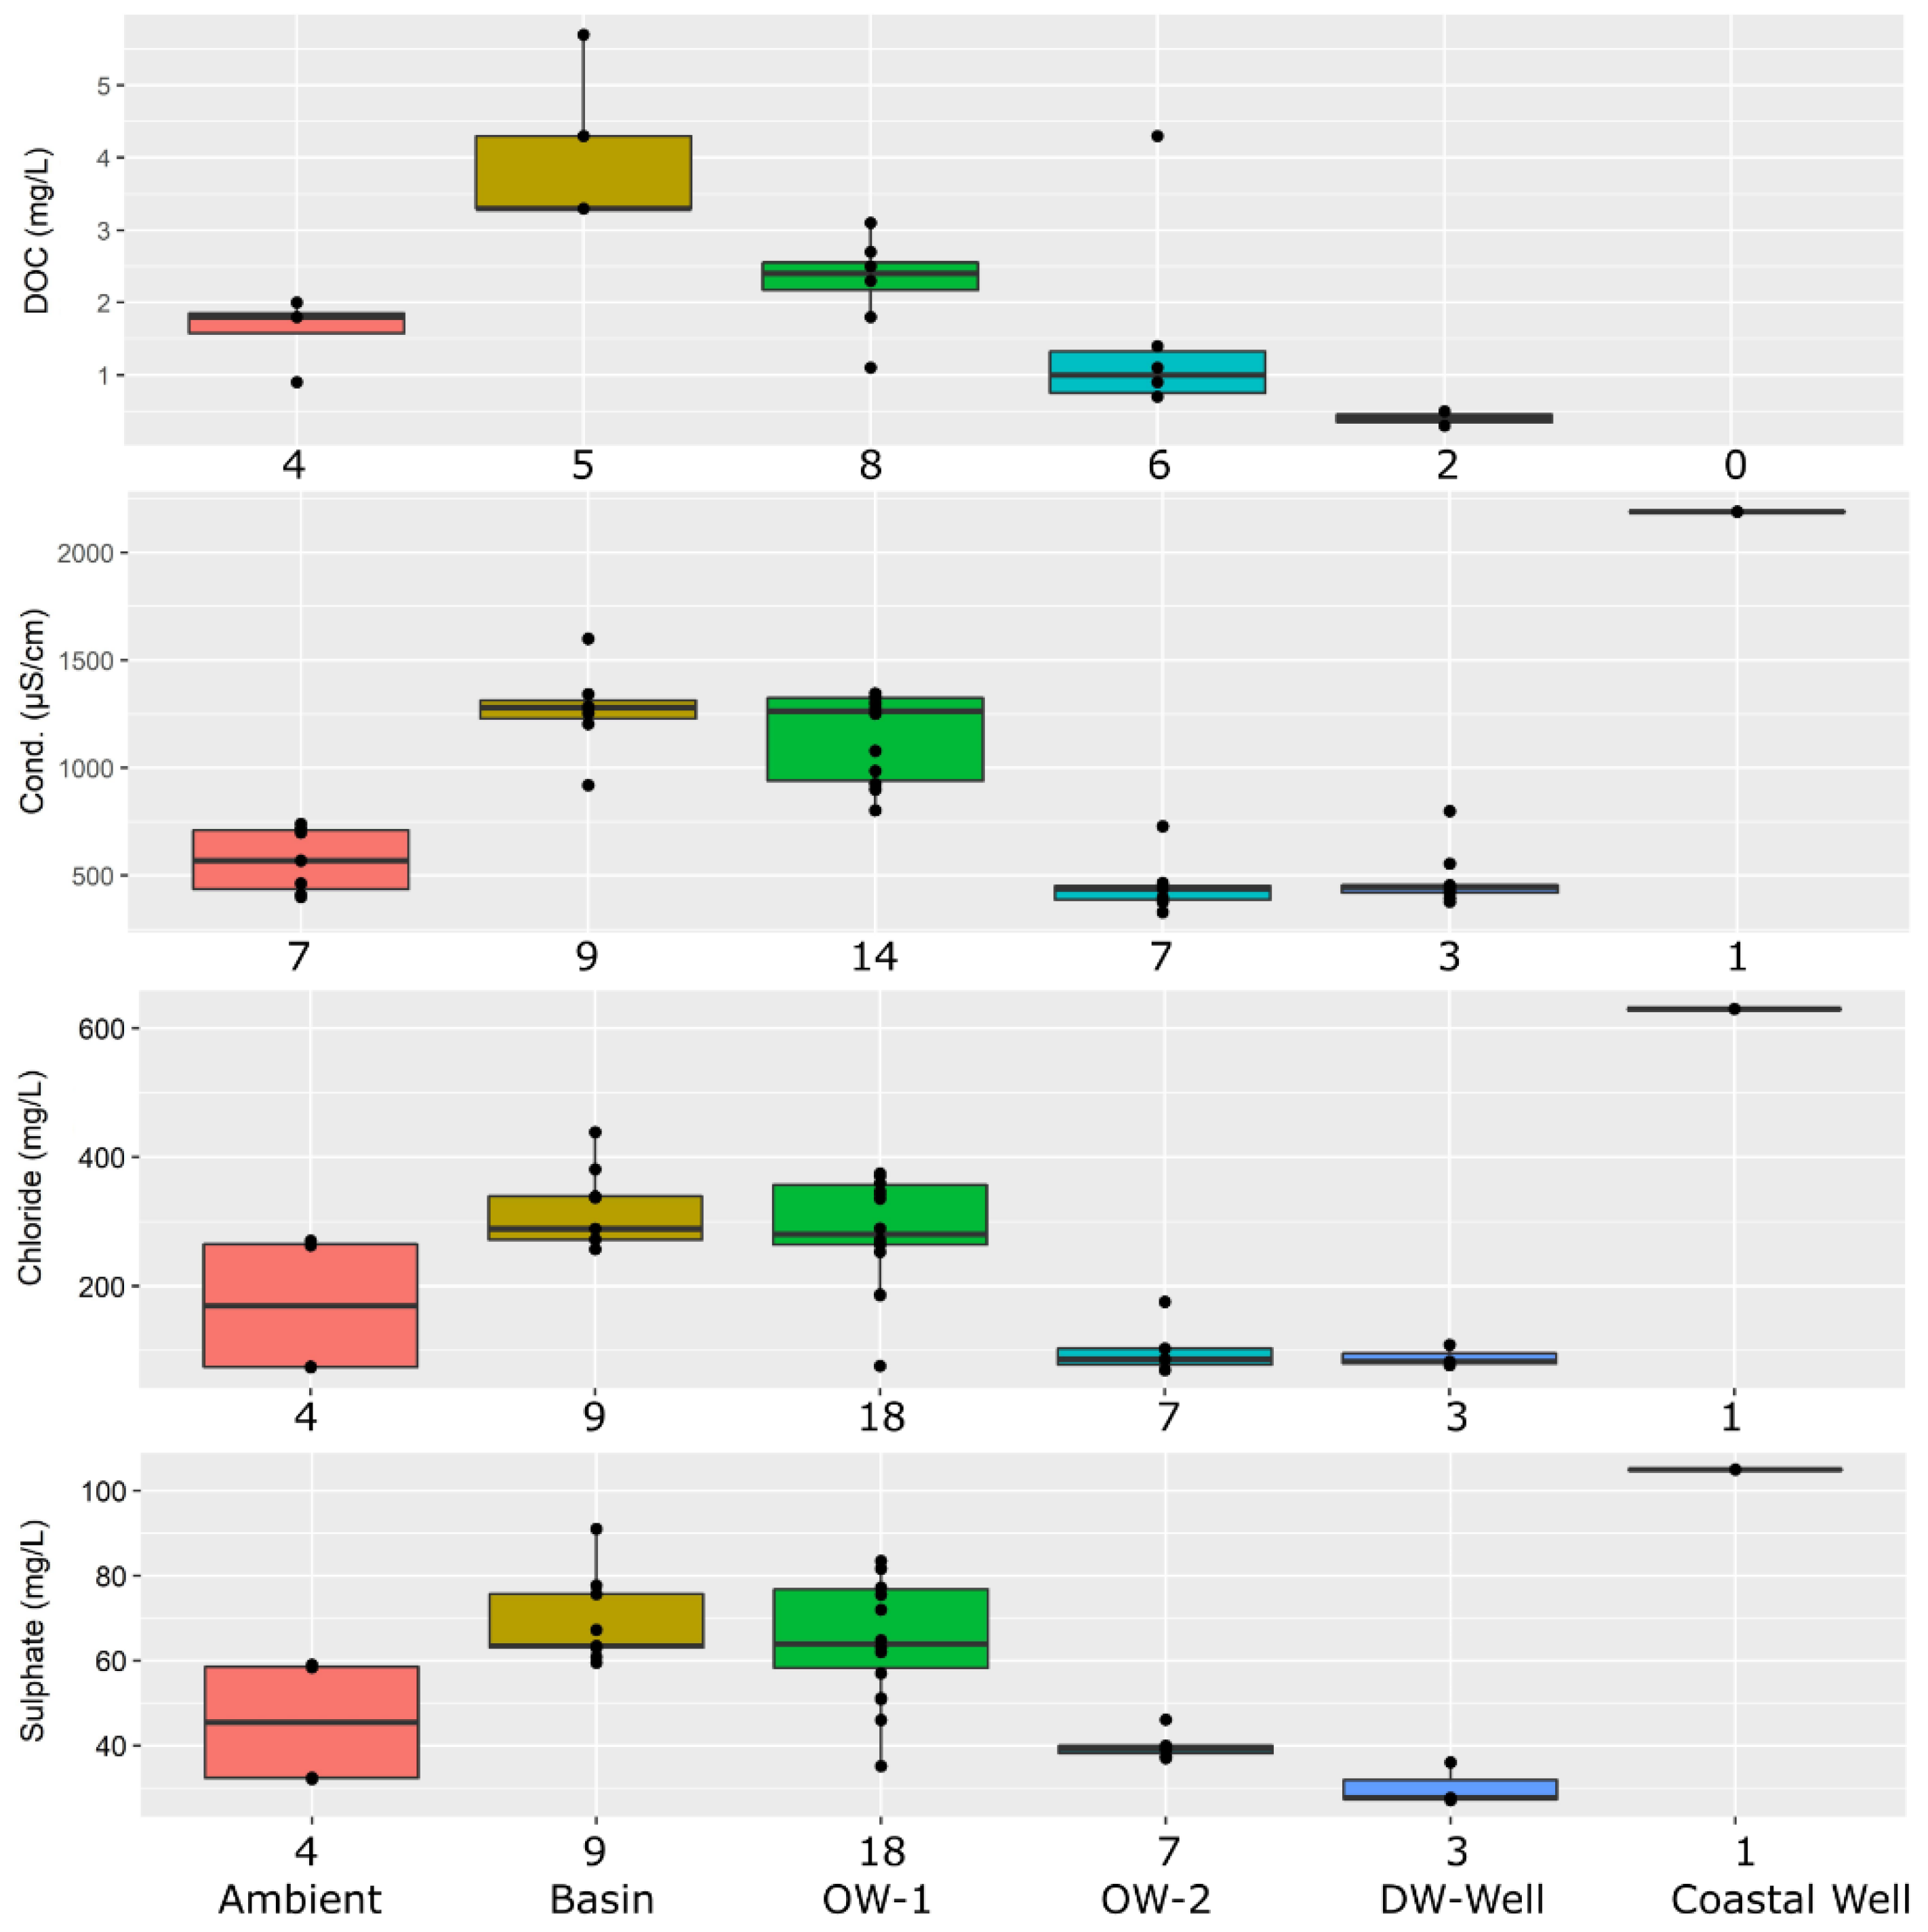
The changes in bulk water quality parameters for ambient groundwater (PZ3), infiltration basins, observation well area 1 (PZ6 and PZ7) and area 2 (PZ4), drinking water wells, and the coastal observation well Bolera are shown in Figure 3. Compared to ambient groundwater, the infiltrated water was higher in total dissolved solids (TDS) concentration, mostly due to elevated levels of chloride and sulfate. Chloride concentrations in infiltration basins and the observation well area 1 exceeded the drinking water limit (250 mg/L, Drinking Water Directive 98/83/EC) in most samples, but were diluted to ambient groundwater levels further downgradient. According to the measured chloride concentrations (median of 289 mg/L and 280 mg/L in basin and observation well area 1 and sulfate concentrations (median of 70 mg/L and 60 mg/L), which are considered to behave conservatively under the given redox conditions, the share of infiltrated water in observation wells PZ6 and PZ7 can be estimated to be approximately 80–90%. The high salinity measured in the coastal observation well was likely caused by sea water intrusion.
Based on EC and chloride concentration, the operationally defined threshold of EC = 1500 μS/cm and to terminate infiltration would require chloride concentration of approximately 400 mg/L. With respect to current operation, mixing of recycled water with native groundwater along the flow path in the subsurface will result in chloride concentrations in drinking water wells of less than 250 mg/L. However, extended drought conditions and increasing volume of recharged water may challenge a sustainable drinking water supply with regard to salinity levels. Salinity control is therefore important and it is recommended to further reduce the sodium chloride concentration in the recycled water prior to recharge as much as possible.
Predominant redox conditions play a key role for contaminant biodegradation in groundwater systems. Oxic and carbon depleted conditions represented by a low biodegradable dissolved organic carbon (BDOC) content have been identified as favorable for enhanced biodegradation of chemicals of emerging concern CECs [10].
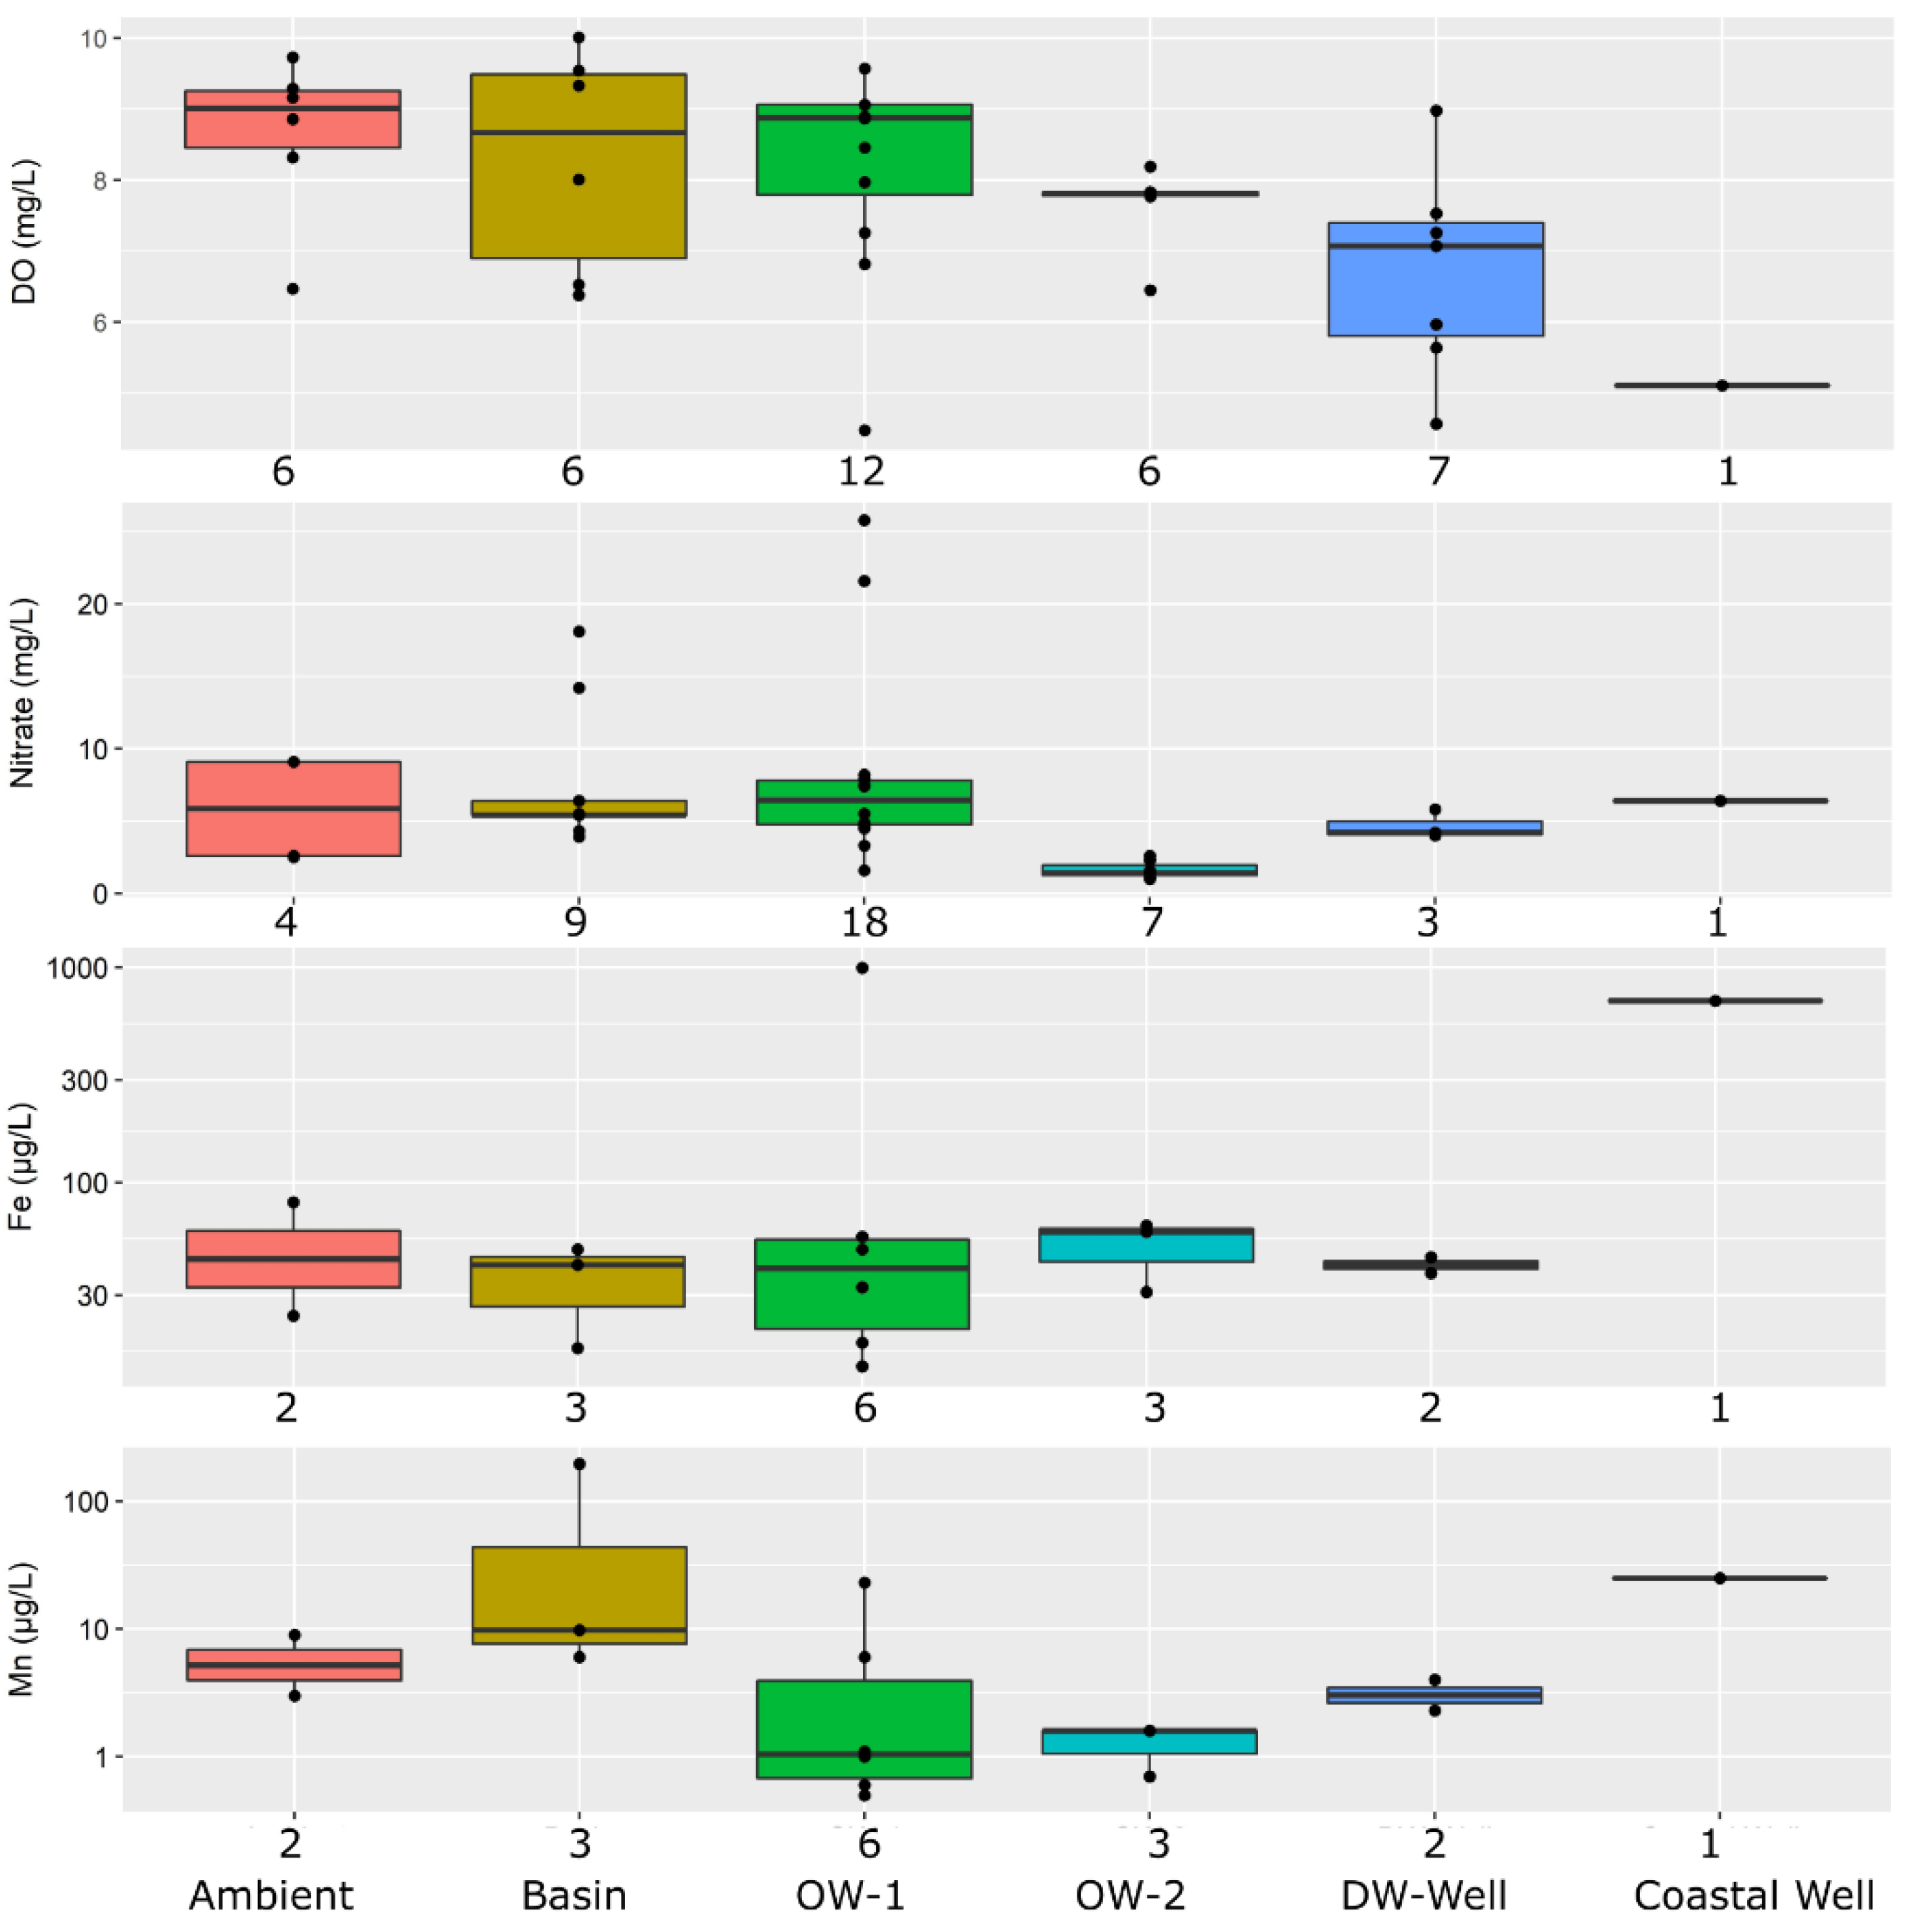
The aquifer in El Port de la Selva is characterized as predominantly oxic with slightly decreasing oxygen level along the flow path towards the coast (Figure 4). During infiltration, dissolved oxygen (DO) was rather stable and nitrate reduction was not observed, supporting the presence of oxic conditions. The low concentrations of the redox-sensitive parameters dissolved iron and manganese (<100 µg/L) also indicate oxic redox conditions in the aquifer. The significant decrease of DOC from 3.3 mg/L in infiltration basins to 2.5 mg/L in observation wells PZ6 and PZ7 suggests biological degradation. The fact, that biological activity did not affect DO concentrations in the subsurface might be explained by the wet/dry operation of the recharge basins resulting in ample supply of additional oxygen in the pores of the subsurface filter medium. The presence of nitrate in ambient groundwater at relatively low concentrations (median 5.8 mg/L) suggests only a minor impact from local agricultural activity.
Phosphate was detected in basin water in two out of eight samples at concentrations of 0.4 mg/L. In groundwater samples from different wells (n = 16), phosphate was always below the detection limit (<0.1 mg/L, data not shown). Boron was present at elevated concentrations of 114 μg/L in basin water (min-max 90–145 µg/L, data not shown). The measured mean concentration in groundwater at OW-1 were 95 μg/L and gradually decreased to almost ambient concentration (25 µg/L) at the drinking water well (31 µg/L). However, concentrations present at El Port de la Selva are still far below the drinking water standard for boron in the EU Drinking Water Directive of 1 mg/L. The measured pH shows typical ranges from slightly alkaline in the recharge basin (median 7.2) to slightly acidic in different groundwater wells (median values between 6.1 and 6.9). Water temperatures did not show significant trends between recharge basin and ambient groundwater or drinking water wells and ranged between 8.3 and 18.5 °C (data not shown).
3.2. Microbial Contamination
3.2.1. Removal of Fecal Indicator Organisms
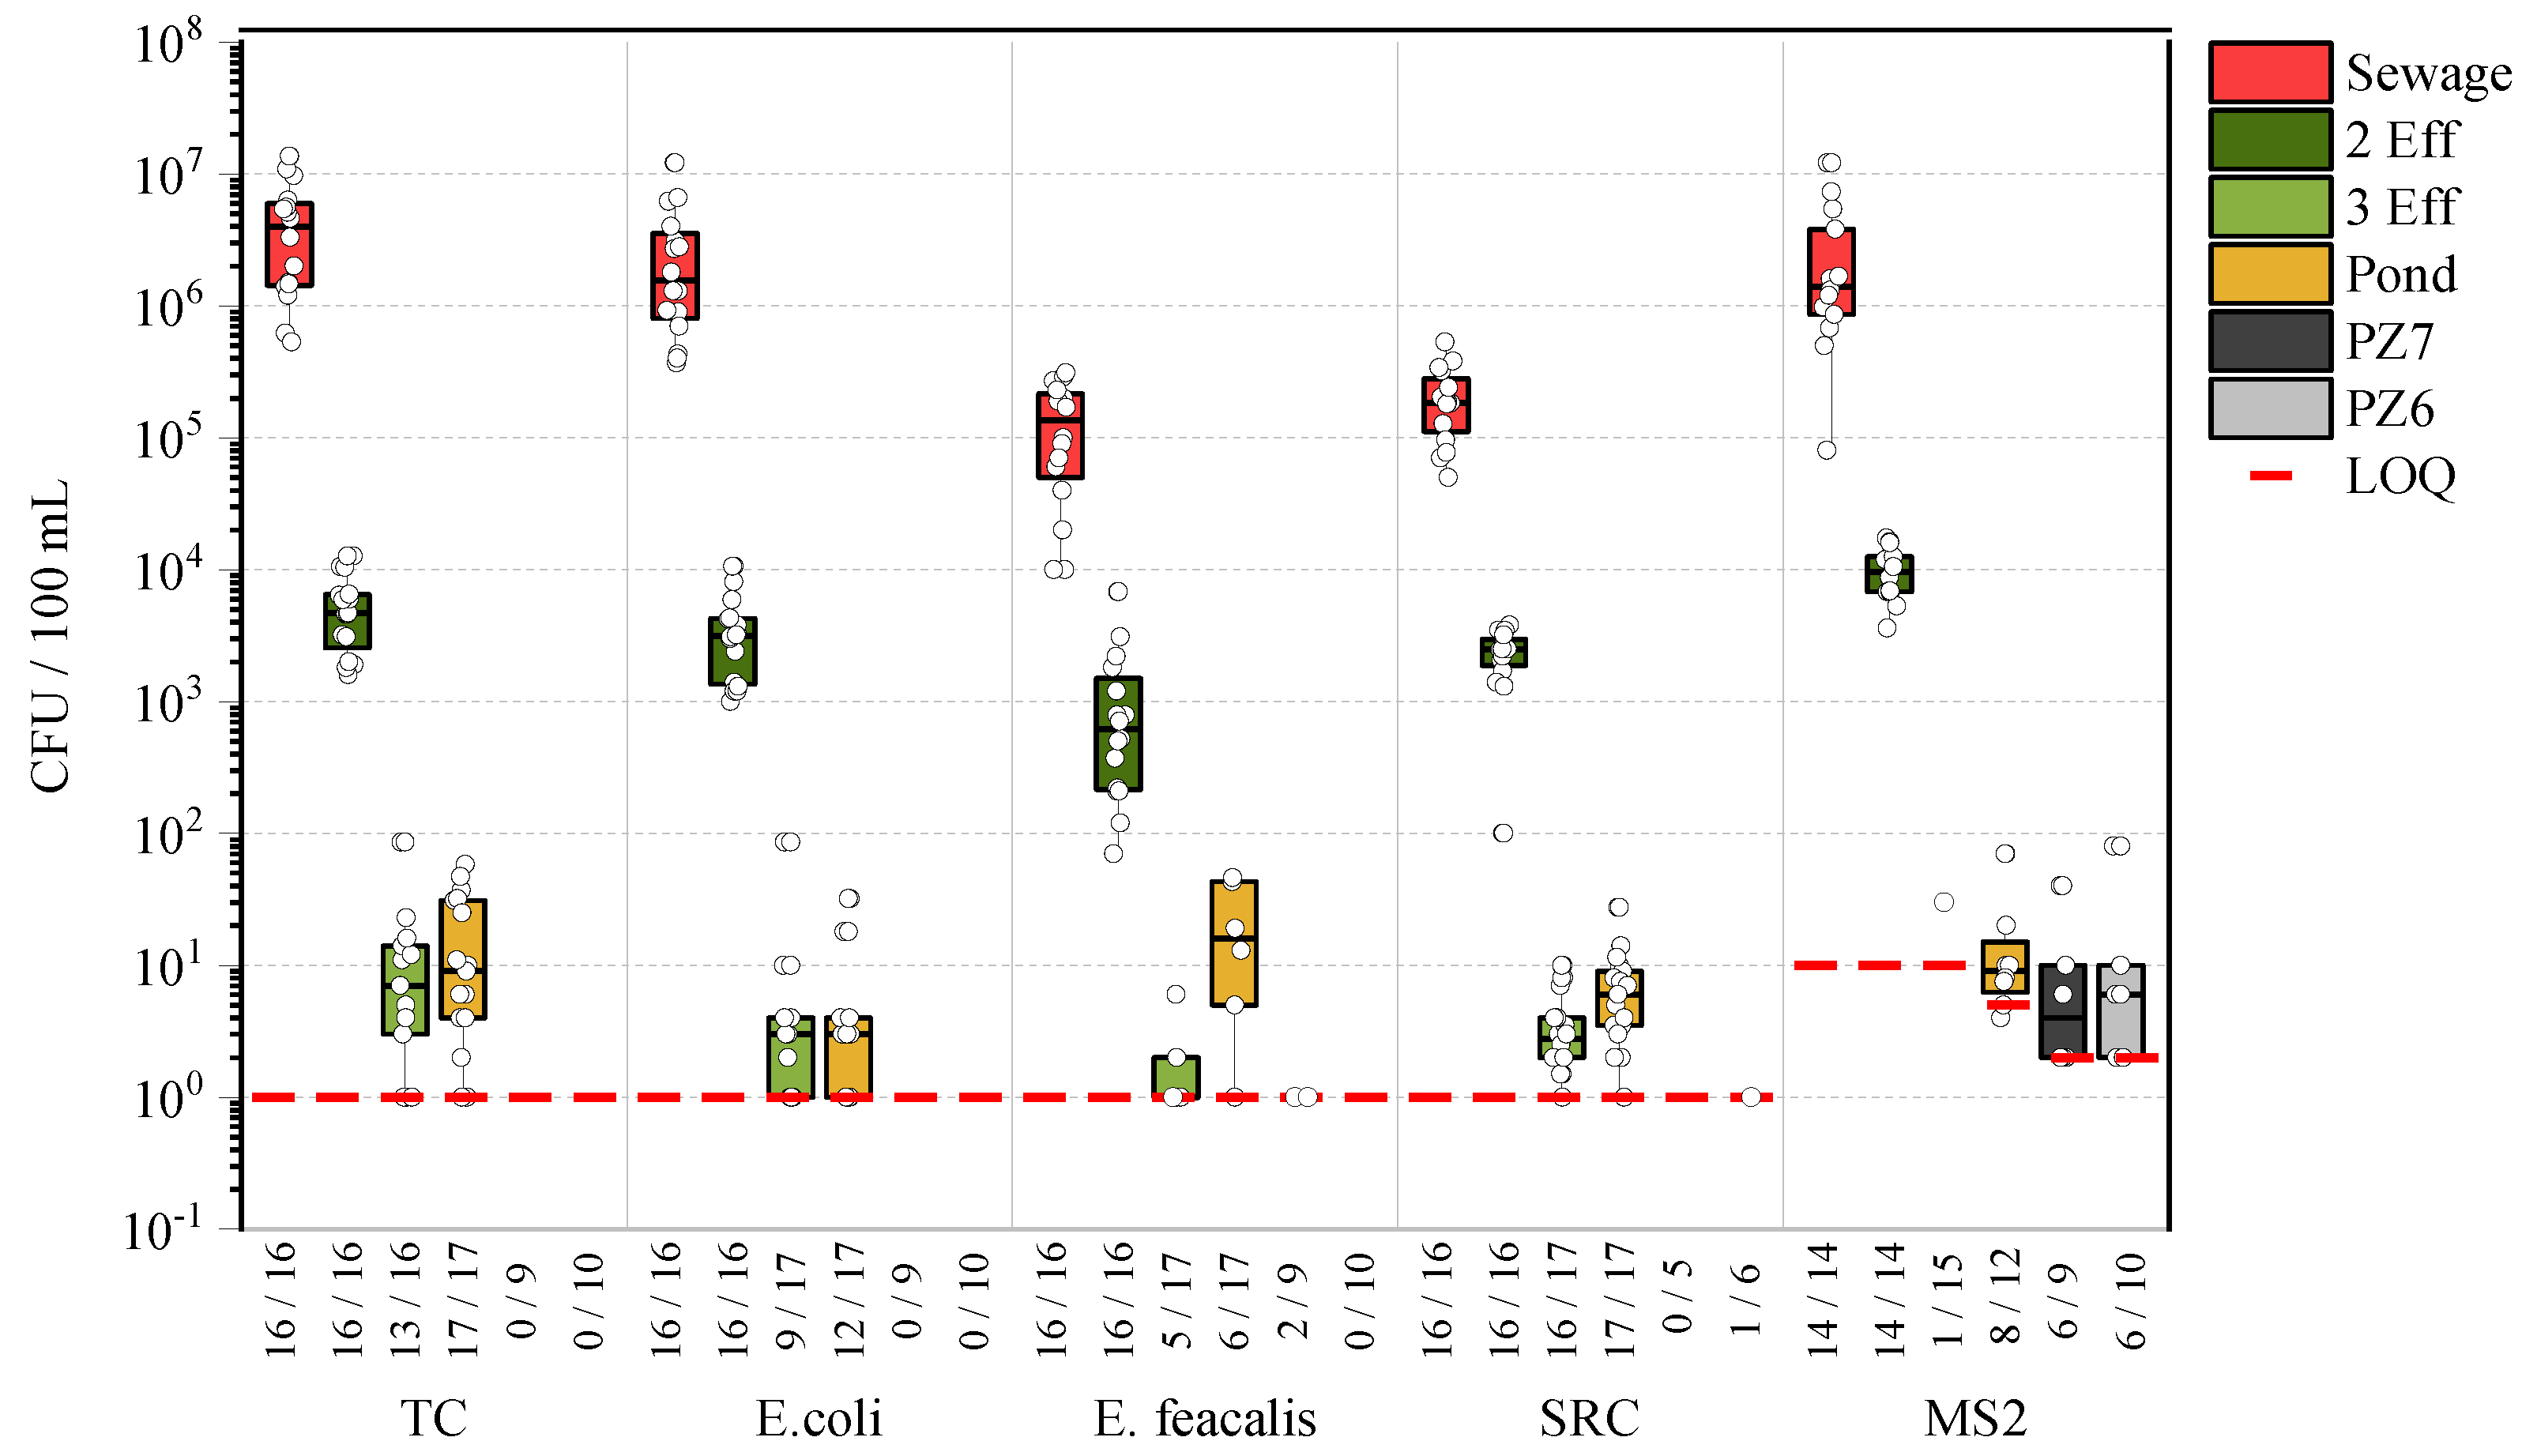
Results from monitoring of indicator organisms after individual treatment steps are illustrated in Figure 5. The raw wastewater in El Port de la Selva contains high levels of fecal indicator organisms (up to ~107 colony forming units (CFU) per 100 mL) but the combined secondary and tertiary treatment processes ensure that the infiltrated water is already of high microbial quality (<10 CFU/100 mL in most samples). 2–3 log removal of bacteria was achieved by conventional biological treatment and another ~3 log removal was achieved by tertiary filtration and UV disinfection. After a travel time of 33 h to PZ7, all bacterial indicator organisms were below limits of quantification (LOQ). Only the MS2 bacteriophages as viral indicator showed some sporadic detects at low abundances close to the LOQ.
The slight increase of selected indicators in the infiltration pond, in comparison to the quality of tertiary effluent, may be attributed to secondary contamination by animals that can easily access the open infiltration basins in the recharge area or to regrowth of bacteria after UV disinfection.
3.2.2. Removal of Viruses
Compared to average dimensions of bacteria, viruses are an order of magnitude smaller and considered to be more mobile during subsurface passage. Somatic coliphages are often used as surrogates for human enteric viruses. These non-pathogenic viruses attack E. coli and have similar physical properties as enteric viruses, but especially MS2 is known to be less sorbing to soil [11].
Median reduction of MS2 by 2.2 log and 2.5 log was achieved in secondary and tertiary water treatment, respectively. Although bacteriophages were detected close to LOQ in the recharge basin, they were not completely removed in the vadose zone and groundwater during the first 55 h of subsurface travel (Pond-PZ6, Figure 5). However, removal rate of pathogens is known to be controlled by many factors, i.e., flow velocity, soil media, redox conditions, pH, and retention time [38]. During field-scale monitoring at the Montebello Forebay (CA, USA), 7 log removal of bacteriophages was achieved within 30 m of subsurface travel [39]. Based on literature data, 6 log removal credits were recently proposed for SAT even with significantly lower HRT than the predicted ~2 years in El Port de la Selva [38].
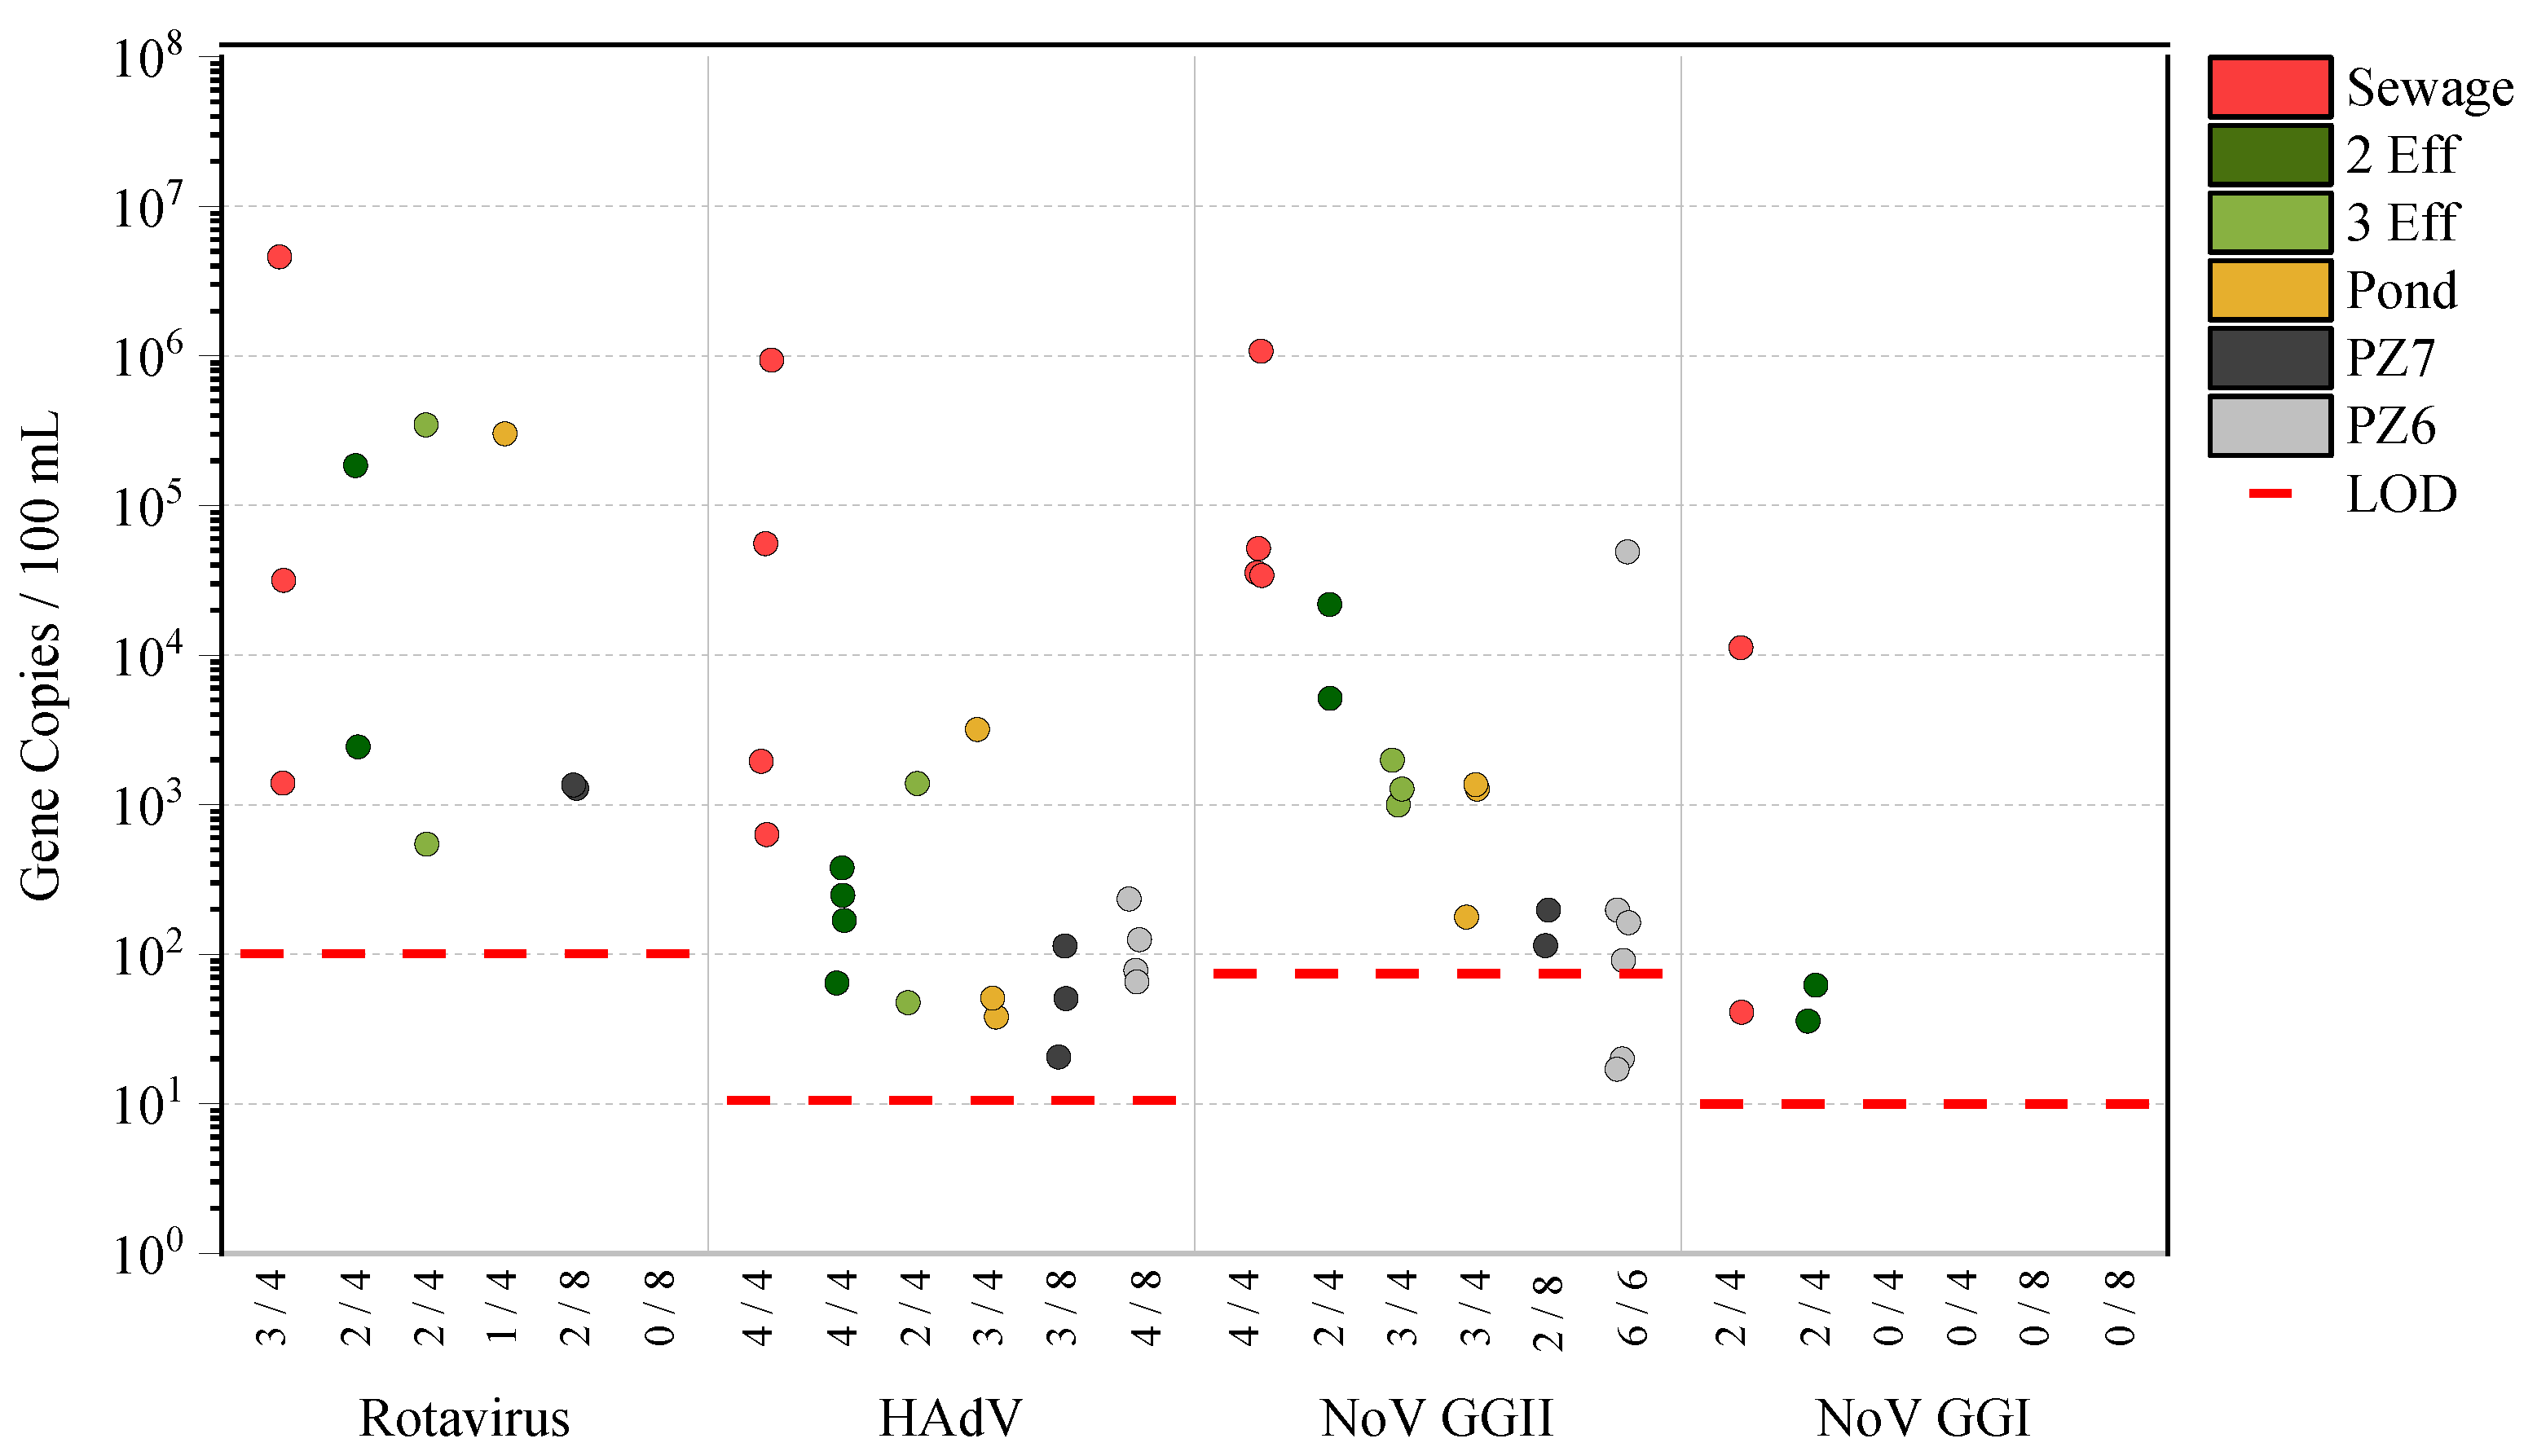
A minimum of four samples were taken from different treatment barriers to assess the inactivation of enterovirus, rotavirus, human adenovirus (HAdv), and norovirus (NovGGI and NoVGGII). While enterovirus was not found in any of the analyzed samples, measured concentrations in raw sewage were highly variable for other viruses with rotavirus, HAdv and norovirus GGII showing highest abundances (about 5 log gene copies/100 mL, Figure 6). Despite the fact that reliable log removal values could not be determined from low number of data points with high variability, results indicate high resistance to UV disinfection and limited removal during short-term SAT especially for human adenovirus (1.9 log gene copies/100 mL) and norovirus GGII. However, it should be noted that abundances are low and the detection in qPCR is not necessarily indicative for infectious virus. This limitation of qPCR analyses is already known for the assessment of inactivation in UV systems [40].
3.2.3. Compliance with International Guidelines
Currently, no guidelines for potable water reuse purposes have been specifically proposed in Europe. The WHO Potable Reuse Guidelines recommended performance targets of 8.5 log reduction for campylobacter as reference bacteria, 9.5 log reduction for norovirus as reference virus, and 8.5 log reduction for Cryptosporidium as reference protozoa. As this is often not possible to demonstrate at full-scale due to analytical limitations, performance of individual treatment barriers can be assessed separately from experiments or literature data and reported as accumulated values [6]. In this study, virus and bacteria removal was assessed through monitoring of indicator organisms and derived log reduction values are summarized in Table 3. Measured 2–3 log inactivation of indicator microorganisms by secondary treatment is superior to literature data from monitoring of existing systems [6]. In contrast, removal of approximately 3 log by tertiary treatment is at the lower range of commonly credited log removal values (LRV) for UV disinfection systems [6,7], possibly due to limited accuracy of analytical methods at concentrations close to the detection level. Subsequent removal of target bacteria and viruses in SAT could not be fully assessed due to the already low concentrations in the recharge basin. However, fast removal below the limit of detection was achieved in about 33 h (PZ7) indicating that 6 log can be credited with hydraulic retention time >6 months, which is in accordance with previous studies [6]. Overall, results of this study demonstrate that required performance targets can be easily achieved for bacteria.
Although recommended performance targets of 9.5 log by WHO [6] could not be demonstrated with qPCR measurements, sufficient virus removal can be expected based on achieved inactivation of bacteriophages. In addition to >4.5 log in combined secondary and tertiary treatment, SAT provides log reduction rates of 0.08–0.22 log/d (Table 3, Figure 5 and Figure 6). Although derived from rather low abundances of <10 CFU/100 mL, these rates are in accordance with data from Regnery et al. [41], who reported 0.093–0.174 log/d for MS2 phages. Even with the assumption of the lowest observed reduction rate, 80 days of hydraulic retention time would be sufficient to credit the maximum of 6 log removal for SAT. In addition, the GAC filter was not operated during monitoring campaigns and it is expected that UV transmittance would increase due to adsorption of dissolved organic carbon. Therefore, UV disinfection performance might further increase when prior GAC filtration is practiced.
3.2.4. Antibiotic Microbial Resistance
Until now, there is little known about the fate and transport of antibiotic microbial resistance (AMR) in the environment. Human wastewater has been recognized as an important point source of AMR and concerns have been raised about water and the environment as potential exposure route for antibiotic resistant bacteria and their resistance genes (ARGs) [42].
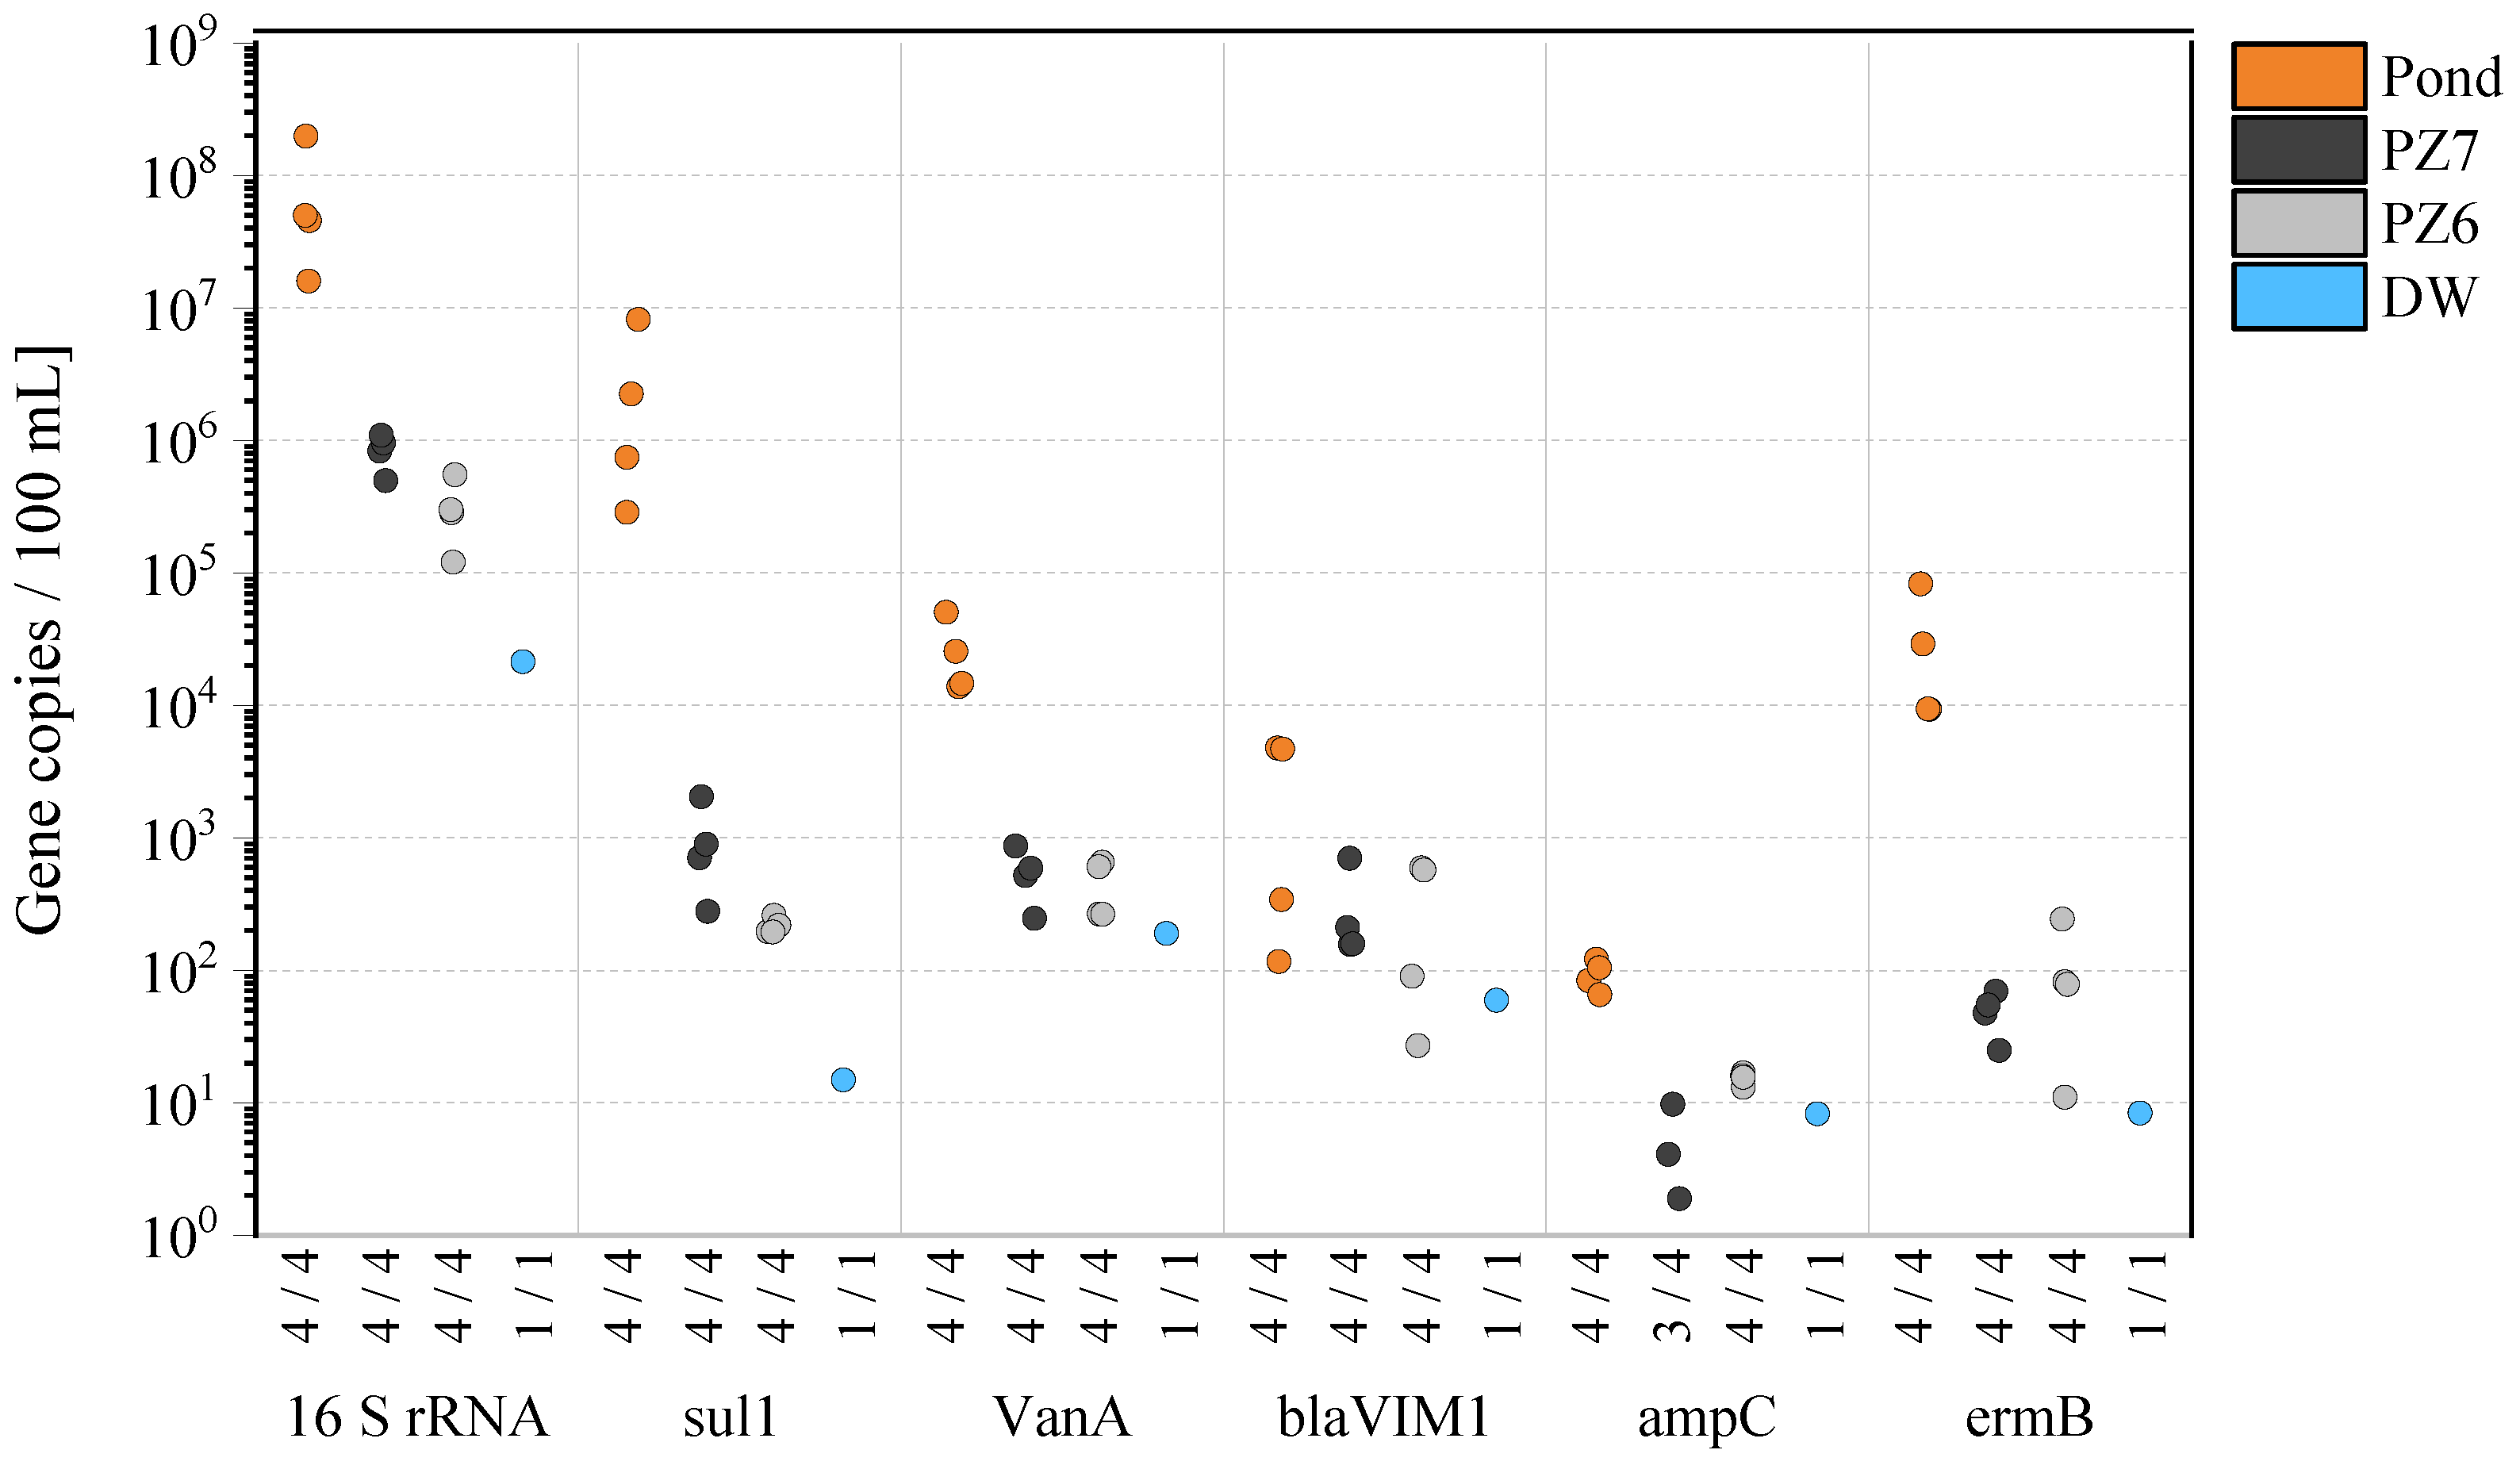
Results from analysis of five ARGs and the 16S rRNA gene copies as a proxy for the total microbial community during infiltration to monitoring wells PZ7 and PZ6 are illustrated in Figure 7 and compared to abundances in drinking water wells which were not affected by infiltrated recycled water yet. The sulfamethoxazole resistance gene sul1 was the most abundant gene in tertiary effluent, but the greatest removal for this gene was also observed during SAT. During travel to the first monitoring well (PZ7), characterized by HRT of about 33 h, reduction by 2.8 log sul1 gene copies/100 mL was achieved. Significant reduction of gene copy numbers was observed also for erythromycin (ermB), vancomycin (vanA), and ampicillin (ampC) resistance genes. Further reduction of ARGs after ~57 h of infiltration was not significant but had already reached a level close to the background level of 10–100 gene copies/100 mL measured in the downstream drinking water well.
These results demonstrate that abundance of ARGs can already be reduced in indirect potable reuse schemes employing SAT to levels comparable with conventional drinking water supplies within a few days of subsurface travel. Similar to previous discussion on virus analysis, however, it has to be considered that the analytical detection based on polymerase chain reaction (PCR) cannot differentiate between functional and non-functional forms of the gene. Hence, it cannot be excluded that DNA fragments were detected, especially in infiltration ponds after UV disinfection. The relatively low number of samples does not allow for general conclusions regarding these parameters.
3.3. Chemicals of Emerging Concern (CECs)
In contrast to microbial risk assessment, evaluation of chemical risks follows different principles. From the broad spectrum of CECs in wastewater, the EU Drinking Water Directive (98/83/EC) and the EU Groundwater Directive (2006/118/EC) only set maximum contaminant levels (MCL) for pesticides (100 ng/L for all individual organic insecticides, herbicides, fungicides, nematicides, acaricides, algicides, rodenticides, slimicides, and related products/metabolites) [43,44]. The upcoming revision of the Drinking Water Directive will also regulate per- and polyfluoroalkyl substances as well as bisphenol A, an endocrine disrupting compound [45]. To assess health-based risks from unregulated chemicals, Drewes et al. (2018) defined monitoring trigger levels (MTL) based on reported predicted no-effect concentrations (PNECs), guidelines and regulations [46,47]. If limited toxicological data were available, precautionary health-oriented guideline values (HOV) defined by the German Environment Agency were adopted [48]. MTL were compared to measured concentrations in secondary effluents to identify health-relevant chemicals for monitoring. For CECs with effluent concentration below MTL, the potential to pose a risk to public health can be considered very unlikely [47].
For this study, available MCL from European Directives, MTL from Drewes et al. (2018), and HOV were compiled (Table S2). To identify health-relevant CECs, threshold levels were compared to occurrence levels in recharge basins (instead of secondary effluent), due to better data availability and the specific focus of this study on the removal efficiency during SAT. CEC removal by secondary and tertiary treatment was only sporadically measured and is not further discussed here.
Key attenuation processes for CECs during SAT are biological transformation and sorption, which are mainly affected by the structure of the compound, soil type and biochemical conditions. To evaluate the attenuation of selected CECs during SAT, measured concentration of 153 substances in monitoring wells were compared with those measured in basin influent and drinking water wells. In total, 94 of the 151 monitored compounds were detected above their limits of quantification (LOQ) in at least one sample in the infiltration basin.
No CECs were detected in PZ 2 and the DW well, indicating that the infiltrated water did not reach these wells until sampling, which is in line with results for inorganic chemicals. Thus, in the following only the removal in the closer monitoring wells (PZ7 and PZ6) is discussed. 66 of the 94 compounds detected above the LOQ in the recharge basin were removed by more than 30% during infiltration with 37 of these CECs being removed to concentration below LOQ. Major removal was observed during the first 33 h of subsurface travel (PZ7) with only little improvement towards PZ6 after 55h of HRT. For 25 compounds only small changes (<30%) were observed, while concentrations of some known metabolites including carboxy-diclofenac (parent: diclofenac) acridone (10,11-Dihydro-10,11-dihydroxy-CBZ), and chlorothiazide (hydrochlorothiazide) significantly increased. Observed results mostly agree with previous observations in managed aquifer recharge systems (e.g., Maeng et al. [49]). DEET and diclofenac, for example, which were often classified as moderately biodegradable, exhibited 48% and 90% removal after 55 h of subsurface travel, and trimethoprim and atenolol, mostly characterized as easily biodegradable CECs, were reduced by more than 80%. However, some results also differed from the literature, e.g., the limited observed biodegradation of caffeine by only 30%. A detailed summary of results for all monitored CECs can be found in Table S2 (Supplementary Materials) and a more detailed evaluation of CECs with respect to treatment at this SAT site was conducted by Hermes et al. [50].
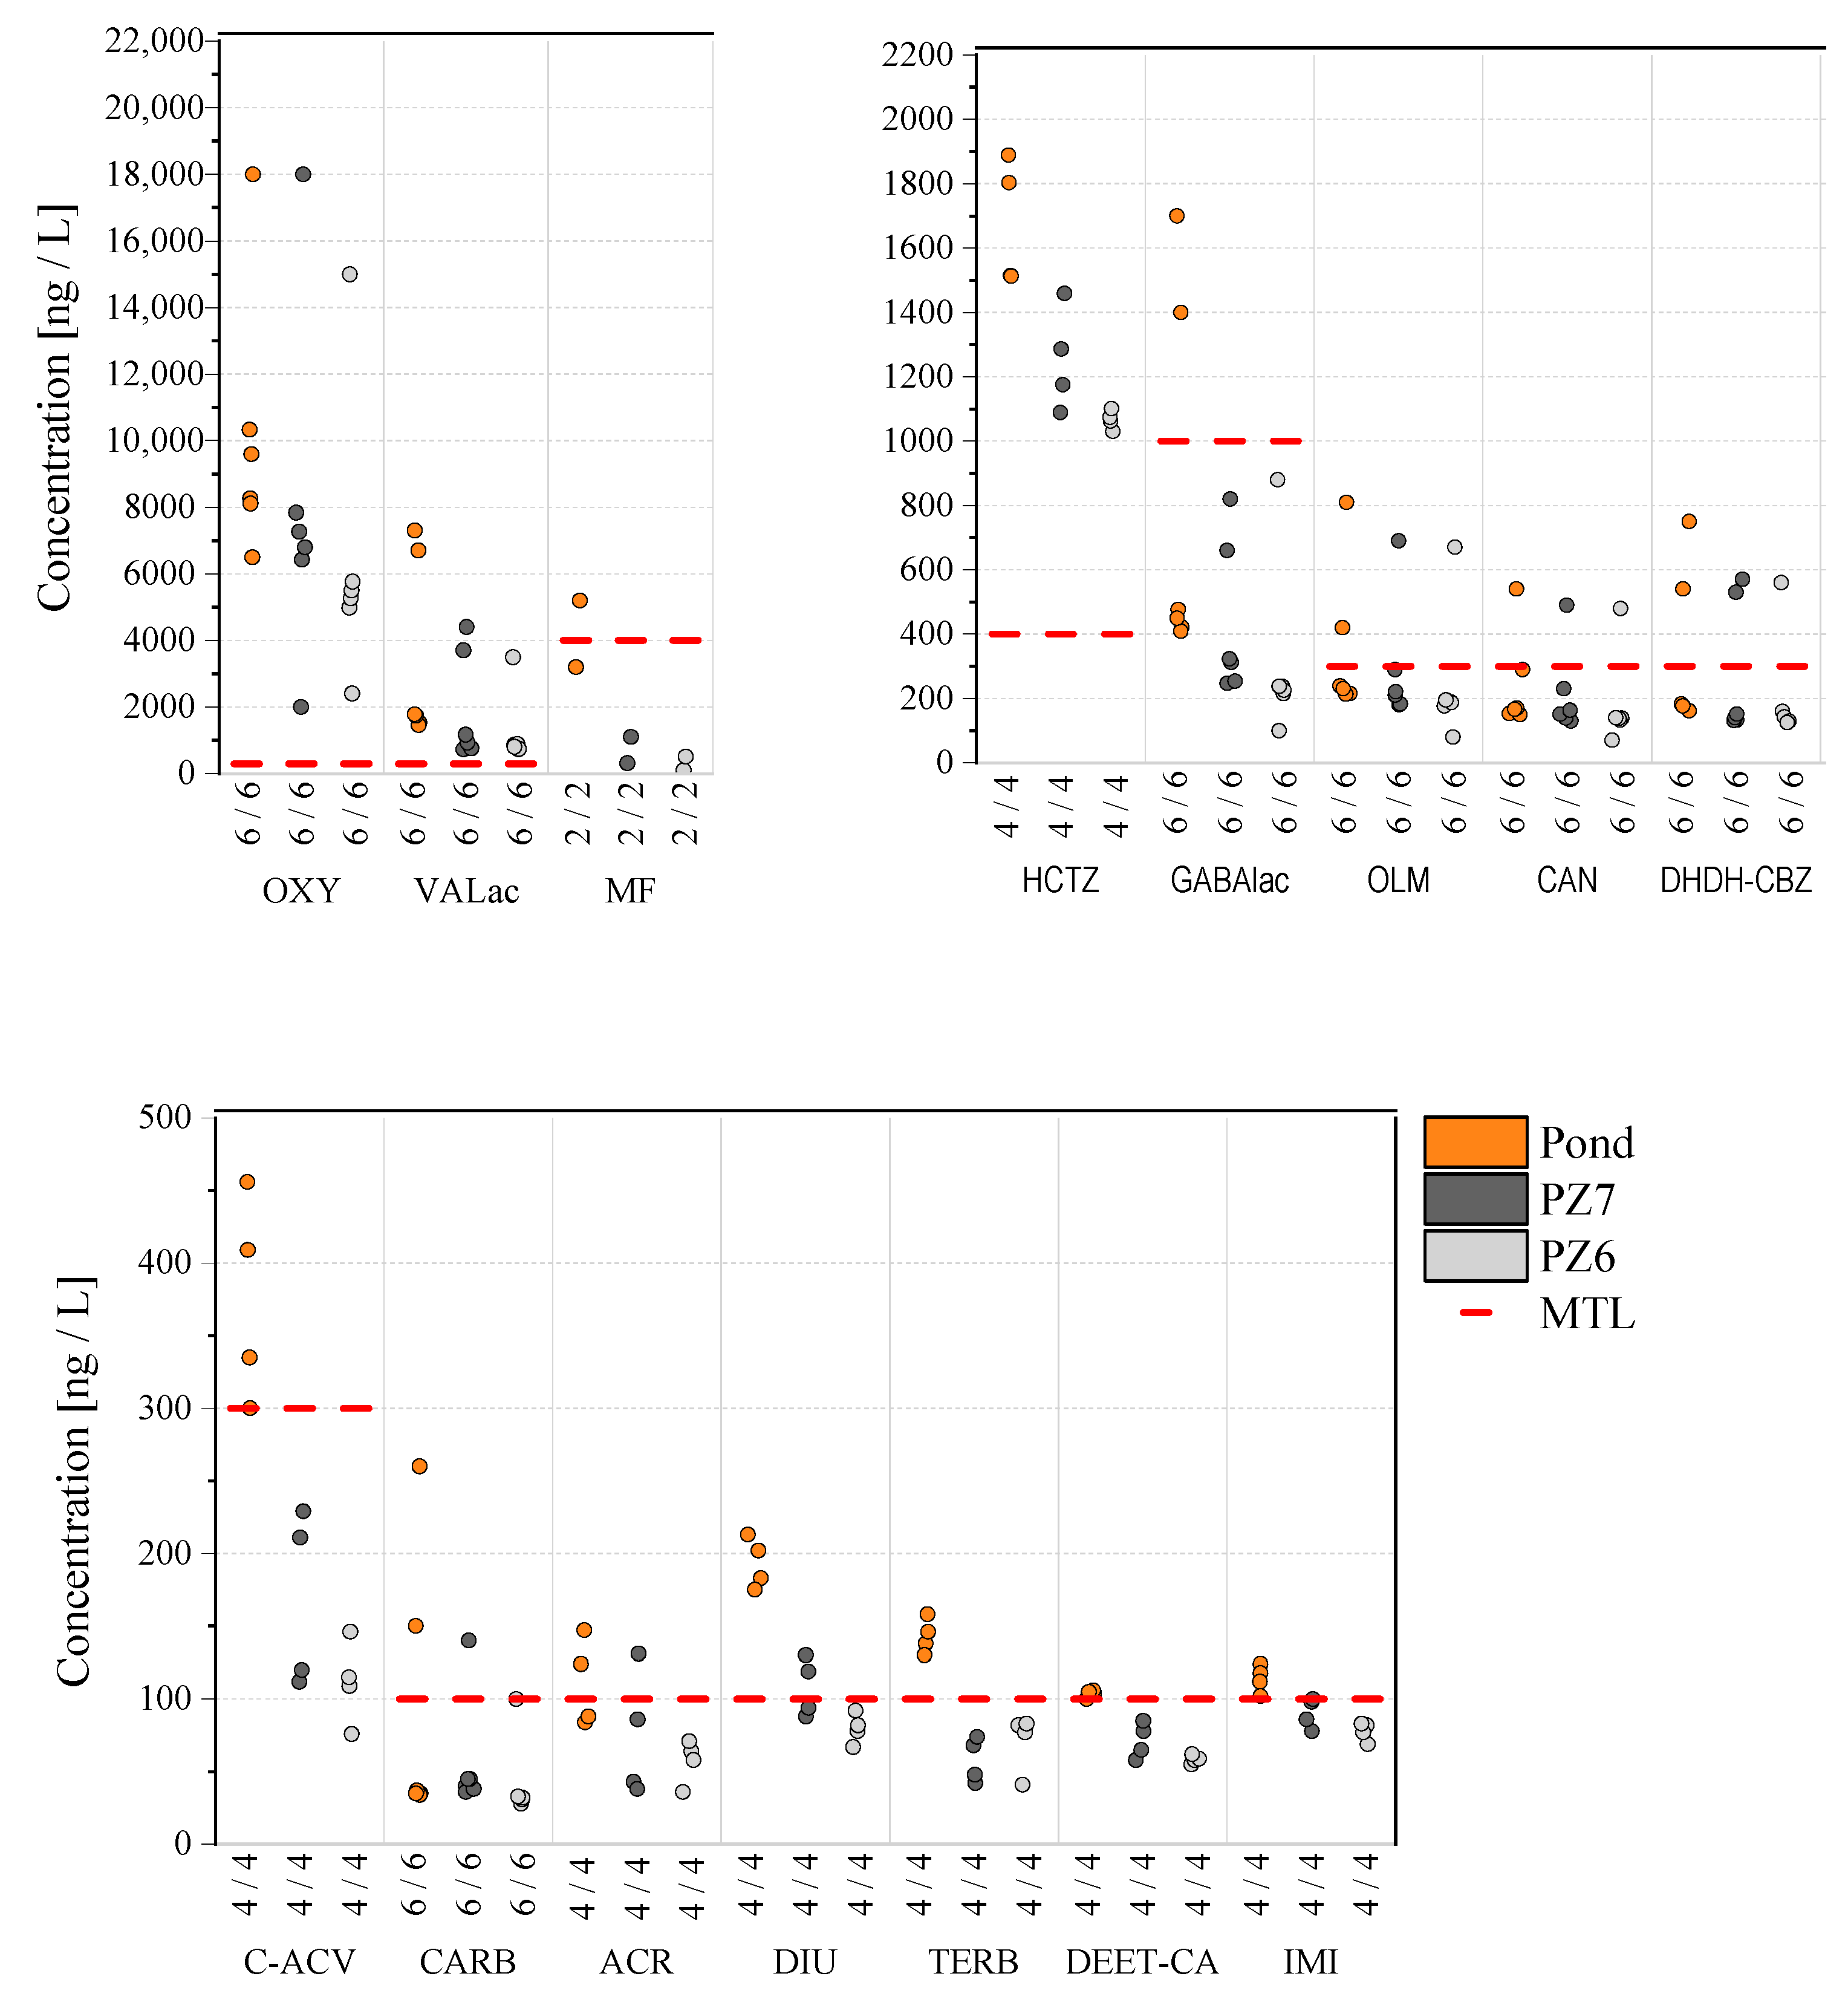
Concentrations of 15 CECs in the recharge basin exceeded MCL or health-based MTL and thus could represent a potential risk to public health. These chemicals were of anthropogenic origin including pharmaceuticals/metabolites (i.e., oxy-purinol, olmesartan, candesartan, metformin, hydrochlorothiazide) and their transformation products (valsartanic acid, gabapentin lactam, carboxy-aciclovir, dihydroxy-dihydro-carbamazepine), pesticides (carbendazim, diuron, imidacloprid, terbutryn, DEET carboxylic acid) and a dye (9-Carboxylic acid-Acridine). Measured concentrations in SAT are shown in Figure 8. Although SAT provided additional removal of these substances, 11 CECs could be detected above their MCL and MTL in at least one of the monitoring wells PZ 7 and PZ6 with the compounds constantly exceeding threshold levels in both wells. Additional removal processes in the aquifer and dilution with native groundwater will further reduce concentrations in the drinking water wells but exceedance of MTL cannot be excluded for the CECs oxy-purinol, valsartan acid and hydrochlorothiazide, as they constantly exceeded their MTL in monitoring wells by a factor of 3–20. In addition, MCL for pesticides should be safely met in monitoring wells as the point of compliance for the EU Groundwater Directive. To address these issues, an additional barrier for CEC removal has been installed at the water reclamation plant in El Port de la Selva by employing granular activated carbon filtration after tertiary filtration. Previous studies showed effective removal of hydrochlorothiazide and oxy-purinol by adsorption to activated carbon, but only moderate removal for valsartan acid [51,52].
4. Conclusions
This study provides a comprehensive assessment of one of the first small-scale indirect potable reuse systems in Europe utilizing tertiary treatment followed by soil-aquifer treatment (SAT) to augment a potable aquifer. The results confirm that this IPR concept based on secondary and tertiary water treatment followed by SAT with long hydraulic retention times (approximately 350–450 days) provides effective removal of pathogens, chemicals of emerging concern and antibiotic microbial resistance. Major conclusions of this study are:
- Conventional wastewater treatment and tertiary dual media filtration and UV disinfection achieved >5 log median reduction of indicator bacteria and >4.5 log for MS2 phages as indicators for viruses.
- Indicator bacteria were completely removed (<1 CFU/100 mL) during infiltration to the first monitoring well after 33 h of subsurface travel resulting in an additional minimum of 0.5 log removal for all bacteria.
- Reduction rates of 0.08–0.22 log/d for MS2 phages were calculated from median concentrations measured in monitoring wells after 33 h and 57 h of HRT. Based on these rates and estimated HRT of minimum 350 days, the IPR system can meet virus removal targets defined in the WHO Potable Reuse Guidelines.
- Antibiotic resistance genes are effectively removed to background levels of groundwater after travel times of 33–57 h.
- Among the monitored 151 chemicals, 94 were detected at least once in the recharge basin with only 15 compounds exceeding regulatory values or health-based monitoring trigger levels (MTL). Three CECs constantly exhibited concentration above MTL in monitoring wells. However, the installation of an additional GAC treatment step as well as dilution with native groundwater will ensure additional reduction of these CECs. Future monitoring should include substances regulated in the revision of the Drinking Water Directive, i.e., per- and polyfluoroalkyl substances and endocrine disrupting compounds, which were not addressed in this study.
Supplementary Materials
The following are available online at https://www.mdpi.com/2073-4441/13/3/325/s1, Text S1. Quantification of antibiotic resistance genes (ARGs) and 16S rRNA gene copies. Table S1: Effective recharge areas for the infiltration ponds 1–3. Table S2: Measured concentration of all monitored chemicals of emerging concern in infiltration basin and monitoring wells (PZ7 and PZ6) sorted according to removal efficiencies in SAT. Figure S1: Technical design of the infiltration ponds. Figure S2: Breakthrough curves of reclaimed water dilution in water supply well AM1, for the five modelling scenarios. Figure S3: Example of normalized breakthrough curves from infiltration pond 2 to observation wells PZ6 and PZ7 based on electrical conductivity.
Author Contributions
S.F. responsible for the data curation, formal analysis, conceptualization, investigation and original draft preparation, review and editing, visualization; C.S. contributed with conceptualization, validation, investigation, writing-review and editing, visualization; N.H. performed the analysis, investigation, writing-review and editing; T.A.T. contributed with writing-review and editing, funding acquisition; L.S. contributed with conceptualization, writing-review and editing, project administration; U.M. contributed with writing-review and editing, funding acquisition; J.E.D. contributed with project administration, writing, review and editing, funding acquisition; U.H. contributed with the conceptualization, validation, original draft preparation, writing-review and editing, visualization, funding acquisition. All authors have read and agreed to the published version of the manuscript.
Funding
This research was carried out within the two research projects DEMOWARE, which was funded within the European Union′s 7th Framework Programme for research, technological development and demonstration under grant number 619040, and FRAME funded by the German Federal Ministry of Education and Research (BMBF) through the JPI Water Consortium, grant number 02WU1345.
Acknowledgments
We gratefully thank Xavier Tristan from Consorci de la Costa Brava for supporting the sampling campaign in El Port de la Selva and to Martí Bayer, Ester Vilanova, Marc Carré, Anna Huguet Boix, Manoj Schulz and Cristina Sendra Massó for assistance and technical contribution during the sampling.
Conflicts of Interest
The authors declare no conflict of interest.
References
- WWAP (United Nations World Water Assessment Programme). The United Nations World Water Development Report 2017, Wastewater: The Untapped Resource; UNESCO: Paris, France, 2017; ISBN 978-92-3-100201-4. [Google Scholar]
- EEA (European Environment Agency). Use of Freshwater Resources. 2017. Available online: https://www.eea.europa.eu/data-and-maps/indicators/use-of-freshwater-resources-2/assessment-2 (accessed on 19 October 2017).
- Asano, T.; Burton, F.; Leverenz, H. Water Reuse: Issues, Technologies, and Applications; McGraw-Hill Education: New York, NY, USA, 2007; ISBN 9780071459273. [Google Scholar]
- EC (European Commission). Communication from the Commission to the European Parliament, the Council, the European Economic and Social Committee and the Committee of the Regions. 2012. A Blueprint to Safeguard Europe’s Water Resources. Available online: https://eur-lex.europa.eu/legal-content/EN/ALL/?uri=CELEX:52012DC0673 (accessed on 26 February 2018).
- EC (European Commission). Guidelines on Integrating Water Reuse into Water Planning and Management in the Context of the WFD. 2016. Available online: https://circabc.europa.eu/sd/a/f36280ac-9ddf-419d-8f35-c5b1f63d402b/CIS%20Guidelines%20on%20Water%20Reuse-final.pdf (accessed on 31 May 2020).
- WHO (World Health Organisation). Guidelines for Drinking-Water Quality: Fourth Edition Incorporating the First Addendum. 2017. Available online: http://apps.who.int/iris/bitstream/10665/254637/1/9789241549950-eng.pdf?ua=1 (accessed on 26 February 2018).
- Drewes, J.E.; Horstmeyer, N. Recent Developments in Potable Water Reuse. In Advanced Treatment Technologies for Urban Wastewater Reuse; Fatta-Kassinos, D., Dionysiou, D., Kümmerer, K., Eds.; Springer: Cham, Switzerland, 2016; pp. 269–290. [Google Scholar]
- AWWA (American Water Works Association). Potable Reuse 101: An Innovative and Sustainable Water Supply Solution. 2016. Available online: https://www.awwa.org/Portals/0/files/resources/water%20knowledge/rc%20reuse/Potable%20Reuse%20101.pdf (accessed on 26 February 2018).
- Drewes, J.E.; Horstmeyer, N.; Michel, P.; Khan, S. Producing high-quality recycled water. In Innovative Wastewater Treatment & Resource Recovery Technologies: Impacts on Energy, Economy and Environment; Lema, J.M., Suarez, S., Eds.; IWA Publishing: London, UK, 2017; pp. 285–296. [Google Scholar]
- Hellauer, K.; Mergel, D.; Ruhl, A.; Filter, J.; Hübner, U.; Jekel, M.; Drewes, J. Advancing Sequential Managed Aquifer Recharge Technology (SMART) Using Different Intermediate Oxidation Processes. Water 2017, 9, 221. [Google Scholar] [CrossRef] [Green Version]
- Drewes, J.E.; Regnery, J.; Dickenson, E.; Gerba, C.P.; Missimer, T. Role of Retention Time in the Environmental Buffer of Indirect Potable Reuse Projects: An Investigation on Managed Aquifer Recharge; Water Reuse Research Fundation: Alexandria, VA, USA, 2015; p. 180. Available online: https://watereuse.org/watereuse-research/role-of-retention-time-in-the-environmental-buffer-of-indirect-potable-reuse-projects-an-investigation-on-managed-aquifer-recharge/ (accessed on 22 February 2017).
- Lazarova, V.; Asano, T.; Bahri, A.; Anderson, J. Milestones in Water Reuse: The Best Success Stories; IWA Publishing: London, UK, 2013; ISBN 9781780400075. [Google Scholar]
- Frigola, X.; Bayer, M.; Taberna, E.; Gracia, D.; Sprenger, C.; Schwarzmüller, H.; Seis, W.; Kraus, F. Annual Progress Report on the Implementation of Water Reuse in El Port de la Selva. 2015. Available online: https://www.google.com/url?sa=t&rct=j&q=&esrc=s&source=web&cd=&ved=2ahUKEwi_m9yd68rqAhUEZMAKHdFHADwQFjAAegQIBBAB&url=http%3A%2F%2Fwww.kompetenz-wasser.de%2Fwp-content%2Fuploads%2F2017%2F05%2Fdemoware_annual_progress_report_elport_aca_2015_final.pdf&usg=AOvVaw0UQyeRpiaNfa8CsJPEYFFn (accessed on 20 March 2019).
- Miehe, U.; Stüber, J. D1.1 Partial Disinfection Technologies for Water Reuse: Case Studies and Design Guidelines. 2016, p. 75. Available online: http://demoware.ctm.com.es/en/demo-sites/el-port-de-la-selva (accessed on 27 March 2019).
- Zietzschmann, F.; Sprenger, C.; Seis, W.; Kraus, F.; Miehe, U.; Schwarzmüller, H.; Vilanova, E.; Bayer, M.; Lakretz, A.; Cikurel, H.; et al. D1.4 Pretreatment Requirements and Design Guidelines for SAT Technologies, and Two SAT Case Studies. 2017. Available online: http://demoware.ctm.com.es/en/demo-sites/el-port-de-la-selva (accessed on 13 February 2020).
- Diersch, H.-J. FEFLOW—Finite Element Modeling of Flow, Mass and Heat Transport in Porous and Fractured Media; Springer: Berlin/Heidelberg, Germany, 2014; ISBN 978-3-642-38739-5. [Google Scholar]
- Standing Committee of Analysts. The Microbiology of Drinking Water (2002)—Part 4a—Methods for the isolation and enumeration of coliform bacteria and Escherichia coli (including E. coli O157:H7). Methods for the Examination of Waters and Associated Materials; Environment Agency: Bristol, UK, 2002. [Google Scholar]
- APHA, AWWA & WPCF, APHA Method 9222: Standard Methods for the Examination of Water and Wastewater; American Public Health Association; American Water Works Association; Water Pollution Control Federation: Washington, DC, USA, 1989.
- Standing Committee of Analysts. The Microbiology of Drinking Water (2002)—Part 5b—Isolation and Enumeration of Enterococci by Membrane Filtration. Methods for the Examination of Waters and Associated Materials; Environment Agency: Bristol, UK, 2002. [Google Scholar]
- ISO. ISO 7899-2:2000(en)—Water Quality—Detection and Enumeration of Intestinal Enterococci—Part 2: Membrane Filtration Method; International Standard Organization: Geneva, Switzerland, 2000. [Google Scholar]
- Standing Committee of Analysts. The Microbiology of Drinking Water (2002)—Part 6c—Methods for the Isolation and Enumeration of Sulphite-Reducing Clostridia and Clostridium Perfringens by Membrane Filtration. Methods for the Examination of Waters and Associated Materials; Environment Agency: Bristol, UK, 2002. [Google Scholar]
- ISO. ISO 10705-2:2000—Water Quality—Detection and Enumeration of Bacteriophages—Part 2: Enumeration of Somatic Coliphages; International Standard Organization: Geneva, Switzerland, 2000. [Google Scholar]
- Calgua, B.; Fumian, T.; Rusiñol, M.; Rodriguez-Manzano, J.; Mbayed, V.A.; Bofill-Mas, S.; Miagostovich, M.; Girones, R. Detection and quantification of classic and emerging viruses by skimmed-milk flocculation and PCR in river water from two geographical areas. Water Res. 2013, 47, 2797–2810. [Google Scholar] [CrossRef] [PubMed] [Green Version]
- Calgua, B.; Rodriguez-Manzano, J.; Hundesa, A.; Suñen, E.; Calvo, M.; Bofill-Mas, S.; Girones, R. New methods for the concentration of viruses from urban sewage using quantitative PCR. J. Virol. Methods 2013, 187, 215–221. [Google Scholar] [CrossRef] [PubMed] [Green Version]
- Bofill-Mas, S.; Albinana-Gimenez, N.; Clemente-Casares, P.; Hundesa, A.; Rodriguez-Manzano, J.; Allard, A.; Calvo, M.; Girones, R. Quantification and Stability of Human Adenoviruses and Polyomavirus JCPyV in Wastewater Matrices. Appl. Environ. Microbiol. 2006, 72, 7894. [Google Scholar] [CrossRef] [PubMed] [Green Version]
- Hernroth, B.E.; Conden-Hansson, A.-C.; Rehnstam-Holm, A.-S.; Girones, R.; Allard, A.K. Environmental factors influencing human viral pathogens and their potential indicator organisms in the blue mussel, Mytilus edulis: The first Scandinavian report. Appl. Environ. Microbiol. 2002, 68, 4523–4533. [Google Scholar] [CrossRef] [PubMed] [Green Version]
- Da Silva, A.K.; Le Saux, J.-C.; Parnaudeau, S.; Pommepuy, M.; Elimelech, M.; Le Guyader, F.S. Evaluation of removal of noroviruses during wastewater treatment, using real-time reverse transcription-PCR: Different behaviors of genogroups I and II. Appl. Environ. Microbiol. 2007, 73, 7891–7897. [Google Scholar] [PubMed] [Green Version]
- Svraka, S.; Duizer, E.; Vennema, H.; de Bruin, E.; van der Veer, B.; Dorresteijn, B.; Koopmans, M. Etiological Role of Viruses in Outbreaks of Acute Gastroenteritis in The Netherlands from 1994 through 2005. J. Clin. Microbiol. 2007, 45, 1389. [Google Scholar] [CrossRef] [Green Version]
- Kageyama, T.; Kojima, S.; Shinohara, M.; Uchida, K.; Fukushi, S.; Hoshino, F.B.; Takeda, N.; Katayama, K. Broadly Reactive and Highly Sensitive Assay for Norwalk-Like Viruses Based on Real-Time Quantitative Reverse Transcription-PCR. J. Clin. Microbiol. 2003, 41, 1548. [Google Scholar] [CrossRef] [Green Version]
- Zeng, S.Q.; Halkosalo, A.; Salminen, M.; Szakal, E.D.; Puustinen, L.; Vesikari, T. One-step quantitative RT-PCR for the detection of rotavirus in acute gastroenteritis. J. Virol. Methods 2008, 153, 238–240. [Google Scholar] [CrossRef]
- Mohamed, N.; Elfaitouri, A.; Fohlman, J.; Friman, G.; Blomberg, J. A sensitive and quantitative single-tube real-time reverse transcriptase-PCR for detection of enteroviral RNA. J. Clin. Virol. 2004, 30, 150–156. [Google Scholar] [CrossRef]
- Corless, C.E.; Guiver, M.; Borrow, R.; Edwards-Jones, V.; Fox, A.J.; Kaczmarski, E.B.; Mutton, K.J. Development and evaluation of a ‘real-time’ RT-PCR for the detection of enterovirus and parechovirus RNA in CSF and throat swab samples. J. Med Virol. 2002, 67, 555–562. [Google Scholar] [CrossRef] [PubMed]
- López-Gutiérrez, J.C.; Henry, S.; Hallet, S.; Martin-Laurent, F.; Catroux, G.; Philippot, L. Quantification of a novel group of nitrate-reducing bacteria in the environment by real-time PCR. J. Microbiol. Methods 2004, 57, 399–407. [Google Scholar] [CrossRef] [PubMed]
- Pei, R.; Kim, S.-C.; Carlson, K.H.; Pruden, A. Effect of River Landscape on the sediment concentrations of antibiotics and corresponding antibiotic resistance genes (ARG). Water Res. 2006, 40, 2427–2435. [Google Scholar] [CrossRef] [PubMed]
- Volkmann, H.; Schwartz, T.; Bischoff, P.; Kirchen, S.; Obst, U. Detection of clinically relevant antibiotic-resistance genes in municipal wastewater using real-time PCR (TaqMan). J. Microbiol. Methods 2004, 56, 277–286. [Google Scholar] [CrossRef] [PubMed]
- Alexander, J.; Bollmann, A.; Seitz, W.; Schwartz, T. Microbiological characterization of aquatic microbiomes targeting taxonomical marker genes and antibiotic resistance genes of opportunistic bacteria. Sci. Total Environ. 2015, 512–513, 316–325. [Google Scholar]
- Hermes, N.; Jewell, K.S.; Wick, A.; Ternes, T.A. Quantification of more than 150 micropollutants including transformation products in aqueous samples by liquid chromatography-tandem mass spectrometry using scheduled multiple reaction monitoring. J. Chromatogr. A 2018, 1531, 64–73. [Google Scholar] [CrossRef]
- Betancourt, W.Q.; Kitajima, M.; Wing, A.D.; Regnery, J.; Drewes, J.E.; Pepper, I.L.; Gerba, C.P. Assessment of virus removal by managed aquifer recharge at three full-scale operations. J. Environ. Sci. HealthPart A 2014, 49, 1685–1692. [Google Scholar] [CrossRef]
- Maliva, R.G. Anthropogenic Aquifer Recharge: WSP Methods in Water Resources Evaluation Series; Springer International Publishing: Cham, Switzerland, 2019; p. 861. ISBN 9783030110840. [Google Scholar]
- Ho, J.; Seidel, M.; Niessner, R.; Eggers, J.; Tiehm, A. Long amplicon (LA)-qPCR for the discrimination of infectious and noninfectious phix174 bacteriophages after UV inactivation. Water Res. 2016, 103, 141–148. [Google Scholar] [CrossRef]
- Regnery, J.; Gerba, C.P.; Dickenson, E.R.V.; Drewes, J.E. The importance of key attenuation factors for microbial and chemical contaminants during managed aquifer recharge: A review. Crit. Rev. Environ. Sci. Technol. 2017, 47, 1409–1452. [Google Scholar] [CrossRef]
- WHO. Antimicrobial Resistance: An Emerging Water, Sanitation and Hygiene Issue. 2014. Available online: https://www.google.com/url?sa=t&rct=j&q=&esrc=s&source=web&cd=&cad=rja&uact=8&ved=2ahUKEwizpN_yxPDqAhVEKewKHUchD8sQFjAOegQICBAB&url=https%3A%2F%2Fapps.who.int%2Firis%2Frest%2Fbitstreams%2F910174%2Fretrieve&usg=AOvVaw2LKX--Yz9c8PSj6_3dmeT9 (accessed on 3 May 2020).
- COUNCIL DIRECTIVE 98/83/EC: Council Directive 98/83/EC of 3 November 1998 on the Quality of Water Intended for Human Consumption. Available online: http://data.europa.eu/eli/dir/1998/83/oj (accessed on 14 July 2020).
- Groundwater Directive (GWD) 2006/118/EC: Directive 2006/118/EC of the European Parliament and of the Council of 12 December 2006 on the Protection of Groundwater Against POLLUTION and Deterioration. Available online: http://eur-lex.europa.eu/LexUriServ/LexUriServ.do?uri=OJ:L:2006:372:0019:0031:EN:PDF (accessed on 20 July 2020).
- Council of the European Union, ST 6060 2020 REV 1: Proposal for a Directive of the European Parliament and of the Council on the Quality of Water INTENDED for Human Consumption (Recast)—Political Agreement. 2020. Available online: https://eur-lex.europa.eu/legal-content/EN/TXT/?qid=1583491875802&uri=CONSIL:ST_6060_2020_REV_1 (accessed on 4 November 2020).
- Drewes, J.E.; Anderson, P.; Denslow, N.; Jakubowski, W.; Olivieri, A.; Schlenk, D.; Snyder, S.A. Monitoring Strategies for Constituents of Emerging Concern (CECs) in Recycled Water: Recommendations of a Science Advisory Panel. SCCWRP Technical Report 1032. 2018. Available online: http://ftp.sccwrp.org/pub/download/DOCUMENTS/TechnicalReports/1032_CECMonitoringInRecycledWater.pdf (accessed on 3 May 2018).
- Drewes, J.E.; Anderson, P.; Denslow, N.; Olivieri, A.; Schlenk, D.; Snyder, S.A.; Maruya, K.A. Designing monitoring programs for chemicals of emerging concern in potable reuse – what to include and what not to include? Water Sci. Technol. 2013, 67, 433–439. [Google Scholar] [CrossRef]
- UBA (Umweltbundesamt). Gesundheitlicher Orientierungswert—GOW. 2020. Available online: https://www.umweltbundesamt.de/dokument/gow-liste-pdf (accessed on 20 October 2020).
- Maeng, S.K.; Sharma, S.K.; Lekkerkerker-Teunissen, K.; Amy, G.L. Occurrence and fate of bulk organic matter and pharmaceutically active compounds in managed aquifer recharge: A review. Water Res. 2011, 45, 3015–3033. [Google Scholar] [CrossRef] [PubMed]
- Hermes, N.; Jewell, K.S.; Schulz, M.; Müller, J.; Hübner, U.; Wick, A.; Drewes, J.E.; Ternes, T.A. Elucidation of removal processes in sequential biofiltration (SBF) and soil aquifer treatment (SAT) by analysis of a broad range of trace organic chemicals (TOrCs) and their transformation products (TPs). Water Res. 2019, 163, 114857. [Google Scholar] [PubMed]
- Bourgin, M.; Beck, B.; Boehler, M.; Borowska, E.; Fleiner, J.; Salhi, E.; Teichler, R.; von Gunten, U.; Siegrist, H.; McArdell, C.S. Evaluation of a full-scale wastewater treatment plant upgraded with ozonation and biological post-treatments: Abatement of micropollutants, formation of transformation products and oxidation by-products. Water Res. 2018, 129, 486–498. [Google Scholar] [CrossRef] [PubMed] [Green Version]
- Sperlich, A.; Harder, M.; Zietzschmann, F.; Gnirss, R. Fate of Trace Organic Compounds in Granular Activated Carbon (GAC) Adsorbers for Drinking Water Treatment. Water 2017, 9, 479. [Google Scholar] [CrossRef] [Green Version]
Figure 1.
Schematic system design for indirect potable water reuse monitored in El Port de la Selva, where PZ7, PZ6 and PZ2 represent the monitoring wells and DW the drinking water well (adapted from Zietzschmann et al. [15]).
Figure 1.
Schematic system design for indirect potable water reuse monitored in El Port de la Selva, where PZ7, PZ6 and PZ2 represent the monitoring wells and DW the drinking water well (adapted from Zietzschmann et al. [15]).

Figure 2.
The study area in El Port de la Selva, showing the wastewater treatment plant (WWTP), drinking water wells AM1 and AM2 and the recharge area with recharge basins and monitoring wells indicated in the inlet (groundwater flow follows the riverbed towards the Mediterranean Sea; adapted from Zietzschmann et al. (2017) [15]).

Figure 3.
Bulk water quality parameters measured in the infiltration basin and in the aquifer. OW-1: observation well area 1 (PZ6 and PZ7); OW-2: observation well area 2 (PZ4); DW-Well: drinking water well (AM1 and AM2); Coastal Well: coastal observation well Bolera (number of samples are given below individual box plots).

Figure 4.
Redox sensitive parameter measured in the infiltration basins and in the aquifer. OW-1: observation well area 1 (PZ6 and PZ7); OW-2: observation well area 2 (PZ4); DW-Well: drinking water well (AM1 and AM2); Coastal Well: coastal observation well Bolera.
Figure 4.
Redox sensitive parameter measured in the infiltration basins and in the aquifer. OW-1: observation well area 1 (PZ6 and PZ7); OW-2: observation well area 2 (PZ4); DW-Well: drinking water well (AM1 and AM2); Coastal Well: coastal observation well Bolera.

Figure 5.
Abundance and limits of quantification of selected indicator organisms, i.e., total coliforms (TC), E. coli, E. faecalis, Clostridium Perfringens (SRC) and bacteriophages MS2 measured along the water reuse facility: sewage, secondary effluent (2Eff), tertiary effluent (3Eff), infiltration pond, and monitoring wells PZ7 (HRT 33.2 h) and PZ6 (HRT 57 h); x-axis denotes number of detections/number of samples.

Figure 6.
Number of gene copies for Rotavirus, Human Adenovirus (HAdv) and Norovirus (NovGGI and NoVGGII) measured during treatment train of managed aquifer recharge; x-axis denotes number of detections/number of samples.
Figure 6.
Number of gene copies for Rotavirus, Human Adenovirus (HAdv) and Norovirus (NovGGI and NoVGGII) measured during treatment train of managed aquifer recharge; x-axis denotes number of detections/number of samples.

Figure 7.
Abundance of 16SrRNA and antibiotic resistance genes (ARGs) in infiltration pond, in monitoring wells (PZ7, HRT = 33.2 h and PZ6, HRT = 57 h) and in the drinking water well (DW).
Figure 7.
Abundance of 16SrRNA and antibiotic resistance genes (ARGs) in infiltration pond, in monitoring wells (PZ7, HRT = 33.2 h and PZ6, HRT = 57 h) and in the drinking water well (DW).

Figure 8.
Measured concentrations and monitoring trigger levels (MTL) of identified organic compounds in the infiltration pond and in monitoring wells PZ7 (HRT 33 h) and PZ6 (HRT 57 h). TOrCs: OXY (oxy-purinol), VALac (valsartan acid), MF (metformin), HCTZ (hydrochlorothiazide), GABAlac (gabapentin lactam), OLM (olmesartan), CAN (candesartan), DHDH-CBZ (dihydroxy-dihydro-carbamazepine), C-ACV (carboxy-aciclovir), CARB (carbendazim), ACR (9-carboxylic acid-acridine), DIU (diuron), TERB (terbutryn), DEET-CA (DEET carboxylic acid), IMI (imidacloprid).


Table 1.
List of genes related to antibiotic resistance and primers used in qPCR assay.
| Reference MO | Antibiotic | Gene | R2 | Primer (5′ → 3′) | |
|---|---|---|---|---|---|
| Whole microbial community | - | 16S rRNA (202 bp) | 0.989 | 341 f | GACTCCTACGGGAGGCWGCAG |
| 515 r | GTATTACCGCGGCTGCTGG [33] | ||||
| Escherichia coli J53 (Plasmid R388) | Sulfamethoxazole | Sul1 (162 bp) | 0.983 | f | CGCACCGGAAACATCGCTGCAC |
| r | TGAAGTTCCGCCGCAAGGCTCG [34] | ||||
| Enterococcus faecium B7641 | Vancomycin | VanA (65 bp) | 0.992 | f | CTGTGAGGTCGGTTGTGCG |
| r | TTTGGTCCACCTCGCCA [35] | ||||
| Pseudomonas aeruginosa VR143 | Imipenem | BlaVIM (62 bp) | 0.985 | f | CCTCCATTGAGCGGATTCA |
| r | GCCGTGCCCCGGAA [35] | ||||
| Enterobacter cloacae NZ11 | Ampicillin | ampC (67 bp) | 0.993 | f | GGGAATGCTGGATGCACAA |
| r | CATGACCCAGTTCGCCATATC [35] | ||||
| Streptococcus hyointestinalis DSM 20770 | Erythromycin | ermB (71 bp) | 0.997 | f | TGAATCGAGACTTGAGTGTGCAA |
| r | GGATTCTACAAGCGTACCTT [36] |
Table 2.
Hydraulic retention times from infiltration basin to the observation wells (PZ7 and PZ6) determined based on monitoring of electrical conductivity as a conservative tracer.
Table 2.
Hydraulic retention times from infiltration basin to the observation wells (PZ7 and PZ6) determined based on monitoring of electrical conductivity as a conservative tracer.
| Distance from Pond Edge | Predominant Residence Time | Predominant Flow Velocity | Median Residence Time | Median Flow Velocity | |
|---|---|---|---|---|---|
| (m) | (h) | Vdom (m/h) 1 | (h) | Vmed (m/h) 2 | |
| Basin 2-PZ7 | 3 | 11.5 | 0.3 | 33.2 | 0.1 |
| Basin 2-PZ6 | 23 | 55 | 0.4 | 57 | 0.4 |
1 based on maximal concentration, 2 based on 50% of tracer breakthrough.
Table 3.
Measured log reduction of indicator microorganisms at individual treatment barriers of the indirect potable reuse system (n.d.: not detected).
Table 3.
Measured log reduction of indicator microorganisms at individual treatment barriers of the indirect potable reuse system (n.d.: not detected).
| Indicator Organisms | Conventional WWTP | Tertiary Treatment | Soil-Aquifer Treatment | |||
|---|---|---|---|---|---|---|
|
Log Reduction (Measured) | Log Reduction/d | |||||
| PZ7 | PZ6 | PZ7 | PZ6 | |||
| Total coliforms | 2.84 | 2.85 | >0.91 | >0.91 | n.d. | n.d. |
| E. coli | 2.77 | 2.92 | >0.49 | >0.49 | n.d. | n.d. |
| E. faecalis | 2.17 | 2.57 | >1.06 | >1.09 | n.d. | n.d. |
| C. perfringens | 1.95 | 2.83 | >0.73 | >0.73 | n.d. | n.d. |
| Bacteria (median) | 2.47 | 2.84 | >0.81 | >0.81 | >0.59 | >0.34 |
| MS2 phages | 2.21 | 2.49 | 0.31 | 0.18 | 0.22 | 0.08 |
Publisher’s Note: MDPI stays neutral with regard to jurisdictional claims in published maps and institutional affiliations. |
© 2021 by the authors. Licensee MDPI, Basel, Switzerland. This article is an open access article distributed under the terms and conditions of the Creative Commons Attribution (CC BY) license (http://creativecommons.org/licenses/by/4.0/).
Share and Cite
MDPI and ACS Style
Fajnorová, S.; Sprenger, C.; Hermes, N.; Ternes, T.A.; Sala, L.; Miehe, U.; Drewes, J.E.; Hübner, U. Assessment of Full-Scale Indirect Potable Water Reuse in El Port de la Selva, Spain. Water 2021, 13, 325. https://doi.org/10.3390/w13030325
AMA Style
Fajnorová S, Sprenger C, Hermes N, Ternes TA, Sala L, Miehe U, Drewes JE, Hübner U. Assessment of Full-Scale Indirect Potable Water Reuse in El Port de la Selva, Spain. Water. 2021; 13(3):325. https://doi.org/10.3390/w13030325
Chicago/Turabian StyleFajnorová, Soňa, Christoph Sprenger, Nina Hermes, Thomas A. Ternes, Lluís Sala, Ulf Miehe, Jörg E. Drewes, and Uwe Hübner. 2021. "Assessment of Full-Scale Indirect Potable Water Reuse in El Port de la Selva, Spain" Water 13, no. 3: 325. https://doi.org/10.3390/w13030325
Note that from the first issue of 2016, this journal uses article numbers instead of page numbers. See further details here.