
Operationalizing Urban Resilience to Floods in Island Territories—Application in Punaauia, French Polynesia


UNIV. POLYNESIE FRANCAISE, IFREMER, ILM, IRD, EIO UMR 241, TAHITI, POLYNESIE FRANCAISE
*
Author to whom correspondence should be addressed.
Water 2021, 13(3), 337; https://doi.org/10.3390/w13030337
Submission received: 8 January 2021
/
Revised: 25 January 2021
/
Accepted: 26 January 2021
/
Published: 29 January 2021
(This article belongs to the Special Issue GIS Application: Flood Risk Management)
Abstract
:In the context of climate change and increasing urbanization, Small Island Developing States are increasingly vulnerable to natural disasters. In response to urbanization in at risk areas, the concept of territorial resilience has potential as an approach to urban flood issues. The objective of this research is to develop a spatial decision support tool based on a collaborative assessment method of territorial resilience. The proposed methodology consists of: the adaptation to the French Polynesian context, three existing resilience assessment methods applied to a case study in the Punaruu Valley’s (Punaauia, French Polynesia) and the use of geovisualization techniques: use of GIS for data processing and analysis, visualization, mapping and model processing. This methodology integrates the technical, urban and social components of the territory, while highlighting the various levers available to improve territorial resilience and facilitate its understanding through collaborative work efforts and the use of a visual tool. The results demonstrate the reproducibility of these methods for assessing resilience in French Polynesia. They underline the potential of a collaborative approach to highlight critical infrastructures and generate possible decision support to improve the territory’s ability to function despite a disruption and the ability to rebuild following this disruption.
1. Introduction
1.1. Issues and Background
In French Polynesia, more than half of the population has already faced a natural hazard such as a cyclone, flood or landslide. These phenomena have and continue to cause serious consequences. Between 1996 and 2015, they caused nineteen billion XPF of damages and 22 deaths [1].
Due to the climatic context (intertropical convergence zone), the islands of French Polynesia are frequently subject to atmospheric depressions and cyclones, leading to high winds, heavy rain, torrential floods, flooding, landslides, marine submersion, etc. [2,3]. Floods has been recognized as the main natural risk in French Polynesia [1,4]. In addition, the morphology of high islands and the anarchic urbanization of the territory amplify the flood risk [5,6]. Indeed, the steep slopes of the catchment induce flow speeds qualified as “torrential” [7] with a high kinetic energy capable of causing significant damage such as in 2017, when the flash floods caused 12.5 million Euros of damage on the island of Tahiti [8]. These torrential flow can carry considerable volumes and favor the creation of logjams and/or the modification of the channel’s course, amplifying the risk of flooding [9]. Urbanization, through increasing the amount of impervious areas in the catchment, results in a replacement of this regime by concentrating rain run-off [5].
The context of climate disruption calls into question the adaptive capacity of the Polynesian islands. Indeed, according to the Intergovernmental Panel on Climate Change (IPCC), global temperature will raise by 1.5 °C sometime between 2030 and 2050 [10]. This increase in atmospheric temperature will lead to an increase in the average temperature of the oceans and a rise in the average sea level [11]. In the Pacific, the rise would be of the order of 3 to 5 mm/year. Although floods are predicted with deterministic model including inherent uncertainties associated with uncertain variables (precipitation, stream flow, topographic representation, modeling parameters) [12], it appears indispensable to anticipate flood scenarios that probabilistic models consider as extreme or rare [13,14]. According to a climate model, 100-year floods could occur twice as frequently by 2050 over 40% of the planet [15].
As a small island developing state, the French Polynesian territory is affected by limited resources, remoteness, susceptibility to natural disasters, vulnerability to external shocks, excessive dependence on international trade, and fragile environments [16,17]. Thus, in the context of global climate change, it is essential to take into account the increase of these natural risks in the Polynesian land use planning policy and to evaluate its potential resilience in the event of a disaster.
1.2. Operational Approach Based on the Concept of Resilience
In the event of flooding, long-term consequences are multiplied in urban areas by cumulative effects, producing a “domino effect”: urban density and the contiguity of the issues at stake can lead to cascading reactions and affect the whole territory [18,19]. In this case, the trigger event is natural in origin and may lead to events of the same nature (e.g., landslides following torrential floods; marine submersion followed by urban flooding) [20,21] or a different nature (e.g., a torrential flood leads to the disruption of the electrical network) [22,23].
Some infrastructures are considered to be critical and provide territories with vital resources, and strategic networks such as telecommunications, transport, and electricity [24]. For instance, an urban flood may cause an interruption to vital networks such as energy supply, transport, and telecommunications. Thus, the disruption of this critical infrastructure can impact the population and lead to economic, political and health consequences [25]. It is therefore essential to take into account all of the components of a territory (technical, urban, social, etc.) when establishing a risk management strategy.
Approaches to risk analysis and assessment has existed for several decades and has been applied globally in a variety of different areas. Recently, the concept of resilience has been used as a strategic support tool in the field of risk management [26]. This integrated risk management approach takes into account and involves all the actors in the territory. The concept is based on a prevention component (informing the population, controlling land use planning, strengthening the resistance of existing buildings, etc.), a protection component (reducing exposure) and an anticipation component (forecasting and warning system facilitating recovery). The objective is no longer just to prevent the hazard but to minimize the consequences by reducing exposure and vulnerability and promoting recovery.
Because the concept of resilience is multidisciplinary, its understanding and application as a risk management strategy is extremely complex. Some studies have been carried out to facilitate its operationalization. These researches are principally divided into two approaches, a technical-functional approach [22,27,28] and a more organizational approach [29,30,31,32]. However, this concept is still facing operational limitations, which restricts its integration into local risk management strategies [33,34].
In French Polynesia, there have been very little studies conducted on the operationalization of the concept of resilience in response to numerous natural hazards. The main risk management tool in French Polynesia is a regulatory zoning system that integrates flooding risks, land movement and marine submersion in land-use planning: the natural risk prevention plan [1]. Approved for only one commune in Tahiti, this zoning tool has proved to be ineffective (numerous revisions following economic and political pressures) and unsuitable (rejection of building bans on an already small area) for the territory [35].
Faced with the increasing risks and vulnerability of small island developing states and the lack of operationalization of the concept of resilience in French Polynesia, this study aims to develop a methodology to promote the integration of resilience into risk management strategies. The challenge here is to test the reproducibility of operational resilience assessment methods applied in France in order to produce a global approach to resilience on a scale fine enough to lead to an appropriation of the concepts by managers and citizens, in order to participate in the decision-making process.
A decision support system is an effective tool to aid in this decision-making process. It can be defined as an “integrated, interactive and flexible computer system that supports all phases of decision-making with a user-friendly interface, data and expert knowledge” [36]. Such a system aims to aggregate acquired data from the field and practical experience under one framework, thus, creating and facilitating communication, for instance, between a network of scientists and local knowledge and practices [30]. It is important to consider the spatial nature of coastal systems and processes because coastal zones are dynamic environments that are susceptible to natural and anthropogenic pressures and therefore require accurate representation of its features and processes [36]. This is why the term spatial decision support system will henceforth be used in this study.
Firstly, this study will analyze the different existing methods on the operationalization of resilience, while identifying their assets and limitations. Secondly, this study will develop a methodology, with its results adapted to the context of French Polynesia, allowing to identify the territorial resilience. This study concludes on the relevance of this methodology and the need to design a centralizing collaborative tool.
2. Operationalizing Territorial Resilience in Pacific Island States
2.1. Tools for Operationalizing the Concept of Resilience
There are a multitude of approaches to operationalizing territorial resilience, resulting from years of research in the field of risk management, but they are too often used separately. The challenge of this study consists in assembling and adapting three methods, already applied in European cities [28,29,31], in order to design indicators for measuring and evaluating territorial resilience in French Polynesia.
2.1.1. Vulnerability Assessment of Critical Infrastructure in Hamburg
A territory is a transdisciplinary object by nature. It is therefore necessary to address territorial resilience through a transdisciplinary approach. The DS3 model (Spatial Decision Support System) is a technical-functional approach aimed at facilitating the appropriation of the concept by urban technical services [28]. The city is described like a complex system with various components interconnected by a network [37]. Three resilience capacities have been defined: resistance capacity, absorption capacity and recovery capacity.
- Resilience capacity: The probability of services to malfunction in the event of a disturbance. The more the technical network is damaged, the more difficult it will be to put it back into service. Resilience analysis thus makes it possible to assess possible damage and its consequences on the system to highlight the interdependencies between the various network components.
- Absorption capacity: The possible alternatives allowing services to be maintained despite network disturbance. As well as the identification of solutions to maintain service continuity despite flooding, thus operating in “degraded” mode.
- Recovery capacity: The time required to bring the system back into service.
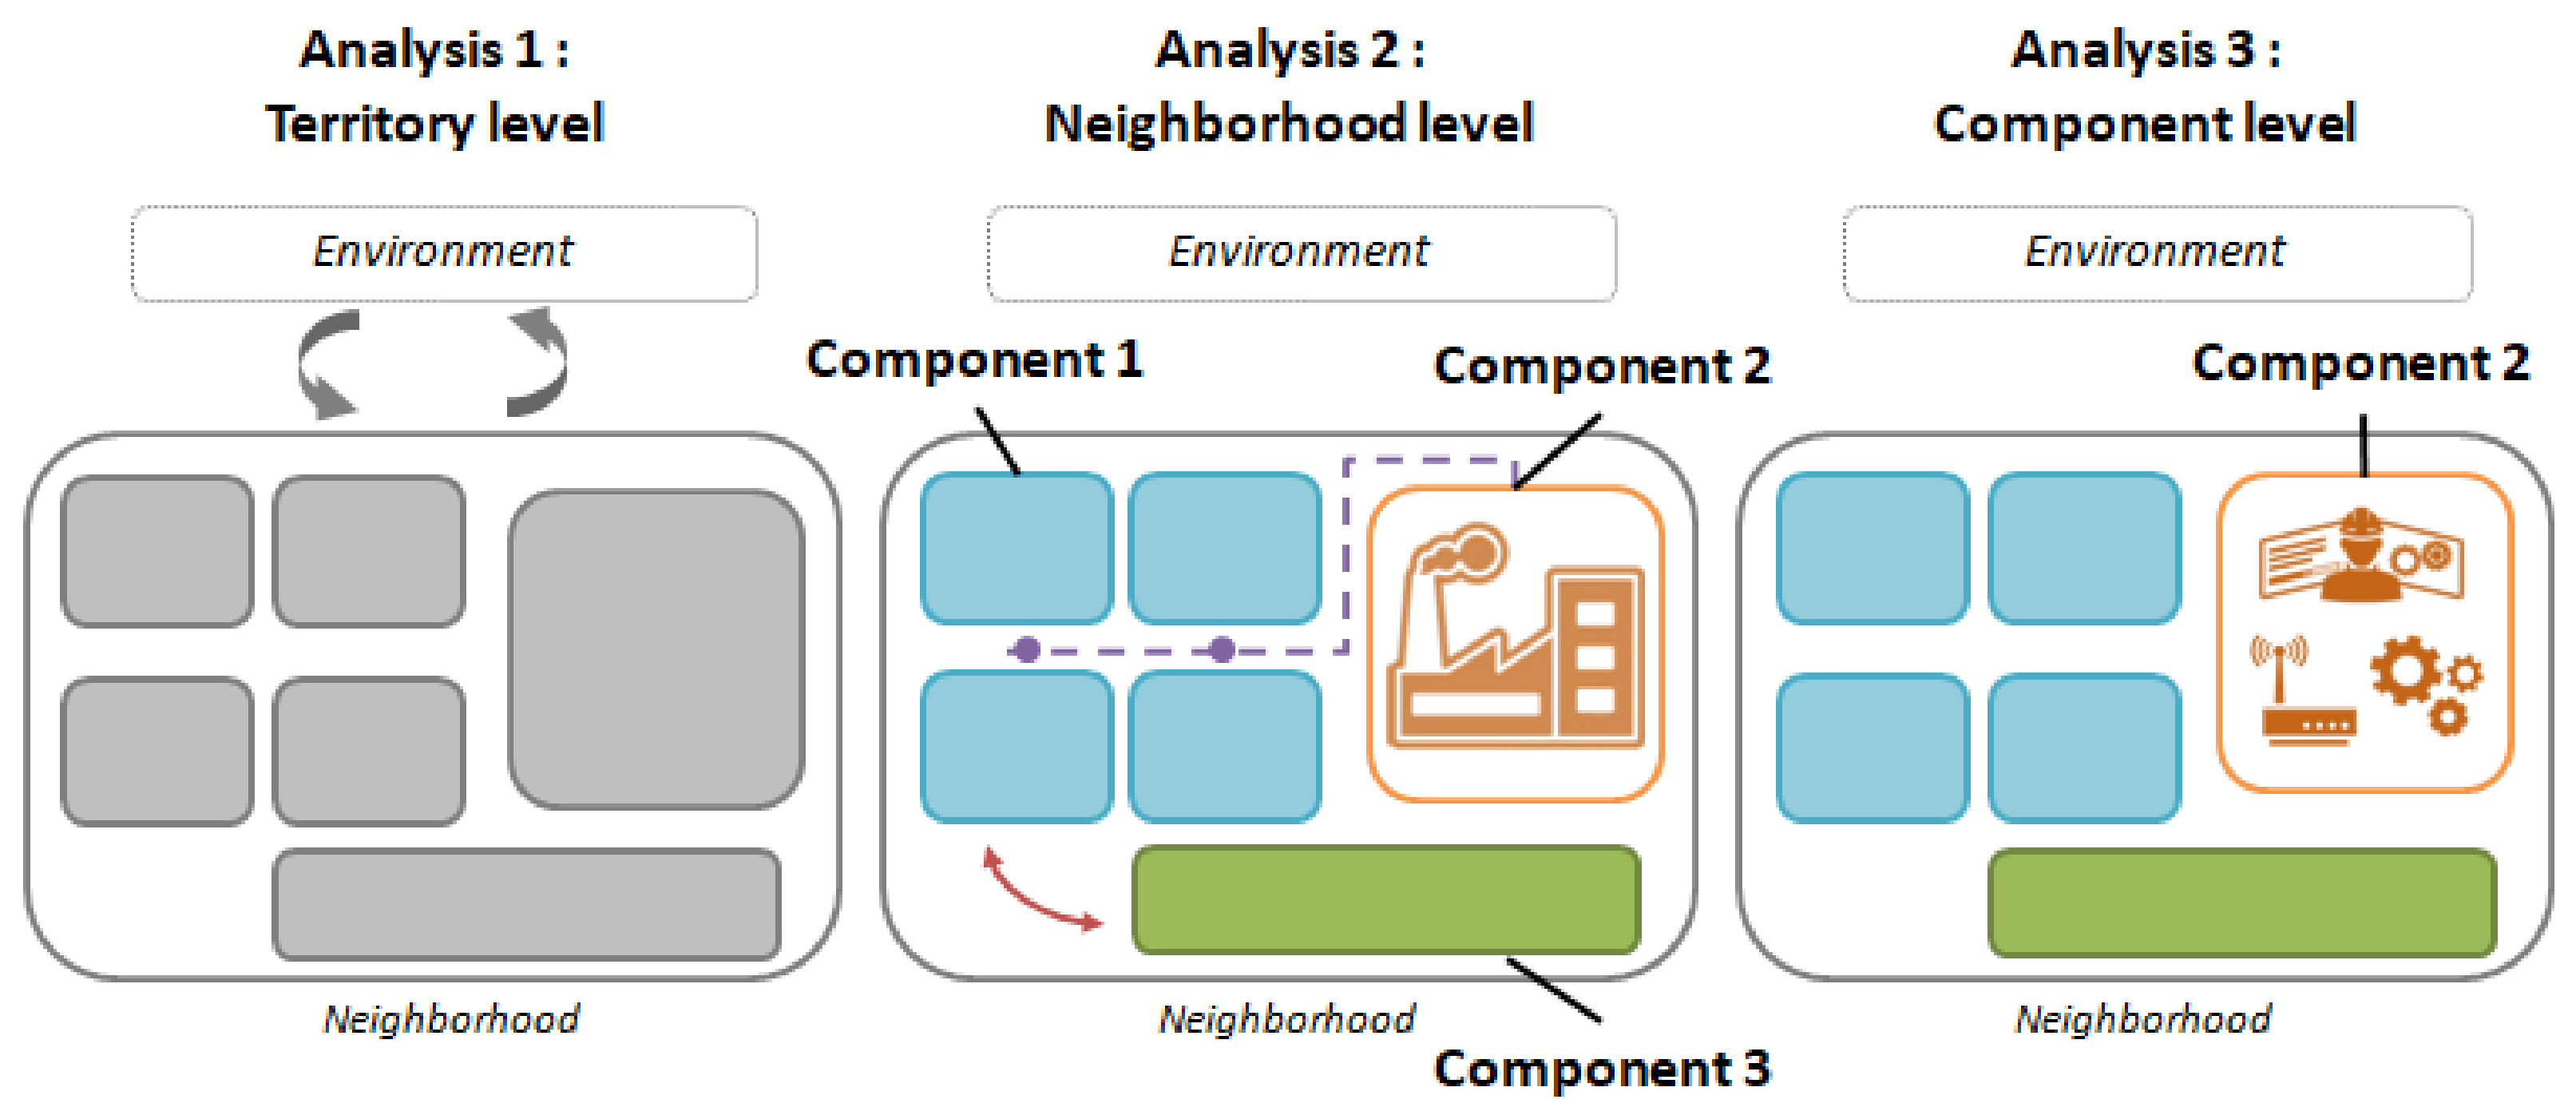
The DS3 model allows an analysis on three levels: a global overview at the territory level, an intermediate analysis at the neighborhood level and a finer analysis on the scale of a component (Figure 1).
As a spatial decision support tool, the DS3 model allows for the identification of critical infrastructures whose malfunctioning would threaten the security, economy, lifestyle and/or public [37]. This model was built to be reproducible.
Because of its transdisciplinarity, the use of the DS3 model can be complex, particularly through the use of dependability analysis or graph theory. A detailed analysis of all the levels of a system is time-consuming and requires options. In this study, the DS3 model will be used more as a global vision of the concept of resilience, applicable at several levels of the territory (Figure 1), rather than for its technical-functional tools.
It appears necessary to broaden the approach to the concept and its analysis in order to promote understanding and adoption of the concept. However, this perspective does not provide a comprehensive approach to the resilience of a territory that must take into account other components of the territory, other than technical. This is why this methodology is complemented with an approach that takes into account the social and urban components of a territory [31].
2.1.2. A Collaborative Approach with Parisian Urban Services
A collaborative approach (proposed by DS3 Model) allows for an analysis at the neighborhood scale. This complementary method makes it possible to identify the challenges of a territory by involving the local actors [29]. This transversal method has already made it possible to model and characterize the interdependencies between Parisian urban services preceded by a survey of managers.
This approach overcomes the difficulties of data collection and modeling at the critical infrastructure level, as well as highlights the influence/dependency relationships between urban services before testing the resilience of these interdependencies in response to a disruption, such as a flood. The analysis of the resilience of urban technical services is modeled from a coherent scenario based on feedback (i.e., flooding of the Seine in 1910 and 1982). This scenario makes it possible to situate in space and time the failures and actions planned by managers in the event of a flood. In the end, the results can be used for improving technical resilience, and furthermore, this approach is built to be adaptable to other contexts.
However, this method is based on knowledge shared by managers whose subjectivity and lack of transparency can be biased. It also requires a more detailed, sector-based analysis in order to take into account the different strategies implemented by each manager who have established strategies that are too isolated. The use of the DS3 model [28] as a complement would make it possible to reach this level of detail.
The collaborative diagnosis and the participation of local actors will provide a global vision of the technical resilience of the territory, by identifying critical infrastructures and allowing to model the impact of a disruption on the functioning of the territory.
2.1.3. Indicators to Mapping Resilience in Avignon
Studying resilience at the community level requires the consideration of many other factors such as demographics, economic dynamics and urban planning. In order to respond to this issue, one method used in Avignon utilizes indicators of social and urban resilience [31]. The goal of this approach is to point out the characteristics that could increase or decrease territorial resilience, to revive social, economic and urban activity after a disruption.
Social resilience indicators aim to capture the demographic “qualities” of a population that can be useful in coping with and recovering from a disaster. These qualities reflect the health status of a population, which in turn reflects the understanding, communication and mobility within a community. Urban resilience indicators are intended to represent the economic vitality of a community, the quality of housing construction, as well as the distribution of emergency services and their ability to provide medical care. Technical resilience indicators allow for the analysis of urban networks through their accessibility, to repair in the case of a disruption, and their diversity, to assess the ability to maintain services in the event of a disruption.
Using indicators simplifies data and integrates a lot of information on the potential resilience of each element of the territory. Easily comprehendible, operational indicators are a useful communication tool that managers use in decision-making and that raises awareness to the local population. In addition, the ISPF open access data (for French Polynesia) is very similar to the INSEE data (for France) used by this method and will facilitate its adaptation to the Polynesian territory.
Nevertheless, this approach is still limited at the community project scale and needs to be tested for reproducibility before moving to the urban project scale. The genericity of these indicators, especially for the social resilience analysis, must be validated by a global definition and a construction of universal indicators. Technical resilience indicators will not be used afterwards since there are other tools [28,29], more specific and complete, that will be used to assess the technical resilience of the territory.
2.2. Territorial Resilience Modeling in French Polynesia
In the field of risk management, the concept of resilience is used as a tool for integrated land-use management [38]. The objective is to improve knowledge of the territory in order to produce a process to assist decision-makers in their decision-making (Table 1) and to promote a common policy on risk management strategy with adapting structural measures, such as levees, or with resettling outside the flood-prone area [39].
Assessing the resilience potential of a territory leads to the anticipation of disruptive events and the planning of management crisis by managers. The main goal is to consider all the components of a territory, meaning, critical infrastructures, urban environment, managers, local actors and residents in order to improve their resilience to disruption and restart an activity and a dynamic in response to it [30,31].
In this study, territorial resilience is defined as “the ability of a territory to function despite a disturbance and the ability to rebuild itself following that disturbance. It is the ability to anticipate and limit, the impacts of a hazard on the functioning of the city [18]. This study combined resilience operationalization methods that have been developed to be replicable and applicable to various territories (Table 1) To facilitate its study, territorial resilience is divided into three categories: social resilience, technical resilience and urban resilience (Figure 2).
Spatial and temporal scales play a critical role in measuring resilience [30]. Indeed, in the context of an interconnected urban area, risks have moved beyond their previous geographical and temporal limits and therefore become transboundary disasters [24]. In this case, a local disturbance could have unimaginable and potentially catastrophic effects [40].
Thus, a flood will impact its local territory (major riverbed), but because of the interconnected networks or urban activities, it may exceed the physical limits of the floodplain area. For example, the flooding of a power plant could have repercussions on the telecommunications network and indirectly a financial impact. In order to integrate this specificity of modern disasters, we have established an analysis with a precise geographical and temporal limit.
The spatial scale of analysis is local [31] as this scale is easier to implement a collaborative investigation with local actors. A reduced scale allows an accurate analysis of territorial resilience to the risk of flooding. This application on a neighborhood scale, which today is still not commonly applied [34], makes it possible to act directly on the territory and to set up new local risk management strategies. As a result, the main scale of study chosen to assess territorial resilience must be as accurate as possible: at the District scale. This scale is the basic unit used for census collection by the “Institut de la Statistique de la Polynésie Française” (ISPF). This homogeneous geographical unit has about 400 inhabitants (the equivalent of housing for 100 people).
2.2.1. Technical Resilience
Territorial resilience, defined as the capacity of a territory to maintain its functions, is mainly based on the resilience of urban technical services. The first step is the identification of the actors essential to the functioning of the territory as well as the analysis of their interdependencies (Table 2).
A collaborative analysis makes it possible to identify, in an exhaustive manner, the inputs and outputs of each urban technical service in the municipality. In addition to assessing the service’s resilience capacities, through a self-diagnosis and self-assessment grid completed with the help of the managers. The visualization of interdependencies between urban technical services is carried out using Gephi, a free software package for network analysis and visualization [41].
The breaking down of technical resilience using the capacities defined by the DS3 model (resistance, absorption, recovery) highlights the objectives of each manager according to the constraints of his system.
Resistance capacity reflects the exposure and intrinsic vulnerability of the infrastructure to the flood hazard, as estimated by the manager. Production reliability is an indicator of this vulnerability. Absorption capacity is analyzed on the basis of the risk management strategy developed by the manager as well as the autonomy of the system. Finally, the recovery capacity corresponds to the means available and the time required to bring production back into service. The different capacities of each urban technical services are analyzed on the basis of historical natural disasters (e.g., floods in Punaauia in 1981 and 2017).
2.2.2. Urban and Social Resilience
To complete this assessment of territorial resilience, using the use of indicators for the urban and social resilience analysis helps assess the socio-economic capacities of the community to resist, absorb and recover from disruption. District analysis allows for the identification of priority areas as part of a decision support process.
This quantitative data set is from the ISPF, a French Polynesian open data website (Table 3). To make this method as adaptable as possible, the statistical data is transformed into percentages and then standardized using Min-Max normalization [43] to homogenize data of different natures so that they can be compared using a similar measurement scale [32]. The values obtained range from 0 (very low resilience) to 1 (very high resilience).
Since a disaster occurs of a certain period of time [49], resilience risk management has to integrate this temporality. Indeed, the time scale is reduced to the disaster’s timeline [30].
Three scenarios are considered: before, during and after the disaster [31]. Not all indicators are included in each scenario. For example, population structure is important before (preparedness, risk perception, etc.), during (ability to move) and after the crisis. On the other hand, the employment situation has little influence before and during the disruption but is necessary for the aftermath, for rebuilding, as well as restarting economic activity.
This study is interested in the preventive measures put in place before the crisis, to anticipate (resistance capacity) possible alternatives for adaptation during the crisis (absorption capacity) and the means available and emergency plans to rebuild after the crisis, to restore (recovery capacity) [22].
2.2.3. Flooding Scenario
In order to account for these various analyses and propose concrete results, this study simulates a flooding scenario, with its consequences on the territory.
The flooding scenarios are based on those proposed by the European directive 2007/60/EC [50]: low-probability flood or extreme event scenarios; medium-probability flood (probable return period greater than or equal to one hundred years); high-probability flood. The consequences take into consideration local actors through a collaborative survey. Flood experiences can be used as a proxy for local actor preparedness to assess their reaction in case of emergency [51]. The results make it possible to identify critical infrastructures, priority neighborhoods, the necessary preventive measures and the establishment of an emergency plan.
3. Results and Discussion
The study area is an urban neighborhood in the lower Punaruu valley located in the commune Punaauia, in the peri-urban area of Papeete, the economic capital of French Polynesia. Tahiti’s population explosion and economic development has led to the urbanization of the Punaauia coastline, requiring the exploitation of the mineral resources of the Punaruu Valley, which has been redeveloped into an industrial zone.
Each player has a different strategy, often self-centered, for dealing with the risk of flooding, with different emphasis on each capacity for resilience (Table 4).
The Punaruu Valley is the second largest watershed in Tahiti covering an area of 43.2 km2. Due to the sharp topography of the valley, the Punaruu follows a torrential regime in the event of heavy rainfall, with a rapid rise in water levels and equally rapid fall. Hence, the neighborhood is located within an area that is subjected to flooding [1]. Tropical rainfalls and cyclones produce hazardous flood situations in the neighborhood and generally in the industrial zone. Moreover, previous years have demonstrated that the area is also affected by pluvial floods. The greatest flood recorded in the Punaruu was in 1981, during hurricane Thamar with a maximum flow rate of 460 m3/s [52].
The lower valley of the Punaruu River is a strategic sector since it is home to 43 Installations Classified for the Protection of the Environment within an industrial zone: The Electricité de Tahiti (EDT) thermal power plant provides 80% of the island’s annual production of electrical energy; the Brasserie de Tahiti (BdT), the 4th largest Polynesian company, produces 95% of the beer consumed in the country and produces 50% of the non-alcoholic beverages. Upstream of the lower valley, a dam provides drinking water supply to several thousand households in the neighborhood. The stability of the dam is threatened by significant erosion downstream of the structure. Establishment of industries in urban zones increases the risk of technological disasters, thus affecting both population and the infrastructure [53].
3.1. Mapping Resilience of the Punaruu Valley
Young, working, single-living individuals and families live downstream from the industrial zone: 2600 people live in the neighborhood. In the event of flooding, these people will be the first collateral damage due to the exploitation and the urbanization of the Punaruu Valley.
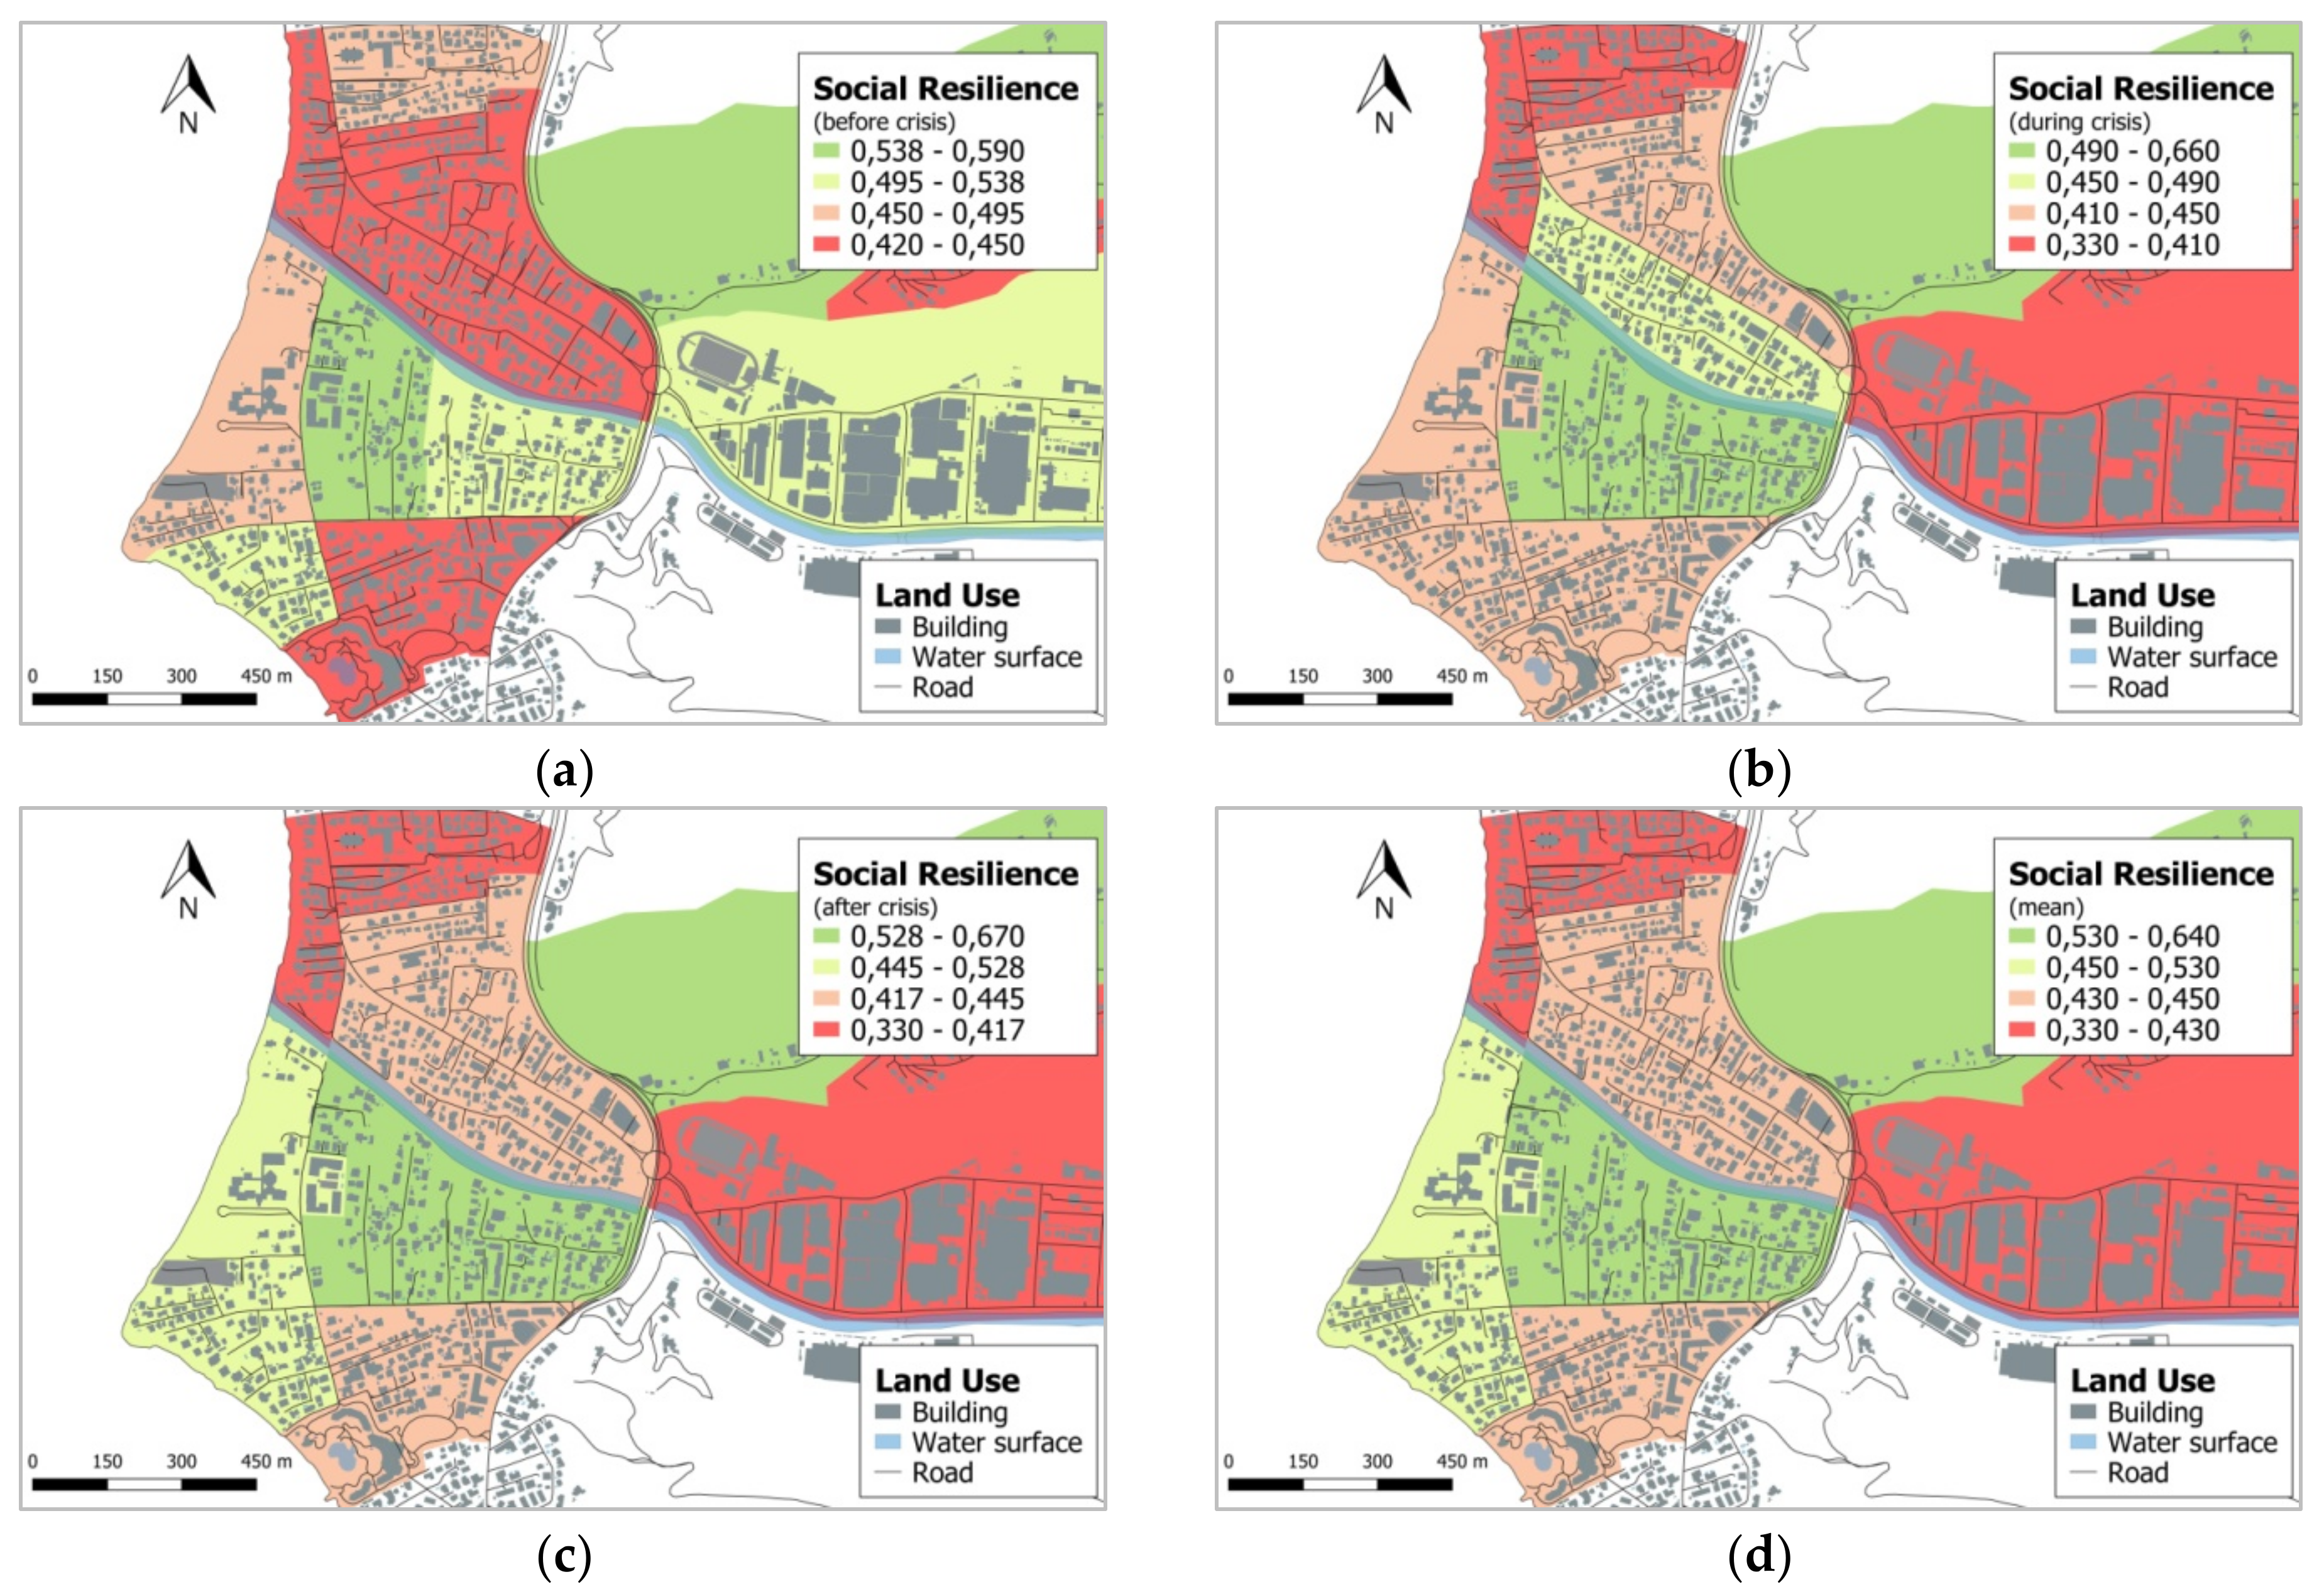
Social resilience appears to be heterogeneous across districts of Punaruu (Figure 3). The industrial zone and districts on the right bank appear to be relatively less resilient. In these districts, the unemployment rate is high and the level of education is relatively low.
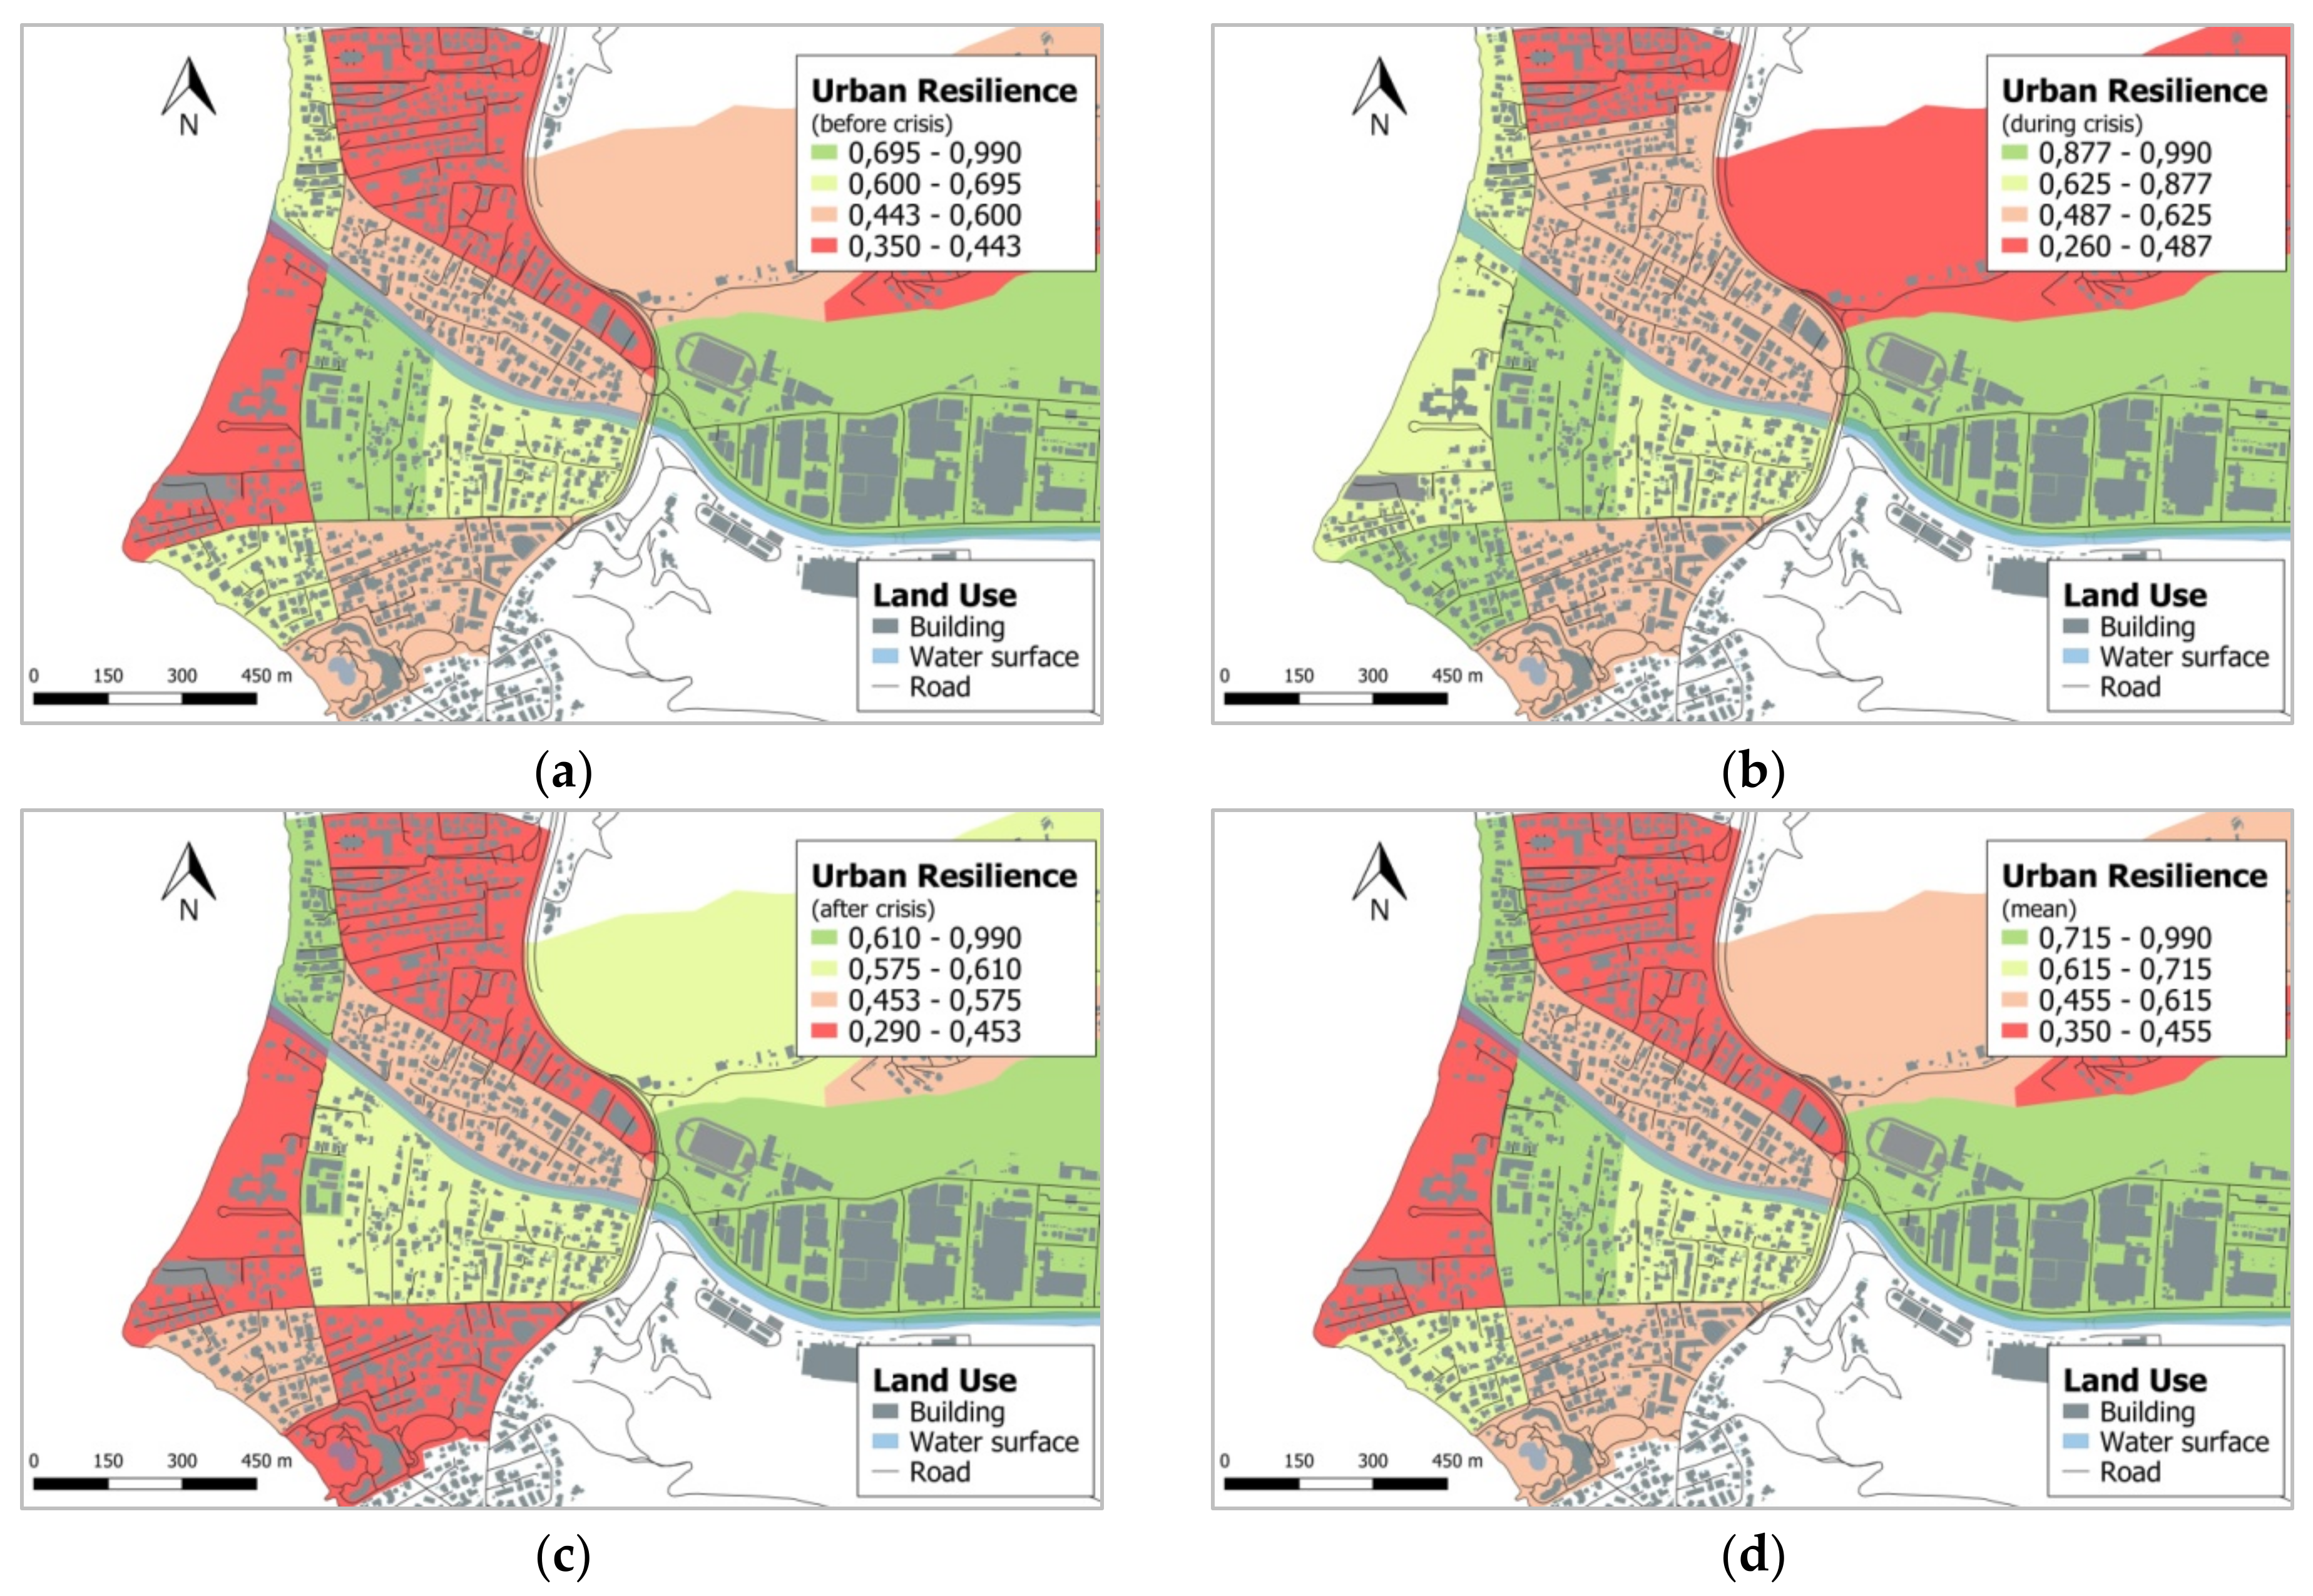
Urban resilience appears to be very heterogeneous between districts (Figure 4). A percentage of 63.3% of residences were built before 2002 and 21.9% are made of wood and are therefore particularly vulnerable to flooding.
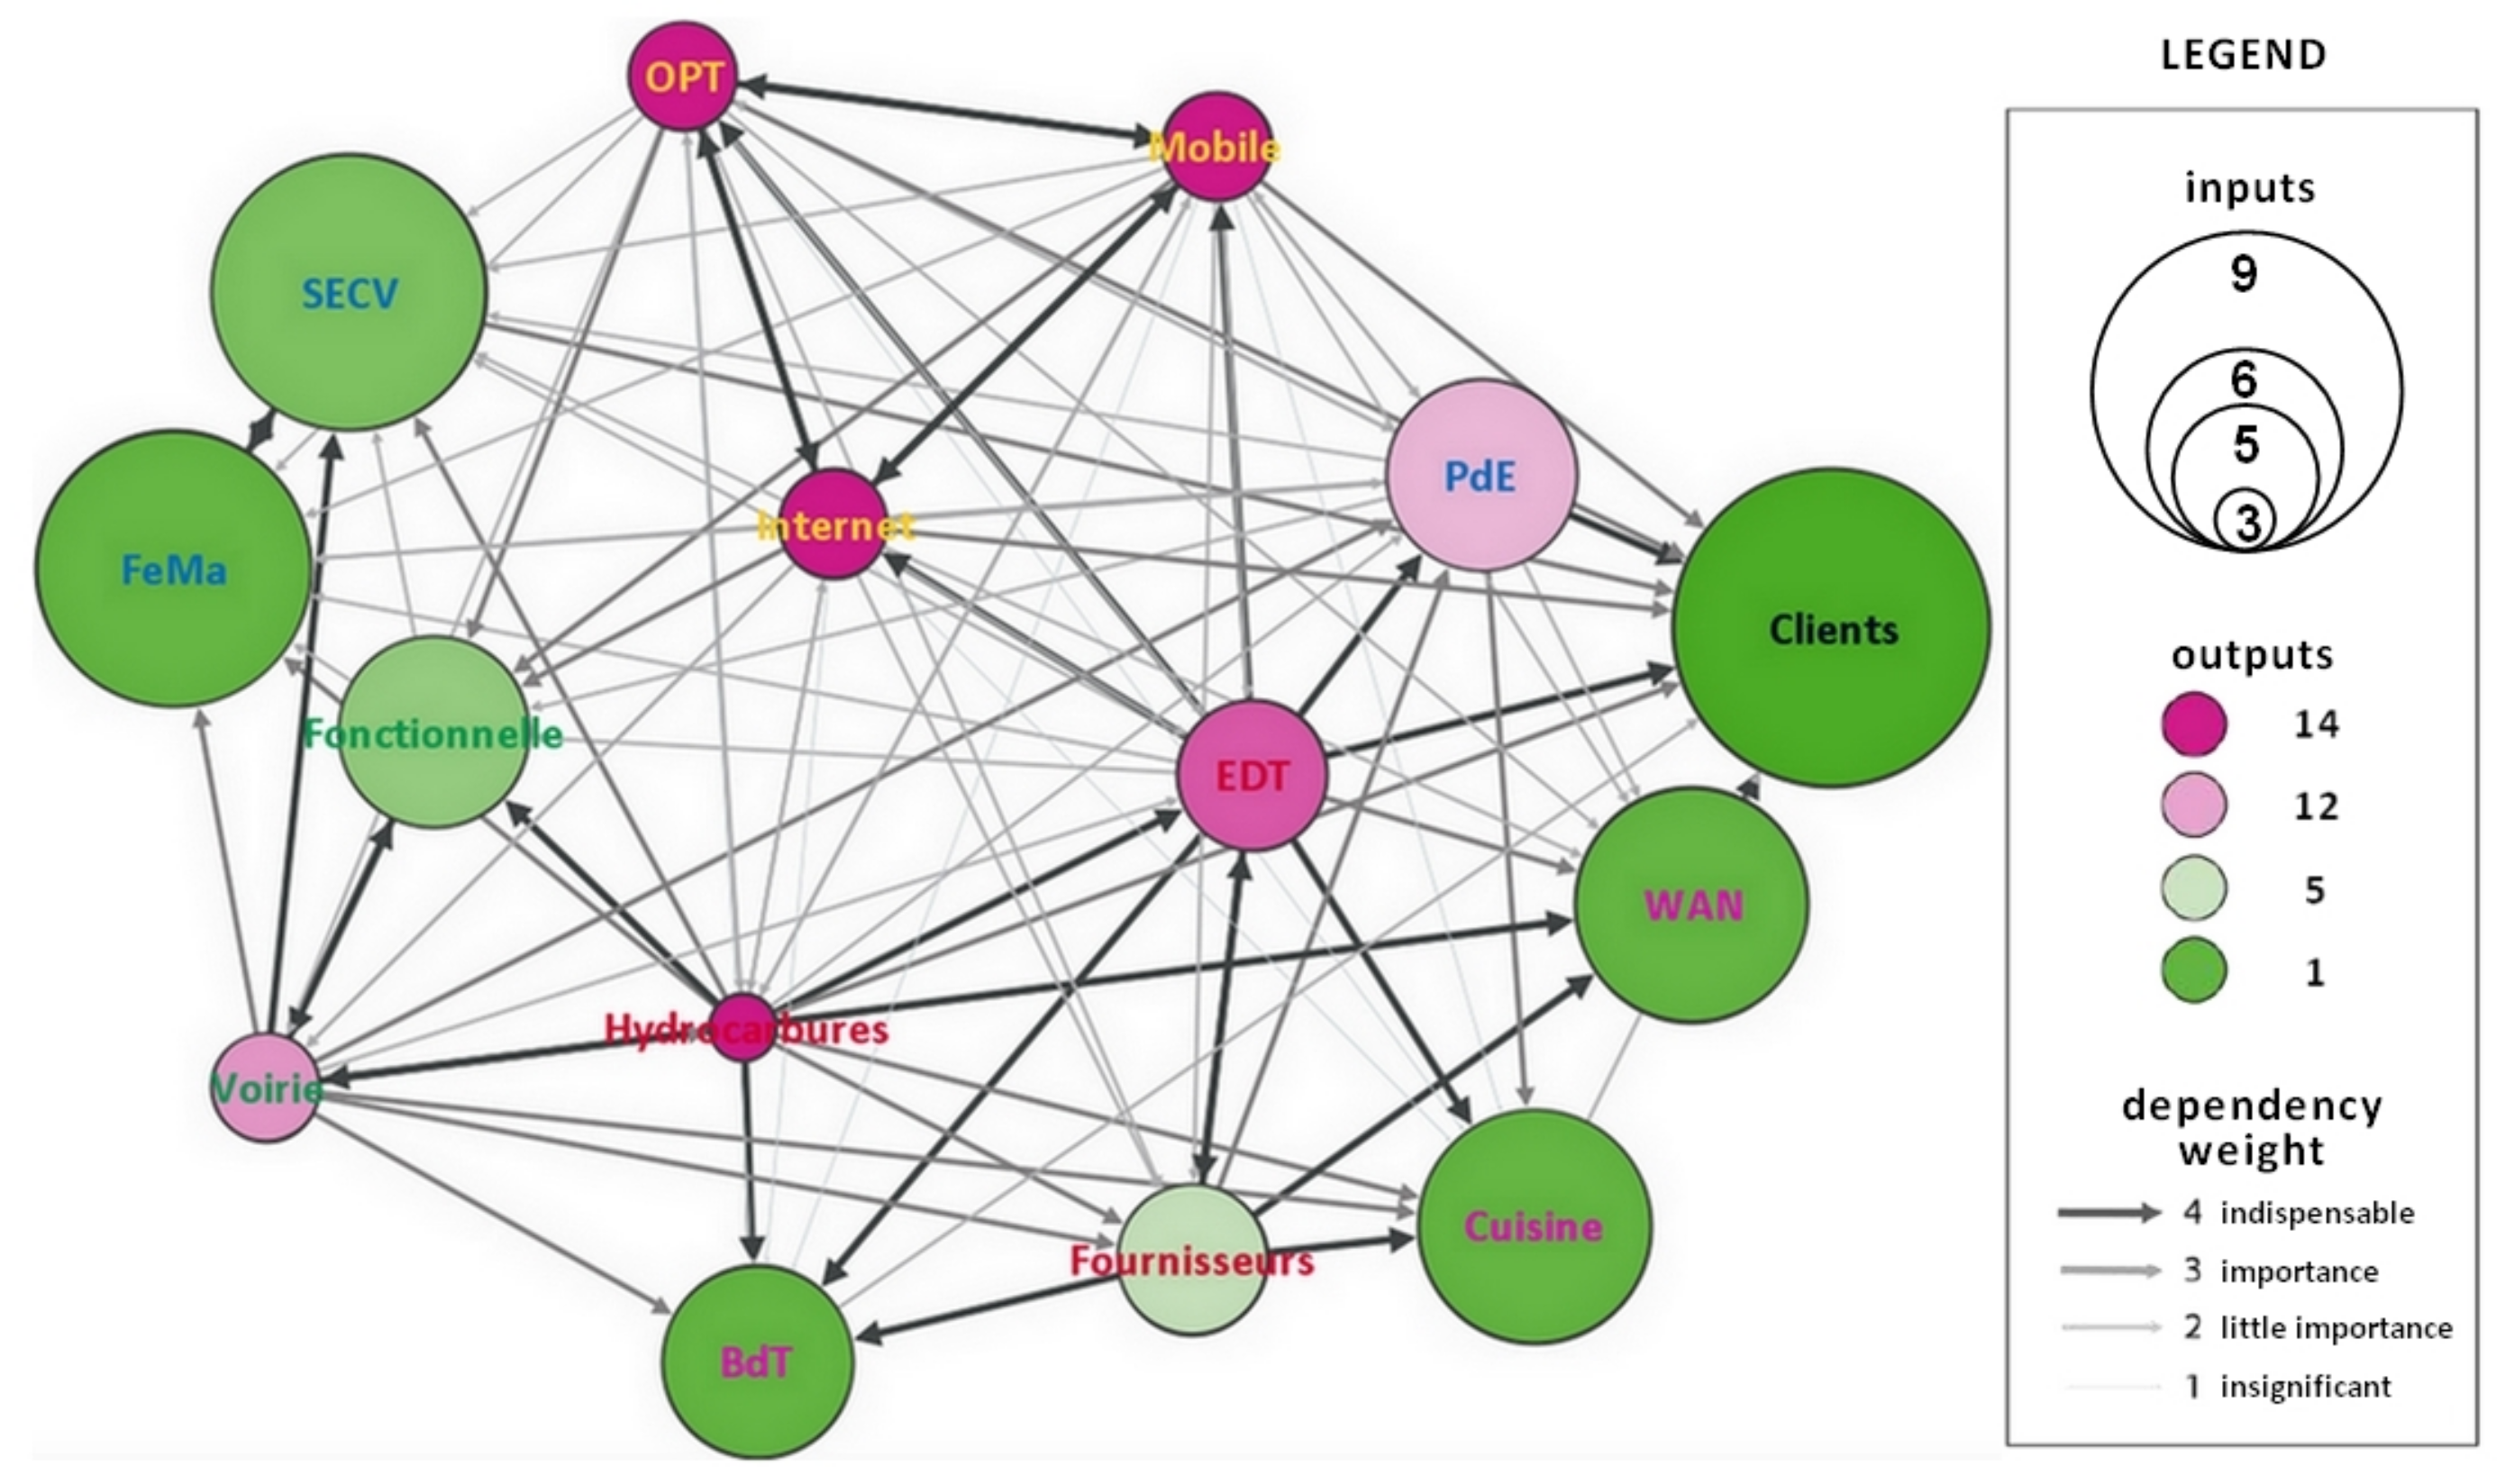
The industrial zone is characterized by a dense mix of different services: a thermal power station, a drinking water supply catchment, and other private activities (beer production, bank, landfill sites, etc.). Important significant connections have been identified concerning critical infrastructures like the telecommunication network, water supply, power plant and transport network (Figure 5).
The structural analysis of these interdependencies makes it possible to highlight the propagation and/or failure potential of each technical service within the urban system as a whole [18]. Defining the influence and dependency of each system makes it possible to prioritize as part of a risk management strategy in order to target the essential components to ensure the proper functioning of all technical services.
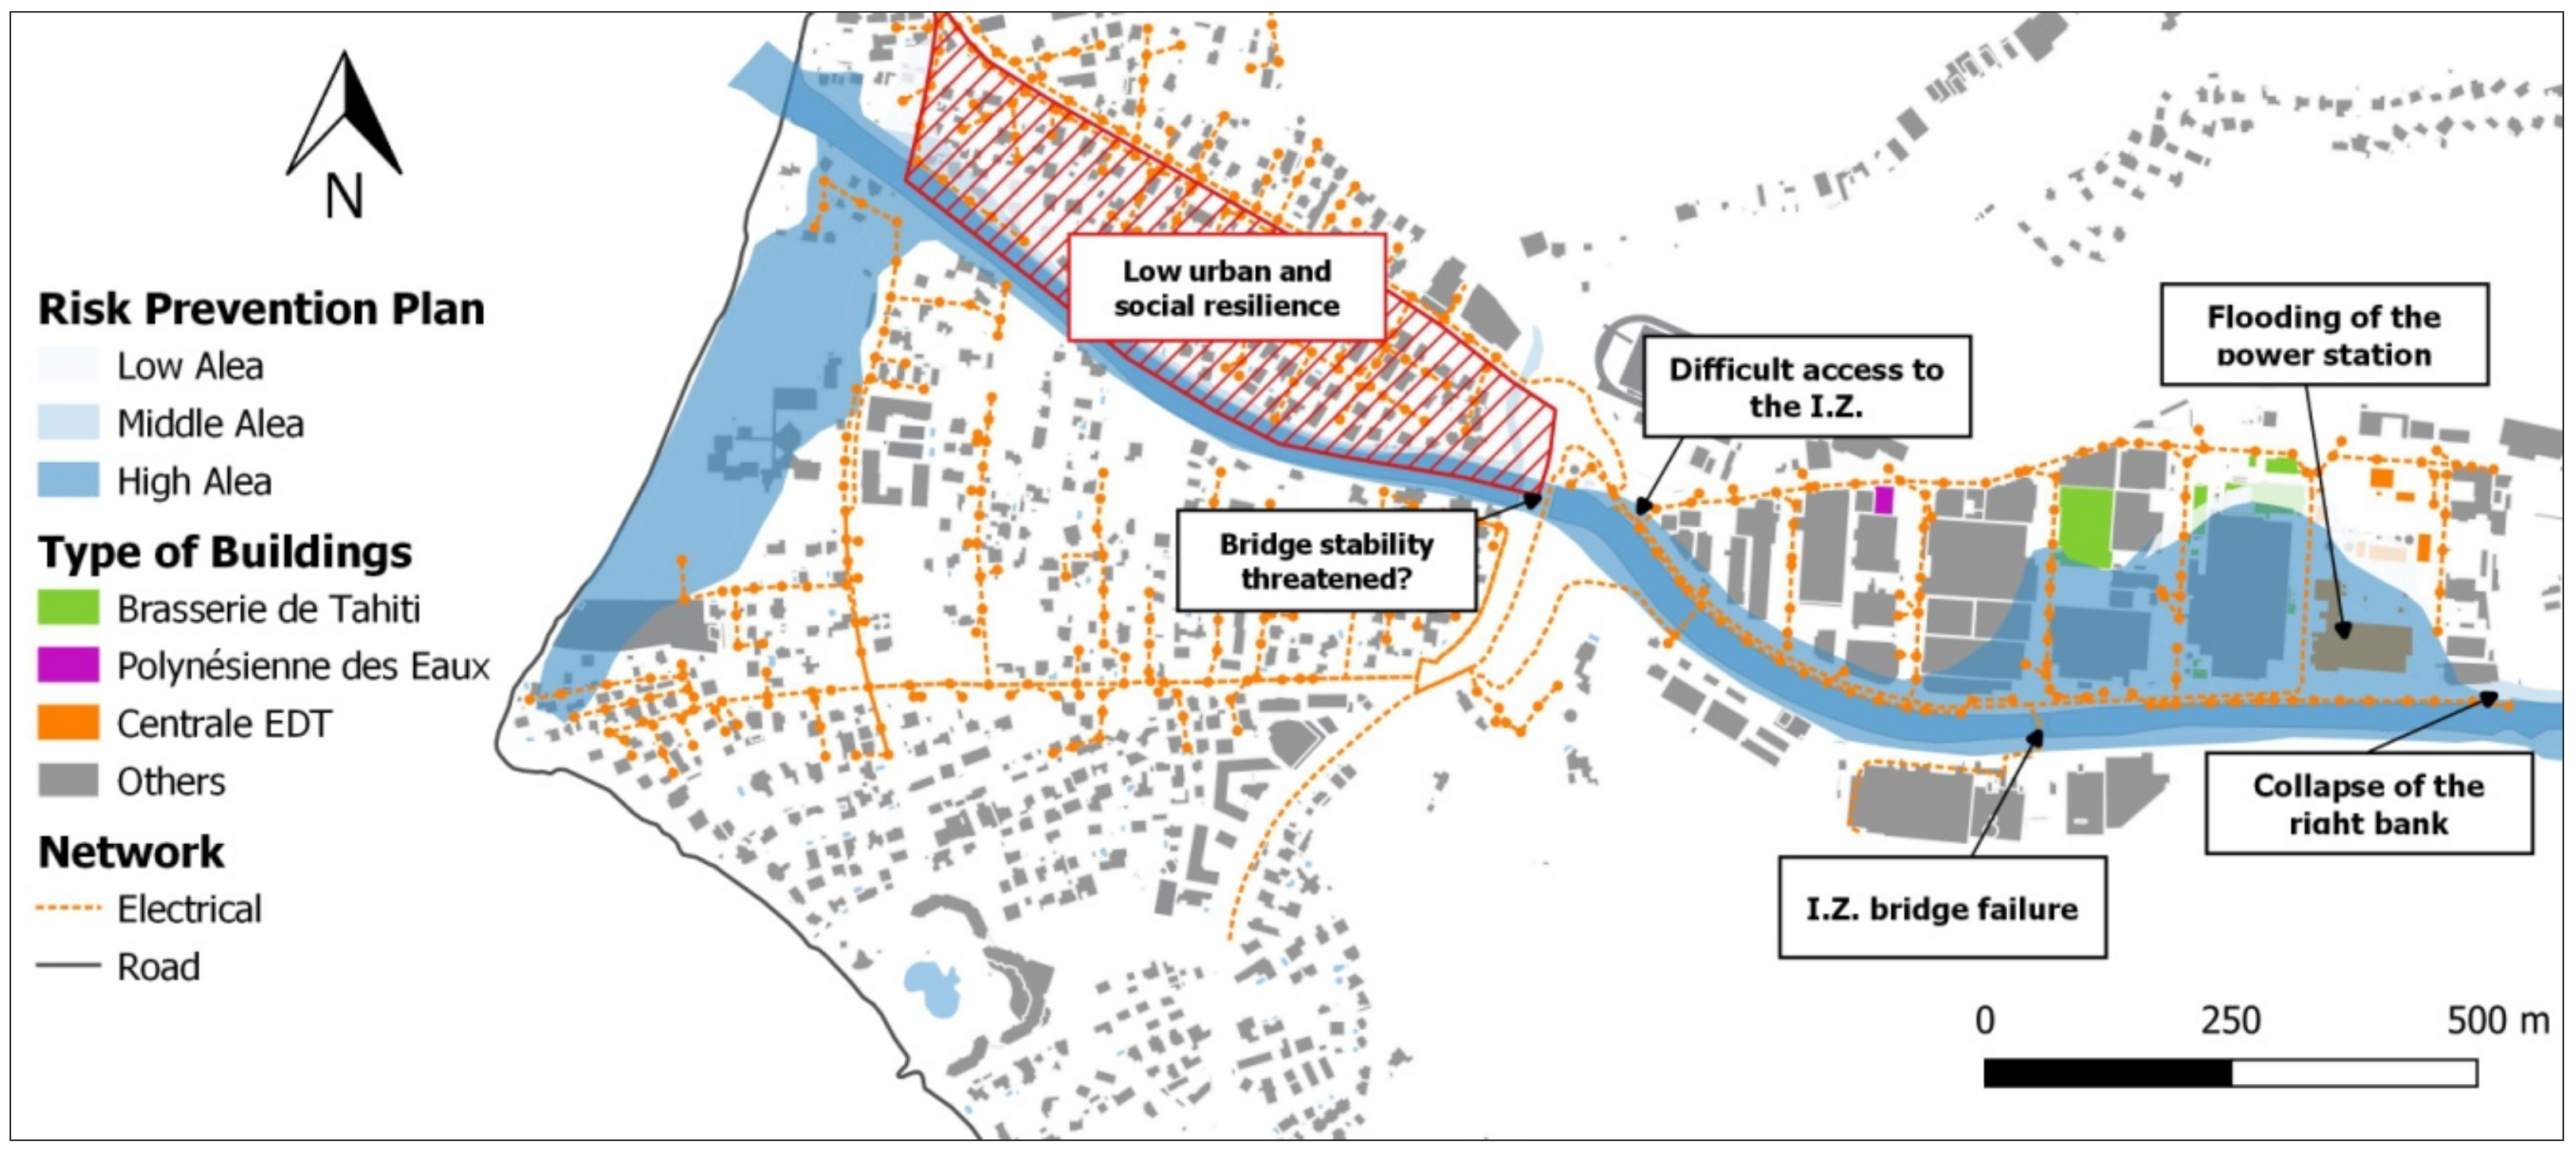
The combination of the results obtained makes it possible to simulate different scenarios in the event of flooding, for example a 100-year flood in this case (Figure 6), and to map the flood risk and its associated risks in order to produce a decision-support tool that can be understood by all actors.
3.2. Towards a Spatial Support Decision
The evaluation of the territorial resilience of the Punaruu Valley to flood risk allows for the proposal of new developments, new alternatives and the renewal of emergency plans in order to improve territorial resilience (Table 5).
Dividing territorial resilience into three categories (urban, social and technical) makes it possible to target a specific component of the territory and facilitates the understanding of the concept of resilience for all local actors. Applying a global approach to resilience [31] on a sufficiently fine scale [28,29] allows for an appropriation of the concept by managers and citizens.
The application of the concept of resilience as a risk management strategy should be effective and sustainable in time and space, and allow for decision support. This is why the scientific project pacific Island Long Term reSilience ILOTS, a research project carried out by the “Institut de Recherche pour le Développement” (IRD) and the “Centre National de la Recherche Scientifique” (CNRS), has defined as an objective to create a Resilience Observatory in order to respond to these issues in French Polynesia.
The main mission of this observatory would be the creation, identification and measurement of characteristic indicators of territorial resilience [54] as well as the publication and dissemination of these results. The observatory would be in charge of providing a coherent and complete vision of the territory, notably by identifying the interactions and interdependencies between the different components of the “Polynesian system.” Because the risk culture of a community plays a major role in decision making in urban flood plains, [55] the observatory would associate the various actors of the country, including governance, urban technical services, businesses, the scientific community and citizens, in order to improve its effectiveness and to promote transparency, understanding, acceptance and the application of a policy of sustainable management of the territory resulting from these analyses.
Thus, this study is part of this observatory by testing and applying some existing tools for operationalizing resilience and propose a general methodology adapted to French Polynesia. Although this methodology requires further efforts, this model serves as a first step in creating an observatory of resilience to the flood risks in French Polynesia, subject to various constraints specific to island territories (natural, economic, etc.).
As a spatial decision support tool, the DS3 model allows for the identification of critical infrastructures whose malfunctioning would threaten the security, economy, lifestyle and/or public health [37]. This model was built to be reproducible.
Because of its transdisciplinarity, the use of the DS3 model can be complex, particularly through the use of dependability analysis or graph theory. A detailed analysis of all the levels of a system is time-consuming and requires options. In this study, the DS3 model will be used more as a global vision of the concept of resilience, applicable at several levels of the territory [28], rather than for its technical-functional tools.
It appears necessary to broaden the approach to the concept and its analysis in order to promote understanding and adoption of the concept. However, this perspective does not provide a comprehensive approach to the resilience of a territory which must take into account other components of the territory, other than technical. This is why this methodology is complemented with an approach that takes into account the social and urban components of a territory [31].
4. Conclusions
This article proposes a methodology intended to operationalize the concept of resilience in French Polynesia, in the context of climate change and the increasing vulnerability of island territories to flood risk. It proposes the first assessment of the territorial resilience of a Polynesian territory through the case of the Punaruu Valley.
This methodology is divided into two stages. First, the modeling and assessment of territorial resilience through three tools, already applied in urban and metropolitain territories, but separately. The innovative combination of these measurement indicators enables an approach to territorial resilience in an exhaustive way on the basis of social, technical and urban criteria. Secondly, we used geovisualization techniques to map the flood risk and its associated risks in the Punaruu Valley in order to build a spatial decision support system accessible and understandable to local stakeholders. The aim is to use the principles of visualization of geovisualization to widely disseminate map results in order to improve operationalization of resilience in French Polynesia.
The interest and contributions of this study are of several types:
- adapting a resilience model to a small island developing state;
- the integration of local stakeholders in the design of a spatial decision support system;
- the use of public data from the Institut de la Statistique de Polynésie française (ISPF) to allow the reproducibility of the study in French Polynesia;
- the use of free and easy-to-use tools for mapping results: QGIS and Gephi;
- the production of visual and understandable maps and tables allowing dialogue with local actors;
Despite the various limitations that have been observed—notably with regard to LIght Detection And Ranging (LIDAR) data limited to the coastline, the technical and time-consuming nature of the application of the true DS3 model, and the need to explain the meaning of socio-economic indicators to the population—many perspectives are already envisaged for the future. First of all, including other natural hazards in this study, such as landslides and the risk of marine submersion could provide new and interesting perspectives. Secondly, the temporal monitoring of the terrain using Unmanned Aerial Vehicules (UAVs) would allow “real-time” monitoring of the risk, while frequently updating the hydraulic models [56]. Moreover, taking into account other socio-economic indicators and the temporal monitoring of these indicators would make it possible to observe the trend in territorial resilience. It would be interesting to quantify in economic terms the risk of areas subject to flooding events [57]. A final envisaged perspective would be to propose a systemic and in-depth study of the three resilience capacities defined by the DS3 model within the urban technical services in order to highlight the critical points, and consequently propose a methodology to improve the resistance, absorption and recovery capacities of each urban technical service. Thus, reproducing and extending this study limited in time and space through a Resilience Observatory would provide a global and coherent vision of territorial resilience to the flood risk in French Polynesia. The design of a resilience observatory would make it possible to improve knowledge of the territory and facilitate the understanding, acceptance and application of a sustainable land management policy. Studies are currently being carried out for this specific purpose.
Author Contributions
Conceptualization and methodology, Y.L. and C.H.; software and investigation, Y.L. and J.J.; validation, C.H. and D.S.; writing—review and editing, Y.L. and J.J.; supervision, C.H. and D.S. All authors have read and agreed to the published version of the manuscript.
Funding
This project was funded by the Centre National de la Recherche Scientifique (CNRS) through the MITI interdisciplinary programs and from the Institut de Recherche pour le Développement (IRD).
Data Availability Statement
Publicly available datasets were analyzed in this study. This data can be found here: https://www.ispf.pf.
Acknowledgments
This research was made possible thanks to the collaboration of local actors in the municipality of Punaauia and the town planning department of French Polynesia. This project has received financial support from the CNRS through the MITI interdisciplinary programs and from the IRD.
Conflicts of Interest
The authors declare no conflict of interest.
References
- SAU. Plan de Prévention des Risques naturels de Punaauia; Report from the municipality of Punaauia. 2016. Available online: http://www.punaauia.pf/ (accessed on 13 June 2020).
- Folland, C.K.; Renwick, J.A.; Salinger, M.J.; Mullan, A.B. Relative influences of the Interdecadal Pacific Oscillation and ENSO on the South Pacific Convergence Zone. Geophys. Res. Lett. 2002, 29, 21-1–21-4. [Google Scholar] [CrossRef]
- Vincent, E.M.; Lengaigne, M.; Menkes, C.E.; Jourdain, N.C.; Marchesiello, P.; Madec, G. Interannual variability of the South Pacific Convergence Zone and implications for tropical cyclone genesis. Clim. Dyn. 2011, 36, 1881–1896. [Google Scholar] [CrossRef] [Green Version]
- Pheulpin, L.; Recking, A.; Sichoix, L.; Barriot, J.-P. Extreme floods regionalisation in the tropical island of Tahiti, French Polynesia. In E3S Web of Conferences; EDP Sciences: Les Ulis, France, 2016; Volume 7, p. 01014. [Google Scholar]
- Lee, S.Y.; Dunn, R.J.K.; Young, R.A.; Connolly, R.M.; Dale, P.E.R.; DeHayr, R.; Lemckert, C.; McKinnon, S.; Powell, B.; Teasdale, P.R.; et al. Impact of urbanization on coastal wetland structure and function. Austral. Ecol. 2006, 31, 149–163. [Google Scholar] [CrossRef]
- Pheulpin, L.; Sichoix, L.; Barriot, J.; Recking, A. An example of flash-flood events in Tahiti. In Earth Observations and Societal Impacts. Adv. Meteorol. 2014. [Google Scholar] [CrossRef]
- Pheulpin, L.; Barriot, J.P.; Recking, A.; Sichoix, L. Extreme Runoff Simulation for A Small Catchment in the Tropical Island of Tahiti; EGU General Assembly Conference Abstracts: Vienna, Austria, 2016; Available online: https://hal.archives-ouvertes.fr/hal-01644056 (accessed on 10 December 2020).
- Le Point.fr. (27 January 2017). Tahiti au Ralenti Cinq Jours Après des Inondations Dévastatrices. Le Point. Available online: https://www.lepoint.fr (accessed on 10 December 2020).
- Hungr, O.; Morgan, G.C.; Kellerhals, R. Quantitative analysis of debris torrent hazards for design of remedial measures. Can. Geotech. J. 1984, 21, 663–677. [Google Scholar] [CrossRef]
- Lescarmontier, L.; Pen Point, S.; Wilgenbus, D.; Guilyardi, E.; Matthews, R.; Bhai Rumjaun, A.; Schluepmann, J.; Borde, B.; Niewoehner, C.; Kounkou-Arnaud, R.; et al. Special Report: Global Warming of 1.5° C—Summary for Policymakers 110; IPCC: Geneva, Switzerland, 2019; Available online: https://www.ipcc.ch/sr15 (accessed on 25 November 2020).
- Hay, J.E.; Forbes, D.L.; Mimura, N. Understanding and managing global change in small islands. Sustain. Sci. 2013, 8, 303–308. [Google Scholar] [CrossRef] [Green Version]
- Merwade, V.; Olivera, F.; Arabi, M.; Edleman, S. Uncertainty in Flood Inundation Mapping: Current Issues and Future Directions. J. Hydrol. Eng. 2008, 13, 608–620. [Google Scholar] [CrossRef] [Green Version]
- Milly, P.C.D.; Wetherald, R.T.; Dunne, K.A.; Delworth, T.L. Increasing risk of great floods in a changing climate. Nat. Cell Biol. 2002, 415, 514–517. [Google Scholar] [CrossRef]
- Zevenbergen, C.; Cashman, A.; Evelpidou, N.; Pasche, E.; Garvin, S.; Ashley, R. Urban Flood Management; CRC Press: Boca Raton, FL, USA, 2010. [Google Scholar]
- Arnell, N.W.; Gosling, S.N. The impacts of climate change on river flood risk at the global scale. Clim. Chang. 2016, 134, 387–401. [Google Scholar] [CrossRef] [Green Version]
- Briguglio, L. Small island developing states and their economic vulnerabilities. World Dev. 1995, 23, 1615–1632. [Google Scholar] [CrossRef]
- Pelling, M.; Uitto, J.I. Small island developing states: Natural disaster vulnerability and global change. Environ. Hazards 2001, 3, 49–62. [Google Scholar] [CrossRef]
- Lhomme, S. Les Réseaux Techniques Comme Vecteur de Propagation des Risques en Milieu urbain—Une Contribution Théorique et Pratique à l’analyse de la Résilience Urbaine. Ph.D. Thesis, Université Paris-Diderot–Paris VII, Paris, France, 2010. [Google Scholar]
- McNally, R.K.; Lee, S.-W.; Yavagal, D.; Xiang, W.-N. Learning the Critical Infrastructure Interdependencies through an Ontology-Based Information System. Environ. Plan. B Plan. Des. 2007, 34, 1103–1124. [Google Scholar] [CrossRef] [Green Version]
- Catane, S.G.; Abon, C.C.; Saturay, R.M.; Mendoza, E.P.P.; Futalan, K.M. Landslide-amplified flash floods—The June 2008 Panay Island flooding, Philippines. Geomorphology 2012, 169, 55–63. [Google Scholar] [CrossRef]
- Avila-Diaz, A.; Justino, F.; Wilson, A.; Bromwich, D.; Amorim, M. Recent precipitation trends, flash floods and landslides in southern Brazil. Environ. Res. Lett. 2016, 11, 114029. [Google Scholar] [CrossRef]
- Serre, D.; Heinzlef, C. Assessing and mapping urban resilience to floods with respect to cascading effects through critical infrastructure networks. Int. J. Disaster Risk Reduct. 2018, 30, 235–243. [Google Scholar] [CrossRef]
- Pregnolato, M.; Ford, A.; Wilkinson, S.M.; Dawson, R.J. The impact of flooding on road transport: A depth-disruption function. Transp. Res. Part D Transp. Environ. 2017, 55, 67–81. [Google Scholar] [CrossRef]
- Kadri, F.; Birregah, B.; Châtelet, E. The Impact of Natural Disasters on Critical Infrastructures: A Domino Effect-based Study. J. Homel. Secur. Emerg. Manag. 2014, 11, 217–241. [Google Scholar] [CrossRef]
- Rinaldi, S.M.; Peerenboom, J.P.; Kelly, T.K. Identifying, understanding, and analyzing critical infrastructure interdependencies. IEEE Control. Syst. 2001, 21, 11–25. [Google Scholar] [CrossRef]
- Morrison, A.; Westbrook, C.J.; Noble, B.F. A review of the flood risk management governance and resilience literature. J. Flood Risk Manag. 2017, 11, 291–304. [Google Scholar] [CrossRef]
- Gonzva, M.; Barroca, B.; Serre, D. Résilience des systèmes urbains: Proposition d’un cadre méthodologique pour répondre aux besoins des exploitants. Risques Urbains 2017, 17. [Google Scholar] [CrossRef] [Green Version]
- Serre, D. Advanced methodology for risk and vulnerability assessment of interdependency of critical infrastructure in respect to urban floods. E3S Web Conf. 2016, 7. [Google Scholar] [CrossRef] [Green Version]
- Toubin, M.; Laganier, R.; Diab, Y.; Serre, D. Improving the Conditions for Urban Resilience through Collaborative Learning of Parisian Urban Services. J. Urban Plan. Dev. 2015, 141. [Google Scholar] [CrossRef]
- Heinzlef, C.; Becue, V.; Serre, D. A spatial decision support system for enhancing resilience to floods: Bridging resilience modelling and geovisualization techniques. Nat. Hazards Earth Syst. Sci. 2020, 20, 1049–1068. [Google Scholar] [CrossRef] [Green Version]
- Heinzlef, C.; Becue, V.; Serre, D. Operationalizing urban resilience to floods in embanked territories—Application in Avignon, Provence Alpes Côte d’azur region. Saf. Sci. 2019, 118, 181–193. [Google Scholar] [CrossRef]
- Cutter, S.; Burton, C.G.; Emrich, C.T. Disaster Resilience Indicators for Benchmarking Baseline Conditions. J. Homel. Secur. Emerg. Manag. 2010, 7. [Google Scholar] [CrossRef]
- Heinzlef, C.; Serre, D. Urban resilience: From a limited urban engineering vision to a more global comprehensive and long-term implementation. Water Secur. 2020, 11, 100075. [Google Scholar] [CrossRef]
- Balsells, M.; Barroca, B.; Becue, V.; Serre, D. Making urban flood resilience more operational: Current practice. Proc. Inst. Civ. Eng. Water Manag. 2015, 168, 57–65. [Google Scholar] [CrossRef]
- SAU. Schéma D’aménagement Général de la Polynésie Française (SAGE). Service de l’Aménagement et de l’Urbanisme. Available online: https://www.service-public.pf/sau/ (accessed on 11 November 2020).
- Fabbri, K.P. A methodology for supporting decision making in integrated coastal zone management. Ocean Coast. Manag. 1998, 39, 51–62. [Google Scholar] [CrossRef]
- Serre, D. La ville résiliente aux inondations Méthodes et outils d’évaluation. Ph.D. Thesis, Université Paris-Est, Paris, France, 2011. Available online: https://tel.archives-ouvertes.fr/tel-00777206 (accessed on 10 December 2020).
- Heinzlef, C.; Robert, B.; Hémond, Y.; Serre, D. Operating urban resilience strategies to face climate change and associated risks: Some advances from theory to application in Canada and France. Cities 2020, 104, 102762. [Google Scholar] [CrossRef]
- Albertini, C.; Mazzoleni, M.; Totaro, V.; Iacobellis, V.; Di Baldassarre, G. Socio-Hydrological Modelling: The Influence of Reservoir Management and Societal Responses on Flood Impacts. Water 2020, 12, 1384. [Google Scholar] [CrossRef]
- Helbing, D. Globally networked risks and how to respond. Nat. Cell Biol. 2013, 497, 51–59. [Google Scholar] [CrossRef] [PubMed]
- Bastian, M.; Heymann, S.; Jacomy, M. Gephi: An Open Source Software for Exploring and Manipulating Networks. In Proceedings of the International AAAI Conference on Web and Social Media, San Jose, CA, USA, 18–20 May 2009; Volume 3, p. No. 1. [Google Scholar] [CrossRef]
- Lhomme, S.; Laganier, R.; Diab, Y.; Serre, D. La résilience de la ville de Dublin aux inondations: De la théorie à la pratique. Cybergeo 2013. [Google Scholar] [CrossRef]
- Tarabusi, E.C.; Guarini, G. An Unbalance Adjustment Method for Development Indicators. Soc. Indic. Res. 2013, 112, 19–45. [Google Scholar] [CrossRef]
- Opach, T.; Rød, J.K. Cartographic Visualization of Vulnerability to Natural Hazards. Cartogr. Int. J. Geogr. Inf. Geovis. 2013, 48, 113–125. [Google Scholar] [CrossRef]
- Gotham, K.F. The Social Roots of Risk: Producing Disasters, Promoting Resilience by Kathleen J. Tierney. Am. J. Sociol. 2015, 121, 646–648. [Google Scholar] [CrossRef]
- Mileti, D. Disasters by Design: A Reassessment of Natural Hazards in the United States; Joseph Henry Press: Washington, DC, USA, 1999. [Google Scholar]
- Sutter, D.; Simmons, K.M. Tornado fatalities and mobile homes in the United States. Nat. Hazards 2009, 53, 125–137. [Google Scholar] [CrossRef]
- Cutter, S.L.; Ash, K.D.; Emrich, C.T. The geographies of community disaster resilience. Glob. Environ. Chang. 2014, 29, 65–77. [Google Scholar] [CrossRef]
- Boin, A. From Crisis to Disaster: Towards in Integrative Perspective; Xlibris Press: Bloomington, IN, USA, 2005; pp. 153–172. [Google Scholar]
- European Parliament. Directive 2007/60/EC of the European Parliament and of the Council of 23 October 2007 on the Assessment and Management of Flood Risks. 2007. Available online: http://data.europa.eu/eli/dir/2007/60/oj (accessed on 18 December 2020).
- Lopez, M.G.; Di Baldassarre, G.; Seibert, J. Impact of social preparedness on flood early warning systems. Water Resour. Res. 2017, 53, 522–534. [Google Scholar] [CrossRef] [Green Version]
- Lafforgue, A. Annales Hydrologiques de l’île de Tahiti de 1971 à 1986. 300; ORSTOM: Papeete, French Polynesia, 1987. [Google Scholar]
- Armenakis, C.; Nirupama, N. Estimating spatial disaster risk in urban environments. Geomat. Nat. Hazards Risk 2013, 4, 289–298. [Google Scholar] [CrossRef] [Green Version]
- Heinzlef, C.; Serre, D. Dérèglement climatique et gestion des risques en Polynésie française: Conception d’un Observatoire de la résilience. Cah. D’Outre Mer Rev. Géogr. Bordx. 2019, 72, 531–563. [Google Scholar] [CrossRef]
- Viglione, A.; Di Baldassarre, G.; Brandimarte, L.; Kuil, L.; Carr, G.; Salinas, J.L.; Scolobig, A.; Blöschl, G. Insights from socio-hydrology modelling on dealing with flood risk—Roles of collective memory, risk-taking attitude and trust. J. Hydrol. 2014, 518, 71–82. [Google Scholar] [CrossRef]
- Annis, A.; Nardi, F.; Petroselli, A.; Apollonio, C.; Arcangeletti, E.; Tauro, F.; Belli, C.; Bianconi, R.; Grimaldi, S. UAV-DEMs for Small-Scale Flood Hazard Mapping. Water 2020, 12, 1717. [Google Scholar] [CrossRef]
- Apollonio, C.; Bruno, M.F.; Iemmolo, G.; Molfetta, M.G.; Pellicani, R. Flood Risk Evaluation in Ungauged Coastal Areas: The Case Study of Ippocampo (Southern Italy). Water 2020, 12, 1466. [Google Scholar] [CrossRef]
Figure 1.
The DS3 Model allows three levels of analysis [28].
Figure 1.
The DS3 Model allows three levels of analysis [28].

Figure 2.
Combination of the three selected models and their adaptation to the evaluation of territorial resilience in French Polynesia.
Figure 2.
Combination of the three selected models and their adaptation to the evaluation of territorial resilience in French Polynesia.

Figure 3.
Social resilience of the Punaruu Valley characterized on the basis of social resilience indicators: (a) before, (b) during, and (c) after a disturbance. (d) Average social resilience.
Figure 3.
Social resilience of the Punaruu Valley characterized on the basis of social resilience indicators: (a) before, (b) during, and (c) after a disturbance. (d) Average social resilience.

Figure 4.
Urban resilience of the Punaruu Valley characterized on the basis of social resilience indicators: (a) before, (b) during, and (c) after a disturbance. (d) Average urban resilience.
Figure 4.
Urban resilience of the Punaruu Valley characterized on the basis of social resilience indicators: (a) before, (b) during, and (c) after a disturbance. (d) Average urban resilience.

Figure 5.
Representation of the interdependencies of the urban technical services of the Punaruu Valley according to the force-atlas spatialization obtained from the Gephi software.
Figure 5.
Representation of the interdependencies of the urban technical services of the Punaruu Valley according to the force-atlas spatialization obtained from the Gephi software.

Figure 6.
Spatialization of the flood risk and its associated risks in the Punaruu Valley.


Table 1.
Synthesis of the objectives of the operationalization of territorial resilience in French Polynesia.
Table 1.
Synthesis of the objectives of the operationalization of territorial resilience in French Polynesia.
| Issues | Testing Method Reproducibility | Providing Data | Encouraging a Collaborative Approach | Training a Decision Support Process | Raising Awareness of Resilience among Local Actors |
|---|---|---|---|---|---|
| Spatialization of flood risk | X | X | - | X | - |
| Indicators of urban and social resilience [14,17] | X | X | X | X | - |
| Technical resilience capacities [16] | X | X | X | X | X |
| Interdependencies urban technical services [11] | X | X | X | X | X |
Table 2.
Example of urban services encountered in Punaauia, status and functions adapted from (Toubin, 2014) [29].
Table 2.
Example of urban services encountered in Punaauia, status and functions adapted from (Toubin, 2014) [29].
| Id | Designation | Meaning of the Acronym | Main Service Provided | Function |
|---|---|---|---|---|
| 1 | EDT Engie | Electricité de Tahiti | Electricity | Management of the public electricity distribution network |
| 2 | PdE | Polynésienne des Eaux | Drinking water Sanitation | Management of the public water production, distribution and sanitation service in the municipalities of Punaauia, Faa’a and Paea |
| 3 | FeMa | Fenua Ma | Waste treatment | Treatment and recycling of community waste |
| 4 | Voirie | Service du Patrimoine | Transport | Urban space planning, traffic organization |
| 5 | OPT | Office des Postes et Télécommunications | Telecommunications | Telephone and Internet operator |
| 6 | BdT | Brasserie de Tahiti | Beverages | Production and distribution of beverages |
| 7 | WAN | Groupe WAN | Food | Distribution of food products in supermarkets |
Table 3.
Example of data selection, sources and references, adapted from (Heinzlef et al., 2019).
| Resilience Indicators | Variables | Sources | Impact on Resilience | Justification |
|---|---|---|---|---|
| Social resilience indicator | Population structure | |||
| 00–09 years old | ISPF | Negative | (Cutter et al., 2010; Opach and Rød, 2013) [32,44] | |
| 10–59 years old | ISPF | Positive | ||
| More than 60 years old | ISPF | Negative | ||
| Employment status | ||||
| Unemployed | ISPF | Negative | (Tierney, 2014) [45] | |
| No professional activity | ISPF | Negative | ||
| Employee | ISPF | Positive | ||
| Educational attainment | ||||
| Exit before the 3rd grade | ISPF | Negative | (Heinzlef et al., 2019) [30] | |
| Bac and better | ISPF | Positive | ||
| Urban resilience indicator | Date of construction of main residences | |||
| Built before 1997 | ISPF | (Mileti, 1999; Cutter et al., 2010; Opach and Rød, 2013) [32,44,46] | ||
| Built from 1997 to 2002 | ISPF | Negative | ||
| Built after 2002 | ISPF | Positive | ||
| Composition of the walls of main residences | ||||
| Hard: cinder block, cement | ISPF | Positive | (Sutter and Simmons, 2010; Cutter et al., 2014) [47,48] | |
| Wood | ISPF | Negative | ||
| Others | ISPF | Negative | ||
| Equipment | ||||
| Running water | ISPF | Positive | (Cutter et al., 2010) [32] | |
| Electricity | ISPF | Positive | ||
| Computer | ISPF | Positive | ||
| Internet connection | ISPF | Positive | ||
Table 4.
Application of the DS3 model and the results of a collaborative study with the urban technical services of the Punaruu valley, in the face of the centennial flood, without taking into account interdependencies.
Table 4.
Application of the DS3 model and the results of a collaborative study with the urban technical services of the Punaruu valley, in the face of the centennial flood, without taking into account interdependencies.
| Resistance (before the Crisis) | Absorption (during the Crisis) | Recovery (after the Crisis) | ||||
|---|---|---|---|---|---|---|
| EDT | Flood zone power plant Underground network and protected posts, risk in case of carriage The network must not be in contact with water | Single power station supplies area Interruption of production (if water height > 50 cm) The network’s meshing makes it possible to bypass some impacted areas | Significant staff and resources Return-to-Service Time < 4 h after securing the system (cleaning and inspection) | |||
| PdE | Factory outside the flood zone Underground network protected except risk of bank erosion Dam stability threatened | Interruption of sanitation Pumping into the water table is started The mesh of the network makes it possible to target distribution | Continuity of service Limited damages except in the case of major haulage operations | |||
| FeMa | Transfer station outside the flood zone | Closing of the site Direct transfer of waste to Motu Uta and Paihoro landfill site | Uncertainty | |||
| Voirie | The gutters must not be flooded or obstructed. Paths locally protected by gabion walls The bridge of the Industrial Zone appears vulnerable | The mesh size is important except for the Punaruuu river crossings and the exit of the Industrial Zone | Significant staff and resources Track cleaning can take a long time Restoration of uncertain traffic flow in case of bridge destruction | |||
| OPT | The network must not be in contact with water | Highly meshed network Coverage provided in the territory | Significant staff and resources | |||
| BdT | Several workshops in flood-prone areas Elevated equipment Routine machine maintenance | Factory must stop Distribution ensured thanks to a safety stock (1 week) | Qualified maintenance service Time to return to production < 4 h | |||
| Legend of resilience levels | Good | Pretty good | Pretty bad | Bad | Unknown | |
Table 5.
Synthesis of ideas to improve technical, social and urban resilience in the Punaruu Valley.
Table 5.
Synthesis of ideas to improve technical, social and urban resilience in the Punaruu Valley.
| Resistance (before the Crisis) | Absorption (during the Crisis) | Recovery (after the Crisis) | ||
|---|---|---|---|---|
| Power plant | Pole and network condition monitoring Strengthening of protective walls | Diversification of power generation sites | Machine maintenance and technician training | |
| Water dam | Installation of a drainage gallery | Promote electrical autonomy (generator set) | - | |
| Road right bank | Gutter maintenance Reinforcement of protective walls Monitoring of incision and de-scoring campaigns Monitoring of scouring under the bridge | Reflection on an alternative access route | The gabion walls allow drainage out of the tracks? Benefit/cost comparison | |
| Industrial zone bridge | Monitoring of scouring under the bridge | Reflection on alternative traffic | Temporary Bridge and Reconstruction (Ex. 20 months for the Matatia Bridge) | |
| Socio-economic dynamics | Public Awareness of Risk | Design of a risk management awareness platform (Hawke’s bay Emergency Management) | Employment policy Lowering of the minimum wage/Creation of an activity bonus (Zylberberg, 2019) | |
| Urban infrastructure | Renovation of buildings Encourage the construction of hard walls rather than wooden walls | Encouraging the purchase of a computer and setting up an internet connection for teleworking | Faster rebuilding in wood than in cinder block? Benefit/cost comparison | |
| Priority level legend | Low | Moderate | High | Unknown |
Publisher’s Note: MDPI stays neutral with regard to jurisdictional claims in published maps and institutional affiliations. |
© 2021 by the authors. Licensee MDPI, Basel, Switzerland. This article is an open access article distributed under the terms and conditions of the Creative Commons Attribution (CC BY) license (http://creativecommons.org/licenses/by/4.0/).
Share and Cite
MDPI and ACS Style
Lamaury, Y.; Jessin, J.; Heinzlef, C.; Serre, D. Operationalizing Urban Resilience to Floods in Island Territories—Application in Punaauia, French Polynesia. Water 2021, 13, 337. https://doi.org/10.3390/w13030337
AMA Style
Lamaury Y, Jessin J, Heinzlef C, Serre D. Operationalizing Urban Resilience to Floods in Island Territories—Application in Punaauia, French Polynesia. Water. 2021; 13(3):337. https://doi.org/10.3390/w13030337
Chicago/Turabian StyleLamaury, Yoann, Jérémy Jessin, Charlotte Heinzlef, and Damien Serre. 2021. "Operationalizing Urban Resilience to Floods in Island Territories—Application in Punaauia, French Polynesia" Water 13, no. 3: 337. https://doi.org/10.3390/w13030337
Note that from the first issue of 2016, this journal uses article numbers instead of page numbers. See further details here.