
High-Arsenic Groundwater in Paleochannels of the Lower Yellow River, China: Distribution and Genesis Mechanisms


1
The Institute of Hydrogeology and Environmental Geology, CAGS, Shijiazhuang 050061, Hebei Province, China
2
Key Laboratory of Groundwater Contamination and Remediation of Hebei Province and China Geological Survey, Zhengding 050083, Hebei Province, China
3
School of Water Resources and Environment Engineering, East China University of Technology, Nanchang 330032, Jiangxi Province, China
*
Author to whom correspondence should be addressed.
Water 2021, 13(3), 338; https://doi.org/10.3390/w13030338
Submission received: 30 November 2020
/
Revised: 8 January 2021
/
Accepted: 26 January 2021
/
Published: 29 January 2021
(This article belongs to the Section Hydrology)
Abstract
:High–arsenic (As) groundwater poses a serious threat to human health. The upper and middle reaches of the Yellow River are well–known areas for the enrichment of high–arsenic groundwater. However, little is known about the distribution characteristics and formation mechanism of high-As groundwater in the lower reach of the Yellow River. There were 203 groundwater samples collected in different groundwater systems of the lower Yellow River for the exploration of its hydrogeochemical characteristics. Results showed that more than 20% of the samples have arsenic concentrations exceeding 10 μg/L. The high-As groundwater was mainly distributed in Late Pleistocene–Holocene aquifers, and the As concentrations in the paleochannels systems (C2 and C4) were significantly higher than that of the paleointerfluve system (C3) and modern Yellow River affected system (C5). The high-As groundwater is characterized by high Fe2+ and NH4+ and low Eh and NO3−, indicating that reductive dissolution of the As–bearing iron oxides is probably the main cause of As release. The arsenic concentrations strikingly showed an increasing tendency as the HCO3− proportion increases, suggesting that HCO3− competitive adsorption may facilitate As mobilization, too. In addition, a Gibbs diagram showed that the evaporation of groundwater could be another significant hydrogeochemical processes, except for the water–rock interaction in the study area. Different sources of aquifer medium and sedimentary structure may be the main reasons for the significant zonation of the As spatial distribution in the lower Yellow River.
1. Introduction
Naturally high-As (>10 μg/L) groundwater is distributed worldwide, including Vietnam, India, Bangladesh, Thailand, China, USA, Argentina, and Mexico, among others [1]. Arsenic is a notorious toxicant and carcinogen that causes serious illnesses, including lung and skin cancer [2], and the drinking water guideline value for As is 10 μg/L according to the World Health Organization [3]. The mechanisms of As release into groundwater mainly include reductive dissolution of As–bearing iron oxide minerals, arsenic desorption in high pH conditions, bicarbonate and phosphate competitive adsorption with arsenic, and oxidation of pyrite [4,5,6,7,8,9].
A lot of research shows that the paleochannel aquifers of alluvial plains are subject to As contamination in groundwater, such as the Red River [10,11], Mekong River [12,13], and Ganges River [14,15] in South and Southeast Asia, and the Yellow River [16,17] and Yangtze River [18,19] in China. In the Red River delta plain, areas with high-As groundwater (10–810 μg/L) are distributed in a 20-km-wide band along the NW–SE boundary of the plain, which is consistent with the location of the Red River paleochannels (9 ka B.P.) [20]. The paleochannel aquifers are characterized by high permeability and reductive conditions. McArthur et al. (2008) suggested that the paleointerfluvial aquifers were unpolluted because of protection by the impermeable paleosol from the downward migration of organic matter that drives As reductive release in the Bengal plain [14].
The Yellow River is the second largest river in China and high-As groundwater has been widely found in the mid-upper reaches of the Yellow River [21,22,23]. Investigations showed that the spatial variation in groundwater As in the Hetao Basin and Yinchuan Basin, located in the mid-upper reaches of the Yellow River, is closely related to the formation of the swing zone of the Yellow River paleochannels since the Late Pleistocene [24,25]. Vertically, high As concentrations mainly occur in shallow aquifers, with depths <40 m in these zones. Cao et al. (2018) found that the concentration of groundwater As has a positive correlation with the swing intensity of the paleo-Yellow River [24]. Nevertheless, the difference in As concentration in groundwater between the paleochannels and paleointerfluves has not been assessed. The lower Yellow River is famous for its high loose-sediment content and frequent siltation, burst, and migration, which is distinctive compared with other rivers. From the Late Pleistocene to Early Holocene, multiple paleochannels were formed with climate change [26]. However, the distribution characteristics of groundwater As in the lower Yellow River and the role of the paleochannels on it are still unknown. Shallow groundwater is the primary water supply for agricultural irrigation in the study area. High concentrations of arsenic pose a serious threat on local water safety.
Therefore, a typical profile was selected in the lower Yellow River, based on the regional hydrogeological conditions, to:
(1) investigate the spatial distribution of As in shallow groundwater;
(2) explore the hydrogeochemical characteristics and the formation mechanisms of high-As groundwater in the lower Yellow River
2. Materials and Methods
2.1. Study Area
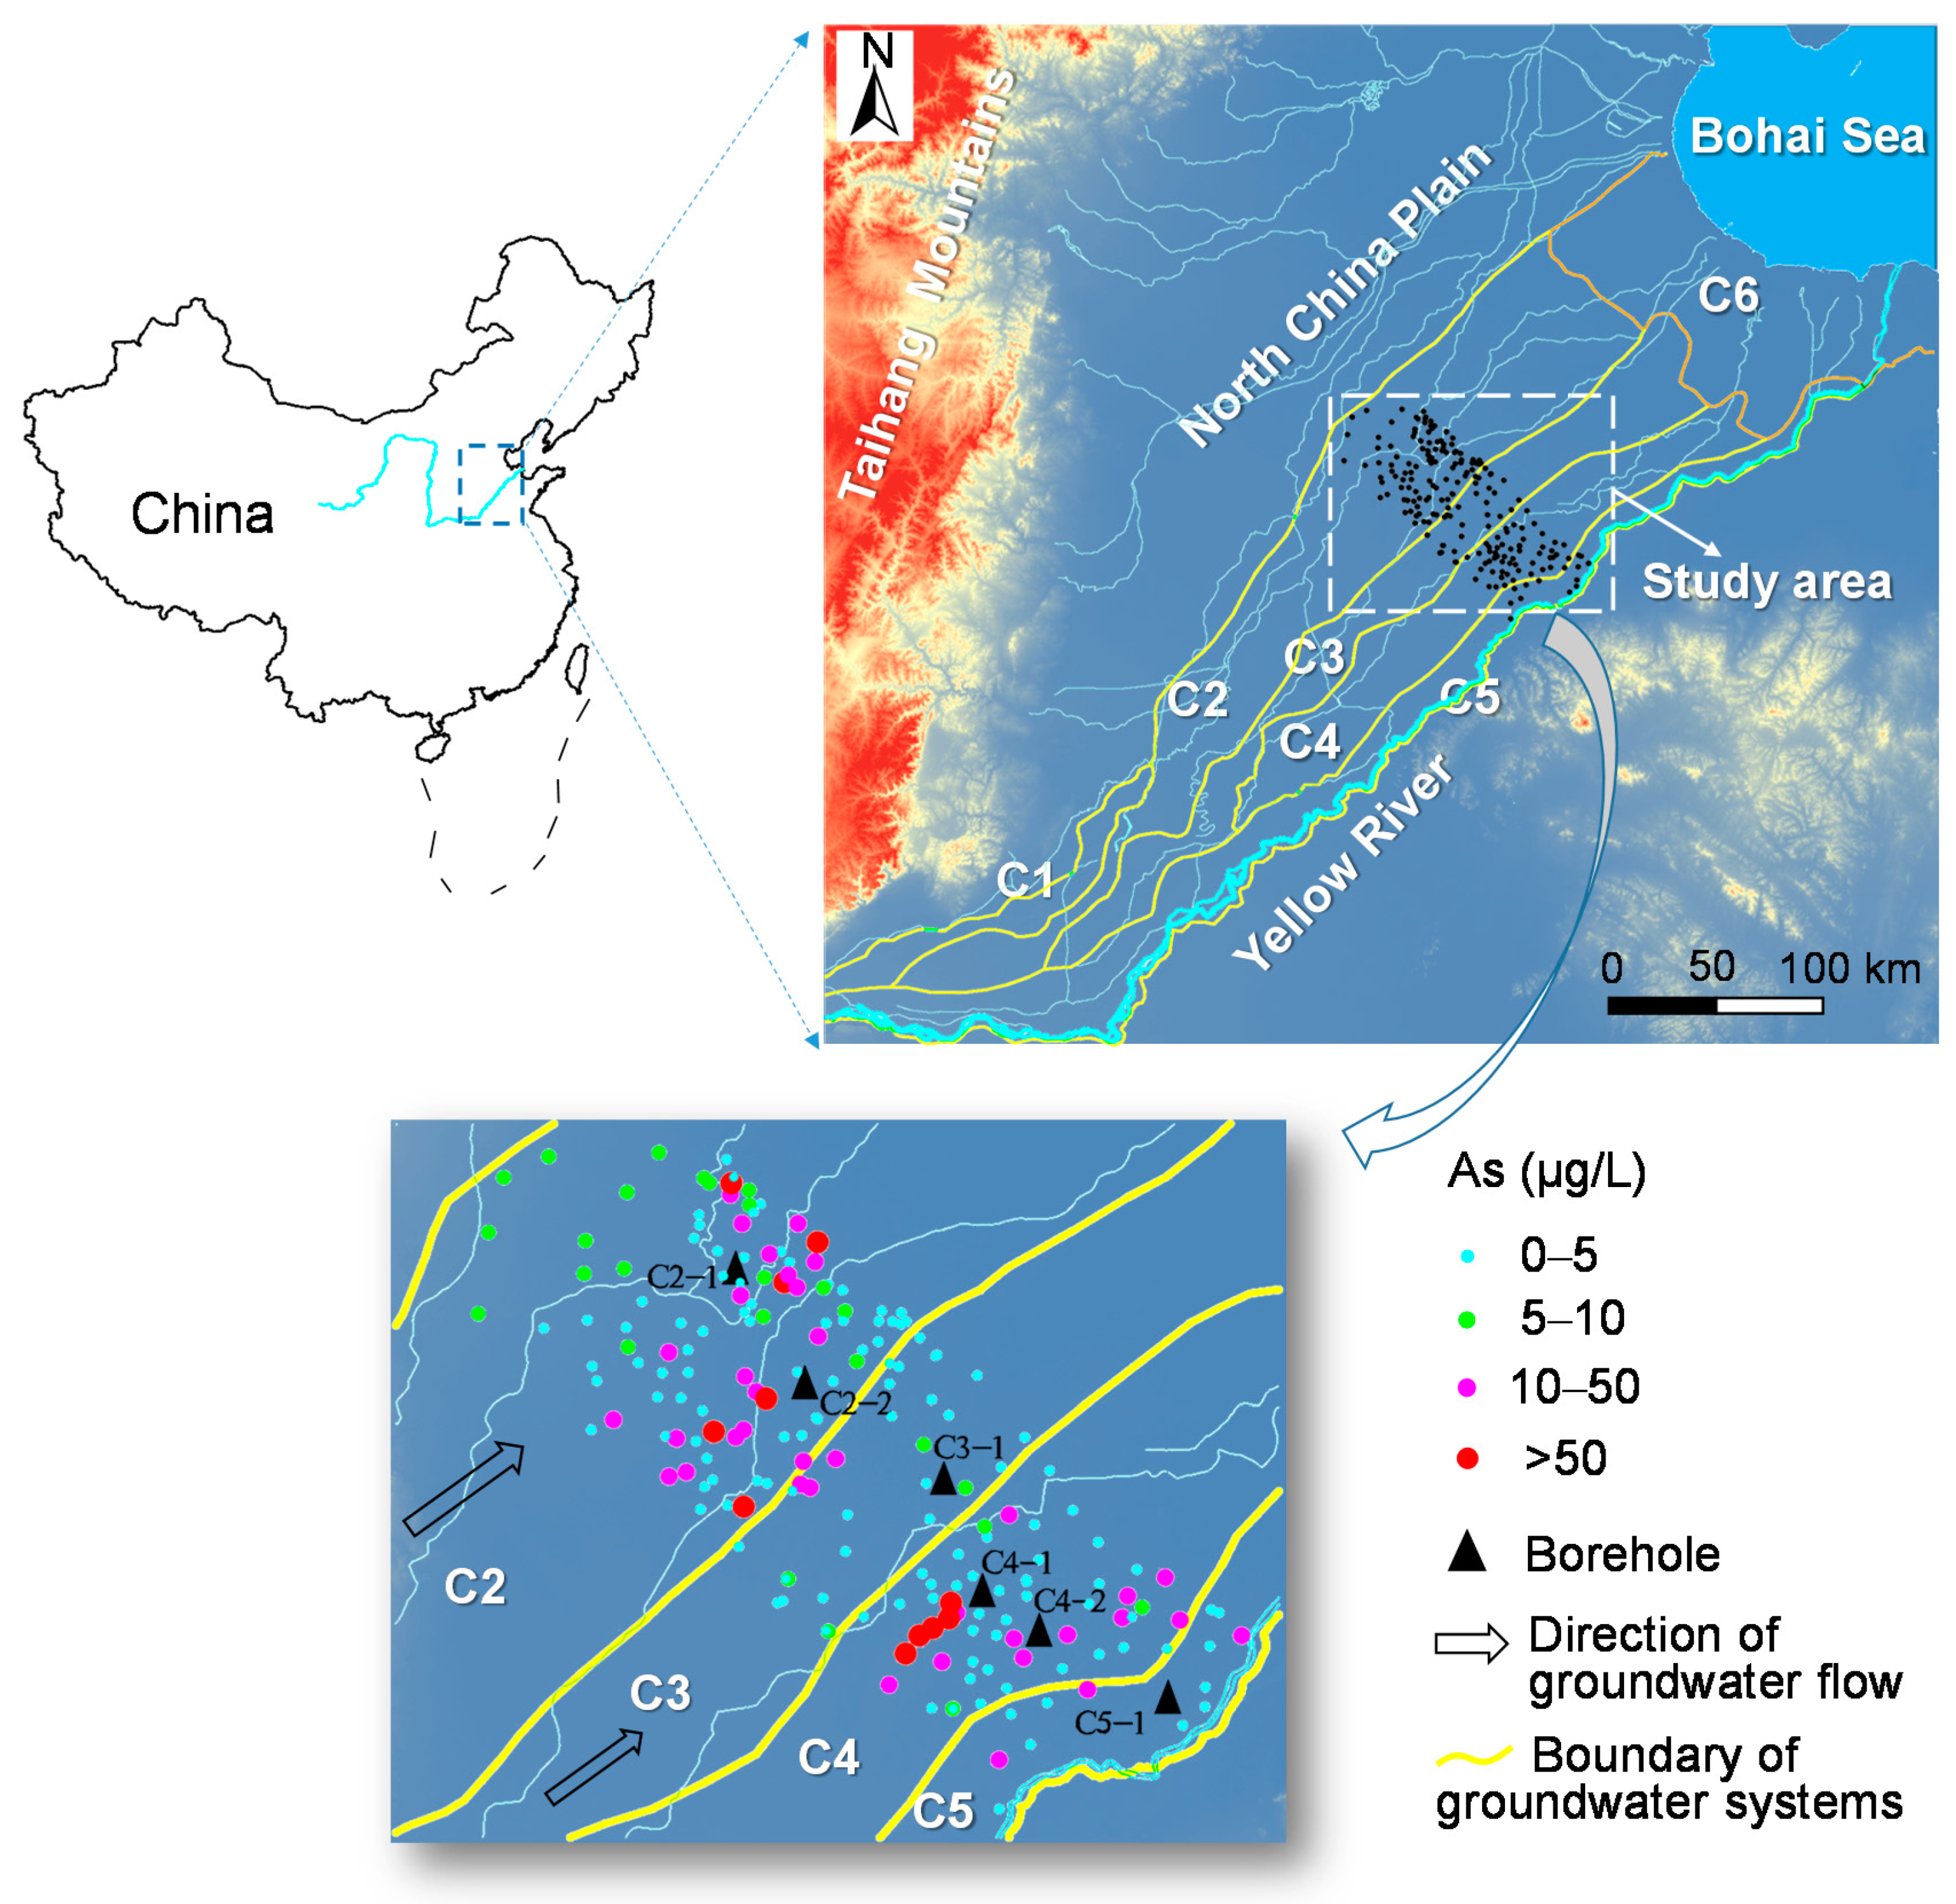
The study area is located in the alluvial plain of the lower Yellow River, bounded by the modern Yellow River in the south, Bohai Sea to the east, and Taihang Mountain to the west (Figure 1). With a warm temperate continental monsoon climate, this region has an average annual rainfall of 563 mm, far less than the average evaporation of 1500–1900 mm. The Yellow River flowing through the study area is the second largest river in China, with a length of 5464 kilometers.
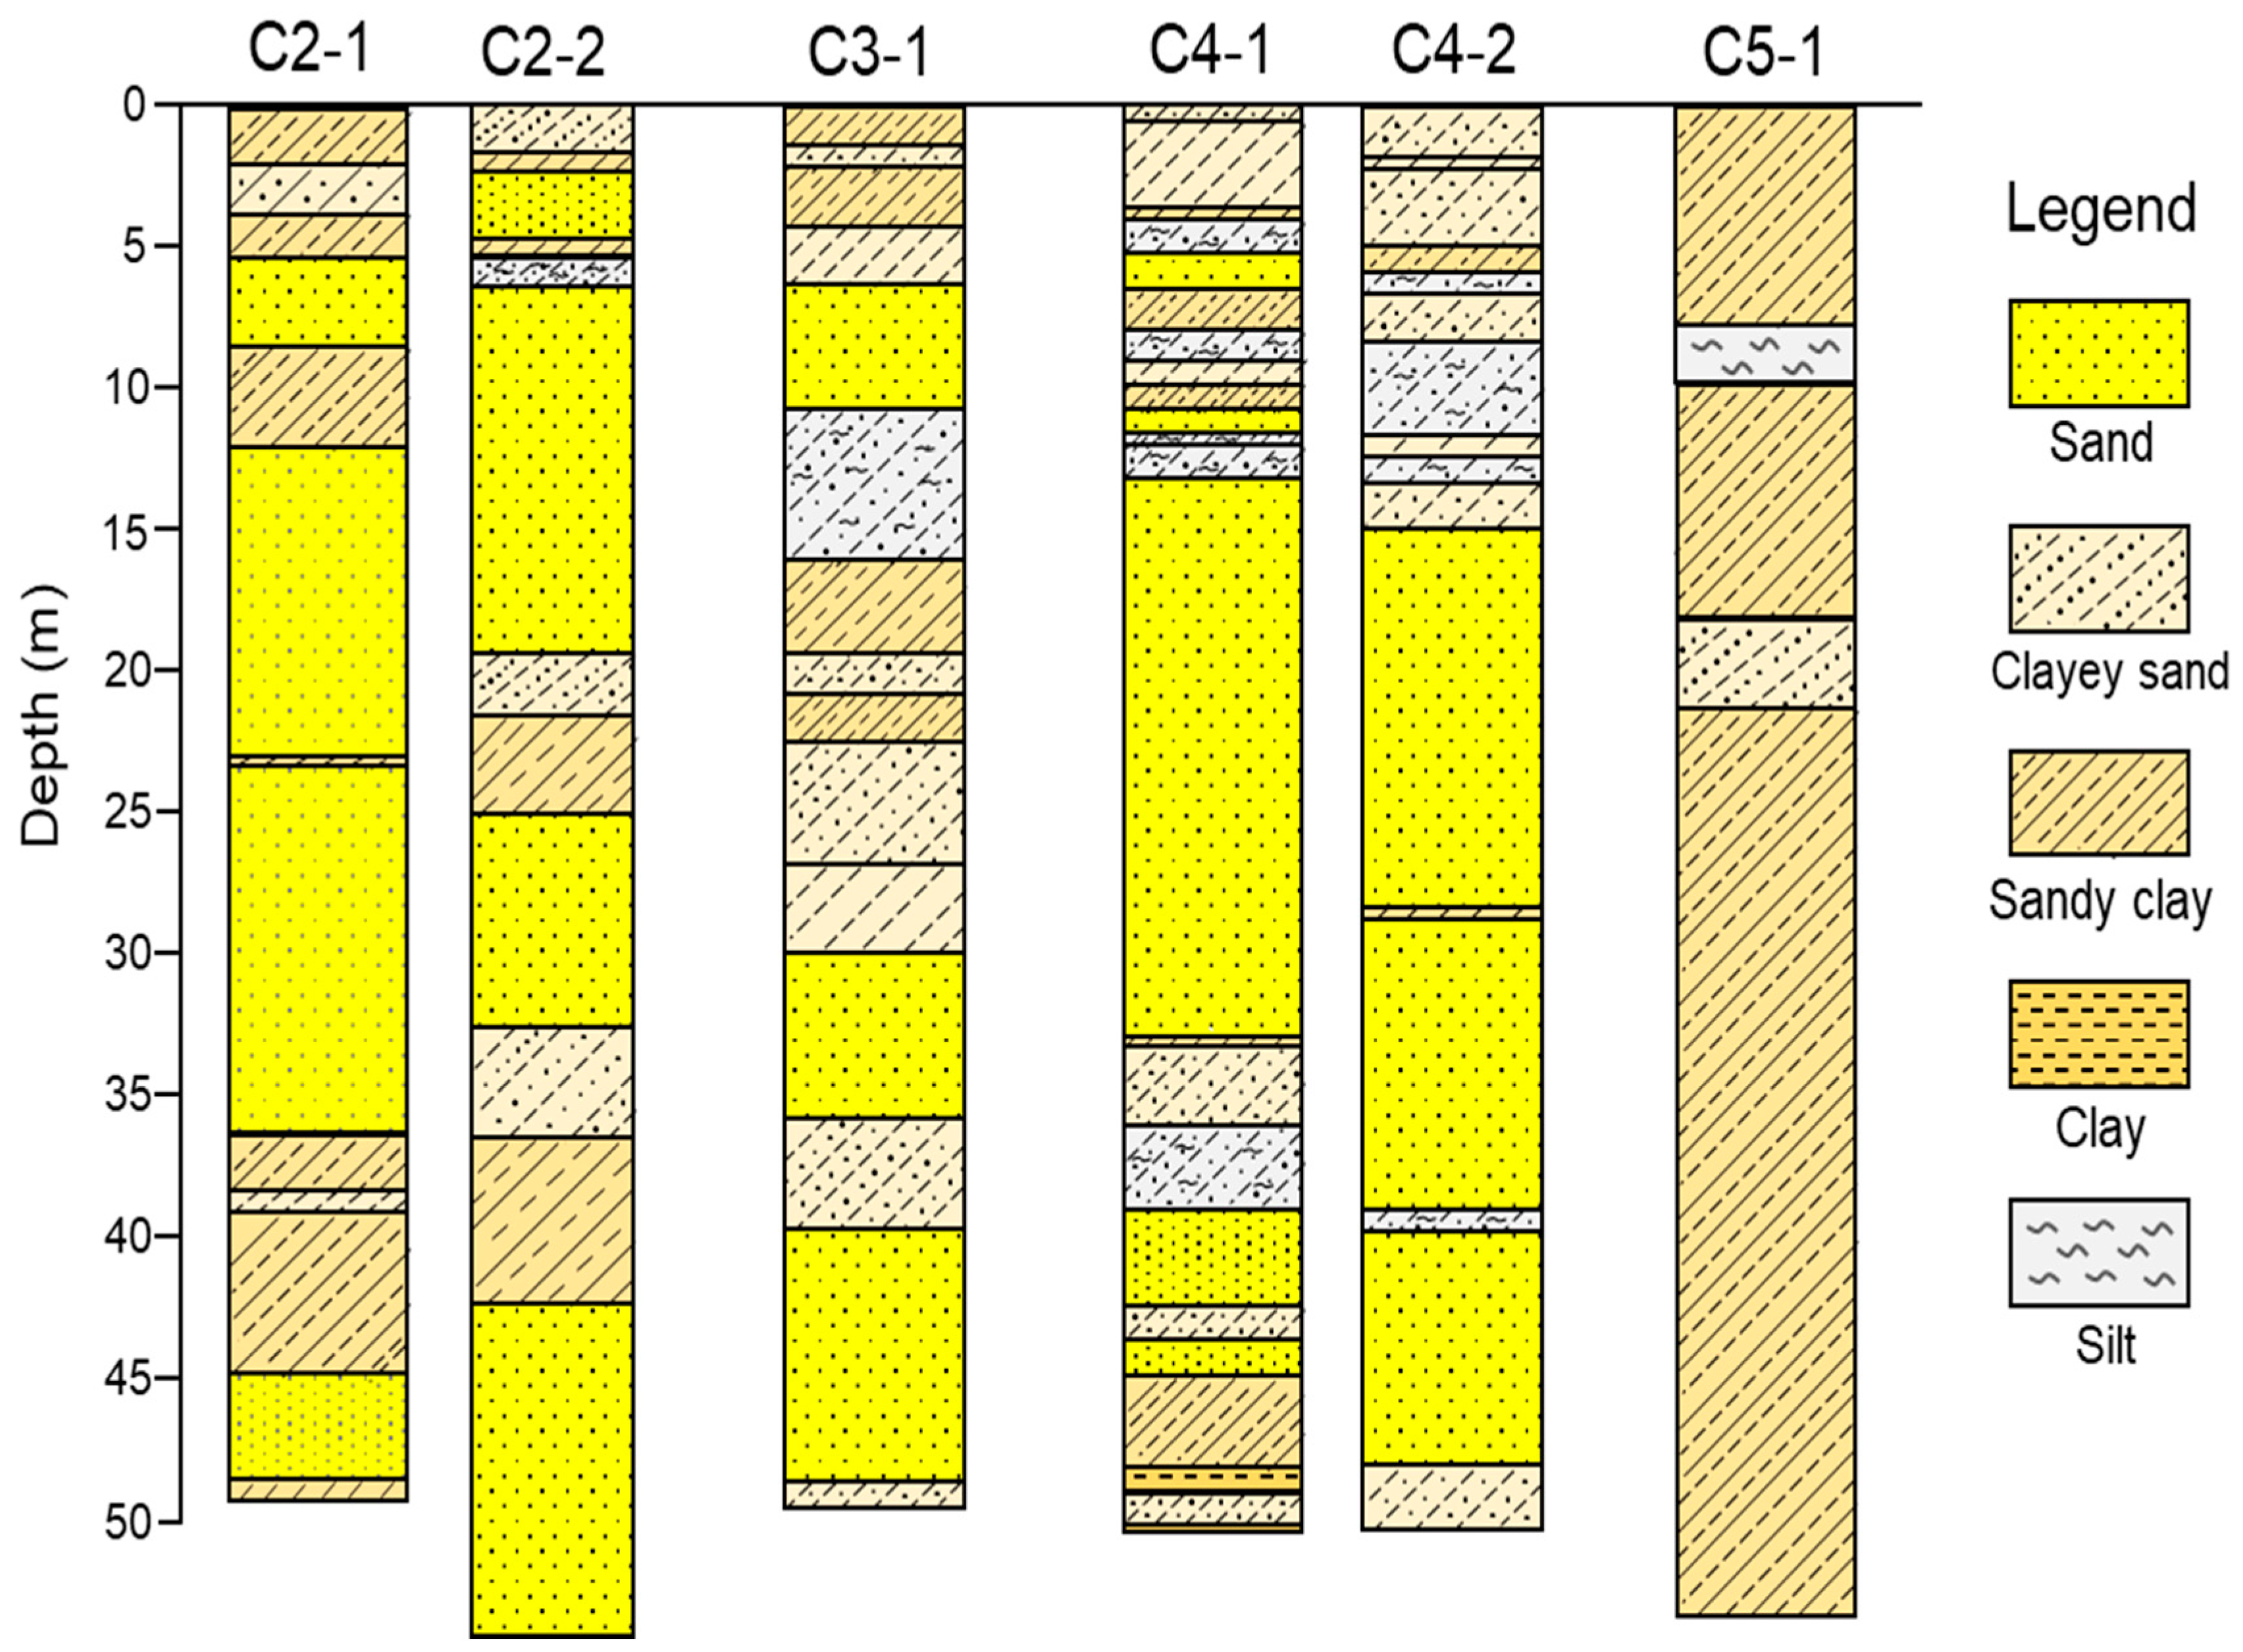
Originating from the northern foothills of the Bayan Har Mountain on the Qinghai–Tibet Plateau, the Yellow River flows through the Loess Plateau in the middle reaches, the vast North China Plain, and finally into the Bohai Sea (Figure 1). The paleo-Yellow River, which carried a large amount of loose sediment, frequently changed its flow path in the low-lying North China Plain [27]. The shallow buried paleochannels in the lower Yellow River was mainly formed from the Late Pleistocene (Last Glacial Maximum) to the Early Holocene (25~7.5 ka BP) when the climate was cold and dry and the sea level was low [26]. During this period, the ancient Yellow River swung, eroded, and cut the bottom clay layer, forming a cut valley with a thickness of 5–20 m, and then quickly deposited. In the mid–Holocene (7.5–3.0 ka BP), the climate became warm and humid, and the river level was higher than the sea level, causing a large transgression. The paleochannels was covered by gray–black silt and clay containing a lot of organic matter (Figure 2).
According to the “Atlas of Groundwater Sustainable Utilization in North China Plain” [28], the groundwater system of the Lower Yellow River plain can be divided into six groundwater subsystems (Figure 1). The division of the groundwater systems is based on sediment lithology, heavy mineral, aquifer structure, permeability, isotopic age, and hydrochemical composition. The impermeable zone of clayey soils is identified as the boundary dividing the paleochannels and paleointerfluves. The study area involves four groundwater subsystems, namely, the southern Neihuang–Guanxian–Ningjin paleochannel system (C2), Fuyang–Gaotang–Yangxin paleointerfluve system (C3), Liaocheng–Linyi paleochannel system (C4), and modern Yellow River affected zone system (C5). The C2 and C4 paleochannel aquifers are composed of fine sand and silty–fine sand with a thickness of 10~20 m and the hydraulic conductivity here is ~2.5–10 m/d. Aquifers of the paleointerfluve (C3) and modern Yellow River affected zone (C5) are characterized by a thin fine–sand layer, with hydraulic conductivities <2.5 m/d. The general direction of the regional groundwater flow is from southwest to northeast.
2.2. Groundwater Sampling and Analysis
Two hundred and three groundwater samples were collected from irrigation wells with depths ranging from 6 m to 50 m, in May to July 2015 (Figure 1). Before sampling, the well was purged at least half an hour to ensure that the groundwater samples are representative of the in–situ conditions. The WTW–Multi–340i/SET multi-parameter measuring instrument (Germany) was used to monitor the groundwater temperature, pH level, and redox potential (Eh). Meanwhile, a portable spectrophotometer (DR2800, HACH) was used to measure the Fe2+ and NH4+–N concentrations on site. Groundwater samples were collected and then filtered by 0.45–μm membrane filters in the field. Samples for trace element analysis were acidified to a pH < 2 using nitric acid, and the unacidified samples were used for the major ions analysis. All samples were stored in portable ice–filled coolers during transportation and preserved in a refrigerator at 4 °C in the laboratory until analysis. After sampling, the samples were immediately transported to the laboratory and analyzed within 48 hours.
All the chemical component measurements were completed at the Water Quality Analysis Laboratory of the Institute of Hydrogeology and Environmental Geology. Total dissolved solids (TDS) were measured through gravimetric analysis. The major cations (Ca2+, Mg2+, Na+, and K+) and total As were tested by inductively coupled plasma–mass spectrometry (Agilent 7500ce ICP–MS), with a detection limit of 1.0 μg/L for As. The major anions (SO42−, Cl−, and NO3−) were determined via ion chromatography (DX–120, Dionex). Besides, concentrations of HCO3− were tested by acid–base titration. The analytical precisions of both the ICP–MS and DX–120 equipment were less than 5%, which refers to the standard deviation of the results of the repeated analyses. The ion charge imbalances were <5% among most groundwater samples. Data of the groundwater samples analysis are presented in Table S1 and descriptive statistics of the hydrochemical parameters in different groundwater systems are shown in Table 1. The concentration values below the detection limit were replaced by the detection limit before the statistical analysis.
3. Results and Discussion
3.1. General Groundwater Chemistry
The groundwater pH values ranged between 6.3 and 8.5, which indicates a neutral–to–weak alkaline environment (Table 1).
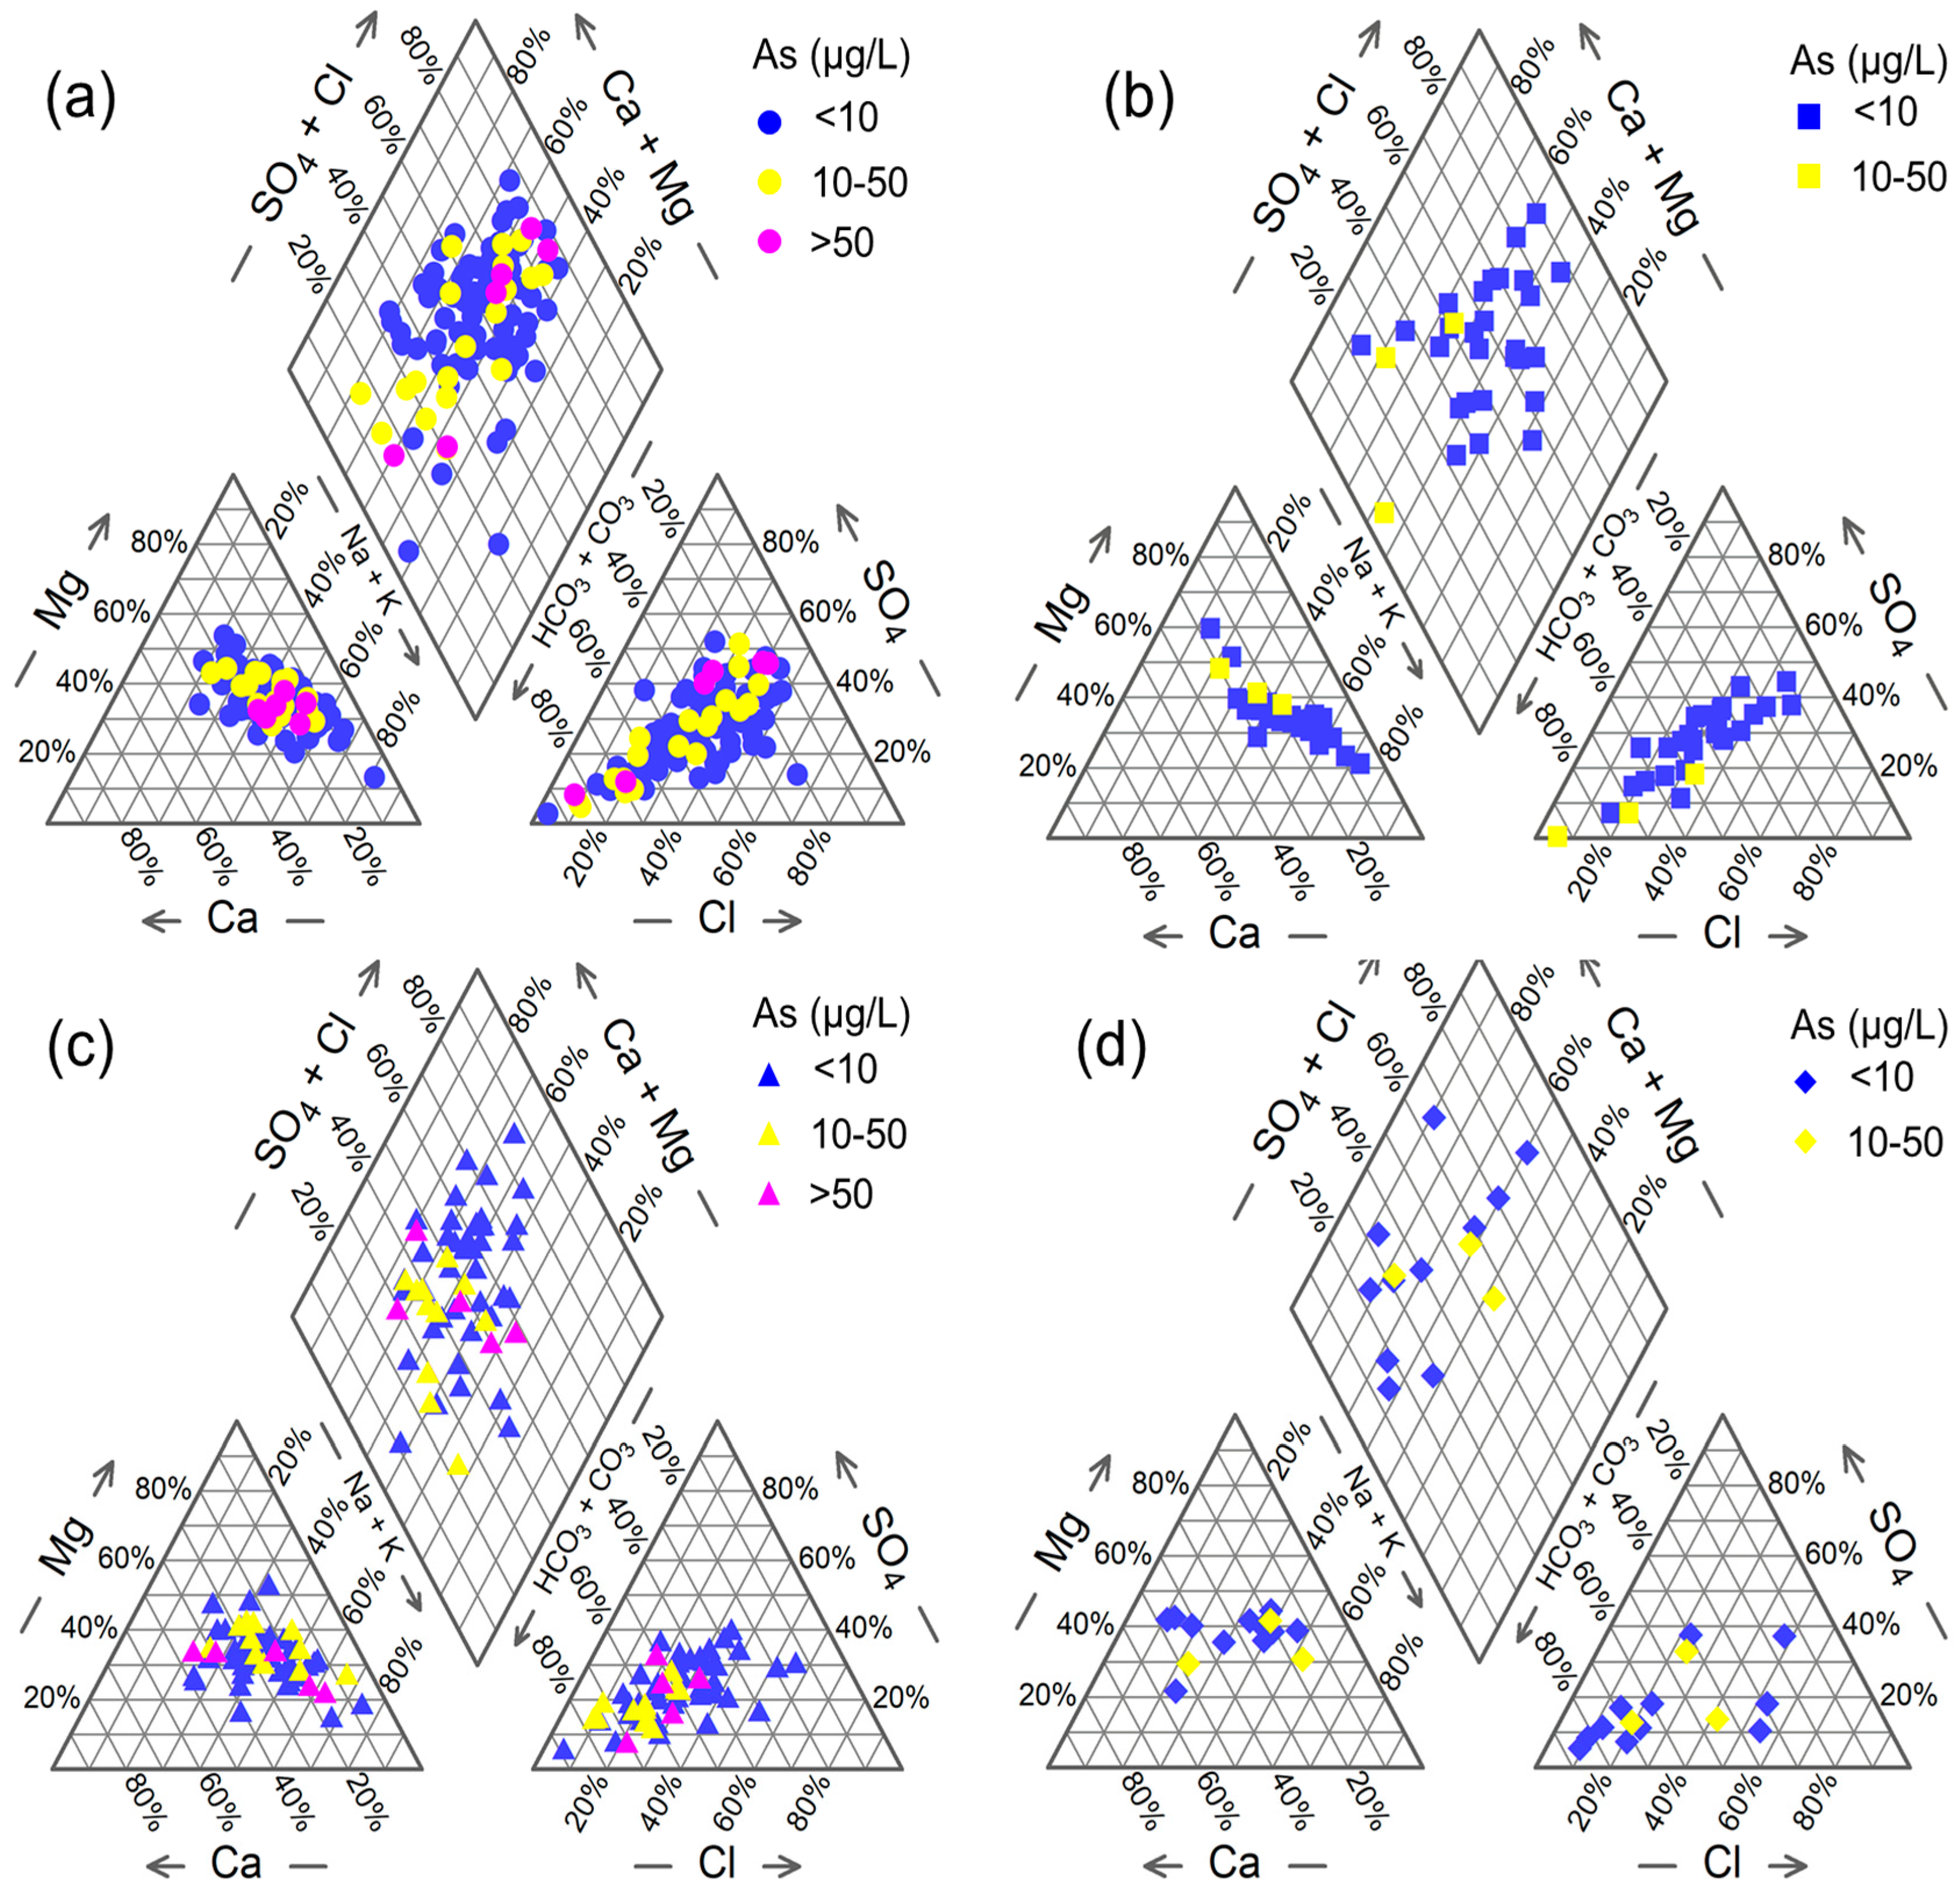
The results showed that the TDS concentrations widely varied between 360 mg/L and 8693 mg/L. The cation concentrations were dominated by Na+, followed by Mg2+, Ca2+, and K+. The average concentrations of them were 342 mg/L, 140 mg/L, 137 mg/L, and 4.1 mg/L, respectively. The anions are dominated by HCO3− with concentrations varying between 271 and 1296 mg/L, far over SO42− and Cl−(Table 1). As shown in the Piper diagram (Figure 3), the figures appeared relatively clustered in the C2, C3, and C4 groundwater systems. The groundwater mainly comprises the Na–Mg–HCO3 type in these three zones. In addition, the distribution of samples was relatively spaced in the C5 groundwater system, with the water types of Na–Mg–HCO3 or Ca–Mg–HCO3.
Groundwater Eh values varied from –173 mV to 373 mV (average 38.3 mV), and the CV value of Eh was 2.5, higher than other parameters, indicating frequent changes in the redox condition in the groundwater. Similar to the Eh values, the concentrations of other redox–sensitive parameters, such as Fe2+, NO3−, and NH4+, varied significantly (Table 1). The highest concentration of Fe2+ was observed in C2, followed by C4, C3, and C5. The concentrations of NH4+ in the four groundwater systems were C4 > C2 > C3 > C5. The NO3− concentrations showed an opposite trend, which is C5 > C4 < C2 > C3. The variations in the Eh values and Fe2+, NH4+, and NO3− concentrations reflect the changes in the redox environment in the different aquifers.
3.2. Spatial Distribution of the Groundwater As
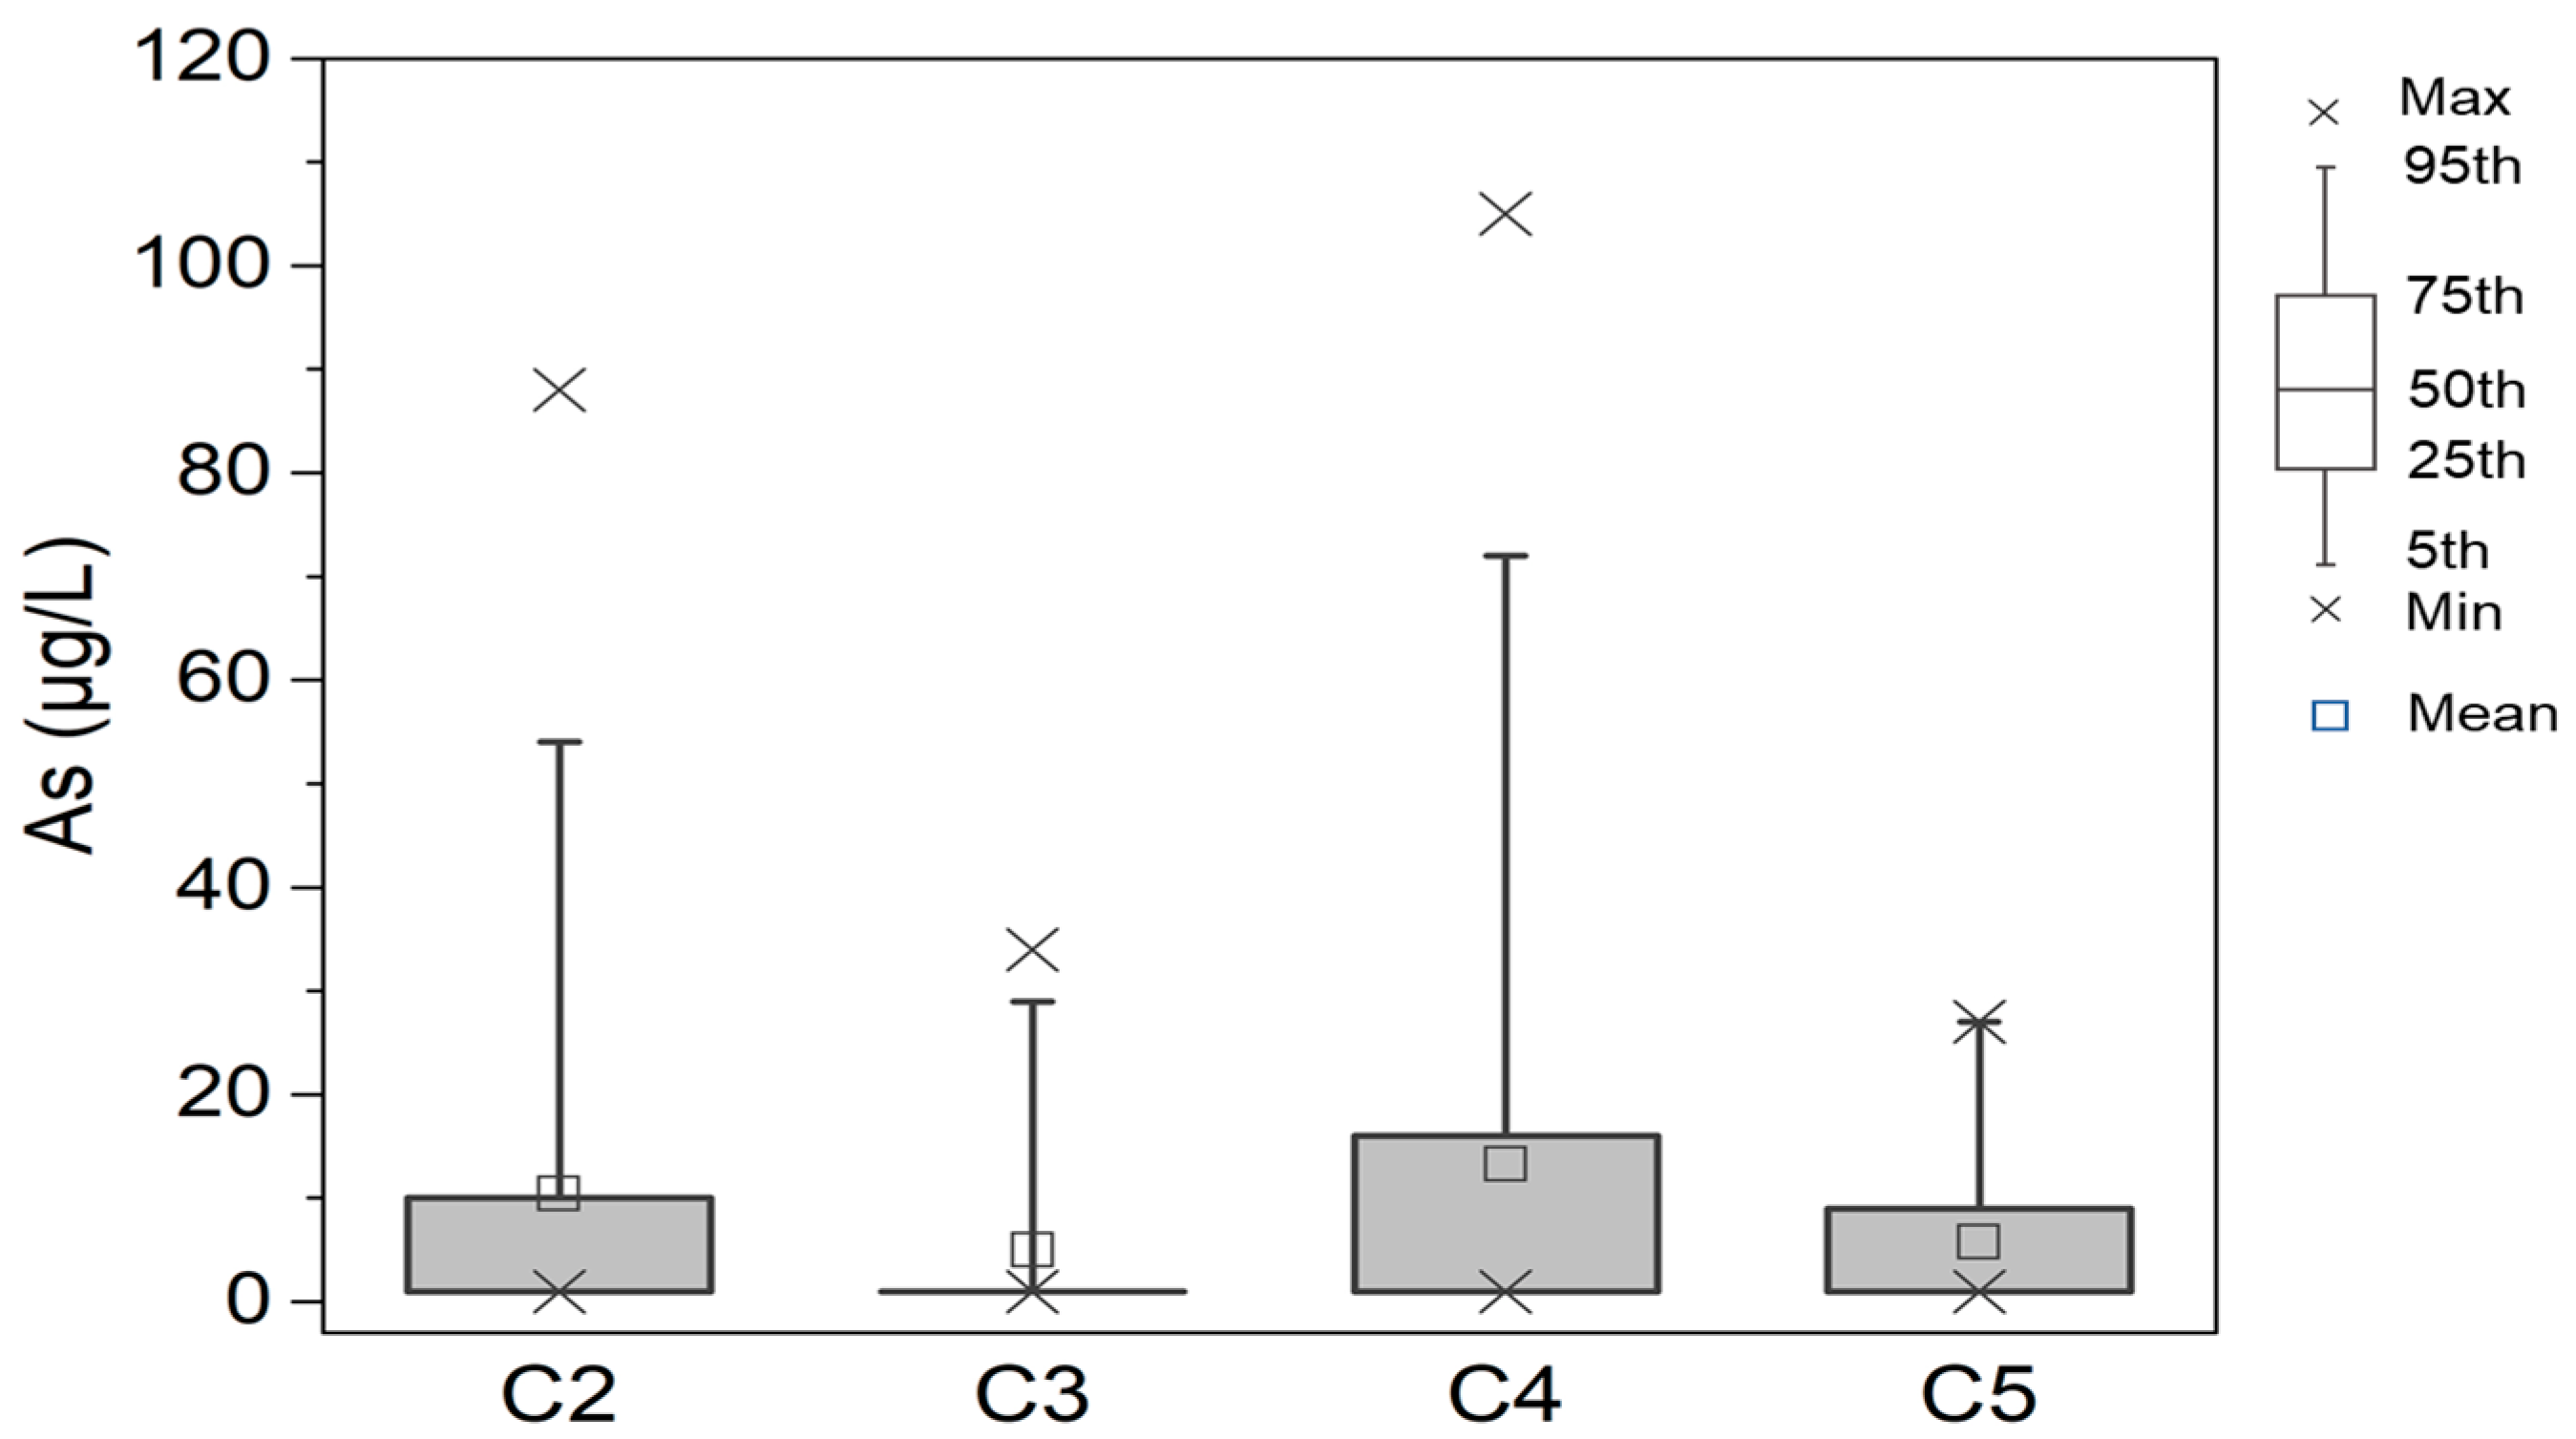
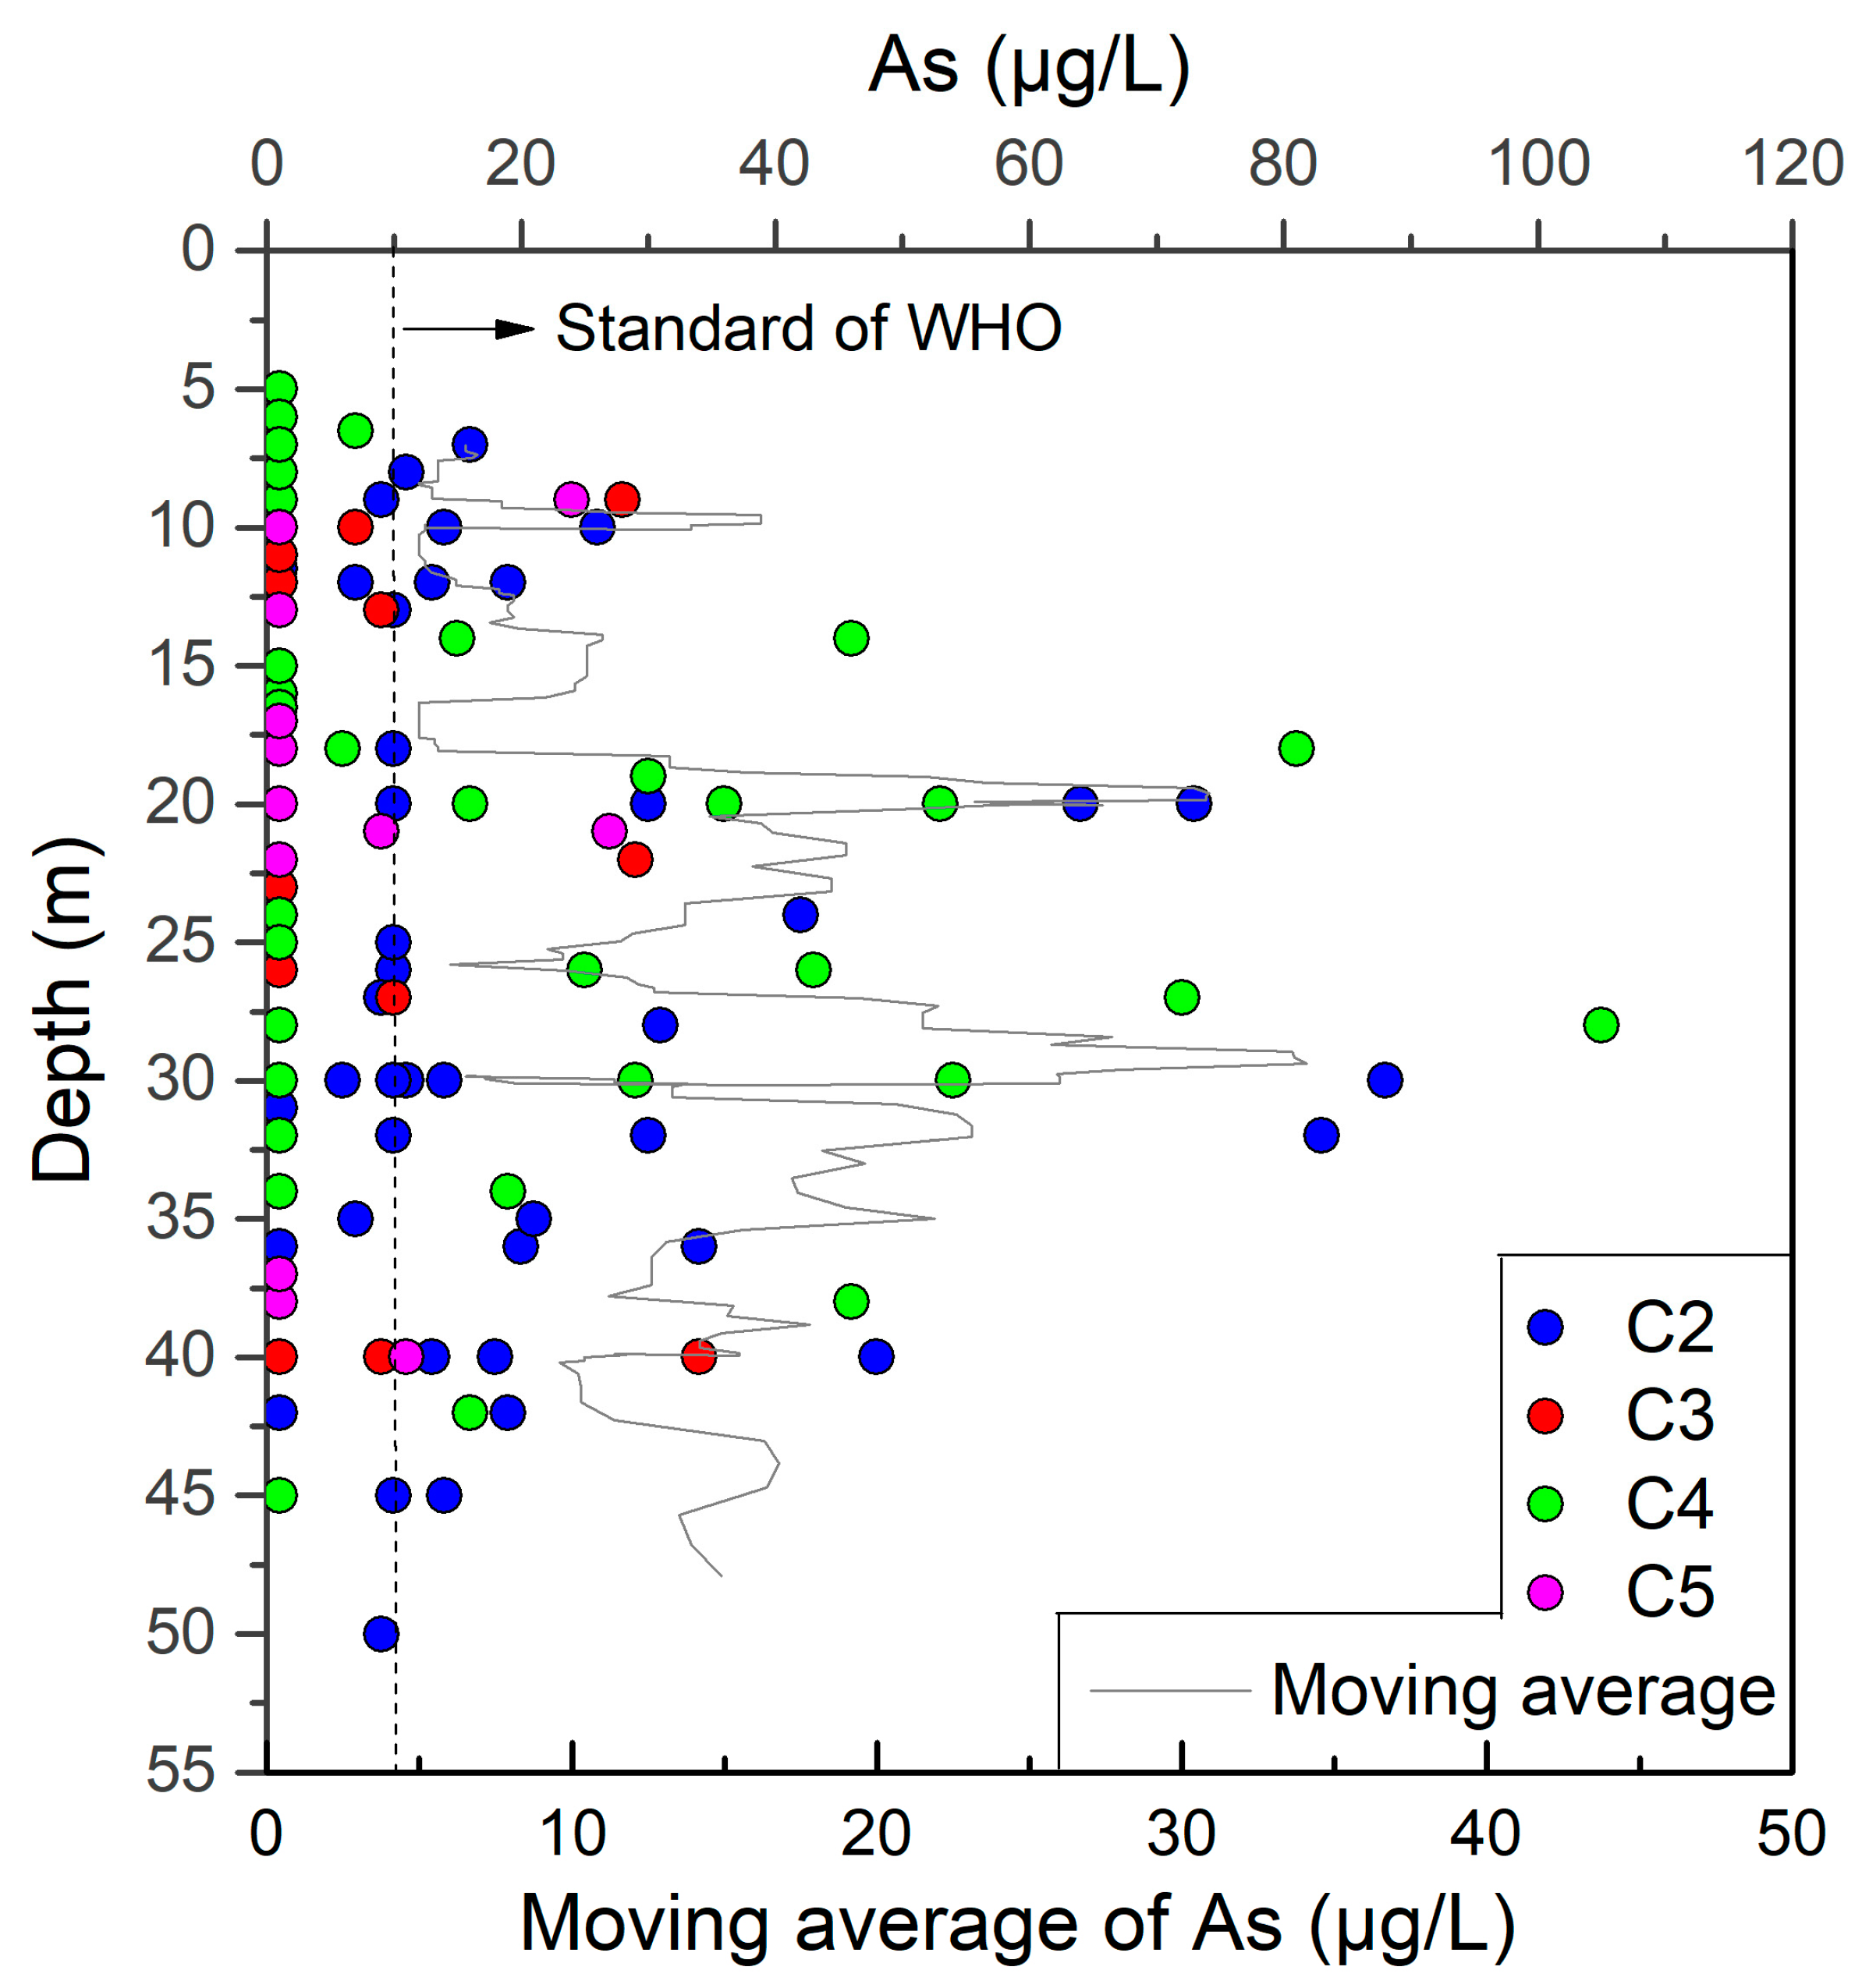
Arsenic concentrations ranged between <1 and 105 μg/L in shallow groundwater, with an average of 10.1 μg/L. More than 20% of the groundwater samples had As concentrations exceeding the World Health Organization’s drinking water guideline value of 10 μg/L. Figure 1 shows the spatial distribution of arsenic in the groundwater is highly heterogeneous. High–As groundwater mainly occurs in the paleochannels (C2 and C4), while the concentration of As in the paleointerfluve (C3) and modern Yellow River affected zone (C5) is relatively low (Figure 4). The average concentration of As was C4 > C2 > C5 > C3, i.e. 13.3 μg/L, 10.4 μg/L, 5.8 μg/L, and 5.0 μg/L, respectively. The standard deviation of the As concentration was 23.0, 17.6, 8.9, and 8.4 in the groundwater systems C4, C2, C3, and C5, respectively. It shows that dispersion of the As concentration is significantly higher in C4 and C2 than C3 and C5. In addition, the change in As concentration appears to be depth–dependent: more high-As samples (>10 μg/L) were distributed in late Pleistocene aquifers, with a depth of 20–35 m, and the over–standard rate of the As was as high as 32.9%, with a maximum of 105 μg/L (Figure 5). Seen from Figure 2, the sand content is high in the C2 and C4 paleochannels aquifers between 20 and 35 m. The high permeability of the aquifers is contributed to the migration of dissolved organic matter and the water–rock interaction, which would affect arsenic mobilization [14,29]. In Holocene aquifers with depths <20 m, only 12.0% of the groundwater samples had arsenic concentrations above 10 μg/L, and the maximum was 81.0 μg/L.
3.3. Formation Mechanisms of High–Arsenic Groundwater
3.3.1. Control of Reduction Conditions
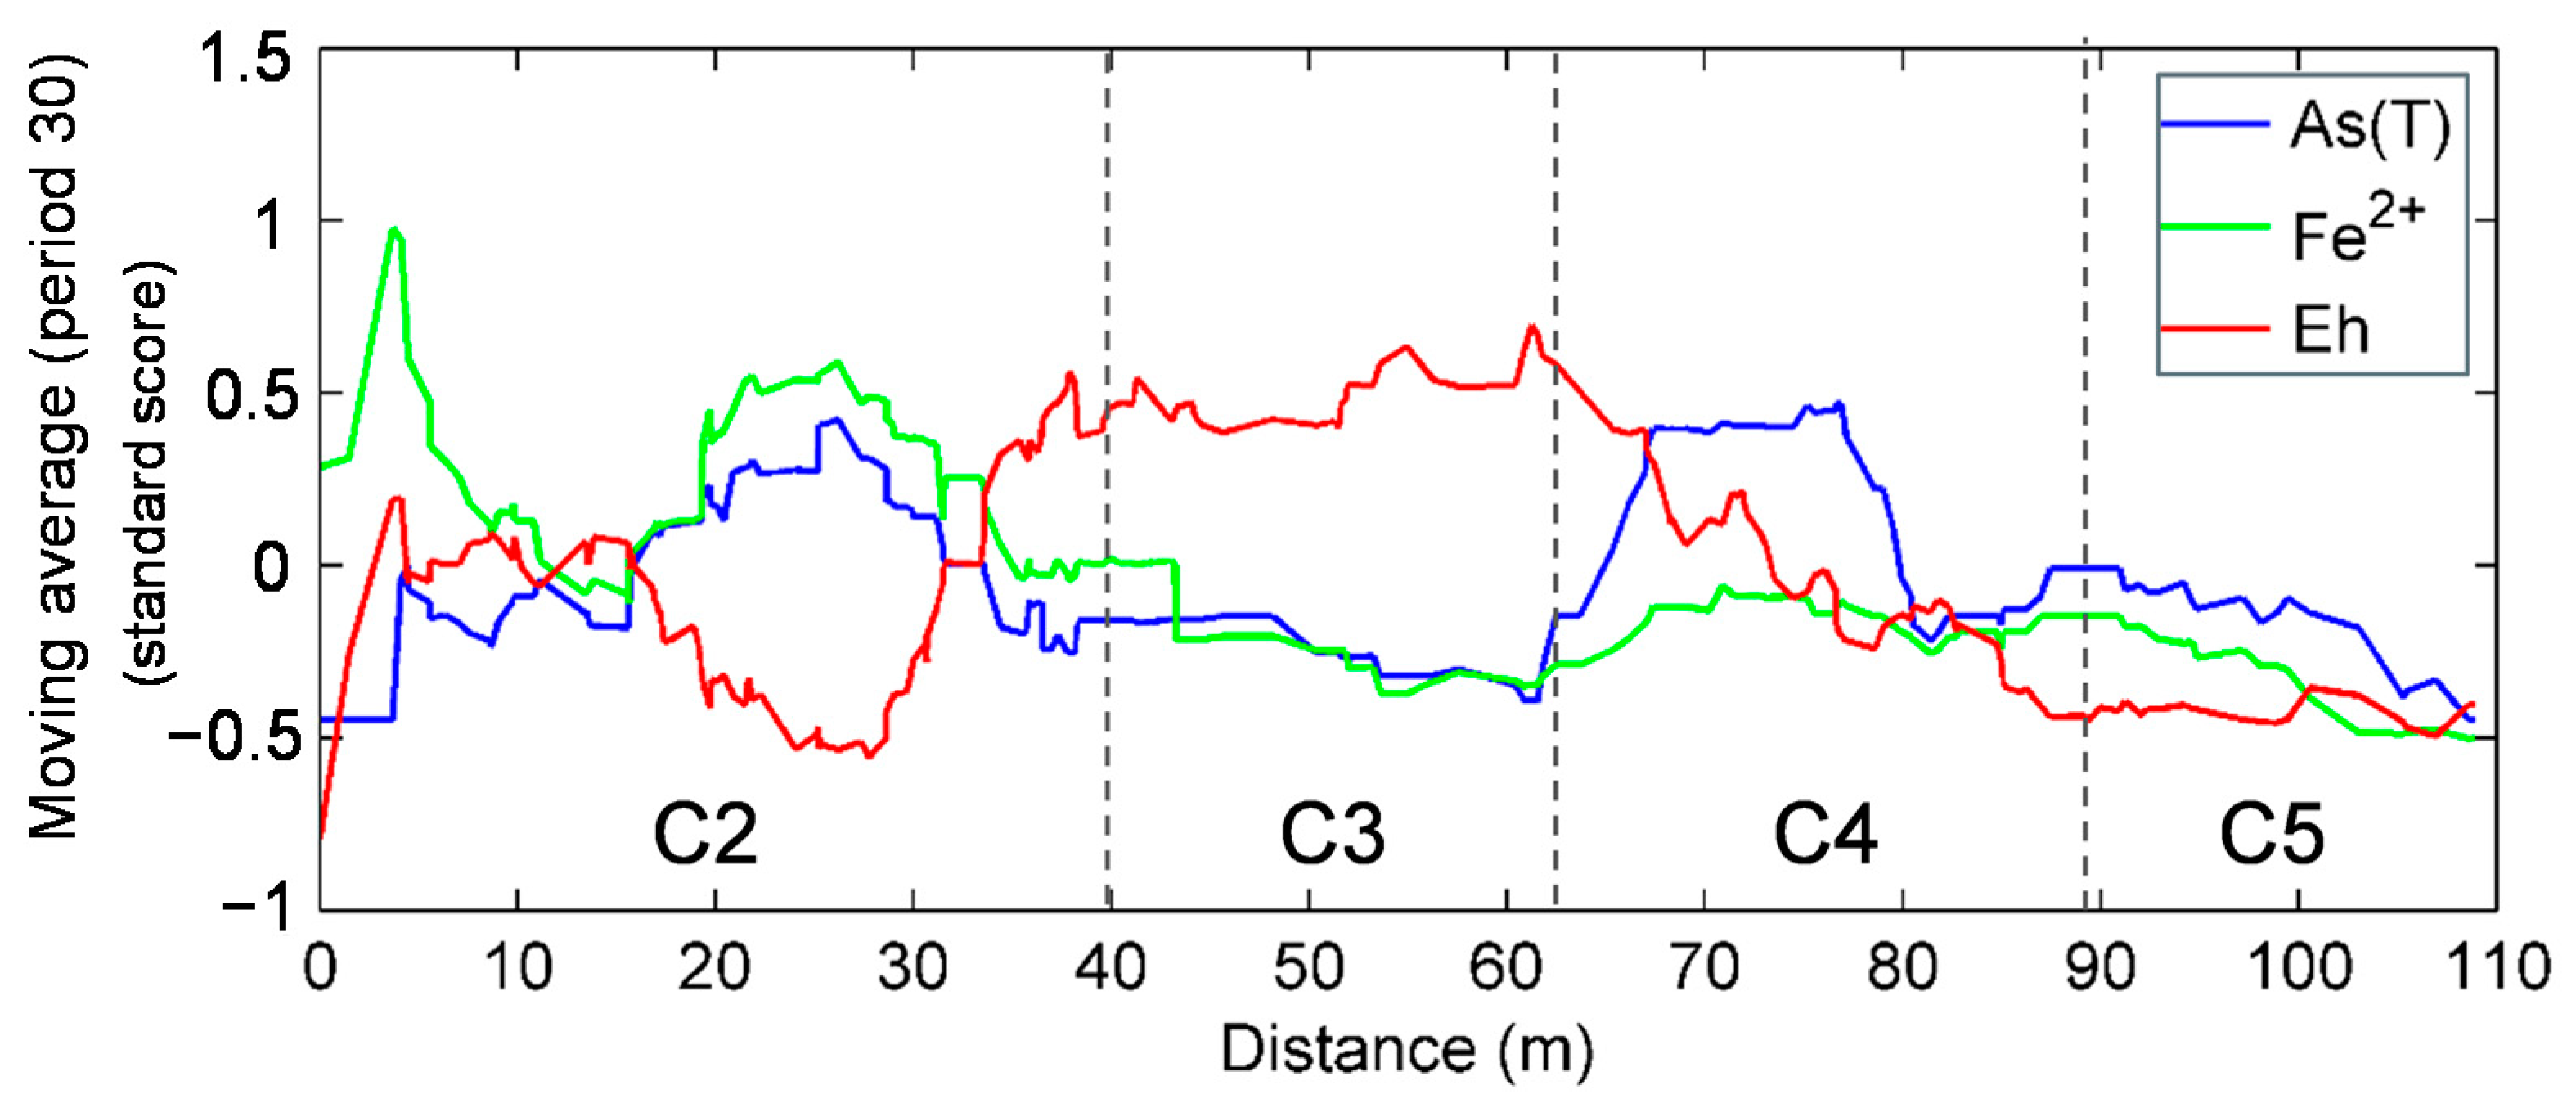
The concentrations of total As and Fe2+ across the different groundwater systems showed the same variation trends, which were opposite to that of the Eh values (Figure 6), indicating that the redox condition is the key controlling factor of As mobilization in the study area. The similar variations observed for As and Fe2+ indicates that arsenic release is possibly related to the reduction of iron oxyhydroxides [30]. Biogeochemical redox processes controls the release or sequestration of inorganic components in groundwater, which induces the following reduction sequence: O2, NO3−, Mn(IV), As(V), Fe(III), and SO42− [31].
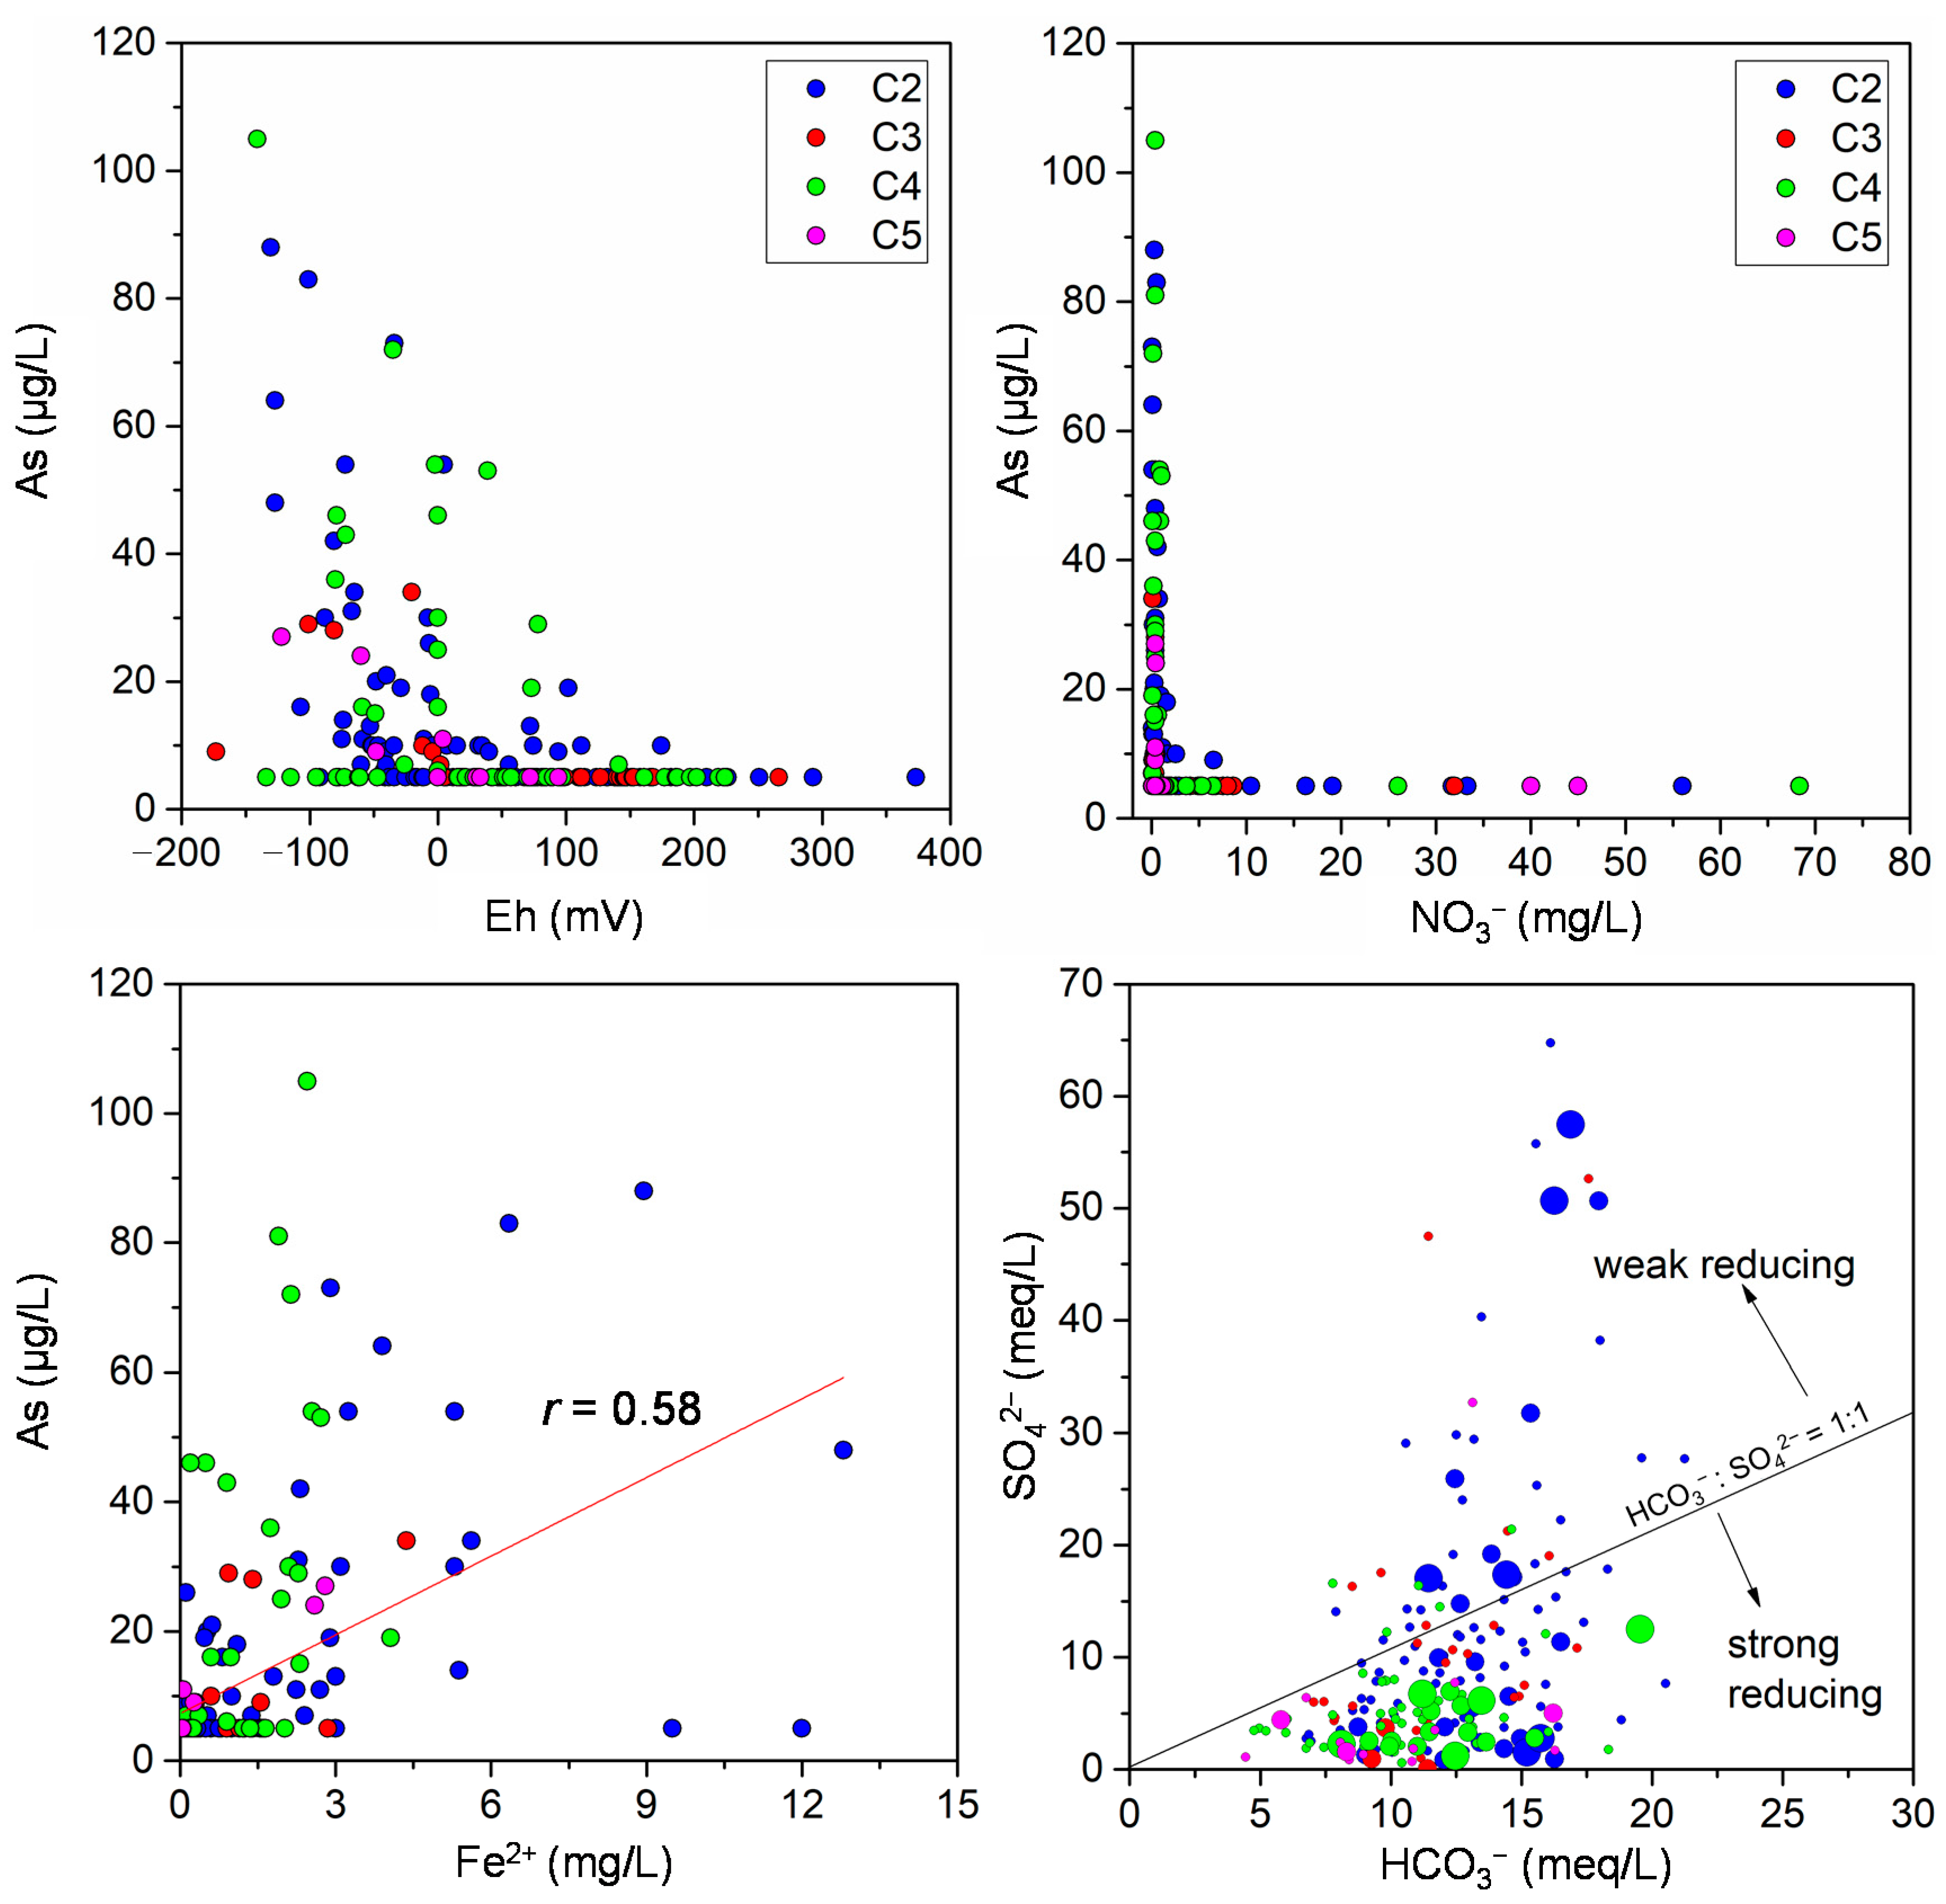
Seen from Figure 7 high As concentrations are mainly observed in groundwater with low Eh values (<0) and NO3− concentrations (<1.6 mg/L), indicating that the reduction of O2 and NO3− was almost completed in the high-As groundwater. A large amount of O2 and NO3− is consumed along the long groundwater flow path and the Holocene sandy clay limits the infiltration of dissolved oxygen and NO3− from surface water and precipitation to groundwater, resulting in an insufficient supply. Thus, As(V) and Fe(III) are easily used as electron acceptors for microbial degradation, causing high As and Fe2+ concentrations in groundwater. In addition, the positive correlation between As and Fe2+ (Figure 7) indicates that reductive dissolution of As–bearing Fe(III) oxyhydroxides is probably the main cause of As release into groundwater [15,32]. The reduction is generally induced by microbial degradation of organic matter in the aquifer, where SO42− is reduced to S2− and the HCO3− concentration increases [33]. Therefore, the SO42−/HCO3− meq ratio is often used to indicate the degree of reductive conditions in high-As groundwater [24]. In Figure 7, most high-As groundwater samples have an SO42−/HCO3− ratio <1, indicating that a strong reducing environment is conductive to enrichment of As in groundwater of the lower Yellow River. The SO42− reduction has also been found in high-As groundwater of the inland basin and coastal aquifers [34,35].
3.3.2. Competitive Desorption of As
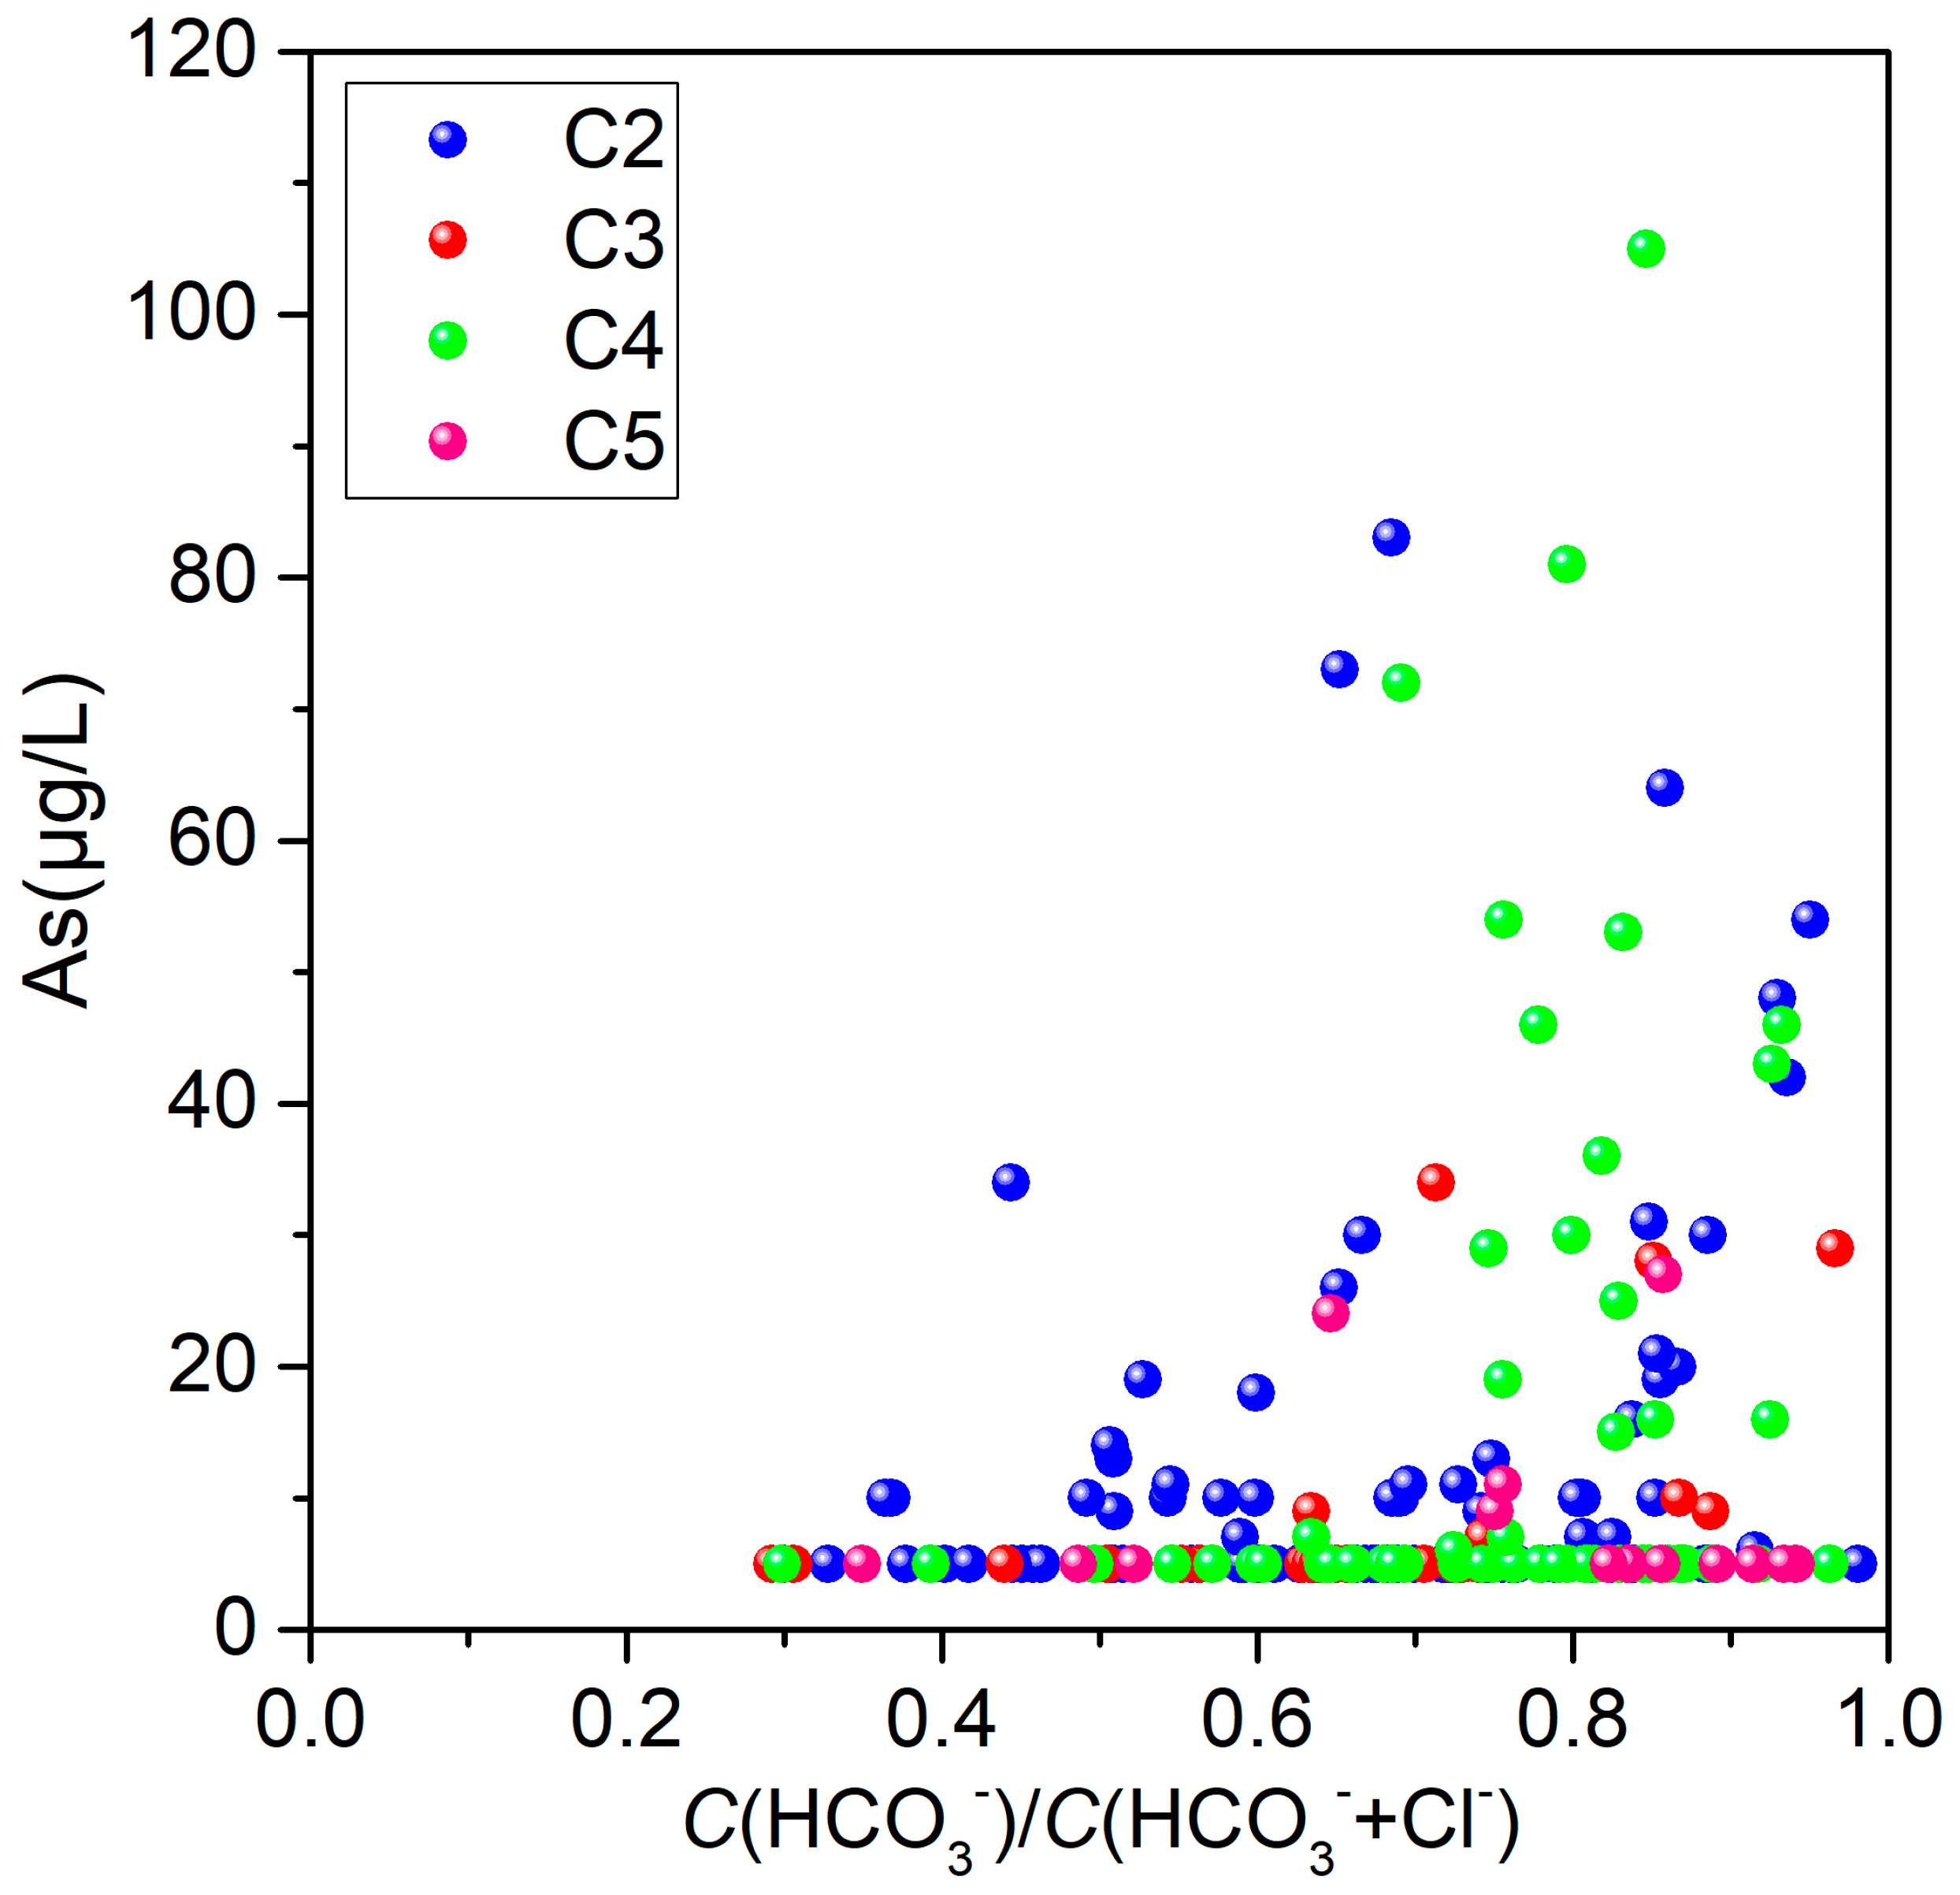
Arsenic release induced by bicarbonate competition may be another important mechanism, which has been proved by lots of laboratory experiments [36,37,38]. In this study area, HCO3− is the dominating anion with average concentrations of 729.5mg/L, which significantly exceeds SO42− and Cl−. HCO3− in groundwater may have multiple sources, including dissolutions of calcite and dolomite and degradation of organic matter [39]. Due to the high solubility and stability of Cl−, HCO3−/(HCO3−+Cl−) was used to evaluated the HCO3− dominance and reduced the influence of salinity [40]. According to Figure 8, the As concentration shows a tendency of a significant increase as the HCO3− proportion increases, which indicates that As release is related to high HCO3− concentrations. A significant correlation between As and HCO3− has been observed in groundwater of the Ganges plain [41], Hetao Basin [42], and Guide Basin [22]. Studies suggested that the HCO3− ion can substitute arsenate from the surface sites of iron oxides, leading to arsenic mobilization [43,44,45]. Thus, HCO3− competitive sorption can be regarded as one possible mechanism to mobilize As in bicarbonate–dominated reductive groundwater of the lower Yellow River.
3.3.3. Influences of Evaporation on Arsenic Concentration
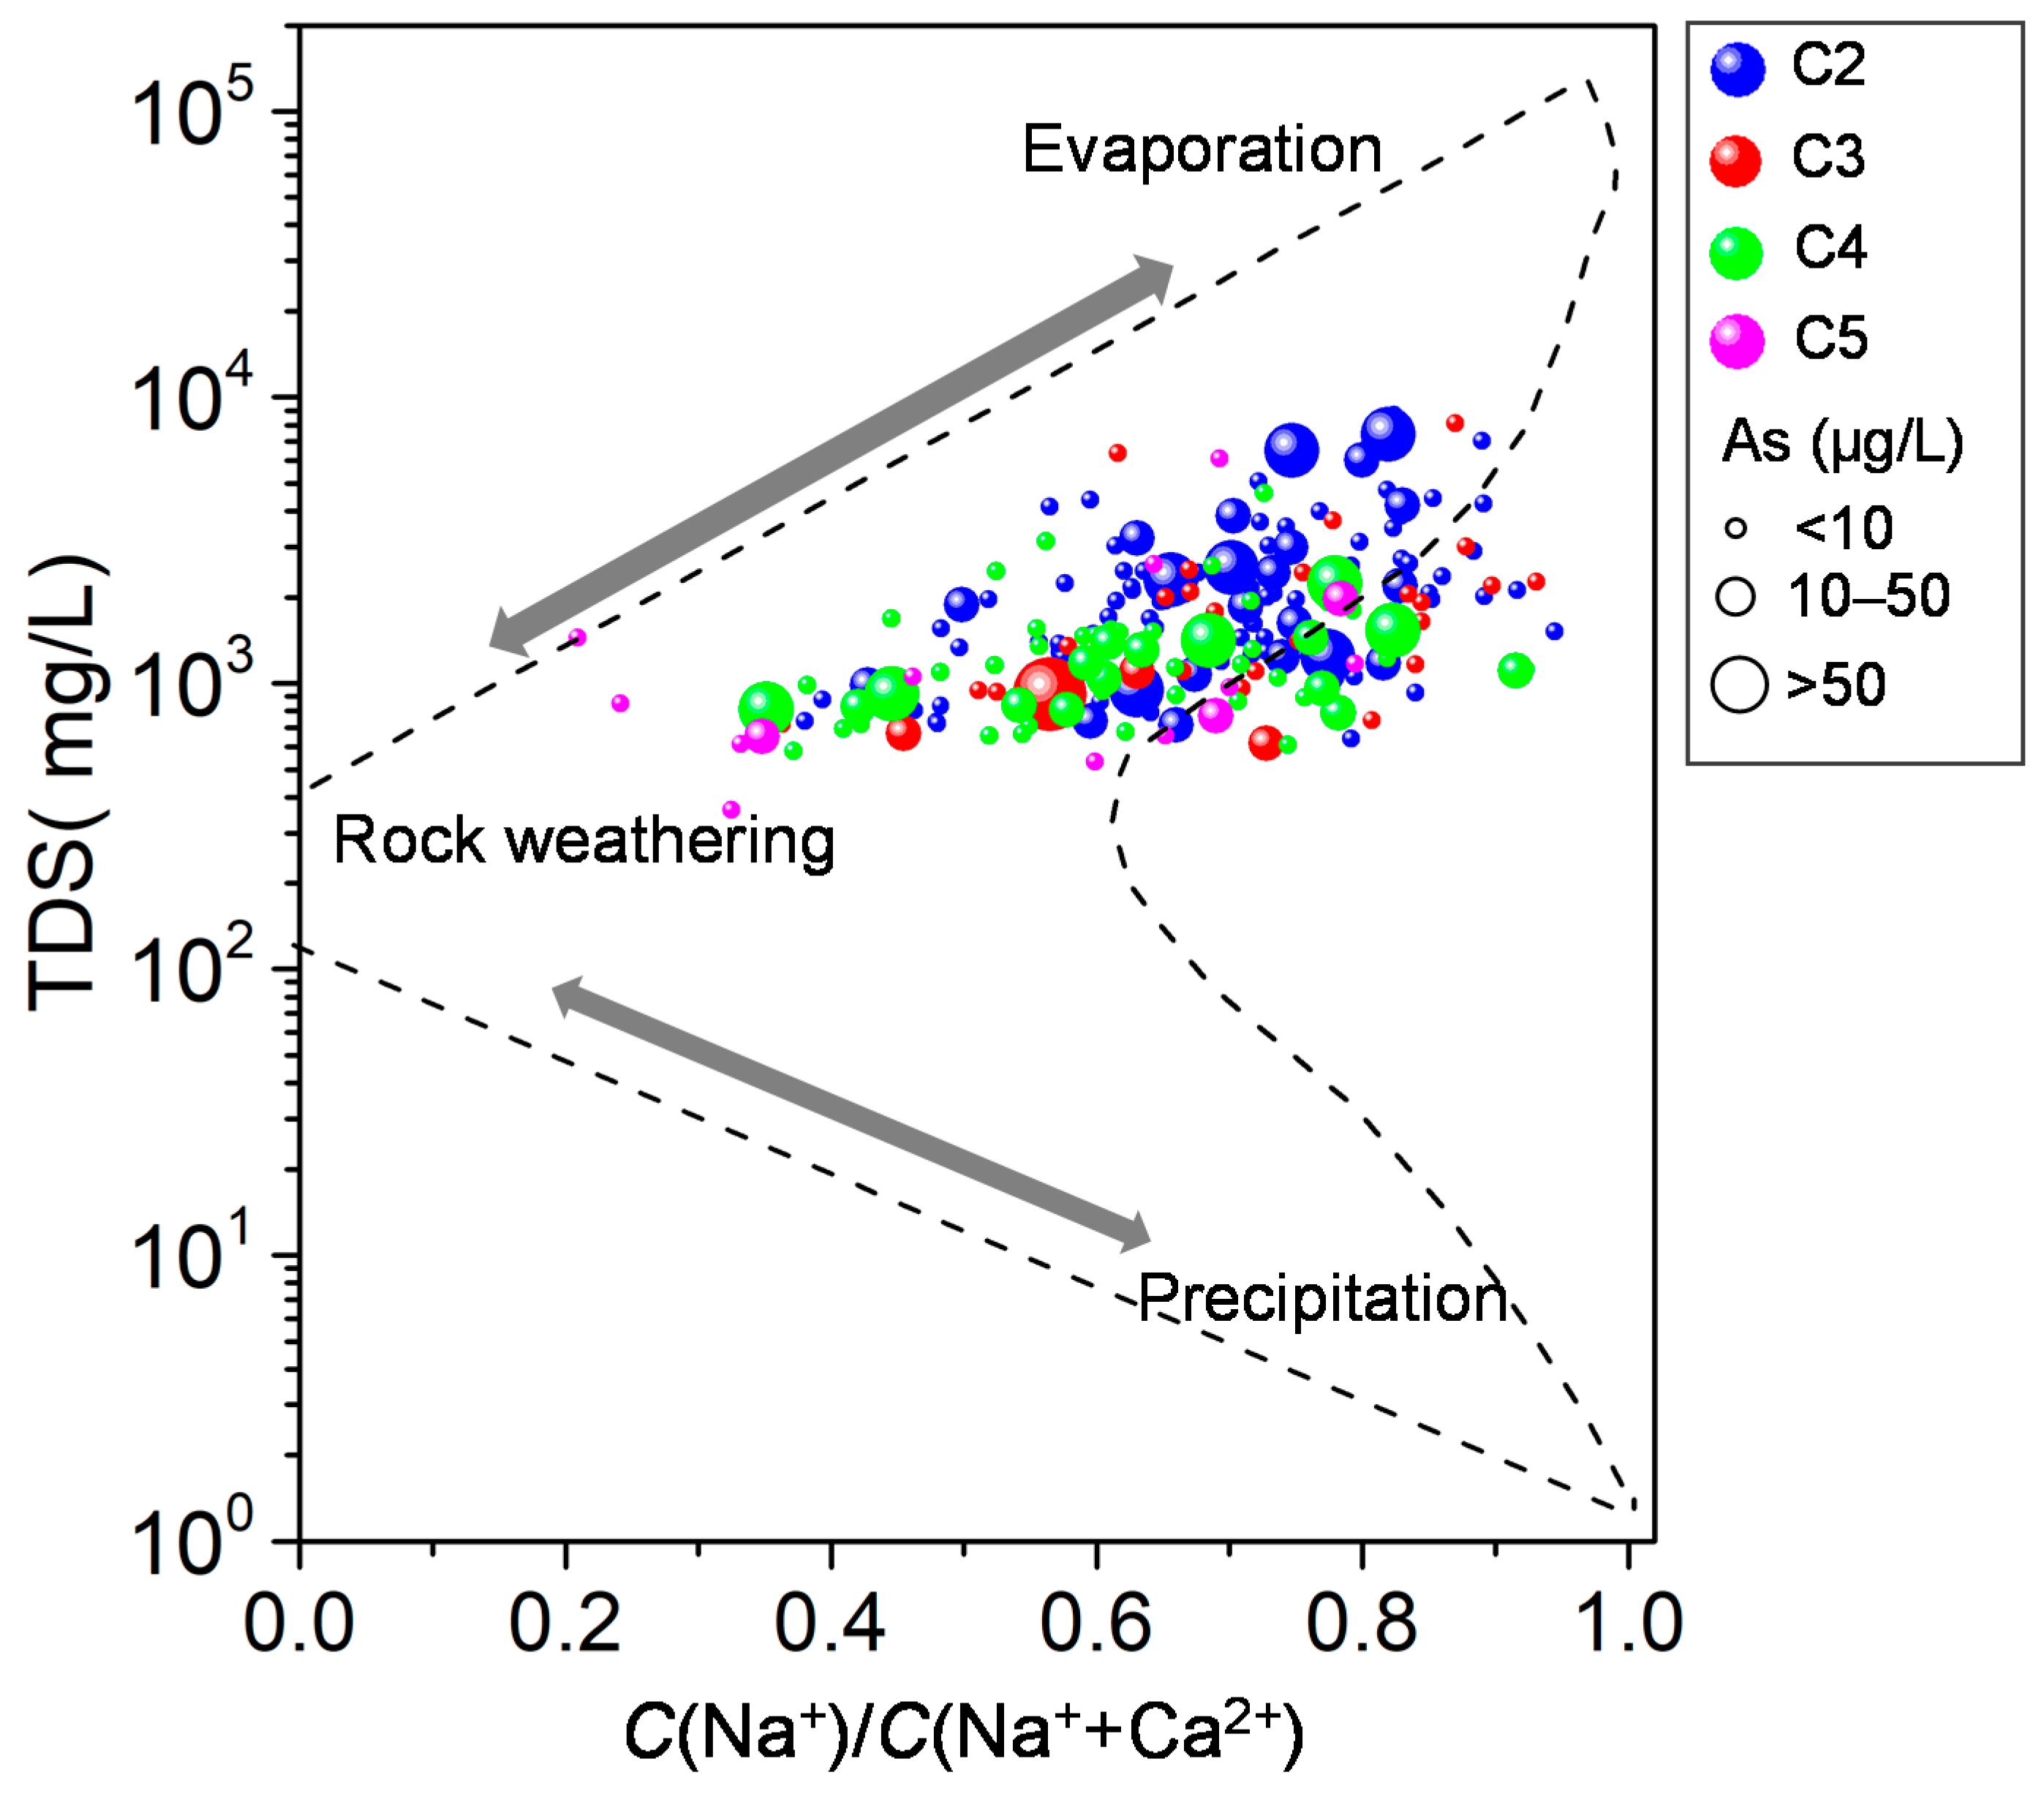
The Gibbs diagram, which was plotted by the relation of TDS versus the concentration ratio of Na+/(Ca2++Na+), was used to assess the principle hydrochemical processes of the groundwater in the lower Yellow River. According to Figure 9, the high-As groundwater was mainly located between the rock weathering domain and evaporation domain, indicating that the hydrochemical compositions were influenced by evaporation except for the water–rock interaction. The effect of evaporation on arsenic accumulation in groundwater has been reported in many low-lying plains, such as the eastern Indus Plain [46], the Okavango Delta of Botswana [47], and Nazas and Aguanaval Rivers plain [48]. In the study area, the burial depth of the shallow groundwater table ranges between 2.0 m and 4.0 m and the hydraulic gradient is <0.3‰, which is conducive to the evaporation of shallow groundwater [28,49]. The high-As groundwater is characterized by high TDS and the maximum of TDS concentration is 8693 mg/L. On the one hand, high evapotranspiration rates could effectively concentrate As and other solutes. On the other hand, evapotranspiration leads to pH and salinity increases, in turn inducing the desorption behavior of As on mineral oxide surfaces [47]. In general, isotopic evidence should be used in further research to support the control of evaporation on arsenic concentration.
3.4. Why Does As Distribution Show Obvious Zonation
A significant zonation of high-As groundwater is observed in the lower Yellow River. The high As samples are mainly distributed in the paleochannel aquifers (C2 and C4) than paleointerfluve aquifers (C3) and modern Yellow River affected aquifers (C5). Several reasons help to explain this characteristic. Sources of aquifer particles is one possible reason. An estimated 95% of the fluvial deposits in the lower course of the Yellow River derive from loess in the middle reaches [50]. Investigations show that the arsenic content in Malan loess, distributed in the middle reaches of the Yellow River, reach 23–30 μg/g, higher than the arsenic background (median: 9.2 μg/g) in Chinese soil. In addition, the arsenic in loess mainly exists in the adsorbed (37.76%) and iron–manganese combined states (36.15%) [51]. It would provide the material sources for groundwater arsenic in the lower paleochannels. Deposit structure may be another key factor. In this study area, the land surface was exposed during the last low stand of the sea level in the Late Pleistocene, cut by the paleo-Yellow River, and now buried by Holocene sediments. Arsenic contamination has been found to be significantly associated with the overlying Holocene sediments, which are rich in organic matter [52,53,54]. Microbial reduction of Fe(III) and As(V) need a supply of available organic carbon [55]. According to Figure 2, the paleochannel aquifers (C2 and C4) consist of thick layers of sand with a high permeability, vulnerable to downward migration of dissolved organic matter, while impermeable clay in the interfluvial areas (C3 and C5) would strongly restrict groundwater flow and solutes transport [14]. Thus, groundwater systems C2 and C4 show a reductive condition with low Eh values that is characterized by high concentrations of Fe2+ and As and a low NO3− concentration, compared with groundwater systems C3 and C5. A similar pattern was found in the Meghna paleochannels [56] and Red River paleochannels [20,57]. A further exploration of the lithological and biogeochemical processes of the different groundwater systems would contribute to a convincing explanation of this assumption.
4. Conclusions
The spatial distribution of As in the groundwater showed a significant zonation. High–As groundwater mainly occurred in paleochannel aquifers (C2 and C4) with a high permeability, compared with the paleointerfluve aquifer (C3) and modern Yellow River affected zone. Vertically, high-As groundwater mainly occurred in the Late Pleistocene–Holocene aquifers, with a depth of 20–35 m. Redox condition is the key controlling factor of As mobilization in the study area. Across these four groundwater systems, the concentration variation trends of the As and Fe2+ was basically the same, which was opposite to the variation trend in Eh values. Reductive dissolution of the As–bearing iron oxides is probably the primary mechanism of As release in the groundwater. The strong reducing conditions in the C2 and C4 groundwater systems are conductive to As release, compared to the C3 and C5 groundwater systems. In addition, HCO3− competition adsorption and evaporation of groundwater also have some influence on the As concentration in shallow groundwater. Although this study revealed the distribution characteristics and influence mechanisms of As in groundwater, it is still weak on evidence, which needs further investigation by experimental studies.
Supplementary Materials
The following are available online at https://www.mdpi.com/2073-4441/13/3/338/s1, Table S1. Data of groundwater samples analysis.
Author Contributions
Conceptualization, C.Z. and W.C.; Data curation, C.Z.; Funding acquisition, W.C.; Investigation, C.Z. and Z.L.; Methodology C.Z. and Z.W.; Project administration, W.C.; Software, C.Z. and Z.W.; Writing—original draft, C.Z.; Writing—review and editing, C.Z., W.C., Z.W., and Z.L. All authors have read and agreed to the published version of the manuscript.
Funding
This research was supported by the National Natural Science Foundation of China (41972262), Hebei Natural Science Foundation for Excellent Young Scholars (D2020504032), and Program of China Geological Survey (DD20190336).
Institutional Review Board Statement
Not applicable.
Informed Consent Statement
Not applicable.
Data Availability Statement
Not applicable.
Acknowledgments
We would like to thank the professional reviewers and the editors.
Conflicts of Interest
The authors declare no conflict of interest.
References
- Smedley, P.L.; Kinniburgh, D.G. A review of the source, behaviour and distribution of arsenic in natural waters. Appl. Geochem. 2002, 17, 517–568. [Google Scholar] [CrossRef] [Green Version]
- Smith, A.H.; Lopipero, P.A.; Bates, M.N.; Steinmaus, C.M. Public health—Arsenic epidemiology and drinking water standards. Science 2002, 296, 2145–2146. [Google Scholar] [CrossRef] [PubMed]
- WHO. Guideline for Drinking–Water Quality, 4th ed.; World Health Organization: Geneva, Switzerland, 2011. [Google Scholar]
- Zhi, C.; Chen, H.; Li, P.; Ma, C.; Zhang, J.; Zhang, C.; Wang, C.; Yue, X. Spatial distribution of arsenic along groundwater flow path in Chaobai River alluvial–proluvial fan, North China Plain. Environ. Earth Sci. 2019, 78, 259. [Google Scholar] [CrossRef]
- Zhang, Z.; Xiao, C.; Adeyeye, O.; Yang, W.; Liang, X. Source and Mobilization Mechanism of Iron, Manganese and Arsenic in Groundwater of Shuangliao City, Northeast China. Water 2020, 12, 534. [Google Scholar] [CrossRef] [Green Version]
- Maier, M.V.; Wolter, Y.; Zentler, D.; Scholz, C.; Stirn, C.N.; Isenbeck–Schröter, M. Phosphate Induced Arsenic Mobilization as a Potentially Effective In–Situ Remediation Technique—Preliminary Column Tests. Water 2019, 11, 2364. [Google Scholar] [CrossRef] [Green Version]
- Guo, H.; Ren, Y.; Liu, Q.; Zhao, K.; Li, Y. Enhancement of arsenic adsorption during mineral transformation from siderite to goethite: Mechanism and application. Environ. Sci. Technol. 2013, 47, 1009–1016. [Google Scholar] [CrossRef]
- Johannesson, K.H.; Tang, J. Conservative behavior of arsenic and other oxyanion–forming trace elements in an oxic groundwater flow system. J. Hydrol. 2009, 378, 13–28. [Google Scholar] [CrossRef]
- Postma, D.; Mai, N.T.H.; Lan, V.M.; Trang, P.T.K.; Sø, H.U.; Nhan, P.Q.; Larsen, F.; Viet, P.H.; Jakobsen, R. Fate of arsenic during Red River water infiltration into aquifers beneath Hanoi, Vietnam. Environ. Sci. Technol. 2017, 51, 838–845. [Google Scholar] [CrossRef] [Green Version]
- Postma, D.; Larsen, F.; Hue, N.T.M.; Duc, M.T.; Viet, P.H.; Nhan, P.Q.; Jessen, S. Arsenic in groundwater of the Red River floodplain, Vietnam: Controlling geochemical processes and reactive transport modeling. Geochim. Cosmochim. Acta 2007, 71, 5054–5071. [Google Scholar] [CrossRef]
- Postma, D.; Trang, P.T.; Sø, H.U.; Van, H.H.; Lan, V.M.; Thai, N.T.; Larsen, F.; Viet, P.H.; Jakobsen, R. A model for the evolution in water chemistry of an arsenic contaminated aquifer over the last 6000 years, Red River floodplain, Vietnam. Geochim. Cosmochim. Acta 2016, 195, 277. [Google Scholar] [CrossRef] [Green Version]
- Berg, M.; Stengel, C.; Trang, P.T.K.; Viet, P.H.; Sampson, M.L.; Leng, M.; Samreth, S.; Fredericks, D. Magnitude of arsenic pollution in the Mekong and Red River Deltas—Cambodia and Vietnam. Sci. Total Environ. 2007, 372, 413–425. [Google Scholar] [CrossRef] [PubMed]
- Asta, M.P.; Wang, Y.; Frutschi, M.; Viacava, K.; Loreggian, L.; Le Pape, P.; Le Vo, P.; Fernández, A.M.; Morin, G.; Bernier–Latmani, R. Microbially Mediated Release of As from Mekong Delta Peat Sediments. Environ. Sci. Technol. 2019, 53, 10208–10217. [Google Scholar] [CrossRef] [PubMed]
- McArthur, J.M.; Ravenscroft, P.; Banerjee, D.M.; Milsom, J.; Hudson–Edwards, K.A.; Sengupta, S.; Bristow, C.; Sarkar, A.; Tonkin, S.; Purohit, R. How paleosols influence groundwater flow and arsenic pollution: A model from the Bengal Basin and its worldwide implication. Water Resour. Res. 2008, 44, W11411. [Google Scholar] [CrossRef]
- Yadav, I.C.; Devi, N.L.; Singh, S. Reductive dissolution of iron–oxyhydroxides directs groundwater arsenic mobilization in the upstream of Ganges River basin, Nepal. J. Geochem. Explor. 2015, 148, 150–160. [Google Scholar] [CrossRef]
- Deng, Y.; Wang, Y.; Ma, T.; Yang, H.; He, J. Arsenic associations in sediments from shallow aquifers of northwestern Hetao Basin, Inner Mongolia. Environ. Earth Sci. 2011, 64, 2001–2011. [Google Scholar] [CrossRef]
- Guo, H.; Li, X.; Xiu, W.; He, W.; Cao, Y.; Zhang, D.; Wang, A. Controls of organic matter bioreactivity on arsenic mobility in shallow aquifers of the Hetao Basin, P.R. China. J. Hydrol. 2019, 571, 448–459. [Google Scholar] [CrossRef]
- Duan, Y.; Gan, Y.; Wang, Y.; Deng, Y.; Guo, X.; Dong, C. Temporal variation of groundwater level and arsenic concentration at Jianghan Plain, central China. J. Geochem. Explor. 2015, 149, 106–119. [Google Scholar] [CrossRef]
- Lu, X.; Wang, N.; Wang, H.; Deng, Y.; Ma, T.; Wu, M.; Zhang, Y. Molecular characterization of the total bacteria and dissimilatory arsenate–reducing bacteria in core sediments of the Jianghan Plain, central China. Geomicrobiol. J. 2017, 34, 467–479. [Google Scholar]
- Winkel, L.H.E.; Pham Thi Kim, T.; Vi Mai, L.; Stengel, C.; Amini, M.; Nguyen Thi, H.; Pham Hung, V.; Berg, M. Arsenic pollution of groundwater in Vietnam exacerbated by deep aquifer exploitation for more than a century. Proc. Natl. Acad. Sci. USA 2011, 108, 1246–1251. [Google Scholar] [CrossRef] [Green Version]
- Zhang, Z.; Guo, H.; Liu, S.; Weng, H.; Han, S.; Gao, Z. Mechanisms of groundwater arsenic variations induced by extraction in the western Hetao Basin, Inner Mongolia, China. J. Hydrol. 2020, 583, 124599. [Google Scholar] [CrossRef]
- Wang, Z.; Guo, H.; Xiu, W.; Wang, J.; Shen, M. High arsenic groundwater in the Guide basin, northwestern China: Distribution and genesis mechanisms. Sci. Total Environ. 2018, 640, 194–206. [Google Scholar] [CrossRef] [PubMed]
- Guo, Q.; Guo, H.; Yang, Y.; Han, S.; Zhang, F. Hydrogeochemical contrasts between low and high arsenic groundwater and its implications for arsenic mobilization in shallow aquifers of the northern Yinchuan Basin, P.R. China. J. Hydrol. 2014, 518, 464–476. [Google Scholar] [CrossRef]
- Cao, W.; Guo, H.; Zhang, Y.; Ma, R.; Li, Y.; Dong, Q.; Li, Y.; Zhao, R. Controls of paleochannels on groundwater arsenic distribution in shallow aquifers of alluvial plain in the Hetao Basin, China. Sci. Total Environ. 2018, 613, 958–968. [Google Scholar] [CrossRef] [PubMed]
- Han, S.; Zhang, F.; Zhang, H.; An, Y.; Wang, Y.; Wu, X.; Wang, C. Spatial and temporal patterns of groundwater arsenic in shallow and deep groundwater of Yinchuan Plain, China. J. Geochem. Explor. 2013, 135, 71–78. [Google Scholar] [CrossRef]
- Wu, C.; Zhu, X.Q.; He, N.H.; Xu, Q.H.; Yuan, W.Y.; Wang, Z.H.; Shi, D.R.; Zhao, M.X. A Study Of The Formation Of Ancient Channels On The North China Plain. Sci. China Ser. B Chem. 1991, 34, 1510–1515. [Google Scholar]
- Qian, N.; Zhou, W. Evolution of the Lower Yellow River Bed; Science Press: Beijing, China, 1965. [Google Scholar]
- Zhang, Z.; Fei, Y. Atlas of Groundwater Sustainable Utilization in North China Plain; Sinomaps Press: Beijing, China, 2009; Volume 17, p. 51. [Google Scholar]
- McArthur, J.M.; Nath, B.; Banerjee, D.M.; Purohit, R.; Grassineau, N. Palaeosol Control on Groundwater Flow and Pollutant Distribution: The Example of Arsenic. Environ. Sci. Technol. 2011, 45, 1376–1383. [Google Scholar] [CrossRef]
- Choudhury, R.; Mahanta, C.; Verma, S.; Mukherjee, A. Arsenic distribution along different hydrogeomorphic zones in parts of the Brahmaputra River Valley, Assam (India). Hydrogeol. J. 2017, 25, 1153–1163. [Google Scholar] [CrossRef] [Green Version]
- Borch, T.; Kretzschmar, R.; Kappler, A.; Van Cappellen, P.; Ginder–Vogel, M.; Voegelin, A.; Campbell, K. Biogeochemical Redox Processes and their Impact on Contaminant Dynamics. Environ. Sci. Technol. 2010, 44, 15–23. [Google Scholar] [CrossRef]
- Anawar, H.M.; Akai, J.; Mihaljevič, M.; Sikder, A.M.; Ahmed, G.; Tareq, S.M.; Rahman, M.M. Arsenic Contamination in Groundwater of Bangladesh: Perspectives on Geochemical, Microbial and Anthropogenic Issues. Water 2011, 3, 1050–1076. [Google Scholar] [CrossRef] [Green Version]
- Beaucaire, C.; Michelot, J.L.; Savoye, S.; Cabrera, J. Groundwater characterisation and modelling of water–rock interaction in an argillaceous formation (Tournemire, France). Appl. Geochem. 2008, 23, 2182–2197. [Google Scholar] [CrossRef]
- Jia, Y.; Xi, B.; Jiang, Y.; Guo, H.; Yang, Y.; Lian, X.; Han, S. Distribution, formation and human–induced evolution of geogenic contaminated groundwater in China: A review. Sci. Total Environ. 2018, 643, 967–993. [Google Scholar] [CrossRef] [PubMed]
- Kao, Y.H.; Liu, C.W.; Wang, P.L.; Liao, C.M. Effect of sulfidogenesis cycling on the biogeochemical process in arsenic–enriched aquifers in the Lanyang Plain of Taiwan: Evidence from a sulfur isotope study. J. Hydrol. 2015, 528, 523–536. [Google Scholar] [CrossRef]
- Gao, X.B.; Hu, Q.H.; Wang, Y.X.; Liu, X.G. Bicarbonate Competition in the Desorption of Arsenic Species from Sediments. Geochim. Cosmochim. Acta 2010, 74, A319. [Google Scholar]
- DeVore, C.L.; Rodriguez–Freire, L.; Mehdi–Ali, A.; Ducheneaux, C. Effect of bicarbonate and phosphate on arsenic release from mining–impacted sediments in the Cheyenne River watershed, South Dakota, USA. Environ. Sci. Process. Impacts 2019, 21, 456–468. [Google Scholar] [CrossRef] [Green Version]
- Stachowicz, M.; Hiemstra, T.; Van Riemsdijk, W.H. Arsenic−Bicarbonate Interaction on Goethite Particles. Environ. Sci. Technol. 2007, 41, 5620–5625. [Google Scholar] [CrossRef]
- Guo, H.; Yang, S.; Tang, X.; Li, Y.; Shen, Z. Groundwater geochemistry and its implications for arsenic mobilization in shallow aquifers of the Hetao Basin, Inner Mongolia. Sci. Total Environ. 2008, 393, 131–144. [Google Scholar] [CrossRef]
- Xing, L.; Guo, H.; Wei, L.; Zhan, Y. Evolution Feature and Gensis of Fluoride Groundwater in Shallow Aquifer from North China Plain. J. Earth Sci. Environ. 2012, 34, 57–67. [Google Scholar]
- Halim, M.A.; Majumder, R.K.; Nessa, S.A.; Hiroshiro, Y.; Uddin, M.J.; Shimada, J.; Jinno, K. Hydrogeochemistry and arsenic contamination of groundwater in the Ganges Delta Plain, Bangladesh. J. Hazard. Mater. 2009, 164, 1335–1345. [Google Scholar] [CrossRef]
- Gao, Z.; Jia, Y.; Guo, H.; Zhang, D.; Zhao, B. Quantifying Geochemical Processes of Arsenic Mobility in Groundwater from an Inland Basin Using a Reactive Transport Model. Water Resour. Res. 2020, 56, e2019WR025492. [Google Scholar] [CrossRef]
- Gao, X.; Su, C.; Wang, Y.; Hu, Q. Mobility of arsenic in aquifer sediments at Datong Basin, northern China: Effect of bicarbonate and phosphate. J. Geochem. Explor. 2013, 135, 93–103. [Google Scholar] [CrossRef]
- Anawar, H.M.; Akai, J.; Sakugawa, H. Mobilization of arsenic from subsurface sediments by effect of bicarbonate ions in groundwater. Chemosphere 2004, 54, 753–762. [Google Scholar] [CrossRef] [PubMed]
- Appelo, C.A.J.; Van Der Weiden, M.J.J.; Tournassat, C.; Charlet, L. Surface complexation of ferrous iron and carbonate on ferrihydrite and the mobilization of arsenic. Environ. Sci. Technol. 2002, 36, 3096. [Google Scholar] [CrossRef] [PubMed]
- Mushtaq, N.; Younas, A.; Mashiatullah, A.; Javed, T.; Ahmad, A.; Farooqi, A. Hydrogeochemical and isotopic evaluation of groundwater with elevated arsenic in alkaline aquifers in Eastern Punjab, Pakistan. Chemosphere Oxf. 2018, 200, 576–586. [Google Scholar] [CrossRef] [PubMed]
- Mladenov, N.; Wolski, P.; Hettiarachchi, G.M.; Murray–Hudson, M. Abiotic and biotic factors influencing the mobility of arsenic in groundwater of a through–flow island in the Okavango Delta, Botswana. J. Hydrol. 2014, 518, 326–341. [Google Scholar] [CrossRef]
- Ortega-Guerrero, A. Evaporative concentration of arsenic in groundwater: Health and environmental implications, La Laguna Region, Mexico. Environ. Geochem. Health 2016, 39, 987–1003. [Google Scholar] [CrossRef]
- Liting, X.; Fengjuan, Z.; Changsuo, L.I.; Lizhi, Y.; Liyan, W. Hydro–chemical Characteristics of Shallow Groundwater in the North Shandong Plain. J. Irrig. Drain. 2015, 34, 90–94. [Google Scholar]
- Zhang, J. Geochemistry of Arsenic in the Huanghe (Yellow River) and Its Delta Region—A Review of Available Data. Aquat. Geochem. 1995, 1, 241–275. [Google Scholar] [CrossRef]
- Xie, Y.Y.; Chen, T.H.; Zhou, Y.F.; Xie, Q.Q. Effect of the interaction of microorganisms and iron oxides on arsenic releasing into groundwater in Chinese Loess. Environ. Sci. 2013, 34, 3940–3944. [Google Scholar]
- Rodriguez–Lado, L.; Sun, G.; Berg, M.; Zhang, Q.; Xue, H.; Zheng, Q.; Johnson, C.A. Groundwater Arsenic Contamination Throughout China. Science 2013, 341, 866–868. [Google Scholar] [CrossRef]
- Edmunds, W.; Ahmed, K.; Whitehead, P. A review of arsenic and its impacts in groundwater of the Ganges–Brahmaputra–Meghna delta, Bangladesh. Environ. Sci. Process. Impacts 2015, 17, 1032–1046. [Google Scholar]
- Tan, Z.; Yang, Q.; Zheng, Y. Machine Learning Models of Groundwater Arsenic Spatial Distribution in Bangladesh: Influence of Holocene Sediment Depositional History. Environ. Sci. Technol. 2020, 54, 9454–9463. [Google Scholar] [CrossRef] [PubMed]
- Neidhardt, H.; Berner, Z.A.; Freikowski, D.; Biswas, A.; Majumder, S.; Winter, J.; Gallert, C.; Chatterjee, D.; Norra, S. Organic carbon induced mobilization of iron and manganese in a West Bengal aquifer and the muted response of groundwater arsenic concentrations. Chem. Geol. 2014, 367, 51–62. [Google Scholar] [CrossRef]
- Ghosal, U.; Sikdar, P.K.; McArthur, J.M. Palaeosol Control of Arsenic Pollution: The Bengal Basin in West Bengal, India. Groundwater 2015, 53, 588–599. [Google Scholar] [CrossRef] [PubMed] [Green Version]
- Jessen, S.; Larsen, F.; Postma, D.; Viet, P.H.; Ha, N.T.; Nhan, P.Q.; Nhan, D.D.; Duc, M.T.; Hue, N.T.M.; Huy, T.D.; et al. Palaeo–hydrogeological control on groundwater As levels in Red River delta, Vietnam. Appl. Geochem. 2008, 23, 3116–3126. [Google Scholar] [CrossRef]
Figure 1.
Locations of the study area and arsenic concentration distribution in the different groundwater systems in the lower Yellow River. C2 is the southern Neihuang–Guanxian–Ningjin paleochannel system; C3 is the Fuyang–Gaotang–Yangxin paleointerfluve system; C4 is the Liaocheng–Linyi paleochannel system; C5 is the modern Yellow River affected zone system.

Figure 2.
Depositional lithology of typical boreholes in the different zones.

Figure 3.
Piper plot of the C2 (a), C3 (b), C4 (c), and C5 (d) groundwater systems.

Figure 4.
Box plot of the As concentrations in the four zones.

Figure 5.
Variations of As concentrations with depth in groundwater. Concentrations were smoothed using a moving average filter with a period of 30.
Figure 5.
Variations of As concentrations with depth in groundwater. Concentrations were smoothed using a moving average filter with a period of 30.

Figure 6.
Variation trends of the As and Fe2+ concentrations and Eh values across different groundwater systems. Concentrations were standardized and then smoothed using a moving average filter with a period of 30.
Figure 6.
Variation trends of the As and Fe2+ concentrations and Eh values across different groundwater systems. Concentrations were standardized and then smoothed using a moving average filter with a period of 30.

Figure 7.
Scatter plot of As versus Eh; NO3−; and Fe2+; bubble diagram of SO42− versus HCO3− in groundwater with different As concentrations.
Figure 7.
Scatter plot of As versus Eh; NO3−; and Fe2+; bubble diagram of SO42− versus HCO3− in groundwater with different As concentrations.

Figure 8.
Scatter plot of HCO3−/(HCO3−+Cl−) versus As of shallow groundwater in the different zones.
Figure 8.
Scatter plot of HCO3−/(HCO3−+Cl−) versus As of shallow groundwater in the different zones.

Figure 9.
Gibbs diagram of the groundwater samples in the study area.


Table 1.
Statistical summary of the major physical–chemical parameters of the groundwater in the study area.
Table 1.
Statistical summary of the major physical–chemical parameters of the groundwater in the study area.
| pH | Eh | TDS | Ca2+ | Mg2+ | Na+ | K+ | HCO3− | SO42− | Cl− | NO3− | NH4+ | Fe2+ | As | |
|---|---|---|---|---|---|---|---|---|---|---|---|---|---|---|
| mV | mg/L | mg/L | mg/L | mg/L | mg/L | mg/L | mg/L | mg/L | mg/L | mg/L | mg/L | μg/L | ||
| Total (n = 203) | ||||||||||||||
| Min | 6.3 | –173.0 | 360.1 | 28.1 | 16.9 | 34.0 | 0.3 | 270.9 | 3.0 | 13.4 | <0.01 | <0.03 | <0.04 | <1.0 |
| Max | 8.5 | 373.0 | 8692.5 | 639.7 | 713.6 | 1775.0 | 170.0 | 1295.7 | 3108.6 | 2428.9 | 68.4 | 5.1 | 12.8 | 105.0 |
| Mean | 7.5 | 38.3 | 1889.3 | 137.4 | 140.0 | 341.5 | 4.1 | 729.5 | 478.2 | 390.3 | 2.7 | 0.2 | 1.0 | 10.1 |
| Median | 7.4 | 19.2 | 1445.2 | 118.7 | 111.6 | 256.8 | 1.1 | 715.1 | 290.1 | 261.4 | 0.4 | 0.1 | 0.1 | 1.0 |
| SD | 0.5 | 95.7 | 1413.2 | 83.2 | 104.5 | 292.3 | 16.1 | 197.2 | 539.9 | 394.9 | 8.6 | 0.5 | 1.9 | 18.1 |
| CV | 0.1 | 2.5 | 0.7 | 0.6 | 0.7 | 0.9 | 3.9 | 0.3 | 1.1 | 1.0 | 3.2 | 2.5 | 1.9 | 1.8 |
| C2 (n = 103) | ||||||||||||||
| Min | 6.3 | –130.5 | 638.9 | 28.9 | 36.3 | 61.0 | 0.4 | 412.3 | 16.6 | 13.4 | <0.01 | <0.03 | <0.04 | <1.0 |
| Max | 8.2 | 373.0 | 8692.5 | 462.1 | 713.6 | 1700.0 | 170.0 | 1295.7 | 3108.6 | 2297.6 | 56.0 | 5.1 | 12.8 | 88.0 |
| Mean | 7.2 | 34.3 | 2250.6 | 151.6 | 170.0 | 412.0 | 4.5 | 787.6 | 616.3 | 473.9 | 2.34 | 0.2 | 1.4 | 10.4 |
| Median | 7.1 | 14.8 | 1937.8 | 136.9 | 131.2 | 300.0 | 1.2 | 771.5 | 420.6 | 368.7 | 0.4 | 0.1 | 0.3 | 1.0 |
| SD | 0.3 | 97.3 | 1520.3 | 80.4 | 114.6 | 318.0 | 19.7 | 187.2 | 621.3 | 410.6 | 7.4 | 0.5 | 2.5 | 17.6 |
| CV | 0.05 | 2.8 | 0.7 | 0.5 | 0.7 | 0.8 | 4.4 | 0.2 | 1.0 | 0.9 | 3.2 | 2.6 | 1.8 | 1.7 |
| C3 (n = 30) | ||||||||||||||
| Min | 7.0 | –173.0 | 616.1 | 40.7 | 50.6 | 44.5 | 0.3 | 429.9 | 3.0 | 24.3 | <0.01 | 0.08 | <0.04 | <1.0 |
| Max | 8.5 | 266.0 | 8126.0 | 639.7 | 572.2 | 1775.0 | 91.3 | 1071.9 | 2525.5 | 2428.9 | 32.0 | 0.7 | 4.4 | 34.0 |
| Mean | 7.6 | 79.9 | 1955.1 | 124.6 | 139.8 | 379.5 | 4.7 | 711.9 | 513.3 | 412.6 | 2.28 | 0.2 | 0.5 | 5.0 |
| Median | 7.4 | 105.5 | 1407.2 | 94.2 | 109.0 | 296.0 | 0.9 | 695.0 | 310.9 | 241.9 | 0.4 | 0.1 | 0.1 | 1.0 |
| SD | 0.5 | 96.3 | 1604.3 | 108.9 | 102.6 | 345.6 | 16.3 | 174.1 | 569.0 | 486.9 | 6.0 | 0.2 | 1.0 | 8.9 |
| CV | 0.1 | 1.2 | 0.8 | 0.9 | 0.7 | 0.9 | 3.5 | 0.2 | 1.1 | 1.2 | 2.6 | 1.0 | 1.8 | 1.8 |
| C4 (n = 56) | ||||||||||||||
| Min | 6.9 | –141.0 | 580.5 | 28.1 | 27.3 | 60.0 | 0.3 | 290.1 | 27.6 | 24.7 | <0.01 | 0.09 | <0.04 | <1.0 |
| Max | 8.5 | 224.0 | 4638.5 | 327.3 | 352.9 | 800.0 | 45.5 | 1192.7 | 1027.9 | 1379.1 | 68.4 | 4.3 | 4.1 | 105.0 |
| Mean | 7.9 | 32.9 | 1308.9 | 119.2 | 91.3 | 226.0 | 3.1 | 659.5 | 263.7 | 246.6 | 2.5 | 0.2 | 0.7 | 13.3 |
| Median | 7.9 | 19.0 | 1160.0 | 112.3 | 79.8 | 202.0 | 1.1 | 635.1 | 214.4 | 186.8 | 0.4 | 0.1 | 0.1 | 1.0 |
| SD | 0.4 | 93.8 | 681.1 | 60.6 | 51.7 | 133.0 | 8.2 | 186.7 | 203.4 | 231.2 | 9.6 | 0.6 | 1.0 | 23.0 |
| CV | 0.1 | 2.9 | 0.5 | 0.5 | 0.6 | 0.6 | 2.6 | 0.3 | 0.8 | 0.9 | 3.8 | 2.5 | 1.4 | 1.7 |
| C5 (n = 14) | ||||||||||||||
| Min | 7.0 | –122.0 | 360.1 | 51.4 | 16.9 | 34.0 | 0.3 | 270.9 | 33.2 | 32.9 | <0.01 | 0.10 | <0.04 | <1.0 |
| Max | 8.1 | 94.0 | 6099.0 | 414.9 | 467.3 | 935.0 | 22.3 | 993.4 | 1569.5 | 1490.0 | 45.0 | 0.1 | 2.8 | 27.0 |
| Mean | 7.6 | 0.2 | 1412.4 | 133.2 | 114.5 | 203.2 | 4.0 | 619.4 | 244.4 | 302.1 | 6.9 | 0.1 | 0.4 | 5.8 |
| Median | 7.6 | 0.0 | 909.3 | 106.6 | 84.5 | 113.8 | 1.0 | 602.6 | 102.3 | 133.3 | 0.4 | 0.1 | 0.0 | 1.0 |
| SD | 0.3 | 51.3 | 1427.0 | 98.0 | 107.4 | 237.1 | 7.3 | 210.9 | 381.2 | 395.8 | 15.2 | 0.0 | 0.9 | 8.7 |
| CV | 0.04 | 269.0 | 1.0 | 0.7 | 0.9 | 1.2 | 1.8 | 0.3 | 1.6 | 1.3 | 2.2 | 0.0 | 2.1 | 1.5 |
SD: standard deviation; CV: coefficient of variation; CV = SD/average.
Publisher’s Note: MDPI stays neutral with regard to jurisdictional claims in published maps and institutional affiliations. |
© 2021 by the authors. Licensee MDPI, Basel, Switzerland. This article is an open access article distributed under the terms and conditions of the Creative Commons Attribution (CC BY) license (http://creativecommons.org/licenses/by/4.0/).
Share and Cite
MDPI and ACS Style
Zhi, C.; Cao, W.; Wang, Z.; Li, Z. High-Arsenic Groundwater in Paleochannels of the Lower Yellow River, China: Distribution and Genesis Mechanisms. Water 2021, 13, 338. https://doi.org/10.3390/w13030338
AMA Style
Zhi C, Cao W, Wang Z, Li Z. High-Arsenic Groundwater in Paleochannels of the Lower Yellow River, China: Distribution and Genesis Mechanisms. Water. 2021; 13(3):338. https://doi.org/10.3390/w13030338
Chicago/Turabian StyleZhi, Chuanshun, Wengeng Cao, Zhen Wang, and Zeyan Li. 2021. "High-Arsenic Groundwater in Paleochannels of the Lower Yellow River, China: Distribution and Genesis Mechanisms" Water 13, no. 3: 338. https://doi.org/10.3390/w13030338
Note that from the first issue of 2016, this journal uses article numbers instead of page numbers. See further details here.