Article

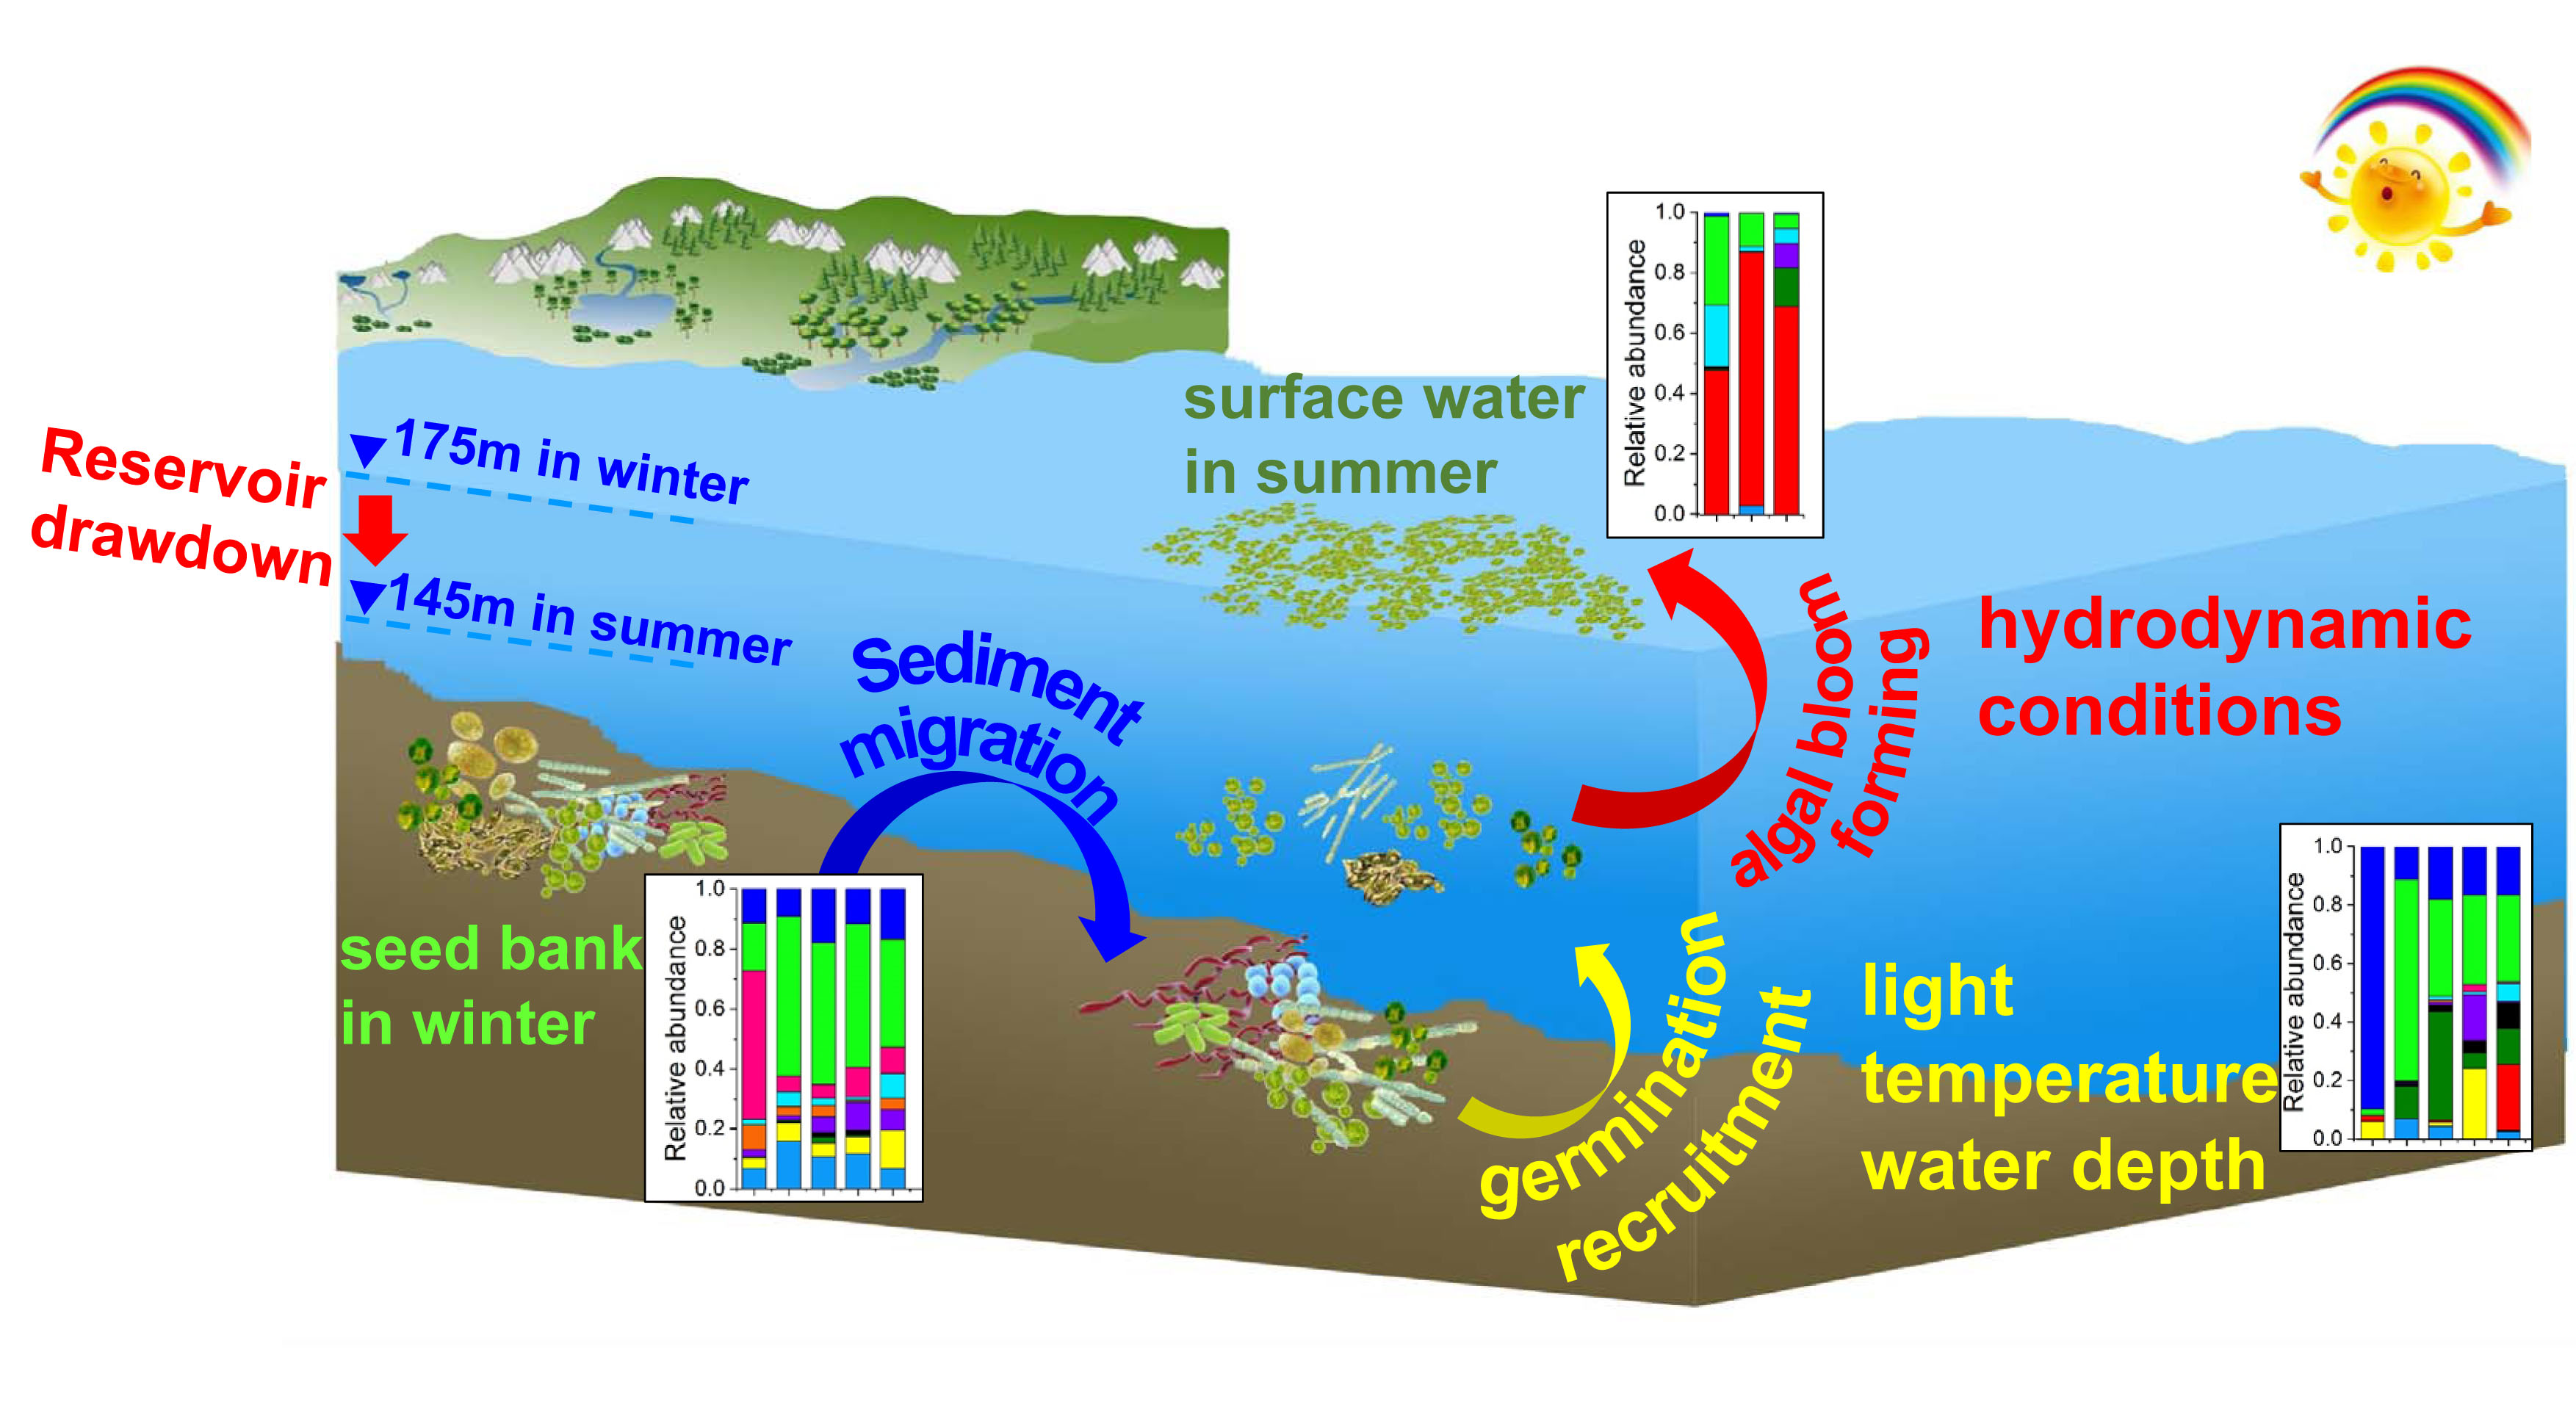
Spatio-Temporal Variations in Phytoplankton Communities in Sediment and Surface Water as Reservoir Drawdown—A Case Study of Pengxi River in Three Gorges Reservoir, China

1
Key Laboratory of Reservoir Aquatic Environment of CAS, Chongqing Institute of Green and Intelligent Technology, Chinese Academy of Sciences, Chongqing 400714, China
2
University of Chinese Academy of Sciences, Beijing 100049, China
3
Key Laboratory of the Three Gorges Reservoir Region’s Eco-Environment, Ministry of Education, Chongqing University, Chongqing 400045, China
*
Author to whom correspondence should be addressed.
Water 2021, 13(3), 340; https://doi.org/10.3390/w13030340
Submission received: 23 November 2020 / Revised: 17 January 2021 / Accepted: 26 January 2021 / Published: 29 January 2021
(This article belongs to the Section Hydrology)

Abstract

:
The resting stages of phytoplankton are usually regarded as the seed bank and source of harmful algal blooms because of the recruitment of phytoplankton from sediment to the water column under suitable environmental conditions. Information about resting stages of phytoplankton is abundant in shallow lakes and littoral sea; yet, studies on river–reservoir systems are rare. The river–reservoir continuum shows a unique structuring of longitudinal gradients of hydrological and hydrodynamic conditions. We hypothesized that the seed bank and algal blooms in reservoirs are influenced by the hydrodynamic conditions of each reservoir. We used Illumina Miseq sequencing to examine the spatio-temporal variation in the phytoplankton community in the sediment as reservoir drawdown and in surface water during algal blooms in Pengxi River, a tributary of China’s Three Gorges Reservoir. The results show that the cyanobacteria community in sediment is significantly influenced by temperature, total carbon, maximum flow velocity, and total phosphorous, the eukaryotic phytoplankton community in sediment is significantly influenced by total phosphorous, temperature, total carbon, maximum flow velocity, and total nitrogen. Additionally, the dominant species in sediment is significantly different from that in surface water during algal blooms. Our results suggest that the dominant species in surface water during algal blooms is more influenced by the environmental factors and hydrodynamic conditions in the water column than the seeds in the sediment. These findings are fundamental for further research on the influence of hydrodynamic conditions on algal blooms in artificially regulated river-reservoir systems.

Graphical Abstract

1. Introduction

The increasingly frequent harmful algal blooms (HABs) are significantly degrading the water quality in both inland and coastal water bodies around the world [1,2], threatening the aquatic environment, freshwater and marine ecosystems, and human health [3,4]. The resting stages of phytoplankton in sediment, which are regarded as the seed bank and source of HABs, have been extensively studied over the past decades [5,6]. A resting strategy in sediment is adapted by many phytoplankton species to survive under stressful environmental conditions, such as cold temperatures, ice cover, and low irradiance [7,8,9]. It is widely accepted that the resting stages of phytoplankton played an important role in initiating blooms of marine dinoflagellates [10,11,12], in blooms of cyanobacteria [9,13,14], and dinoflagellates [13,15] in freshwater. Consequently, the temporal and spatial characteristics of phytoplankton communities in sediment need to be studied.
Phytoplankton in sediment plays an important role in the formation of algal blooms by enhancing recruitment in the upper layer under certain environmental conditions [13,15,16,17]. Many studies have focused on the resting stages of phytoplankton and the factors influencing their recruitment and vertical migration [18,19,20]. Many factors have been found to affect the recruitment of the resting stages of phytoplankton: nutrient level [21,22,23], meteorological factors (temperature and radiation) [8,18,21,23,24,25], hydrological and hydrodynamic conditions (depth of water, thermocline, the turbulence of sediment, etc.) [8,13,18,26], and biological factors (size of colonies, synthesis of microcystin, and interaction with other species) [22,23,26,27,28,29].
Reservoirs perform invaluable functions such as fresh water supply, flood control, and hydropower generation. The number of reservoirs in the world is increasing, and most large- and medium-sized rivers have become cascade reservoirs. Reservoirs are one of the most important components of freshwater ecosystems; however, researches on the resting stages of phytoplankton have been mainly conducted in shallow lakes and littoral sea area, while studies on reservoirs are scarce [30,31].
Reservoirs exhibit a transition from lotic to lentic systems, so their physicochemical and hydrodynamic conditions reveal a transition from riverine to lacustrine, not only along the longitudinal axis, but also along the process of seasonal regulation [30,32,33,34]. Reservoir riverine zones are characterized by shorter hydraulic retention times (HRTs), higher water flow, and shallower depth of water column. However, these characters in a lacustrine zone are the opposite. So, the reservoir provides an ideal opportunity to examine phytoplankton community variation under spatial and temporal environmental conditions. During reservoir drawdown, the turbulence of sediment, flow velocity, thermal stratification, water depth, and nutrient retention [21,35,36] change with the hydrodynamic conditions. However, it is unclear whether these factors influence the communities of resting stages of phytoplankton in sediment [8,21], which ultimately influence their germination, vertical migration, and recruitment, and thereby the formation of algal blooms.
The Three Gorges Reservoir (TGR), constructed by China’s Three Gorges project, is operated by anti-season water level manipulation, and it maintains a water level of 175 m in winter and 145 m in summer [37,38]. As a consequence, the soil is submerged, HRT increases, followed by the deposition of sediment and increase in light transmittance throughout the water column. The risk of HABs in the backwater area of tributaries has been increasing in spring, summer, and autumn after the impoundment of the TGR [39,40]. It reported that the main reasons for HABs in the TGR are thermal stratification, increased euphotic depth [41,42,43], and the nutrients releasing after soil submergence. The period of water discharge from the TGR between early spring and early summer is consistent with the sensitive period for the recruitment of algal resting stages and the outbreak of HABs. However, the relationship between the dynamic fluctuation in water and the outbreak of algal blooms are unclear until now. The effects of the hydrodynamic conditions on the phytoplankton community in surface water during algal blooms are previously unknown.
In this study, we investigated the spatio-temporal variations in the phytoplankton community to examine the relationship between the resting stages of phytoplankton in sediment and the dynamic conditions of the reservoir, and the relationship between the phytoplankton community in surface water during algal blooms and the dynamic conditions of the reservoir. For this purpose, Pengxi River, the largest tributary in the middle reaches of the TGR, was selected. The communities of the cyanobacteria and eukaryotic phytoplankton in sediment and water during algal blooms were analyzed using 16S rRNA and 18S rRNA gene high-throughput sequencing. Moreover, we further studied the variations in community composition across the sites and we examined the effect of environmental parameters upon them. Our results provide valuable insights into understanding the influence of the hydrodynamic conditions on HABs in artificially river-reservoir systems.

2. Materials and Methods

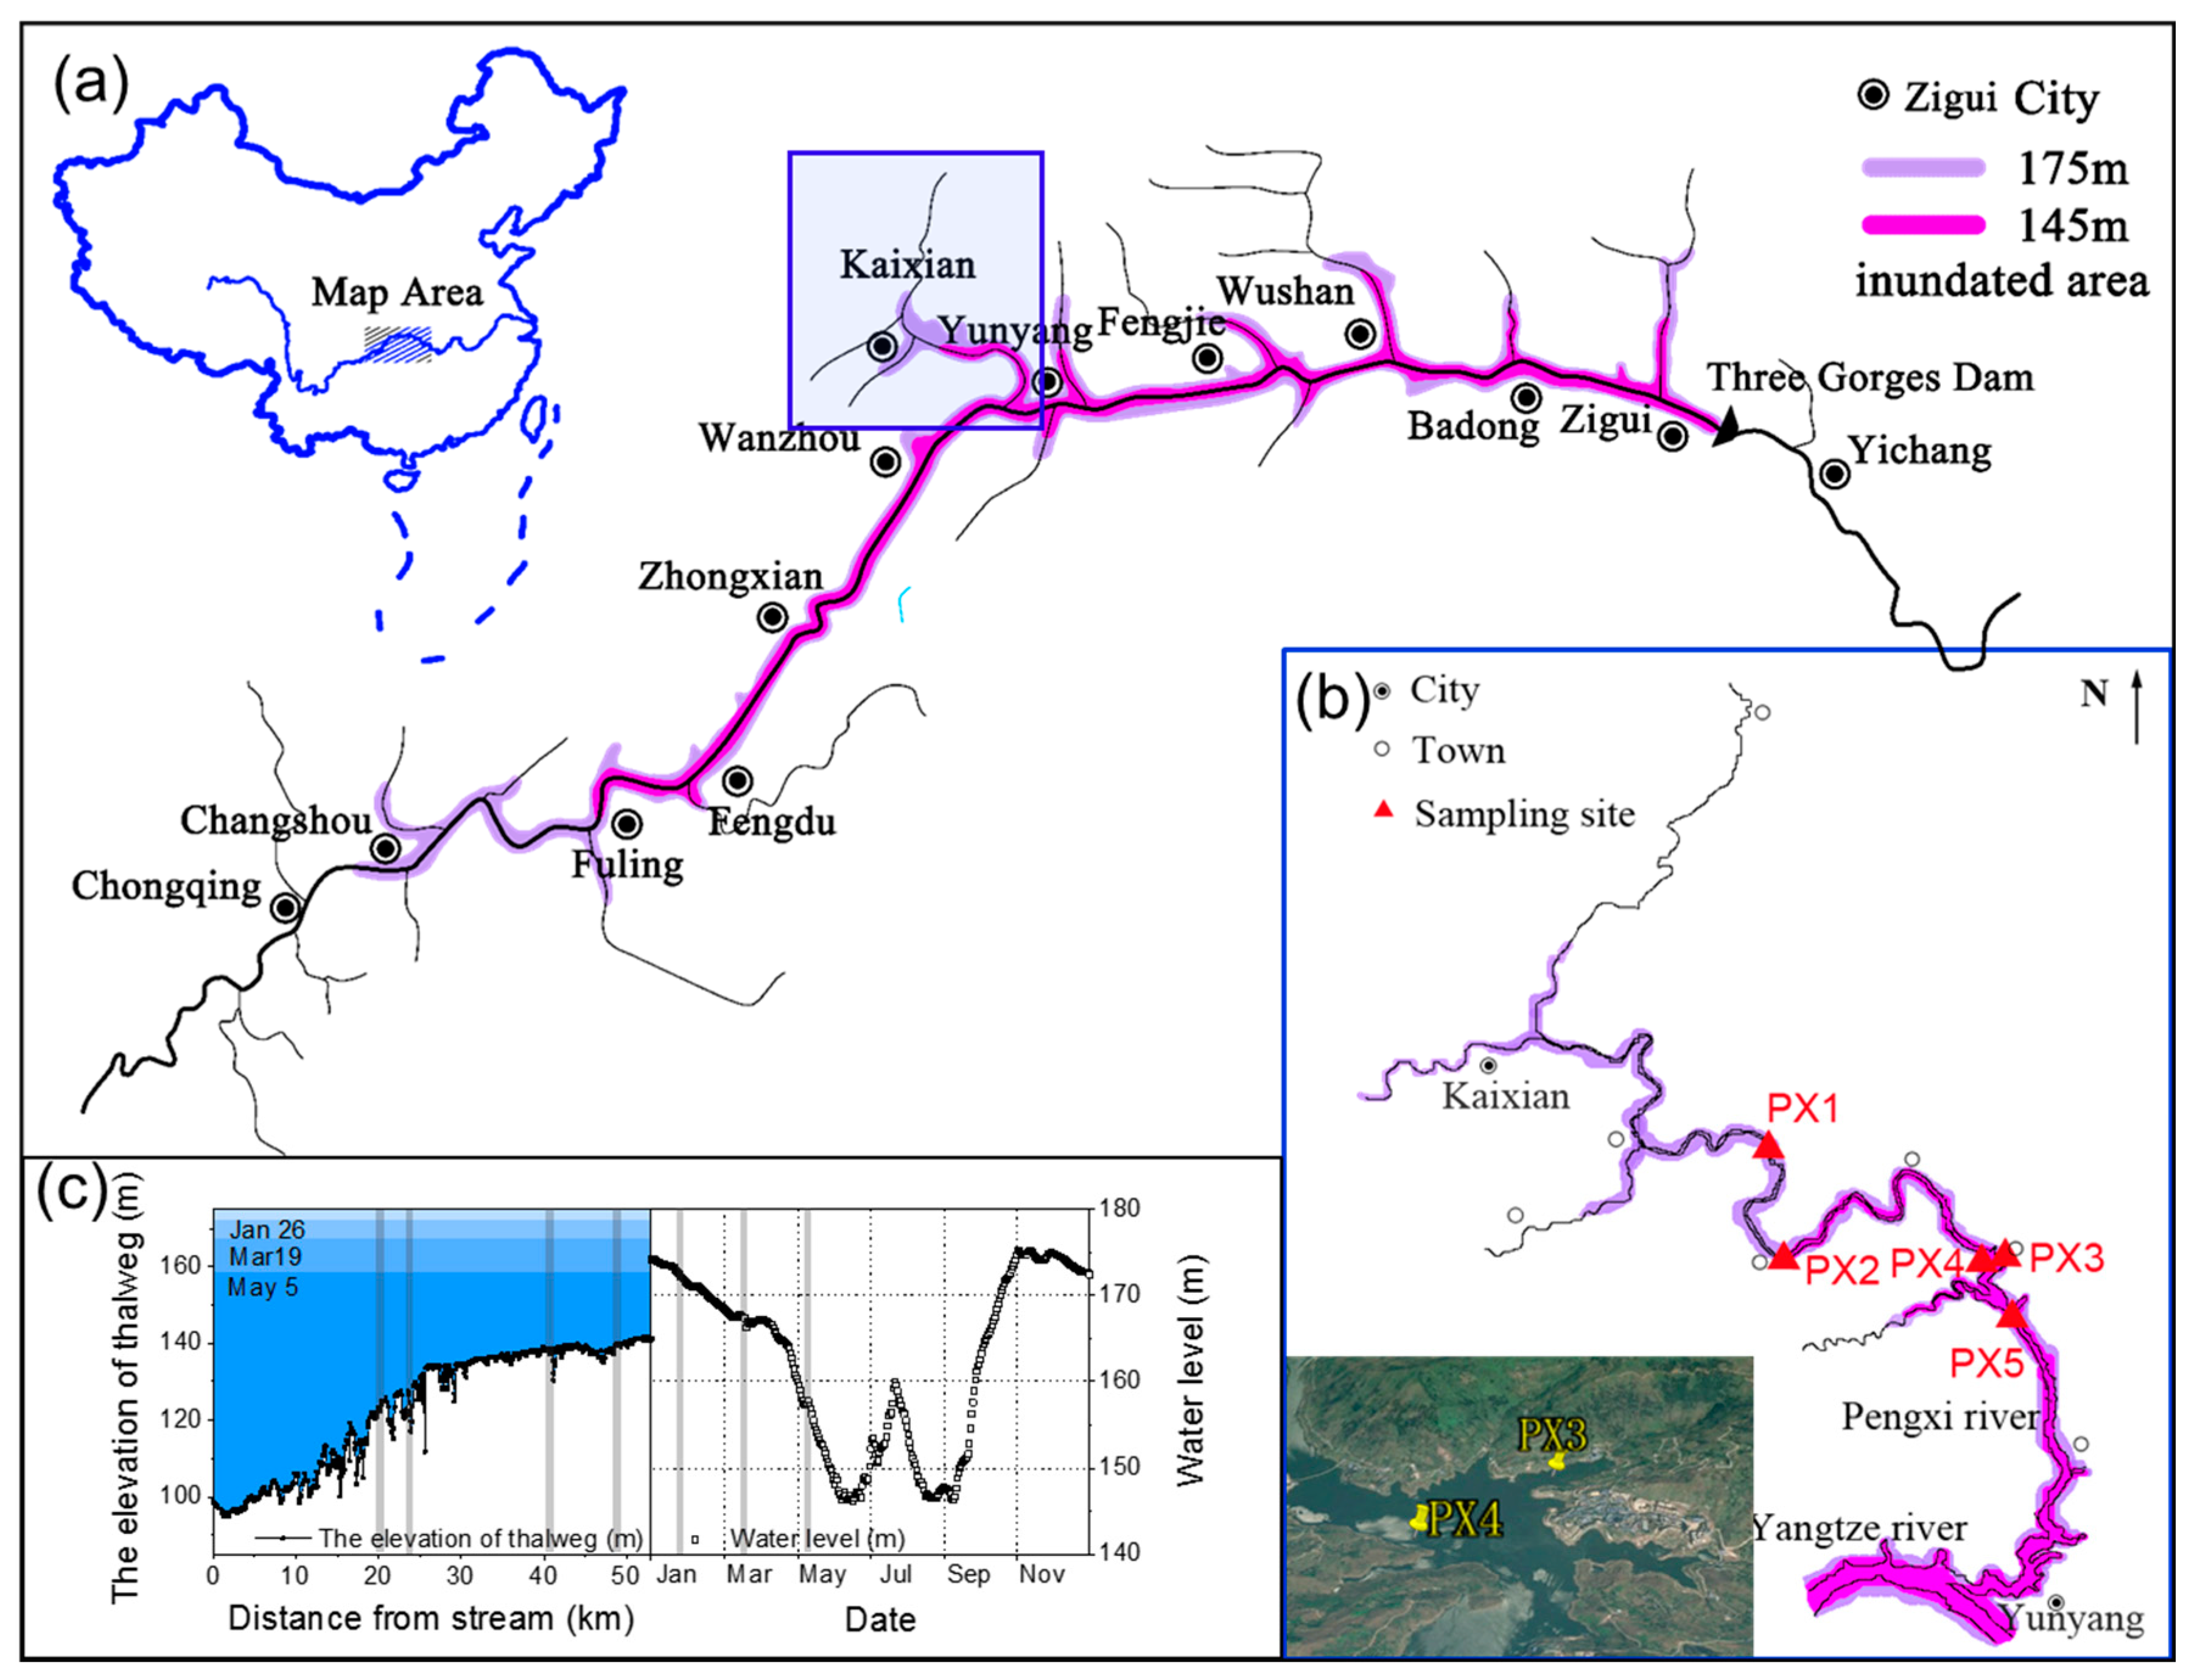
2.1. Study Area and Sample Collection

The TGR has a total storage capacity of 39 billion m3, a surface area of 1084 km2, and a backwater area length of 663 km. Pengxi River is one of the largest tributaries located at the middle reaches of the Yangtze River in the TGR, about 250 km upstream of the Three Gorges Dam (TGD). The main stream length of the Pengxi River is about 182 km, ranging from 31°00′ N, 107°56′ E to 31°42′ N, 108°54′ E. After the impoundment of the TGR, algal blooms occurred every year in the backwater area of Pengxi River. From upstream to downstream along the longitudinal axis of the Pengxi River, five sampling sites were chosen: PX1 (31°8′49″ N, 108°32′41″ E), PX2 (31°5′13″ N, 108°34′19″ E), PX3 (31°6′16″ N, 108°40′29″ E), PX4 (31°5′47″ N, 108°39′55″ E), and PX5 (31°3′35″ N, 108°41′30″ E), located 48.74, 41.3, 23.9, 23.9, and 20.4 km from the confluence, respectively (Figure 1). Samples of water and sediment were collected on 26 January, 19 March, and 5 May in 2016. The sampling times corresponded to the initial, middle, and late discharge periods of the TGR, respectively. The sampling points covered the period during which algal blooms occurred in spring. Algal blooms occur frequently in Gaoyang Lake (Figure 1b). It has a water surface area of 4–5 km2 and an average depth of less than 10 m, when the water level of the TGR is of 145 m. PX3 is located in the bay of Gaoyang Lake, and PX4 is located in the main river channel. Both sites are at the same longitudinal location. According to our studies over the past fifteen years, the hydrodynamic parameters differ between PX3 and PX4; however, the physicochemical parameters are similar. Thus, PX4 has the same physicochemical characteristics as PX3, but has its own hydrodynamic characteristics. Phytoplankton communities both in PX3 and PX4 were microscopically examined, and no significant differences were found in composition and abundance.
Water samples were collected 0.5 m below the water surface and subsampled for physiochemical analysis, phytoplankton identification, and DNA-based analysis. About 1 L of the water sample was subsequently filtered through a 0.22 μm filter membrane (Millipore, Billerica, MA, USA) for DNA extraction, and the filters were stored at −86 °C until DNA extraction. About 2 L of the water sample was immediately preserved using 1% Lugol’s solution on site for microscopic identification of phytoplankton. Surface sediment was collected using a van Veen grab sampler, then each sample was thoroughly mixed, and a 10 g sediment sample was stored in alcohol-sterilized sterile plastic tubes at −86 °C.

2.2. Analysis of Physicochemical Factors

The water level of the TGR at the dam site was obtained from the website of the China Three Gorges Corporation (http://www.ctgpc.com.cn/). Temperature (T), conductivity, pH, and dissolved oxygen (DO) were measured in situ using a YSI Pro2030 (YSI Incorporated, Yellow Springs, OH, USA). Total carbon (TC) and total organic carbon (TOC) were measured by a Vario TOC Cube analyzer (Elemen-tar, Hanau, Germany). Total nitrogen (TN) and total phosphorous (TP) were analyzed following the National Standard method (HJ636-2012, GB11893-89) with a UV-2700 spectrophotometer (Shimadzu, Kyoto, Japan). Chlorophyll a (Chla) was extracted from a Whatman GF/C filter for 24 h with 90% acetone, centrifuged at 3000 rpm for 10 min, and then spectrophotometrically quantified. The water flow velocity of the study area was calculated using a previously described model [44]. Phytoplankton cells in surface water were identified and counted under microscope at 400× magnification (Olympus BX51, Tokyo, Japan) according to [45].

2.3. DNA Extraction and Polymerase Chain Reaction (PCR)

Total DNA was extracted from the 0.22 μm filters and sediment using the FastDNA SPIN Kit for Soil (MP Biomedicals™, Santa Ana, CA, USA), according to the manufacturer’s instructions. The V3–V4 region of the bacterial 16S rRNA gene was amplified using the 338F/806R primer set. All PCR amplifications were conducted in triplicate for each sample using the following program: 3 min of denaturation at 95 °C, 27 cycles of 30 s at 95 °C, 30 s for annealing at 55 °C, and 45 s for elongation at 72 °C, and a final extension at 72 °C for 10 min. A 20 μL reaction mixture for PCR amplification is: 4 μL of 5× FastPfu Buffer, 2 μL of 2.5 mM dNTPs, 0.8 μL of each primer (5 μM), 0.4 μL of FastPfu Polymerase, and 10 ng of template DNA. The resulting PCR products were extracted from a 2% agarose gel and further purified using an AxyPrep DNA Gel Extraction Kit (Axygen Biosciences, Union City, CA, USA) and quantified using QuantiFluor™-ST (Promega, Madison, WI, USA) according to the manufacturer’s protocol.
The V4 region of the eukaryotic 18S rRNA gene was amplified using the 3NDF/V4-euk-R2 primer (5′-GGCAAGTCTGGTGCCAG-3′/5′-ACGGTATCTRATCRTCTTCG-3′) [46]. All PCR reactions were conducted with the same programs and conditions as for 16S rRNA except that the 27 cycles were replaced by 37 cycles.

2.4. Illumina MiSeq Sequencing and Analysis

Purified amplicons were pooled in equimolar and paired-end sequenced (2 × 300) on an Illumina MiSeq platform (Illumina, San Diego, CA, USA) according to the standard protocols by Majorbio Bio-Pharm Technology Co. Ltd. (Shanghai, China). The raw reads were deposited into the National Center for Biotechnology Information (NCBI) Sequence Read Archive (SRA) database (accession number: SRP229160).
Raw fastq files were demultiplexed, quality-filtered by Trimmomatic, and merged by FLASH with the following criteria: (i) the reads were truncated at any site receiving an average quality score <20 over a 50 bp sliding window; (ii) primers were exactly matched allowing 2 nucleotide mismatching and reads containing ambiguous bases were removed; (iii) sequences whose overlap was longer than 10 bp were merged according to their overlap sequence.
Operational taxonomic units (OTUs) were clustered with 97% similarity cutoff using UPARSE (version 7.1 http://drive5.com/uparse/), and chimeric sequences were identified and removed using UCHIME. The taxonomy of each 16S rRNA gene sequence was analyzed using the RDP Classifier algorithm (http://rdp.cme.msu.edu/) against the Silva (SSU128) 16S rRNA using confidence threshold of 70%. The taxonomy of each 18S rRNA gene sequence was analyzed following the same as for the Silva (SSU128) 18S rRNA database.

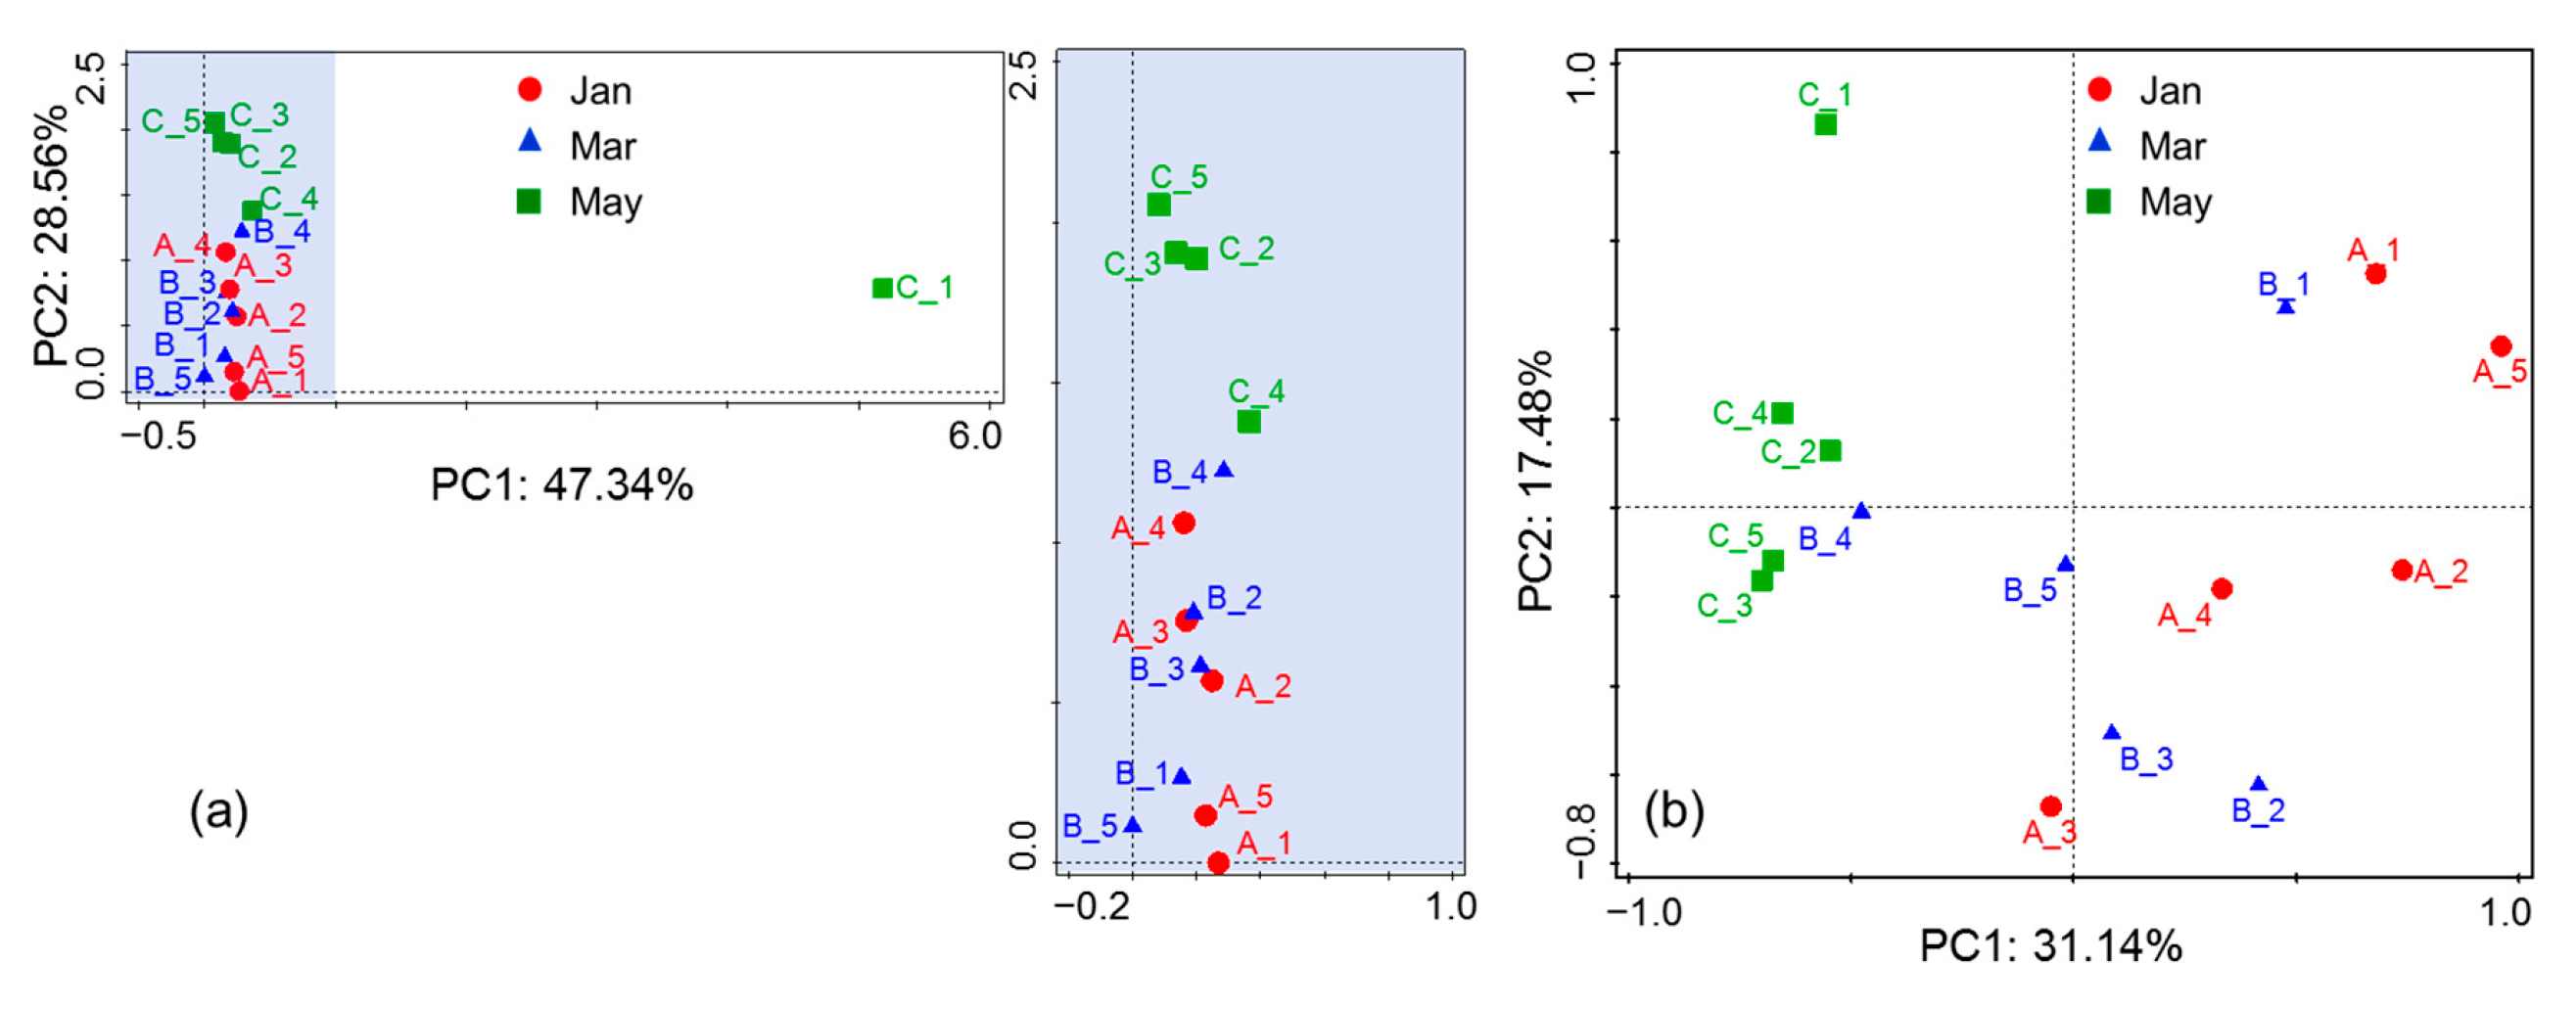
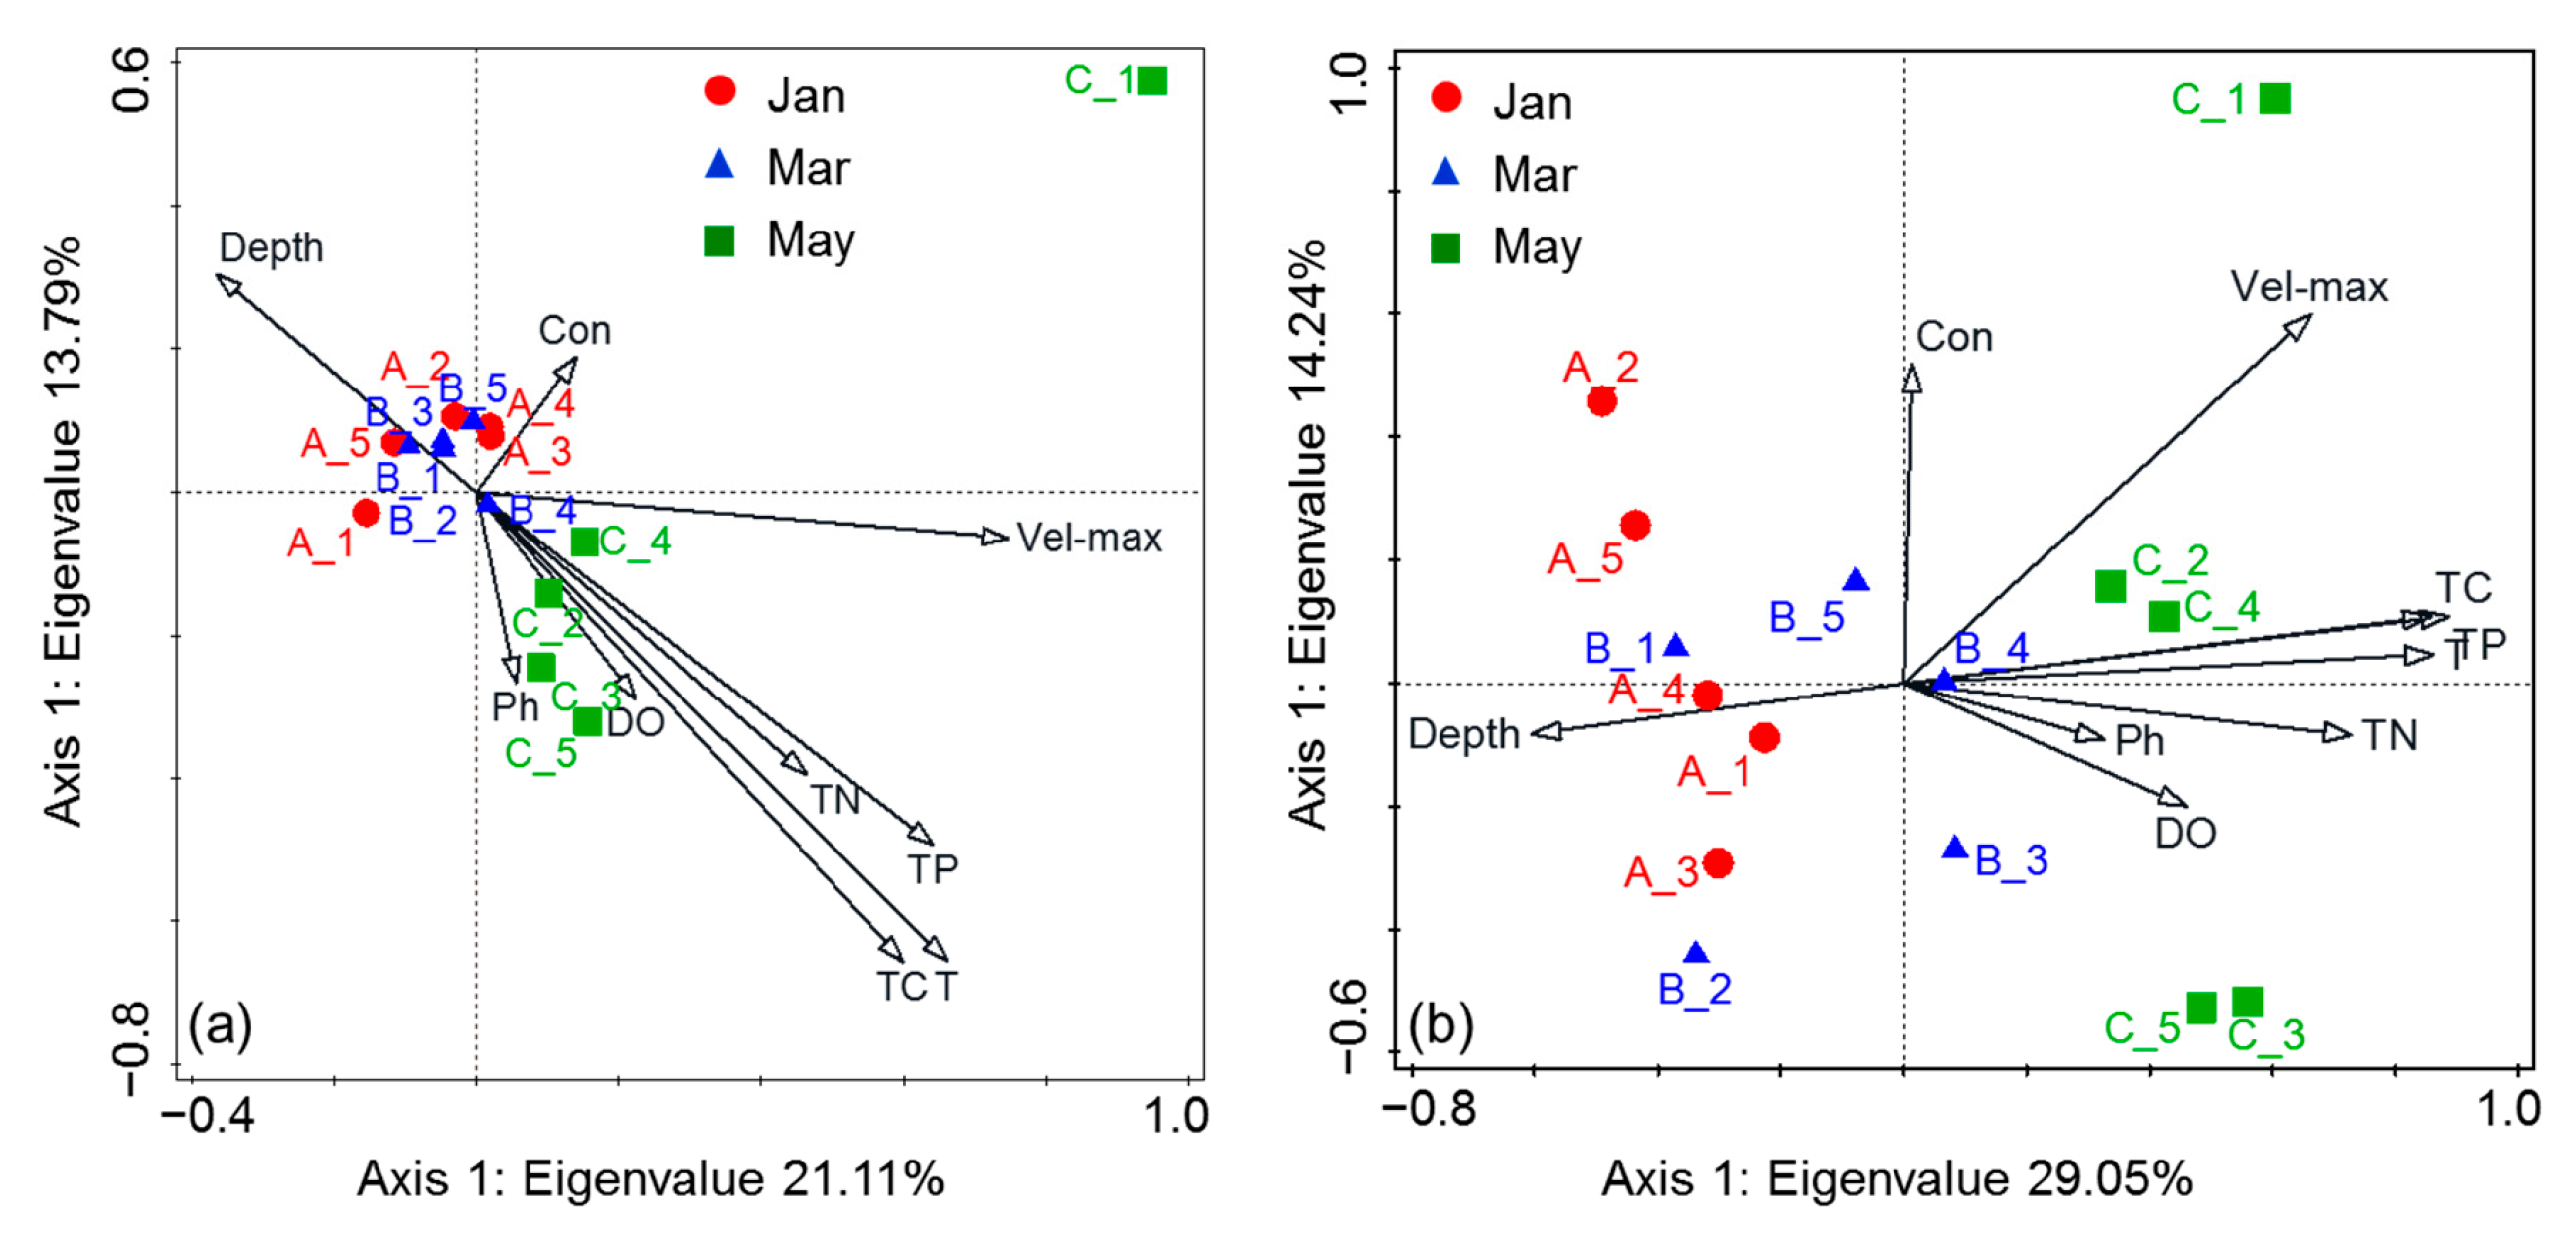
2.5. Statistics Analysis

The OTU distribution of cyanobacteria and eukaryotic phytoplankton community composition in sediment was statically analyzed by principal components analysis (PCA) and detrended correspondence analysis (DCA). To further determine the environmental variables associated with changes in phytoplankton community structure, redundancy analysis (RDA) was performed with contextual parameters that significantly explained variations in phytoplankton fingerprints. PCA, DCA, and RDA were implemented in Canoco for Windows 5.0 software (Microcomputer Power Co., Ithaca, NY, USA). The Student’s t-test and the hierarchical clustering were analyzed on the free online Majorbio Cloud Platform (www.majorbio.com).

3. Results

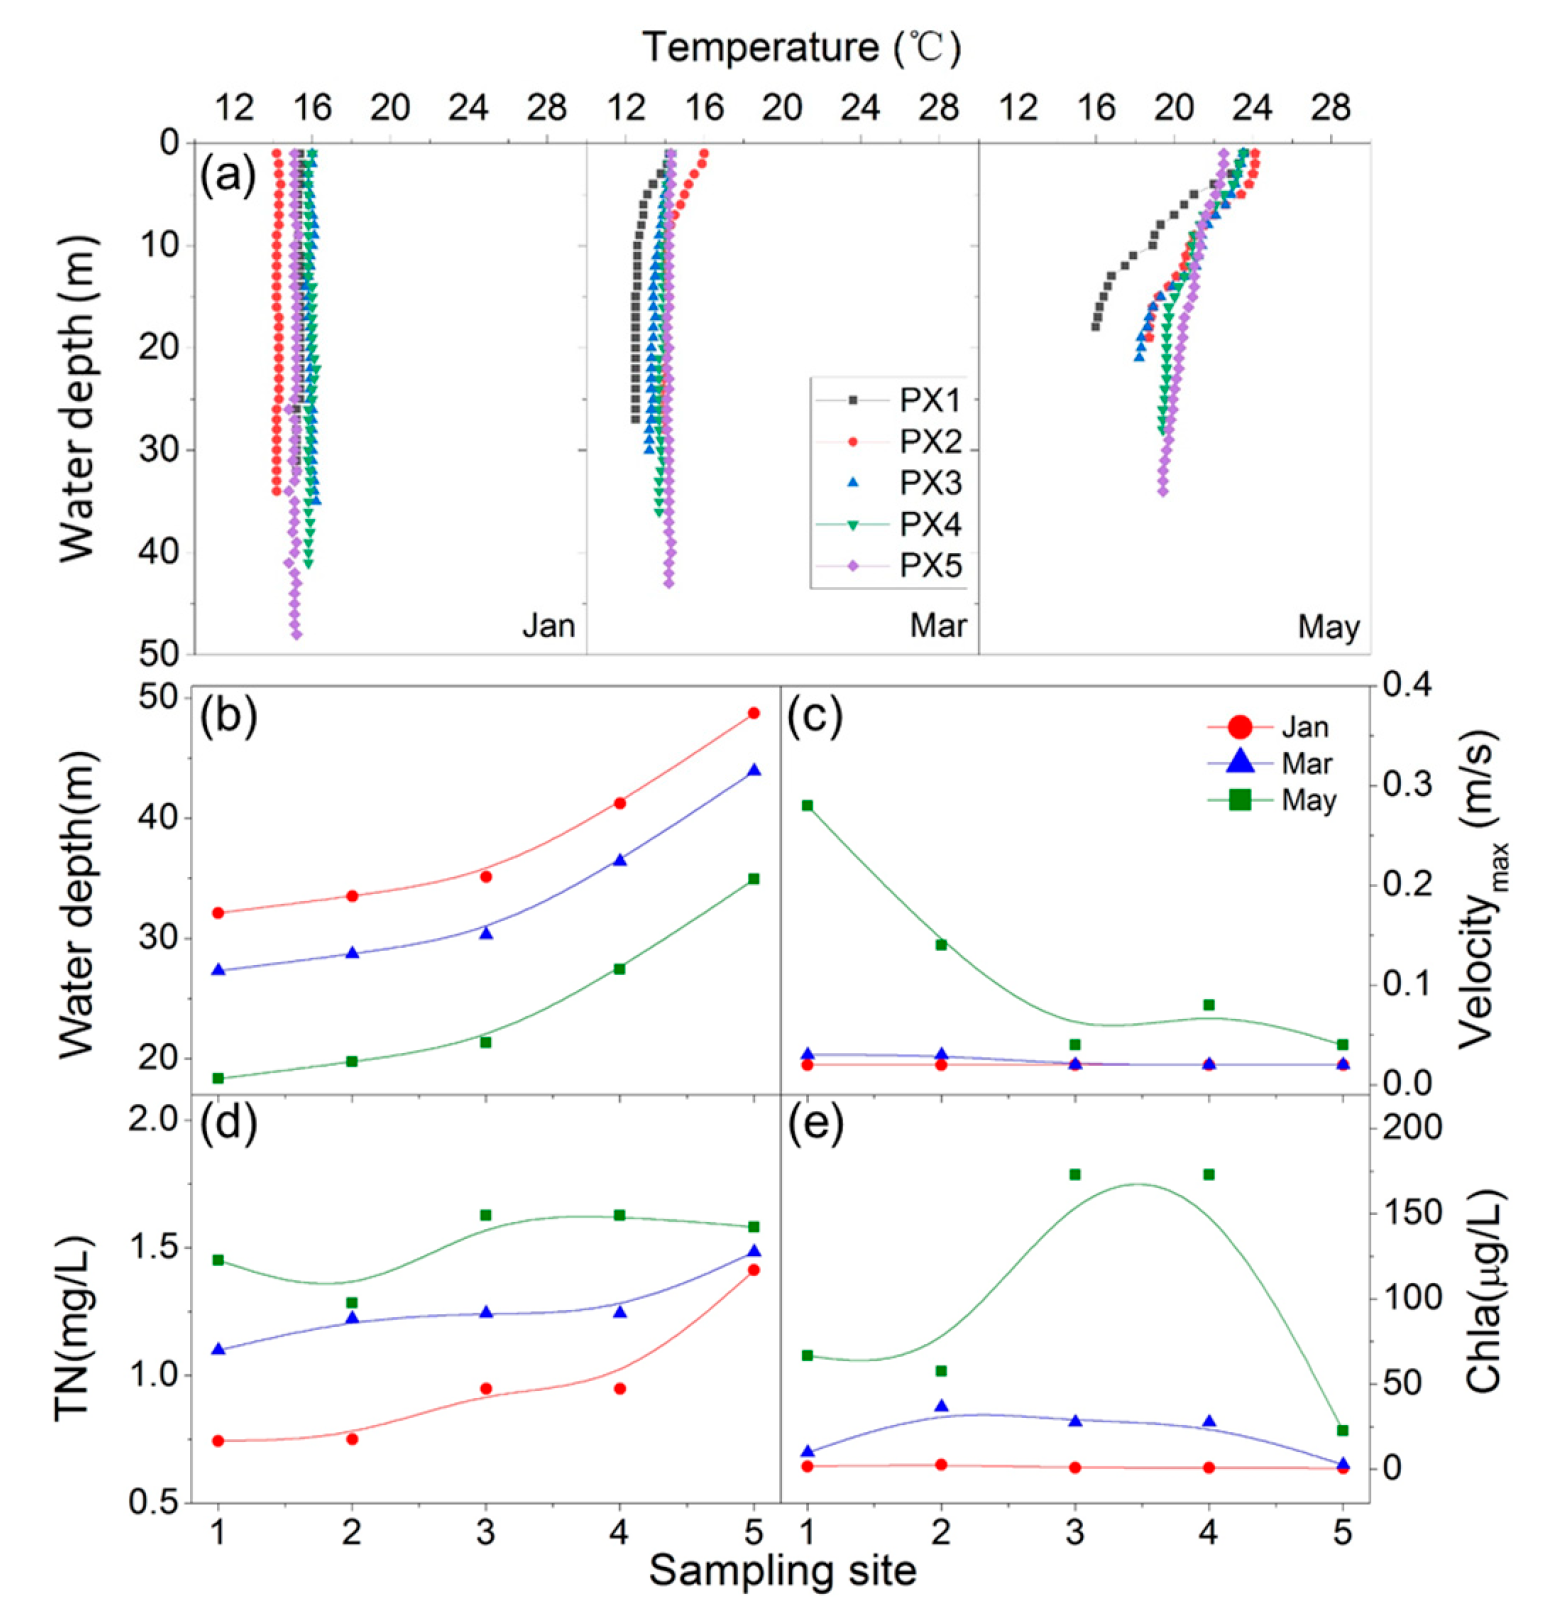
3.1. Environmental Parameters

During the entire TGR drawdown period, the water level (Figure 1c) ranged from 174.17 to 146.28 m, and the water depth decreased from 34.17 to 6.28 m in PX1, from 35.57 to 7.68 m in PX2, from 37.17 to 9.28 m in PX3, from 43.27 to 15.38 m in PX4, and from 50.77 to 22.88 m in PX5. Figure 2a shows the temperature variation, the low water temperature, and the little vertical stratification at all five sites during the initial period of TGR discharge. The maximum water temperature difference between the surface and bottom layers was only 0.4 °C. In the middle period, a weak stratification due to water temperature appeared in PX1, PX2, and PX3. In the late period, stable vertical stratification of water temperature was observed at most sampling sites (Figure 2a). The water was static in January and March, with an average flow velocity of 0.01–0.02 m/s. The flow velocity increased from March to May and, particularly, from downstream to upstream in May. The maximum flow velocity was 0.28 and 0.17 m/s in PX1 and PX2, respectively, and remained about 0.02 m/s at the other sites downstream (Figure 2c). According to the hydrodynamic conditions, the reservoir was characterized by three longitudinal zonations: riverine, transitional, and lacustrine. In January and March, all sites were lacustrine, then PX1 changed to transitional and riverine in May, and the others remained the lacustrine zone.
The TOC, TC, TN, and Chla concentrations increased from January to May at almost all sampling sites, except for TC in PX1 (Table 1, Figure 2d,e). The concentration of Chla exceeded 10 μg/L in March and May at most sampling sites, and the Chla concentration at PX3 in May was the highest during the reservoir drawdown period. The concentration of Chla increased during the TGR drawdown, and with increasing water depth along the longitudinal axis of the backwater, the concentration of Chla first increased and then decreased (Figure 2e). In terms of cell density, Microcystis sp. was microscopically detected as the dominant species in surface water in PX1, PX2, and PX3.

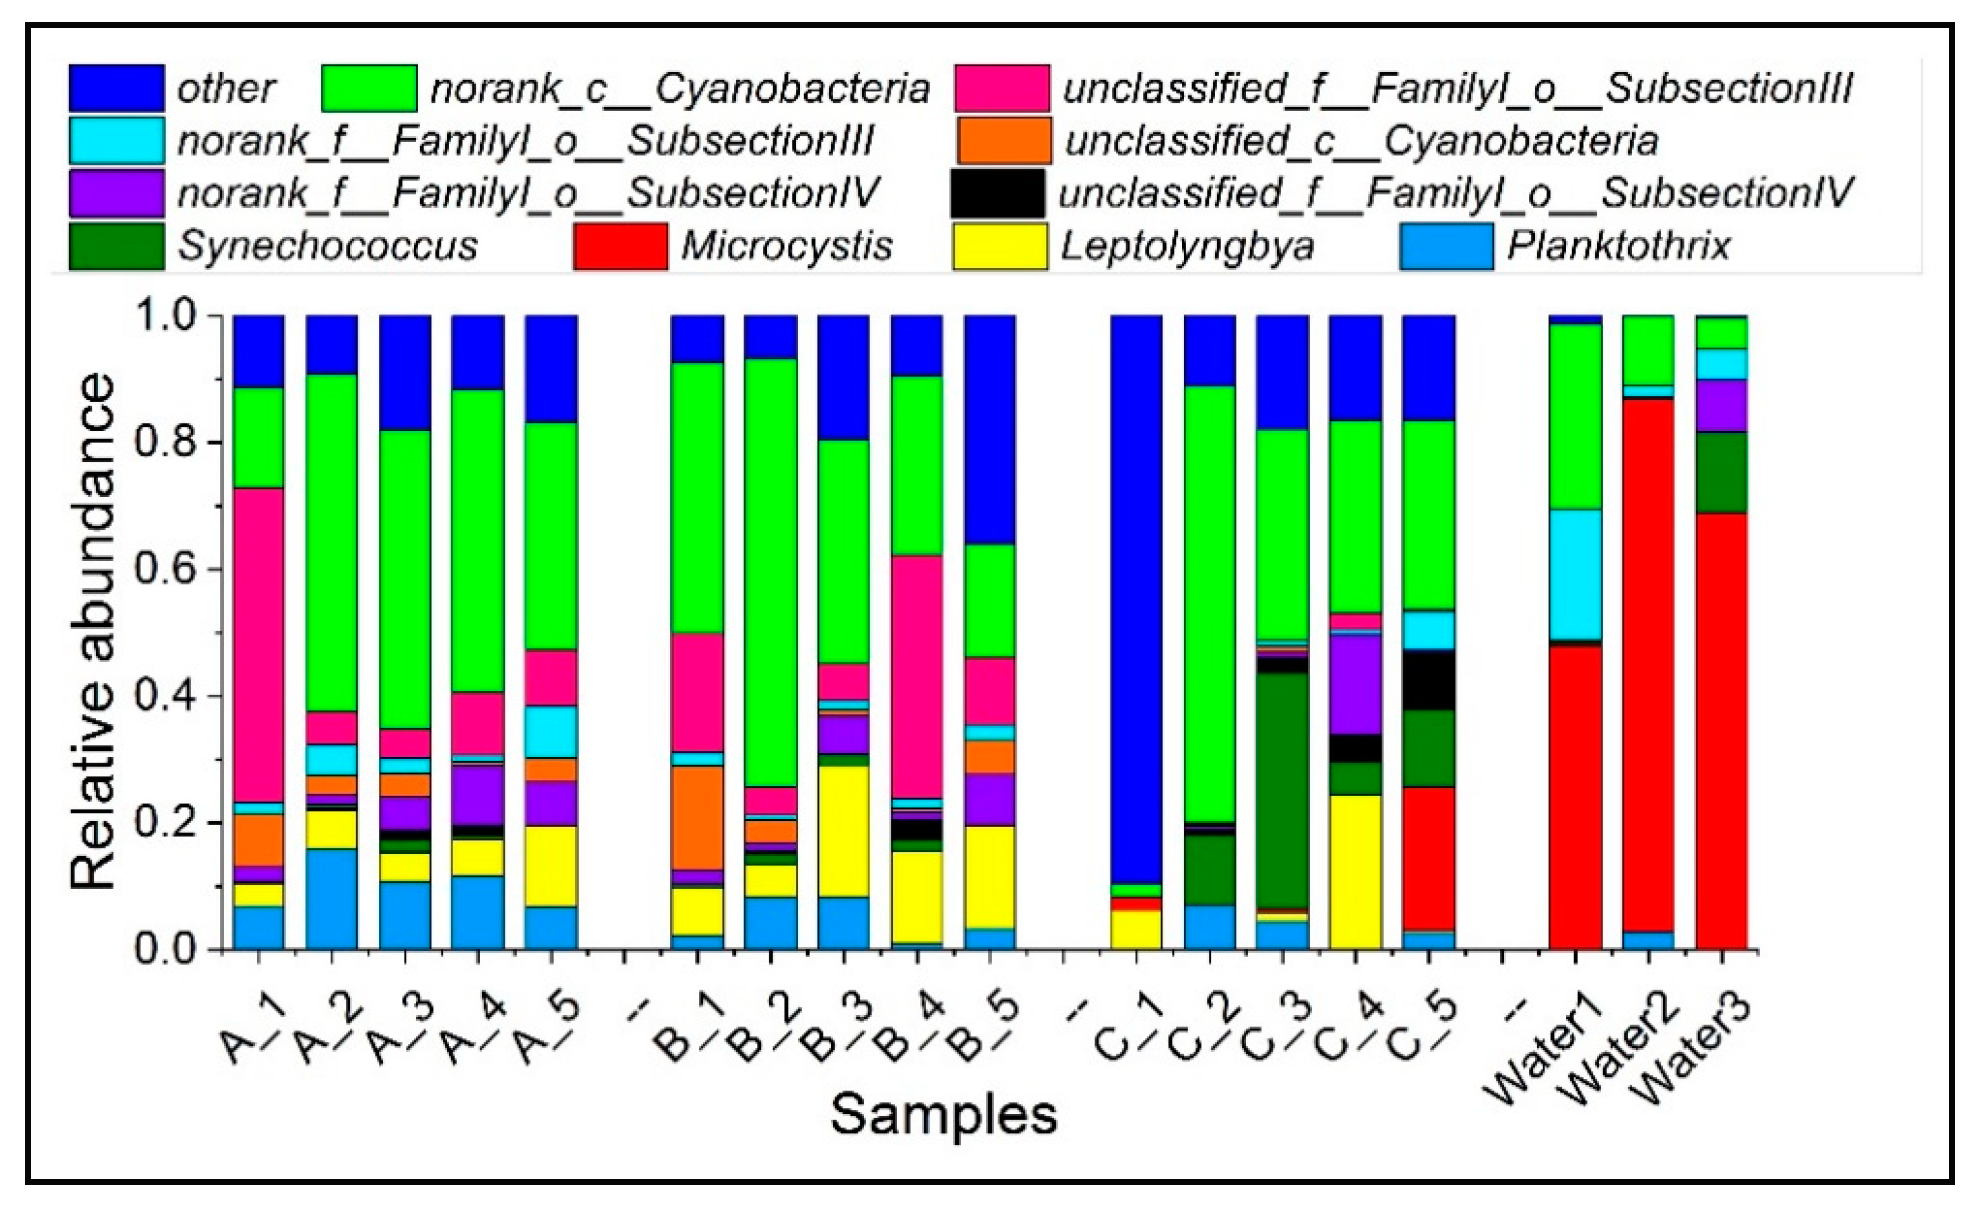
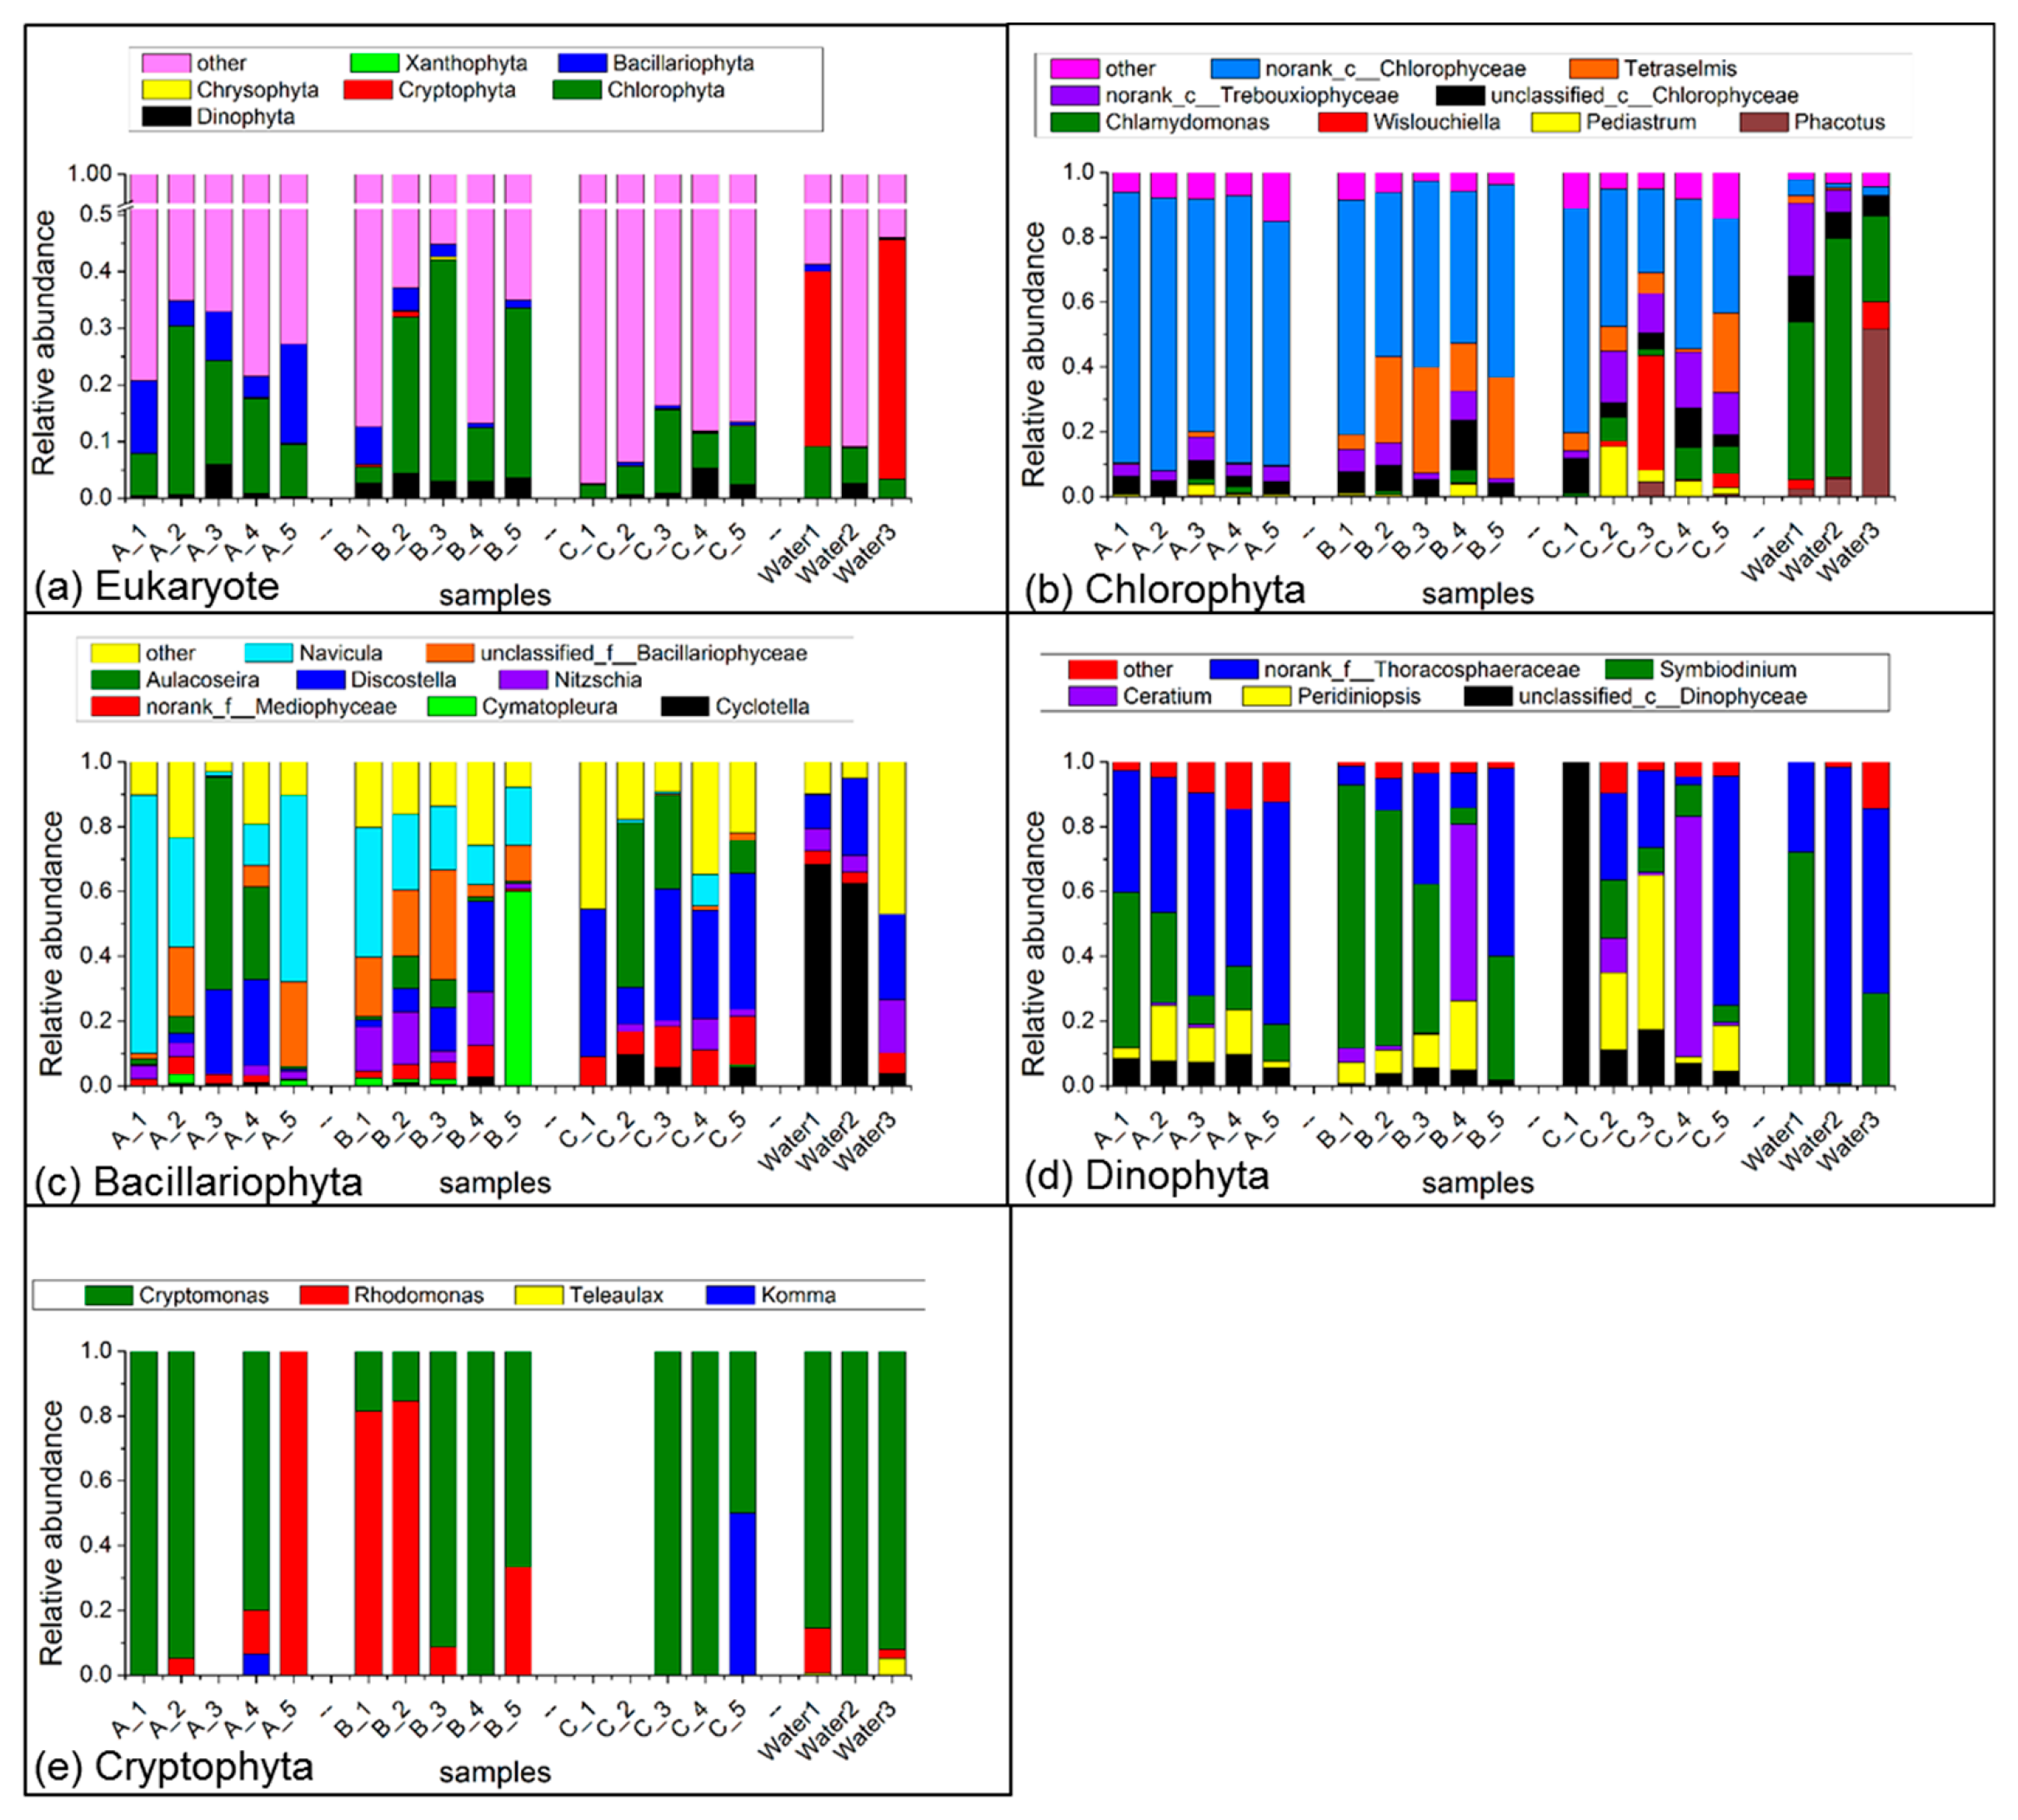
3.2. Phytoplankton Communities in Sediment

Because of the DNA sequencing method, both the benthic microalgae and phytoplankton in sediment were included in our result. For example, Symbiodinium sp. (4 OTUs detected) is a genus of Dinoflagellate symbiont; Cymatopleura sp. (1 OUT detected) is a genus of benthic Bacillariophyta; and Leptolyngbya sp. (19 OTUs detected) is a genus of benthic cyanobacteria. However, we focus on the community variations of phytoplankton resting stages in sediment and phytoplankton in surface water.
A total of 144 OTUs, 30 genera, 10 families, 10 orders, and 1 class were identified and assigned to Cyanobacteria. A total of 310 OTUs, 119 genera, 52 families, 46 orders, 20 classes, and 5 phyla were identified and assigned to eukaryotic microalgae. They included Chlorophyta, Dinophyta, Cryptophyta, Glucophyta, and Ochrophyta, which were further divided into Bacillariophyta, Chrysophyta, and Xanthophyta. The descriptions of total prokaryotic and eukaryotic OTUs are provided in the Supplementary Information.
The analysis of the OTUs showed that in the initial and in the middle periods of TGR discharge, the relative abundance of cyanobacteria in sediment (RAC) was the highest in PX1. The relative abundance of eukaryotic phytoplankton in sediment (RAEP) was higher at PX2, PX3, and PX5 than at the other sites (Table 2). The composition of phytoplankton community among the study sites appeared different in the same period of TGR discharge. For example, the proportion of Synechococcus sp., Planktothrix sp. in Cyanobacteria, and the proportions of Chlorophyta, Bacillariophyta, and Dinophyta in eukaryotic phytoplankton changed in the different sites (Figures S1 and S2; Figure 3 and Figure 4). This suggested the variability of phytoplankton along the longitudinal axis with water level changes within the TGR. The PCA plots (Figure 5; Table S3) show that the difference of phytoplankton communities at different sites were obvious (e.g., PX1 and PX2 in January), especially in the initial and middle periods of TGR discharge. The spatial heterogeneity along the longitudinal axis of the tributary was not significant except in PX1 during the late discharge period.
Higher relative abundance of phytoplankton in sediment was found in the initial and middle periods than in the late period of TGR discharge. With the discharging of the TGR, the RAC and RAEP in sediment decreased at some sites, such as PX1. The RAC and RAEP in sediment increased first and then decreased at the others site, such as PX2. Community variation was found in sediment in the process of TGR discharge (Figure 3 and Figure 4), for example, the increases in Synechococcus sp. and Microcystis sp., and decreases in Planktothrix sp. and Bacillariophyta. The PCA (Figure 5, Table S3) plots show that communities in sediment in May were significantly different from those of other periods (January and March), for both cyanobacteria and eukaryotic phytoplankton. We found a wide temporal variation between the late period and the other periods of TGR discharge. Briefly, we observed spatial heterogeneity along the longitudinal axis of the tributary during the initial and middle periods, and temporal heterogeneity between the late period and other periods of TGR drawdown.
Of all the environmental factors, T, TC, the maximum flow velocity (Vel-max), and TP significantly influenced (p < 0.05) cyanobacteria community assemblages (Figure 6a; Table S4). A similar result was found in the analysis of eukaryotic community assemblages: TP, T, TC, Vel-max, and TN had significant influences (p < 0.01) (Figure 6b; Table S4).

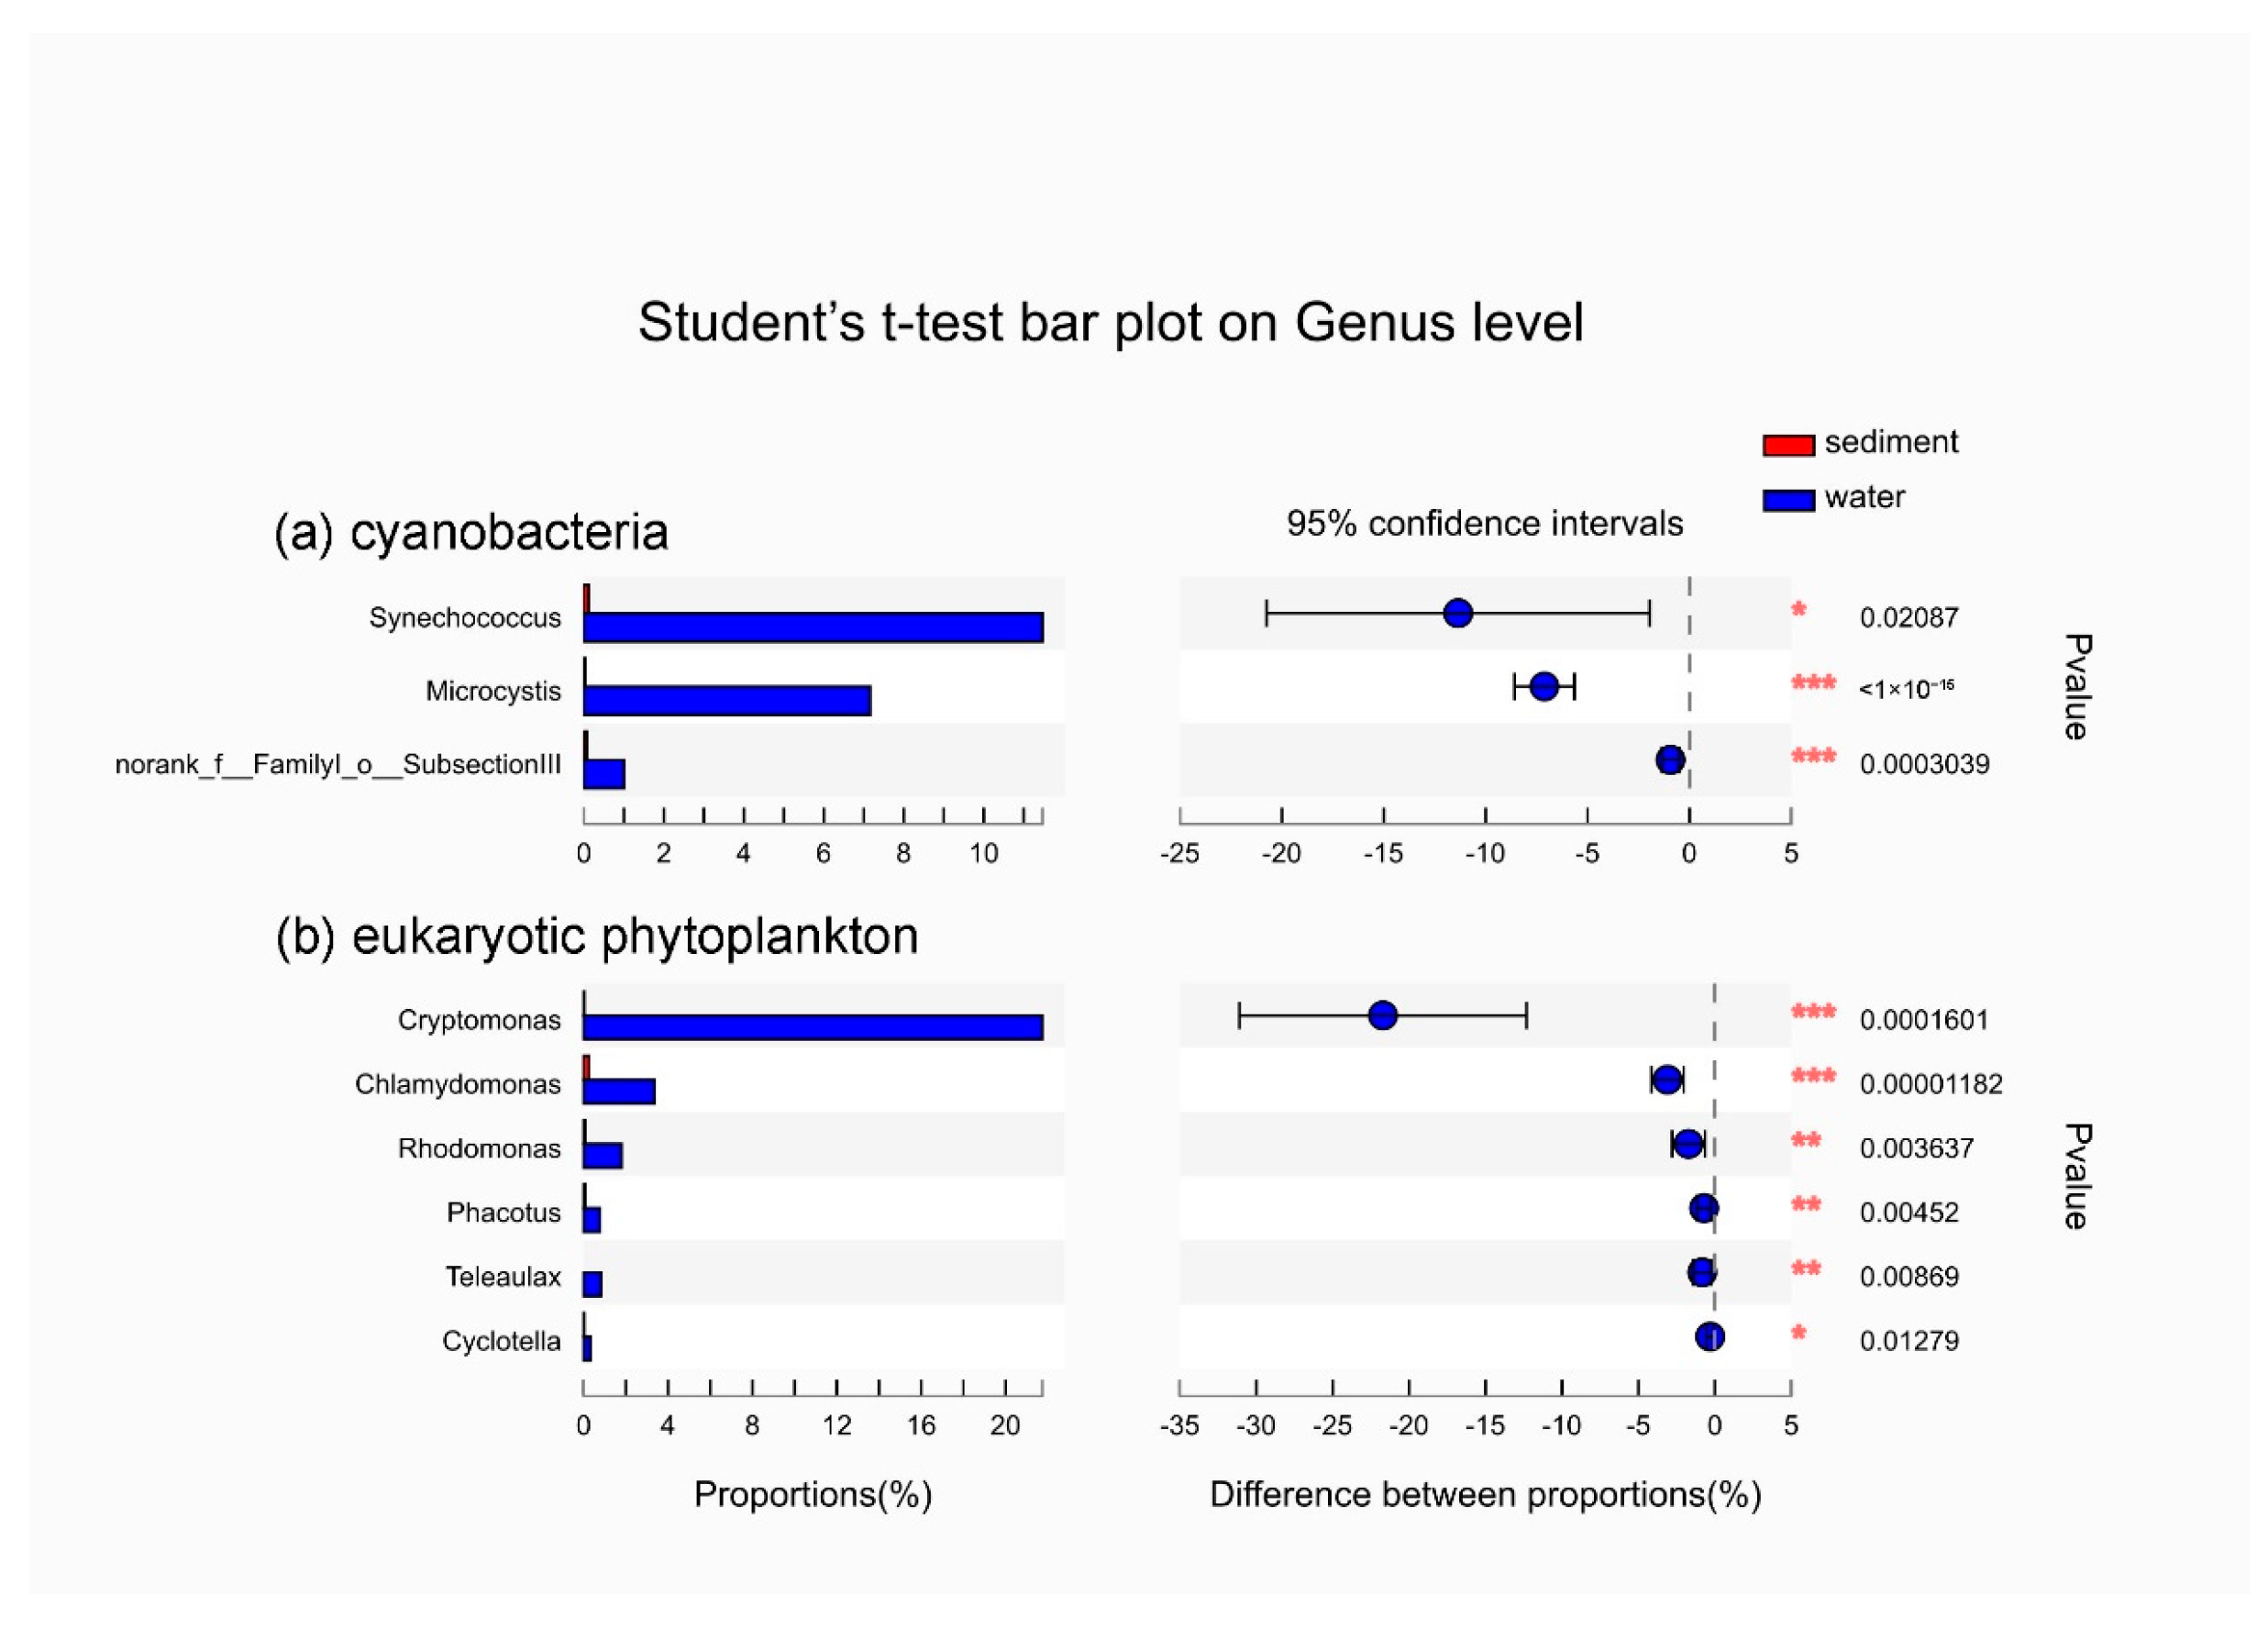
3.3. The Dominant Species of Phytoplankton in Sediment and Surface Water during Algal Blooms Period

The OTU analysis of water samples in PX1, PX2, and PX3 showed that RAC were 9.18%, 7.93%, and 56.93% (Table 2), respectively. The most abundant taxon was Microcystis sp., accounting for 47.06%, 84.42%, and 68.97% of cyanobacteria, respectively (Figure 3). The RAEP were 41.30%, 9.14%, and 45.99%, respectively. The most abundant taxon in Cryptophyta was Cryptomonas sp., which accounted for 84.18%; the most abundant taxon in Chlorophyta was Chlamydomonas sp., accounting for 48.09%; and the most abundant taxon in Cryptophyta was Cryptomonas sp., which accounted for 91.75% (Figure 4b–e). As concerned the most abundant taxa in the sediment, Planktothrix sp. and Synechococcus sp. dominated in Cyanobacteria. Bacillariophyta, Dinophyta, and Chlorophyta were the main taxa of eukaryotic phytoplankton, especially during the initial and middle periods of TGR discharge (Figure 3 and Figure 4). The microscopic examination of the May water samples showed that Cyanobacteria had the highest cell density, followed by Cryptophyta and Chlorophyta. Bacillariophyta and Dinophyta had the lowest cell density. In the PX3 water sample in May, the cell density of Microcystis sp. reached 7.8 × 10⁶ cells/L.
According to Student’s t-test, significant differences were found in the phytoplankton communities between sediment and water (Figure 7, Figures S4 and S5). Differences were found in Cyanobacteria (p < 0.01) and Cryptophyta (p < 0.01) at the phylum level (Figure S4); differences was found in Microcystis sp. (p < 0.01), Synechococcus sp. (p < 0.05), Cryptomonas sp. (p < 0.01), Rhodomonas sp. (p < 0.01), Teleaulax sp. (p < 0.01), Phacotus sp. (p < 0.01), and Chlamydomonas sp. (p < 0.01) at the genus level, of which the first two, middle three, and latter two genera belong to Cyanobacteria, Cryptophyta, and Chlorophyta, respectively (Figure 7).
Compared to the initial and middle periods of TGR discharge, the relative abundance of Planktothrix sp. (Cyanobacteria) in sediment in the late period decreased, whereas that of Synechococcus sp. and Microcystis sp. increased. Microcystis sp. was the dominant species in surface water during algal blooms, indicating that the populations of cyanobacteria in the sediment underwent a change during TGR discharge. The hierarchical clustering analysis based on the distance matrix of beta diversity also showed that the distance of sample branches between the sediment in May and the surface water was shorter than that between the sediment in January and the surface water (Figure S3). Considering this, it was obvious that the difference between sediment and water column communities decreased with TGR drawdown.

4. Discussion

4.1. Variations in Phytoplankton Communities in Sediment

Previous studies showed that the area from Gaoyang Lake (PX3) to confluence is the area at high risk of algal blooms, but our result showed that the most abundant cyanobacteria in sediment were located in PX1 in the initial period of reservoir drawdown [47]. We suppose that the cyanobacteria in downstream surface water (PX3) could flow upstream (PX1) and deposit in the sediment during the process of water impoundment in the previous September and October, because the area from site PX1 to PX5 is within the backwater area of Pengxi River [43,48].
Spatial and temporal variations were found in the relative abundance of cyanobacteria and eukaryotic phytoplankton. The relative abundance of cyanobacteria and eukaryotic phytoplankton in PX1 decreased in the middle compared to the initial period. This was mainly attributed to the scouring of sediment. Scouring, suspension, and re-sedimentation of sediment are caused by reservoir drawdown; consequently, phytoplankton in sediment transfers upstream to downstream but remains in sediment. This transition was proven by the increasing relative abundance in PX2. In almost all sites, the relative abundance of phytoplankton in the late period was lower than in the middle period. The dominant factor is most likely germination and vertical migration into the water column given the more suitable temperature and radiation [20]. Furthermore, rainfall increases during late spring and early summer; the nutrition brought in by runoff stimulates the algal recruitment, growth, and even the blooms [49].
The communities of phytoplankton in sediment exhibited a spatial heterogeneity in our research. The distance from the sample sites to the confluence ranged from about 20 to 50 km, the elevation ranged from about 123 to 140 m, and the water depth in January ranged from 32.13 to 48.73 m. The meteorological conditions, physiochemical conditions, the TN and TP levels, hydrologic conditions, and hydrodynamic conditions were significantly different in different sites [43,48,50,51,52]. Furthermore, the different photo-thermal environment, water pressure, and oxygen and speciation of nutrients in water column led to the community variation in sediment along the longitudinal axis.
The phytoplankton communities in sediment exhibited temporal heterogeneity, with a clear distinction between May samples and both other sampling periods (Figure 5b; Table S3). This is attributed to the large change in meteorological, hydrologic, and hydrodynamic factors from the middle to late period of reservoir drawdown. From the initial to the middle period, the water temperature and flow velocity remained about 15 °C and 0.02 m/s, respectively, and the water level reduced by 5 m. However, the meteorological, hydrologic, and hydrodynamic factors were significantly different during the late period: the water temperature was about 24 °C, the maximum flow velocity was 0.28 m/s, and the water level reduced by nearly 10 m. This finding was supported by RDA analysis: water temperature and flow velocity significantly affected the phytoplankton community composition. Previous studies showed that the different locations of the backwater of the TGR successively change from lacustrine (flow velocity lower than 0.02 m/s) water body to intermediate and riverine (flow velocity above 0.05 m/s) during the discharge of the TGR [44]. The upper river (PX1) was riverine in the late period with the maximum velocity, the shallowest water depth, and the shortest HRT, but the other sites were intermediate or lacustrine. Therefore, the different hydrodynamic conditions probably be the main reason why the phytoplankton community in PX1 was significantly different from those at the other locations.

4.2. The Factor Influencing Species in Surface Water during Algal Blooms

After impoundment of the TGR, HABs break out almost every year in tributaries of the Yangtze River, with a higher frequency of HABs than in the main stream. Previous studies showed that the factors determining HABs are hydrodynamic conditions rather than nutritional conditions [53]. The impoundment of the TGR did not increase the nutrient level, but caused weaker turbulence intensity, clearer water, increased light transmittance, and longer HRT. HABs were less frequent in main stream due to higher flow velocity, stronger vertical turbulence, higher water turbidity, and lower light transmittance.
Previous studies (Table 3) in shallow lakes and epicontinental seas showed that increasing temperature and light, shallow water depth, and turbulence positively affect the germination and recruitment of cyanobacteria and eukaryotic phytoplankton in sediment. In our study, the discharging of the reservoir lead to the decrease in water depth and increases in flow velocity and sediment turbulence, so resting cells in sediment enter the water column. Furthermore, the photo-thermal conditions from winter to spring benefit the germination and recruitment of resting cells, which was confirmed by the high level of Chla and the relative abundance of phytoplankton in surface water. The concentration of Chla exceeded the threshold of 10 μg/L [54] for bloom formation at almost all the sampling sites in March and May. Previous studies [47,55] also showed that HABs outbreaks occur every spring, summer, and autumn in the Pengxi River. In the late TGR drawdown period, the flow velocity in PX1 and PX2 was too high for phytoplankton survival, and the water depth of PX4 and PX5 was too deep for resting cells to receive light, so the cyanobacteria bloom broke out in PX3.
The differences in the communities and dominant species of phytoplankton in sediment and surface water are logical. The germination and migration of resting cells from sediment to the water column requires not only biomass in sediment but also suitable environmental conditions in the water column. Rolland and Vincent found that species that were not dominant in sediment could develop into dominant species in water blooms as well [50]. The community in seed bank changes due to the impact of influent and effluent water during reservoir discharge. The seed bank in sediment is relatively open, and resting cells in sediment could be brought from the upper to the lower reaches, and even to the main stream. However, the seed bank in lakes cannot be brought in or out. In addition, the hydrological and hydrodynamic conditions of a reservoir significantly affect their germination, vertical migration, recruitment, and the forming of algal blooms [18,31].
As the water temperature increases during reservoir drawdown, the vertical stratification of temperature occurs in the tributaries [48]. Thermal stratification leads to hypoxia in sediment, release of N and P nutrients from the sediment to the water column, and the depth of euphotic layer is larger than that of the mixed layer, and sufficient light could be obtained by phytoplankton [51,53]. However, Bacillariophyta and Chlorophyta cannot vertically migrate and prefer moderate flow velocity and turbulence [52], so they could not become the dominant species in surface water under stable thermal stratification conditions. Dinoflagellate prefers to grow at 10–20 °C [49], so dinoflagellate blooms occur more frequently below 20 °C. However, the cyanobacteria Microcystis sp. likes the temperature to be between 20 and 35 °C and prefers a low concentration ratio of nitrogen and phosphorus of about 10 [56]. Moreover, Microcystis sp. can use pseudo-cavities to float up to surface water to obtain more light [57]. Low flow velocity is also suitable for Microcystis sp. colony formation. The hydrological and hydrodynamic conditions in PX3 in May were favorable to the physiological adaptability of Microcystis sp. but unfavorable to Bacillariophyta, Chlorophyta, and Dinoflagellate. Microcystis sp. has an absolute advantage due to the carbon dioxide concentration mechanism and microcystin production. As a result, Microcystis sp. succeeded in the community succession of phytoplankton in the water column and eventually became the dominant bloom species in Pengxi River, the tributaries of the TGR. Other researches have reported the dominant species of HABs in the TGR, which evolved from dinoflagellate and diatom (the typical species in rivers) to cyanobacteria (the typical species in lakes) after impoundment [45,58]. So, the factors more influencing the dominant species in surface water during algal blooms were the hydrologic and hydrodynamic conditions rather than the seed bank in sediment.

5. Conclusions

Our study demonstrated that the artificial regulation of reservoirs played an important role in the community structure of cyanobacteria and eukaryotic phytoplankton in the seed bank of the sediment and surface water during algal blooms. The different hydrological and hydrodynamic conditions led to the temporal and spatial heterogeneity of the phytoplankton community in sediment. The significant influencing factors were T, TP, TC, Vel-max for cyanobacteria (p < 0.05) and T, TP, TC, Vel-max, and TN for eukaryotic phytoplankton (p < 0.05). The dominant species in surface water during algal blooms was significantly different from that in the sediment, and was mainly influenced by the environmental factors in the water column rather than the seeds in the sediment.

Supplementary Materials

The following are available online at https://www.mdpi.com/2073-4441/13/3/340/s1, Figure S1: The relative percentage contribution of the bacteria community composition at the phylum level at the different sample sites. Figure S2: The relative percent contribution of the eukaryote community composition at the phylum level for the different sample sites. Figure S3: Hierarchical clustering tree of (a) cyanobacteria and (b) eukaryotic phytoplankton at the OTU level. Figure S4: Student’s t-test of communities between sediment and surface water at the phylum level. (a) Prokaryotes using the result of 16S rRNA sequencing and (b) eukaryote phytoplankton using the result of 18S rRNA sequencing. * p ≤ 0.01, ** 0.001 ≤ p ≤ 0.01, *** p ≤ 0.001. Figure S5: Student’s t-test of phytoplankton communities between sediment and surface water at the genus level. The figure shows all the genera detected in this study. a) Cyanobacteria using the 16S rRNA result; (b) eukaryotic phytoplankton using the 18S rRNA result. * p ≤ 0.01, ** 0.001 ≤ p ≤ 0.01, *** p ≤ 0.001. Table S1: Richness (Sobs, Chao, and Ace), diversity (Shannon and Simpson), and coverage (Coverage) of the bacterial 16 S rRNA for each sample site by operational taxonomic units (OTUs)-based analyses. Table S2: Richness (Sobs, Chao, and Ace), diversity (Shannon and Simpson), and coverage (Coverage) of the bacterial 18S rRNA for each sample site by OTUs-based analyses. Table S3: The detrended correspondence analysis (DCA) results of the cyanobacteria community and the principal component analysis (PCA) result of eukaryotic phytoplankton community. Table S4: The redundancy analysis (RDA) results of the influence of each significant parameter on the cyanobacteria or eukaryotic phytoplankton community composition.

Author Contributions

Conceptualization, W.O. and J.G.; methodology, W.O.; software, W.O. and L.L.; validation, Z.L. and J.Y.; formal analysis, W.O. and L.L.; investigation, W.O. and Z.L.; data curation, L.L.; writing—original draft preparation, W.O.; writing—review and editing, Z.L., J.G., and J.Y.; visualization, W.O. and J.Y.; supervision, Z.L. and J.Y.; funding acquisition, J.G. All authors have read and agreed to the published version of the manuscript.

Funding

This research was funded by National Natural Science Foundation of China, grant number 41771520.

Institutional Review Board Statement

Not applicable.

Informed Consent Statement

Not applicable.

Data Availability Statement

The data presented in this study are available on request from the corresponding author due to privacy restrictions.

Conflicts of Interest

The authors declare no conflict of interest. The funders had no role in the design of the study; in the collection, analyses, or interpretation of data; in the writing of the manuscript, or in the decision to publish the results.

References

  1. Hallegraeff, G.M. A review of harmful algal blooms and their apparent globle increase. Phycologia 1993, 32, 79–99. [Google Scholar] [CrossRef] [Green Version]
  2. Duan, H.; Ma, R.; Xu, X.; Kong, F.; Zhang, S.; Kong, W.; Hao, J.; Shang, L. Two-Decade Reconstruction of Algal Blooms in China’s Lake Taihu. Environ. Sci. Technol. 2009, 43, 3522–3528. [Google Scholar] [CrossRef] [PubMed]
  3. Falconer, I.R. An overview of problems caused by toxic blue-green algae (cyanobacteria) in drinking and recreational water. Environ. Toxicol. 1999, 14, 5–12. [Google Scholar] [CrossRef]
  4. Lambert, T.W.; Holmes, C.F.B.; Hrudey, S.E. Microcystin class of toxins: Health effects and safety of drinking water supplies. Environ. Rev. 1994, 2, 167–186. [Google Scholar] [CrossRef]
  5. Seegers, B.N.; Birch, J.M.; Marin, R.; Scholin, C.A.; Caron, D.A.; Seubert, E.L.; Howard, M.D.A.; Robertson, G.L.; Jones, B.H. Subsurface seeding of surface harmful algal blooms observed through the integration of autonomous gliders, moored environmental sample processors, and satellite remote sensing in southern California. Limnol. Oceanogr. 2015, 60, 754–764. [Google Scholar] [CrossRef] [Green Version]
  6. Verspagen, J.M.H.; Snelder, E.O.F.M.; Visser, P.M.; Huisman, J.; Mur, L.R.; Ibelings, B.W. Recruitment of benthic microcystis (cyanophyceae) to the water column: Internal buoyancy changes or resuspension? J. Phycol. 2004, 40, 260–270. [Google Scholar] [CrossRef]
  7. Boero, F.; Belmonte, G.; Fanelli, G.; Piraino, S.; Rubino, F. The continuity of living matter and the discontinuities of its constituents: Do plankton and benthos really exist? Trends Ecol. Evol. 1996, 11, 177–180. [Google Scholar] [CrossRef]
  8. Karlsson-Elfgren, I.; Rengefors, K.; Gustafsson, S. Factors regulating recruitment from the sediment to the water column in the bloom-forming cyanobacterium Gloeotrichia echinulata. Freshw. Biol. 2004, 49, 265–273. [Google Scholar] [CrossRef] [Green Version]
  9. Head, R.M.; Jones, R.I.; Bailey-Watts, A.E. An assessment of the influence of recruitment from the sediment on the development of planktonic populations of cyanobacteria in a temperate mesotrophic lake. Freshw. Biol. 1999, 41, 759–769. [Google Scholar] [CrossRef]
  10. Anderson, D.M.; Chisholm, S.W.; Watras, C.J. Importance of life cycle events in the population dynamics of Gonyaulax tamarensis. Mar. Biol. 1983, 76, 179–189. [Google Scholar] [CrossRef]
  11. Anglès, S.; Garcés, E.; Reñé, A.; Sampedro, N. Life-cycle alternations in Alexandrium minutum natural populations from the NW Mediterranean Sea. Harmful Algae 2012, 16, 1–11. [Google Scholar] [CrossRef]
  12. McQuoid, M.R.; Godhe, A. Recruitment of coastal planktonic diatoms from benthic versus pelagic cells: Variations in bloom development and species composition. Limnol. Oceanogr. 2004, 49, 1123–1133. [Google Scholar] [CrossRef]
  13. Hansson, L.-A. Algal recruitment from lake sediments in relation to grazing, sinking, and dominance patterns in the phytoplankton community. Limnol. Oceanogr. 1996, 41, 1312–1323. [Google Scholar] [CrossRef]
  14. Stahl-Delbanco, A.; Hansson, L.A. Effects of bioturbation on recruitment of algal cells from the "seed bank" of lake sediments. Limnol. Oceanogr. 2002, 47, 1836–1843. [Google Scholar] [CrossRef]
  15. Rengefors, K.; Gustafsson, S.; Ståhl-Delbanco, A. Factors regulating the recruitment of cyanobacterial and eukaryotic phytoplankton from littoral and profundal sediments. Aquat. Microb. Ecol. 2004, 36, 213–226. [Google Scholar] [CrossRef]
  16. Brunberg, A.K.; Blomqvist, P. Recruitment of Microcystis (Cyanophyceae) from lake sediments: The importance of littoral inocula. J. Phycol. 2003, 39, 58–63. [Google Scholar] [CrossRef]
  17. Karlsson-Elfgren, I.; Brunberg, A.-K. The importance of shallow sediments in the recruitment of anabaena and aphanizomenon (cyanophyceae). J. Phycol. 2004, 40, 831–836. [Google Scholar] [CrossRef]
  18. Misson, B.; Latour, D. Influence of light, sediment mixing, temperature and duration of the benthic life phase on the benthic recruitment of Microcystis. J. Plankton Res. 2011, 34, 113–119. [Google Scholar] [CrossRef]
  19. Schöne, K.; Jähnichen, S.; Ihle, T.; Ludwig, F.; Benndorf, J. Arriving in better shape: Benthic Microcystis as inoculum for pelagic growth. Harmful Algae 2010, 9, 494–503. [Google Scholar] [CrossRef]
  20. Brosnahan, M.L.; Ralston, D.K.; Fischer, A.D.; Solow, A.R.; Anderson, D.M. Bloom termination of the toxic dinoflagellate Alexandrium catenella: Vertical migration behavior, sediment infiltration, and benthic cyst yield. Limnol. Oceanogr. 2017, 62, 2829–2849. [Google Scholar] [CrossRef] [Green Version]
  21. Ramm, J.; Rücker, J.; Knie, M.; Nixdorf, B. Lost in the dark: Estimation of the akinete pool for the recruitment of Nostocales populations (cyanobacteria) in a temperate deep lake. J. Plankton Res. 2017, 39, 392–403. [Google Scholar] [CrossRef] [Green Version]
  22. Villena, M.-J.; Romo, S. Effects of Nutrients, Fish, Charophytes and Algal Sediment Recruitment on the Phytoplankton Ecology of a Shallow Lake. Int. Rev. Hydrobiol. 2007, 92, 626–639. [Google Scholar] [CrossRef]
  23. Borges, H.; Wood, S.A.; Puddick, J.; Blaney, E.; Hawes, I.; Dietrich, D.R.; Hamilton, D.P. Intracellular, environmental and biotic interactions influence recruitment of benthicMicrocystis(Cyanophyceae) in a shallow eutrophic lake. J. Plankton Res. 2016, 38, 1289–1301. [Google Scholar] [CrossRef] [Green Version]
  24. Tan, X.; Kong, F.; Zhang, M.; Yü, Y. Recruitment of Phytoplankton from Winter Sediment of Lake Taihu: A Laboratory Simulation. J. Freshw. Ecol. 2009, 24, 339–341. [Google Scholar] [CrossRef] [Green Version]
  25. Cao, H.-S.; Tao, Y.; Kong, F.-X.; Yang, Z. Relationship between Temperature and Cyanobacterial Recruitment from Sediments in Laboratory and Field Studies. J. Freshw. Ecol. 2008, 23, 405–412. [Google Scholar] [CrossRef] [Green Version]
  26. Carey, C.C.; Weathers, K.C. Spatial and temporal variability in recruitment of the cyanobacterium Gloeotrichia echinulata in an oligotrophic lake. Freshw. Sci. 2014, 33, 577–592. [Google Scholar] [CrossRef]
  27. Feng, B.; Wang, C.; Wu, X.; Tian, C.; Tian, Y.; Xiao, B. Involvement of microcystins, colony size and photosynthetic activity in the benthic recruitment of Microcystis. Environ. Biol. Fishes 2019, 31, 223–233. [Google Scholar] [CrossRef]
  28. Zou, W.; Wang, Z.; Song, Q.; Tang, S.; Peng, Y. Recruitment-promoting of dormant Microcystis aeruginosa by three benthic bacterial species. Harmful Algae 2018, 77, 18–28. [Google Scholar] [CrossRef]
  29. Karlson, A.M.; Nascimento, F.J.A.; Suikkanen, S.; Elmgrenc, R. Benthic fauna affects recruitment from sediments of the harmful cyanobacterium Nodularia spumigena. Harmful Algae 2012, 20, 126–131. [Google Scholar] [CrossRef]
  30. Hamre, K.D.; Gerling, A.; Munger, Z.; Doubek, J.; McClure, R.; Cottingham, K.L.; Carey, C. Spatial variation in dinoflagellate recruitment along a reservoir ecosystem continuum. J. Plankton Res. 2017, 39, 715–728. [Google Scholar] [CrossRef]
  31. Su, Y.; You, X.; Lin, H.; Zhuang, H.; Weng, Y.; Zhang, D. Recruitment of cyanobacteria from the sediments in the eutrophic Shanzi Reservoir. Environ. Technol. 2015, 37, 641–651. [Google Scholar] [CrossRef] [PubMed]
  32. Stone, R.; Jia, H. Hydroengineering: Going Against the Flow. Science 2006, 313, 1034–1037. [Google Scholar] [CrossRef] [PubMed]
  33. Nilsson, C.; Reidy, C.A. Fragmentation and flow regulation of the world’s large river systems. Science 2005, 308, 405–408. [Google Scholar] [CrossRef] [PubMed] [Green Version]
  34. Stone, R. China’s environmental challenges: Three gorges dam: Into the unknown. Science 2008, 321, 628–632. [Google Scholar] [CrossRef]
  35. Becker, V.; Huszar, V.L.M.; Naselli-Flores, L.; Padisák, J. Phytoplankton equilibrium phases during thermal stratification in a deep subtropical reservoir. Freshw. Biol. 2008, 53, 952–963. [Google Scholar] [CrossRef]
  36. Conley, D.J.; Stålnacke, P.; Pitkänen, H.; Wilander, A. The transport and retention of dissolved silicate by rivers in Sweden and Finland. Limnol. Oceanogr. 2000, 45, 1850–1853. [Google Scholar] [CrossRef]
  37. Wu, J.G.; Huang, J.H. Three-Gorges Dam—Experiment in habitat fragmentation? Science 2003, 300, 1239–1240. [Google Scholar] [CrossRef]
  38. Huang, Z.L.; Wu, B.F. The overview of the project and environment. In Research on Ecological and Environmental Monitoring System of the Three Gorges Project, 1st ed.; Li, F., Gai, Y., Eds.; Science Press: Beijing, China, 2006. [Google Scholar]
  39. Zhou, G.J.; Kuang, Q.J. Investigation of algal water-blooms in the Three Gorges Reservoir and its toxicological study. Acta Hydrobiol. Sin. 2006, 1, 37. [Google Scholar]
  40. Zheng, B.H.; Cao, Y.J. Analysis of Algal Blooms in Da-ning River of Three Gorges Reservoir. Environ. Sci. 2009, 30, 3218. [Google Scholar]
  41. Zhang, S.; Xiao, Y.; Li, Z.; Wang, S.; Guo, J.; Lu, L. Turbulence exerts nutrients uptake and assimilation of bloom-forming Dolichospermum through modulating morphological traits: Field and chemostat culture studies. Sci. Total. Environ. 2019, 671, 329–338. [Google Scholar] [CrossRef]
  42. Ran, X.; Bouwman, A.F.; Yu, Z.; Liu, J. Implications of eutrophication for biogeochemical processes in the Three Gorges Reservoir, China. Reg. Environ. Chang. 2019, 19, 55–63. [Google Scholar] [CrossRef]
  43. Liu, X.; Qian, K.; Chen, Y. Effects of water level fluctuations on phytoplankton in a Changjiang River floodplain lake (Poyang Lake): Implications for dam operations. J. Great Lakes Res. 2015, 41, 770–779. [Google Scholar] [CrossRef]
  44. Li, Z.; Guo, J.S. 1D hydrodynamic model on Pengxi (Xiaojiang) River backwater area in the Three Gorges Reservoir. J. Chongqing Uni. 2012, 5, 143. [Google Scholar]
  45. Xiao, Y.; Li, Z.; Guo, J.; Fang, F.; Smith, V.H. Succession of phytoplankton assemblages in response to large-scale reservoir operation: A case study in a tributary of the Three Gorges Reservoir, China. Environ. Monit. Assess. 2016, 188, 153. [Google Scholar] [CrossRef]
  46. Bråte, J.; Logares, R.; Berney., C.; Ree, D.K.; Klaveness, D.; Jakobsen, K.S.; Shalchian-Tabrizi, K. Freshwater Perkinsea and marine-freshwater colonizations revealed by pyrosequencing and phylogeny of environmental rDNA. ISME J. 2010, 4, 1144–1153. [Google Scholar] [CrossRef] [Green Version]
  47. Zhou, C.; Yu, J.-J.; Fu, L.; Cui, Y.-J.; Liu, D.; Jiang, W.; Haffner, D.; Zhang, L. Temporal and Spatial Distribution of Environmental Factors and Phytoplankton During Algal Bloom Season in Pengxi River, Three Gorges Reservoir. Environ. Sci. 2016, 37, 873–883. [Google Scholar]
  48. Huang, Y.; Yasarer, L.M.W.; Li, Z.; Sturm, B.S.M.; Zhang, Z.; Guo, J.; Shen, Y. Air–water CO2 and CH4 fluxes along a river–reservoir continuum: Case study in the Pengxi River, a tributary of the Yangtze River in the Three Gorges Reservoir, China. Environ. Monit. Assess. 2017, 189, 223. [Google Scholar] [CrossRef]
  49. Shin, H.H.; Li, Z. Seasonal production of dinoflagellate cysts in relation to environmental characteristics ih jiiihae-Masan Bay, Korea: One-year sedimerit trap observation. Estuar. Coast. Shelf Sci. 2018, 215, 83–93. [Google Scholar] [CrossRef]
  50. Rolland, D.C.; Vincent, W.F. Characterization of phytoplankton seed banks in the sediments of a drinking water reservoir. Lake Reserv. Manag. 2014, 30, 371–380. [Google Scholar] [CrossRef]
  51. Valdespino-Castillo, P.M.; Merino-Ibarra, M.; Jiménez-Contreras, J.; Castillo-Sandoval, F.S.; Ramírez-Zierold, J.A. Community metabolism in a deep (stratified) tropical reservoir during a period of high water-level fluctuations. Environ. Monit. Assess. 2014, 186, 6505–6520. [Google Scholar] [CrossRef] [Green Version]
  52. Jäger, C.G.; Diehl, S.; Schmidt, G.M. Influence of water-column depth and mixing on phytoplankton biomass, community composition, and nutrients. Limnol. Oceanogr. 2008, 53, 2361–2373. [Google Scholar] [CrossRef] [Green Version]
  53. Liu, L.; Liu, D.; Johnson, D.M.; Yi, Z.; Huang, Y. Effects of vertical mixing on phytoplankton blooms in Xiangxi Bay of Three Gorges Reservoir: Implications for management. Water Res. 2012, 46, 2121–2130. [Google Scholar] [CrossRef] [PubMed]
  54. Oliver, R.L.; Ganf, G.G. Freshwater Blooms. In The Ecology of Cyanobacteria II: Their Diversity in Time and Space, 1st ed.; Whitton, B.A., Potts, M., Eds.; Springer: Dordrecht, The Netherlands, 2002; pp. 149–194. [Google Scholar]
  55. Li, Z.; Fang, F. Spring algal bloom and nutrients characteristics in Xiaojiang River backwater area, Three Gorges Reservoir. J. Lake Sci. 2009, 21, 36. [Google Scholar]
  56. Ståhl-Delbanco, A.; Hansson, L.; Gyllström, M. Recruitment of resting stages may induce blooms of Microcystis at low N: P ratios. J. Plankton Res. 2003, 25, 1099–1106. [Google Scholar] [CrossRef]
  57. Xiao, M.; Li, M.; Reynolds, C.S. Colony formation in the cyanobacteriumMicrocystis. Biol. Rev. 2018, 93, 1399–1420. [Google Scholar] [CrossRef] [Green Version]
  58. Chia National Environmental Monitoring Center. Available online: http://www.cnemc.cn/jcbg/zjsxgcstyhjjcbg/ (accessed on 18 December 2020).
Figure 1. (a,b) The location of the sampling sites along Pengxi River, (c) the elevation of Pengxi River and the water level of the Three Gorges Reservoir (TGR) with sampling sites and sampling dates marked by grey lines.
Water 13 00340 g001
Figure 2. (a) The water temperature at different depths, (b) water depth, (c) maximum velocity of flow, (d) concentration of TN, and (e) concentration of Chla at different sampling sites and water levels.
Water 13 00340 g002
Figure 3. The relative percentage contribution of different genera in cyanobacteria. A_1 to C_5 represent the sediment samples, and water 1 to 3 represent the water samples. A, B, and C represent the January, March, and May sampling times, respectively; 1 to 5 represent sampling sites PX1 to PX5, respectively; the labels have the same meaning in Figure 4, Figure 5 and Figure 6.
Water 13 00340 g003
Figure 4. The relative percentage contribution (a) of different eukaryotic microalgae and (be) of the different genera in the corresponding eukaryotic microalgae: (b) Chlorophyta, (c) Bacillariophyta, (d) Dinophyta, and (e) Cryptophyta. The phyla of Chrysophyta and Xanthophyta were omitted because of low abundance.
Water 13 00340 g004
Figure 5. (a) Detrended correspondence analysis (DCA) of cyanobacteria community; (b) principal component analysis (PCA) of eukaryotic phytoplankton community.
Water 13 00340 g005
Figure 6. Redundancy analyses of phytoplankton community composition and environmental variables: (a) cyanobacteria; (b) eukaryotic phytoplankton.
Water 13 00340 g006
Figure 7. Student’s t-test of phytoplankton communities between sediment and surface water at the genus level. Only the genera with significant differences are presented: (a) cyanobacteria; (b) eukaryotic phytoplankton. * p ≤ 0.01, ** 0.001 ≤ p ≤ 0.01, *** p ≤ 0.001.
Water 13 00340 g007
Table 1. Summary of the physicochemical characteristics for each of the sample sites in January and May 2016. T, temperature; DO, dissolved oxygen; TC, total carbon; TOC, total organic carbon; IC, inorganic carbon; TN, total nitrogen; TP, total phosphorus; Chla, chlorophyll a.
Sampling TimeSampling SiteT (°C)Conductivity (μS/cm)pHDO (mg/L)TC (mg/L)TOC (mg/L)IC (mg/L)TN (mg/L)TP (mg/L)Chla (μg/L)Average Flow Velocity (m/s)
JanuaryPX115.4388.67.877.8937.981.3136.680.7450.0241.780.02
PX214.2473.08.367.7132.093.1728.920.7520.0292.630.02
PX316.0365.77.806.4630.873.4027.470.9490.0410.930.02
PX416.0365.77.806.4630.873.4027.470.9490.0410.930.02
PX515.1359.68.387.9030.142.5127.631.4130.0450.700.02
MarchPX114.2448.58.579.9533.795.3128.491.1000.0369.940.02
PX216.0437.17.6915.5633.317.4925.531.2240.03236.620.02
PX314.3382.38.1810.9632.556.5825.971.2440.04727.690.02
PX414.3382.38.1810.9632.556.5825.971.2440.04727.690.02
PX514.3379.18.159.2631.293.6627.631.4840.0482.820.01
MayPX123.6471.07.6810.0868.398.0760.331.4510.12766.660.07
PX224.1410.78.2812.4179.549.0170.541.2840.08757.590.05
PX323.5395.59.6915.8061.1515.1745.971.6270.142172.860.01
PX423.5395.59.6915.8061.1515.1745.971.6270.142172.860.02
PX522.5372.57.737.2966.796.4660.341.5820.08522.720.01
Table 2. The relative abundance of cyanobacteria and the eukaryotic phytoplankton.
CyanobacteriaEukaryotic Phytoplankton
SedimentWaterSedimentWater
Sampling siteJanuaryMarchMayMayJanuaryMarchMayMay
PX111.91%6.06%0.18%9.18%20.57%10.22%2.62%41.30%
PX21.37%4.68%2.17%7.93%34.57%33.97%6.20%9.14%
PX33.23%2.41%2.44%56.93%32.38%43.45%16.29%45.99%
PX40.67%1.80%0.36%- 121.42%13.06%11.33%- 1
PX52.22%1.26%2.46%- 126.91%32.78%13.31%- 1
1 The target band of the Polymerase Chain Reaction (PCR) product was too weak or not detected, and subsequent experiments could not be performed.
Table 3. The effect of environmental conditions on the recruitment of phytoplankton.
Algae SpeciesTemperatureLightDepth of WaterDisturbance of SedimentBiological FactorsOther ConditionReference
Microcystishigher than 20 °C2000 lx positive effect [31]
Oscillatoriahigher than 20 °C positive effect
Chlorophytes and Diatomshigher than 9 °C [24]
Cyanobacteriahigher than 12.5 °C
Microcystis and Aphanizomenon gracile16–25 °Cbetween 50 and 100 μmol m−2 s−1 allopathic interactions, ammonium [23]
Dolichospermum; Aphanizomenon; and Cylindrospermopsis raciborskii8–12 °C>0.1 mol m−2 d−1<12 m oxic conditions[21]
Microcystis aeruginosa, Viridis, Wesenbergii, Aphanizomenon flos-aquae, Anabaena Circinalis 1–2 m was better than 6–7 m [16,17]
Microcystis positive effectphotosynthetic activity, colony size, and intracellular microcystin content [27]
Publisher’s Note: MDPI stays neutral with regard to jurisdictional claims in published maps and institutional affiliations.

