
Effect of Freeze-Thaw Cycles on Soil Detachment Capacities of Three Loamy Soils on the Loess Plateau of China

1
College of Agricultural Engineering, Hohai University, Nanjing 210098, China
2
Changjiang River Scientific Research Institute, Changjiang Water Resources Commission, Wuhan 430010, China
3
Engineering Technology Research Center of Mountain Flood Geological Disaster Prevention and Control, Ministry of Water Resources, Wuhan 430010, China
*
Authors to whom correspondence should be addressed.
Water 2021, 13(3), 342; https://doi.org/10.3390/w13030342
Submission received: 11 January 2021
/
Revised: 25 January 2021
/
Accepted: 26 January 2021
/
Published: 29 January 2021
(This article belongs to the Special Issue Soil Water Erosion)
Abstract
:Soil detachment is the initial phase of soil erosion and is of great significance to study in seasonal freeze-thaw regions. In order to elucidate the effects mechanism of freeze-thaw cycles on soil detachment capacity of different soils, a sandy loam, a silt loam, and a clay loam were subjected to 0, 1, 5, 10, 15, and 20 freeze-thaw cycles before they were scoured. The results revealed that with increased freeze-thaw cycles, soil bulk density and water-stable aggregates content decreased after the first few times and then kept nearly stable after about 10 cycles, especially for sandy loam. The shear strength of all soils gradually decreased as freeze-thaw cycles increased, except the values of clay loam increased subsequent to the 5th and 15th cycles. After the 20th cycle, the degree of decline of silt loam was the greatest (77.72%), followed by sandy loam (63.18%) and clay loam (39.77%). The soil organic matter of clay loam was much greater than silt loam and sandy loam and all significantly increased after freeze-thaw. Soil detachment capacity of silt loam and sandy loam was positively correlated with freeze-thaw cycle, which was contrary to findings for clay loam. The values of clay loam increased at first and then decreased during the cycles, reaching minimum values at about the 15–20th cycle. After the 20th cycle, the values of sandy loam and silt loam significantly increased 1.62 and 4.74 times over unfrozen, respectively, which was greater than clay loam (0.53 times). A nonlinear regression analysis indicated that the soil detachment capacity of silt loam could be estimated well by soil properties (R2 = 0.87, p < 0.05). This study can provide references for the study of the soil erosion mechanism in seasonal freeze-thaw regions.
1. Introduction
Soil erosion has become one of the most critical environmental problems influencing sustainable development and agricultural productive capacity [1,2]. It comprises a series of complex physical processes including detachment, entrainment, transport, and the deposition of soil particles as the result of one or more natural or anthropogenic erosive forces [3]. During the initial stages of soil erosion, soil detachment is defined as the process by which constituent particles are separated from the matrix at a particular location on the surface by erosive agents [4].
Soil detachment capacity is affected by slope, overland flow hydraulics parameters, land use, biocrusts, and soil properties [5,6,7,8,9]. Among them, soil properties exert a profound influence on soil erosion, to an even greater extent than flow discharge and slope under some circumstances [10]. The process of soil detachment involves the interaction between flow and soil particles. Water shear stress increased as result of the adhesion between soil particles when soil particles were detached [6,7]. Additionally, the adhesion between soil particles was positively proportional to clay content, soil bulk density, shear strength, water stable aggregates content, and soil organic matter. However, the increase in sand content, soil porosity, and water content causes a decrease in adhesion [9,10,11,12]. These soil properties were important indices for evaluating soil erodibility [13]. Previous research has demonstrated a 2 to 3 times higher rate of soil erodibility during the winter-spring thaw period than the rest of the year [14], while other studies have shown that temporal variation in this variable might result from freeze-thaw action [15,16].
In recent decades, as global climate has tended to be warmer, the effects of freeze-thaw in areas of high latitude and high elevation have been intensified [17,18]. Freeze-thaw erosion does not always occur, but freeze-thaw action can provide effective material sources for other erosion forces by affecting soil properties, and its distribution range is larger than that of freeze-thaw erosion [19]. Generally, frozen soil melts from the surface downward, and an impermeable layer forms at the boundary, with the underlying soil remaining frozen [20]. Due to decreased friction at this border, water can easily flow [21]. Via laboratory simulation experiments, Ferrick and Gatto [22] found that average groove depth, width, and degree of powdery soil erosion following freeze-thaw were significantly greater than those of soils without freeze-thaw. Barnes et al. [23] used an erosion needle method to monitor the impact of freeze-thaw cycles on gully erosion of clay soil in the field over prolonged periods of time, finding freeze-thaw significantly increased erosion of gullies, especially the lateral walls.
During a period of soil thawing, the frozen soil starts thawing with the process of water and heat transfer, and the water changes and migrates in solid, liquid, and gas phases [20,24]. Due to the different densities of water and ice, the constant phase change of soil water causes ice crystal growth and water migration, the frequent frost heaving and thawing of soil leading to changes in soil structures and properties [25]. However, with the increase of freeze-thaw cycles, research results on the changes of soil properties have not been completely consistent as a result of soil texture. For example, soil aggregates—as important components of soil structure, its composition, and stability—influence soil erodibility [26]. Since the 1950s, many studies have investigated the effects of freeze-thaw action on the stability of soil aggregates. It has been shown that freeze-thaw significantly decreased water stable aggregates [27,28,29]. However, the treatment of freeze-thaw cycles led to disaggregation of micro aggregates and thus enhanced the formation of surface sealing that reduced splash erosion [30]. Hence, the effects of freeze-thaw on the stability of soil aggregates have been studied extensively over several decades; results have proved contradictory because of differences in soil texture, structure, chemical properties, and freeze-thaw cycles.
On the Loess Plateau of China from March to May every year are the periods of thawing; the plateau belongs to a seasonal freeze-thaw area, so freeze-thaw, snowmelt, and rainfall agents occur interactively or simultaneously. After the freeze-thaw cycles in early spring, soil properties—such as bulk density, water stable aggregates, and shear strength change—that lead to erosion easily occur when rain intensity or snowmelt is not too great [31]. However, limited research has been carried out to date to understand how freeze-thaw affects soil properties, and thus soil detachment capacity. The main aim of this study was therefore to research the effects of freeze-thaw cycles on soil properties and soil detachment capacity, and then to quantify the relationship between soil detachment capacity and properties of sandy loam, silt loam, and clay loam under conditions of freeze-thaw. This study can provide a scientific basis for the study of the mechanism of complex erosion of freeze-thaw and water during thawing periods.
2. Materials and Methods
2.1. Soil Samples
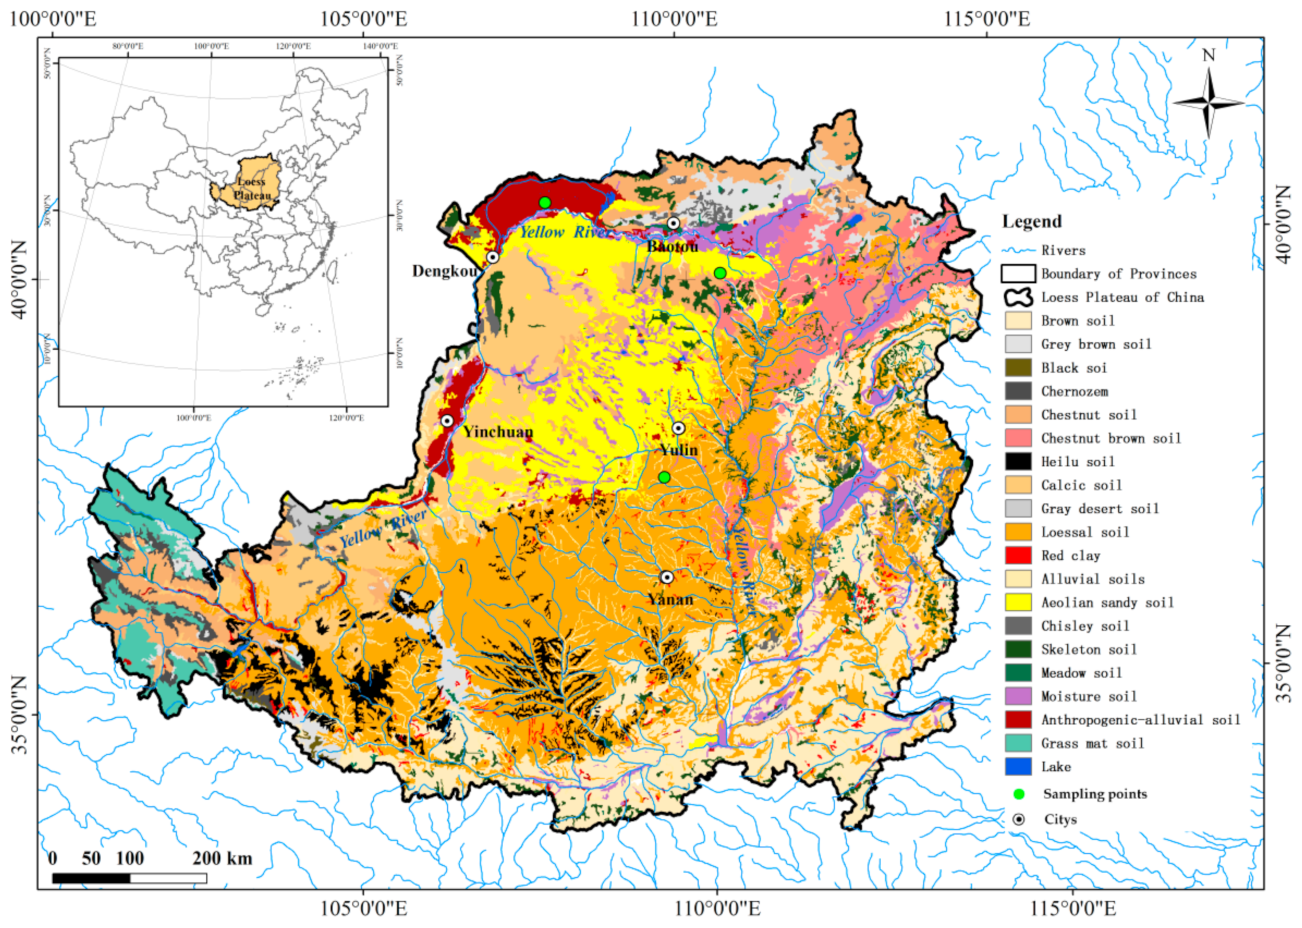
The three soils used in this study (loessal soil, aeolian sandy soil, anthropogenic-alluvial soil) were collected from the central and north of Loess Plateau and had the widest distribution or were most affected by human activity (Figure 1). The minimum and maximum daily temperatures can reach about −26 °C in February and 37 °C in July, and mean annual precipitation is about 360 mm. During the freeze-thaw periods, the minimum and maximum recorded daily temperatures in this region can reach about −10 °C and 22 °C (March and April), and maximum daily precipitation can be as high as 198 mm.
All the above three soils were taken from 0–20 cm of the surface of abandoned land. Based on United States textural classification standards, the aeolian sandy soil, loessal soil, and anthropogenic-alluvial soil used in this study were sandy loam, silt loam, and clay loam, respectively (Table 1).
2.2. Determination of Soil Properties
The soil samples were collected by a ring knife with a volume of 100 cm3. During the sampling process, the handle was placed on the ring knife. The edge of the ring knife was pressed down vertically into the soil with consistent force until the ring knife was filled with soil samples. Then the ring knife filled with soil was taken out and the excess soil around the ring knife was carefully cut off. Finally, the soil sample was put into a dried cylindrical aluminum box in the oven. The soil moisture content and bulk density were measured by oven-drying. Soil particle size distribution was determined by using laser diffraction (Malvern Mastersizer 2000, Malvern, UK) [32,33]. Water stable aggregates (>0.25 mm) were measured by the wet-sieving method. The content of larger than 0.25 mm aggregate was computed from the size distribution of aggregates [29]. Soil organic matter was measured by potassium bichromate by external heating. Shear strength was measured by miniature adhesion instrument (Pocket shear 15.10, Royal Eijkelkamp Company, Giesbeek, The Netherlands). Soil unconfined compressive strength (CS) before and after each freeze-thaw cycle was measured by soil firmness meter. The tests of all soil properties were repeated three times.
2.3. Design of Freeze-Thaw and Scour Simulation Experiments
To remove stones, grass, and other debris, soil samples were stored in polyvinyl chloride (PVC) cylindrical boxes (10 cm diameter, 5 cm depth) based on their bulk densities in the field. There were nine holes at the bottom of each box and gauze covered box bottoms before being filled with the soil samples. According to the measured average value of the samples taken in the field, all the test soil samples were configured with an initial mass water content of about 10%. Then they were frozen at −10 °C for 12 h and thawed at room temperature between 5 and 10 °C for 12 h to simulate the natural phenomenon of night freezing and day thawing. The slope gradient of experiments was controlled at 15°, flow discharge constant was held at 6 L min−1, and the experiments used soils with three textures (i.e., sandy loam, silt loam, and clay loam). The samples were subjected to six distinct freeze-thaw cycles (0, 1, 5, 10, 15, and 20 times) and utilized a full-factorial design that required 54 tests, each comprising three replications. All tests were carried out between November and March in order to ensure that air and water temperatures were similar to those recorded in the field during thawing.
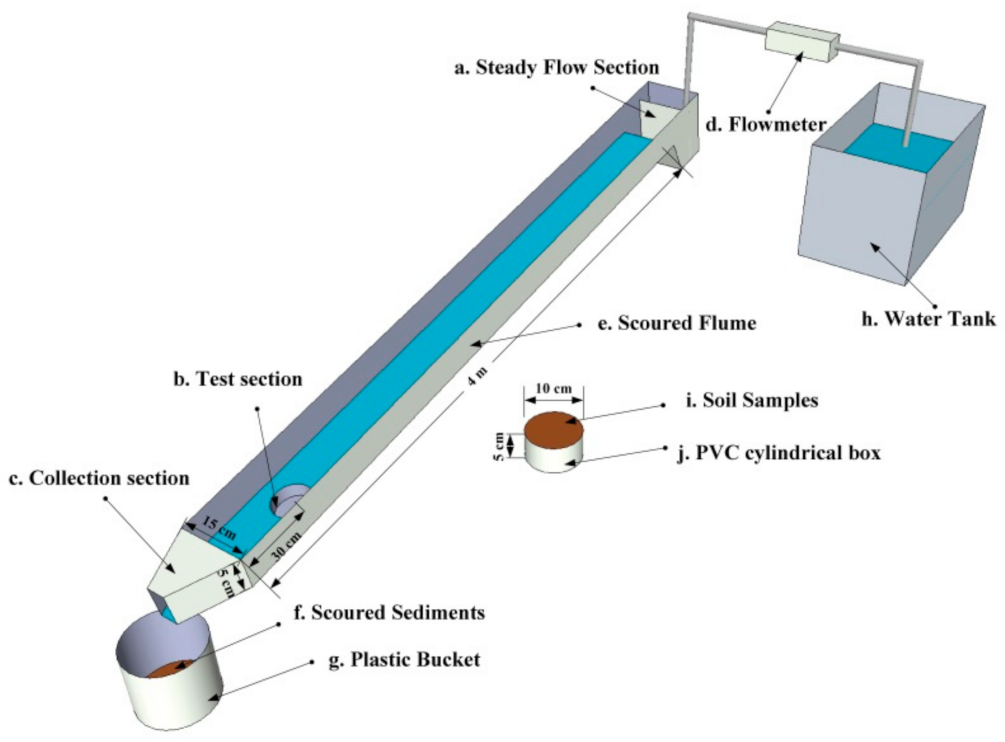
Soil detachment capacities were obtained by performing flow scouring experiments. To do this, a scouring device comprised of a water supply tank and flume (400 cm in length, 15 cm in width, and 5 cm in depth) made of PVC material (Figure 2) was used. Fine sand was adhered to this flume to simulate field surface roughness, and a flowmeter was used to control the scouring flow from the water supply tank. Each sample was placed in the test section (10 cm in diameter, Figure 2) of the flume bed, located at a distance of 0.3 m from the flume outlet, and the slope gradient and flow discharge were adjusted to 15° and 6 L min−1 prior to each experiment. Tests were timed as soon as they began and ended when the depth of the eroded soil in the soil sample box reached 2 cm [9,10,11]. The wet soil was then oven-dried at 105 °C for 24 h and then weighed.
Soil detachment capacities was then calculated as follows:
where SDC is soil detachment capacity (g m−2 s−1), is the dry weight of soil before testing (g), is the dry weight after testing (g), T is the test’s duration(s), and A is the sample cross-sectional area (m2).
2.4. Data Analyses
All data were analyzed by using SPSS 22.0 (International Business Machine Company, Chicago, IL, USA), and detected significant differences in mean physical properties and soil detachment capacity between soil types and number of freeze-thaw cycles were analyzed via a one-way analysis of variance (ANOVA) followed by least significant difference tests (LSD) (p < 0.05) and two-way ANOVA. A nonlinear regression method was used to estimate the relationships between soil detachment capacity and the physical properties of soils. Determination coefficients (R2) and Mann–Whitney U tests were used to evaluate the effectiveness of the models. The figure plotting was conducted by Origin v. 2020 (OriginLab Corp., Northampton, MA, USA).
3. Results
3.1. The Effects of Freeze-Thaw Cycles on Soil Properties
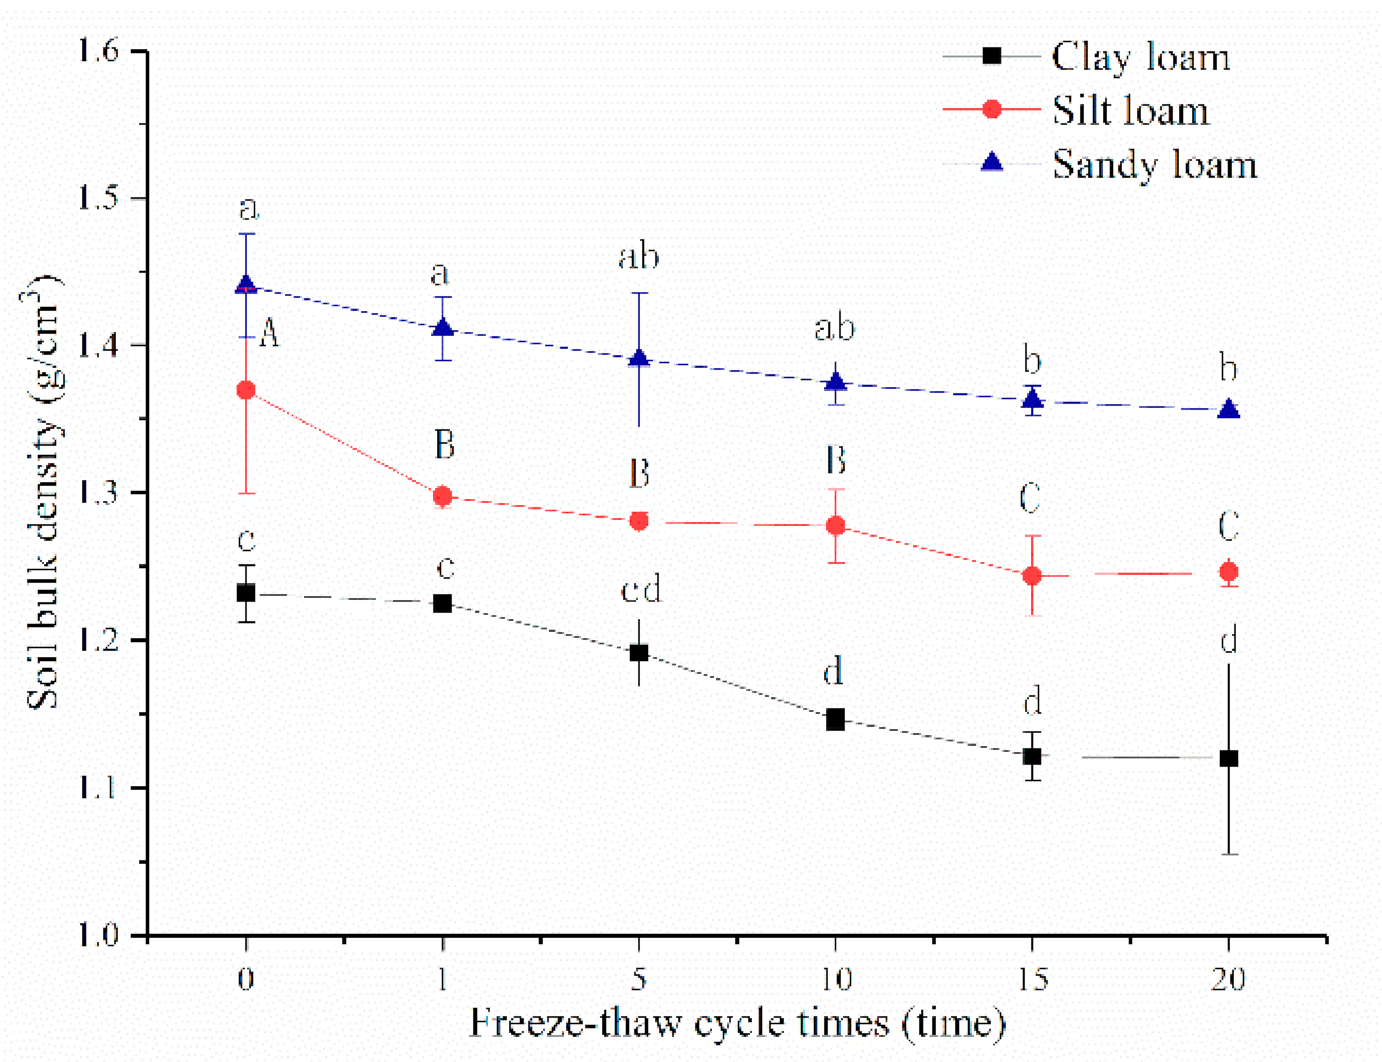
On average, for bulk density, the values of sandy loam were the greatest (1.39 g cm−3), followed by silt loam (1.29 g cm−3) and clay loam (1.17 g cm−3). With the increase of freeze-thaw cycles, bulk density of the three soils decreased significantly and gradually tended to be stable after the 10th freeze-thaw cycle, especially for sandy loam (Figure 3). It could be seen that bulk density of the three soils all had no significant difference between the 1st and 5th cycles, which was similar to the values between 15th and 20th cycles. After a 20th freeze-thaw cycle, the bulk density of sandy loam, silt loam, and clay loam decreased 5.87%, 8.99%, and 9.07% under unfrozen, respectively.
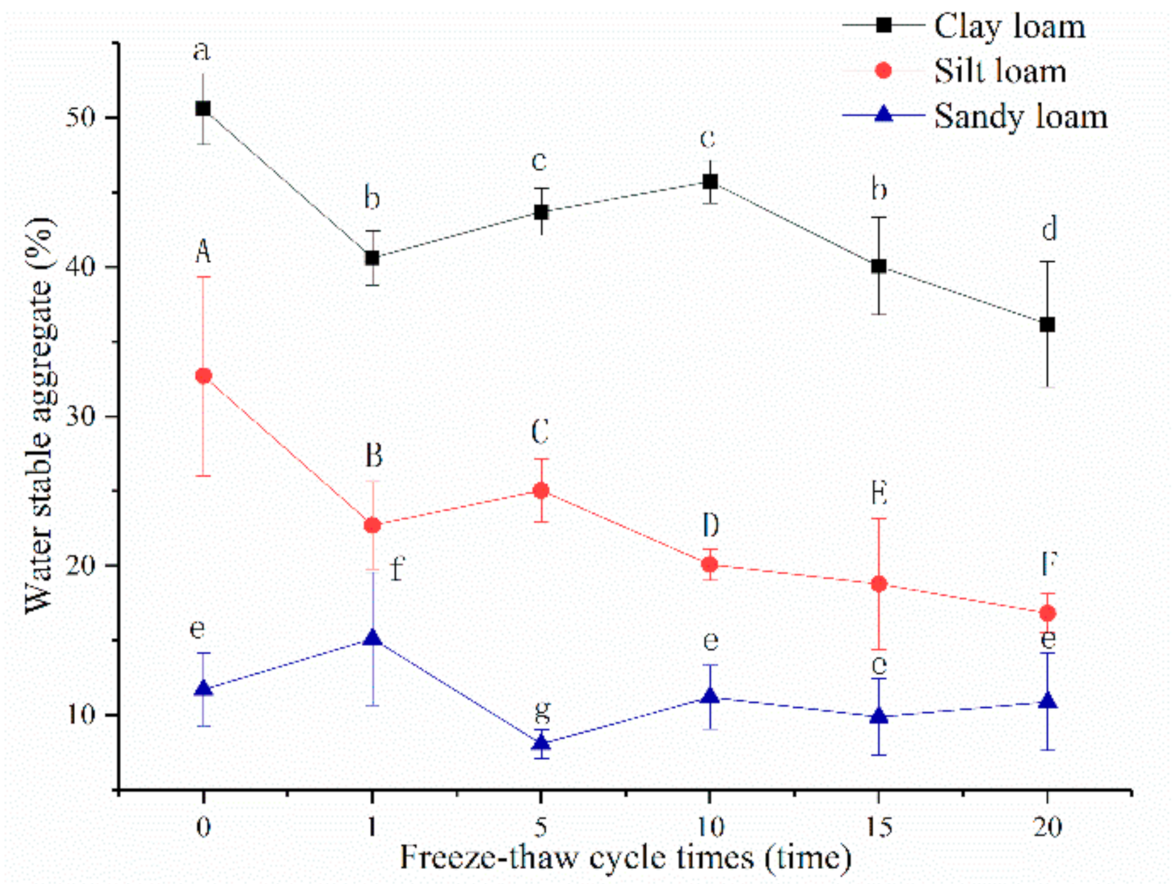
Contrasted with bulk density, the water stable aggregates content (>0.25 mm) of clay loam was the greatest with a mean of 50.58%, followed by silt loam (32.70%) and sandy loam (11.73%) before freeze-thaw. Water stable aggregates content of clay loam ranged from 45.72% to 36.19% with a mean of 41.26% after the 1st to 20th freeze-thaw cycle, from 25.04% to 16.83% with a mean of 20.70% for silt loam, and from 15.13% to 8.08% with a mean of 11.05% for sandy loam. The values of clay loam and silt loam decreased significantly after a 1st freeze-thaw cycle, then increased initially and decreased afterward, especially for silt loam; there were significant differences between each of their freeze-thaw cycles (Figure 4). However, the values of sandy loam increased after the 1st freeze-thaw cycle, and there was basically no significant change after the 10th freeze-thaw cycle. After a 20th freeze-thaw cycle, the water stable aggregates of silt loam, clay loam, and sandy loam decreased 48.54%, 28.44%, and 7.04% under unfrozen, respectively.
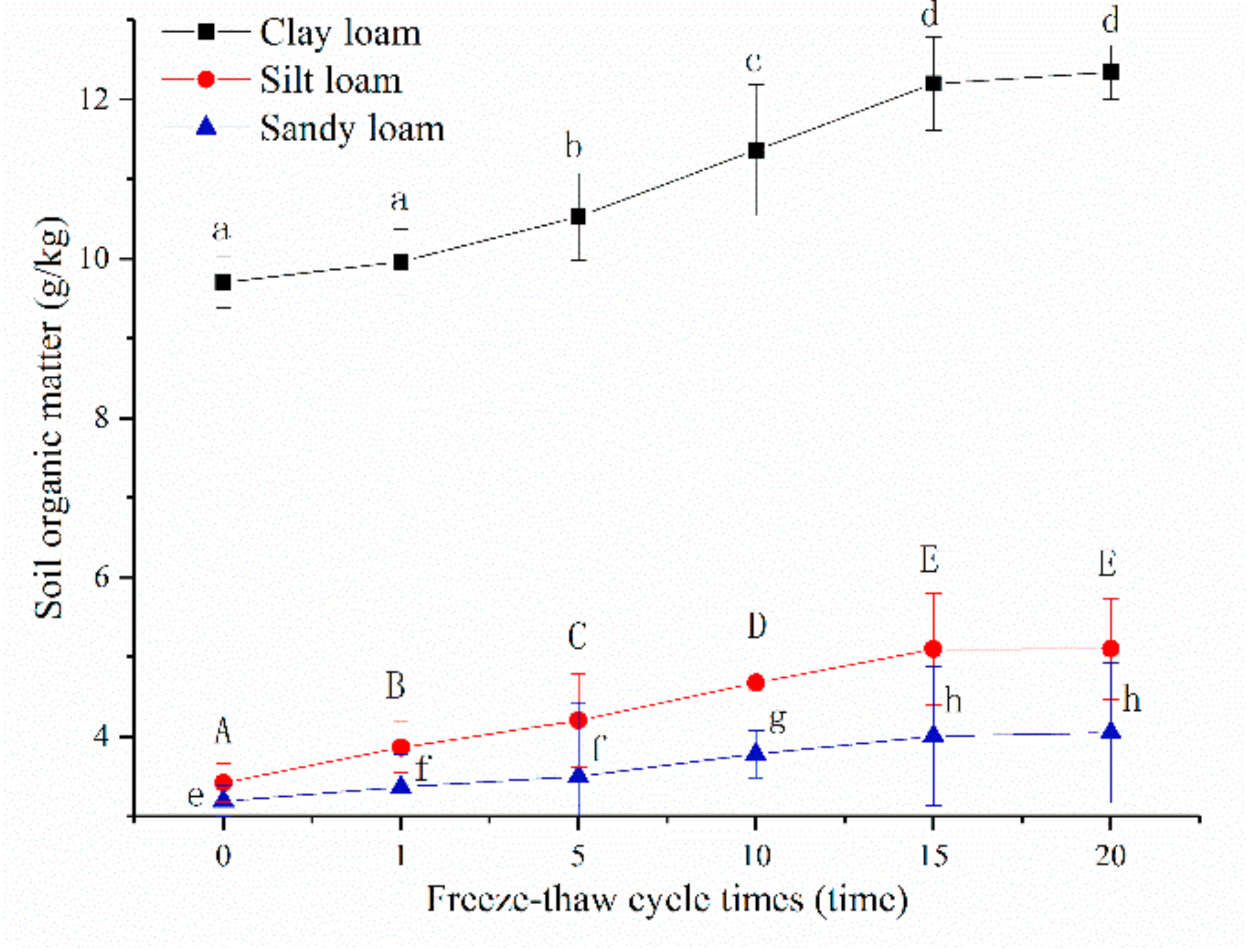
The soil organic matter of clay loam was greater than silt loam and sandy loam, no matter before or after freeze-thaw, and the means of the three soils all significantly increased with the increase in freeze-thaw cycle (p < 0.05, Figure 5). Significant changes in the means of soil organic matter were no longer observed for all three soils after a 15th freeze-thaw cycle. After a 20th freeze-thaw cycle, the means of sandy loam, silt loam, and clay loam increased 1.27, 1.49 and 1.28 times over unfrozen, respectively.
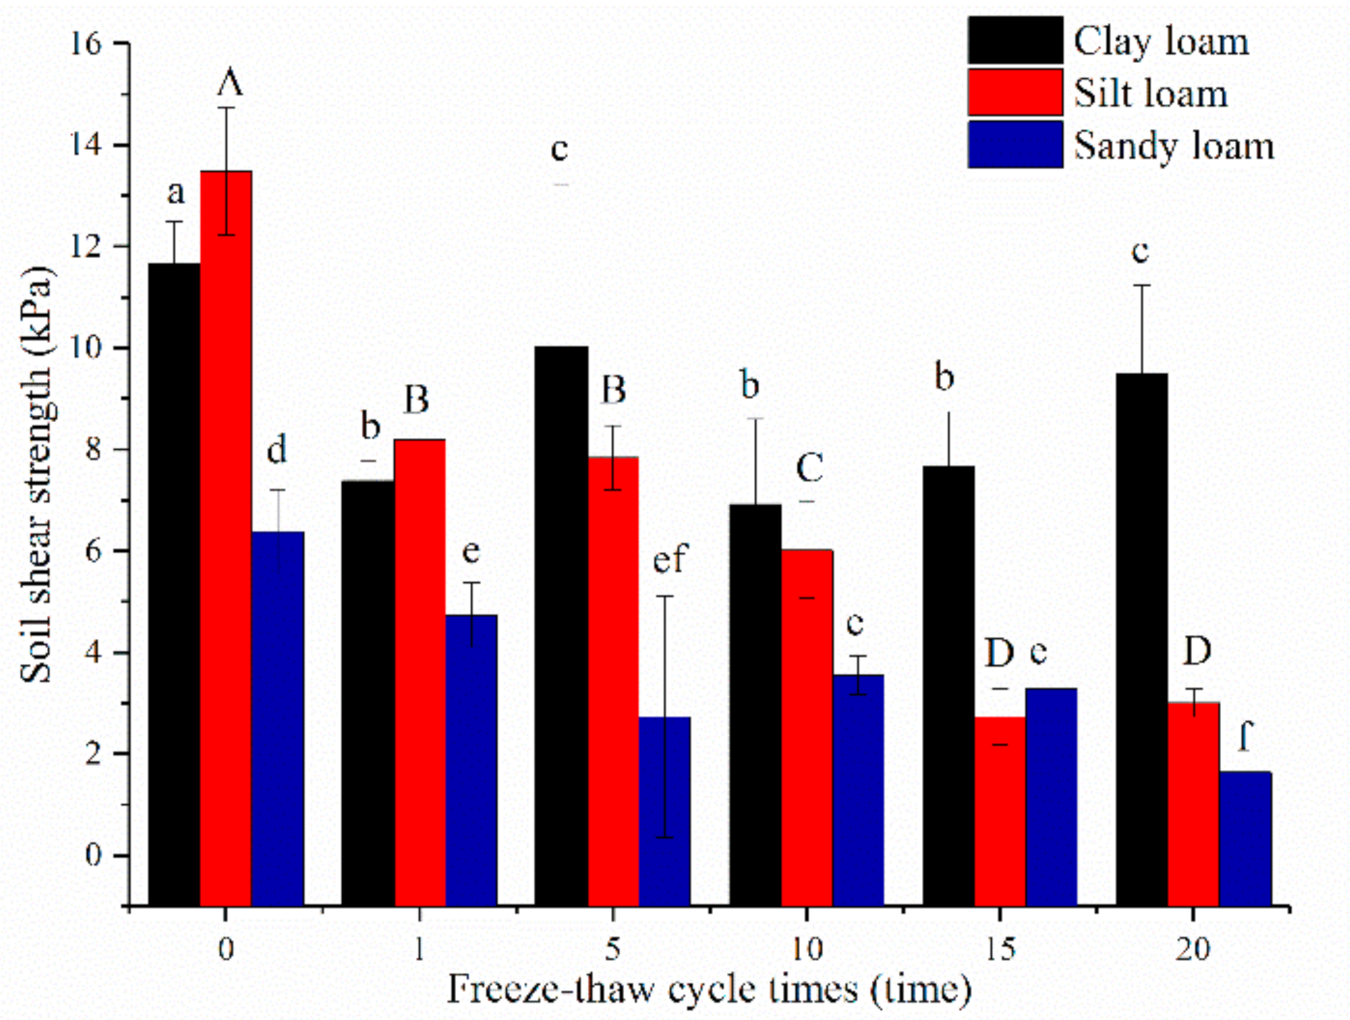
The shear strength of silt loam was the largest (13.49 ± 1.27 kPa) before freeze-thaw, followed by clay loam (11.67 ± 0.84 kPa), and last was sandy loam (6.38 ± 0.83 kPa). The shear strength of all soils gradually decreased as freeze-thaw cycles increased, especially after the 1st time, except the values for clay loam increased subsequent to the 5th and 15th cycles (Figure 6). After a 20th cycle, the degree of decline of silt loam was the greatest (77.72%), followed by sandy loam (63.18%), and clay loam (39.77%).
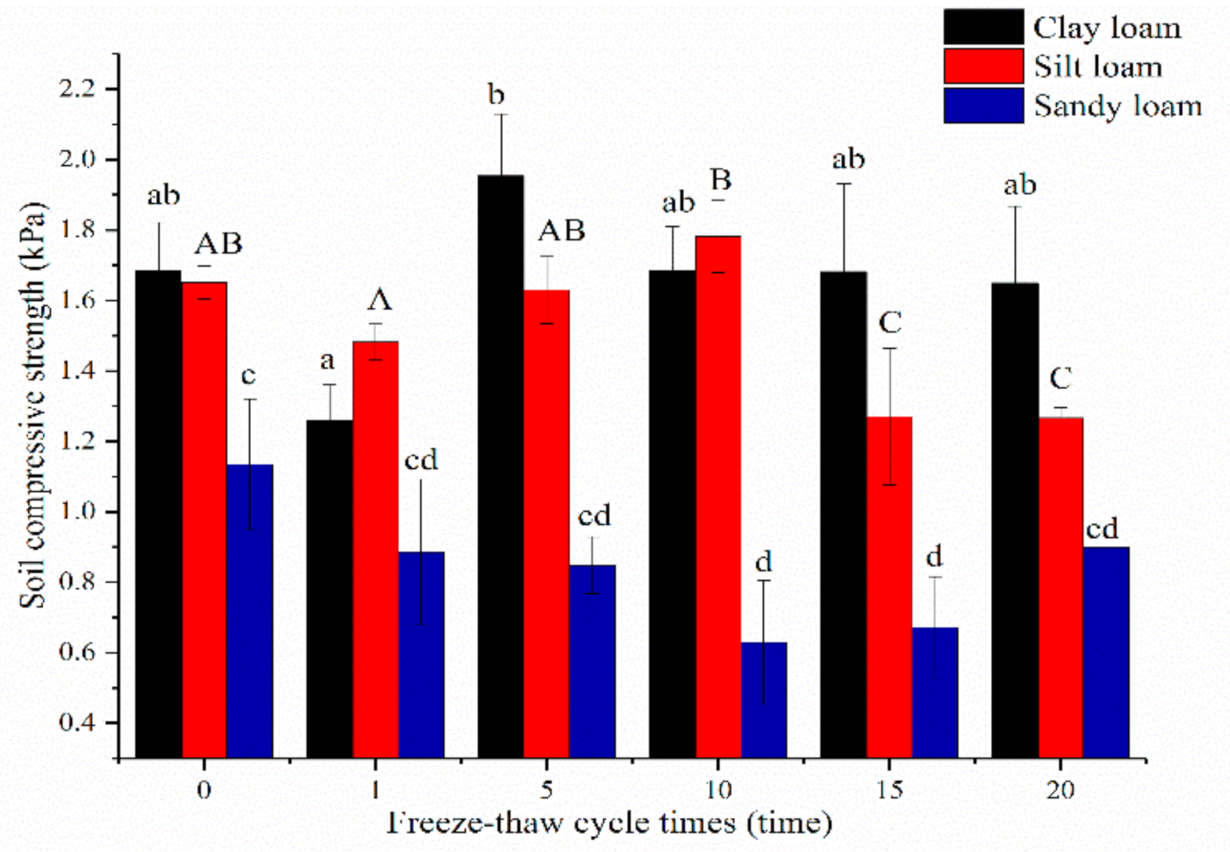
The mean soil compressive strength before the freeze-thaw of clay loam (1.68 ± 0.14 KPa) and silt loam (1.65 ± 0.05 KPa) were significantly higher than sandy loam (1.14 ± 0.19 KPa, p < 0.05). The values of clay loam decreased after the 1st freeze-thaw cycle, then increased after the 5th freeze-thaw cycle, but no significant differences were found between before and after freeze-thaw cycles (p > 0.05). However, this variable for silt loam initially increased and then decreased after the 1st cycle, and no significant change in sandy loam was recorded before the 10th freeze-thaw cycle. Different freeze-thaw cycles exerted no significant influence on the CS of sandy loam (p > 0.05, Figure 7).
3.2. Freeze-Thaw Cycles Impacts on Soil Detachment Capacity
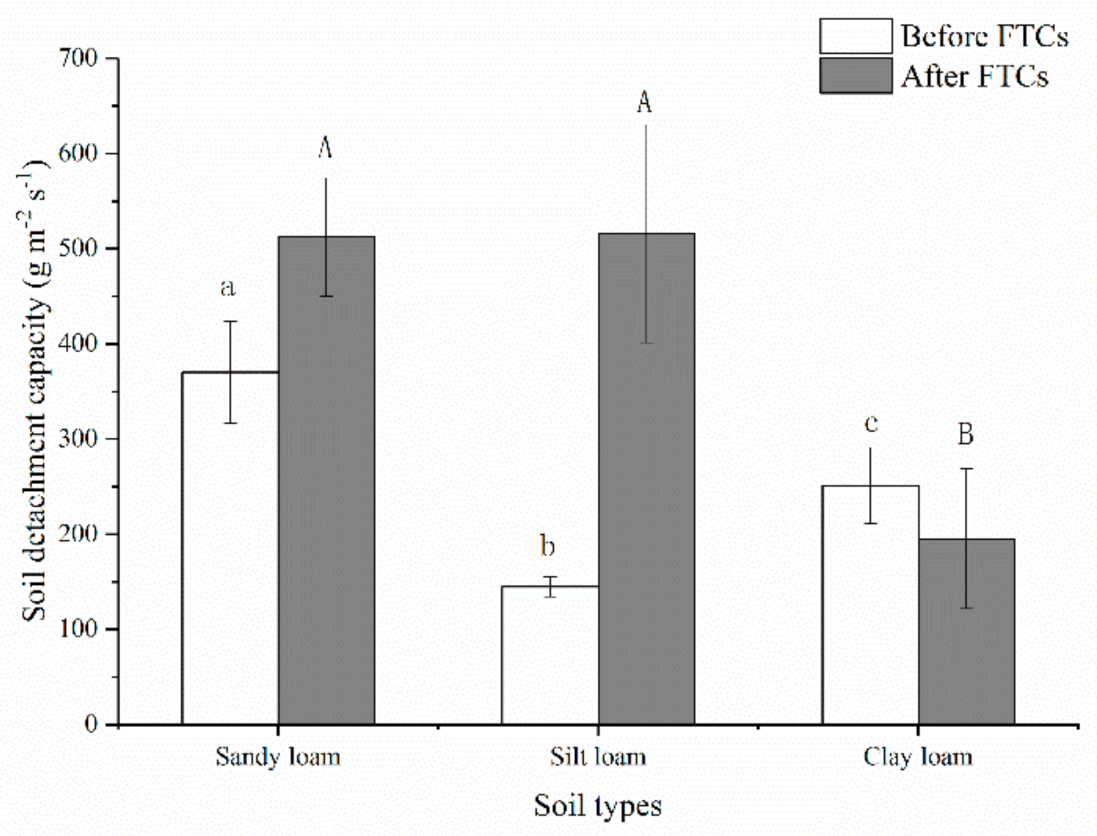
The soil detachment capacities of three soils were calculated by using Equation (1). The mean value of sandy loam (370.09 ± 53.61 g m−2 s−1) was greater than that of clay loam (251.30 ± 39.87 g m−2 s−1) and silt loam (144.90 ± 10.28 g m−2 s−1) before freeze-thaw cycles. The mean values of sandy loam and silt loam from the 1st to the 20th freeze-thaw cycle significantly increased 1.38 and 3.56 times over unfrozen (p < 0.05). However, the values decreased 1.29 times under unfrozen for clay loam. The means of sandy loam and silt loam had no significant difference and were all 2.6 times over clay loam after a 20th freeze-thaw cycle (Figure 8).
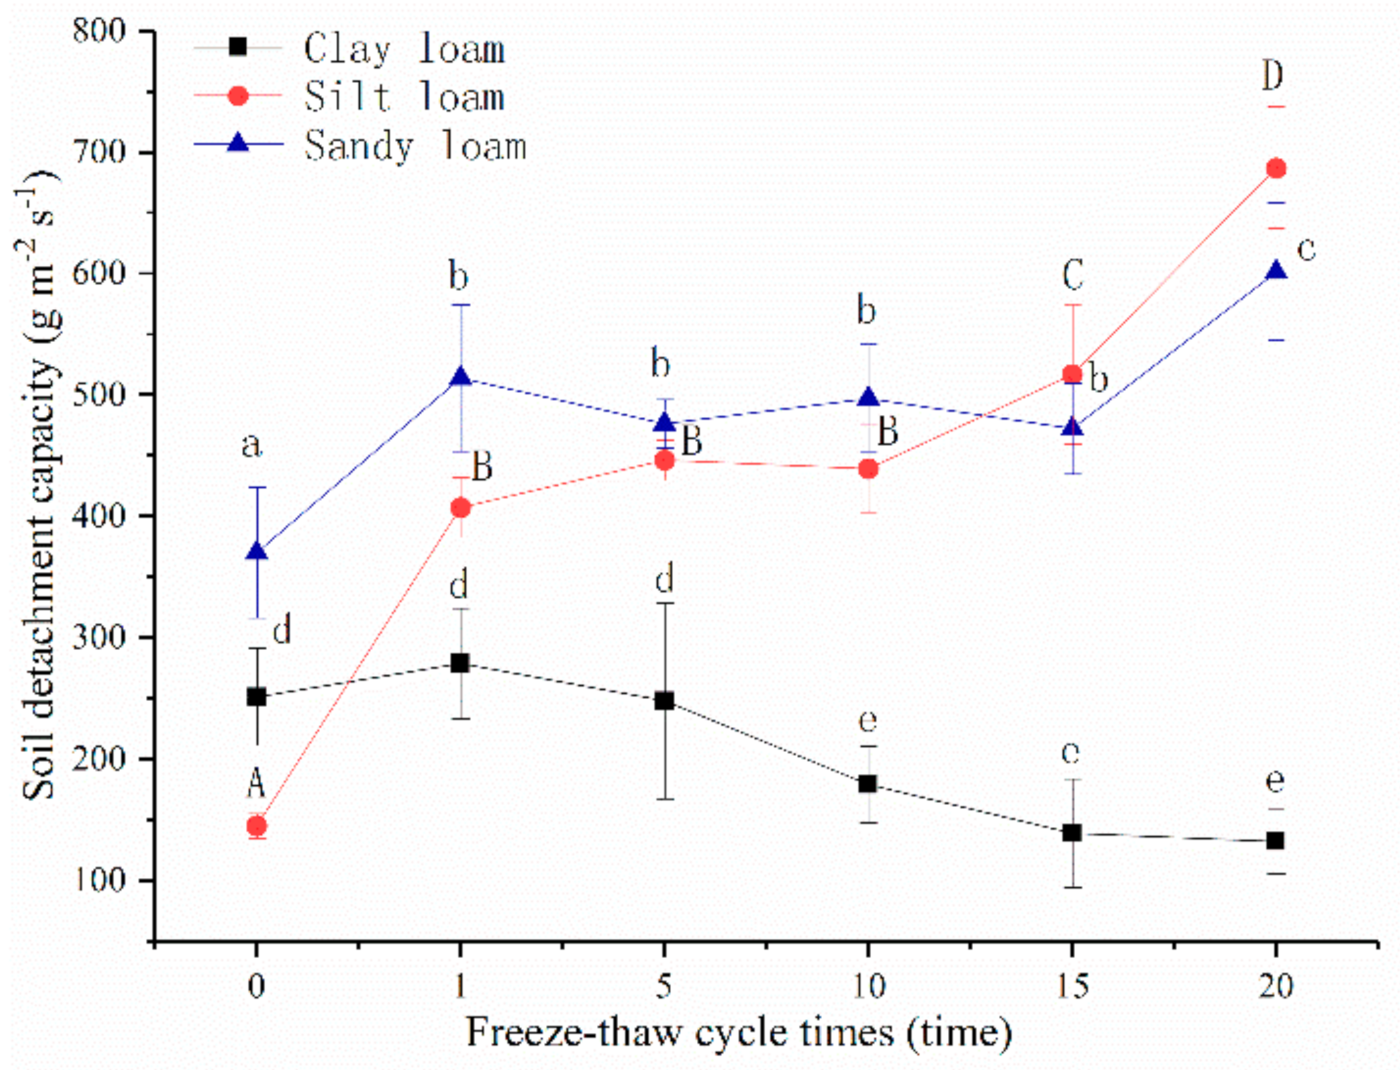
The variation of three soils soil detachment capacities with freeze-thaw cycles increased and is shown in Figure 9. The soil detachment capacity of clay loam increased after the 1st freeze-thaw cycle, but then decreased gradually with the increase of freeze-thaw cycles. The values after the 10th cycle were significantly less than the early stages of freeze-thaw cycles (0–5 times, p < 0.05). After the 20th cycle, soil detachment capacity of clay loam decreased 47.47% under unfrozen. The soil detachment capacity of sandy loam and silt loam significantly increased 1.39 and 2.81 times over unfrozen after the 1st freeze-thaw cycle, while as the number of cycles increased, there was no longer significant change until the 15th cycle. After the 15th cycle, soil detachment capacity of silt loam became larger than sandy loam, and after a 20th cycle the values of sandy loam and silt loam significantly increased 1.62 and 4.74 times over unfrozen, respectively. After the 20th cycle, the soil detachment capacity of silt loam was the greatest (709.65 ± 44.14 g m−2 s−1), then sandy loam (601.33 ± 56.60 g m−2 s−1), and clay loam was last (132.00 ± 26.25 g m−2 s−1).
3.3. Relationship between Soil Detachment Capacity and Soil Properties
Under the condition of freeze-thaw, there were significant correlations between soil detachment capacities and different soil properties based on correlation analysis (p < 0.05). The relationship between soil detachment capacity of sandy loam and soil properties could only be well fitted by a linear function of shear strength (p < 0.05, Table 2). However, soil detachment capacity of silt loam had a significant relationship with soil organic matter, bulk density, water stable aggregates, and shear strength (p < 0.05), and it was negatively correlated with bulk density and shear strength and positively correlated with soil organic matter and water stable aggregates. Soil detachment capacity of clay loam also could be fitted by a linear and exponential function of bulk density and soil organic matter for clay loam (p < 0.05), but it was negatively correlated with soil organic matter, which was contrary to findings for bulk density.
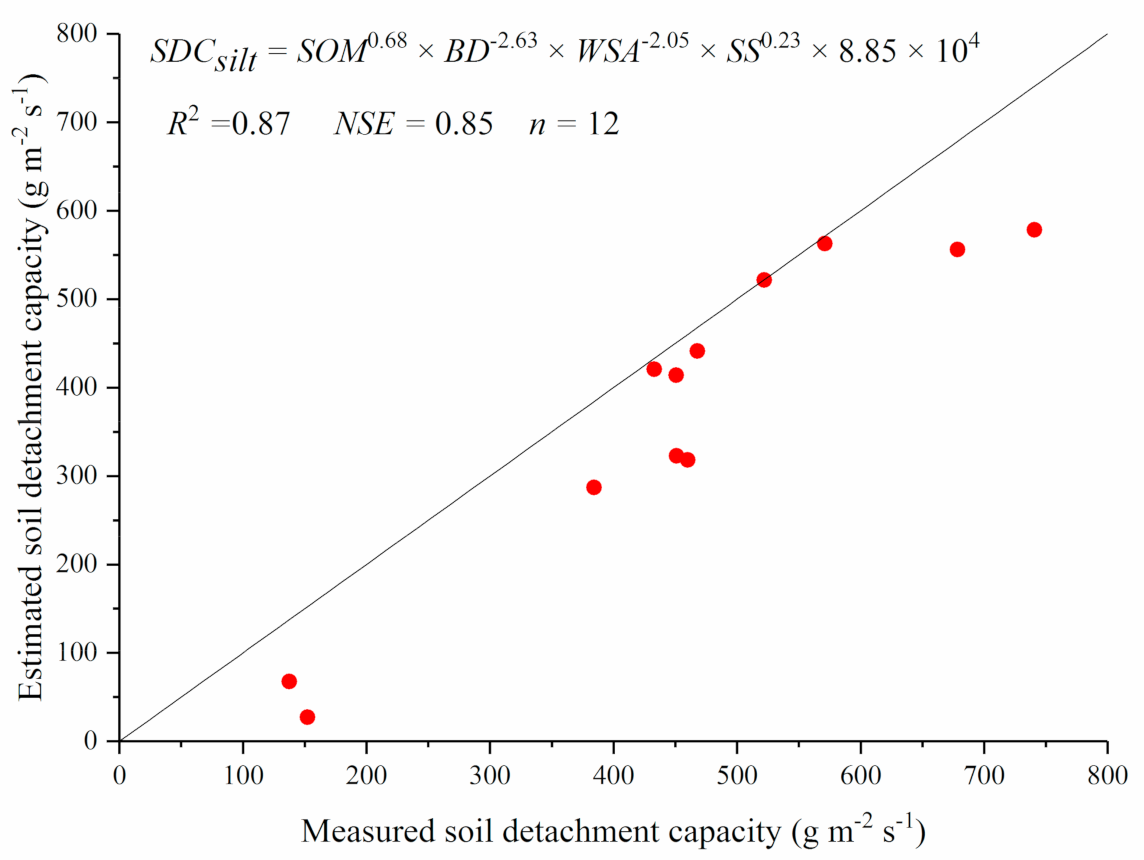
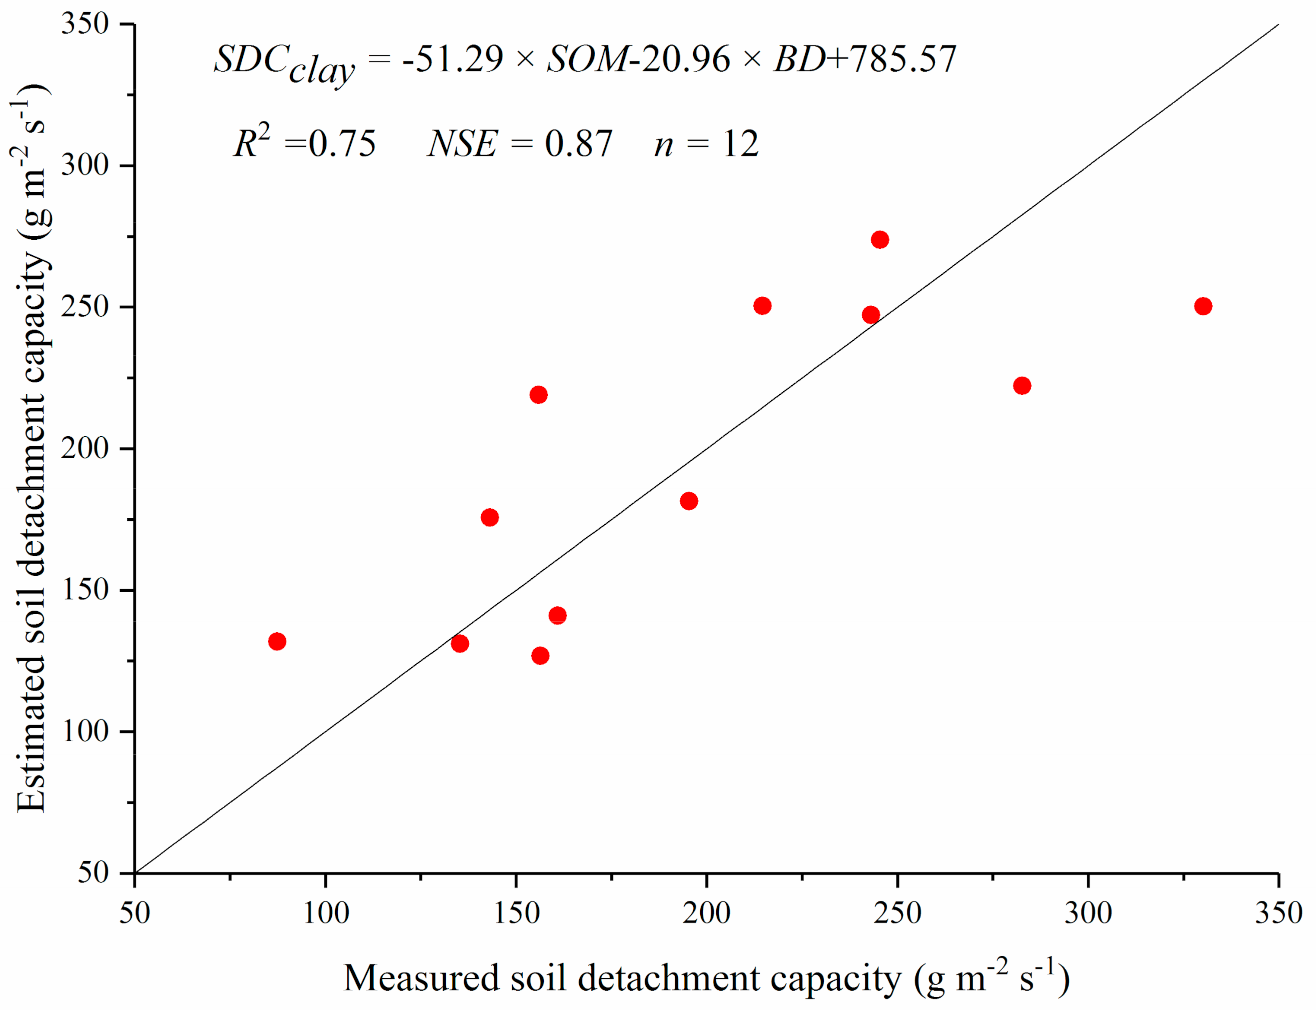
Generally, soil detachment capacities of different soils are difficult to obtain because measured soil erosion processes under different soils, slopes, and flow discharges are needed. Thus, it is helpful to develop regression equations based on easily measured parameters of soils. A nonlinear regression analysis indicated that soil detachment capacity (SDC) of silt loam could be estimated well by soil organic matter (SOM), bulk density (BD), water stable aggregates (WSA), and shear strength (SS) (Equation (2), Figure 10). Additionally, linear regression analysis indicated that soil detachment capacity of clay loam could be estimated well by soil organic matter and bulk density (Equation (3), Figure 11).
SDCsilt = SOM0.68 × BD−2.63 × WSA−2.05 × SS0.23 × 8.85 × 104
SDCclay = −51.29 × SOM-20.96 × BD + 785.57
4. Discussion
4.1. Effect of Freeze-Thaw on Soil Properties
With increasing subsequent freeze-thaw cycles (10–15 times), soil bulk density decreased to stable values (Figure 3) which indicates that freeze-thaw cycles had limited effect on soil bulk density. Frequent phase changes of soil water slowly altered the porosity ratio of soil, causing modifications in soil bulk density. However, there exists a critical freeze-thaw cycle related to the soil remodeling properties and the limited degree of freeze-thaw [34,35]. On the other hand, development of variation tendency and the stable state of soil bulk density depend on soil texture and initial state. Bulk density of saline–sodic soils would increase when the initial value was lower, while soils with larger initial values would become looser in structure and decrease in bulk density [36]. In this study, the bulk density of all three soils decreased with the increase of freeze-thaw cycles, which may be due to the initial moisture content and that there were no impurities in the soils. Starkloff et al. [37] found that looser sandy soil was more affected by freeze-thaw than silt soil of Nordic countries by X-ray scanner, which contrasts with this study.
Generally, soil moisture transport and phase transition during freeze-thaw process can lead to the fragmentation of aggregates. However, the influence of freeze-thaw cycles on aggregates was not only related to soil texture but also to the size of aggregates. Smaller aggregates were reformed under the action of soil deformation compression and soil moisture adsorption after the large aggregates were broken. There were studies that have shown that it can reach a peaking after 2–3 freeze-thaw cycles [38]. Additionally, the negative effects of freeze-thaw on water stable aggregates are more pronounced for aggregates larger than 0.25 mm, in comparison with micro aggregates [39]. For sandy loam in this study, during the freeze-thaw process, fragmentation and recombination occurred frequently, and the aggregate content reached the peak value before the 5th freeze-thaw cycle (Figure 4). After 10th freeze-thaw cycle, it had no significant change, maybe because of the lower content of water stable aggregates [40]. For silt loam and clay loam in this study, aggregates contents were relatively high, and the crushing effect was greater than recombination at the beginning of freeze-thaw. Nonetheless, aggregates contents peaked after the 10th and 5th freeze-thaw cycle for clay loam and silt loam, respectively (Figure 4). Overall, freeze-thaw decreased the aggregates stability of all soils, but the effect was more severe on the silt soil (reduced by 48.54%), which was similar to existing research [27].
Freeze-thaw breaks soil aggregates, exposes carbohydrates, fatty acids and sterols, and increases their contact with and utilization by microorganisms. Extractable nutrients have been observed to increase by 2 to 3 times [41]. Moreover, the increase of fine particulate or clay, which has large surface areas, has strong adsorption capacity for organic matter, resulting in redistribution or dissolution of soil organic matter [42]. Thus, the phase changes of water led to contraction of organic matter, destruction of bonds with soil particles, and led to increased release of soil organic matter in this study (Figure 5). Especially for silt loam, the increase of organic matter content (1.49 times) was related to the decrease of aggregates content (48.54%) and was the largest among the three soils. However, as freeze-thaw cycles increased, soil organic matter would not rise significantly at all after the 10th cycles due to its relatively small proportion of total soil carbon and the limited effect of freeze-thaw cycles.
After freeze-thaw cycles, an important index to gauge soil resistance to erosion, the shear strength of three soils significantly decreased, being supportive to most previous studies showing that soil structure becomes looser, and the mechanical properties and microstructure of soils change significantly [43,44,45,46,47]. Soil cohesion was determined by the tensile forces of menisci at the particle contact surfaces as well as the contact relationships between solid particles and liquid films [15]. In the process of freeze-thaw, the frequent phase changes of the water between soil particles led to tensile forces being destroyed and the extent of damage varied with freeze-thaw cycles and soil texture. The shear strength of sandy loam and silt loam decreased after the first few freeze-thaw cycles and then kept nearly stable after about the 5th to 15th cycles, which was similar to the aforementioned other soil properties (Figure 6). However, shear strength of clay loam still increased after the 15th freeze-thaw cycle, mainly because of the indirect effect of its higher soil aggregates content after the 10th cycle and the increased soil organic matter [48].
4.2. Effect Mechanism of Freeze-Thaw on Soil Detachment Capacity
Soil detachment is the initial stage of soil erosion, and the most affected by freeze-thaw. Soil erosion amounts during periods of thawing were higher than those of other seasons, and they could reach 2–3 times [21,22,23]. Similarly, this study showed that soil detachment capacity of sandy loam and silt loam under freeze-thaw was larger (by approximately 1.38 and 3.56 times) than that under unfrozen, which contrasts with clay loam (Figure 8). Obviously, soil properties in this experiment proved to be the most important factor that significantly influenced soil detachment capacity, determined by soil types and the number of freeze-thaw cycles. The process of soil detachment in the Qinghai-Tibet plateau was significantly lower than that of other regions of China, which was related to the degree of freeze-thaw and soil properties, but the specific mechanism of the effect was unclear [49].
As the most important factors, shear strength and water stable aggregates were strongly negatively correlated with soil erodibility [50,51,52]. Soil detachment capacity significantly increased as a result of reductions in soil shear strength, and water stable aggregates were destroyed by freeze-thaw [13]. In the case of sandy loam, for example, soil detachment capacity was basically larger than silt loam and clay loam without freeze-thaw cycles in this study. These discrepancies were mainly due to the fact that shear strength, water stable aggregates, and soil organic matter of sandy loam were less, while the tensile forces of coarse particles and the contact relationships between them and liquid films were weaker in some cases than others [50,53]. Additionally, the soil properties had not changed significantly, as freeze-thaw cycles increased after it had been destroyed by the first freeze-thaw (Figure 3, Figure 4, Figure 5, Figure 6 and Figure 7). This means that soil detachment capacity of sandy loam did not significantly increase with the increase of freeze-thaw cycles and only had a significant negative correlation with shear strength (Table 2).
Likewise, soil detachment capacity of silt loam was the greatest after the 20th freeze-thaw cycle in this study (Figure 9). Higher powder content has been related to greater formation of capillaries, leading to more rapid moisture migration and greater damage due to freeze-thaw [50]. Therefore, silt loam was most prone to erosion when exposed to freeze-thaw. The process of soil detachment was complex, and in our experiments, it was significantly influenced and well estimated by bulk density, soil organic matter, water stable aggregates, and shear strength (Table 2, Figure 10). Compared to sandy loam and silt loam, the decreased soil detachment capacity of clay loam after freeze-thaw mainly depended on soil organic matter and soil bulk density mainly because increased freeze-thaw times, the variation trend of water stable aggregates, and the relative complexity of shear strength cannot represent the change of soil detachment capacity. Additionally, soil detachment capacity cannot be determined well by a single factor, and the comprehensive effect of various factors should be considered [9,10,11].
5. Conclusions
The effects of freeze-thaw cycles on the properties and soil detachment capacity of three loamy soils were examined by using the artificial freeze-thaw and scour experiments. Soil bulk density, water stable aggregates, and shear strength of three soils were negatively correlated with freeze-thaw cycles. However, the change of soil organic matter was the opposite. After 10 to 15 freeze-thaw cycles, soil properties were basically stable. Soil detachment capacity of silt loam and sandy loam were positively correlated with freeze-thaw cycles, which was contrary to findings for clay loam. The mean soil detachment capacity of sandy loam was the greatest before and after freeze-thaw. After the 15th freeze-thaw cycle, the soil detachment capacity of sandy loam was exceeded by silt loam. A nonlinear regression function could be used to describe the relationship between the soil detachment capacity of silt loam and soil organic matter, bulk density, water stable aggregates, and shear strength. Soil organic matter and bulk density were the best hydraulic parameters to simulate soil detachment capacity of clay loam.
Author Contributions
Conceptualization, J.L. and X.J.; methodology, J.L.; software, H.L.; validation, J.L., B.S., F.R., H.L., and X.J.; formal analysis, J.L.; investigation, B.S., F.R., and H.L.; resources, X.J.; data curation, H.L.; writing—original draft preparation, J.L.; writing—review and editing, B.S.; project administration, B.S.; funding acquisition, B.S. All authors have read and agreed to the published version of the manuscript.
Funding
This research was funded by the Program of National Key Research and Development of China (2018YFC0407601-03), Central Public-interest Scientific Institution Basal Research Fund of China (No. CKSF2019292/SH+TB and CKSF2019179/TB), and the National Natural Science Foundation of China (41807066 and 41877082).
Institutional Review Board Statement
Not applicable.
Informed Consent Statement
Not applicable.
Data Availability Statement
The data presented in this study are available on request from the corresponding author. The data are not publicly available due to the funded project is not finished yet.
Acknowledgments
All authors thank editors and reviewers for insightful comments on the original manuscript.
Conflicts of Interest
The authors declare no conflict of interest.
References
- Luca, M. Govern our soils. Nature 2015, 528, 32–33. [Google Scholar]
- Mohammed, S.; Al-Ebraheem, A.; Holb, I.J.; Alsafadi, K.; Dikkeh, M.; Pham, Q.B.; Linh, N.T.T.; Szabo, S. Soil management effects on soil water erosion and runoff in central Syria—A comparative evaluation of general linear model and random forest regression. Water 2020, 12, 25–29. [Google Scholar] [CrossRef]
- Nearing, M.A.; Bradford, J.M.; Parker, S.C. Soil Detachment by shallow flow at low slopes. Soil Sci. Soc. Am. J. 1991, 55, 351–357. [Google Scholar] [CrossRef]
- Zhang, G.H.; Liu, B.Y.; Liu, G.B.; Nearing, M.A. Detachment of undisturbed soil by shallow flow. Soil Sci. Soc. Am. J. 2003, 67, 713–719. [Google Scholar] [CrossRef]
- Chang, E.; Li, P.; Li, Z.; Su, Y.; Zhang, Y.; Zhang, J.; Liu, Z.; Li, Z. The impact of vegetation successional status on slope runoff erosion in the Loess Plateau of China. Water 2019, 11, 2614. [Google Scholar] [CrossRef] [Green Version]
- Knapen, A.; Poesen, J.; Govers, G.; Nachtergaele, J. Resistance of soils to concentrated flow erosion: A review. Earth-Sci. Rev. 2007, 80, 75–109. [Google Scholar] [CrossRef]
- Wang, D.D.; Wang, Z.L.; Shen, N.; Chen, H. Modeling soil detachment capacity by rill flow using hydraulic parameters. J. Hydrol. 2016, 535, 473–479. [Google Scholar] [CrossRef]
- Zhang, G.H.; Liu, G.B.; Tang, K.M.; Zhang, X.C. Flow Detachment of Soils under Different Land Uses in the Loess Plateau of China. Trans. ASABE 2008, 51, 883–890. [Google Scholar]
- Zhang, G.H.; Ding, W.F.; Pu, J.; Li, J.M.; Qian, F.; Sun, B.Y. Effects of moss-dominated biocrusts on soil detachment by overland flow in the Three Gorges Reservoir Area of China. J. Mt. Sci. 2020, 17, 2418–2431. [Google Scholar] [CrossRef]
- Yi, W.; Cao, L.X.; Fan, J.B.; Lu, H.; Liang, Y. Modelling Soil Detachment of Different Management Practices in the Red Soil Region of China. Land Degrad. Dev. 2017, 28, 1496–1505. [Google Scholar]
- Wang, B.; Zhang, G.H.; Shi, Y.Y.; Zhang, X.C.; Ren, Z.P.; Zhu, L.J. Effect of natural restoration time of abandoned farmland on soil detachment by overland flow in the Loess Plateau of China. Earth Surf. Process. Landf. 2013, 38, 1725–1734. [Google Scholar] [CrossRef]
- Chen, Z.X.; Guo, M.M.; Wang, W.L. Variations in Soil Erosion Resistance of Gully Head along a 25-Year Revegetation Age on the Loess Plateau. Water 2020, 12, 3301. [Google Scholar] [CrossRef]
- Nciizah, A.D.; Wakindiki, I.I.C. Physical indicators of soil erosion, aggregate stability and erodibility. Arch. Agron. Soil Sci. 2015, 61, 827–842. [Google Scholar] [CrossRef]
- Chow, T.L.; Rees, H.W.; Monteith, J. Seasonal distribution of runoff and soil loss under four tillage treatments in the upper St. John River valley New Brunswick, Canada. Can. J. Soil Sci. 2000, 80, 649–660. [Google Scholar] [CrossRef] [Green Version]
- Kok, H.; Mccool, D.K. Quantifying freeze/thaw-induced variability of soil strength. T ASAE 1990, 33, 501–506. [Google Scholar] [CrossRef]
- Bajracharya, R.M.; Lal, R.; Hall, G.F. Temporal variation in properties of an uncropped, ploughed Miamian soil in relation to seasonal erodibility. Hydrol. Process. 1998, 12, 1021–1030. [Google Scholar] [CrossRef]
- Wang, R.; Zhu, Q.K.; Ma, H. Spatial-temporal variations in near-surface soil freeze-thaw cycles in the source region of the Yellow River during the period 2002–2011 based on the Advanced Microwave Scanning Radiometer for the Earth Observing System (AMSR-E) data. J. Arid Land 2017, 9, 850–864. [Google Scholar] [CrossRef] [Green Version]
- Teng, H.F.; Liang, Z.Z.; Chen, S.C.; Liu, Y.; Rossel, R.A.; Chappell, A.; Yu, W.; Shi, Z. Current and future assessments of soil erosion by water on the Tibetan Plateau based on RUSLE and CMIP5 climate models. Sci. Total Environ. 2018, 635, 673–686. [Google Scholar] [CrossRef]
- Fan, H.M.; Cai, Q.G. Review of research progress in freeze-thaw erosion. Sci. Soil Water Conserv. 2003, 1, 50–55. [Google Scholar]
- Chen, J.; Zheng, X.; Zang, H.; Ping, L.; Ming, S. Numerical Simulation of Moisture and Heat Coupled Migration in Seasonal Freeze-thaw Soil Media. J. Pure Appl. Microbiol. 2013, 7, 151–156. [Google Scholar]
- Gatto, L.W. Soil freeze–thaw-induced changes to a simulated rill: Potential impacts on soil erosion. Geomorphology 2000, 32, 147–160. [Google Scholar] [CrossRef]
- Ferrick, M.G.; Gatto, L.W. Quantifying the effect of a freeze-thaw cycle on soil erosion: Laboratory experiments. Earth Surf. Process. Landf. 2005, 30, 1305–1326. [Google Scholar] [CrossRef]
- Barnes, N.; Luffman, I.; Nandi, A. Gully Erosion and Freeze-Thaw Processes in Clay-Rich Soils, Northeast Tennessee, USA. Georesj 2016, 9, 67–76. [Google Scholar] [CrossRef]
- Fu, Q.; Hou, R.J.; Li, T.X. Soil Moisture-heat transfer and its action mechanism of freezing and thawing soil. Trans. Chin. Soc. Agric. Mach. 2016, 47, 99–110. [Google Scholar]
- Sun, B.Y.; Li, Z.B.; Xiao, J.B.; Zhang, L.T.; Ma, B.; Li, J.M.; Cheng, D.B. Research progress of the effect of freeze-thaw on soil physical and chemical properties and wind and water erosion. Chin. J. Appl. Ecol. 2019, 30, 337–347. [Google Scholar]
- Barthes, B.; Roose, E. Aggregate stability as an indicator of soil susceptibility to runoff and erosion, validation at several levels. Catena 2002, 47, 133–149. [Google Scholar] [CrossRef] [Green Version]
- Kværno, S.H.; Oygarden, L. The influence of freeze–thaw cycles and soil moisture on aggregate stability of three soils in Norway. Catena 2006, 67, 175–182. [Google Scholar] [CrossRef]
- Oztas, T.; Fayetorbay, F. Effect of freezing and thawing processes on soil aggregate stability. Catena 2003, 52, 1–8. [Google Scholar] [CrossRef]
- Li, G.Y.; Fan, H.M. Effect of Freeze-Thaw on Water Stability of Aggregates in a Black Soil of Northeast China. Pedosphere 2014, 24, 285–290. [Google Scholar] [CrossRef]
- Sadeghi, S.H.; Raeisi, M.B.; Hazbavi, Z. Influence of freeze-only and freezing-thawing cycles on splash erosion. Int. Soil Water Conserv. Res. 2018, 6, 275–279. [Google Scholar] [CrossRef]
- Wang, T.; Li, P.; Liu, Y.; Li, Z.B. Experimental investigation of freeze-thaw meltwater compound erosion and runoff energy consumption on loessal slopes. Catena 2020, 185, 104310. [Google Scholar] [CrossRef]
- Koiter, A.J.; Owens, P.N.; Petticrew, E.L. The role of soil surface properties on the particle size and carbon selectivity of interrill erosion in agricultural landscapes. Catena 2017, 153, 194–206. [Google Scholar] [CrossRef]
- Wang, L.; Shi, Z.H. Size Selectivity of eroded sediment associated with soil texture on steep slopes. Soil Sci. Soc. Am. J. 2015, 79, 917. [Google Scholar] [CrossRef]
- Dagesse, D.F. Freezing-induced bulk soil volume changes. Can. J. Soil Sci. 2010, 90, 389–401. [Google Scholar] [CrossRef] [Green Version]
- Jie, Z.; Tang., Y. Experimental inference on dual-porosity aggravation of soft clay after freeze-thaw by fractal and probability analysis. Cold Reg. Sci. Technol. 2018, 153, 181–196. [Google Scholar]
- Sahin, U.; Angin, I.; Kiziloglu, F.M. Effect of freezing and thawing processes on some physical properties of saline–sodic soils mixed with sewage sludge or fly ash. Soil Tillage Res. 2008, 99, 254–260. [Google Scholar]
- Starkloff, T.; Larsbo, M.; Stolte, J. Quantifying the impact of a succession of freezing-thawing cycles on the pore network of a silty clay loam and a loamy sand topsoil using X-ray tomography. Catena 2017, 156, 365–374. [Google Scholar] [CrossRef]
- Lehrsch, G.A. Freeze-Thaw Cycles Increase Near-Surface Aggregate Stability. Soil Sci. 1998, 163, 63–70. [Google Scholar]
- Wang, D.Y.; Ma, W.; Niu, Y.H. Effects of cyclic freezing and thawing on mechanical properties of Qinghai–Tibet clay. Cold Reg. Sci. Technol. 2007, 48, 34–43. [Google Scholar] [CrossRef]
- Edwards, L.M. The effect of alternate freezing and thawing on aggregate stability and aggregate size distribution of some Prince Edward Island soils. Eur. J. Soil Sci. 2010, 42, 193–204. [Google Scholar] [CrossRef]
- Song, Y.; Yu, X.F.; Zhou, Y.C. Progress of freeze-thaw effects on carbon, nitrogen and phosphorus cycling in soils. Soils Crop. 2016, 5, 78–90. [Google Scholar]
- Mohanty, S.K.; Saiers, J.E.; Ryan, J.N. Colloid-facilitated mobilization of metals by freeze-thaw cycles. Environ. Sci. Technol. 2014, 48, 977–984. [Google Scholar] [PubMed]
- Ni, W.K.; Shi, H.Q. Influence of freezing-thawing cycles on micro-structure and shear strength of loess. J. Glaciol. Geocryol. 2014, 36, 922–927. [Google Scholar]
- Zhang, W.B.; Ma, J.Z.; Tang, L. Experimental study on shear strength characteristics of sulfate saline soil in Ningxia region under long-term freeze-thaw cycles. Cold Reg. Sci. Technol. 2019, 160, 48–57. [Google Scholar]
- Nguyen, T.H.; Cui, Y.J.; Valery, F. Effect of freeze-thaw cycles on mechanical strength of lime-treated fine-grained soils. Transp. Geotech. 2019, 21, 100281. [Google Scholar]
- Dong, X.H.; Zhang, A.J.; Lian, J.B.; Guo, M.X. Study of shear strength deterioration of loess under repeated freezing-thawing cycles. J. Glaciol. Geocryol. 2010, 32, 767–772. [Google Scholar]
- Liu, J.; Chang, D.; Yu, Q. Influence of freeze-thaw cycles on mechanical properties of a silty sand. Eng. Geol. 2016, 210, 23–32. [Google Scholar] [CrossRef]
- Schjonning, P.; Lamande, M.; Keller, T. Subsoil shear strength–Measurements and prediction models based on readily available soil properties. Soil Tillage Res. 2020, 200, 104638. [Google Scholar] [CrossRef]
- Li, M.Y.; Xiao, H.; Huan, H.; Shao, Y.; Xia, Z. Modelling soil detachment by overland flow for the soil in the Tibet Plateau of China. Sci. Rep. 2019, 9, 8063–8073. [Google Scholar] [CrossRef] [Green Version]
- Formanek, G.E.; Mccool, D.K.; Papendick, R.I. Freeze-thaw and consolidation effects on strength of a wet silt loam. Trans. ASAE-Am. Soc. Agric. Eng. 1984, 27, 1749–1752. [Google Scholar] [CrossRef]
- Sun, L.; Zhang, G.H.; Luan, L.L.; Liu, F.L. Temporal variation in soil resistance to flowing water erosion for soil incorporated with plant litters in the Loess Plateau of China. Catena 2016, 145, 239–245. [Google Scholar] [CrossRef]
- Boswell, E.P.; Balster, N.J.; Bajcz, A.W.; Thompson, A.M. Soil aggregation returns to a set point despite seasonal response to snow manipulation. Geoderma 2020, 357, 113954. [Google Scholar] [CrossRef]
- Flerchinger, G.N.; Lehrsch, G.A.; McCool, D.K. Freezing and thawing. In Processes Encyclopedia of Soils in the Environment; Elsevier Inc.: Amsterdam, The Netherlands, 2005; pp. 104–110. [Google Scholar]
Figure 1.
Location of sampling points and soil types of Loess Plateau in China.

Figure 2.
Schematic diagram of experimental setup.

Figure 3.
Relationships between soil bulk density and freeze-thaw cycles of three soils. Note: The letters indicated whether the differences in the test results were significant or not. “a, b” stands for sandy loam, “A, B” stands for silt loam, “c, d” stands for clay loam. And different letters indicate a significant difference of test results among the different freeze-thaw cycles and soils at the 0.05 level.

Figure 4.
Relationships between soil water stable aggregates and freeze-thaw cycles of three soils. Note: The letters indicated whether the differences in the test results were significant or not. “a, b, c, d” stands for clay loam, “A, B, C, D, E, F” stands for silt loam, “e, f, g” stands for sandy loam. Different letters indicate a significant difference of test results among the different freeze-thaw cycles and soils at the 0.05 level.

Figure 5.
Relationships between soil organic matters and freeze-thaw cycles of three soils. Note: The letters indicated whether the differences in the test results were significant or not. “a, b, c, d” stands for clay loam, “A, B, C, D, E” stands for silt loam, “e, f, g, h” stands for sandy loam. Different letters indicate a significant difference of test results among the different freeze-thaw cycles and soils at the 0.05 level.

Figure 6.
Relationships between soil shear strength and freeze-thaw cycles of three soils. Note: The letters indicated whether the differences in the test results were significant or not. “a, b, c” stands for clay loam, “A, B, C, D” stands for silt loam, “d, e, f” stands for sandy loam. Different letters indicate a significant difference of test results among the different freeze-thaw cycles and soils at the 0.05 level.

Figure 7.
Relationship between soil compressive strength and freeze-thaw cycles of three soils. Note: The letters indicated whether the differences in the test results were significant or not. “a, b” stands for clay loam, “A, B, C” stands for silt loam, “c, d” stands for sandy loam. Different letters indicate a significant difference of test results among the different freeze-thaw cycles and soils at the 0.05 level.

Figure 8.
Soil detachment capacities before and after freeze-thaw cycles of three soils. Note: The letters indicated whether the differences in the test results were significant or not. “a, b, c” stands for before freeze-thaw cycles (FTCs), “A, B” stands for after freeze-thaw cycles. Different letters indicate a significant difference of test results among the different freeze-thaw cycles and soils at the 0.05 level.

Figure 9.
Variation of soil detachment capacity with freeze-thaw cycles. Note: The letters indicated whether the differences in the test results were significant or not. “a, b, c” stands for sandy loam, “A, B, C, D” stands for sandy loam, “d, e” stands for clay loam. Different letters indicate a significant difference of test results among the different freeze-thaw cycles and soils at the 0.05 level.

Figure 10.
Measured soil detachment capacity vs. estimated ones using Equation (2) of silt loam.

Figure 11.
Measured soil detachment capacity vs. estimated ones using Equation (3) of clay loam.


Table 1.
Information on three soil samples.
| Soil Samples | Geographic Coordinates | Soil Texture % | |||
|---|---|---|---|---|---|
| Clay (<0.002) | Silt (0.002–0.05) | Sand (>0.05) | |||
| Aeolian sandy soil | 110°31′17″ E | 39°58′12″ N | 11.14 | 14.84 | 74.02 |
| Loessal soil | 109°15′46″ E | 36°46′28″ N | 20.17 | 61.04 | 18.79 |
| Anthropogenic-alluvial soil | 107°40′47″ E | 40°54′21″ N | 32.18 | 23.68 | 44.14 |
Table 2.
Regression analysis of soil detachment capacities of three soils and soil properties under the condition of freeze-thaw.
Table 2.
Regression analysis of soil detachment capacities of three soils and soil properties under the condition of freeze-thaw.
| Soil Properties | Sandy Loam | Silt Loam | Clay Loam | |||
|---|---|---|---|---|---|---|
| Regression Equation | R2 | Regression Equation | R2 | Regression Equation | R2 | |
| Soil organic matter | - | - | y = 20.19e0.69x | 0.74 * | y = 3617.3e−0.27x | 0.63 ** |
| Bulk density | - | - | y = −2165.1x + 3238.5 | 0.54 * | y = 915.48x − 877.94 | 0.49 * |
| Water stable aggregates | - | - | y = 3255.1e−0.09x | 0.85 ** | - | - |
| Shear strength | y = −38.88x + 634.25 | 0.49 * | y = −44.28x + 762.83 | 0.80 ** | - | - |
Note: The number of samples for each soil property was 18; y is soil detachment capacity, x is soil properties. * Significant at p < 0.05, ** Significant at p < 0.01.
Publisher’s Note: MDPI stays neutral with regard to jurisdictional claims in published maps and institutional affiliations. |
© 2021 by the authors. Licensee MDPI, Basel, Switzerland. This article is an open access article distributed under the terms and conditions of the Creative Commons Attribution (CC BY) license (http://creativecommons.org/licenses/by/4.0/).
Share and Cite
MDPI and ACS Style
Lu, J.; Sun, B.; Ren, F.; Li, H.; Jiao, X. Effect of Freeze-Thaw Cycles on Soil Detachment Capacities of Three Loamy Soils on the Loess Plateau of China. Water 2021, 13, 342. https://doi.org/10.3390/w13030342
AMA Style
Lu J, Sun B, Ren F, Li H, Jiao X. Effect of Freeze-Thaw Cycles on Soil Detachment Capacities of Three Loamy Soils on the Loess Plateau of China. Water. 2021; 13(3):342. https://doi.org/10.3390/w13030342
Chicago/Turabian StyleLu, Jian, Baoyang Sun, Feipeng Ren, Hao Li, and Xiyun Jiao. 2021. "Effect of Freeze-Thaw Cycles on Soil Detachment Capacities of Three Loamy Soils on the Loess Plateau of China" Water 13, no. 3: 342. https://doi.org/10.3390/w13030342
Note that from the first issue of 2016, this journal uses article numbers instead of page numbers. See further details here.