
Enhanced Mesophilic Anaerobic Digestion of Primary Sewage Sludge


Department of Civil Engineering, Aristotle University of Thessaloniki, 54124 Thessaloniki, Greece
*
Author to whom correspondence should be addressed.
Water 2021, 13(3), 348; https://doi.org/10.3390/w13030348
Submission received: 11 January 2021
/
Revised: 25 January 2021
/
Accepted: 26 January 2021
/
Published: 30 January 2021
(This article belongs to the Special Issue Application of Biological and Chemical Processes to Wastewater Treatment)
Abstract
:Processing of the produced primary and secondary sludge during sewage treatment is demanding and requires considerable resources. Most common practices suggest the cotreatment of primary and secondary sludge starting with thickening and anaerobic digestion. The aim of this study is to investigate the anaerobic digestion of the primary sludge only and estimate its impact on sludge treatment and energy recovery. Within this context, the performance of the anaerobic digestion of primary sludge is explored and focused on practices to further enhance the methane production by using additives, e.g., a cationic polyelectrolyte and attapulgite. The results showed that the overall yield in methane production during anaerobic digestion of primary sludge alone was higher than that obtained by the anaerobic digestion of mixed primary and secondary sludge (up to 40%), while the addition of both organic polyelectrolyte and attapulgite enhanced further the production of methane (up to 170%). Attapulgite increased the hydrolysis rate of biosolids and produced relatively stabilized digestate, though of lower dewaterability. Moreover, the results suggest that single digestion of primary sludge may accomplish higher methane production capacities at lower digestors’ volume increasing their overall efficiency and productivity, while the produced digestates are of adequate quality for further utilization mainly in agricultural or energy sectors.
1. Introduction
Primary sludge from municipal wastewater treatment plants (MWWTPs) is usually codigested anaerobically with secondary sludge to produce biomethane and stabilized sludge that can further be utilized as a secondary material in various economy sectors in the context of circular economy. However, these two fractions of sewage sludge are of different quality. Primary sludge contains higher quantities of biodegradable organic material compared to secondary sludge, therefore anaerobic digestion (AD) is expected to be more efficient with regards to energy capacity and overall methane production. Indeed, organic matter from primary settling tanks consists of fatty acids, lipids, fiber, and other solids, while secondary sludge consists mainly of more refractory products, like microbes and extracellular polymeric substances (EPS) with less energy potential [1,2,3]. However, despite the higher energy capacity of primary sludge, anaerobic digestion causes the loss of a slight amount of energy potential, as some carbohydrates that are decomposed to methane, contain theoretically higher energy potential than the end-product, e.g., methane. Still, anaerobic digestion of primary sludge is expected to yield higher methane production compared to secondary sludges.
Recent studies investigate ways and various pretreatment technologies to increase the overall efficiency of the anaerobic treatment of mixed primary and secondary sludge. These studies mainly focus to concentrate biosolids and disintegrate biomass to release organics amenable to anaerobic digestion. Most common techniques include chemical treatment (coagulation, hydrolysis), thermal treatment (thermal hydrolysis), mechanical treatment (application of shear stress forces), and enzymatic treatment [4,5]. An alternative approach would be to enhance primary settling, so that primary sludge is enriched with biodegradable solids and biogas production would thus be intensified [6]. Although this practice is promising, aspects like the increased consumption of chemicals, that may produce adverse effects on the environment in downstream applications, as well as the overall operational cost should be carefully addressed [7]. Codigestion of sewage sludge with organic wastes may improve digestion conditions inside the digestors; thus, achieving increased anaerobic digestion efficiency and energy production [8,9]. Wickham et al. [10] demonstrated that codigestion of sewage sludge with organic rich wastes and dehydrated algae yielded increased biomethane production. However, the adaptation of such technologies in MWWTPs, although feasible from technological point of view, is difficult to accomplish due to legislation constrains and downstream management of the final products. For example, increased concentrations of sulphur and phosphorous in food waste cosubstrates pose risks of elevated hydrogen sulphide (H2S) in biogas and phosphorus accumulation in sludge that need to be carefully addressed during full scale operation [9,10].
As sludge treatment gains more attention, the increase of volatile solids loading rate inside anaerobic digesters in MWWTPs remains a critical issue. To this regard, besides pretreatment of mixed sludge to enhance biodegradability, dewaterability, and biogas production [11], a separate pretreatment of each sludge fraction has been proposed as a promising approach [12]. It is based on the direct feed of anaerobic digestor with primary sludge and the subsequent feed with secondary sludge after dynamic thickening that results in increased concentration of biomass and overall enhanced digester performance [12,13]. Furthermore, the application of a postaerobic treatment step may provide economic sustainability to the operating costs of a MWWTP [12]. Although promising, such practices should be further studied as they are linked to significant capital costs, especially for facilities that are already operating.
In general, the intensification of anaerobic digestion of organic wastes has been realized by using various inorganic additives, such as clay minerals that improve methane production efficiency and process stability. Lin et al. [14] investigated the batch anaerobic digestion of swine manure under 60 g/L zeolite and found that zeolite increases biogas yield by 20%. This behavior was attributed to the stimulation of microbial growth, the effective regulation of ammonia toxicity, and the increase of hydrolysis, mainly due to adsorption properties of zeolite and the concurrent release of calcium, magnesium, and potassium ions. In addition, Fernández et al. [15] found that zeolite and other clay minerals possess a high capacity for immobilization of microorganisms resulting in biomass growth that considerably favors anaerobic digestion. Likewise, Liang et al. [16] confirmed that the addition of attapulgite up to a certain level during anaerobic digestion of pig sludge increased the production of methane by about 37%, while methane production kinetics were also affected. Still, the influence of such materials needs to be elucidated, as well as the characteristics of the produced sludge that are critical for the assessment of environmental impact during its further utilization and disposal.
The most prevalent methodology for the evaluation of methane production by anaerobic digestion is currently biochemical methane potential (BMP) testing [1,17]. Typically, sludge from a well-operating anaerobic digestor is mixed with a substrate and the obtained liquor is transferred and stored into reactor bottles inside a controlled temperature bath or chamber under continuous stirring for about 30 days. The bottles are sealed to achieve anaerobic conditions and the produced gas mixture (containing mainly methane) is measured to estimate biomethane potential. The BMP is ideally suited, to elucidate what kinds of substrates have the greatest biomethane potential, while at the same time it may be used to approximate the critical variable for the assessment of the anaerobic biodegradability of solid wastes [18] that is the optimal ratio between the substrate (S) and inoculum (I) (SIR). According to Angelidaki et al. [17], the SIR should be recognized as one of the major parameters affecting the results of anaerobic assays. The optimum SIR depends on the activity and biomass concentration of the inoculum, as well as the organic loading (otherwise volatile solids concentration) and biodegradability potential of the substrate. Even though the SIR technically affects only the kinetics and not the ultimate methane yield, it is mentioned that too low SIR may inhibit the induction of the enzymes required for the biodegradation of the substrate; thus, leading to relatively low biomethane production capacity [1,8,19]. Most commonly, for anaerobic digestion of sewage sludges, the used SIR is 0.5 or 1 g VS substrate per 2 g VS inoculum [8,19]. In case of substrates that contain more rapidly degradable organic molecules even lower ratios can be applied [19]. Although the BMP tests have been widely used, the lack of standardized protocols may jeopardize their validity. Nevertheless, this gap of standardization is bridged by the adaptation of common practices and protocol guidelines [1,17].
This study was triggered by the upgraded energy potential of primary sludge that could be further enhanced using additives that have been confirmed to improve hydrolysis during anaerobic digestion (AD) of other waste streams. According to literature data, primary sludge is more likely to produce more methane than the combined stream of primary and secondary sludge. Still, it is anticipated that the higher methane production will not be accompanied by complete decomposition of the organic matter, leaving space for further improvements. To this account, the addition of natural and synthetic materials is examined to promote hydrolysis and overall anaerobic digestion efficiency. Therefore, this study investigates the anaerobic digestion of the fraction of primary sludge exclusively to produce enriched biomethane by primary biosolids. This approach aims to upgrade anaerobic digestion in currently operating plants, where multiple digesters operate and feed divergence could be feasible. In this case, secondary sludge could be intensively thickened prior to anaerobic digestion, or cotreated with other organic wastes, since secondary sludge may reduce the toxicity that arises from ammonia that is present in numerous organic wastes; however, this falls beyond the aims of this study. To optimize the methane production of primary sludge, a wide experimental protocol is presented including the examination of the optimum substrate (primary sludge) to inoculum ratio (SIR), the addition of a commercial organic chemical, e.g., a cationic polyelectrolyte that is used for sludge thickening, and the addition of a natural occurring inorganic clay mineral, attapulgite.
2. Materials and Methods
2.1. Substrates and Inoculum
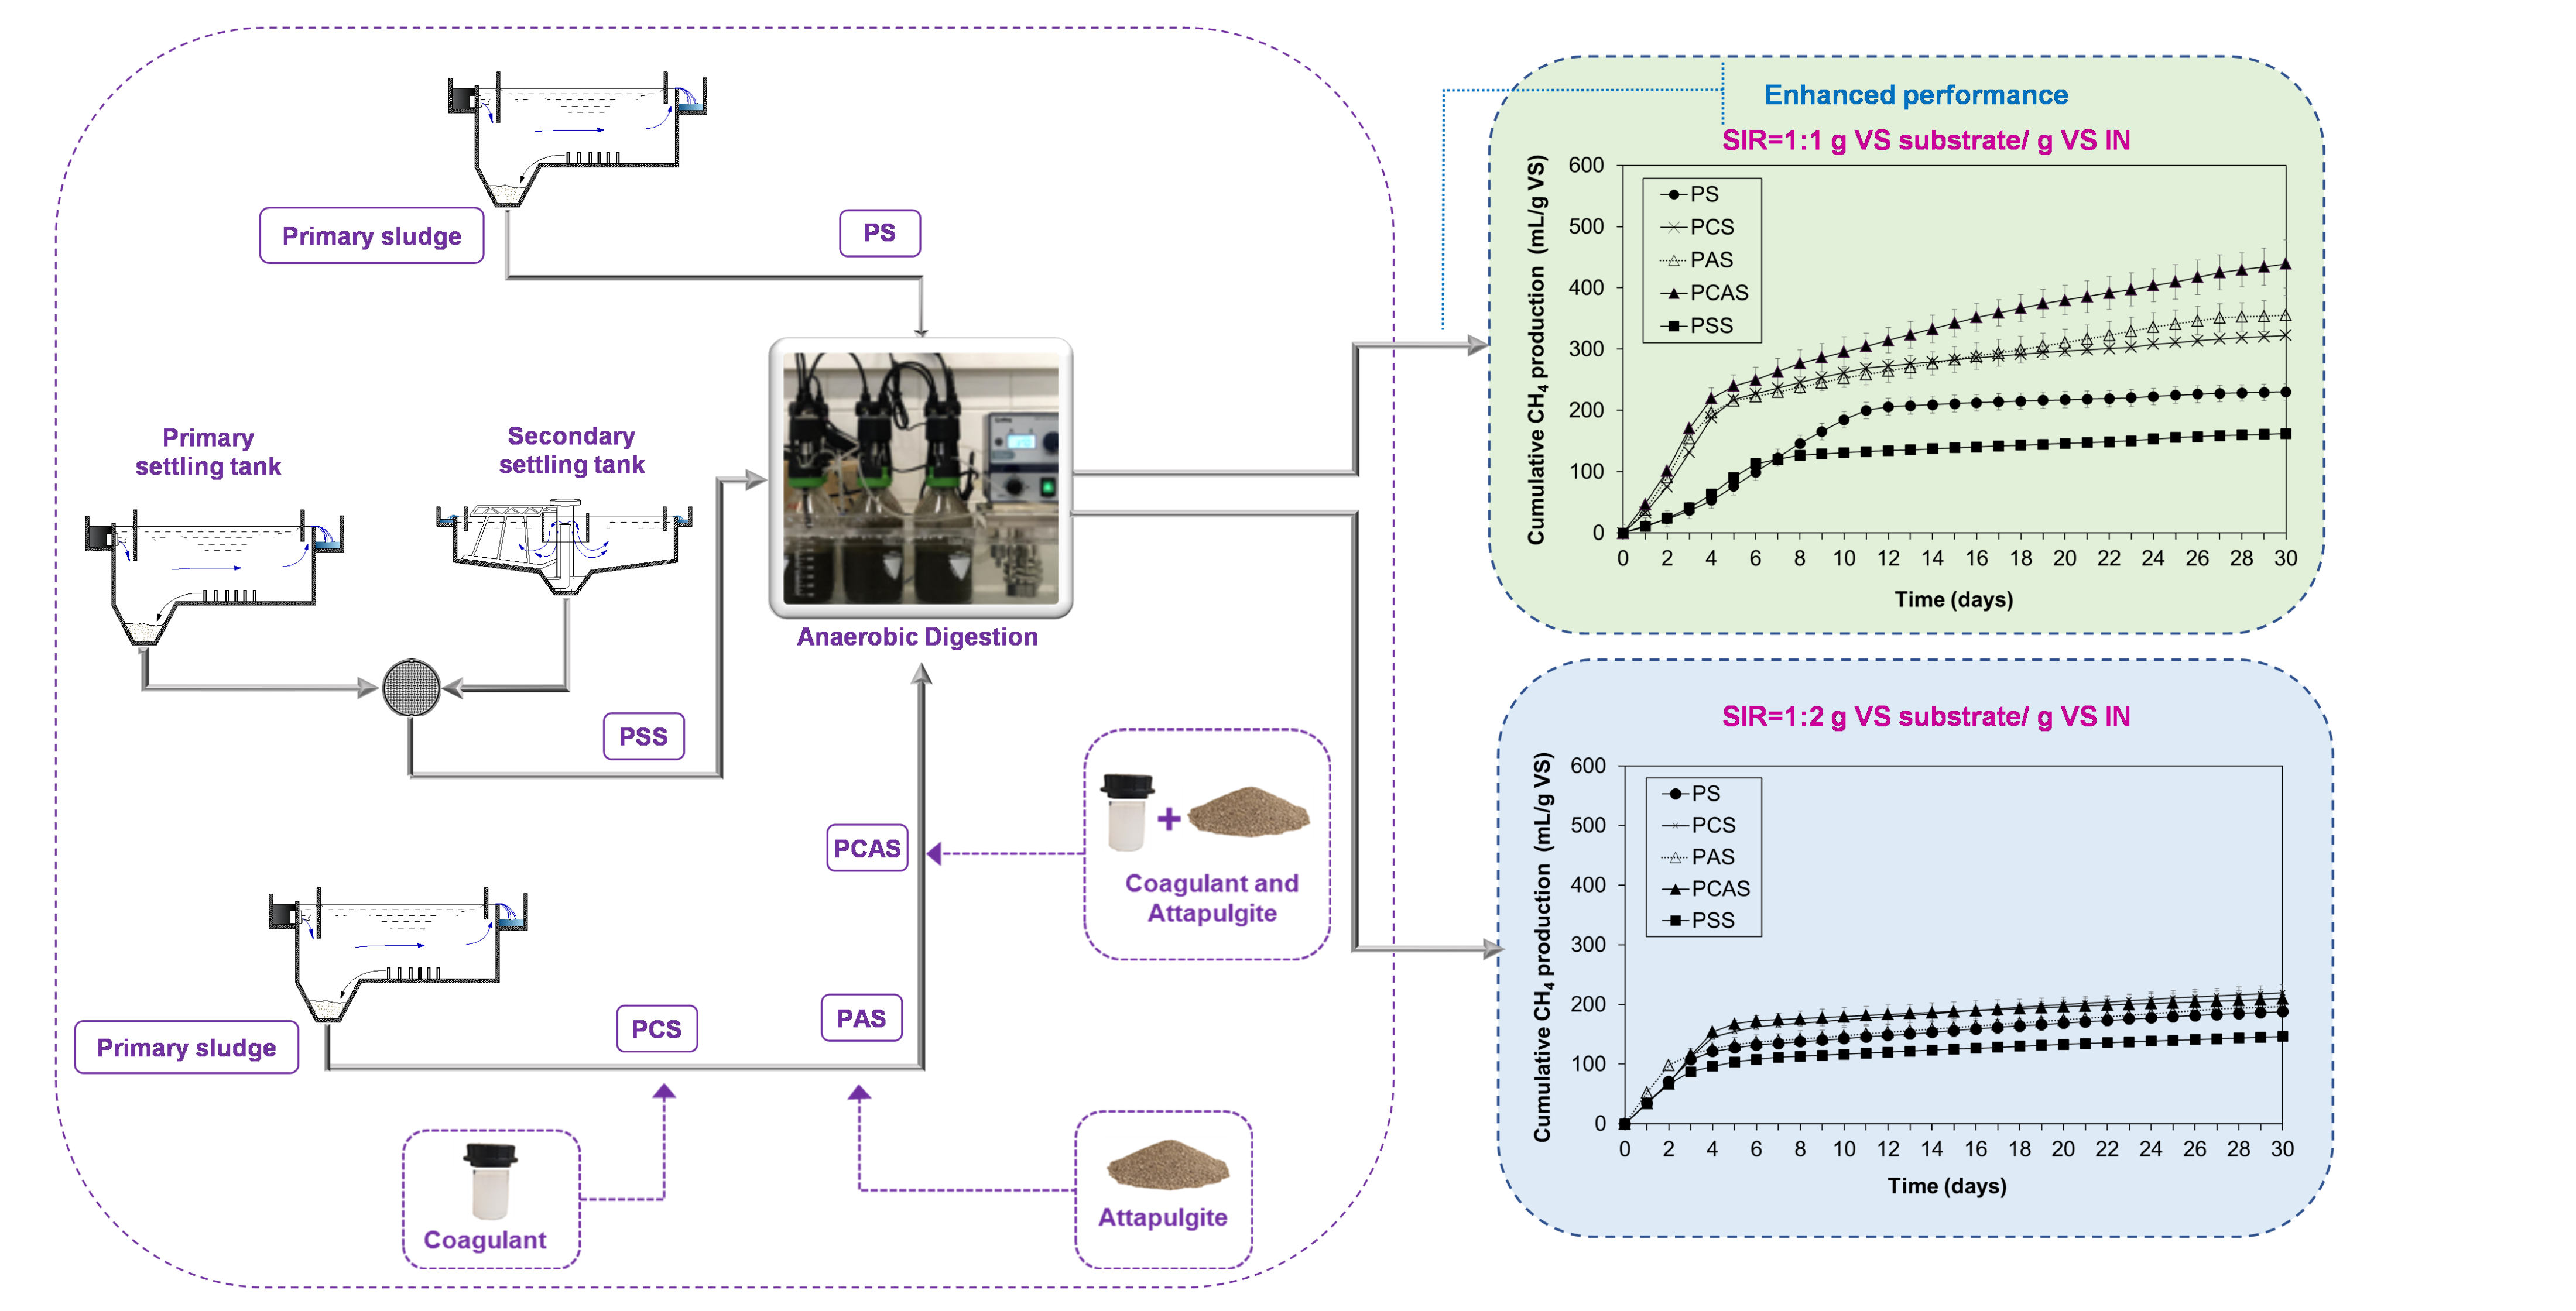
All samples were collected from Thessaloniki’s Municipal Wastewater Treatment Plant (MWWTP) that serves about 1,000,000 residents in Thessaloniki city, located in Northern Greece. The average inlet flowrate in the MWWTP is about 150,000 m3/day of municipal sewage, while the organic loading rate is about 60,000 kg BOD5/d and hydraulic retention time for sewage about 24 h. The flow diagram of the treatment plant and the corresponding sampling points are given in Figure 1. According to plant design, in the primary settling tanks about 1275 m3/d of sludge are totally produced, while in the secondary settling tanks about 2865 m3/d of secondary sludge are totally produced. As shown in Figure 1, the primary sludge is thickened to a final volume of approximately 360 m3/d, separately from the secondary sludge that is thickened after the addition of coagulant to a final volume of approximately 370 m3/d. Afterwards, the two sludge streams are mixed in a ratio of about 1:1 and introduced to three mesophilic anaerobic digesters of total volume of 23,100 m3. The hydraulic retention time of sludge in digesters is about 25 days. Operation of anaerobic digesters during the sampling campaigns was performed at SIR around 1:1. Three types of samples were collected including primary sludge, a mixture of primary and secondary sludge, and anaerobically digested sludge from the mesophilic digesters of Thessaloniki’s MWWTP, with that latter being used as inoculum (IN). The anaerobically digested sludge (IN) was collected from the combined effluent of the three digesters. All samples were collected in polypropylene (PP) bottles and immediately were transferred to the laboratory and further processed. In order to remove the methane and the residual biodegradable organic matter of inoculum, a preincubation step took place. During the preincubation step, inoculum was stored at a constant temperature of 37 °C ± 1 °C for 3 days. After that period, and in order, to evaluate its performance, three reactors were filled with IN and 1 g of glucose, while another set of three reactors served as blank reactors, e.g., without any addition of glucose. Methane production in the presence of glucose was 70% higher than in the blank after anaerobic digestion for 5 days (data not shown), indicating a good inoculation activity of the inoculum.
2.2. Attapulgite and Polyelectrolyte
Two additives were examined in this study to evaluate their performance as regards the upgrade of anaerobic digestion of primary sludge. Clay mineral attapulgite AGLEV SI 200 (Geohellas S.A., Athens, Greece) that was used as received (particle size range: 0.25–1.18 mm) and cationic polyelectrolyte, Flopam EM 640 HIB (Chemifloc, Shannon, Ireland) with high charge density, specific gravity 1.00–1.10, viscosity of polyelectrolyte solution 5 g/L equal to 1900 cPs, and average nonvolatile solids concentration around 49–56%. This type of coagulant is already used in Thessaloniki’s MWWTP for sludge thickening. The cationic polyelectrolyte was added to the digesters as a 0.5% aqueous polymer solution, which was prepared 1 h before every test.
2.3. Biochemical Methane Potential Assay
2.3.1. Experimental Setup
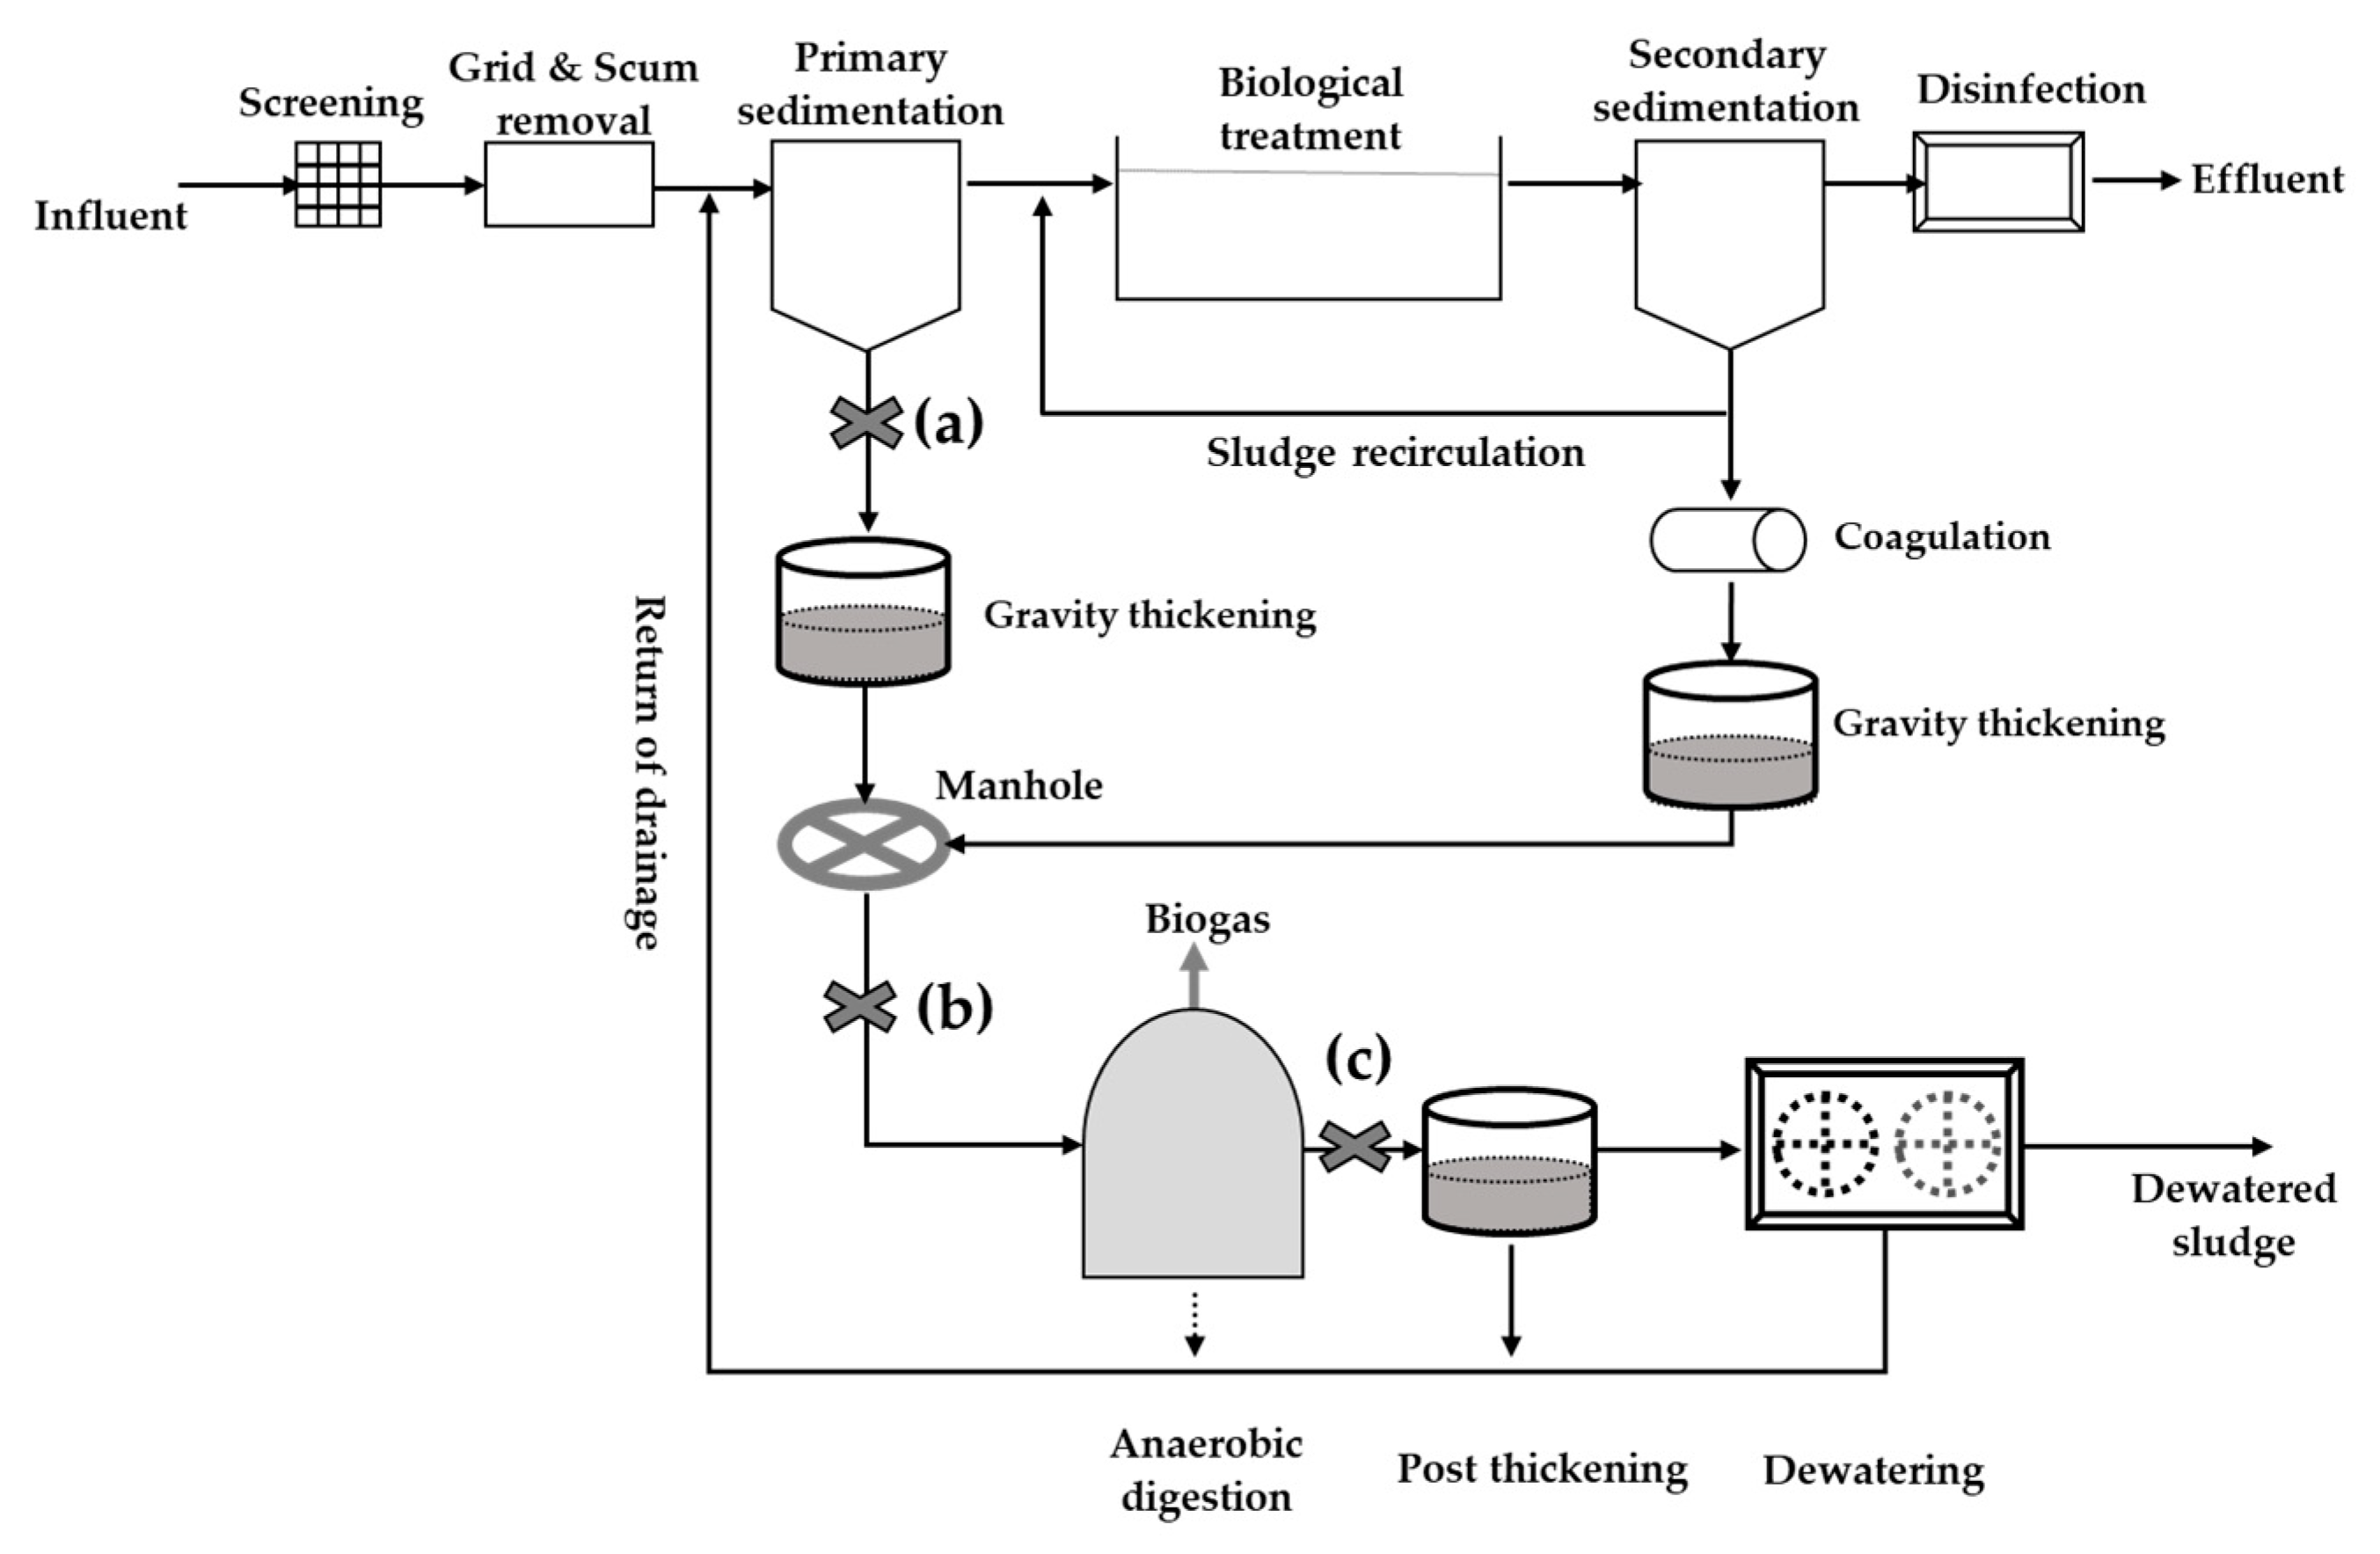
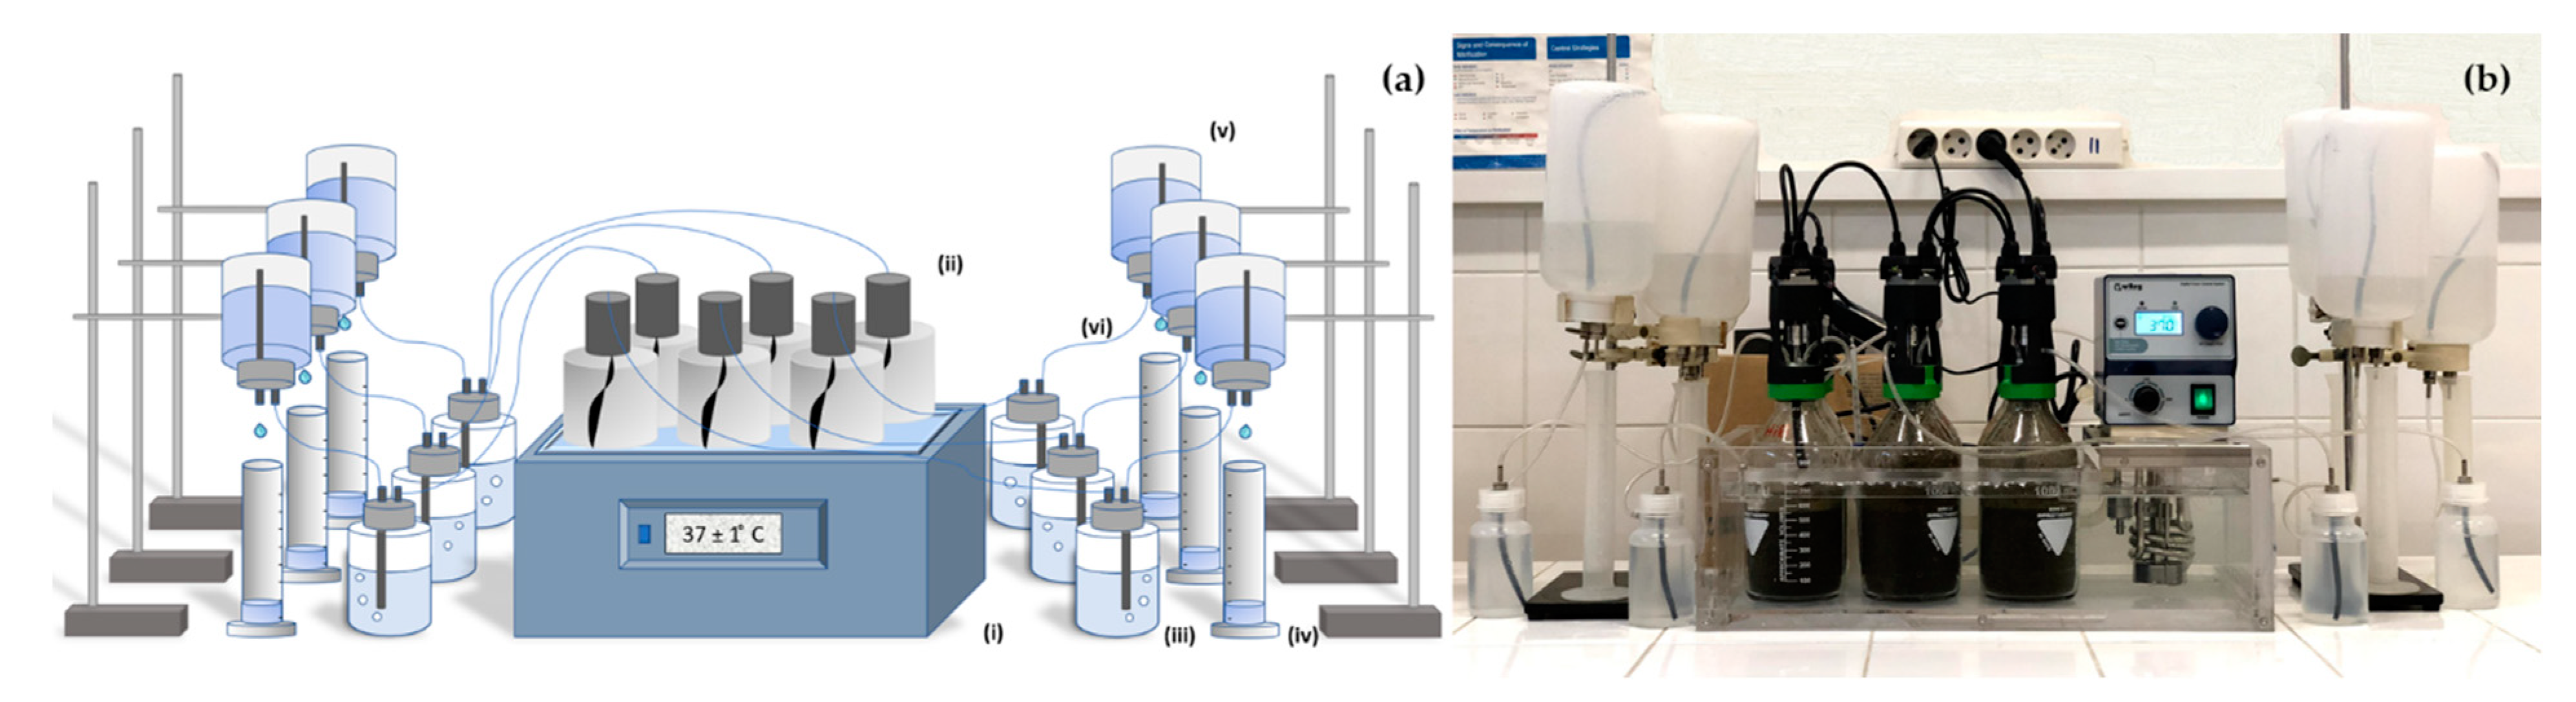
Glass reactors of total volume of 1000 mL (Figure 2a,b) were used for the evaluation of the biochemical methane potential (BMP). During BMP tests, the organic loading was 9.21 ± 0.02 g for SIR 1:2 tests and 10.66 ± 0.02 g for SIR 1:1, while the sludge retention time was equal to 30 d for all tests. The reactors were sealed with a mechanical agitation system of a poly-vinyl cap, GL 45 (BPC Instruments AB, Lund, Sweden) and the stirring speed was fixed at 20 rpm. Carbon dioxide was removed from the produced biogas by passing through polypropylene bottles of 250 mL volume filled with 3 M NaOH solution. Then the volume of the methane was monitored following Mariotte’s law (volume of dripping liquid = volume of gas produced), as shown in the experimental set up in Figure 2a,b. Biochemical methane potential assay (BMP) was conducted under mesophilic conditions at 37 °C ± 1 °C, and a temperature control was achieved using a wcb-11 water bath (Witeg Labortechnik GMBH, Wertheim, Germany).
2.3.2. Experimental Protocol
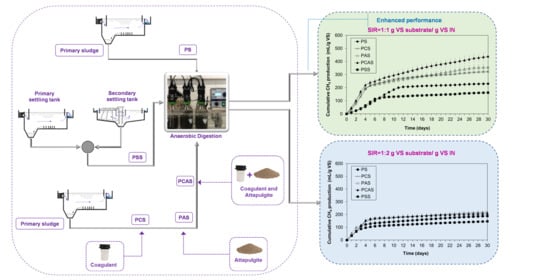
The optimum sludge to inoculum ratio (SIR) was assessed using two ratios of substrates primary sludge to inoculum equal to 1:1 and 1:2 g VS substrate/g VS IN. Primary sludge (PS) and a mixture of primary and secondary sludge (PSS) were used as substrates, while anaerobic digestion experiments were also conducted after treatment of the primary sludge with cationic polyelectrolyte and attapulgite. The treatment of the substrates tested for the anaerobic digestion process included 0.2 g polyelectrolyte/L PS (PCS), 15 g attapulgite/L PS (PAS), 0.2 g polyelectrolyte, and 15 g attapulgite/L PS (PCAS). Coagulation of PS was conducted by adding polyelectrolyte (0.2 g/L) to PS and mixing at 250 rpm for 60 s in a Jar test device. Afterwards, the speed of mechanical stirrers was reduced to 30 rpm for 20 min to promote flocs growth. Finally, the PS was allowed to settle for 30 min and coagulated PS was collected after the removal of the supernatant liquid.
All tests were conducted in triplicate, while another set of three reactors served as blank reactor, e.g., filled only with inoculum, in three identically developed experimental units (Figure 2). After adding sludge substrates and inoculum into the reactors, the mechanical agitation system was attached tightly, and the headspace of each reactor was flushed with nitrogen gas to displace air from the system and achieve anaerobic conditions. Each agitation unit was equipped with two sampling ports. One port served as gas inlet and was connected to a nitrogen gas cylinder, whereas the other served as the gas outlet. The headspace of each reactor was flushed with nitrogen gas at 5–10 psi for 5 min. Afterwards, one port was connected to a carbon dioxide trap, while the other one was sealed. All tests were executed under continuous stirring at 20 rpm. The volume of the produced methane was recorded daily, and the experiments terminated when the daily methane production rate was less than 1% of the cumulative methane production.
2.3.3. Analytical Methods
Chemical analysis of sludges before and after anaerobic digestion included total solids (TS), volatile solids (VS), pH, electrical conductivity, alkalinity, volatile fatty acids (VFA), nitrogen as ammonium ions (NH4+-N), total phosphorus, chemical oxygen demand (COD). Total coliforms, Escherichia coli (E. Coli), Enterococci, and total microbial count were also evaluated using membrane filtration techniques. To detect the bacterial counts, 10 mL of each substrate were diluted in 90 mL Ringer’s solution 1/4 (Oxoid Ltd., Basingstoke, UK), and then incubated at 37 °C ± 1 °C, under continuous stirring for 2 h [20]. After incubation, serial dilutions with Ringer’s solution were performed in order to proceed to the membrane filtration technique. Both chemical and microbiological analyses were conducted according to standard methods [21]. Organic matter and organic carbon were determined based on the Walkley Black method [22], while elemental carbon (C) and nitrogen (N) content were measured using an elemental analyzer Flash 2000 (Thermo Scientific™, Waltham, MA, USA). The dewatering capacity of the substrates and the residues of the digestion process was evaluated using a capillary suction time (CST) meter 304M CST (Triton Electronics Ltd., Dunmow, UK).
2.3.4. Kinetics Modeling of Biogas Production
Two kinetic models, the first order kinetic model, and the modified Gompertz model were used to fit the cumulative methane of each experiment. The first order kinetic model (Equation (1)), was based on the hypothesis that hydrolysis controls the entire process and the availability of the substrate as the limiting factor of anaerobic digestion [17], and was therefore chosen to deliver additional information about the hydrolysis rate constant.
where M is the cumulative methane production (mL/g VS substrate) and MO is the potential methane production. The estimated production of methane is equal to the interception obtained by plotting M against 1/t, k (d−1) is hydrolysis rate and t (d) is the digestion time [16].
The modified Gompertz model (Equation (2)) describes the cell density during microbial growth periods in terms of exponential growth rates and lag phase duration, hence it was selected to estimate both the lag phase and the methane production rate.
where M (mL/g VS substrate) is the cumulated methane production at time t, P (mL/g VS substrate) is the potential methane production, Rmax (mL/g VS substrate/d) is the maximum methane production rate, e is Euler’s number (e = 2.71828), λ (d) is the lag phase, and t (d) is time. P, Rmax, and λ were determined by a nonlinear least-square regression analysis using IBM SPSS Statistics 25 software (IBM Corp., Armonk, NY, USA).
2.3.5. Statistical Analysis of Results
Results regarding methane production were submitted to statistical analysis to compare mean values obtained from different substrates. Initially, data were submitted to Shapiro–Wilk test to check normality and then Levene’s test was applied to check the homogeneity of variances. Finally, one-way ANOVA (significance level of 0.05) was used to compare means and post-hoc analysis according to Tukey HSD test was applied to determine the significance of differences between various examined substrates with regards to cumulative methane production and maximum daily methane production rate, and CST values with respect to substrate type, as well. Comparisons between cumulative methane production of PS at different SIR, as well as comparisons between volatile solid removal rates of PS and PSS were conducted based on t-test. Calculations were performed using IBM SPSS Statistics 25 software (IBM Corp., Armonk, NY, USA).
3. Results
3.1. Characterization of Substrates
Table 1 provides the quality characteristics of the inoculum, the primary and secondary sludge of the MWWTP of the city of Thessaloniki. Noteworthy, primary sludge presents higher volatile solids’ content (2.95 ± 0.72%) compared to the mixture of primary and secondary sludge (1.87 ± 0.02%). In addition, primary sludge, as expected, contains higher concentration of total solids (3.96 ± 0.83%) compared to the combined fraction of primary and secondary sludges. On the other hand, the variability in solids’ concentration in primary sludge is significantly higher suggesting that this parameter may impact methane production rate and should be considered when designing such systems, especially in large scale. Analysis of primary sludge dry matter presented relatively high total carbon content of around 43.2 ± 3.0%, and relatively low nitrogen content about 3.2 ± 0.4%, while the corresponding values for the mix of two sludges fraction are 35.1 ± 3.4% and 3.8 ± 0.4%, respectively. Higher methane production potential is also indicated by the results of VFA analysis, expressed as mg/L of acetic acid, where primary sludge fraction demonstrates more than 1.5 times higher VFA concentration against PSS samples.
The values of pH and alkalinity show that anaerobic digestion is favored for both cases of two fractions of sludges. In addition, ammonium ion concentrations are low to cause toxicity, while carbon to nitrogen ratio is also rather low, i.e., 13.6 ± 0.9 for primary sludge and 9.2 ± 0.1 for the mix of primary and secondary sludges, compared to optimum conditions for anaerobic digestion of sewage sludge [23,24]. The measurement of capillary suction time (CST) was applied for the estimation of the evolution of dewaterability during anaerobic digestion. Digested sludge sample showed the lowest value compared to both sludge fractions, implying that AD may improve the dewaterability characteristics. On the other hand, primary sludge showed a significantly higher value (61.8 ± 13.44 s) compared to the mix fraction (35.4 ± 5.30 s).
3.2. Methane Production of Primary Sludge Using Different SIR
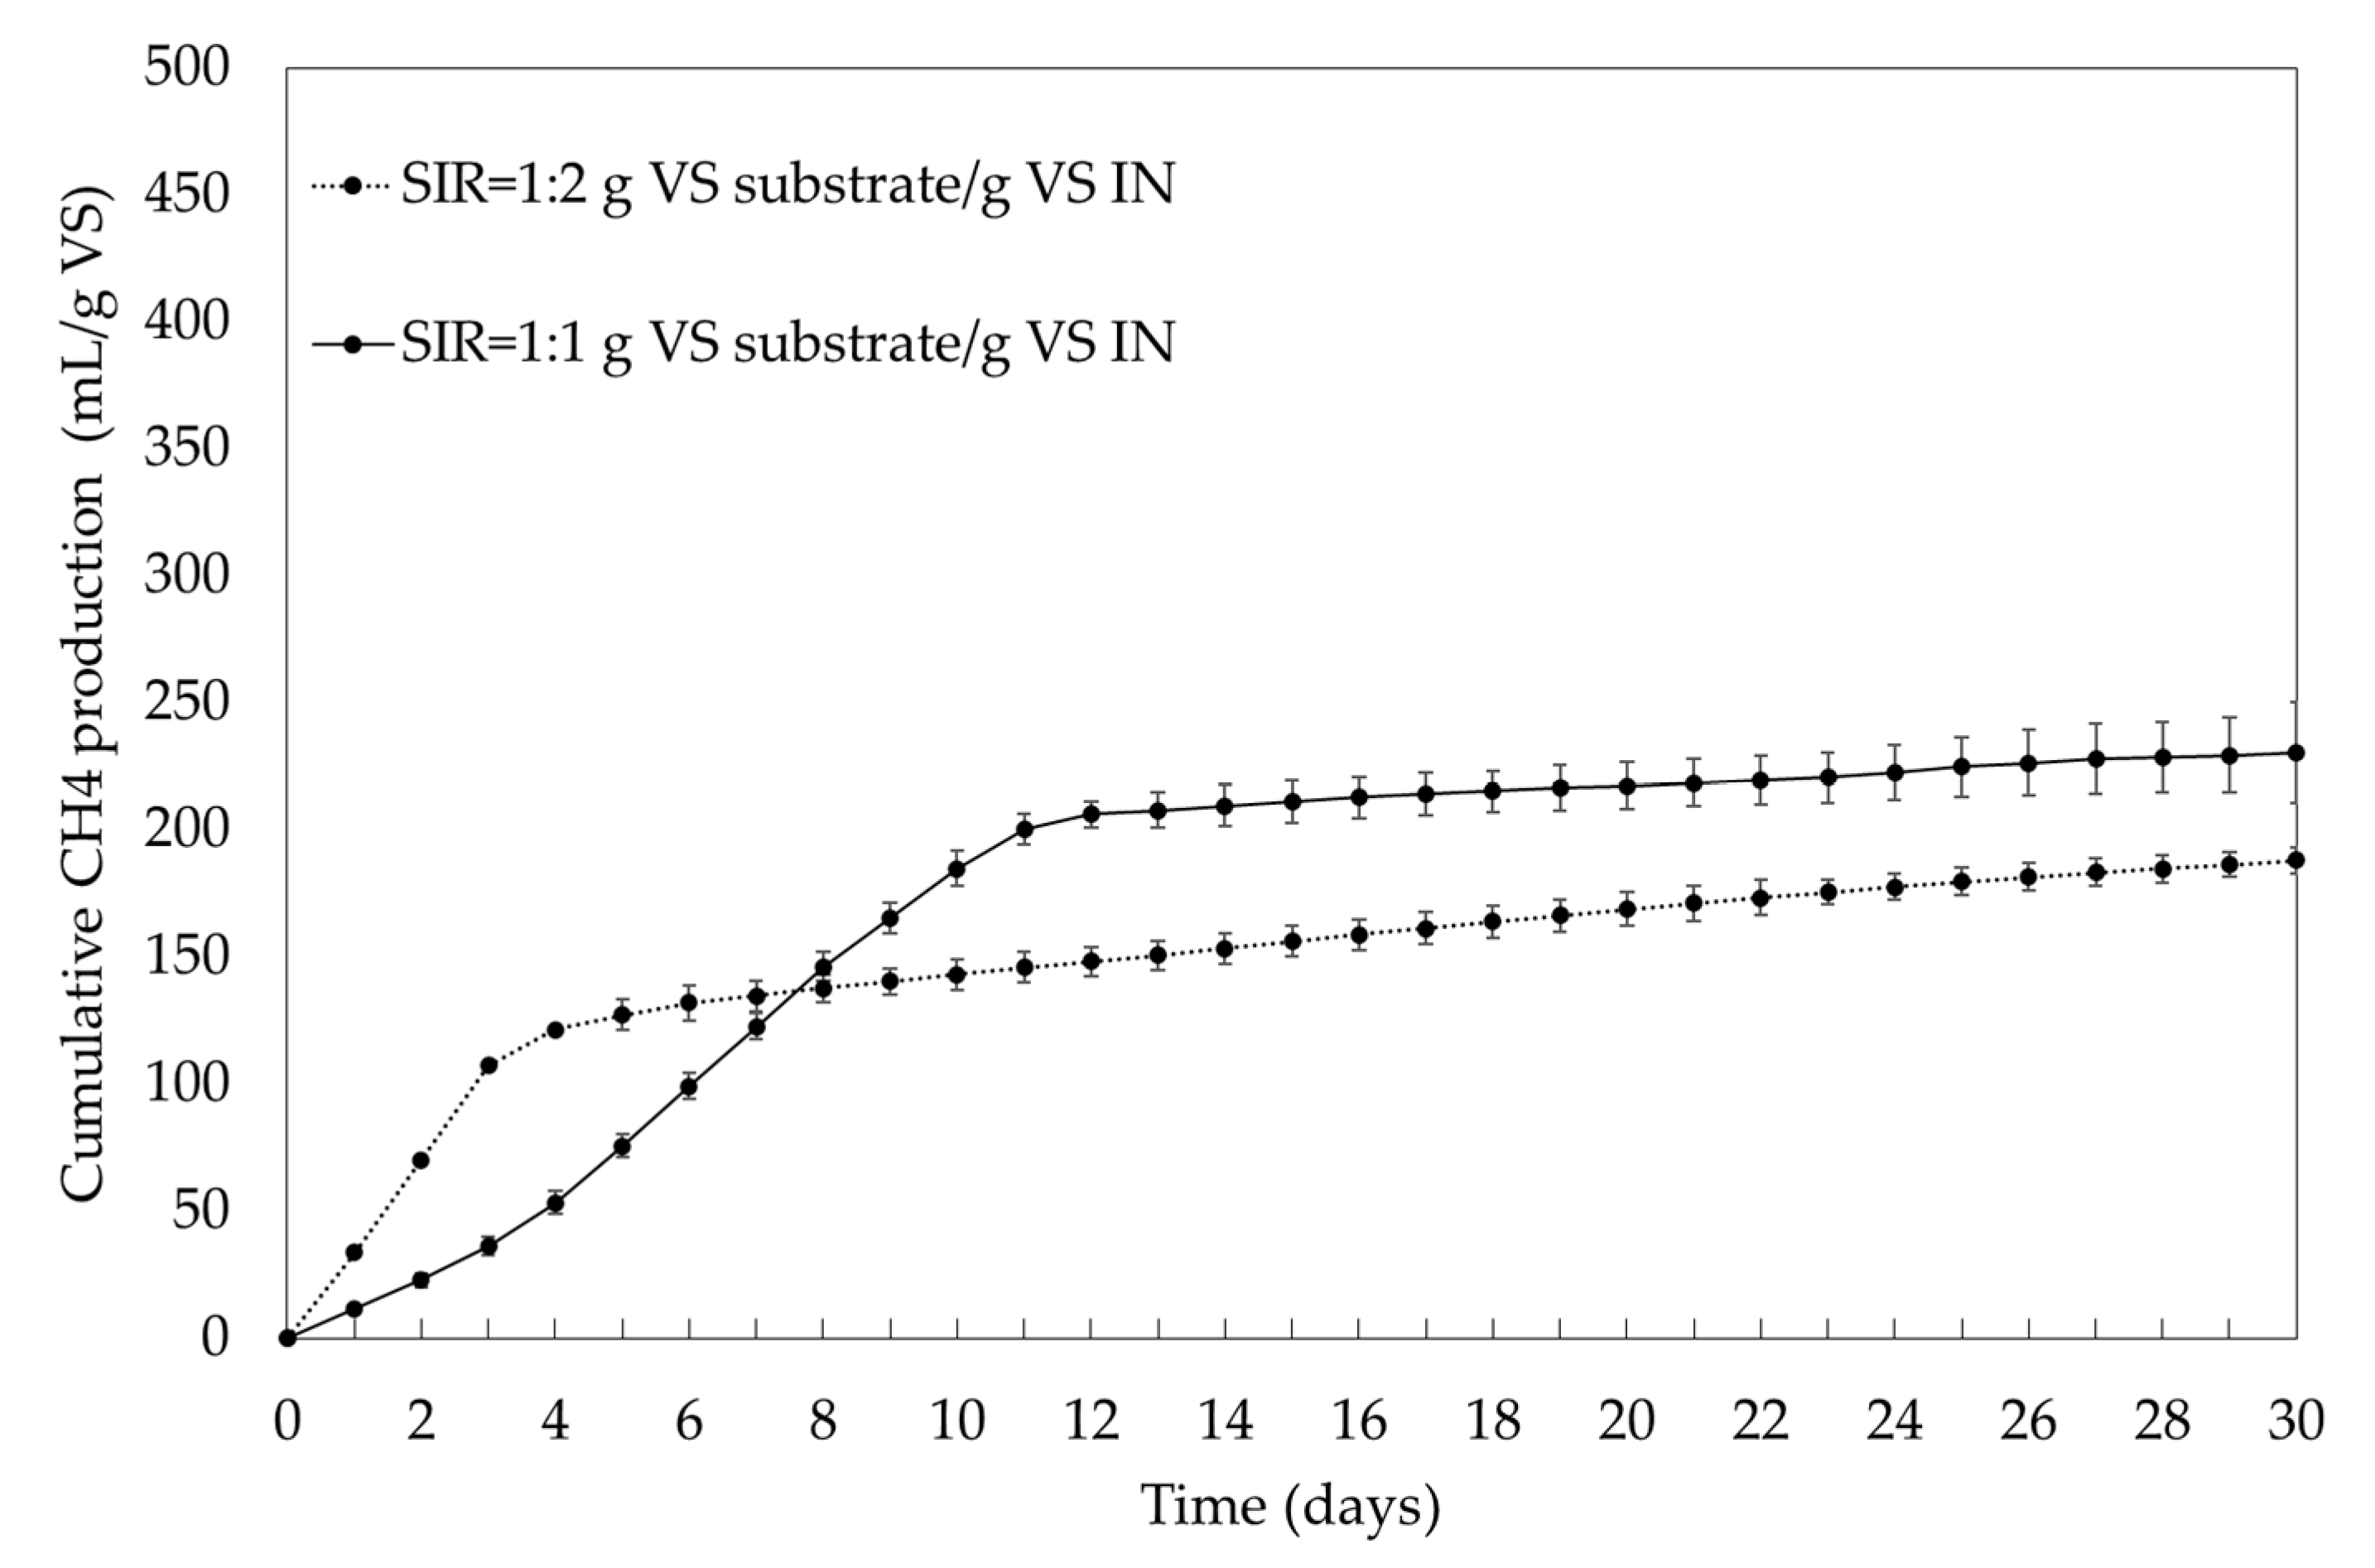
The employment of two different SIR equal to 1:2 and 1:1 g VS substrate/g VS IN was investigated in this study to estimate the potential of PS to produce methane. The obtained results corresponding to cumulative methane production are demonstrated in Figure 3. Initially, PS of SIR = 1:2 g VS substrate/g VS IN produced higher quantity of methane compared to that of SIR = 1:1 g VS substrate/g VS IN and this behavior was stable for the first 7 days of the process. However, the increased methane production rate lasted only 3 days, while after that period, methane production slowed down. On the other hand, the methane production rate was lower for SIR = 1:1 g VS substrate/g VS IN during the first days of the assay, whereas it lasted longer and only after the 12th day a significant decrease of BMP was observed. The maximum methane production rate for SIR equal to 1:2 g VS substrate/g VS IN occurred on the 3rd day (about 37.1 ± 0.46 mL/g VS substrate/day) and for SIR = 1:1 g VS substrate/g VS IN on the 6–8th day from the beginning of the BMP assay, where the methane production for all those 3 days was equal 23.5 ± 0.30 mL/g VS substrate/day.
The experiments were terminated on the 30th day of the digestion when the daily methane production rate for both assays was less than 1% of the cumulative methane production. At the end of the testing period, the cumulative methane production of primary sludge for SIR = 1:1 g VS substrate/g VS IN reached 230 ± 26.04 mL/g VS, while methane production of primary sludge for SIR = 1:2 g VS substrate/g VS IN reached almost 188 mL/g VS (t-test, p = 0.046, null hypothesis was rejected).
3.3. Effect of Additives in Methane Production of PS at Different SIR in Comparison to AD of PSS
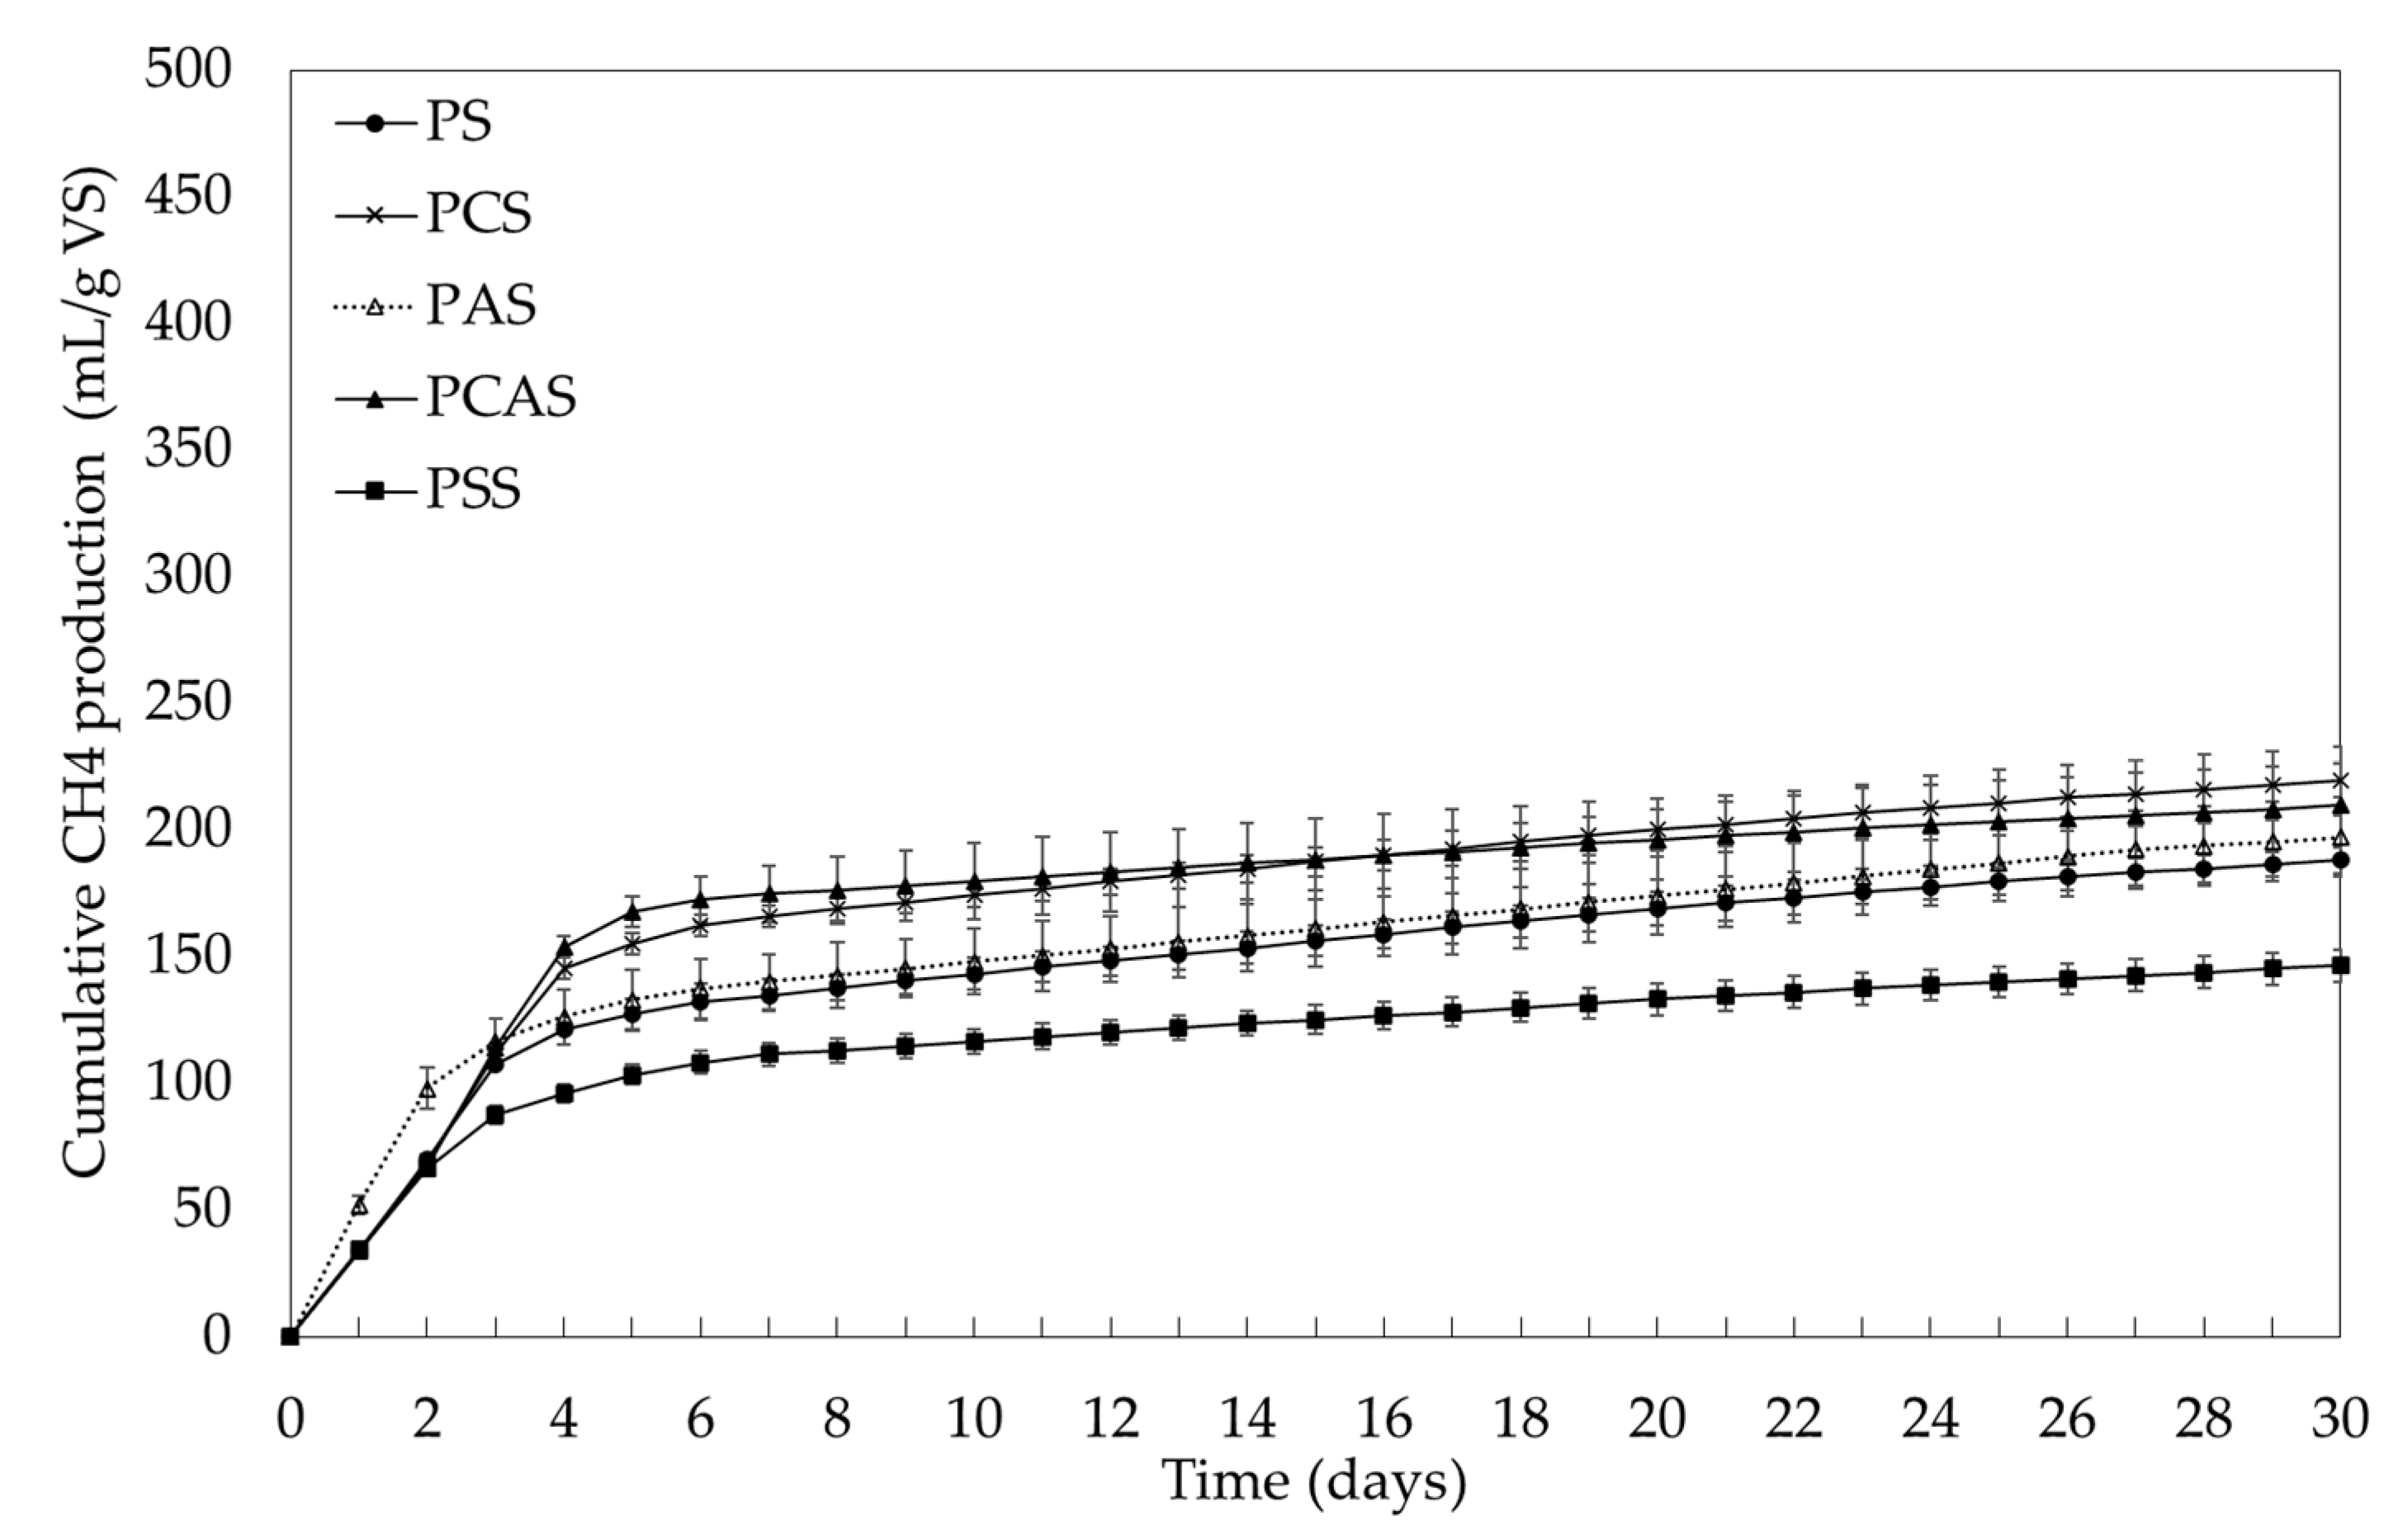
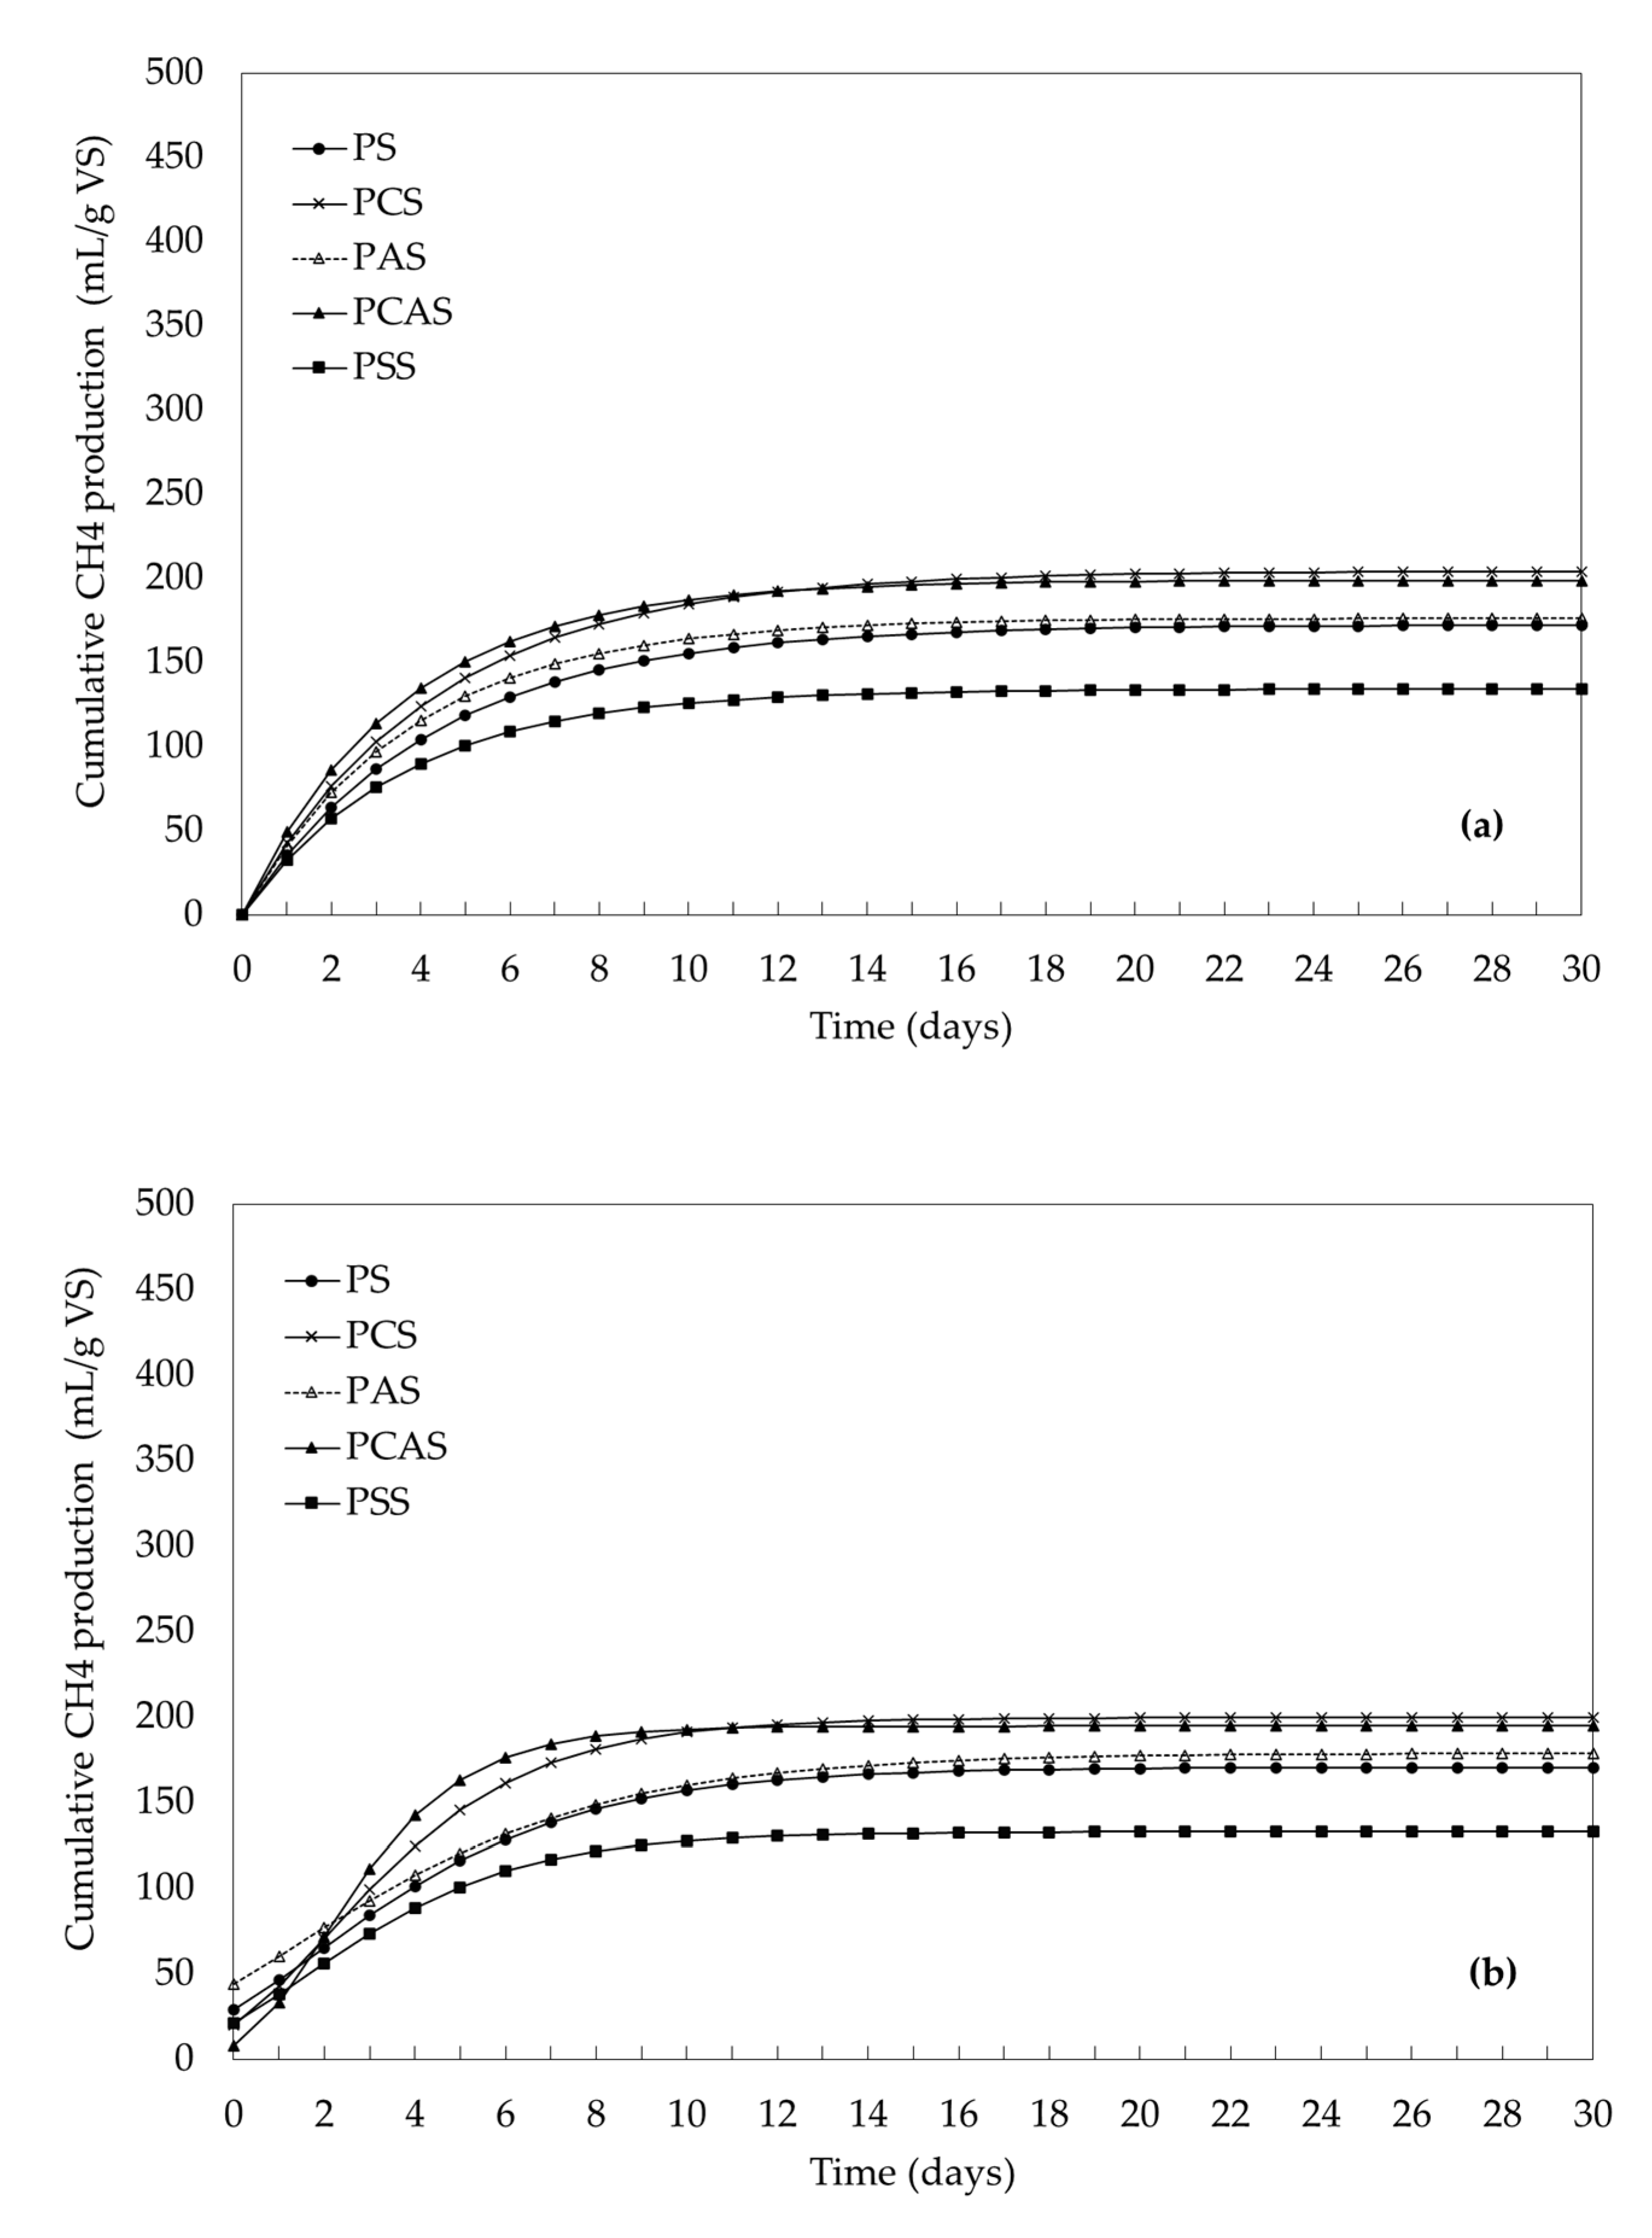
The addition of a cationic polyelectrolyte and attapulgite during the anaerobic digestion of PS was studied along with the AD of the combined primary and secondary sludge (PSS), that is the current practice of the majority of MWWTPs. Figure 4 presents the cumulative methane production curves for the tests, which were conducted under SIR = 1:2 g VS substrate/g VS IN, while Table 2 shows the maximum methane production rate of the substrates normalized per g VS, as calculated by the kinetic analysis. The normalized maximum methane production rate at SIR = 1:2 g VS substrate/g VS IN, was higher for the test where PAS was used as substrate (52.11 ± 3.65 mL CH4/g VS substrate/day). After 30 days of digestion, the cumulative methane production reached 187.9 ± 0.84, 219.1 ± 13.74, 196.9 ± 15.75, 209.7 ±16.58, 146.4 ± 6.30 mL CH4/g VS substrate for PS, PCS, PAS, PCAS, PSS substrates, respectively. Methane production for the PCS test was 16.6% higher than that observed during the solely digestion of primary sludge (PS). In tests PAS and PCAS the increase in methane yield corresponded to 4.8% and 11.6%; yet, these differences are comparable, since they confirm the null hypothesis (p = 0.761 and p = 0.082, respectively). On the other hand, the substrate of PSS clearly demonstrated the lowest BMP, about 22.1% less, compared to the AD of single PS fraction (p = 0.001). However, in this case the maximum daily methane production was almost the same (p = 0.535, null hypothesis was accepted).
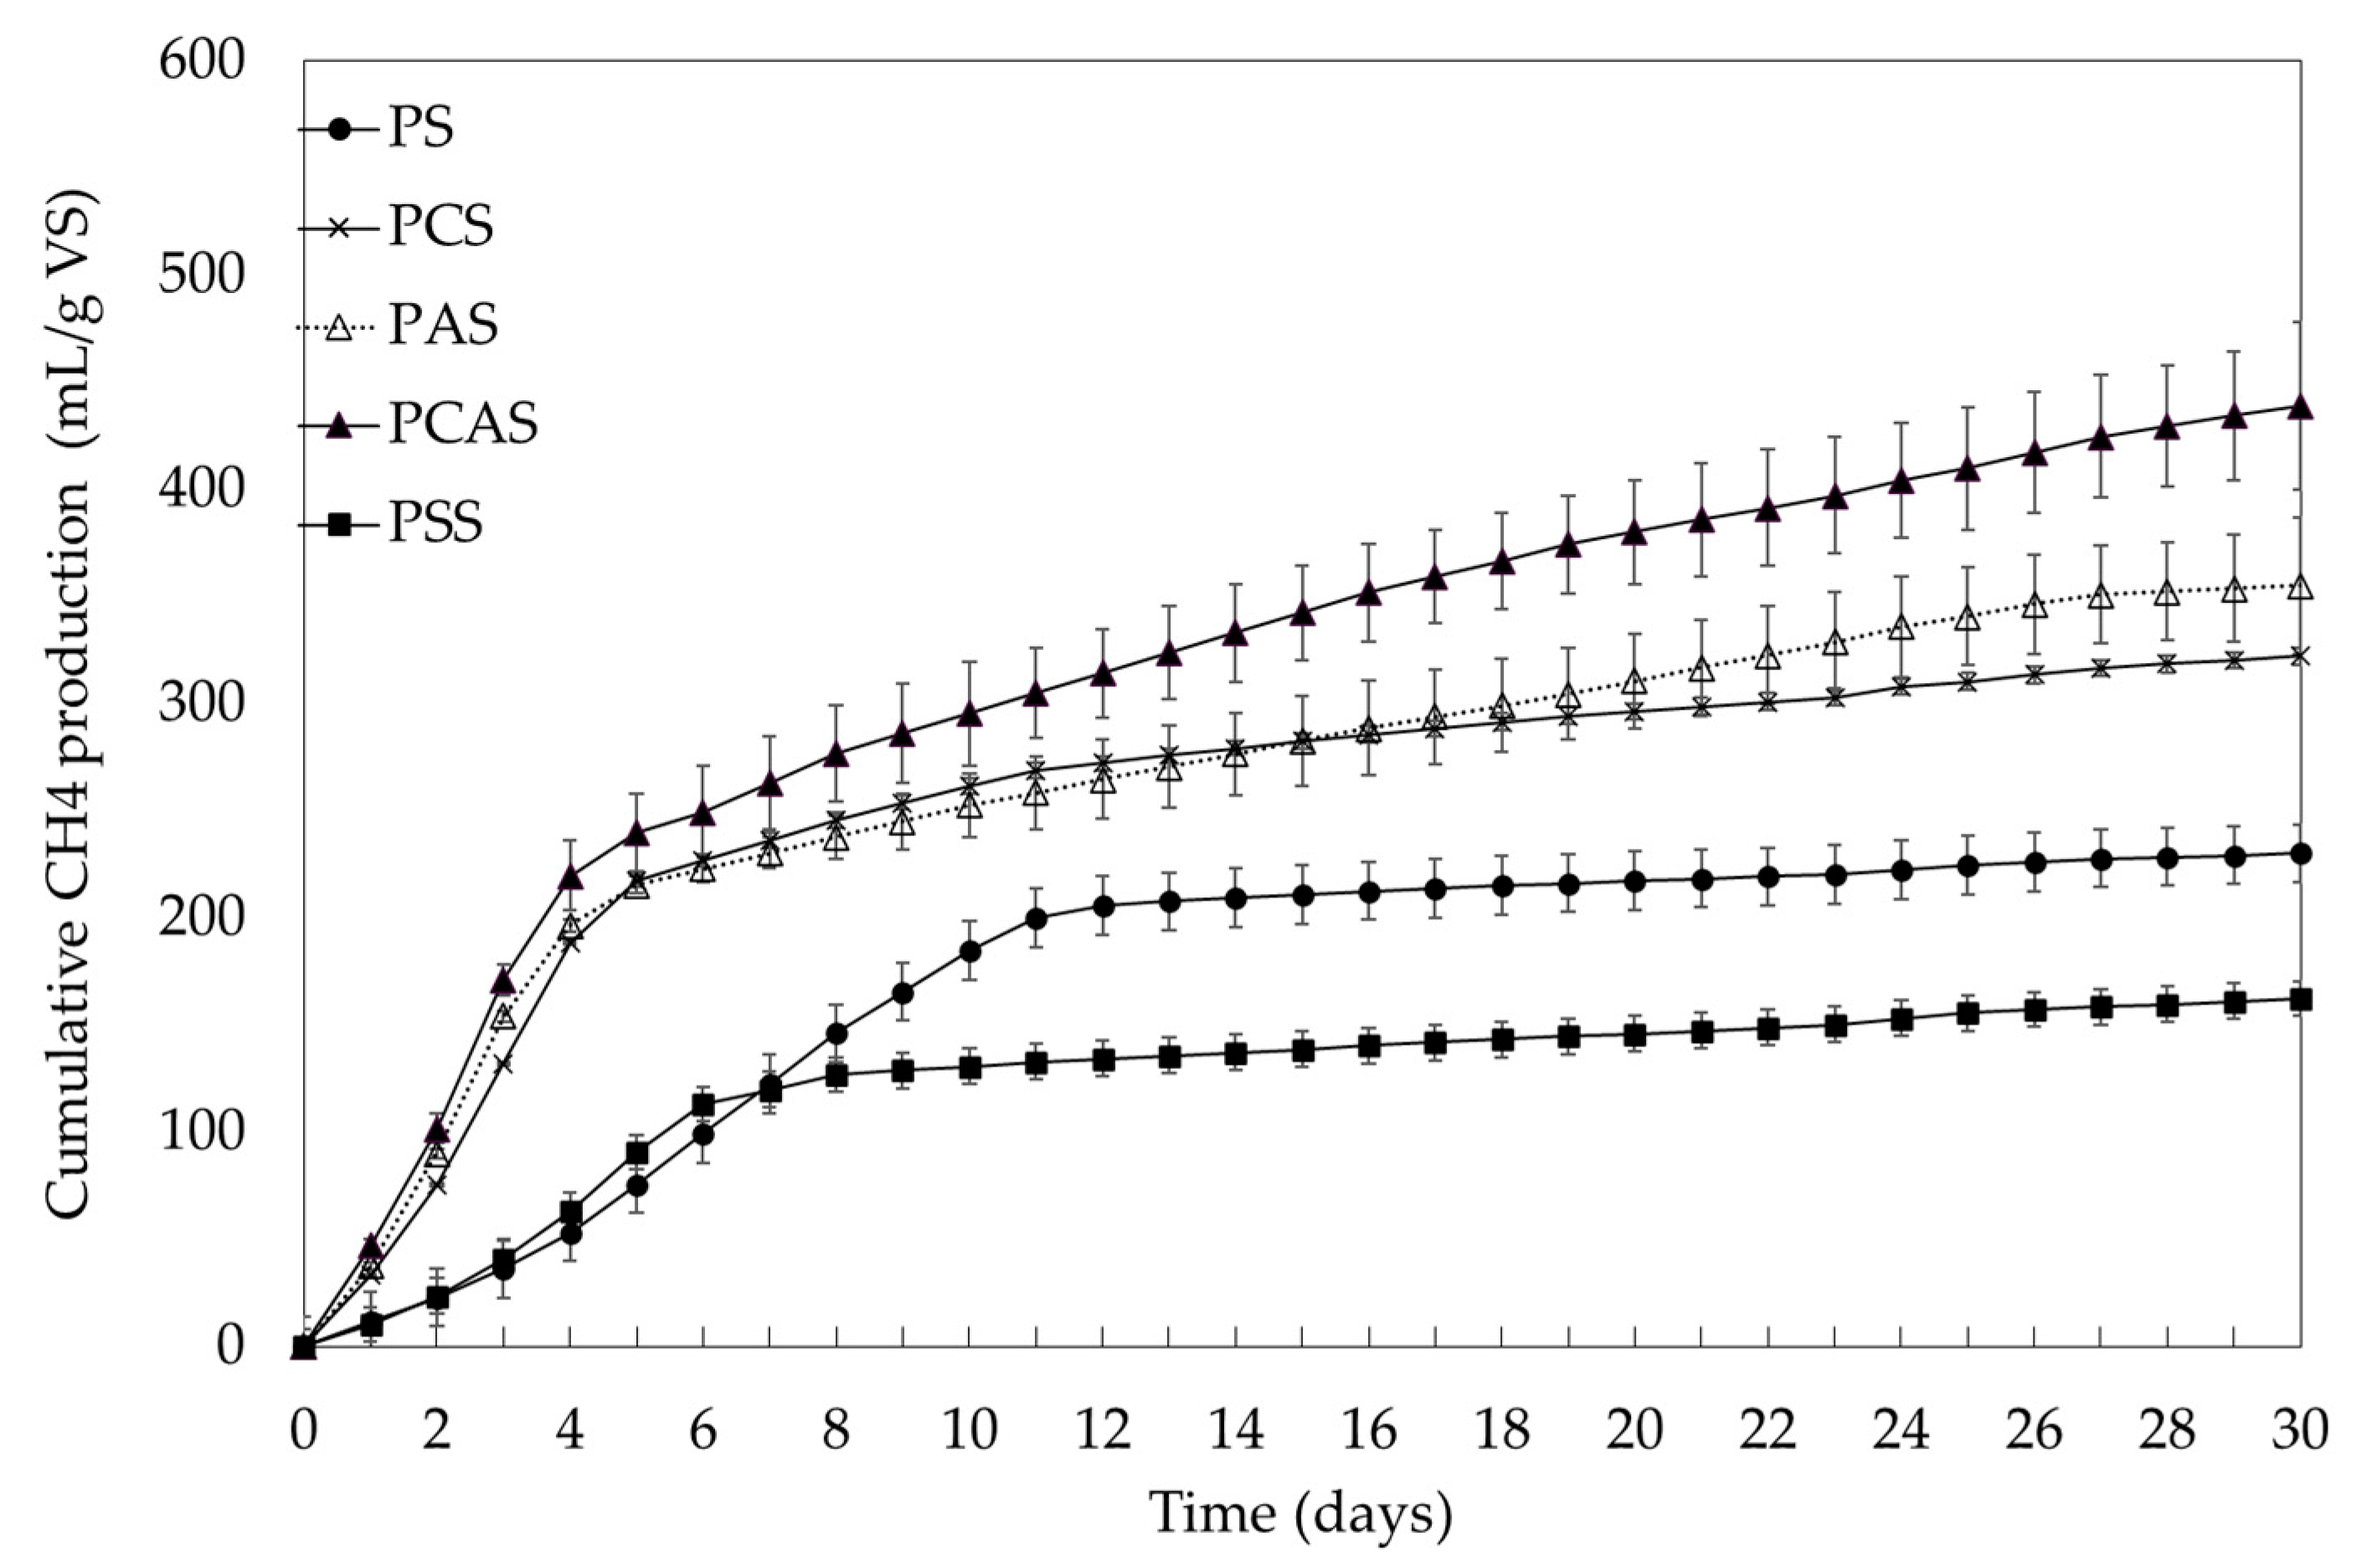
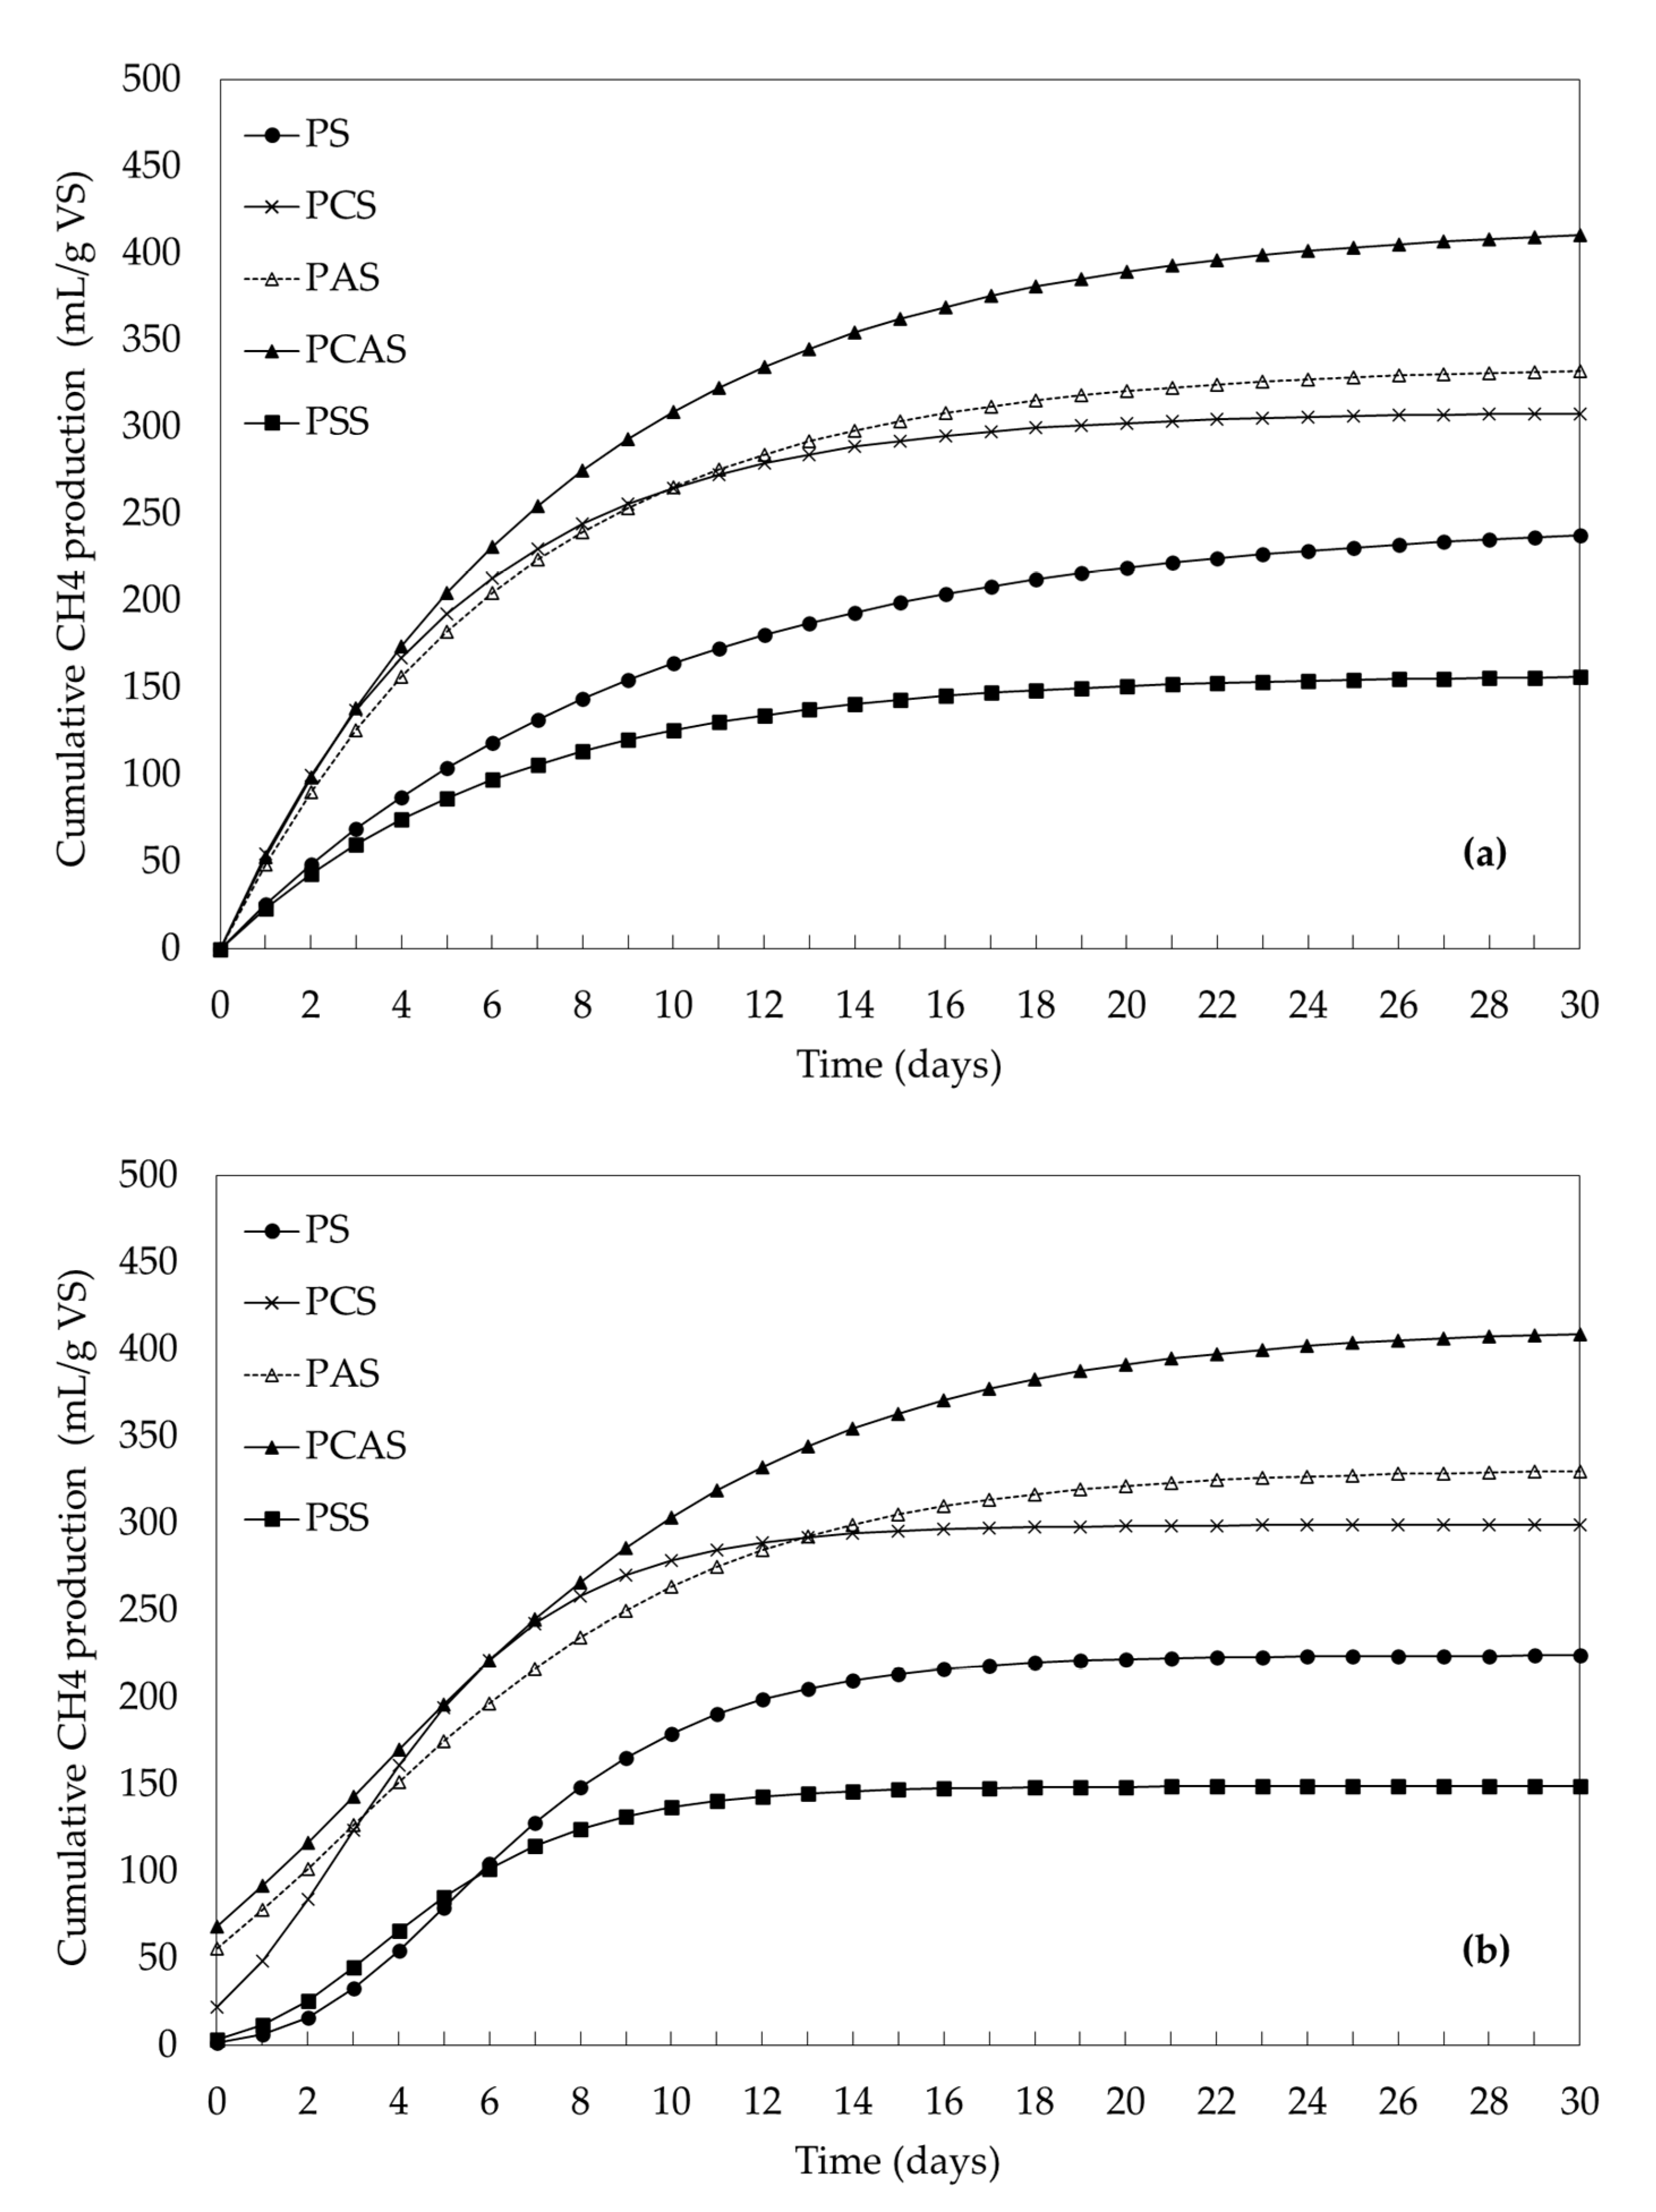
The cumulative methane production capacities for all tested substrates under SIR = 1:1 g VS substrate/g VS IN are presented in Figure 5. The cumulative methane production for the substrates PS, PCS, PAS, PCAS, and PSS was found to be equal to 230.2 ± 6.04, 322.2 ± 3.85, 355.3 ± 31.97, 439.1 ± 51.47, and 162.3 ± 9.22 mL CH4/g VS substrate, respectively, higher than those obtained for SIR = 1:2 g VS substrate/g VS IN (in all cases null hypothesis was rejected, p = 0.000). Apparently, the addition of either polyelectrolyte and/or attapulgite considerably enhanced the overall methane production, unlike in the case of SIR ratio equal to 1:2 g VS substrate/g VS IN. Noteworthy though, the cumulative methane production results, when PAS or PCS were used as substrates, do not reject the null hypothesis (p = 0.615). In addition, the cumulative methane production of the tests PAS and PCAS was higher by 54.4% and 90.8% (null hypothesis was rejected, as p = 0.000 for both tests) compared to cumulative methane production in test PS and even higher compared to that of PSS. More specifically, the production of methane from the anaerobic digestion of PSS was found to be lower by 29.5% than that of PS for the same SIR (the null hypothesis was rejected, as p = 0.020), in accordance to previous results for SIR equal to 1:2 g VS substrate/g VS IN. Interestingly, as presented in Table 2, maximum daily methane production was comparable between PS and PSS fractions, since the corresponding results satisfied the null hypothesis (p = 0.807).
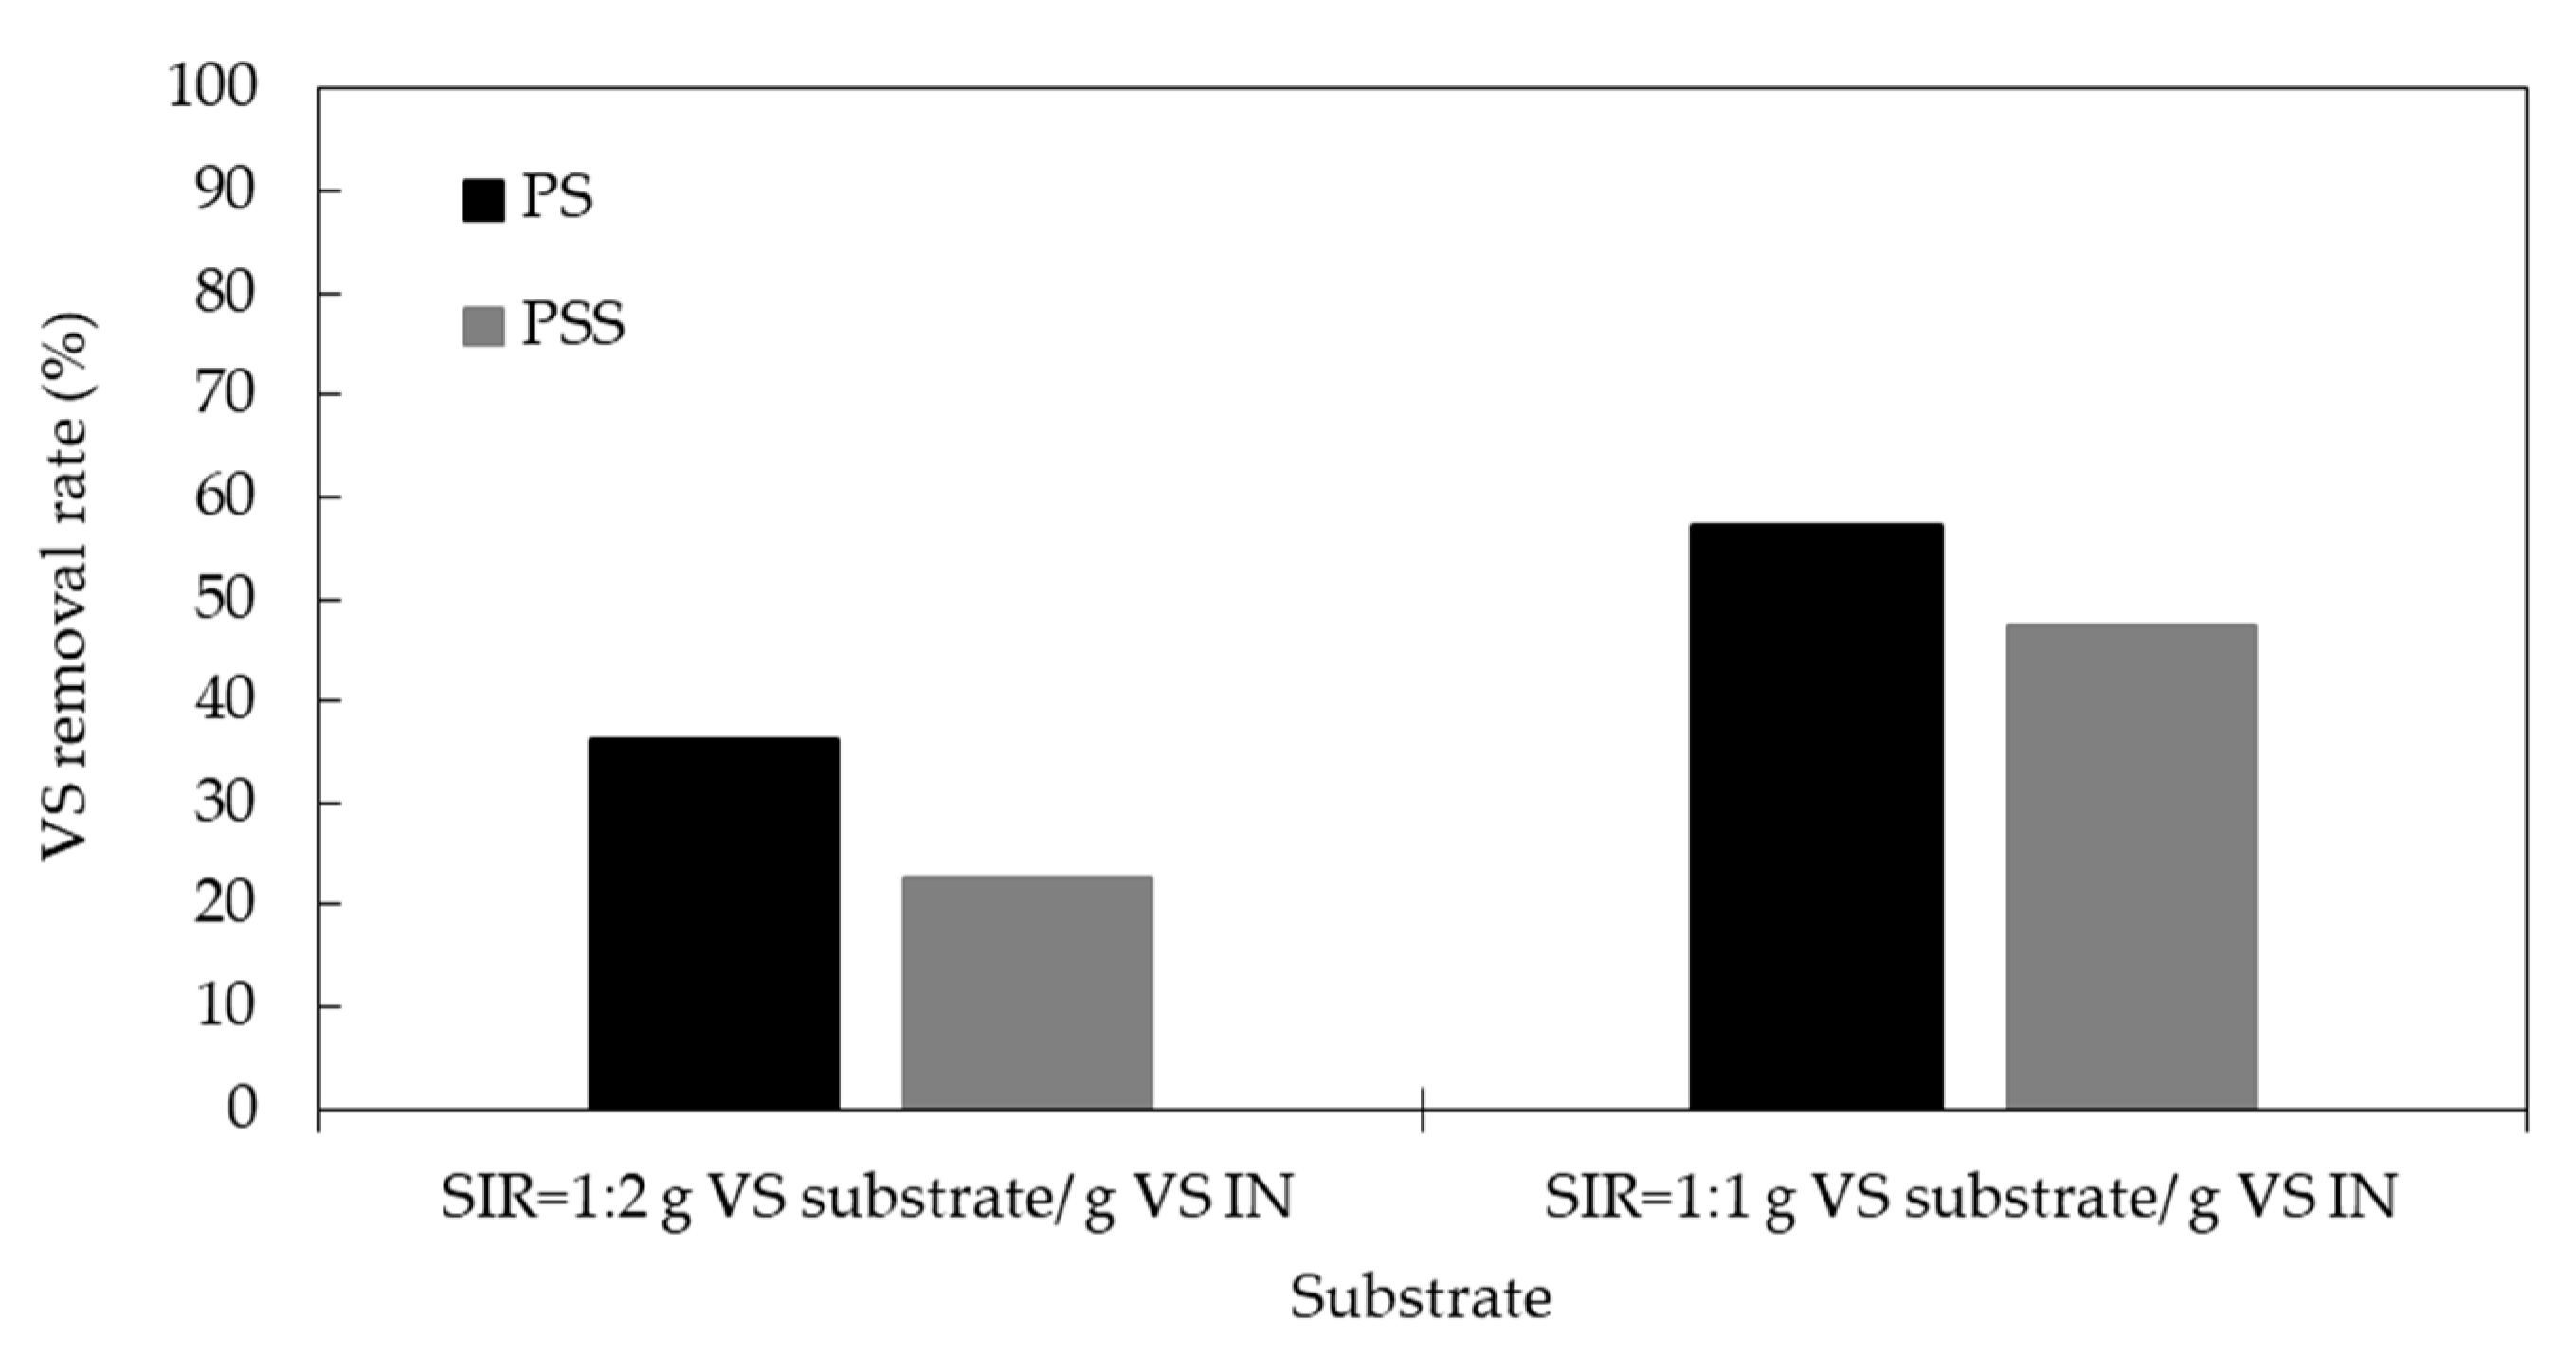
To better appraise the degradability of biosolids contained in the fractions of PS and PSS, the VS removal rate was calculated at the end of each assay, as shown in Figure 6. The highest biodegradability was obtained for the test PS (57.2%) at SIR = 1:1 g VS substrate/g VS IN and was higher than the corresponding one for SIR =1:2 g VS substrate/g VS IN (p = 0.004, so null hypothesis was rejected), confirming the biogas productivity results demonstrated in Figure 4 and Figure 5. Consequently, the corresponding VS removal rate for PS at SIR = 1:2 g VS substrate/g VS IN was less than 40%, indicating the weaker capacity in methane production in this case. Noteworthy, this value was even lower than that of VS removal during AD of PSS (above 45%) at SIR = 1:1 g VS substrate/g VS IN (p = 0.007, so null hypothesis was rejected). Still, the biosolids contain bioenergy that is not exploited during AD. These results are in line with the quality parameters presented in Supplementary Materials. Measurements of organic material concentration underline the presence of significant quantity of residual organics that are not decomposed during AD.
3.4. Kinetics Modeling of Biogas Production
Two theoretical models were used for the kinetic analysis of the obtained results, i.e., the first order kinetic model (Equation (1)) and the modified Gompertz model (Equation (2)). The estimated parameters such as the hydrolysis rate constant (k (d−1)), the lag phase (λ (d)), maximum methane production rate (Rmax (mL/g VS substrate/d)), and the potential methane production (P (mL/g VS substrate)) are presented in Table 2. Moreover, Table 2 shows that for some substrates the parameters result in negative lag phase (λ) values. For all cases the lag phase value was calculated by nonlinear fitting, following the Gompertz model (Equation (2)). Negative values for lag phase were due to fitting equation and are commonly observed in many studies [25,26]. Those negative values have no physical meaning, and occur when the bioproducts are generated almost immediately without a lag period [25], which implies that the microorganisms were active and the substrates were easily biodegradable and that the lag phase of methanogens growth occurred faster than predicted by Gompertz model [25,26]. The fact that the microorganisms started to function fully in short time, is most probably due to the fact that the inoculum in this study was obtained from the mesophilic digesters of Thessaloniki’s MWWTP.
The potential methane production was assessed by fitting the experimental results based on cumulative methane production and the kinetic parameters of the models. Figure 7a,b shows the kinetic modeling results for the first order and the modified Gompertz model, respectively; for SIR = 1:2 g VS substrate/g VS IN. The hydrolysis rate (k) for the test PS, PCS, PAS, PCAS, and PSS ranged within 0.232 ± 0.02–0.284 ± 0.02 (d−1). At SIR = 1:2 g VS substrate/g VS IN the substrate PCAS had the highest k value (0.284 ± 0.02 d−1) among all tests, but the difference was not significant. The potential methane production (P, mL/g VS substrate) for the tests PAS and PCAS were higher than that for the rest of the tests while the PSS demonstrated the lowest methane production capacity. The maximum methane production rate, 41.4 ± 3.79 mL/g VS substrate/d was observed for the substrate PCAS. The lag phase (λ) values in this ratio were relatively low, from −2.63 ± 0.93 to 0.27 ± 0.23 (d), practically close to zero.
The predicted values for SIR = 1:1 g VS substrate/g VS IN are presented in Figure 8a,b, while the estimated parameters are presented in Table 2. The hydrolysis rate (k) for the tests at SIR = 1:1 g VS substrate/g VS IN ranged within 0.109 ± 0.01 and 0.196 ± 0.01 (d−1). The comparison of the hydrolysis rate between the two SIR indicates that the k value decreased as the SIR increased, which agrees with the results reported by Filer et al. [1]. Moreover, it is observed that the addition of attapulgite increased the potential methane production. The potential methane production increased by 47.6% (PAS) and 83.9% (PCAS) compared with the PS test. Likewise, Liang et al. [16] reported that an appropriate dose of 10 g/L attapulgite can enhance P and Rmax of anaerobic digestion of pig slurry. The lag values for the ratio of 1:1 ranged within −2.36 ± 0.77 and 1.84 ±0.16± (d), where the negative values for the test PCS, PAS, PCAS indicate that the lag phase occurred faster than the predicted, suggesting that these tests were conducted using the most beneficial substrates, which accelerated the anaerobic microbial growth in the initial anaerobic process and reduced the time to reach exponential phase considerably.
3.5. Microbiological Parameters
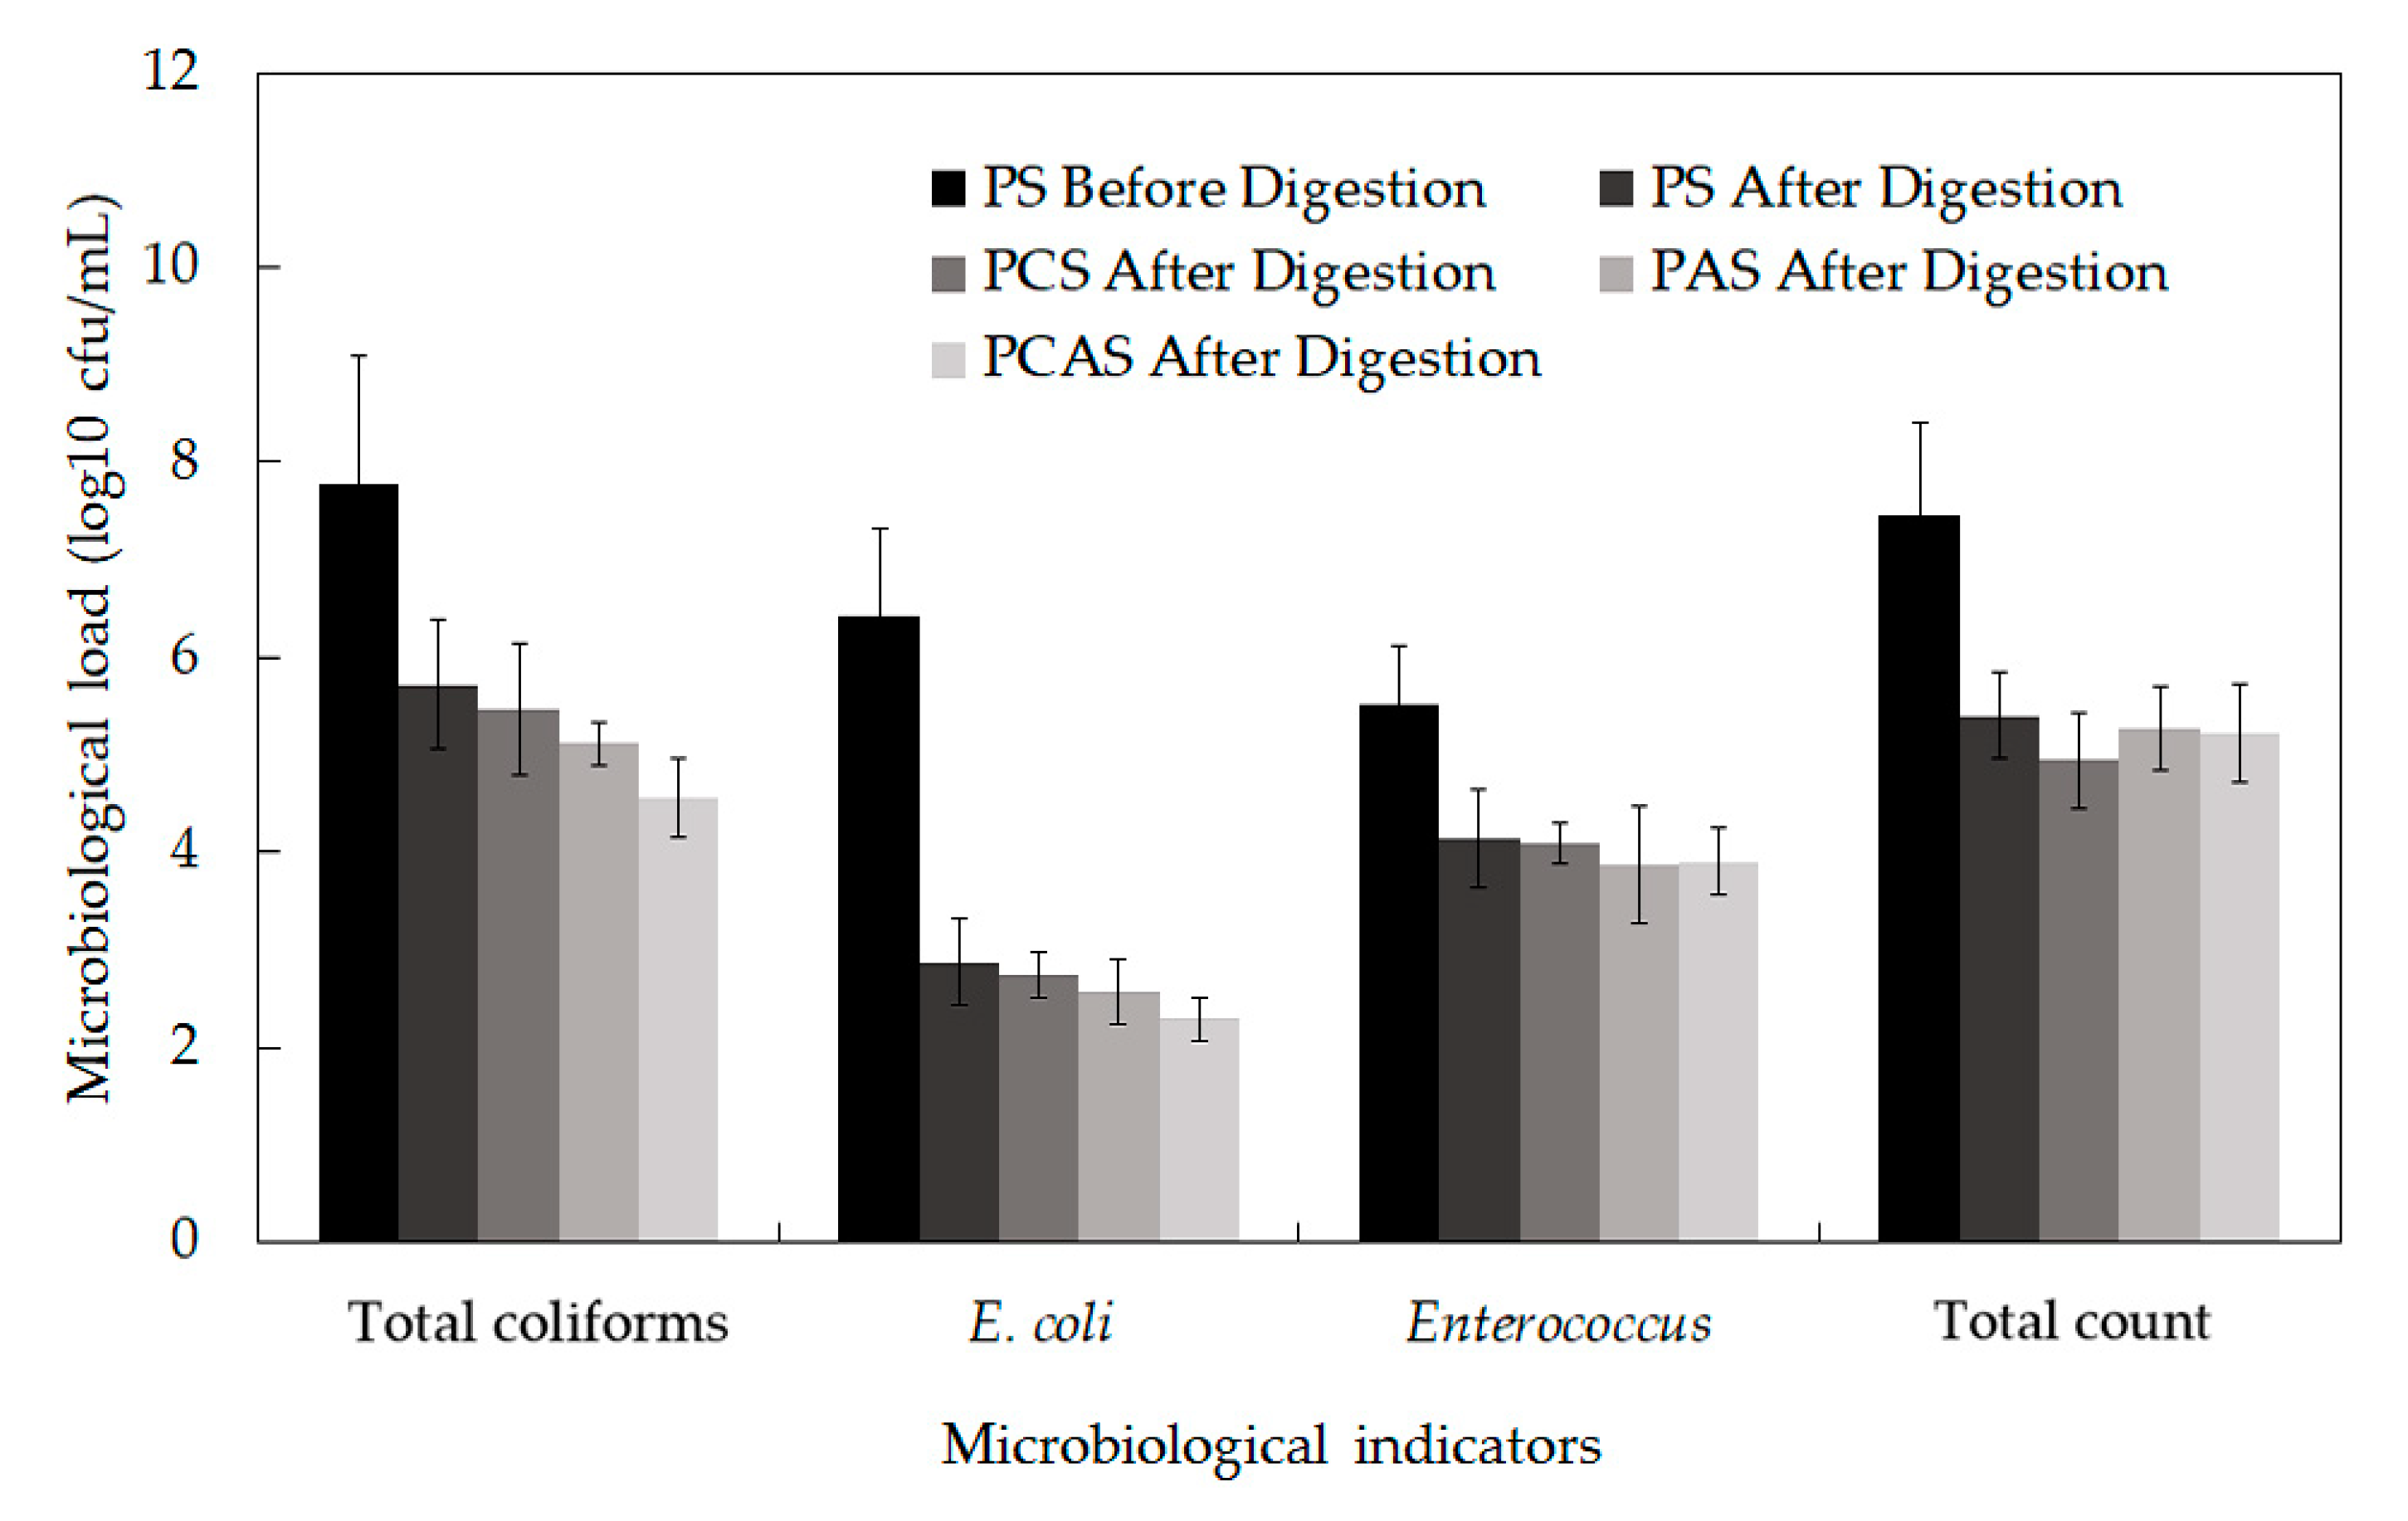
The microbial load of primary sludge and the mix of primary and secondary sludges, as well as the microbial load of the corresponding digestates are shown in Figure 9. The colony forming units (cfu) per 1 g of PS was 7.78 ± 1.3 log10 for total coliforms, 6.42 ± 0.9 log10 for E. coli, 5.51 ± 0.6 log10 for Enterococcus, and 7.45 ± 0.95 log10 for total microbiological count, while the corresponding values for the raw PSS were 7.27, 6.29, 4.89, 7.29 log10 (Figure S1). After the anaerobic digestion of PS (Figure 9) and PSS (Figure S1), a significant reduction of the microbiological load was recorded. The reduction of total coliforms load was 2.06 and 2.39 log10 for PS and PSS, respectively, while the highest reduction, up to 4.12 log10, was observed for E. coli, after the anaerobic digestion of primary sludge with the addition of both cationic polyelectrolyte and attapulgite (PCAS). On the other hand, the rest of the microbiological indicators did not show any particular behavior compared to the remaining substrates. In all cases, E. coli colonies were found to be less than 3 log10 per gram of biosolids, meeting the requirement of the US EPA “Class A” regulations for unrestricted use of biosolids in agriculture, where the number of E. coli should not exceed 3 log10 per gram of dry solids (USA EPA, 2003) [27]. Similar microbiological loads, as well as removal performances are also reported in the literature.
Lopez et al. [28] demonstrated approximately 3 log10 reduction of total coliforms, Escherichia coli and Enterococcus in mesophilic anaerobic digestion of sewage sludge, while in thermophilic (55–57 °C) conditions, the reduction reached up to 5 log10 units, which is similar to what was observed in this study. Carroll and Long [29] also reported approximately 3 log10 reduction of E. coli and Enterococcus in mesophilic anaerobic digestion, while the inactivation was up to 1–2 log10 higher in thermophilic anaerobic digestion. Notably, in this study it is shown that stabilization taking place in anaerobic digestors is not hampered by the increased microbial load of primary sludge. In fact, sufficient stabilization can be achieved, even under less favorable conditions, such as mesophilic ones. There are strong indications that the addition of attapulgite in sewage sludge prior to its use in agriculture, promotes further the destruction of pathogens [30]. Such a behavior could also be significantly enhanced by the supplementary addition of small quantities of attapulgite to the digestate stream prior to final disposal or use.
3.6. Effect of Anaerobic Digestion on the Dewaterability of the Sludge
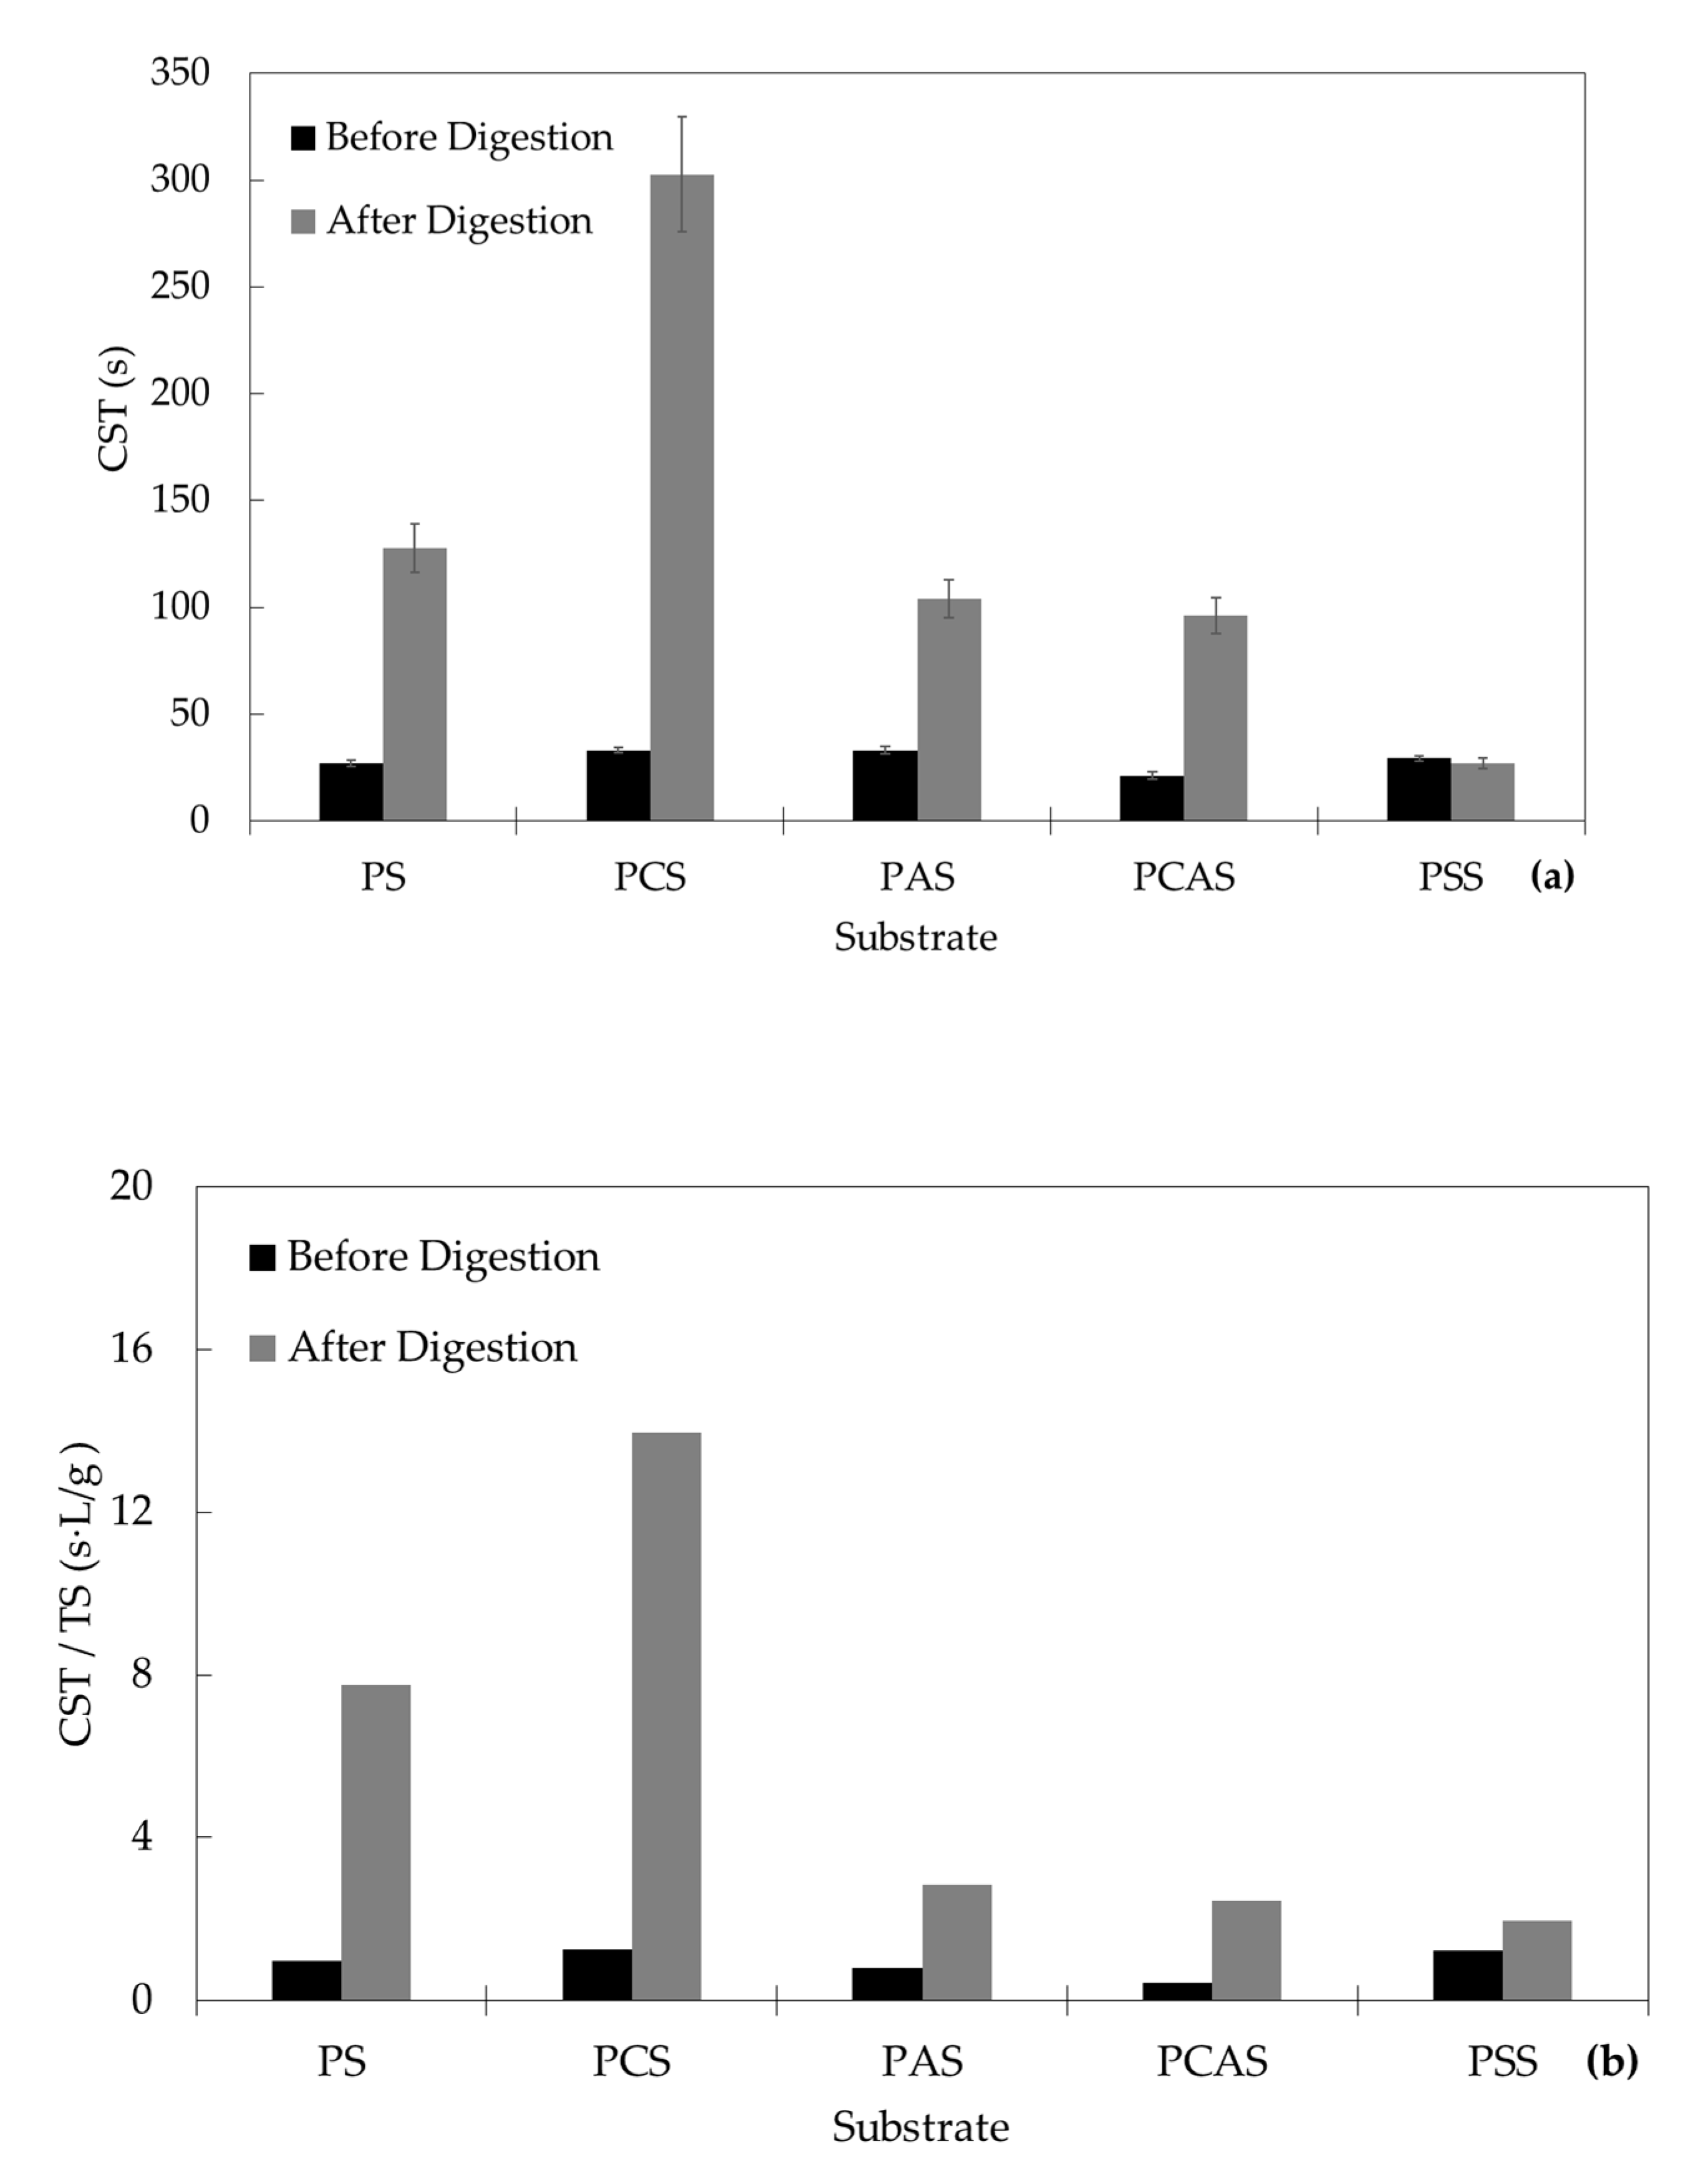
Capillary suction time (CST) is a simple method used to measure dewaterability of sludge samples. The CST of the PS, as well as the mixtures of PCS, PAS, PCAS, and PSS for the ratio SIR = 1:1 g VS substrate/g VS IN, before and after the anaerobic digestion are presented in Figure 10a. Initially, PS and PSS samples demonstrated similar CST values (the null hypothesis was accepted, as p = 0.383), whereas as it is shown in Figure 10a, anaerobic digestion increased the CST value in all treatments, except in the case of PSS. The highest increase was observed in the case of the addition of the cationic polyelectrolyte, where the CST increased about one order of magnitude (from 33.1 ± 1.06 to 302.7 ± 27.1 s), while the CST of primary sludge (PS) increased from 27.0 ± 1.68 to 127.8 ± 11.4 s after the anaerobic digestion. The negative impact of anaerobic digestion on the dewaterability of sewage sludge has been also described by other studies [31,32] that attribute this behavior to the deformation of sludge particles and the consequent formation finer particles, which may block the fine pores of the filter paper during the CST measurement, causing resistance for the water to filter through. These particles along with the extracellular polymeric substances that are produced by the anaerobic microbial mass may result in digested liquor suspensions that contain particles with increased capacity to retain water in their structure, thus increasing the CST. From the macroscopic point of view, changes in density and viscosity of the substrates or digestates affect significantly the results of CST.
To this regard, the addition of polyelectrolyte and attapulgite in PS also affected the concentration of solids in the substrate. To normalize the variances in solids, CST was divided by the concentration of total solids and the results are demonstrated in Figure 10b. Interestingly, it was found that for the PSS fraction an increase of the CST per g/L TS occurred after digestion, in agreement with the rest of substrates. Consequently, it is verified that in all cases, digested biosolids increased their capacity to capture water into their structure. As regards PS, the normalized CST value of digestate was almost four times higher than that of PSS. Coagulant addition induced further increase in normalized CST, about two times, indicating that anaerobic degradation of biosolids in the presence of coagulant alters the rheological properties of the substrates. Noteworthy, attapulgite significantly improved the CST, and achieved diminishing the water retention ability of biosolids produced by the used coagulant.
4. Discussion
Every year about 10 million Mg of biosolids (dry matter) from sewage sludge are produced in Europe with primary sludge being acknowledged to contribute significantly to this amount, although valid and accurate data are missing [33]. Current EU legislation considers renewable energy generated from sewage sludge to contribute significantly to the climate change mitigation [34], revealing the important role of efficient AD as critical issue to sludge management. An alternative practice to current ones that require the two major fractions of sludge from ΜWTPs to be mixed and processed together using anaerobic digestion is investigated in this study. According to this perspective, each of the two fractions are anaerobically digested separately to increase the energy recovery yield and optimize the digestors’ operation. Indeed, quality characteristics of primary sludge signify a higher expected methane production potential compared to the mix of primary and secondary sludge that are currently stabilized through AD in many MWWTPs. Volatile solids content is considerably higher for the primary sludge fraction compared to the mix of primary and secondary sludges. Moreover, primary sludge contains biosolids that have not been subjected to degradation, whereas the mix of two sludges that contains also secondary sludge is partially composed of decomposed biosolids and bacterial biomass along with their exerted material like EPS, whose energy potential has been to some extent dampened. This is also confirmed by the substantially greater concentration of VFA measured in PS fraction. On the other hand, higher VFA concentration, during digestion, may cause higher pH drops, requiring substrates with significant buffering capacity [35]. For sewage sludges, alkalinity values of about 2500 mg CaCO3/L are considered adequate, but higher values offer enhanced buffering capacity [35,36]. In this study, the alkalinity was relatively low and the ratio VFA to alkalinity was relatively high questioning the stability of the system [1]; however, the alkalinity was not raised at the beginning of the tests, e.g., by the addition of a phosphate buffer, to avoid possible inhibitory effects during BMP tests [37]. Measurements at the end of BMP tests (Supplementary Materials) demonstrated that alkalinity was sufficient for maintaining the pH levels neutral.
Besides carbon, nitrogen is also crucial for unhindered methane production by biosolids. Ammonia that accounts for both free ammonia (NH3), and ammonium ions (NH4+), may cause severe inhibition when exceeding certain critical thresholds, even complete failure of anaerobic digestors. Optimum levels of ammonia and C/N ratio are crucial for the methanogenic archaea to grow and the increase of system’s buffer capacity, counteracting acidification driven by VFA production [38,39]. Values of C/N equal to 10 or up to 13–16 are considered suitable for AD [24,40]. According to results of Table 1, primary sludge complies with the criteria to a higher degree compared to PSS, implying better performance of the anaerobic digestor and higher methane production yielding. In addition, ammonium content is not expected to cause toxicity, as it is found in rather low levels, less than 200 mg/L, for both substrates [38]. Ammonium ions analysis of the inoculum fraction implied significant accumulation of ammonium inside the digestor, indicating that this parameter should be carefully monitored, especially in case of full-scale operation.
Initial experiments were performed to elucidate the optimum substrate to inoculum ratio (SIR). Results shown in Figure 3 and Table 2 demonstrated that SIR of 1:1 g VS substrate/g VS IN resulted in moderately higher overall methane production. On the other hand, methane production was faster for SIR equal to 1:2 g VS substrate/g VS IN, verifying that in this case the increased anaerobic biomass shortened the lag phase (Table 2). Remarkably, the application of the modified Gompertz model yielded negative λ factor suggesting that the anaerobic microbial community mass was viable and well-functioning, therefore, readily biodegradable organic material started producing methane shortly after inoculation. Under these conditions, PS anaerobic digestion at SIR of 1:1 g VS substrate/g VS IN is favored, suggesting that higher efficiencies can be accomplished at lower digestors’ volume.
Next, results were compared to those obtained by PSS fraction. As expected, the overall yield in methane production was lower. Especially in case of anaerobic digestion at SIR of 1:1 g VS substrate/g VS IN, methane production by PSS was about 30% lower compared to PS, while in case of SIR equal to 1:2 g VS substrate/g VS IN the observed reduction was around 22%. Again, the highest SIR yielded better efficiencies, although the lag phase was higher and maximum daily methane production was significantly less, as demonstrated by results in Table 2. Chemical analysis of digestates (Supplementary Materials) exhibited similar results for most of the parameters. Interestingly, digestate derived from AD of PS presented worse dewaterability, in terms of CST, compared to PSS fraction and this may adversely impact its further treatment for disposal or utilization.
As regards the impact of additives to primary sludge, both organic polyelectrolyte and attapulgite significantly enhanced the production of methane. It should be noted though that the addition of polyelectrolyte contributed to the enhancement of total organic carbon because of its nature, so in this case methane production is partially due to the increase of organic matter added to the anaerobic digesters. On the other hand, attapulgite is an inorganic material, so the action mechanism is completely different. Interestingly, for SIR equal to 1:1 g VS substrate/g VS IN, PAS substrate exhibited the best performance, while the simultaneous addition of polyelectrolyte did not enhance further the production of methane.
This trend is most likely due to the addition of attapulgite to the digestion process of primary sludge, which improves methane production and biodegradability of the substrate [16]. The even higher methane production for PCAS compared to PAS, and the high productivity of PCS is partially attributed to the additional organic load of the cationic polyelectrolyte. Xie et al. [41] also investigated the digestion of primary sludge with additives using BMP tests at SIR equal to 1.5:1 and found that specific methane yields increased from 136 mL/g VS for primary sludge to 146, 151, and 152 mL/g VS for the addition of nano magnetite, graphite powder, and activated carbon powder at optimal dosages, respectively, after 10 days of digestion. These results indicate higher methane production potential when attapulgite is used with PS. However, it should be stressed that selecting the appropriate SIR appears to be crucial for the overall performance of anaerobic digestion.
Kinetic analysis for SIR equal to 1:1 g VS substrate/g VS IN revealed that the addition of attapulgite reduced the lag phase and significantly increased the hydrolysis rate, facilitating the degradation of organics and the production of methane. Likewise, Wei et al. [3] reported a significant increase of hydrolysis rate, from 0.31 to 0.51 d−1, after addition of 1.82 g corn biochar/g TS, indicating that biochar was effective in speeding up methane production and improving the hydrolysis and methane potential of PS. Further increase of biochar concentration caused reduction of the overall efficiency, indicating that probably biochar caused toxic effects against anaerobic bacteria. Indeed, effective concentration of additives should be carefully addressed by performing dose response tests using BMP procedures. As regards the addition of the polyelectrolyte along with attapulgite, methane production was slightly promoted considering that part of the observed methane production capacity was accredited to the organic nature of the coagulant.
At the end of the BMP tests, the digestates were subjected to physical, chemical, and microbiological analysis to assess their quality characteristics. Chemical analysis demonstrated that anaerobic digestion achieved to biodegrade sufficiently the organics contained PS and their final concentration into PS digestate was close to that of the PSS digestate that is accomplished after mixing and thickening processes (Figure 1). As regards pathogen indicators’ analysis, the results exhibited remarkable efficiency of anaerobic digestion to stabilize the primary sludge. Total coliforms in digestate complied with EPA regulations for unrestricted agricultural use, while the rest of indicators were significantly reduced, by more than three orders of magnitude for E. coli, two orders of magnitude for total count, and more than 1.5 orders of magnitude for Enterococcus. On the contrary, CST results suggested that rheological properties of PS substrates were altered during anaerobic digestion; thus, their dewaterability properties were downgraded indicating that the next treatment step may probably be more demanding. Nevertheless, results of this study are promising for adopting practices of exclusive anaerobic digestion of primary sludge. Mixing of primary with specific additives, such as attapulgite, promotes AD that turns out highly effective in producing methane. Produced digestates are of adequate quality for further utilization mainly in agricultural or energy sectors, since organic matter is not completely degraded.
5. Conclusions
This study focused on the investigation of practices to further enhance the methane production of the anaerobic digestion of primary sludge alone as a separate stream in a wastewater treatment plant. To this regard, PS digestion efficiency was compared with PSS digestion yield and afterwards additives were examined to investigate their capacity to further promote methane production of methane by PS. The results showed that the overall yield in methane production during anaerobic digestion of primary sludge alone was higher than that obtained by the anaerobic digestion of mixed primary and secondary sludge, indicating the upgraded energy potential of primary sludge. The addition of both organic polyelectrolyte and attapulgite enhanced further the production of methane at SIR equal to 1:1, while attapulgite increased the hydrolysis rate of biosolids and produced relatively stabilized digestate, though of lower dewaterability. The results of this study also demonstrated that when using such additives, the hydraulic retention time of sludge could be reduced, improving the productivity of digesters, yielding more energy, and providing new perspectives in sludge management that is sometimes the most cost and effort demanding task during MWWTP operation.
Supplementary Materials
The following are available online at https://www.mdpi.com/2073-4441/13/3/348/s1, Table S1. Results of physical-chemical analysis of substrates before anaerobic digestion, for tests under SIR = 1:2 g VS substrate/g VS IN, Table S2. Results of physical-chemical analysis of substrates after anaerobic digestion, for tests under SIR = 1:2 g VS substrate/g VS IN, Table S3. Results of physical-chemical analysis of substrates before anaerobic digestion, for tests under SIR = 1:1 g VS substrate/g VS IN, Table S4. Results of physical-chemical analysis of substrates after anaerobic digestion, for tests under SIR = 1:1 g VS substrate/g VS IN, Figure S1. Colony forming units (cfu) of total coliforms, Escherichia coli, Enterococcus, total microbiological count, before and after digestion, for the PSS substrate.
Author Contributions
Conceptualization, M.P., V.T. and E.D.; Data curation, F.S.; Formal analysis, M.P.; Investigation, F.S.; Methodology, F.S., M.P. and V.T.; Resources, M.P. and E.D.; Software, F.S.; Supervision, E.D.; Validation, F.S. and V.T.; Visualization, F.S.; Writing—Original draft, F.S., M.P. and V.T.; Writing—Review and editing, M.P. and V.T. All authors have read and agreed to the published version of the manuscript.
Funding
This study was partially financially supported by Thessaloniki’s Water Supply and Sewerage Co. S.A, Greece.
Acknowledgments
The authors would like to thank Thessaloniki’s Water Supply and Sewerage Co. S.A. staff for their support during sampling campaigns. The authors also acknowledge the support of Geohellas S.A., Greece, for providing the attapulgite which was used in this study.
Conflicts of Interest
The authors declare no conflict of interest. The funders had no role in the design of the study; in the collection, analysis, or interpretation of data; in the writing of the manuscript; or in the decision to publish the results.
Abbreviations
| AD | anaerobic digestion |
| BMP | biochemical methane potential |
| C | carbon |
| COD | chemical oxygen demand |
| CST | capillary suction time |
| C/N | carbon to nitrogen ratio |
| EPS | extracellular polymeric substances |
| IN | inoculum |
| k | hydrolysis rate |
| M | cumulative methane production |
| MO | cumulative methane production calculated by modified first order kinetic model |
| MWWTP | municipal wastewater treatment plant |
| N | nitrogen |
| P | cumulative methane production calculated by modified Gompertz kinetic model |
| PAS | substrate of primary sludge and attapulgite |
| PCAS | substrate of primary sludge, polyelectrolyte and attapulgite |
| PCS | substrate of primary sludge and polyelectrolyte |
| PS | primary sludge |
| PSS | primary and secondary sludge |
| R max | maximum methane production rate calculated by modified Gompertz kinetic model |
| SIR | substrate to inoculum ratio |
| t | digestion time |
| TS | total solids |
| VFA | volatile fatty acids |
| VS | volatile solids |
| λ | lag phase |
References
- Filer, J.; Ding, H.H.; Chang, S. Biochemical Methane Potential (BMP) Assay Method for Anaerobic Digestion Research. Water 2019, 11, 921. [Google Scholar] [CrossRef] [Green Version]
- Turovskiy, I.S.; Mathai, P.K. Wastewater Sludge Processing; John Wiley & Sons: Hoboken, NJ, USA, 2005. [Google Scholar] [CrossRef]
- Wei, W.; Guo, W.; Ngo, H.H.; Mannina, G.; Wang, D.; Chen, X.; Liu, Y.; Peng, L.; Ni, B.J. Enhanced High-Quality Biomethane Production from Anaerobic Digestion of Primary Sludge by Corn Stover Biochar. Bioresour. Technol. 2020, 306, 123159. [Google Scholar] [CrossRef]
- Rulkens, W. Sewage Sludge as a Biomass Resource for the Production of Energy: Overview and Assessment of the Various Options. Energy Fuels 2008, 22, 9–15. [Google Scholar] [CrossRef]
- McCarty, P.L.; Bae, J.; Kim, J. Domestic Wastewater Treatment as a Net Energy Producer—Can This Be Achieved? Environ. Sci. Technol. 2011, 45, 7100–7106. [Google Scholar] [CrossRef] [PubMed]
- Gómez, X.; Cuetos, M.J.; Cara, J.; Morán, A.; García, A.I. Anaerobic Co-Digestion of Primary Sludge and the Fruit and Vegetable Fraction of the Municipal Solid Wastes. Conditions for Mixing and Evaluation of the Organic Loading Rate. Renew. Energy 2006, 31, 2017–2024. [Google Scholar] [CrossRef]
- Kooijman, G.; De Kreuk, M.K.; Van Lier, J.B. Influence of Chemically Enhanced Primary Treatment on Anaerobic Digestion and Dewaterability of Waste Sludge. Water Sci. Technol. 2017, 76, 1629–1639. [Google Scholar] [CrossRef] [PubMed]
- Elbeshbishy, E.; Nakhla, G.; Hafez, H. Biochemical Methane Potential (BMP) of Food Waste and Primary Sludge: Influence of Inoculum Pre-Incubation and Inoculum Source. Bioresour. Technol. 2012, 110, 18–25. [Google Scholar] [CrossRef]
- Mata-Alvarez, J.; Dosta, J.; Romero-Güiza, M.S.; Fonoll, X.; Peces, M.; Astals, S. A Critical Review on Anaerobic Co-Digestion Achievements between 2010 and 2013. Renew. Sustain. Energy Rev. 2014, 36, 412–427. [Google Scholar] [CrossRef]
- Wickham, R.; Galway, B.; Bustamante, H.; Nghiem, L.D. Biomethane Potential Evaluation of Co-Digestion of Sewage Sludge and Organic Wastes. Int. Biodeterior. Biodegrad. 2016, 113, 3–8. [Google Scholar] [CrossRef] [Green Version]
- Nguyen, V.K.; Chaudhary, D.K.; Dahal, R.H.; Trinh, N.H.; Kim, J.; Chang, S.W.; Hong, Y.; La, D.D.; Nguyen, X.C.; Ngo, H.H.; et al. Review on Pretreatment Techniques to Improve Anaerobic Digestion of Sewage Sludge. Fuel 2021, 285, 119105. [Google Scholar] [CrossRef]
- Tomei, M.C.; Bertanza, G.; Canato, M.; Heimersson, S.; Laera, G.; Svanström, M. Techno-Economic and Environmental Assessment of Upgrading Alternatives for Sludge Stabilization in Municipal Wastewater Treatment Plants. J. Clean. Prod. 2016, 112, 3106–3115. [Google Scholar] [CrossRef]
- Mininni, G.; Braguglia, C.M.; Ramadori, R.; Tomei, M.C. An Innovative Sludge Management System Based on Separation of Primary and Secondary Sludge Treatment. Water Sci. Technol. 2004, 50, 145–153. [Google Scholar] [CrossRef] [PubMed]
- Lin, L.; Wan, C.; Liu, X.; Lei, Z.; Lee, D.J.; Zhang, Y.; Tay, J.H.; Zhang, Z. Anaerobic Digestion of Swine Manure under Natural Zeolite Addition: VFA Evolution, Cation Variation, and Related Microbial Diversity. Appl. Microbiol. Biotechnol. 2013, 97, 10575–10583. [Google Scholar] [CrossRef] [PubMed]
- Fernández, N.; Montalvo, S.; Fernández-Polanco, F.; Guerrero, L.; Cortés, I.; Borja, R.; Sánchez, E.; Travieso, L. Real Evidence about Zeolite as Microorganisms Immobilizer in Anaerobic Fluidized Bed Reactors. Process Biochem. 2007, 42, 721–728. [Google Scholar] [CrossRef]
- Liang, Y.G.; Xu, L.; Bao, J.; Firmin, K.A.; Zong, W. Attapulgite Enhances Methane Production from Anaerobic Digestion of Pig Slurry by Changing Enzyme Activities and Microbial Community. Renew. Energy 2020, 145, 222–232. [Google Scholar] [CrossRef]
- Angelidaki, I.; Alves, M.; Bolzonella, D.; Borzacconi, L.; Campos, J.L.; Guwy, A.J.; Kalyuzhnyi, S.; Jenicek, P.; Van Lier, J.B. Defining the Biomethane Potential (BMP) of Solid Organic Wastes and Energy Crops: A Proposed Protocol for Batch Assays. Water Sci. Technol. 2009, 59, 927–934. [Google Scholar] [CrossRef] [Green Version]
- Holliger, C.; Alves, M.; Andrade, D.; Angelidaki, I.; Astals, S.; Baier, U.; Bougrier, C.; Buffière, P.; Carballa, M.; De Wilde, V.; et al. Towards a Standardization of Biomethane Potential Tests. Water Sci. Technol. 2016, 74, 2515–2522. [Google Scholar] [CrossRef]
- Koch, K.; Hafner, S.D.; Weinrich, S.; Astals, S. Identification of Critical Problems in Biochemical Methane Potential (BMP) Tests From Methane Production Curves. Front. Environ. Sci. 2019, 7, 178. [Google Scholar] [CrossRef]
- Lawlor, K. Comparison of Methods to Investigate Microbial Populations in Soils under Different Agricultural Management. FEMS Microbiol. Ecol. 2000, 33, 129–137. [Google Scholar] [CrossRef]
- Rice, E.W.; Baird, R.B.; Eaton, A.D.; Clesceri, L.S. Standard Methods for Examination of Water and Wastewater; American Public Health Association (APHA): Washington, DC, USA, 2012. [Google Scholar]
- Walkley, A.; Black, I.A. An Examination of the Degtjareff Method Fordetermining Soil Organic Matter and a Proposed Modification of the Chromicacid Titration Method. Soil Sci. 1934, 37, 29–38. [Google Scholar] [CrossRef]
- Mshandete, A.; Björnsson, L.; Kivaisi, A.K.; Rubindamayugi, M.S.T.; Mattiasson, B. Effect of Particle Size on Biogas Yield from Sisal Fibre Waste. Renew. Energy 2006, 31, 2385–2392. [Google Scholar] [CrossRef]
- Silvestre, G.; Fernández, B.; Bonmatí, A. Addition of Crude Glycerine as Strategy to Balance the C/N Ratio on Sewage Sludge Thermophilic and Mesophilic Anaerobic Co-Digestion. Bioresour. Technol. 2015, 193, 377–385. [Google Scholar] [CrossRef] [PubMed]
- Shen, J.; Jun, Z. Development of General Gompertz Models and Their Simplified Two-Parameter Forms Based on Specific Microbial Growth Rate for Microbial Growth, Bio-Products and Substrate Consumption. Adv. Biotechnol. Microbiol. 2017, 4, 64–74. [Google Scholar] [CrossRef]
- Jijai, S.; Srisuwan, G.; O-thong, S.; Norli, I.; Siripatana, C. Effect of Substrate and Granules/Inocula Sizes on Biochemical Methane Potential and Methane Kinetics. Iran. J. Energy Environ. 2016, 7, 94–101. [Google Scholar] [CrossRef] [Green Version]
- United States Environmental Protection Agency (EPA). Control of Pathogens and Vector Attraction in Sewage Sludge—(Including Domestic Septage):Under 40 CFR Part 503; (EPA 625/R-92/013); EPA: Cincinnati, OH, USA, 2003.
- López, A.; Rodríguez-Chueca, J.; Mosteo, R.; Gómez, J.; Ormad, M.P. Microbiological Quality of Sewage Sludge after Digestion Treatment: A Pilot Scale Case of Study. J. Clean. Prod. 2020, 254, 120101. [Google Scholar] [CrossRef]
- Carroll, Z.S.; Long, S.C. Bench-Scale Analysis of Surrogates for Anaerobic Digestion Processes. Water Environ. Res. 2016, 88, 458–467. [Google Scholar] [CrossRef]
- Samara, E.; Matsi, T.; Zdragas, A.; Barbayiannis, N. Use of Clay Minerals for Sewage Sludge Stabilization and a Preliminary Assessment of the Treated Sludge’s Fertilization Capacity. Environ. Sci. Pollut. Res. 2019, 26, 35387–35398. [Google Scholar] [CrossRef]
- Gebreeyessus, G.D. Effect of Anaerobic Digestion Temperature on Sludge Quality. Waste Biomass Valorization 2020, 11, 1851–1861. [Google Scholar] [CrossRef]
- Wang, T.; Chen, J.; Shen, H.; An, D. Effects of Total Solids Content on Waste Activated Sludge Thermophilic Anaerobic Digestion and Its Sludge Dewaterability. Bioresour. Technol. 2016, 217, 265–270. [Google Scholar] [CrossRef]
- Europa. Eurostat Sewage Sludge Production and Disposal; European Statistical Office: Luxembourg, 2019; Available online: https://ec.europa.eu/eurostat/web/products-datasets/-/env_ww_spd (accessed on 22 January 2021).
- Europa. EC. Environmental, Economic and Social Impacts of the Use of Sewage Sludge on Land—Part II: Report on Options and Impacts; European Commission: Brussels, Belgium, 2010; Available online: http://ec.europa.eu/environment/archives/waste/sludge/pdf/part_ii_report.pdf (accessed on 22 January 2021).
- Raposo, F.; Fernández-Cegrí, V.; de la Rubia, M.A.; Borja, R.; Béline, F.; Cavinato, C.; Demirer, G.; Fernández, B.; Fernández-Polanco, M.; Frigon, J.C.; et al. Biochemical Methane Potential (BMP) of Solid Organic Substrates: Evaluation of Anaerobic Biodegradability Using Data from an International Interlaboratory Study. J. Chem. Technol. Biotechnol. 2011, 86, 1088–1098. [Google Scholar] [CrossRef]
- Stafford, D.A.; Hawkes, D.L.; Horton, R. Methane Production from Waste Organic Matter; CRC Press: Boca Raton, FL, USA, 1980. [Google Scholar]
- Pabón-Pereira, C.P. Anaerobic Digestion in Sustainable Biomass Chains. Ph.D. Thesis, Wageningen University, Wageningen, The Netherlands, 2009. [Google Scholar]
- Polizzi, C.; Alatriste-Mondragón, F.; Munz, G. The Role of Organic Load and Ammonia Inhibition in Anaerobic Digestion of Tannery Fleshing. Water Resour. Ind. 2018, 19, 25–34. [Google Scholar] [CrossRef]
- Rajagopal, R.; Massé, D.I.; Singh, G. A Critical Review on Inhibition of Anaerobic Digestion Process by Excess Ammonia. Bioresour. Technol. 2013, 143, 632–641. [Google Scholar] [CrossRef] [PubMed]
- Elsayed, M.; Andres, Y.; Blel, W.; Gad, A.; Ahmed, A. Effect of VS Organic Loads and Buckwheat Husk on Methane Production by Anaerobic Co-Digestion of Primary Sludge and Wheat Straw. Energy Convers. Manag. 2016, 117, 538–547. [Google Scholar] [CrossRef]
- Xie, S.; Li, X.; Wang, C.; Kulandaivelu, J.; Jiang, G. Enhanced anaerobic digestion of primary sludge with additives: Performance and mechanisms. Bioresour. Technol. 2020, 316, 123970. [Google Scholar] [CrossRef] [PubMed]
Figure 1.
Flow diagram of Thessaloniki’s Municipal Wastewater Treatment Plant and sampling points: (a) primary sludge, (b) mixture of primary and secondary sludge, (c) inoculum.
Figure 1.
Flow diagram of Thessaloniki’s Municipal Wastewater Treatment Plant and sampling points: (a) primary sludge, (b) mixture of primary and secondary sludge, (c) inoculum.

Figure 2.
(a) Experimental test set up: (i) water bath; (ii) anaerobic reactors; (iii) carbon dioxide separating unit; (iv) graduated cylinder; (v) inverted bottle; (vi) capillary tube. (b) Experimental set up photo.
Figure 2.
(a) Experimental test set up: (i) water bath; (ii) anaerobic reactors; (iii) carbon dioxide separating unit; (iv) graduated cylinder; (v) inverted bottle; (vi) capillary tube. (b) Experimental set up photo.

Figure 3.
Cumulative methane production of primary sludge (PS) at different substrate to inoculum ratios (error bars indicate standard deviation of mean values).
Figure 3.
Cumulative methane production of primary sludge (PS) at different substrate to inoculum ratios (error bars indicate standard deviation of mean values).

Figure 4.
Cumulative methane production (mL/g VS) for SIR = 1:2 g VS substrate/g VS IN (error bars indicate standard deviation of mean values).
Figure 4.
Cumulative methane production (mL/g VS) for SIR = 1:2 g VS substrate/g VS IN (error bars indicate standard deviation of mean values).

Figure 5.
Cumulative methane production (mL/g VS) for SIR = 1:1 g VS substrate/g VS IN (error bars indicate standard deviation of mean values).
Figure 5.
Cumulative methane production (mL/g VS) for SIR = 1:1 g VS substrate/g VS IN (error bars indicate standard deviation of mean values).

Figure 6.
Volatile solid removal rates of PS and PSS for the tested substrate to inoculum ratios.

Figure 7.
Kinetics modeling for SIR = 1:2 g VS substrate/g VS IN. (a) First order kinetics model; (b) modified Gompertz model.
Figure 7.
Kinetics modeling for SIR = 1:2 g VS substrate/g VS IN. (a) First order kinetics model; (b) modified Gompertz model.

Figure 8.
Kinetics modeling for SIR = 1:1 g VS substrate/g VS IN. (a) First order kinetics model; (b) modified Gompertz model.
Figure 8.
Kinetics modeling for SIR = 1:1 g VS substrate/g VS IN. (a) First order kinetics model; (b) modified Gompertz model.

Figure 9.
Colony forming units (cfu) of total coliforms, Escherichia coli, Enterococcus, total microbiological count, for the substrates PS, PCS, PAS, PCAS (error bars indicate standard deviation of mean values).
Figure 9.
Colony forming units (cfu) of total coliforms, Escherichia coli, Enterococcus, total microbiological count, for the substrates PS, PCS, PAS, PCAS (error bars indicate standard deviation of mean values).

Figure 10.
(a) CST at SIR = 1:1 g VS substrate/g VS IN for the substrates PS, PCS, PAS, PCAS, PSS, (error bars indicate standard deviation of mean values), (b) normalized CST for the substrates PS, PCS, PAS, PCAS, PSS.
Figure 10.
(a) CST at SIR = 1:1 g VS substrate/g VS IN for the substrates PS, PCS, PAS, PCAS, PSS, (error bars indicate standard deviation of mean values), (b) normalized CST for the substrates PS, PCS, PAS, PCAS, PSS.


Table 1.
Characterization of primary sludge, mix of primary and secondary sludges, and anaerobically digested sludge.
Table 1.
Characterization of primary sludge, mix of primary and secondary sludges, and anaerobically digested sludge.
| Parameters/Sample | Anaerobically Digested Sludge | Primary Sludge | Primary and Secondary Sludges’ Mix |
|---|---|---|---|
| Total solids (%) | 2.02 ± 0.01 | 3.96 ± 0.83 | 2.79 ± 0.35 |
| Volatile solids (%) | 1.25 ± 0.01 | 2.95 ± 0.72 | 1.87 ± 0.02 |
| pH | 7.90 ± 0.06 | 6.44 ± 0.42 | 6.42 ± 0.13 |
| Conductivity (mS/cm) | 10.11 ± 0.21 | 6.63 ± 1.80 | 6.69 ± 0.72 |
| Alkalinity (mg/L CaCO3) | 2420 ± 28.28 | 960 ± 113.14 | 1084 ± 103.65 |
| Volatile fatty acids, VFA (mg/L acetic acid) | 312 ± 29.33 | 720 ± 67.68 | 432 ± 40.61 |
| NH4-N (mg/L) | 490.00 ± 2.83 | 132.40 ± 17.54 | 191.00 ± 38.61 |
| Total phosphorus (mg/L) | 322.10 ± 25.77 | 269.00 ± 24.21 | 262.20 ± 23.60 |
| Organic carbon (%) | 19.34 ± 7.60 | 30.94 ± 1.70 | 24.18 ± 0.50 |
| Organic matter (%) | 33.35 ± 13.10 | 53.33 ± 2.93 | 41.69 ± 0.87 |
| Chemical oxygen demand, COD (mg/L) | 20,120 ± 1710.20 | 48,560 ± 4127.60 | 42,400 ± 3604.00 |
| N (%) | 2.8 ±0.6 | 3.2 ± 0.4 | 3.8 ± 0.4 |
| C (%) | 27.7 ±1.9 | 43.2 ± 3.0 | 35.1 ± 3.4 |
| C/N | 10.0 ±1.3 | 13.6 ±0.9 | 9.2 ± 0.1 |
| Capillary suction time, CST (s) | 26.2 ± 3.96 | 61.8 ± 13.44 | 35.4 ± 5.30 |
The data represent the means ± SD, n = 6.
Table 2.
Performance of the different substrates at the two different substrates to inoculum ratios (SIR).
Table 2.
Performance of the different substrates at the two different substrates to inoculum ratios (SIR).
| SIR | Tests | PS | PCS | PAS | PCAS | PSS |
|---|---|---|---|---|---|---|
| (g VS substrate/g VS IN) | ||||||
| 1:2 | Measured cumulative CH4 production | 187.95 ± 0.84 | 219.11 ± 13.74 | 196.94 ± 15.75 | 209.66 ± 16.58 | 146.36 ± 6.30 |
| (mL/g VS substrate) | ||||||
| Measured maximum CH4 production rate (mL/g VS substrate/d) | 37.13 ± 0.46 | 42.56 ± 3.99 | 52.11 ± 3.65 | 46.69 ± 2.30 | 34.53 ± 0.61 | |
| MO (mL/g VS substrate) | 172.11 ± 2.73 | 204.22 ± 2.59 | 176.12 ± 3.27 | 198.71 ± 2.14 | 134.07 ± 1.73 | |
| k (d−1) | 0.232 ± 0.02 | 0.234 ± 0.01 | 0.267 ± 0.03 | 0.284 ± 0.02 | 0.277 ± 0.02 | |
| R2 | 0.944 | 0.966 | 0.905 | 0.970 | 0.953 | |
| P (mL/g VS substrate) | 170.44 ± 3.33 | 199.48 ± 3.01 | 178.70 ± 4.14 | 194.51 ± 1.95 | 132.81 ± 2.14 | |
| Rmax (mL/g VS substrate) | 19.13 ± 2.49 | 29.10 ± 3.26 | 16.63 ± 2.49 | 41.43 ± 3.79 | 18.42 ± 2.28 | |
| λ (d) | −1.41 ± 0.64 | −0.43 ± 0.42 | −2.63 ± 0.93 | 0.27 ± 0.23 | −1.05 ± 0.49 | |
| R2 | 0.914 | 0.943 | 0.882 | 0.970 | 0.945 | |
| 1:1 | Measured cumulative CH4 production (mL/g VS substrate) | 230.16 ± 26.04 | 322.23 ± 3.85 | 355.25 ± 31.97 | 439.12 ± 51.47 | 162.29 ± 9.22 |
| Measured maximum CH4 production rate (mL/g VS substrate/d) | 23.45 ± 0.30 | 56.29 ± 0.66 | 64.17 ± 2.57 | 69.23 ± 7.30 | 27.20 ± 0.27 | |
| MO (mL/g VS substrate) | 246.79 ± 8.29 | 308.65 ± 3.27 | 335.33 ± 6.38 | 418.14 ± 7.66 | 157.51 ± 2.88 | |
| k (d−1) | 0.109 ± 0.01 | 0.196 ± 0.01 | 0.157 ± 0.01 | 0.134 ± 0.01 | 0.160 ± 0.01 | |
| R2 | 0.956 | 0.982 | 0.959 | 0.972 | 0.967 | |
| P (mL/g VS substrate) | 224.42 ± 1.38 | 299.12 ± 3.67 | 331.30 ± 8.15 | 412.62 ± 10.23 | 149.14 ± 1.76 | |
| Rmax (mL/g VS substrate) | 25.23 ± 0.85 | 39.56 ± 3.26 | 24.95 ± 2.84 | 26.77 ± 2.57 | 20.85 ± 1.65 | |
| λ (d) | 1.86 ± 0.16 | −0.13 ± 0.34 | −2.08 ± 0.81 | −2.36 ± 0.77 | 0.84 ± 0.30 | |
| R2 | 0.997 | 0.969 | 0.930 | 0.949 | 0.977 |
Publisher’s Note: MDPI stays neutral with regard to jurisdictional claims in published maps and institutional affiliations. |
© 2021 by the authors. Licensee MDPI, Basel, Switzerland. This article is an open access article distributed under the terms and conditions of the Creative Commons Attribution (CC BY) license (http://creativecommons.org/licenses/by/4.0/).
Share and Cite
MDPI and ACS Style
Sakaveli, F.; Petala, M.; Tsiridis, V.; Darakas, E. Enhanced Mesophilic Anaerobic Digestion of Primary Sewage Sludge. Water 2021, 13, 348. https://doi.org/10.3390/w13030348
AMA Style
Sakaveli F, Petala M, Tsiridis V, Darakas E. Enhanced Mesophilic Anaerobic Digestion of Primary Sewage Sludge. Water. 2021; 13(3):348. https://doi.org/10.3390/w13030348
Chicago/Turabian StyleSakaveli, Foteini, Maria Petala, Vasilios Tsiridis, and Efthymios Darakas. 2021. "Enhanced Mesophilic Anaerobic Digestion of Primary Sewage Sludge" Water 13, no. 3: 348. https://doi.org/10.3390/w13030348
Note that from the first issue of 2016, this journal uses article numbers instead of page numbers. See further details here.