
Long-Term Spatiotemporal Variation of Droughts in the Amazon River Basin

 ,
,  ,
,
Abstract
:1. Introduction
2. Materials and Methods
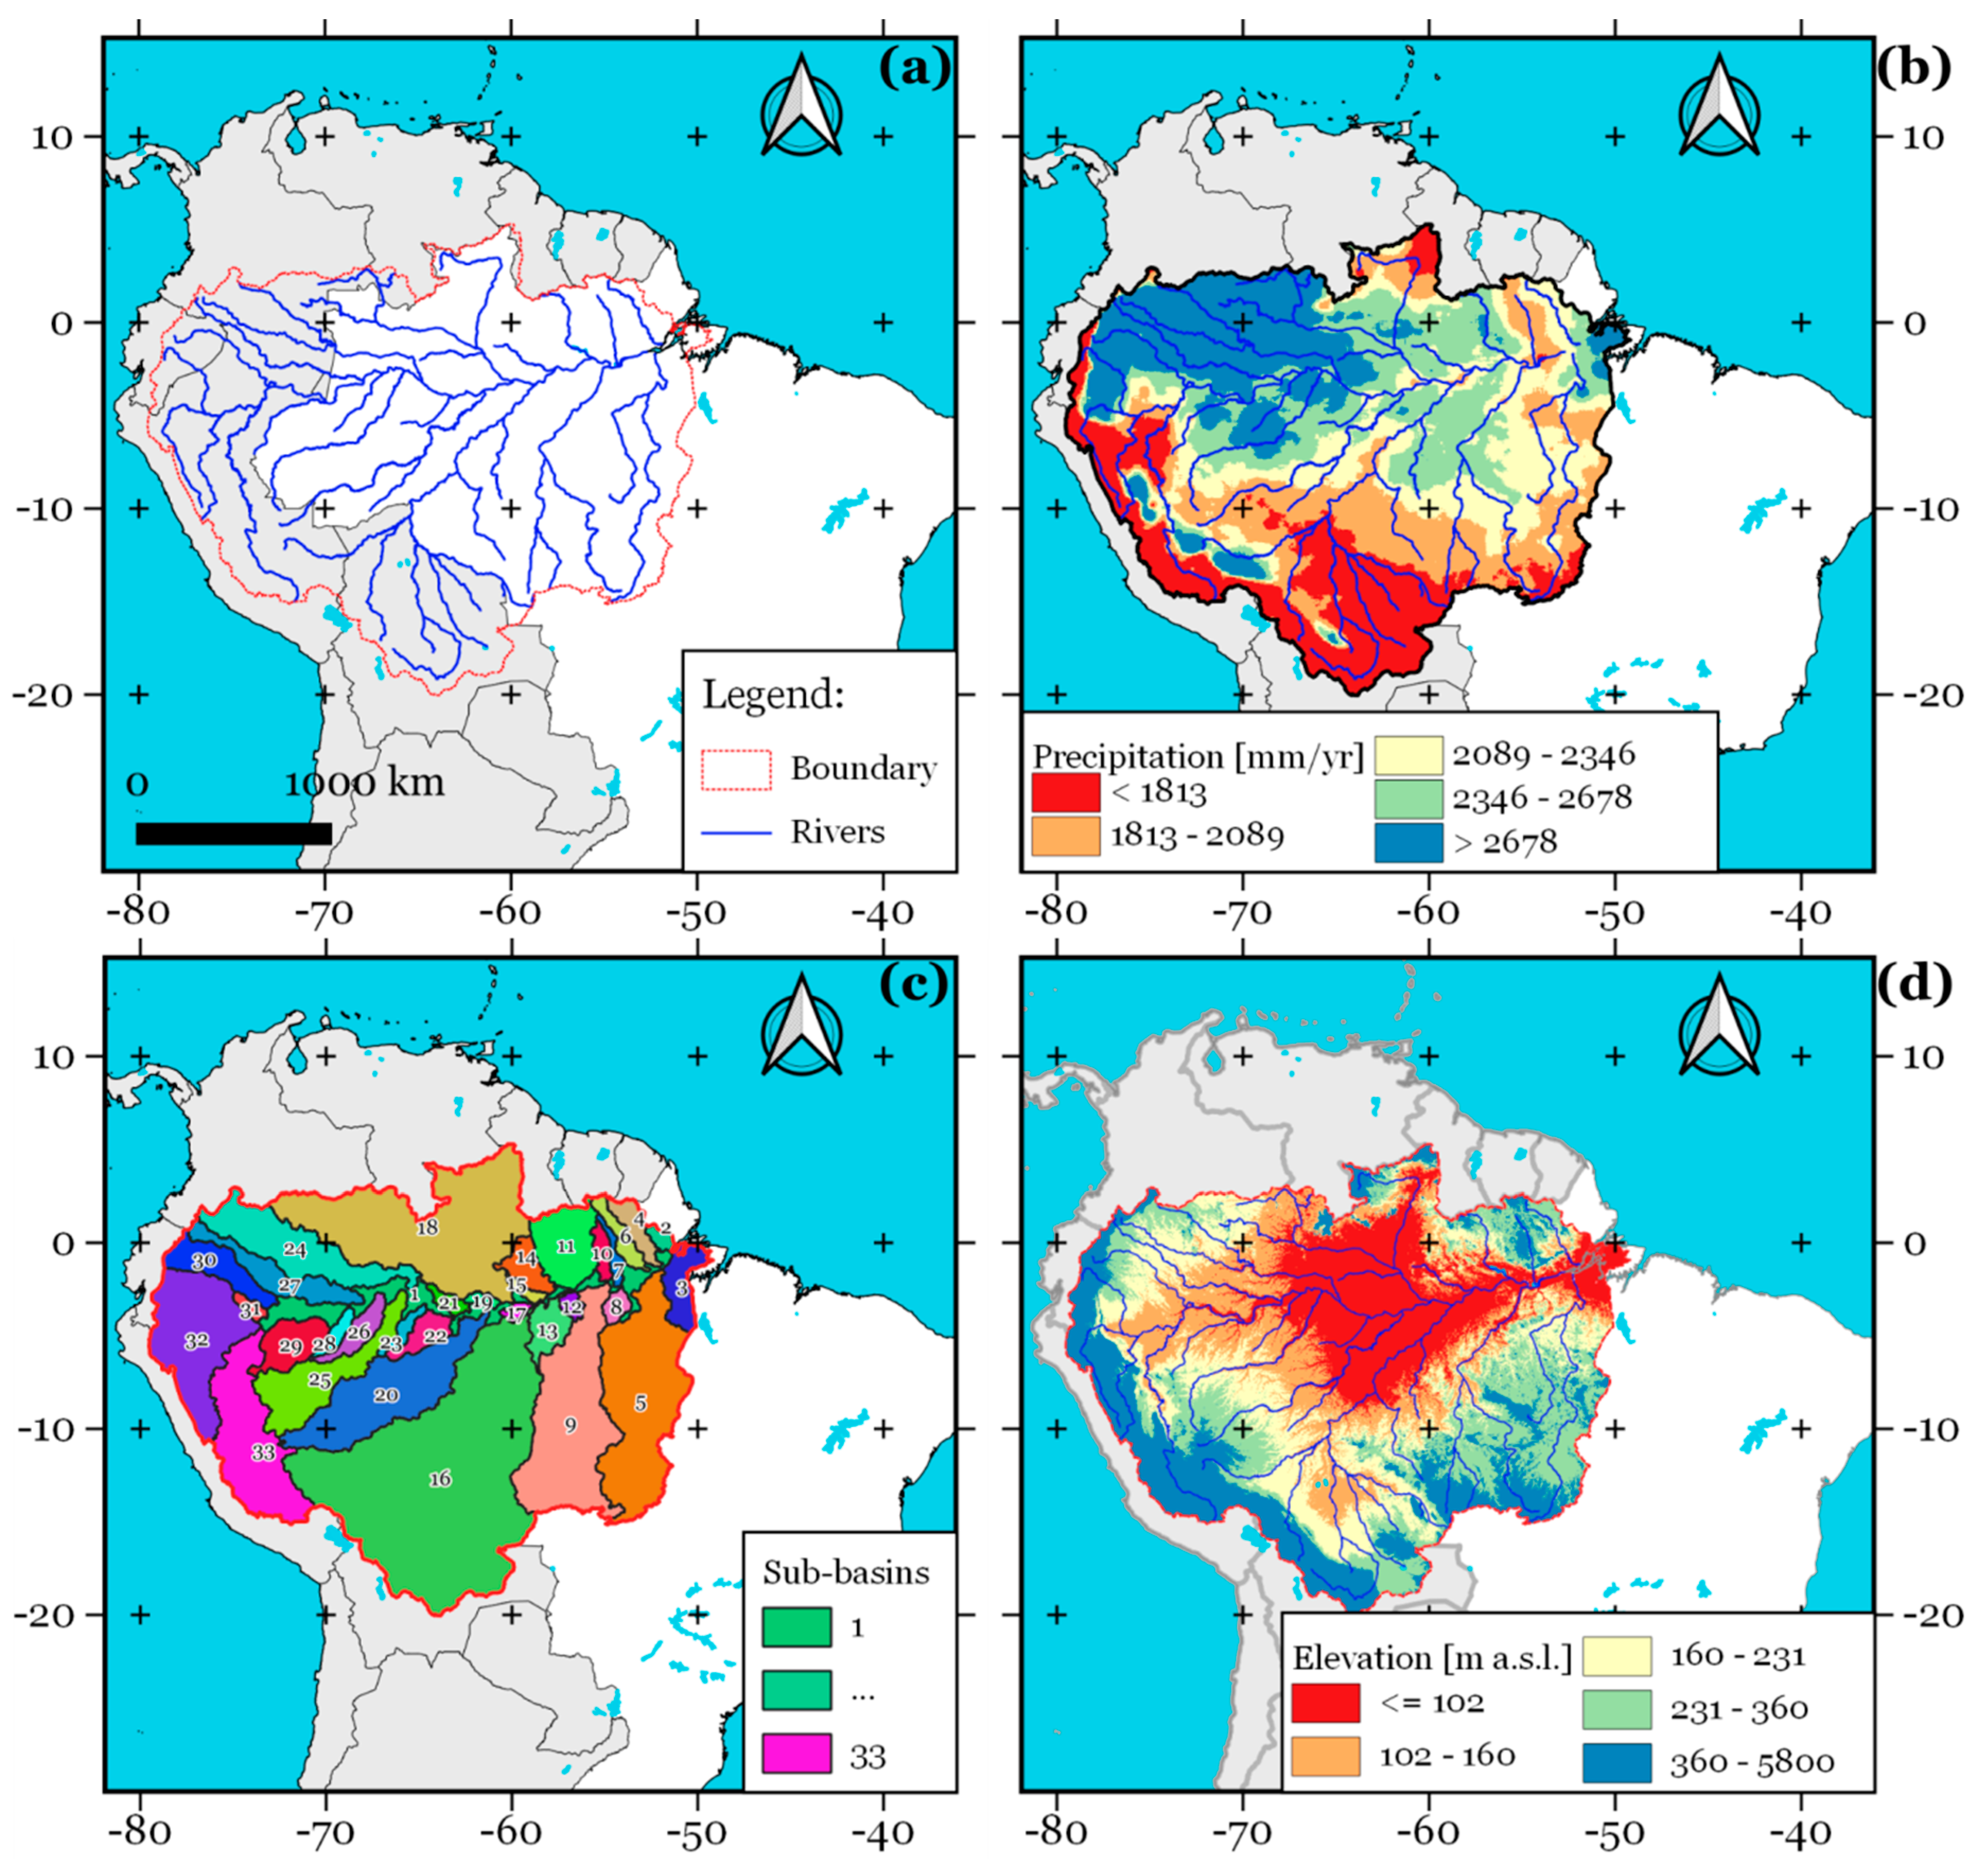
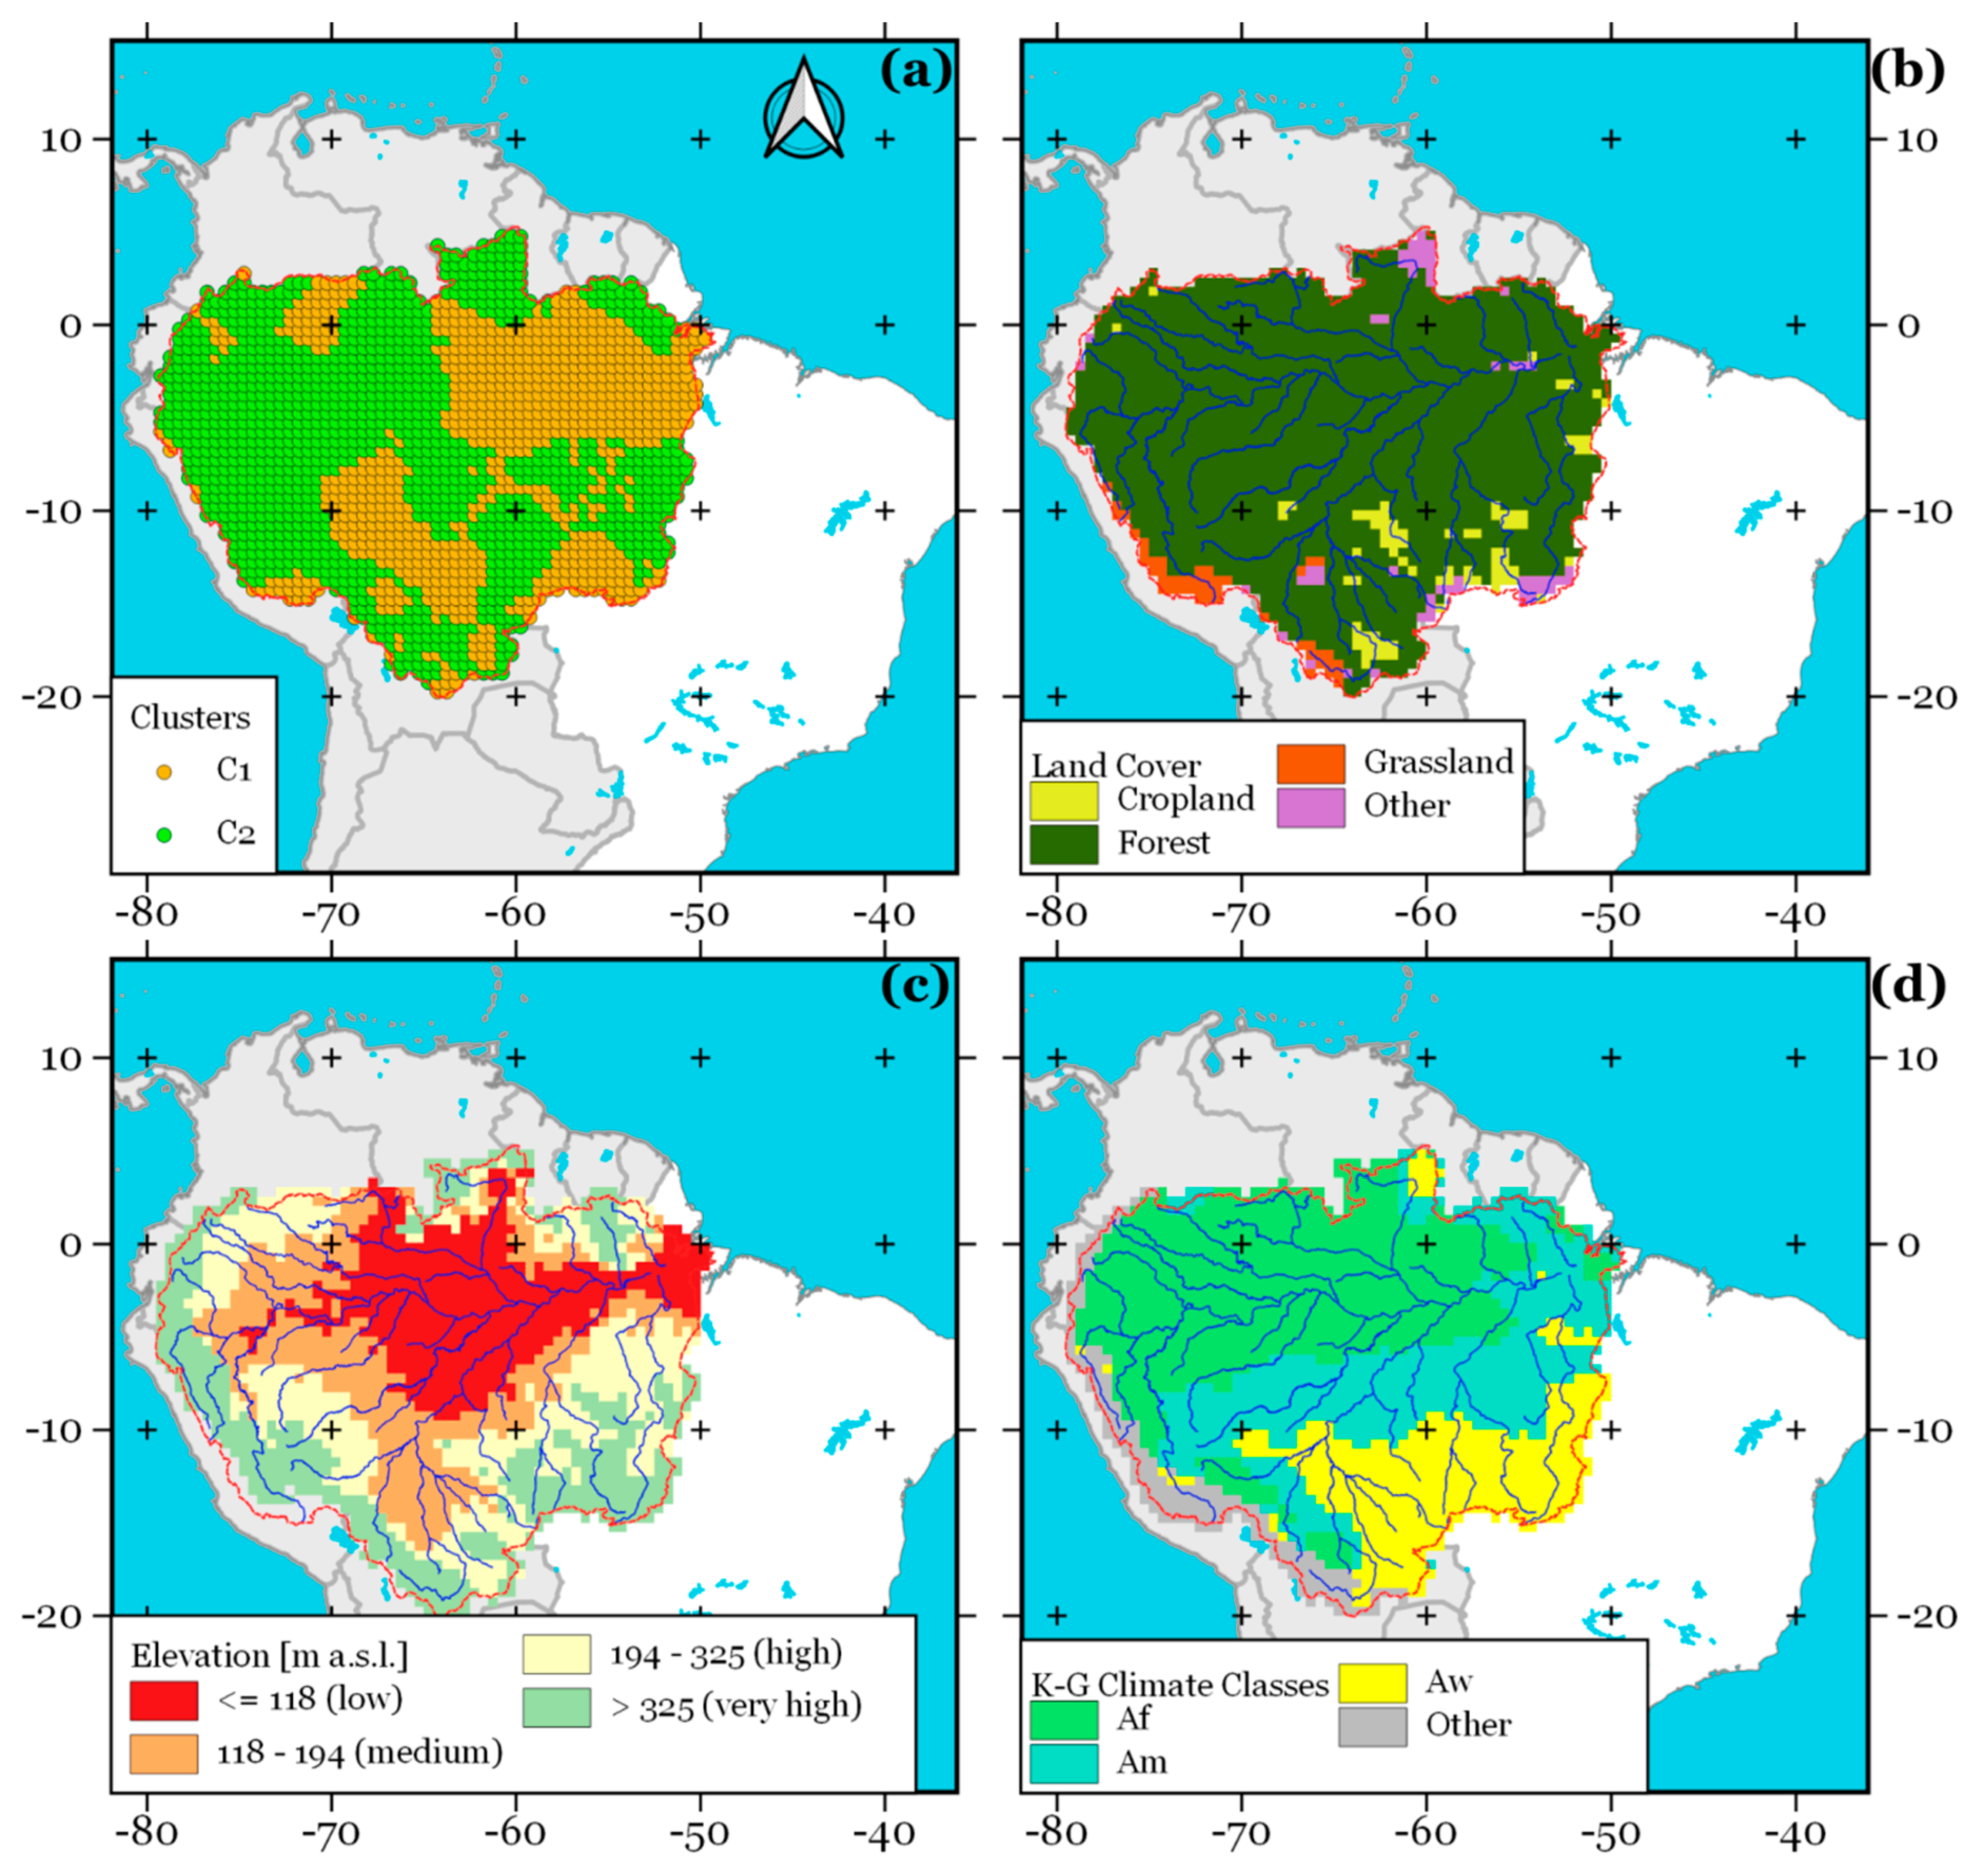
2.1. Study Area
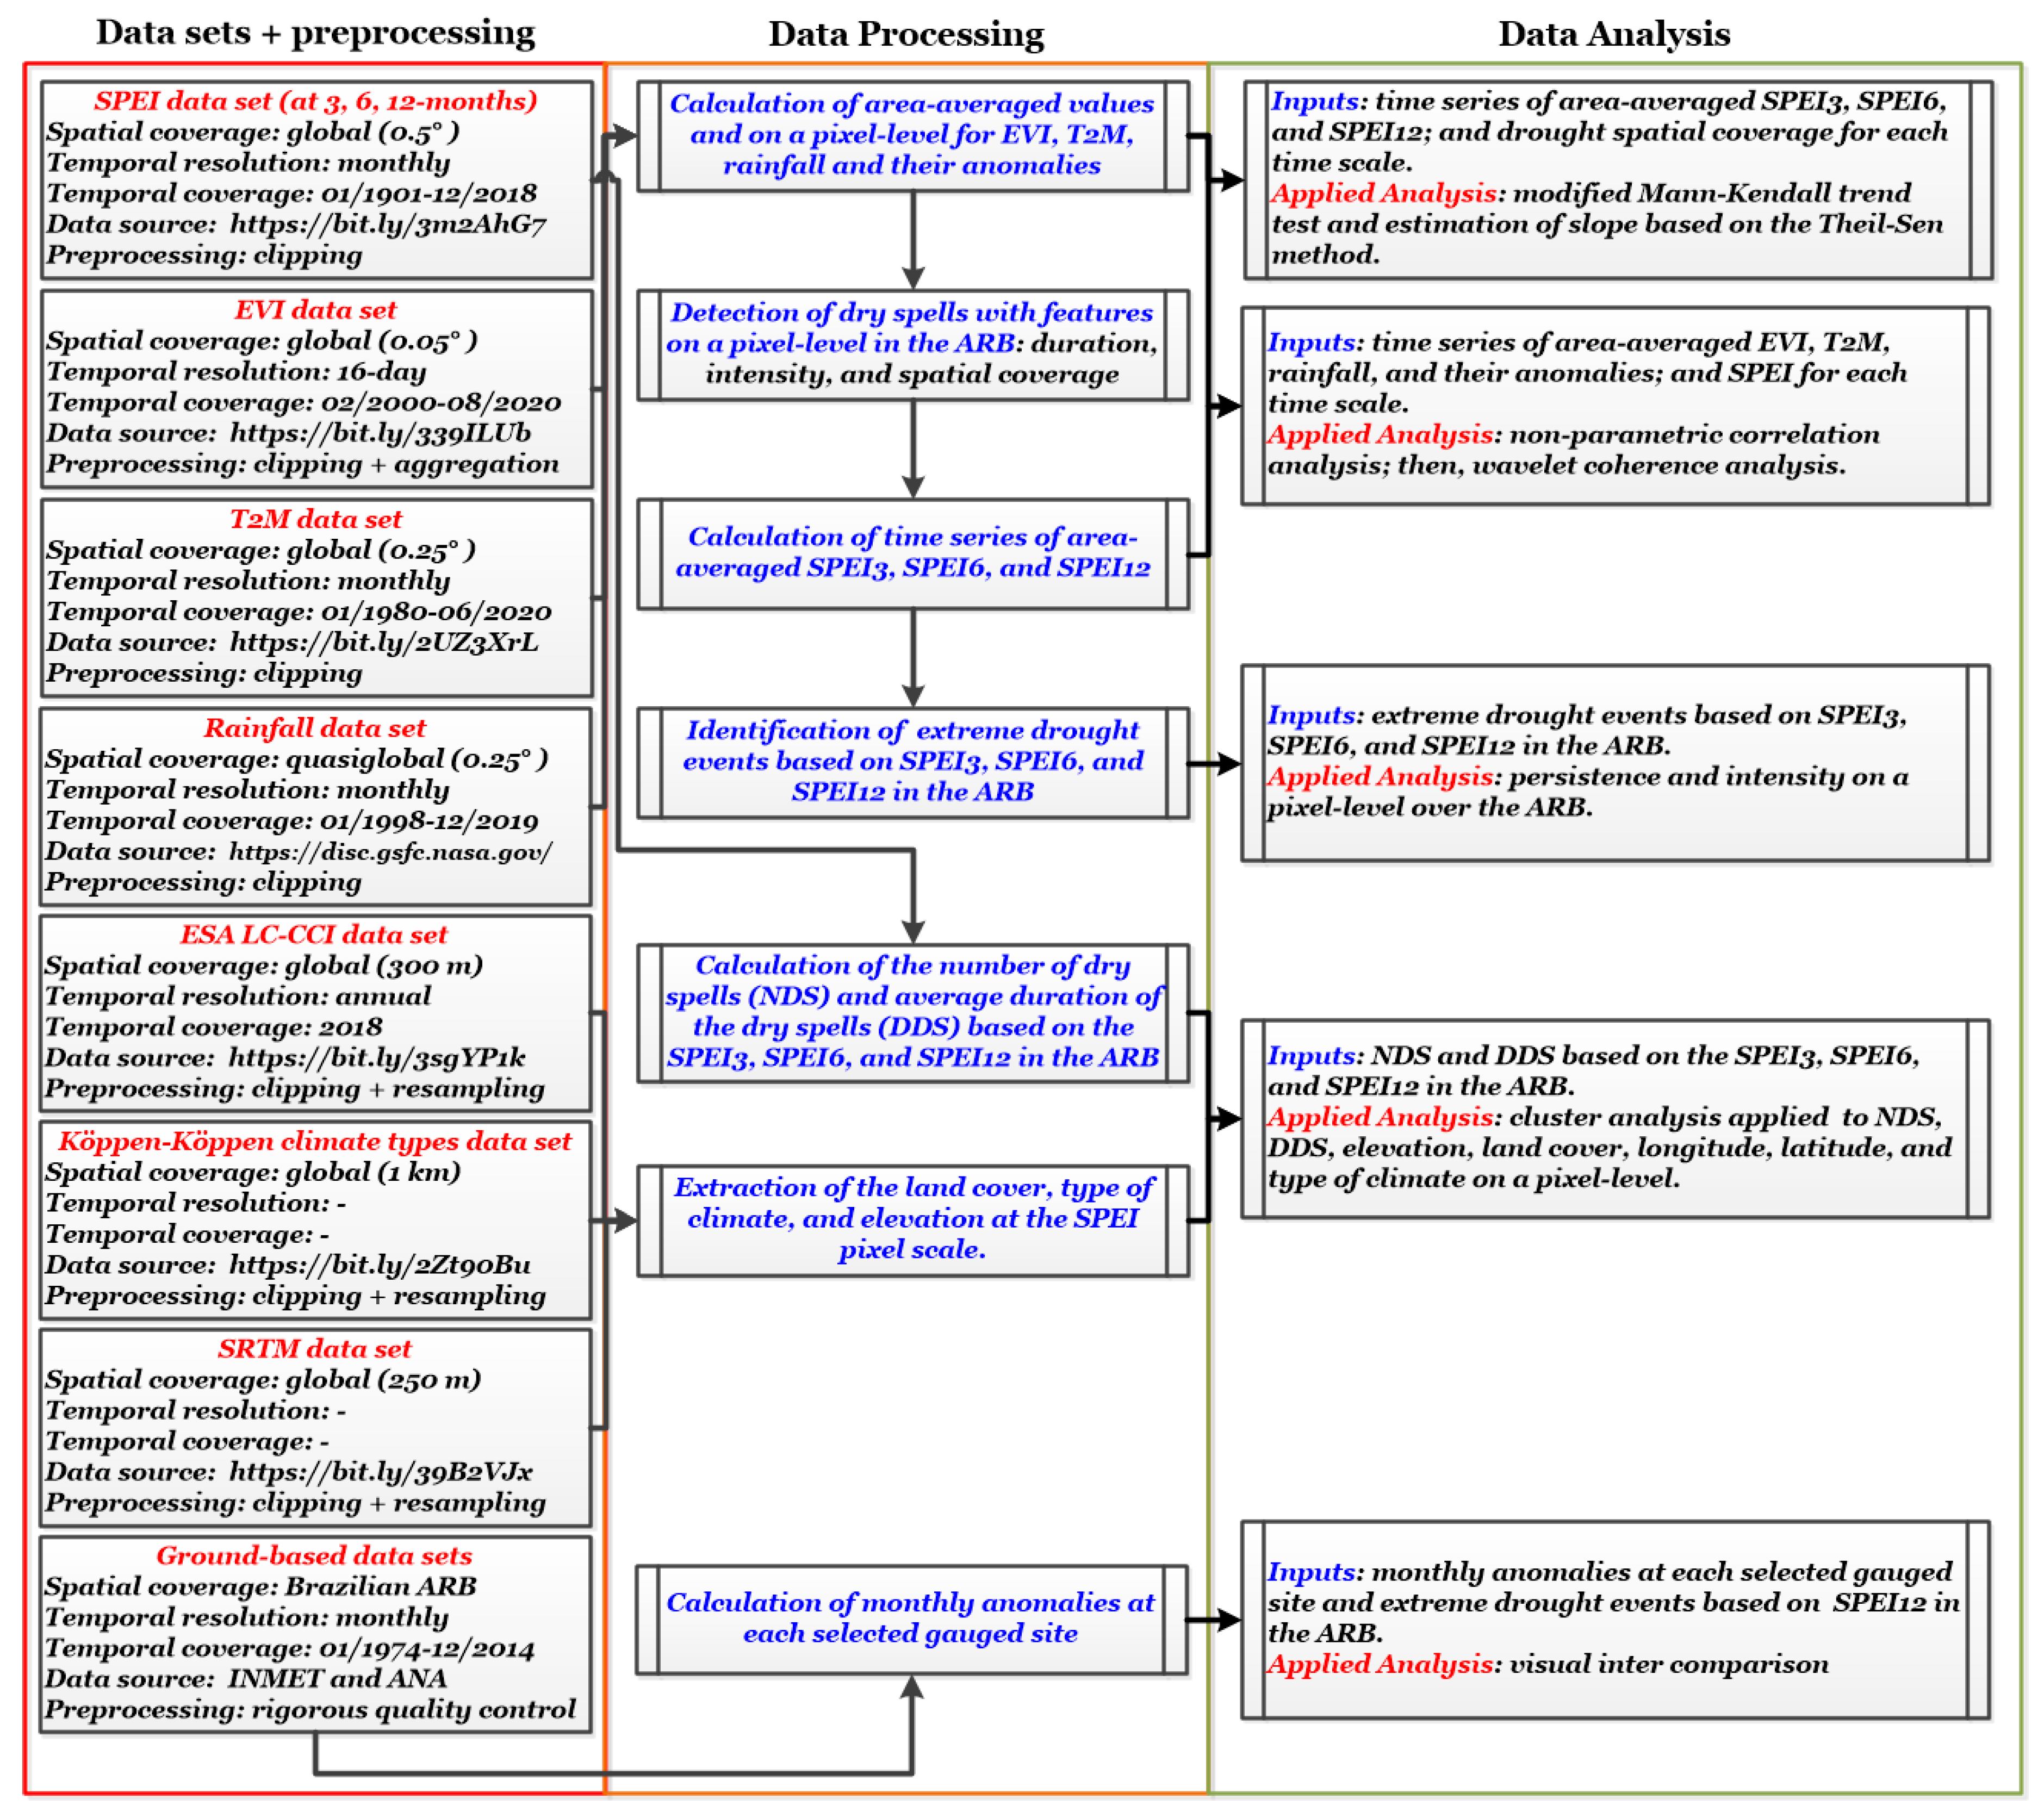
2.2. Datasets
2.2.1. Standardized Precipitation Evapotranspiration Index (SPEI)
2.2.2. Enhanced Vegetation Index (EVI)
2.2.3. Ground-Based Observations
2.2.4. Auxiliary Satellite-Based Datasets
2.3. Methodology
3. Results
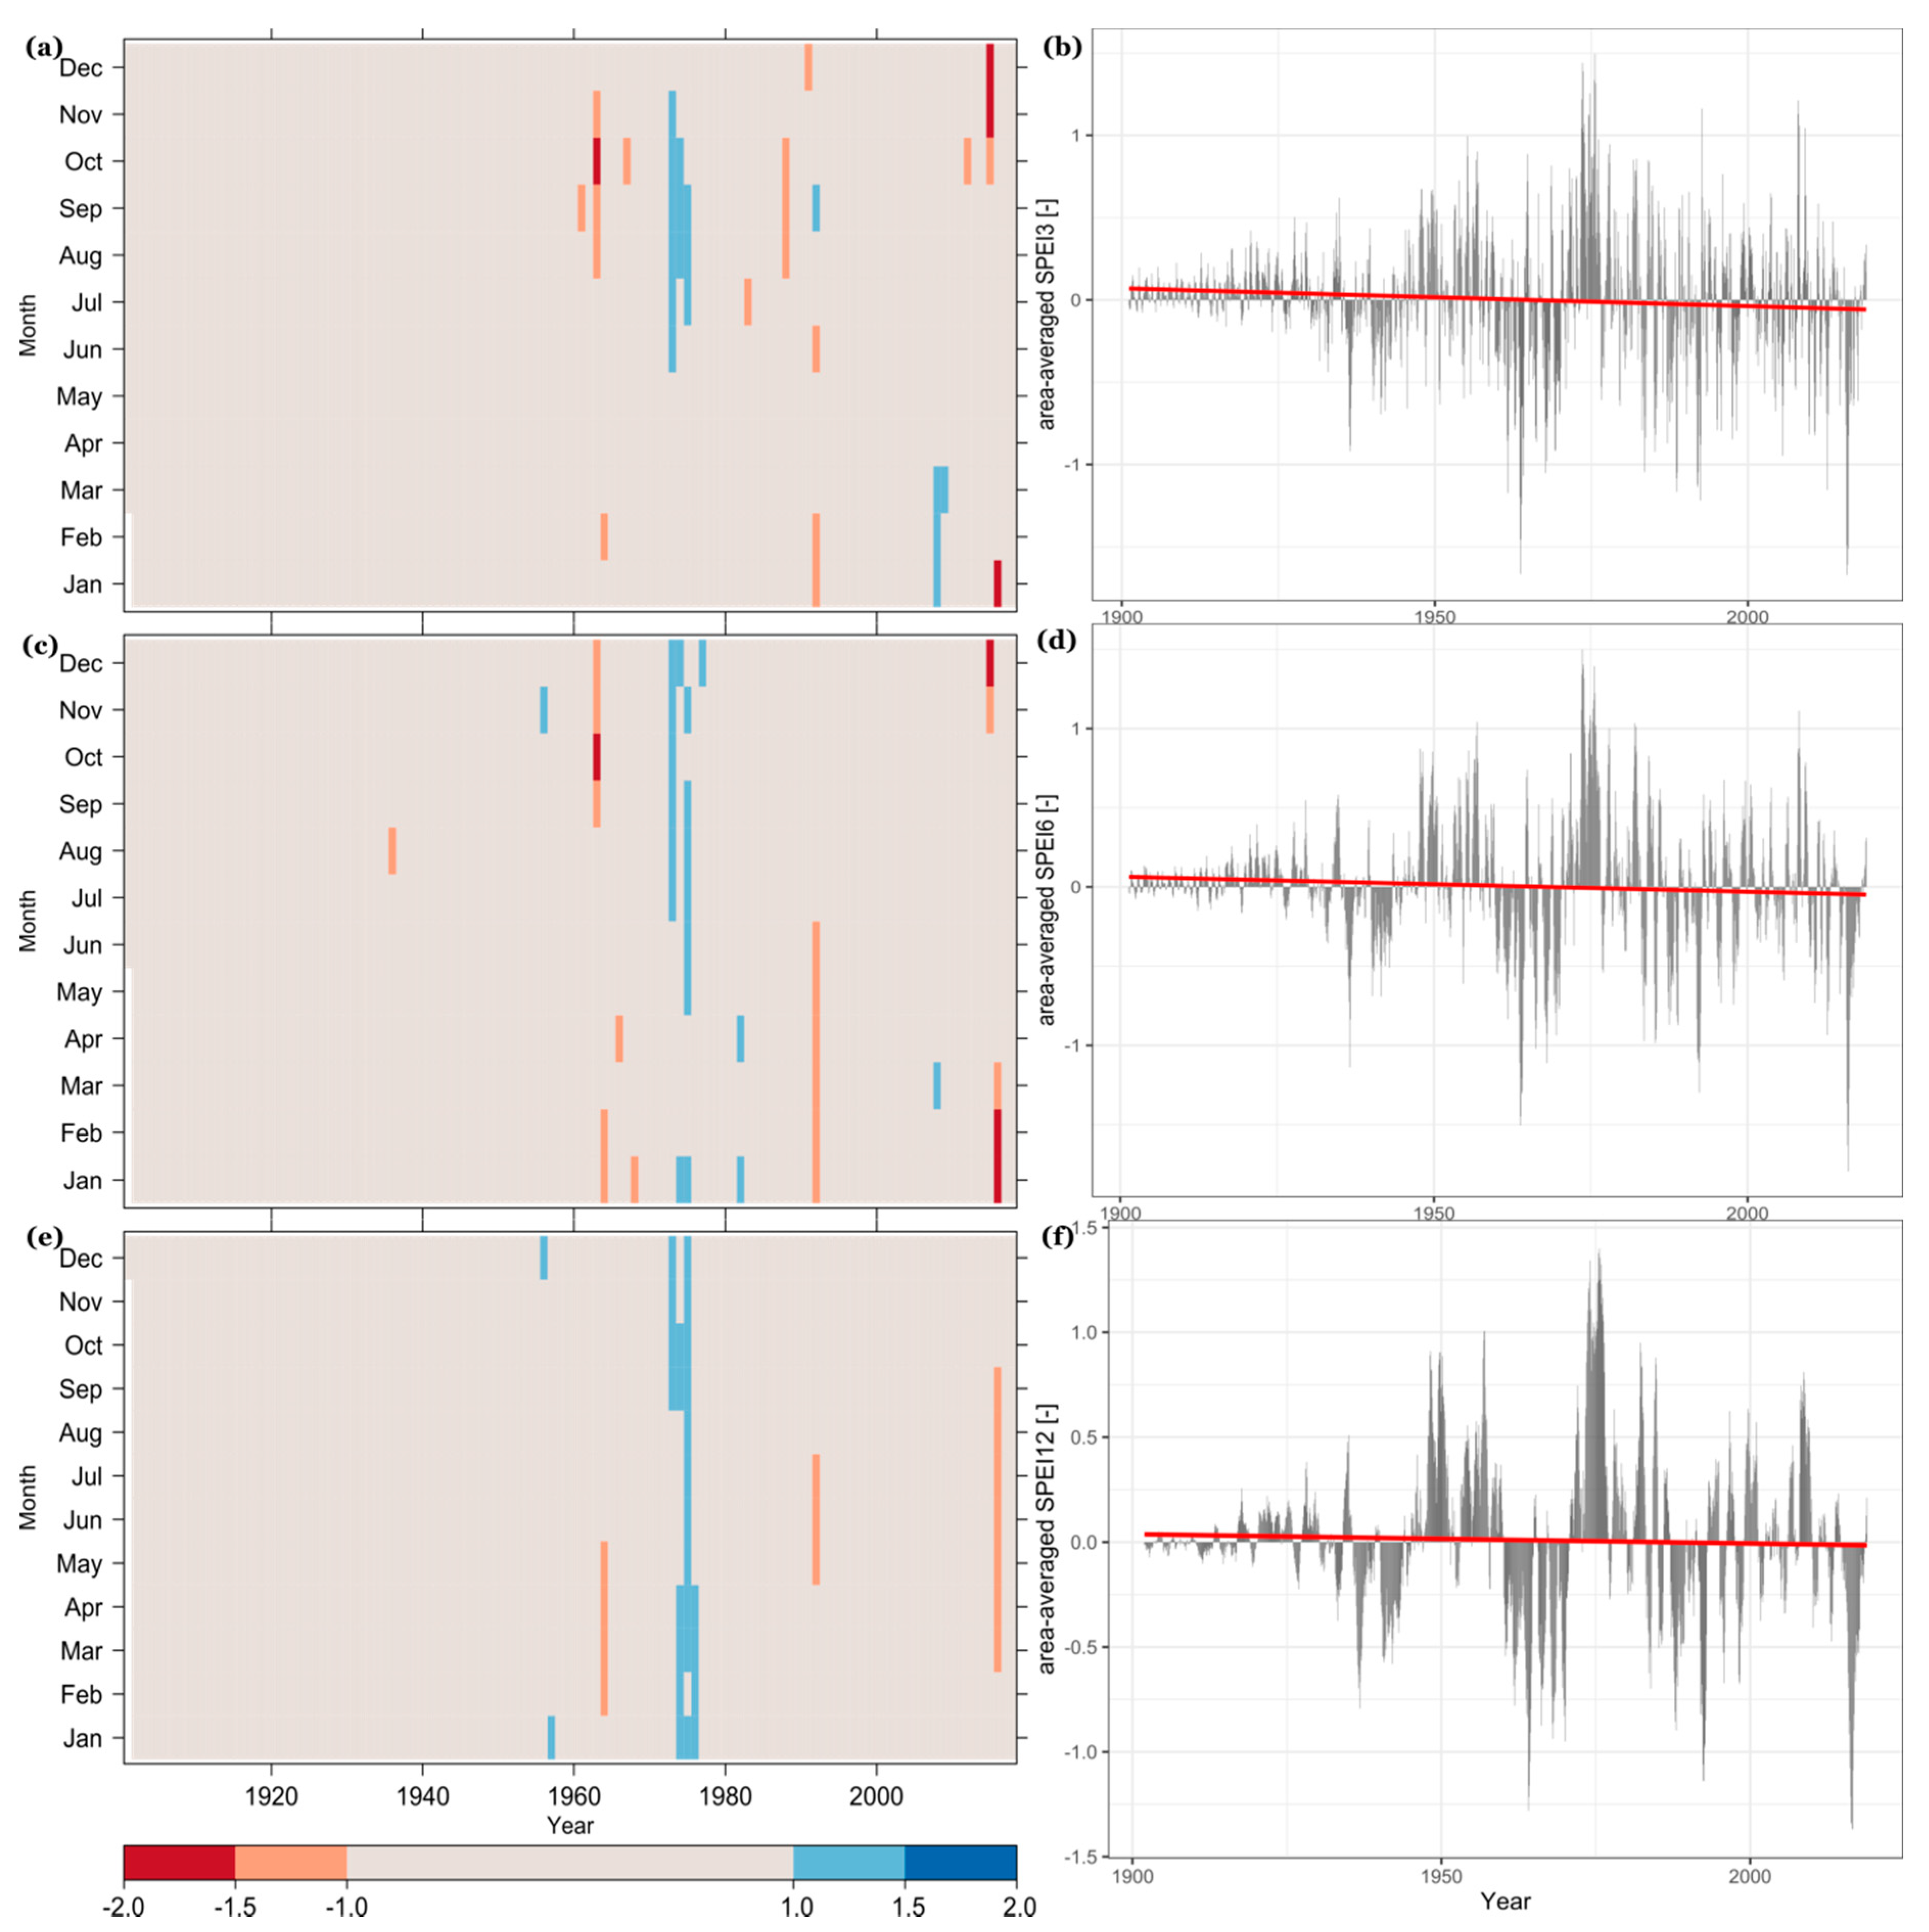
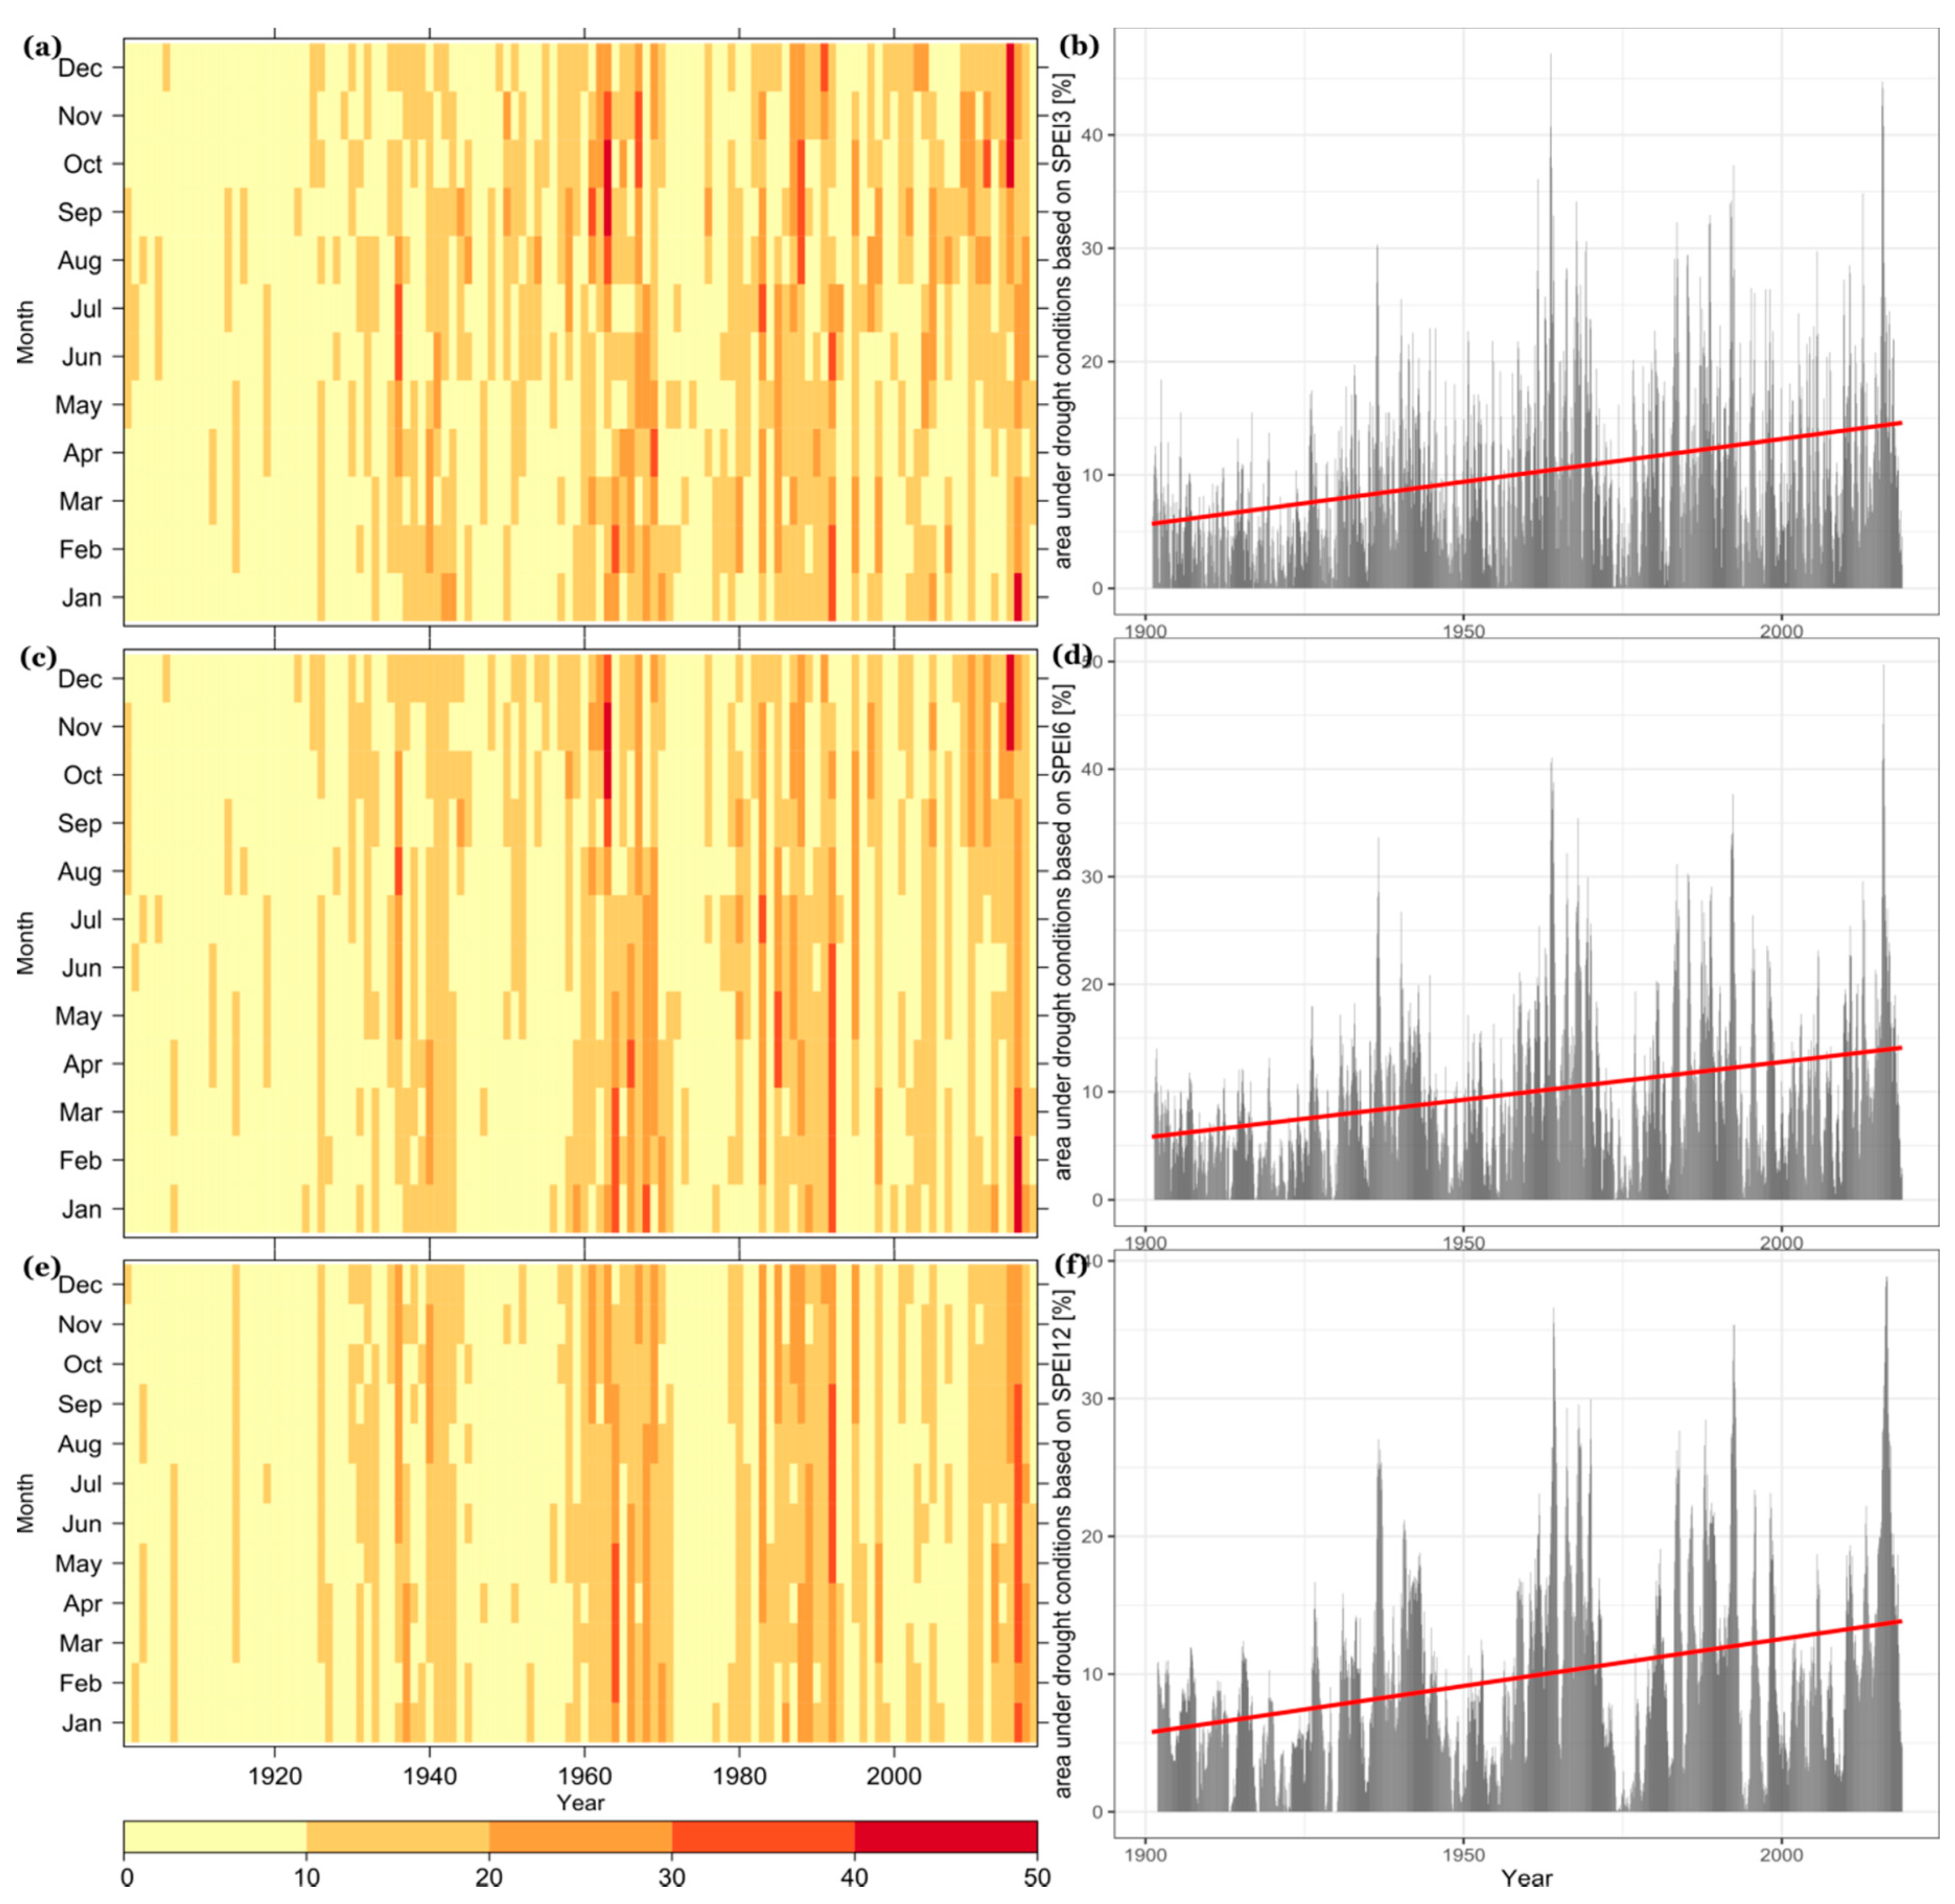
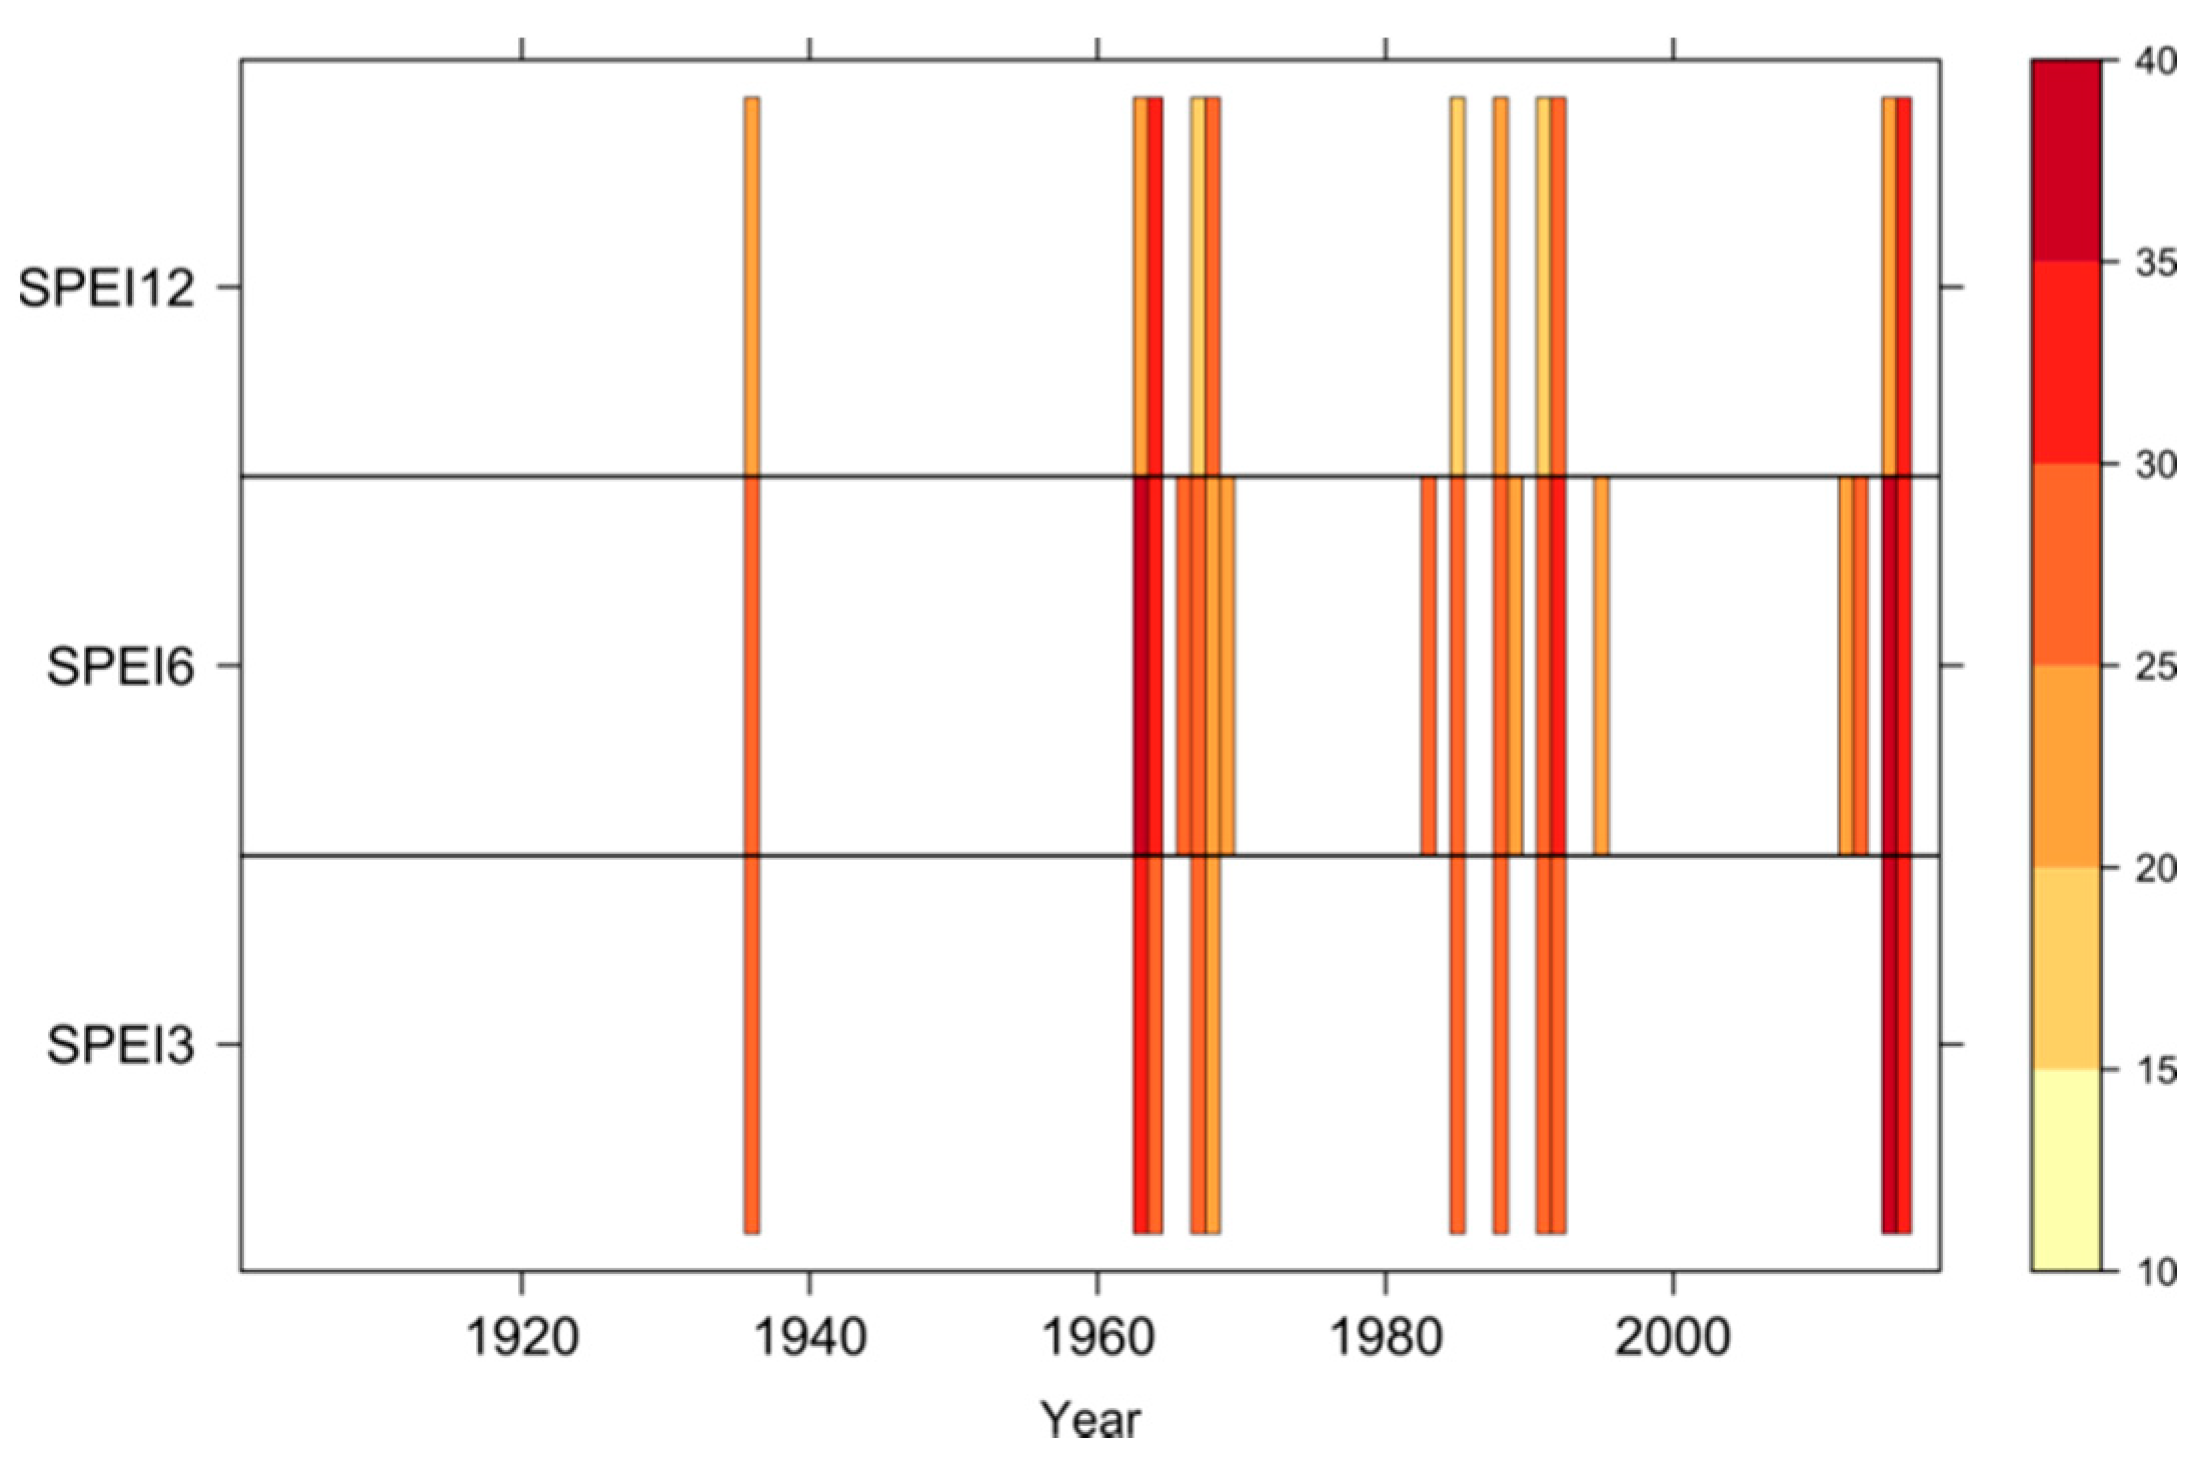
3.1. Long-Term Temporal Patterns of Drought Events in the Entire ARB
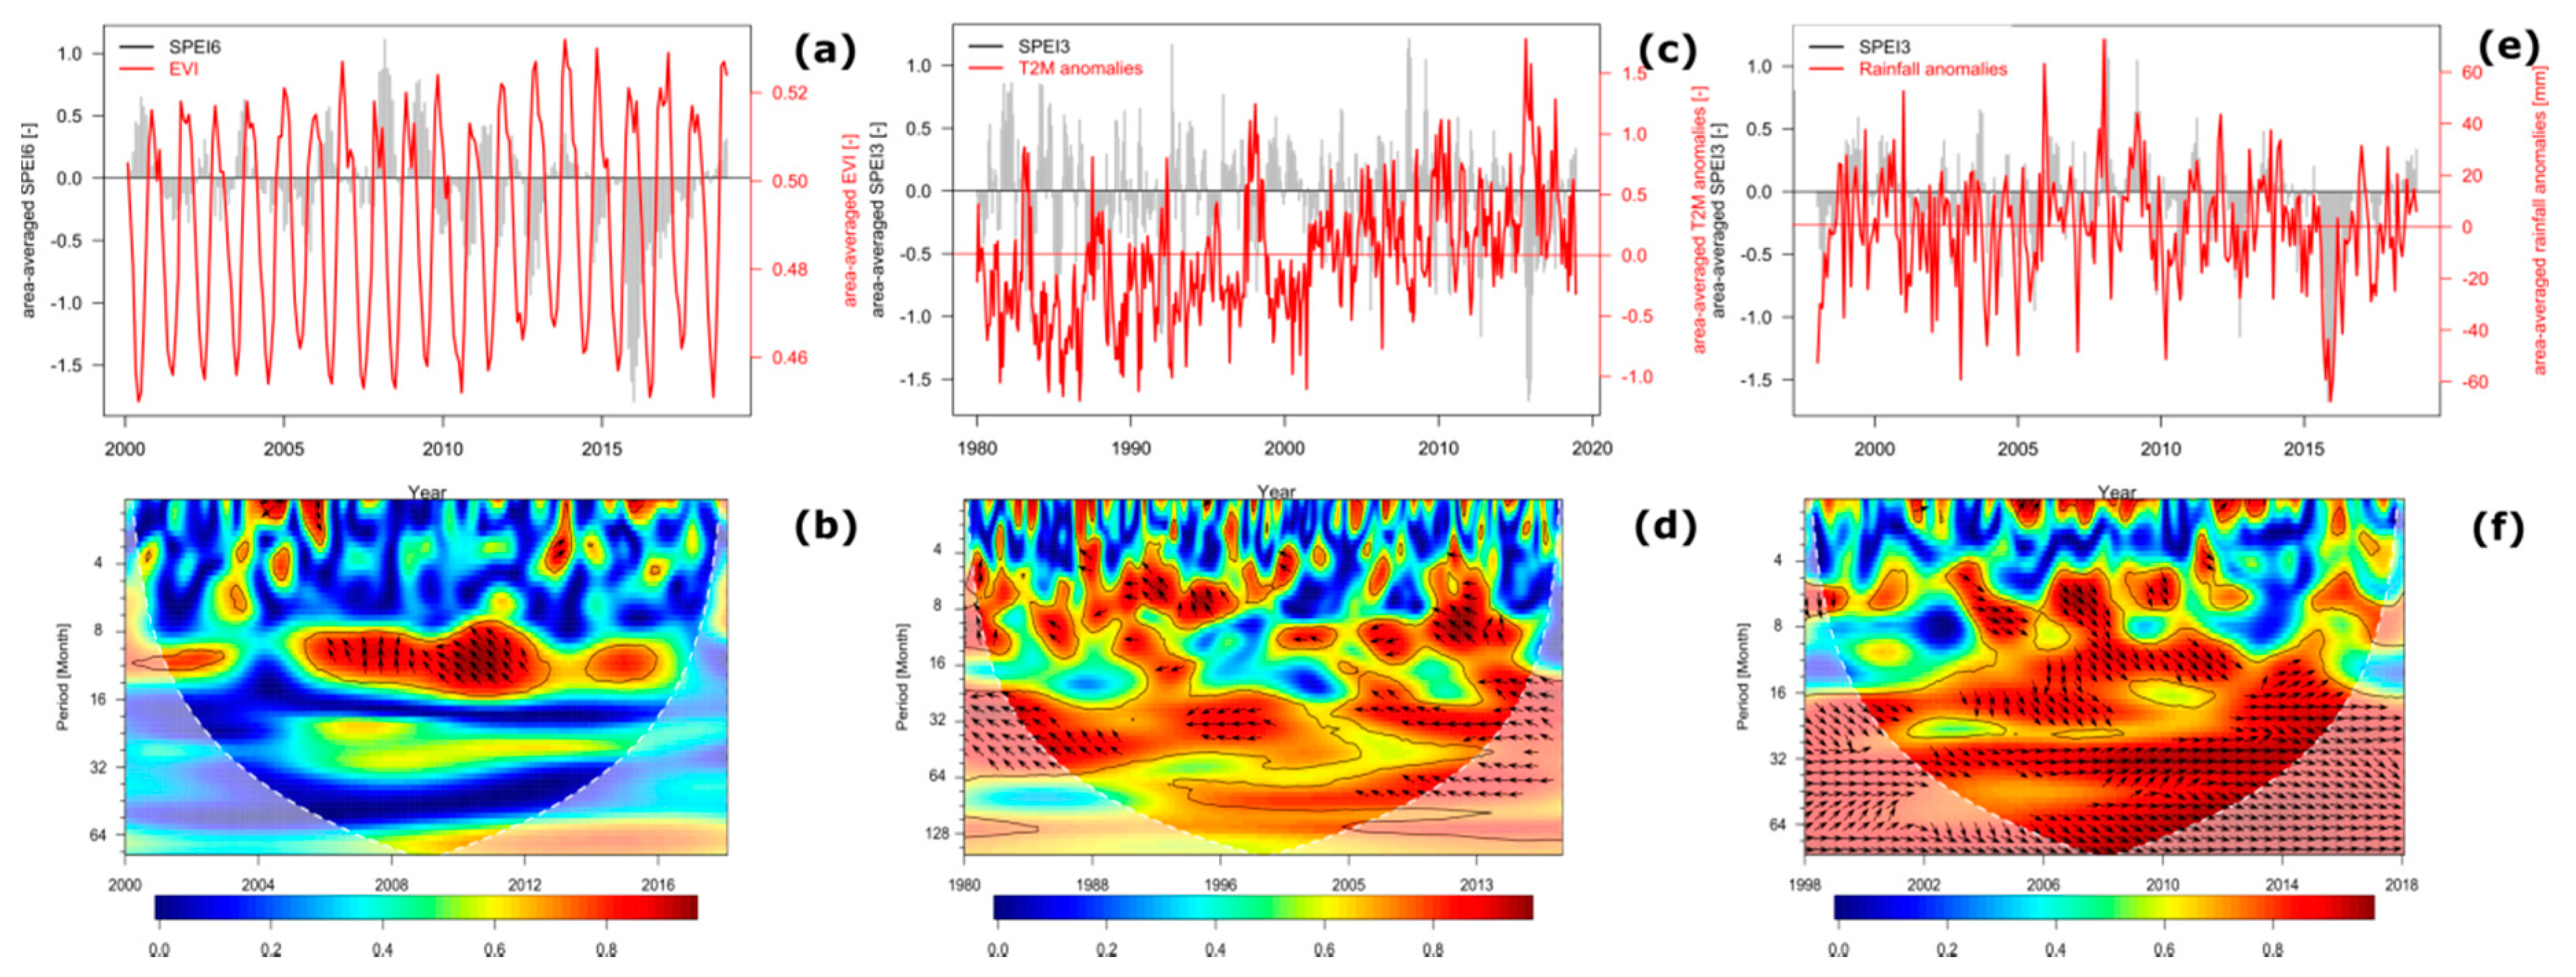
3.2. Land–Atmosphere Coupling during the more Recent Extreme Drought Events in the ARB
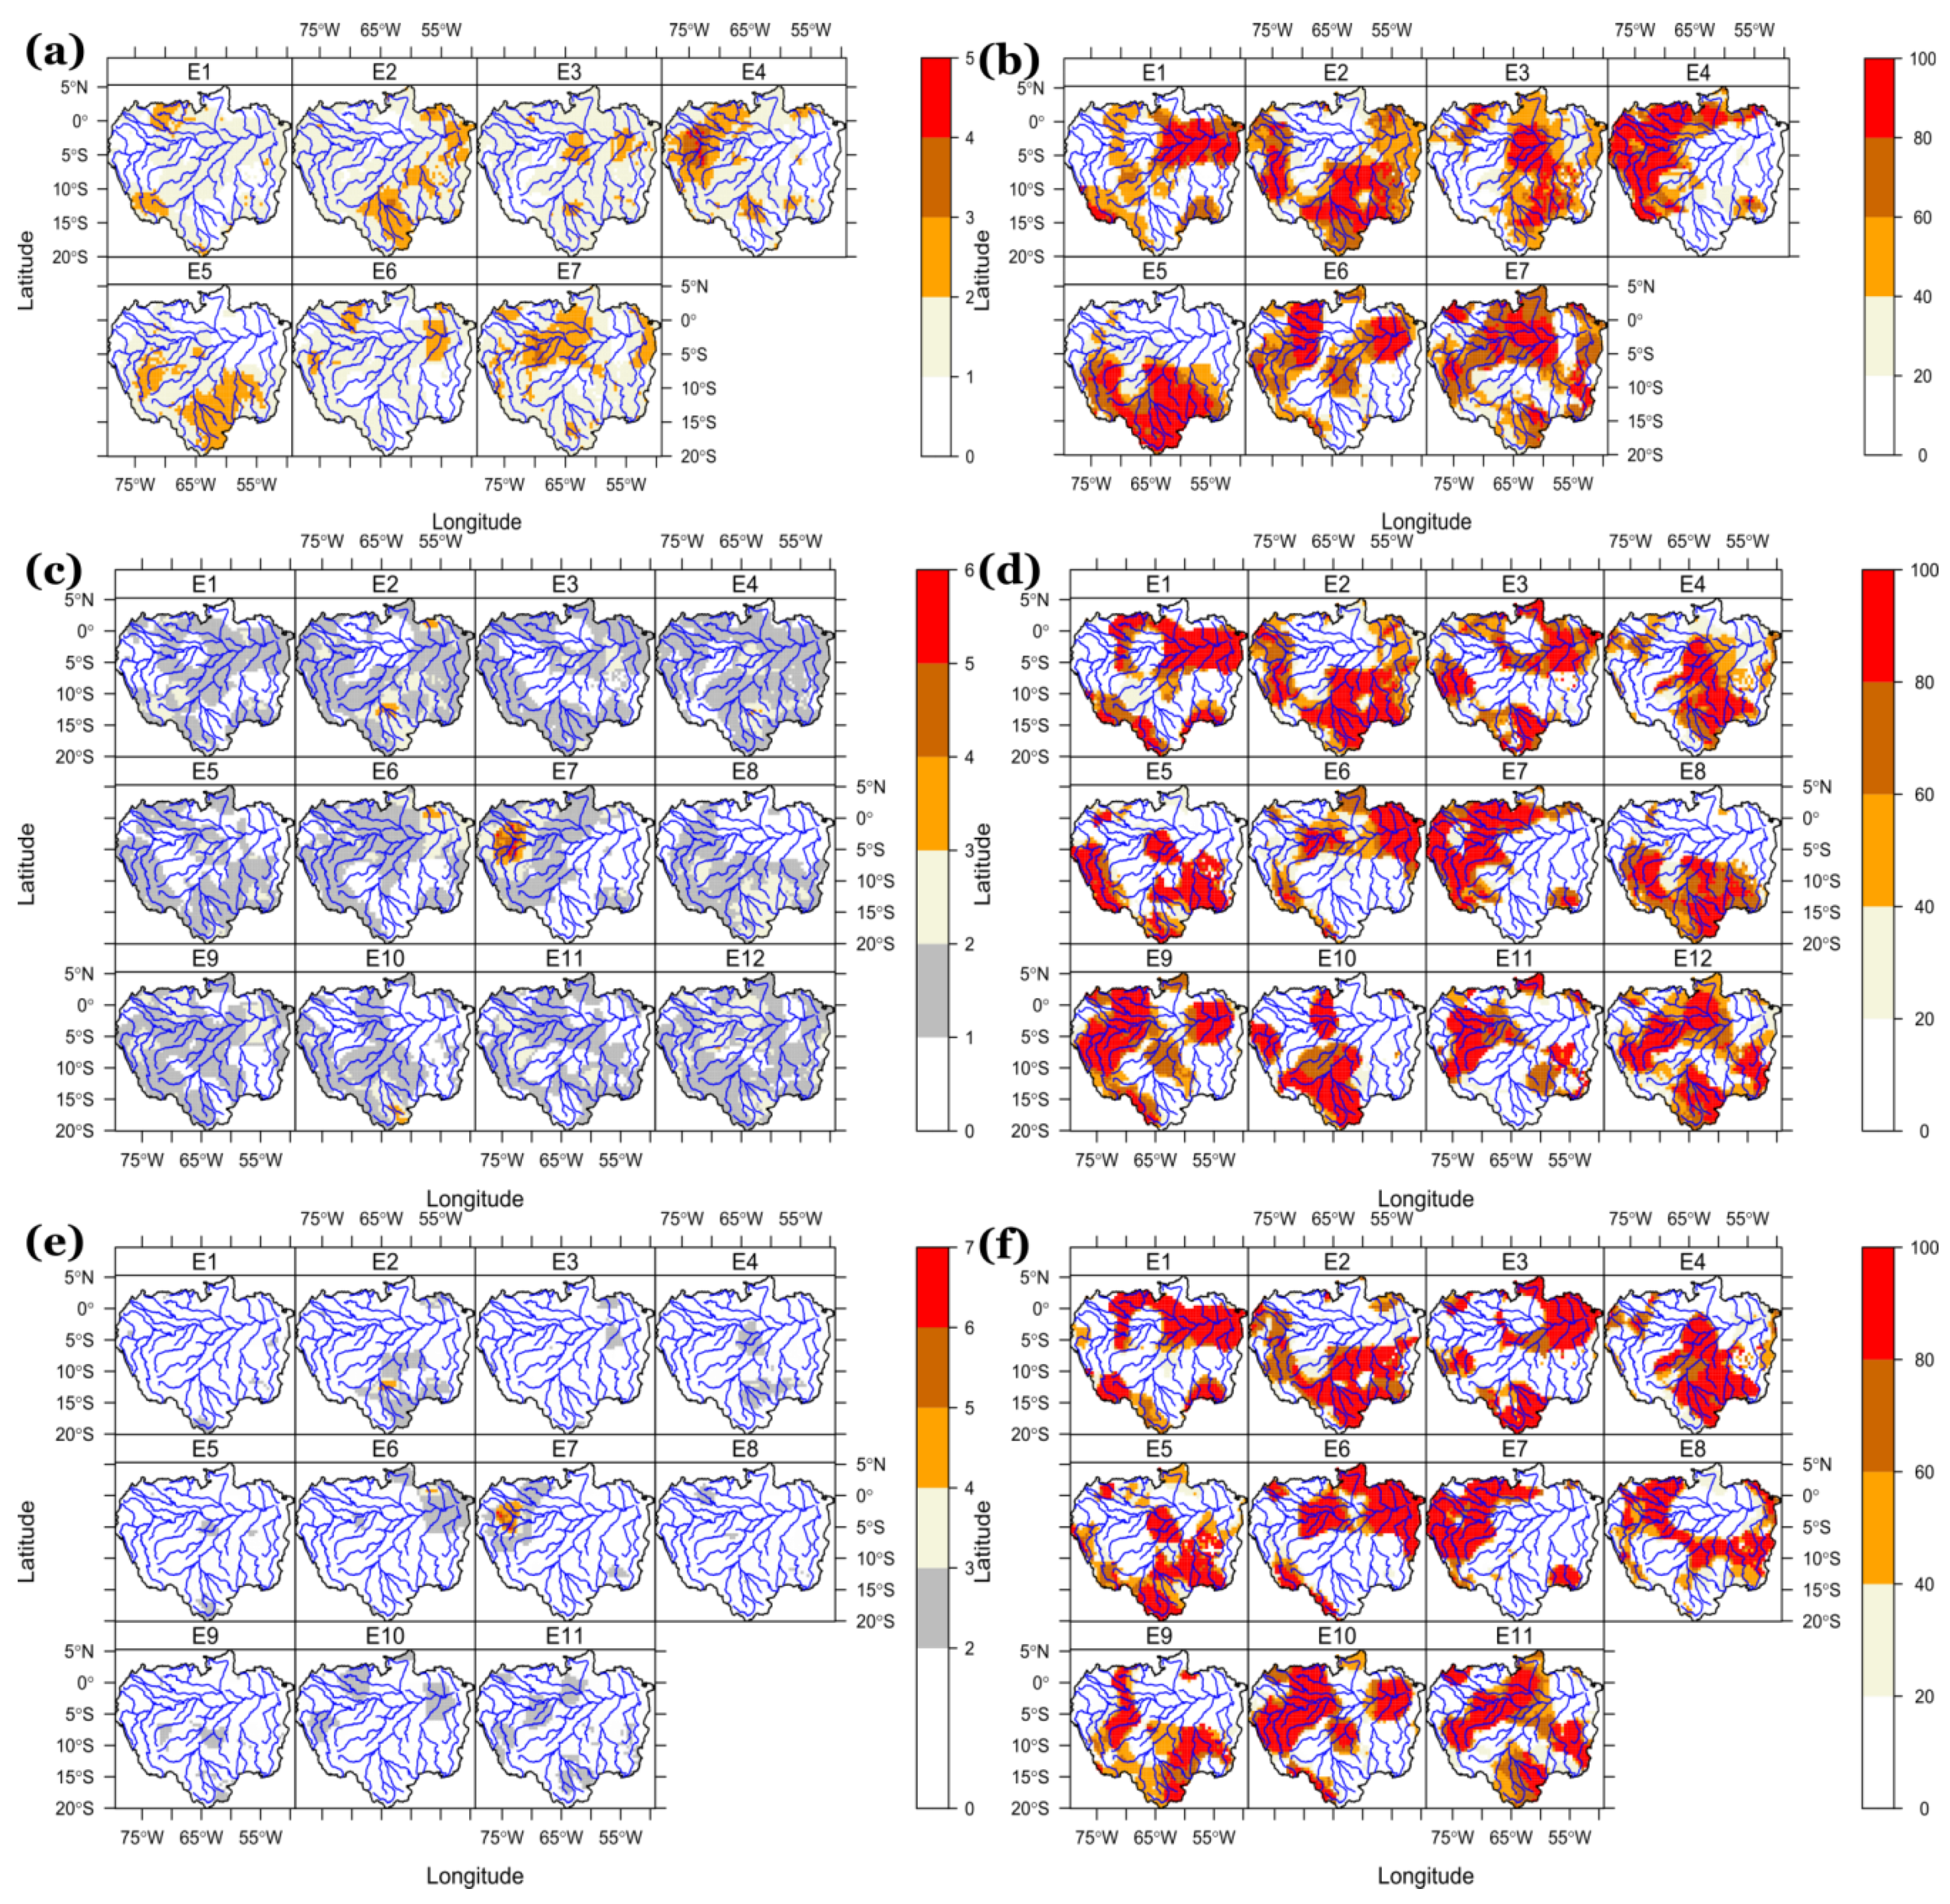
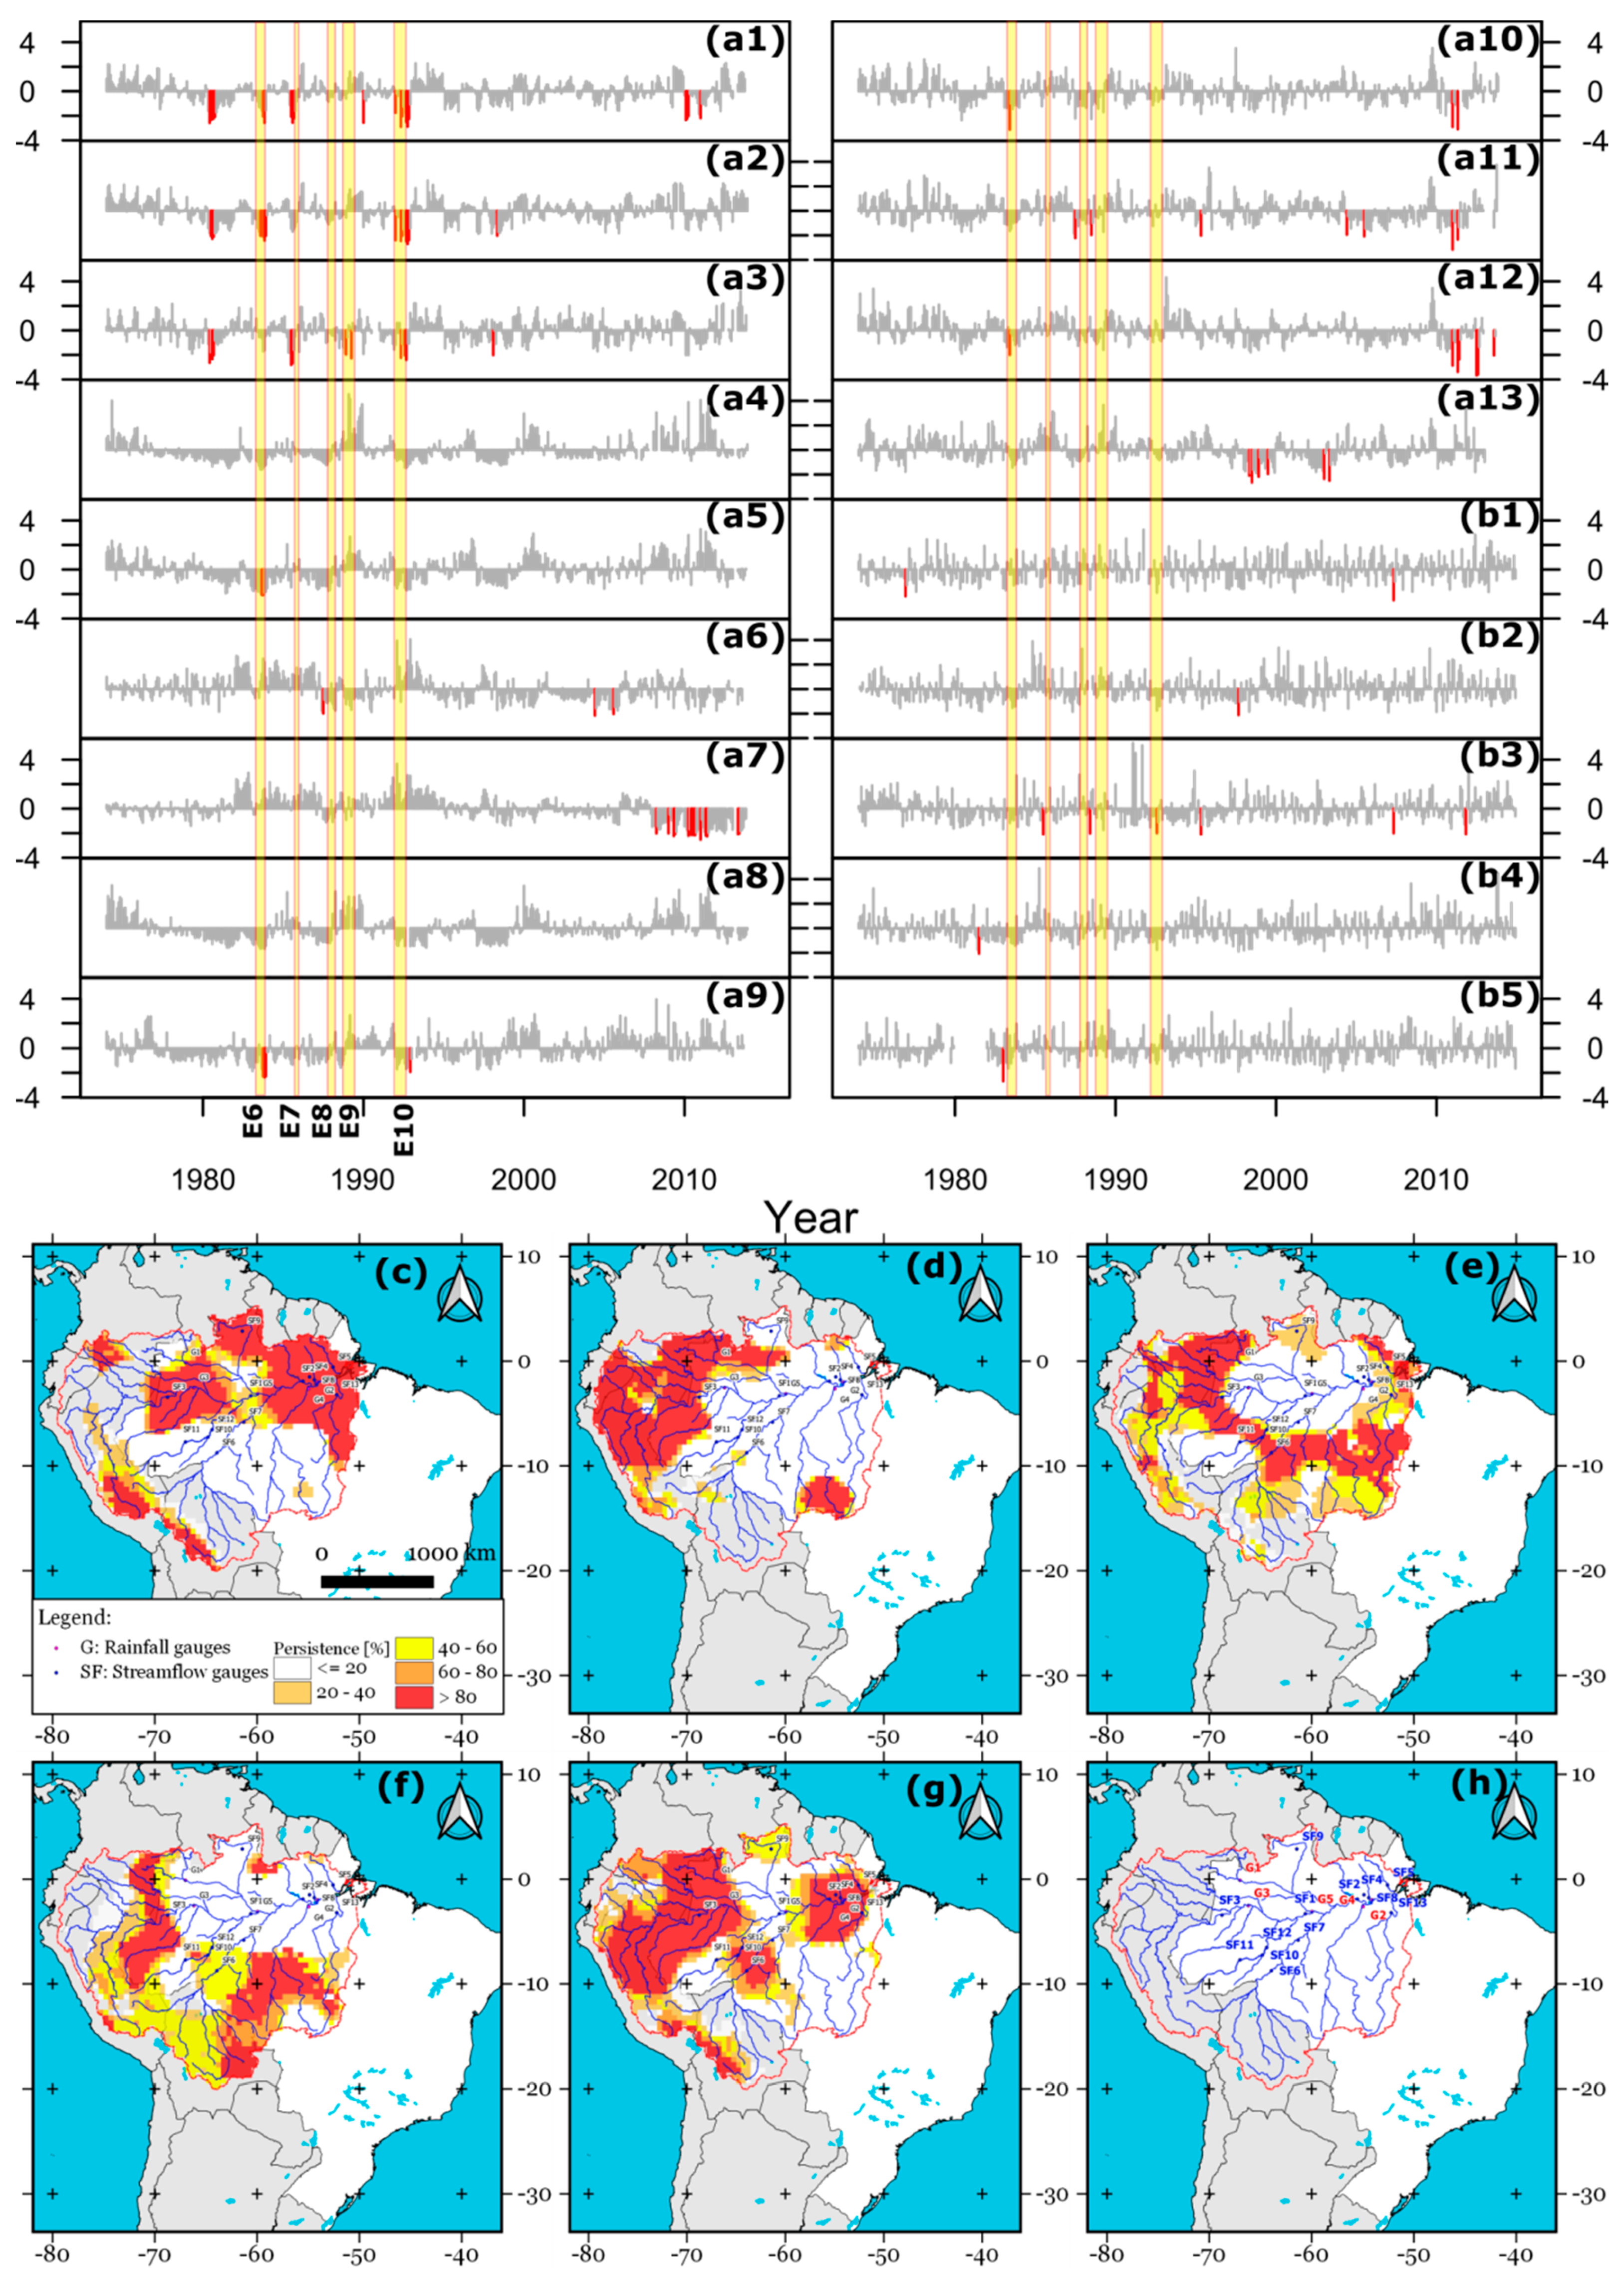
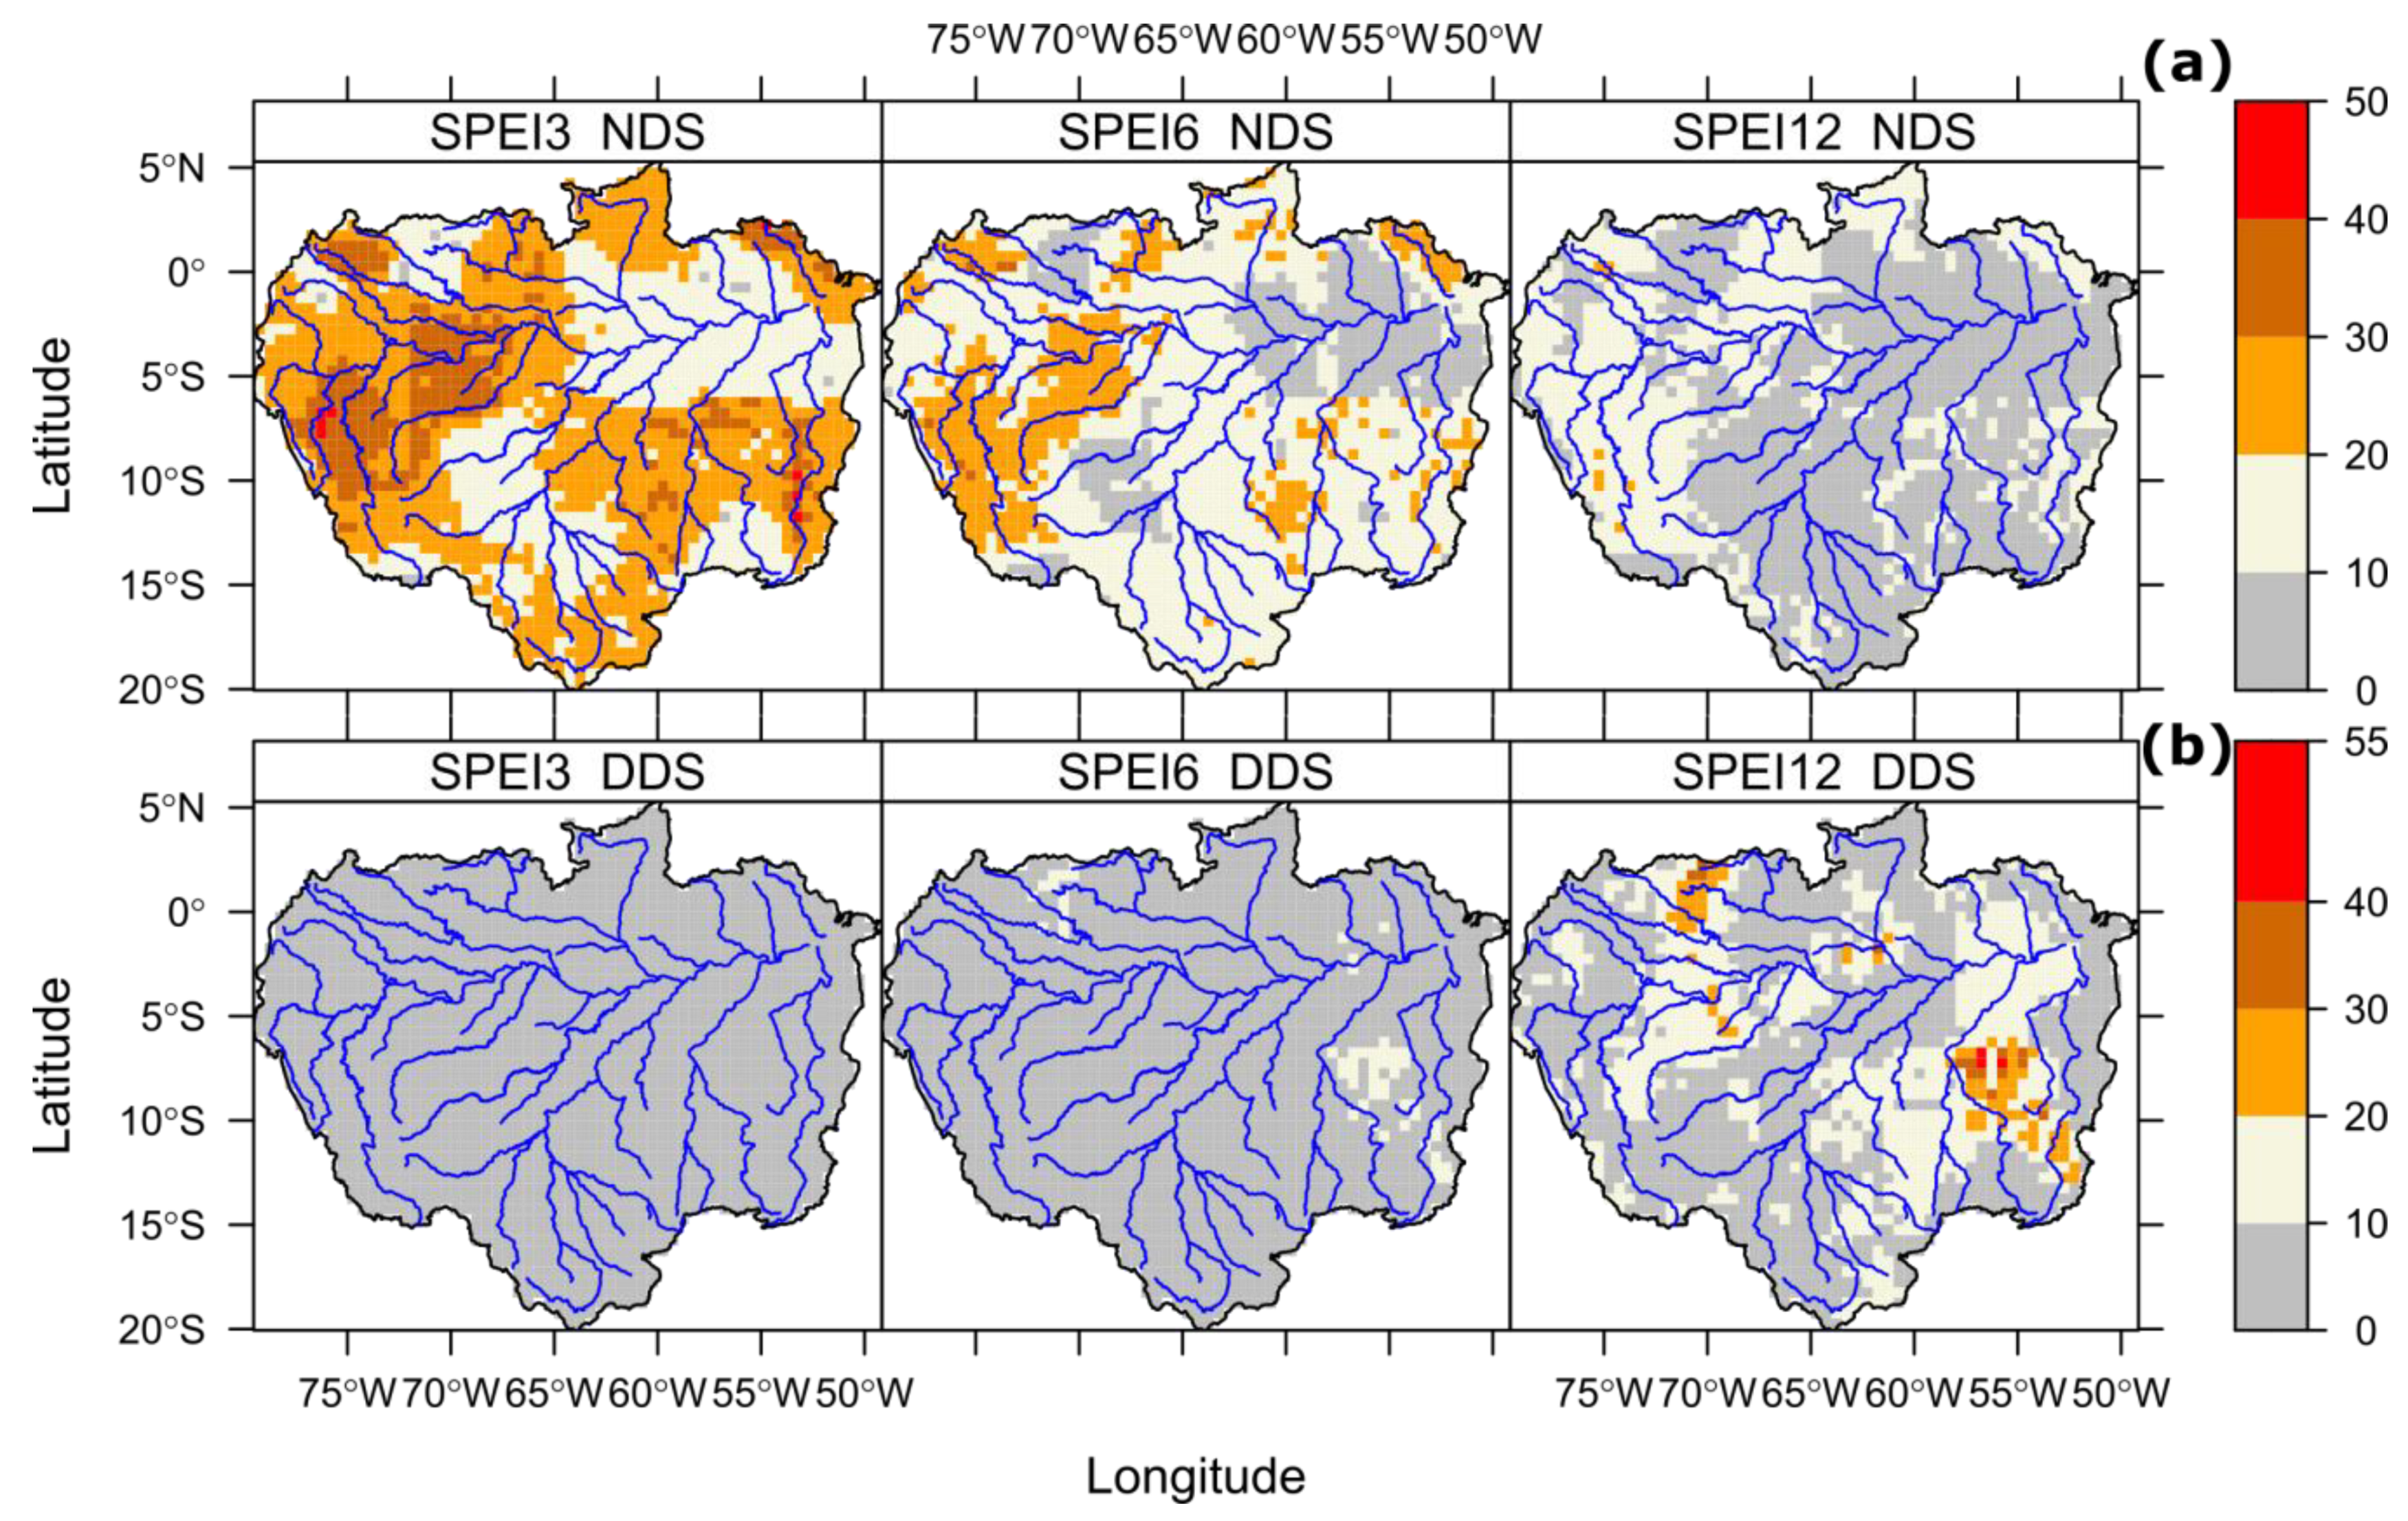
3.3. The Regions of the ARB more Prone to Suffering Drought Events
4. Discussion
5. Conclusions
- Strong drought conditions in 1964, 1992, and 2016, and wet conditions from 1973 to 1975 were observed, coinciding with different patterns of coupling between the ENSO and the PDO, AMO, and MJO.
- A weak long-term drying trend was observed, but there was no evidence of a trend in extreme drought events in terms of spatial coverage, intensity, and duration for the period 1901–2018. A progressive transition from wetter-than-normal conditions to drier-than-normal conditions was evident since the 1970s, which was clearly reflected by a strong coupling between the air temperature anomalies and the drought conditions.
- The more spatially extensive and temporally persistent drought events tended to show lower intensities than those observed in other years, whereas more severe droughts were characterized by a moderate spatial concentration.
- The vegetation greenness (dominated by forest) exhibited an asynchronous connection with the atmospheric dryness, though both tend to be nearly in phase under prolonged warm and dry conditions.
- A high recurrence of short-term and long-term drought events were observed on the sub-basins Ucayali, Japurá-Caquetá, Jari, Jutaí, Marañón, and Xingu of the ARB in recent years, which have important implications on key economic sectors, such as rainfed agricultural and hydropower production.
Supplementary Materials
Author Contributions
Funding
Institutional Review Board Statement
Informed Consent Statement
Data Availability Statement
Acknowledgments
Conflicts of Interest
References
- da Paca, V.H.M.; Espinoza-Dávalos, G.; Moreira, D.; Comair, G. Variability of Trends in Precipitation across the Amazon River Basin Determined from the CHIRPS Precipitation Product and from Station Records. Water 2020, 12, 1244. [Google Scholar] [CrossRef]
- Michot, V.; Vila, D.; Arvor, D.; Corpetti, T.; Ronchail, J.; Funatsu, B.; Dubreuil, V. Performance of TRMM TMPA 3B42 V7 in Replicating Daily Rainfall and Regional Rainfall Regimes in the Amazon Basin (1998–2013). Remote Sens. 2018, 10, 1879. [Google Scholar] [CrossRef] [Green Version]
- Sun, R.; Yao, P.; Wang, W.; Yue, B.; Liu, G. Assessment of Wetland Ecosystem Health in the Yangtze and Amazon River Basins. ISPRS Int. J. Geo Inf. 2017, 6, 81. [Google Scholar] [CrossRef] [Green Version]
- Marengo, J.A.; Espinoza, J.C. Extreme seasonal droughts and floods in Amazonia: Causes, trends and impacts. Int. J. Climatol. 2016, 36, 1033–1050. [Google Scholar] [CrossRef]
- de Albuquerque Cavalcanti, I.F.; Marengo, J.A.; Alves, L.M.; Costa, D.F. On the opposite relation between extreme precipitation over west Amazon and southeastern Brazil: Observations and model simulations. Int. J. Climatol. 2017, 37, 3606–3618. [Google Scholar] [CrossRef]
- Giovannettone, J.; Paredes-Trejo, F.; Barbosa, H.; Santos, C.A.C.; Kumar, T.V.L. Characterization of links between hydro-climate indices and long-term precipitation in Brazil using correlation analysis. Int. J. Climatol. 2020, 40, 5527–5541. [Google Scholar] [CrossRef]
- Marengo, J.A.; Nobre, C.A.; Tomasella, J.; Oyama, M.D.; Sampaio de Oliveira, G.; de Oliveira, R.; Camargo, H.; Alves, L.M.; Brown, I.F. The Drought of Amazonia in 2005. J. Clim. 2008, 21, 495–516. [Google Scholar] [CrossRef] [Green Version]
- Jimenez, J.C.; Marengo, J.A.; Alves, L.M.; Sulca, J.C.; Takahashi, K.; Ferrett, S.; Collins, M. The role of ENSO flavours and TNA on recent droughts over Amazon forests and the Northeast Brazil region. Int. J. Climatol. 2019. [Google Scholar] [CrossRef]
- Jiménez-Muñoz, J.C.; Mattar, C.; Barichivich, J.; Santamaría-Artigas, A.; Takahashi, K.; Malhi, Y.; Sobrino, J.A.; Van Der Schrier, G. Record-breaking warming and extreme drought in the Amazon rainforest during the course of El Niño 2015–2016. Sci. Rep. 2016, 6, 33130. [Google Scholar] [CrossRef] [Green Version]
- Nobre, C.A.; Marengo, J.A.; Soares, W.R. Climate Change Risks in Brazil; Nobre, C.A., Marengo, J.A., Soares, W.R., Eds.; Springer International Publishing: Cham, Germany, 2019; ISBN 978-3-319-92880-7. [Google Scholar]
- Panisset, J.S.; Libonati, R.; Gouveia, C.M.P.; Machado-Silva, F.; França, D.A.; França, J.R.A.; Peres, L.F. Contrasting patterns of the extreme drought episodes of 2005, 2010 and 2015 in the Amazon Basin. Int. J. Climatol. 2018, 38, 1096–1104. [Google Scholar] [CrossRef]
- Rao, V.B.; Franchito, S.H.; Santo, C.M.E.; Gan, M.A. An update on the rainfall characteristics of Brazil: Seasonal variations and trends in 1979–2011. Int. J. Climatol. 2016, 36, 291–302. [Google Scholar] [CrossRef]
- Barbosa, H.A.; Lakshmi Kumar, T.V.; Silva, L.R.M. Recent trends in vegetation dynamics in the South America and their relationship to rainfall. Nat. Hazards 2015, 77, 883–899. [Google Scholar] [CrossRef]
- Wang, X.; Yang, T.; Wortmann, M.; Shi, P.; Hattermann, F.; Lobanova, A.; Aich, V. Analysis of multi-dimensional hydrological alterations under climate change for four major river basins in different climate zones. Clim. Chang. 2017, 141, 483–498. [Google Scholar] [CrossRef]
- Nobre, C.A.; Marengo, J.A.; Artaxo, P. Understanding the climate of Amazonia: Progress from LBA. In Amazonia and Global Change; Keller, M., Bustamante, M., Gash, J., Dias, P.S., Eds.; Geophysical Monograph Series; AGU: Washington, DC, USA, 2009; Volume 186, pp. 145–147. [Google Scholar]
- Pachauri, R.K.; Allen, M.R.; Barros, V.R.; Broome, J.; Cramer, W.; Christ, R.; Church, J.A.; Clarke, L.; Dahe, Q.; Dasgupta, P.; et al. Climate Change 2014: Synthesis Report. Contribution of Working Groups I, II and III to the Fifth Assessment Report of the Intergovernmental Panel on Climate Change; Pachauri, R.K., Meyer, L., Eds.; IPCC: Geneva, Switzerland, 2014; ISBN 9789291691432. [Google Scholar]
- Wang, G. Agricultural drought in a future climate: Results from 15 global climate models participating in the IPCC 4th assessment. Clim. Dyn. 2005, 25, 739–753. [Google Scholar] [CrossRef]
- Marengo, J.A.; Chou, S.C.; Kay, G.; Alves, L.M.; Pesquero, J.F.; Soares, W.R.; Santos, D.C.; Lyra, A.A.; Sueiro, G.; Betts, R.; et al. Development of regional future climate change scenarios in South America using the Eta CPTEC/HadCM3 climate change projections: Climatology and regional analyses for the Amazon, São Francisco and the Paraná River basins. Clim. Dyn. 2012, 38, 1829–1848. [Google Scholar] [CrossRef]
- Alves, L.M.; Chadwick, R.; Moise, A.; Brown, J.; Marengo, J.A. Assessment of rainfall variability and future change in Brazil across multiple timescales. Int. J. Climatol. 2020, 41, E1875–E1888. [Google Scholar] [CrossRef]
- Marengo, J.A.; Borma, L.S.; Rodriguez, D.A.; Pinho, P.; Soares, W.R.; Alves, L.M. Recent Extremes of Drought and Flooding in Amazonia: Vulnerabilities and Human Adaptation. Am. J. Clim. Chang. 2013, 2, 87–96. [Google Scholar] [CrossRef] [Green Version]
- Zargar, A.; Sadiq, R.; Naser, B.; Khan, F.I. A review of drought indices. Environ. Rev. 2011, 19, 333–349. [Google Scholar] [CrossRef]
- Beguería, S.; Vicente-Serrano, S.M.; Reig, F.; Latorre, B. Standardized precipitation evapotranspiration index (SPEI) revisited: Parameter fitting, evapotranspiration models, tools, datasets and drought monitoring. Int. J. Climatol. 2014, 34, 3001–3023. [Google Scholar] [CrossRef] [Green Version]
- de Oliveira-Júnior, J.F.; de Gois, G.; de Bodas Terassi, P.M.; da Silva, C.A., Jr.; Blanco, C.J.C.; Sobral, B.S.; Gasparini, K.A.C. Drought severity based on the SPI index and its relation to the ENSO and PDO climatic variability modes in the regions North and Northwest of the State of Rio de Janeiro-Brazil. Atmos. Res. 2018, 212, 91–105. [Google Scholar] [CrossRef]
- Brito, S.S.B.; Cunha, A.P.M.A.; Cunningham, C.C.; Alvalá, R.C.; Marengo, J.A.; Carvalho, M.A. Frequency, duration and severity of drought in the Semiarid Northeast Brazil region. Int. J. Climatol. 2018, 38, 517–529. [Google Scholar] [CrossRef]
- Huete, A.; Justice, C.; Liu, H. Development of vegetation and soil indices for MODIS-EOS. Remote Sens. Environ. 1994, 49, 224–234. [Google Scholar] [CrossRef]
- Brando, P.M.; Goetz, S.J.; Baccini, A.; Nepstad, D.C.; Beck, P.S.A.; Christman, M.C. Seasonal and interannual variability of climate and vegetation indices across the Amazon. Proc. Natl. Acad. Sci. USA 2010, 107, 14685–14690. [Google Scholar] [CrossRef] [PubMed] [Green Version]
- Fung, K.F.; Huang, Y.F.; Koo, C.H. Assessing drought conditions through temporal pattern, spatial characteristic and operational accuracy indicated by SPI and SPEI: Case analysis for Peninsular Malaysia. Nat. Hazards 2020, 103, 2071–2101. [Google Scholar] [CrossRef]
- Vicente-Serrano, S.M.; Beguería, S.; López-Moreno, J.I. A Multiscalar Drought Index Sensitive to Global Warming: The Standardized Precipitation Evapotranspiration Index. J. Clim. 2010, 23, 1696–1718. [Google Scholar] [CrossRef] [Green Version]
- Spinoni, J.; Barbosa, P.; De Jager, A.; McCormick, N.; Naumann, G.; Vogt, J.V.; Magni, D.; Masante, D.; Mazzeschi, M. A new global database of meteorological drought events from 1951 to 2016. J. Hydrol. Reg. Stud. 2019, 22, 100593. [Google Scholar] [CrossRef]
- Bezdan, J.; Bezdan, A.; Blagojević, B.; Mesaroš, M.; Pejić, B.; Vranešević, M.; Pavić, D.; Nikolić-Đorić, E. SPEI-Based Approach to Agricultural Drought Monitoring in Vojvodina Region. Water 2019, 11, 1481. [Google Scholar] [CrossRef] [Green Version]
- Karnieli, A.; Agam, N.; Pinker, R.T.; Anderson, M.; Imhoff, M.L.; Gutman, G.G.; Panov, N.; Goldberg, A. Use of NDVI and Land Surface Temperature for Drought Assessment: Merits and Limitations. J. Clim. 2010, 23, 618–633. [Google Scholar] [CrossRef]
- Huete, A.; Didan, K.; Miura, T.; Rodriguez, E.; Gao, X.; Ferreira, L. Overview of the radiometric and biophysical performance of the MODIS vegetation indices. Remote Sens. Environ. 2002, 83, 195–213. [Google Scholar] [CrossRef]
- Huete, A.R.; Liu, H.; van Leeuwen, W.J.D. The use of vegetation indices in forested regions: Issues of linearity and saturation. In Proceedings of the 1997 IEEE International Geoscience and Remote Sensing Symposium Proceedings, Remote Sensing—A Scientific Vision for Sustainable Development, IGARSS ’97, Singapore, 3–8 August 1997; Volume 4, pp. 1966–1968. [Google Scholar]
- Marengo, J.; Nobre, C.; Tomasella, J.; Cardoso, M.; Oyama, M. Hydro-climatic and ecological behaviour of the drought of Amazonia in 2005. Philos. Trans. R. Soc. B Biol. Sci. 2008, 363, 1773–1778. [Google Scholar] [CrossRef] [Green Version]
- Marengo, J.A.; Alves, L.M.; Alvala, R.; Cunha, A.P.; Brito, S.; Moraes, O.L.L.L. Climatic characteristics of the 2010-2016 drought in the semiarid Northeast Brazil region. An. Acad. Bras. Cienc. 2018, 90, 1973–1985. [Google Scholar] [CrossRef] [PubMed]
- Asner, G.P.; Alencar, A. Drought impacts on the Amazon forest: The remote sensing perspective. New Phytol. 2010, 187, 569–578. [Google Scholar] [CrossRef] [PubMed]
- Atkinson, P.M.; Dash, J.; Jeganathan, C. Amazon vegetation greenness as measured by satellite sensors over the last decade. Geophys. Res. Lett. 2011, 38, L19105. [Google Scholar] [CrossRef] [Green Version]
- Anderson, L.O.; Malhi, Y.; Aragao, L.E.O.C.; Saatchi, S. Spatial patterns of the canopy stress during 2005 drought in Amazonia. In Proceedings of the 2007 IEEE International Geoscience and Remote Sensing Symposium, Barcelona, Spain, 23–27 July 2007; pp. 2294–2297. [Google Scholar]
- Xu, L.; Samanta, A.; Costa, M.H.; Ganguly, S.; Nemani, R.R.; Myneni, R.B. Widespread decline in greenness of Amazonian vegetation due to the 2010 drought. Geophys. Res. Lett. 2011, 38, L07402. [Google Scholar] [CrossRef] [Green Version]
- Sorí, R.; Marengo, J.; Nieto, R.; Drumond, A.; Gimeno, L. Drought and wet episodes in Amazonia: The role of atmospheric moisture transport. In Proceedings of the First International Electronic Conference on the Hydrological Cycle; MDPI: Basel, Switzerland, 2017; Volume 1, p. 4846. [Google Scholar]
- Drumond, A.; Stojanovic, M.; Nieto, R.; Vicente-Serrano, S.M.; Gimeno, L. Linking Anomalous Moisture Transport And Drought Episodes in the IPCC Reference Regions. Bull. Am. Meteorol. Soc. 2019, 100, 1481–1498. [Google Scholar] [CrossRef]
- Harris, I.; Jones, P.D.; Osborn, T.J.; Lister, D.H. Updated high-resolution grids of monthly climatic observations—The CRU TS3.10 Dataset. Int. J. Climatol. 2014, 34, 623–642. [Google Scholar] [CrossRef] [Green Version]
- Labat, D.; Ronchail, J.; Callede, J.; Guyot, J.L.; De Oliveira, E.; Guimarães, W. Wavelet analysis of Amazon hydrological regime variability. Geophys. Res. Lett. 2004, 31, 3–6. [Google Scholar] [CrossRef] [Green Version]
- Botto, M.P. The Amazon Cooperation Treaty: A mechanism for cooperation and sustainable. In Management of Latin American River Basins: Amazon, Plata, and Sao Francisco; Biswas, A.K., Cordeiro, N.V., Braga, B.P.F., Tortajada, C., Eds.; United Nations University Press: Tokyo, Japan, 1999; p. 68. ISBN 9789280810127. [Google Scholar]
- Lees, A.C.; Peres, C.A.; Fearnside, P.M.; Schneider, M.; Zuanon, J.A.S. Hydropower and the future of Amazonian biodiversity. Biodivers. Conserv. 2016, 25, 451–466. [Google Scholar] [CrossRef]
- Beck, H.E.; Zimmermann, N.E.; McVicar, T.R.; Vergopolan, N.; Berg, A.; Wood, E.F. Present and future Köppen-Geiger climate classification maps at 1-km resolution. Sci. Data 2018, 5, 180214. [Google Scholar] [CrossRef] [Green Version]
- Coe, M.T.; Macedo, M.N.; Brando, P.M.; Lefebvre, P.; Panday, P.; Silvério, D. The Hydrology and Energy Balance of the Amazon Basin. In Interactions Between Biosphere, Atmosphere and Human Land Use in the Amazon Basin; Springer: Cham, Switzerland, 2016; pp. 35–53. [Google Scholar]
- Marengo, J.A. Interdecadal variability and trends of rainfall across the Amazon basin. Theor. Appl. Climatol. 2004, 78, 79–96. [Google Scholar] [CrossRef]
- Marengo, J.A. Interannual variability of surface climate in the Amazon basin. Int. J. Climatol. 1992, 12, 853–863. [Google Scholar] [CrossRef]
- Marengo, J.A.; Alves, L.M.; Soares, W.R.; Rodriguez, D.A.; Camargo, H.; Riveros, M.P.; Pabló, A.D. Two Contrasting Severe Seasonal Extremes in Tropical South America in 2012: Flood in Amazonia and Drought in Northeast Brazil. J. Clim. 2013, 26, 9137–9154. [Google Scholar] [CrossRef]
- Lima, L.S.; Coe, M.T.; Filho, B.S.S.; Cuadra, S.V.; Dias, L.C.P.; Costa, M.H.; Lima, L.S.; Rodrigues, H.O. Feedbacks between deforestation, climate, and hydrology in the Southwestern Amazon: Implications for the provision of ecosystem services. Landsc. Ecol. 2014, 29, 261–274. [Google Scholar] [CrossRef] [Green Version]
- Mayorga, E.; Logsdon, M.G.; Ballester, M.V.R.; Richey, J.E. Estimating cell-to-cell land surface drainage paths from digital channel networks, with an application to the Amazon basin. J. Hydrol. 2005, 315, 167–182. [Google Scholar] [CrossRef]
- Kumar, S.; Vidal, Y.-S.; Moya-Álvarez, A.S.; Martínez-Castro, D. Effect of the surface wind flow and topography on precipitating cloud systems over the Andes and associated Amazon basin: GPM observations. Atmos. Res. 2019, 225, 193–208. [Google Scholar] [CrossRef]
- Liu, X.; Yu, L.; Si, Y.; Zhang, C.; Lu, H.; Yu, C.; Gong, P. Identifying patterns and hotspots of global land cover transitions using the ESA CCI Land Cover dataset. Remote Sens. Lett. 2018, 9, 972–981. [Google Scholar] [CrossRef]
- Funk, C.; Peterson, P.; Landsfeld, M.; Pedreros, D.; Verdin, J.; Shukla, S.; Husak, G.; Rowland, J.; Harrison, L.; Hoell, A.; et al. The climate hazards infrared precipitation with stations—A new environmental record for monitoring extremes. Sci. Data 2015, 2, 150066. [Google Scholar] [CrossRef] [PubMed] [Green Version]
- Berry, P.A.M.; Garlick, J.D.; Smith, R.G. Near-global validation of the SRTM DEM using satellite radar altimetry. Remote Sens. Environ. 2007, 106, 17–27. [Google Scholar] [CrossRef]
- Allen, R.G.; Pereira, L.S.; Raes, D.; Smith, M. Crop evapotranspiration-Guidelines for computing crop water requirements-FAO Irrigation and drainage paper 56. FAO (Rome) 1998, 300, D05109. [Google Scholar]
- Harris, I.; Osborn, T.J.; Jones, P.; Lister, D. Version 4 of the CRU TS monthly high-resolution gridded multivariate climate dataset. Sci. Data 2020, 7, 109. [Google Scholar] [CrossRef] [Green Version]
- Solano, R.; Didan, K.; Jacobson, A.; Huete, A. MODIS Vegetation Index User’s Guide (MOD13 Series); Veg. Index Phenol. Lab, Univ. Arizona: Tucson, AZ, USA, 2010; pp. 1–38. [Google Scholar]
- Jäntschi, L. A Test Detecting the Outliers for Continuous Distributions Based on the Cumulative Distribution Function of the Data Being Tested. Symmetry 2019, 11, 835. [Google Scholar]
- McKnight, P.E.; McKnight, K.M.; Sidani, S.; Figueredo, A.J. Missing Data: A Gentle Introduction; Guilford Press: New York, NY, USA, 2007; ISBN 9781606238202. [Google Scholar]
- Moritz, S.; Bartz-Beielstein, T. ImputeTS: Time series missing value imputation in R. R J. 2017, 9, 207–218. [Google Scholar] [CrossRef] [Green Version]
- Dee, D.P.; Uppala, S.M.; Simmons, A.J.; Berrisford, P.; Poli, P.; Kobayashi, S.; Andrae, U.; Balmaseda, M.A.; Balsamo, G.; Bauer, P.; et al. The ERA-Interim reanalysis: Configuration and performance of the data assimilation system. Q. J. R. Meteorol. Soc. 2011, 137, 553–597. [Google Scholar] [CrossRef]
- Houghton, R.A.; Bontemps, S.; Peng, S.; Lamarche, C.; Li, W.; MacBean, N.; Defourny, P.; Ciais, P. Gross and net land cover changes based on plant functional types derived from the annual ESA CCI land cover maps. Earth Syst. Sci. Data Discuss. 2017, 10, 1–23. [Google Scholar]
- Melo, D.C.D.; Xavier, A.C.; Bianchi, T.; Oliveira, P.T.S.; Scanlon, B.R.; Lucas, M.C.; Wendland, E. Performance evaluation of rainfall estimates by TRMM Multi-satellite Precipitation Analysis 3B42V6 and V7 over Brazil. J. Geophys. Res. Atmos. 2015, 120, 9426–9436. [Google Scholar] [CrossRef] [Green Version]
- Pellicone, G.; Caloiero, T.; Modica, G.; Guagliardi, I. Application of several spatial interpolation techniques to monthly rainfall data in the Calabria region (southern Italy). Int. J. Climatol. 2018, 38, 3651–3666. [Google Scholar] [CrossRef]
- Stagge, J.H.; Tallaksen, L.M.; Gudmundsson, L.; Van Loon, A.F.; Stahl, K. Candidate Distributions for Climatological Drought Indices (SPI and SPEI). Int. J. Climatol. 2015, 35, 4027–4040. [Google Scholar] [CrossRef]
- Levine, R.A.; Wilks, D.S. Statistical Methods in the Atmospheric Sciences. J. Am. Stat. Assoc. 2000, 95, 344. [Google Scholar] [CrossRef]
- Yue, S.; Wang, C. The Mann-Kendall Test Modified by Effective Sample Size to Detect Trend in Serially Correlated Hydrological Series. Water Resour. Manag. 2004, 18, 201–218. [Google Scholar] [CrossRef]
- Hu, Z.; Liu, S.; Zhong, G.; Lin, H.; Zhou, Z. Modified Mann-Kendall trend test for hydrological time series under the scaling hypothesis and its application. Hydrol. Sci. J. 2020, 65, 2419–2438. [Google Scholar] [CrossRef]
- Theil, H. A Rank-Invariant Method of Linear and Polynomial Regression Analysis. In Henri Theil’s Contributions to Economics and Econometrics; Springer: Cham, Switzerland, 1992; pp. 345–381. [Google Scholar]
- Ghaderpour, E.; Ince, E.S.; Pagiatakis, S.D. Least-squares cross-wavelet analysis and its applications in geophysical time series. J. Geod. 2018, 92, 1223–1236. [Google Scholar] [CrossRef]
- Torrence, C.; Compo, G.P. A Practical Guide to Wavelet Analysis. Bull. Am. Meteorol. Soc. 1998, 79, 61–78. [Google Scholar] [CrossRef] [Green Version]
- Grinsted, A.; Moore, J.C.; Jevrejeva, S. Application of the cross wavelet transform and wavelet coherence to geophysical time series. Nonlinear Process. Geophys. 2004, 11, 561–566. [Google Scholar] [CrossRef]
- Park, H.-S.; Jun, C.-H. A simple and fast algorithm for K-medoids clustering. Expert Syst. Appl. 2009, 36, 3336–3341. [Google Scholar] [CrossRef]
- Arora, P.; Deepali, D.; Varshney, S. Analysis of k-means and k-medoids algorithm for big data. Procedia Comput. Sci. 2016, 78, 507–512. [Google Scholar] [CrossRef] [Green Version]
- Reynolds, A.P.; Richards, G.; de la Iglesia, B.; Rayward-Smith, V.J. Clustering Rules: A Comparison of Partitioning and Hierarchical Clustering Algorithms. J. Math. Model. Algorithms 2006, 5, 475–504. [Google Scholar] [CrossRef]
- Kayano, M.T.; Andreoli, R.V.; Souza, R.A.F. Pacific and Atlantic multidecadal variability relations to the El Niño events and their effects on the South American rainfall. Int. J. Climatol. 2020, 40, 2183–2200. [Google Scholar] [CrossRef]
- Barbosa, H.A.; Kumar, T.V.L. Influence of rainfall variability on the vegetation dynamics over Northeastern Brazil. J. Arid Environ. 2016, 124, 377–387. [Google Scholar] [CrossRef]
- Rossato, L.; Marengo, J.A.; de Angelis, C.F.; Pires, L.B.M.; Mendiondo, E.M. Impact of soil moisture over Palmer Drought Severity Index and its future projections in Brazil. RBRH 2017, 22, e36. [Google Scholar] [CrossRef] [Green Version]
- Mbatha, N.; Xulu, S. Time Series Analysis of MODIS-Derived NDVI for the Hluhluwe-Imfolozi Park, South Africa: Impact of Recent Intense Drought. Climate 2018, 6, 95. [Google Scholar] [CrossRef] [Green Version]
- Zhao, W.; Zhao, X.; Zhou, T.; Wu, D.; Tang, B.; Wei, H. Climatic factors driving vegetation declines in the 2005 and 2010 Amazon droughts. PLoS ONE 2017, 12, e0175379. [Google Scholar] [CrossRef] [PubMed]
- Van Loon, A.F. Hydrological drought explained. Wiley Interdiscip. Rev. Water 2015, 2, 359–392. [Google Scholar] [CrossRef]
- Van Loon, A.F.; Laaha, G. Hydrological drought severity explained by climate and catchment characteristics. J. Hydrol. 2015, 526, 3–14. [Google Scholar] [CrossRef] [Green Version]
- Esteban, E.J.L.; Castilho, C.V.; Melgaço, K.L.; Costa, F.R.C. The other side of droughts: Wet extremes and topography as buffers of negative drought effects in an Amazonian forest. New Phytol. 2020, 229, 1995–2006. [Google Scholar] [CrossRef]
- Sheffield, J. Drought; Routledge: Abingdon, UK, 2012; ISBN 9781849775250. [Google Scholar]
- Marengo, J.A.; Williams, E.R.; Alves, L.M.; Soares, W.R.; Rodriguez, D.A. Extreme Seasonal Climate Variations in the Amazon Basin: Droughts and Floods. In Interactions between Biosphere, Atmosphere and Human Land Use in the Amazon Basin; Springer: Cham, Switzerland, 2016; pp. 55–76. [Google Scholar]
- Satyamurty, P.; da Costa, C.P.W.; Manzi, A.O. Moisture source for the Amazon Basin: A study of contrasting years. Theor. Appl. Climatol. 2013, 111, 195–209. [Google Scholar] [CrossRef]
- De Souza, E.B.; Ambrizzi, T. Modulation of the intraseasonal rainfall over tropical Brazil by the Madden–Julian oscillation. Int. J. Climatol. 2006, 26, 1759–1776. [Google Scholar] [CrossRef]
- Andreoli, R.V.; de Souza, R.A.F.; Kayano, M.T.; Candido, L.A. Seasonal anomalous rainfall in the central and eastern Amazon and associated anomalous oceanic and atmospheric patterns. Int. J. Climatol. 2012, 32, 1193–1205. [Google Scholar] [CrossRef]
- Bagley, J.E.; Desai, A.R.; Harding, K.J.; Snyder, P.K.; Foley, J.A. Drought and Deforestation: Has Land Cover Change Influenced Recent Precipitation Extremes in the Amazon? J. Clim. 2014, 27, 345–361. [Google Scholar] [CrossRef]
- Awange, J.L.; Mpelasoka, F.; Goncalves, R.M. When every drop counts: Analysis of Droughts in Brazil for the 1901–2013 period. Sci. Total Environ. 2016, 566–567, 1472–1488. [Google Scholar] [CrossRef] [Green Version]
- Chaudhari, S.; Pokhrel, Y.; Moran, E.; Miguez-Macho, G. Multi-decadal hydrologic change and variability in the Amazon River basin: Understanding terrestrial water storage variations and drought characteristics. Hydrol. Earth Syst. Sci. 2019, 23, 2841–2862. [Google Scholar] [CrossRef] [Green Version]
- Kayano, M.T.; Capistrano, V.B. How the Atlantic multidecadal oscillation (AMO) modifies the ENSO influence on the South American rainfall. Int. J. Climatol. 2014, 34, 162–178. [Google Scholar] [CrossRef]
- Kayano, M.T.; Andreoli, R.V. Relations of South American summer rainfall interannual variations with the Pacific Decadal Oscillation. Int. J. Climatol. 2007, 27, 531–540. [Google Scholar] [CrossRef]
- Espinoza, J.C.; Ronchail, J.; Marengo, J.A.; Segura, H. Contrasting North–South changes in Amazon wet-day and dry-day frequency and related atmospheric features (1981–2017). Clim. Dyn. 2019, 52, 5413–5430. [Google Scholar] [CrossRef]
- Nogueira, J.; Rambal, S.; Barbosa, J.; Mouillot, F. Spatial Pattern of the Seasonal Drought/Burned Area Relationship across Brazilian Biomes: Sensitivity to Drought Metrics and Global Remote-Sensing Fire Products. Climate 2017, 5, 42. [Google Scholar] [CrossRef] [Green Version]
- da Silva, S.S.; Fearnside, P.M.; de Alencastro Graça, P.M.L.; Brown, I.F.; Alencar, A.; de Melo, A.W.F. Dynamics of forest fires in the southwestern Amazon. For. Ecol. Manag. 2018, 424, 312–322. [Google Scholar] [CrossRef]
- Lopes, A.V.; Chiang, J.C.H.; Thompson, S.A.; Dracup, J.A. Trend and uncertainty in spatial-temporal patterns of hydrological droughts in the Amazon basin. Geophys. Res. Lett. 2016, 43, 3307–3316. [Google Scholar] [CrossRef] [Green Version]


| Class Names | SPEI |
|---|---|
| Extreme wet | >2.00 |
| Severe wet | 1.50 to 1.99 |
| Moderate wet | 1.00 to 1.49 |
| Near normal | 0.99 to −0.99 |
| Moderate drought | −1.00 to −1.49 |
| Severe drought | −1.50 to −1.99 |
| Extreme drought | <−2.00 |
| Time Scale [Months] | Event | Start [Date] | End [Date] | Duration [Months] | Intensity [-] | Dry Area Peak [%] | Severity [-] |
|---|---|---|---|---|---|---|---|
| 3 | E1 | April-36 | August-36 | 5 | 1.76 | 30.34 | 8.81 |
| E2 | July-63 | March-64 | 9 | 1.77 | 47.19 | 15.95 | |
| E3 | August-67 | February-68 | 7 | 1.73 | 34.14 | 12.14 | |
| E4 | February-85 | July-85 | 6 | 1.87 | 29.44 | 11.22 | |
| E5 | August-88 | December-88 | 5 | 1.80 | 32.95 | 9.01 | |
| E6 | November-91 | March-92 | 5 | 1.73 | 34.20 | 8.66 | |
| E7 | August-15 | March-16 | 8 | 1.78 | 44.71 | 14.25 | |
| 6 | E1 | May-36 | October-36 | 6 | 1.73 | 33.66 | 10.36 |
| E2 | August-63 | May-64 | 10 | 1.78 | 41.05 | 17.84 | |
| E3 | January-66 | June-66 | 6 | 1.72 | 32.18 | 10.35 | |
| E4 | August-67 | July-68 | 12 | 1.77 | 35.42 | 21.28 | |
| E5 | March-69 | August-69 | 6 | 1.75 | 29.93 | 10.47 | |
| E6 | February-83 | November-83 | 10 | 1.77 | 31.18 | 17.68 | |
| E7 | April-85 | August-85 | 5 | 1.88 | 30.31 | 9.40 | |
| E8 | September-88 | January-89 | 5 | 1.77 | 29.09 | 8.83 | |
| E9 | December-91 | August-92 | 9 | 1.77 | 37.67 | 15.90 | |
| E10 | May-95 | October-95 | 6 | 1.79 | 26.42 | 10.71 | |
| E11 | September-12 | January-13 | 5 | 1.73 | 29.57 | 8.64 | |
| E12 | October-15 | September-16 | 12 | 1.80 | 49.73 | 21.58 | |
| 12 | E1 | June-36 | April-37 | 11 | 1.71 | 27.03 | 18.79 |
| E2 | September-63 | September-64 | 13 | 1.82 | 36.61 | 23.64 | |
| E3 | January-66 | June-66 | 6 | 1.72 | 29.32 | 10.35 | |
| E4 | November-67 | August-68 | 10 | 1.77 | 29.57 | 17.73 | |
| E5 | August-69 | February-70 | 7 | 1.72 | 29.96 | 12.07 | |
| E6 | April-83 | December-83 | 9 | 1.79 | 27.68 | 16.1 | |
| E7 | September-85 | January-86 | 5 | 1.85 | 22.27 | 9.24 | |
| E8 | October-87 | April-88 | 7 | 1.72 | 28.48 | 12.05 | |
| E9 | September-88 | July-89 | 11 | 1.74 | 22.44 | 19.14 | |
| E10 | December-91 | December-92 | 13 | 1.78 | 35.36 | 23.18 | |
| E11 | August-15 | August-17 | 21 | 1.78 | 38.89 | 37.39 |
| Auxiliary Satellite-Based Variable | Period [Years] | SPEI3 [-] | SPEI6 [-] | SPEI12 [-] |
|---|---|---|---|---|
| EVI [-] | 2001–2018 | −0.064 | −0.250 * | −0.019 |
| EVI anomalies [-] | −0.077 | −0.033 | −0.120 * | |
| T2M [°C] | 1980–2018 | −0.339 * | −0.354 * | −0.208 * |
| T2M anomalies [°C] | −0.515 * | −0.414 * | −0.279 * | |
| Rainfall [mm/month] | 1998–2018 | 0.353 * | 0.097 | 0.119 * |
| Rainfall anomalies [mm/month] | 0.559 * | 0.379 * | 0.331 * |
Publisher’s Note: MDPI stays neutral with regard to jurisdictional claims in published maps and institutional affiliations. |
© 2021 by the authors. Licensee MDPI, Basel, Switzerland. This article is an open access article distributed under the terms and conditions of the Creative Commons Attribution (CC BY) license (http://creativecommons.org/licenses/by/4.0/).
Share and Cite
Paredes-Trejo, F.; Barbosa, H.A.; Giovannettone, J.; Lakshmi Kumar, T.V.; Thakur, M.K.; de Oliveira Buriti, C. Long-Term Spatiotemporal Variation of Droughts in the Amazon River Basin. Water 2021, 13, 351. https://doi.org/10.3390/w13030351
Paredes-Trejo F, Barbosa HA, Giovannettone J, Lakshmi Kumar TV, Thakur MK, de Oliveira Buriti C. Long-Term Spatiotemporal Variation of Droughts in the Amazon River Basin. Water. 2021; 13(3):351. https://doi.org/10.3390/w13030351
Chicago/Turabian StyleParedes-Trejo, Franklin, Humberto Alves Barbosa, Jason Giovannettone, T. V. Lakshmi Kumar, Manoj Kumar Thakur, and Catarina de Oliveira Buriti. 2021. "Long-Term Spatiotemporal Variation of Droughts in the Amazon River Basin" Water 13, no. 3: 351. https://doi.org/10.3390/w13030351