Article

Interannual and Spatial Variability of Cyanotoxins in the Prespa Lake Area, Greece

by
Valentini Maliaka
1,2,3,*,
Miquel Lürling
2,4,
Christian Fritz
1,
Yvon J.M. Verstijnen
1,2,5,
Elisabeth J. Faassen
2,6,
Frank van Oosterhout
2 and
Alfons J.P. Smolders
1,5
1
Institute for Water and Wetland Research, Department of Aquatic Ecology and Environmental Biology, Radboud University, Heyendaalseweg 135, 6525 AJ Nijmegen, The Netherlands
2
Aquatic Ecology & Water Quality Management Group, Department of Environmental Sciences, Wageningen University, P.O. Box 47, 6700 AA Wageningen, The Netherlands
3
Society for the Protection of Prespa, Agios Germanos, 53077 Prespa, Greece
4
Department of Aquatic Ecology, Netherlands Institute of Ecology (NIOO-KNAW), P.O. Box 50, 6700 AB Wageningen, The Netherlands
5
B-WARE Research Centre, Radboud University, Toernooiveld 1, 6525 ED Nijmegen, The Netherlands
6
Wageningen Food Safety Research, Wageningen Research, Akkermaalsbos 2, 6708 WB Wageningen, The Netherlands
*
Author to whom correspondence should be addressed.
Water 2021, 13(3), 357; https://doi.org/10.3390/w13030357
Submission received: 20 December 2020 / Revised: 24 January 2021 / Accepted: 26 January 2021 / Published: 30 January 2021

Abstract

:
The Prespa Lakes area in Greece—comprised partly of lake Great and lake Lesser Prespa and the Vromolimni pond—has a global importance for biodiversity. Although the waters show regular cyanobacteria blooms, assessments of water quality threats are limited. Samples collected in 2012 revealed scattered and low microcystin (MC) concentrations in Great Prespa (<0.2 μg MC L−1) whereas considerable spatial heterogeneity in both total chlorophyll (2.4–93 µg L−1) and MC concentrations (0.04–52.4 µg MC L−1) was detected in Lesser Prespa. In 2013, there was far less spatial variability of MC concentrations in Lesser Prespa (0.4–1.53 µg L−1), however in 2014, increased concentrations were detected near the lakeshore (25–861 µg MC L−1). In Vromolimni pond the MC concentrations were on average 26.6 (±6.4) µg MC L−1 in 2012, 2.1 (±0.3) µg MC L−1 in 2013 and 12.7 (±12.5) µg MC L−1 in 2014. In 2013, no anatoxins, saxitoxins, nor cylindrospermopsins were detected in Lesser Prespa and Vromolimni waters. Tissue samples from carps, an otter and Dalmatian Pelicans contained 0.4–1.9 µg MC g−1 dry weight. These results indicate that cyanotoxins could be a threat to the ecosystem functions of particularly Lesser Prespa and Vromolimni.

1. Introduction

The incidence and intensity of cyanobacterial blooms in freshwater systems are on the rise worldwide [1,2]. There is broad consensus that cultural eutrophication, i.e., the over-enrichment of surface waters with nutrients, is the prime driver of cyanobacterial bloom formation (e.g., [3,4]) and that global warming may further stimulate their proliferation [2,5]. High densities of cyanobacteria in the water column are a threat to environmental health and public safety as many cyanobacteria produce a variety of potent toxins [6,7] and may produce undesirable musty odors, cause high turbidity, anoxia, fish kills and food web alterations [5,8].
Like many other lakes worldwide, the water quality of the Prespa Lakes, has been affected by unsustainable human activities such as discharge of communal waste water, intensive agriculture and sedimentation of eroded matter. These events have negative impacts on biodiversity [9]. The Prespa Lakes form a single high altitude (850 m.a.s.l) tri-border basin shared by Albania, Greece and North Macedonia and encompasses two interlinked lakes; the deep lake Great Prespa (also known as Macro Prespa) and the relatively shallow lake Lesser Prespa (also known as Mikri Prespa) [9]. Both lakes together form one of the largest waterbodies and the first transboundary protected site within the Balkan area (Southeast Europe) [9,10]. Lake Lesser Prespa, is protected as a Landscape of Exceptional Natural Beauty, as a Ramsar Wetland of International Importance [11] as well as a Special Protected Area due to its importance for rare and migratory birds (Directive 79/409/EEC) [9]. The area is internationally recognized as a ”shelter” for endemic biodiversity and migratory birds, especially for the rare piscivorous Dalmatian Pelican (Pelecanus crispus) and Great White Pelican (Pelecanus onocrotalus), which have one of their largest colonies worldwide in Lake Lesser Prespa [9,12,13]. Therefore, there is a great need to prevent habitat deterioration, i.e., due to eutrophication and the development of toxic cyanobacteria blooms, and to stimulate conservation of the aquatic habitats in the Prespa area.
Until now, assessments of the water quality threats in the Prespa area have been limited. Concerning Lake Great Prespa, relevant studies report the prevalence of anoxic conditions (lack of oxygen) in the hypolimnion during summer stratification and the coincident increase of in-lake phosphorus concentrations which may further supply the surface layer of the lake during the mixing of the entire water column [14,15,16]. In addition, average summer chlorophyll-a in 2001–2003 and 2008 indicate a mesotrophic to eutrophic status [17] while more than 90% of dominance of cyanobacteria species such as Anabaena affinis and Anabaena contorta or Aphanizomenon sp. has been documented in the summer months [15]. On the one hand, progressive water losses due to furrow irrigation of the adjacent agricultural areas and the prolonged drought events on the other hand are presumed to surpass the effect of eutrophication [14,16,18]. Studies conducted at Lake Lesser Prespa classify the lake as an eutrophic one, where cyanobacteria such as Microcystis aeruginosa and M. wesenbergii may dominate during the warmer periods of the year [19,20].
Several members of the genus Microcystis, might produce potent toxins, microcystins (MCs), that are most frequently encountered in freshwater blooms all around the world [21]. MCs are non-ribosomally synthesized cyclic heptapeptides with a size between 909–1115 Da [21,22]. Their general structure is cyclo(-d-ala-l-X-erythro-β-d-methylaspartic acid-l-Y-Adda-d-isoglutamic acid-N-methyldehydroalanine), where Adda is (2S,3S,8S,9S)-3-amino-9-methoxy-2,6,8-trimethyl-10-phenyldeca-4,6-dienoic acid and X and Y are variable L-amino acids [6]. MCs are potent inhibitors of protein phosphatases and tumor promoters [23,24]. They have been implicated in human fatalities [25] and in animal mortalities, for example in otters [26], turtles [27], dogs [28] and birds [29]. Nevertheless, despite a potential risk of cyanobacteria and their toxins to aquatic- and avifauna in Lesser Prespa, only few and very scattered data on MC concentrations are available. Two studies reported MC concentration based on dry-weight in Lesser Prespa seston of around 1100 µg g−1 [30,31]; one study reported 3 µg L−1 in seston [32], and another study reported total MCs of around 2 µg L−1 on October 2001 and 101 µg L−1 in a sample collected on August 1999 [33]. Another study included one sample from Lesser Prespa, taken in 2014, and reported low concentration of MC-RR (0.354 µg L−1 in seston, but relatively high concentrations of MC-RR, MC-YR and MC-LR in filtered water, 41.4, 36.2 and 40.8 µg L−1, respectively [34]. A major limitation of these studies is that the MC values seem to be based on single samples, whereas the cyanobacterial flora might express considerable temporal and spatial heterogeneity [28,35,36].
To obtain more insight in the heterogeneity of MC concentrations and thus the potential cyanobacterial risks in the Prespa area, water, scum and animal tissue samples were taken at several sites (a) in the summer of 2012 from Lake Great and Lesser Prespa as well as from Vromolimni Pond, (b) in early autumn 2013 from Lake Lesser Prespa and Vromolimni Pond and (c) from July to November 2014 from Lake Lesser Prespa and Vromolimni Pond. Inasmuch as dozens of MC variants have been identified that differ in their toxicity [24], samples were analyzed on eight of the most prominent MC-variants and nodularin by LC-MS/MS rather than on MC-LR concentrations alone. In addition, tissue samples from carp (Cyprinus carpio), Dalmatian Pelicans and a Common otter (Lutra lutra) were collected and analyzed on MCs during 2013 and 2014.
In a preliminary inspection of algae species by using microscopic examination of 2012 samples, quite some Dolichospermum lemmermannii (formerly known as Anabaena) were observed in water samples from Lake Lesser Prespa, which besides MCs might also produce the neurotoxins anatoxin-a and saxitoxins [37]. Therefore, the collected samples in 2013 were also analyzed for cyanobacterial neurotoxins-(homo)anatoxin-a, four (homo)anatoxin-a metabolites, saxitoxins, gonyautoxins- and for cytotoxins-cylindrospermopsin, 7-epi-cylindrospermopsin and 7-deoxy-cylindrospermopsin to obtain a more thorough insight in the potential risk of cyanobacteria and their toxins to aquatic organisms and avifauna in the Prespa Lakes.

2. Materials and Methods

2.1. Sample Origin

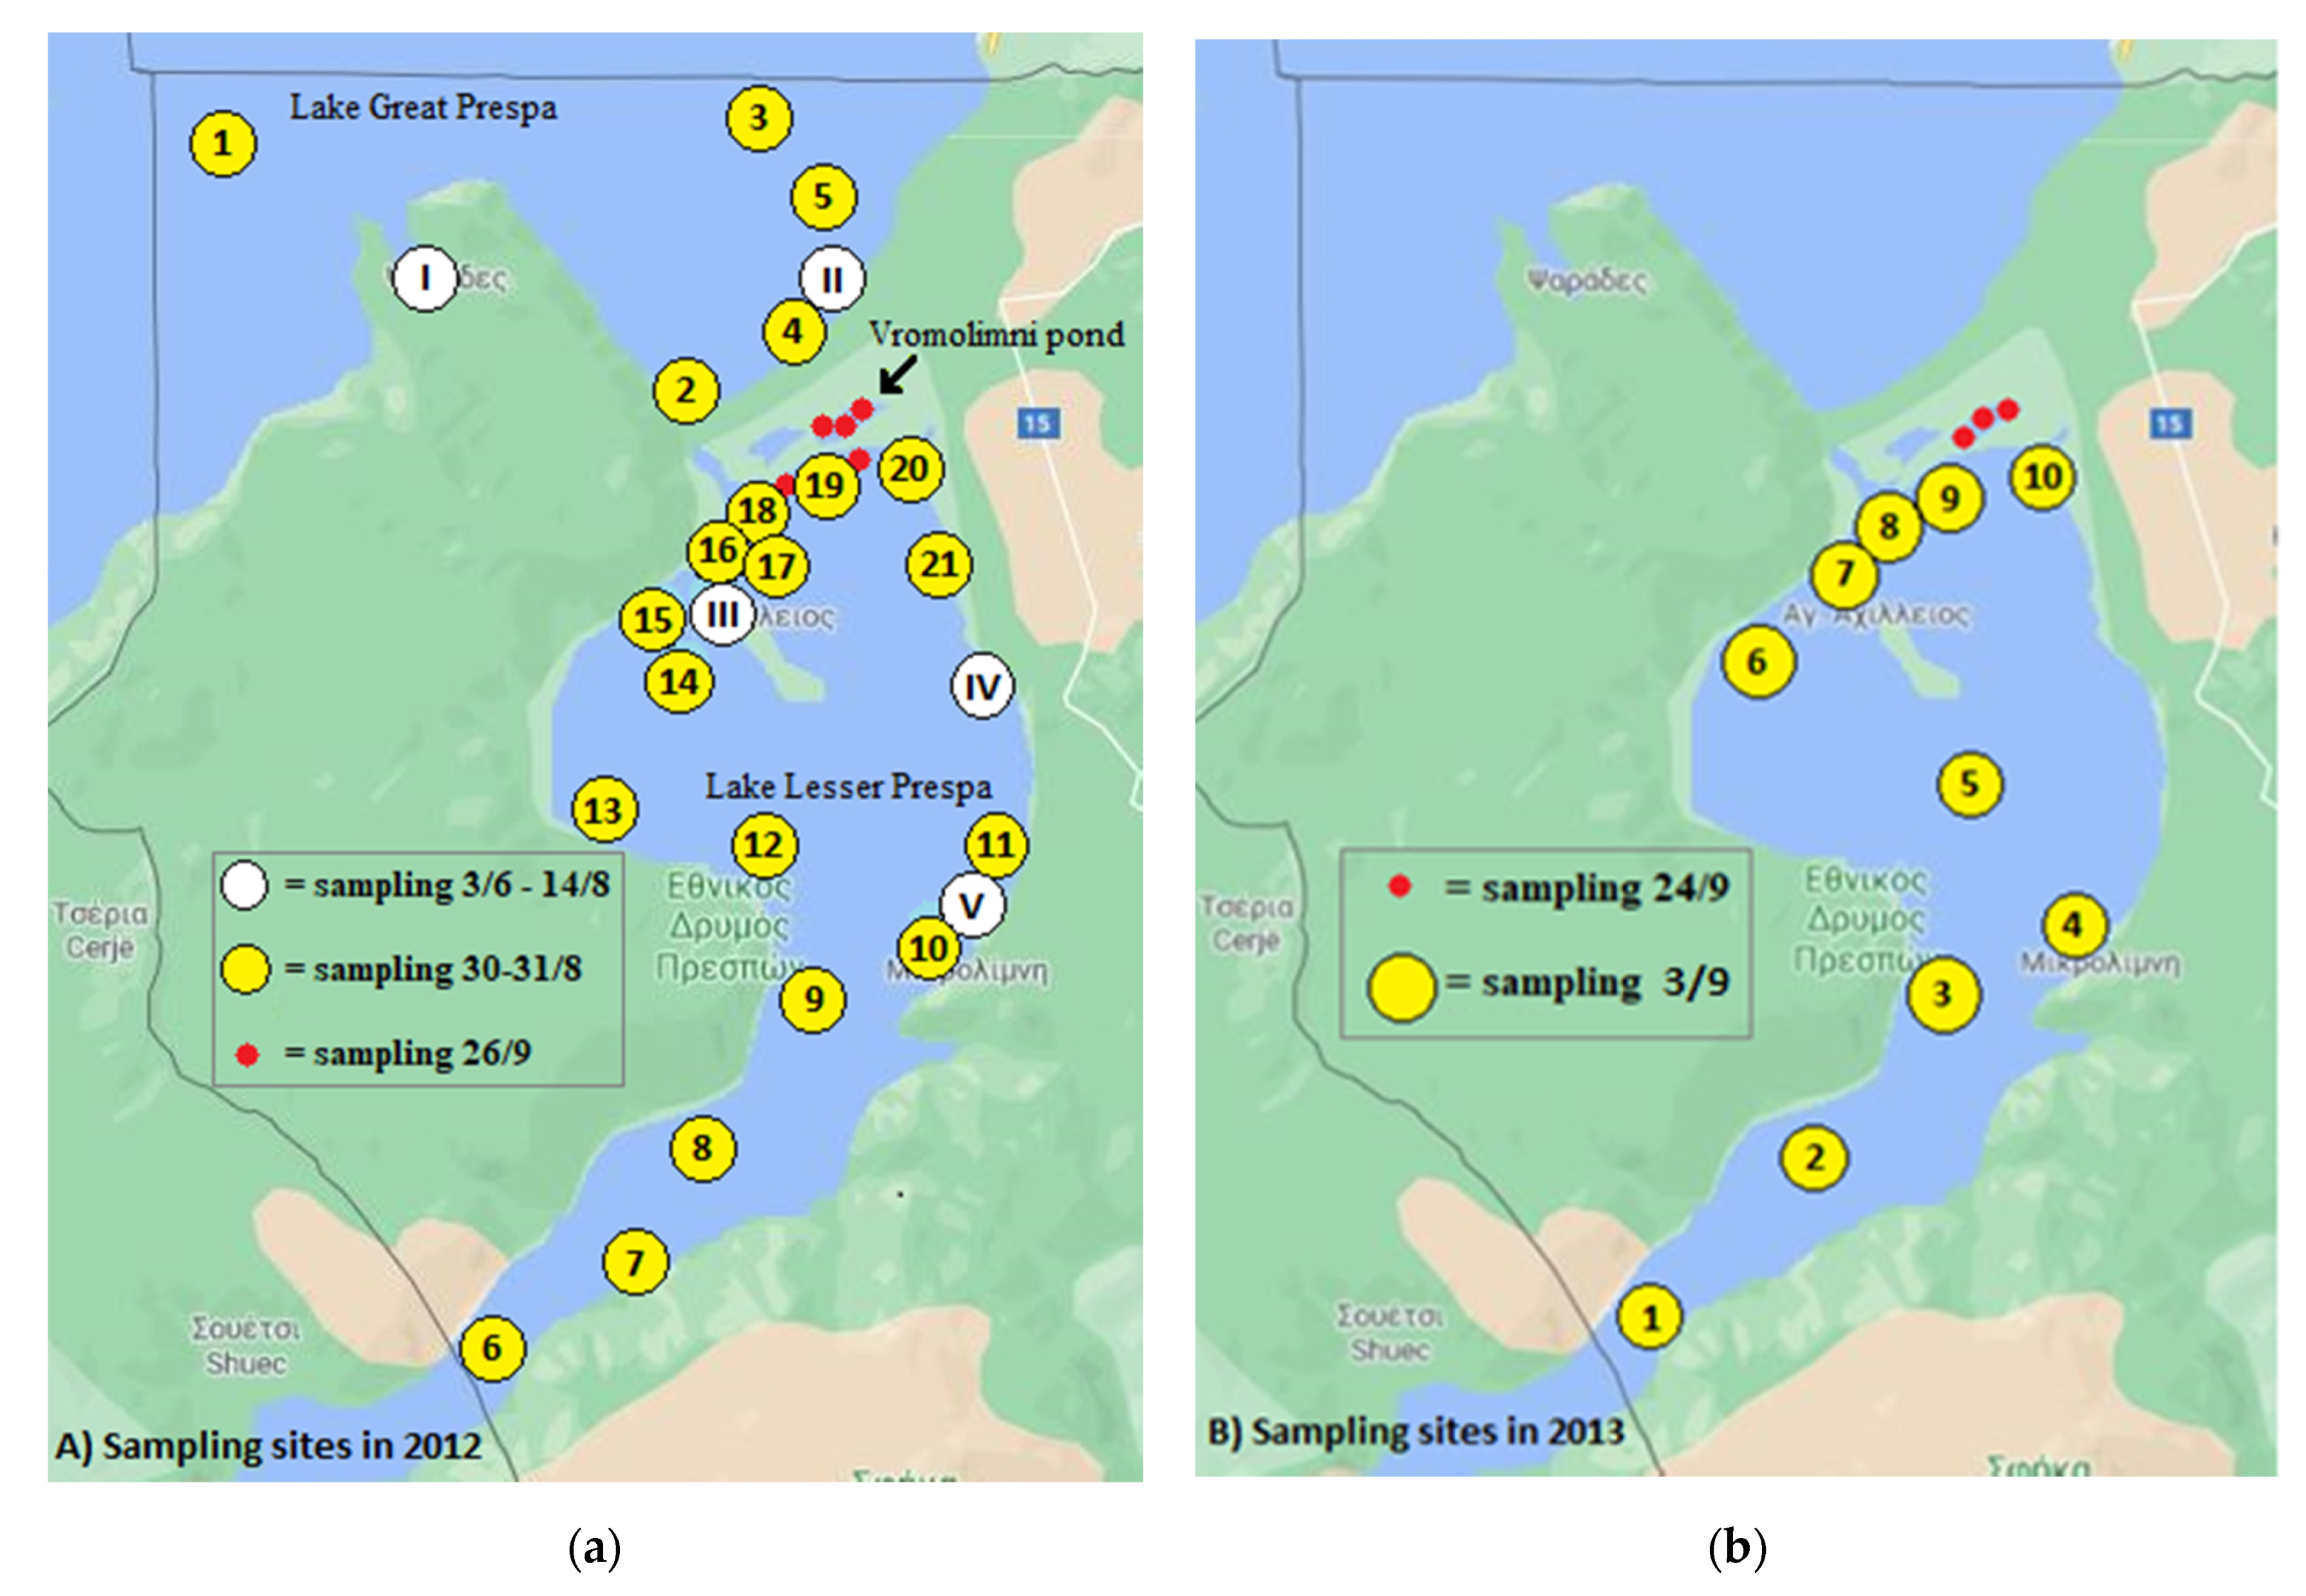
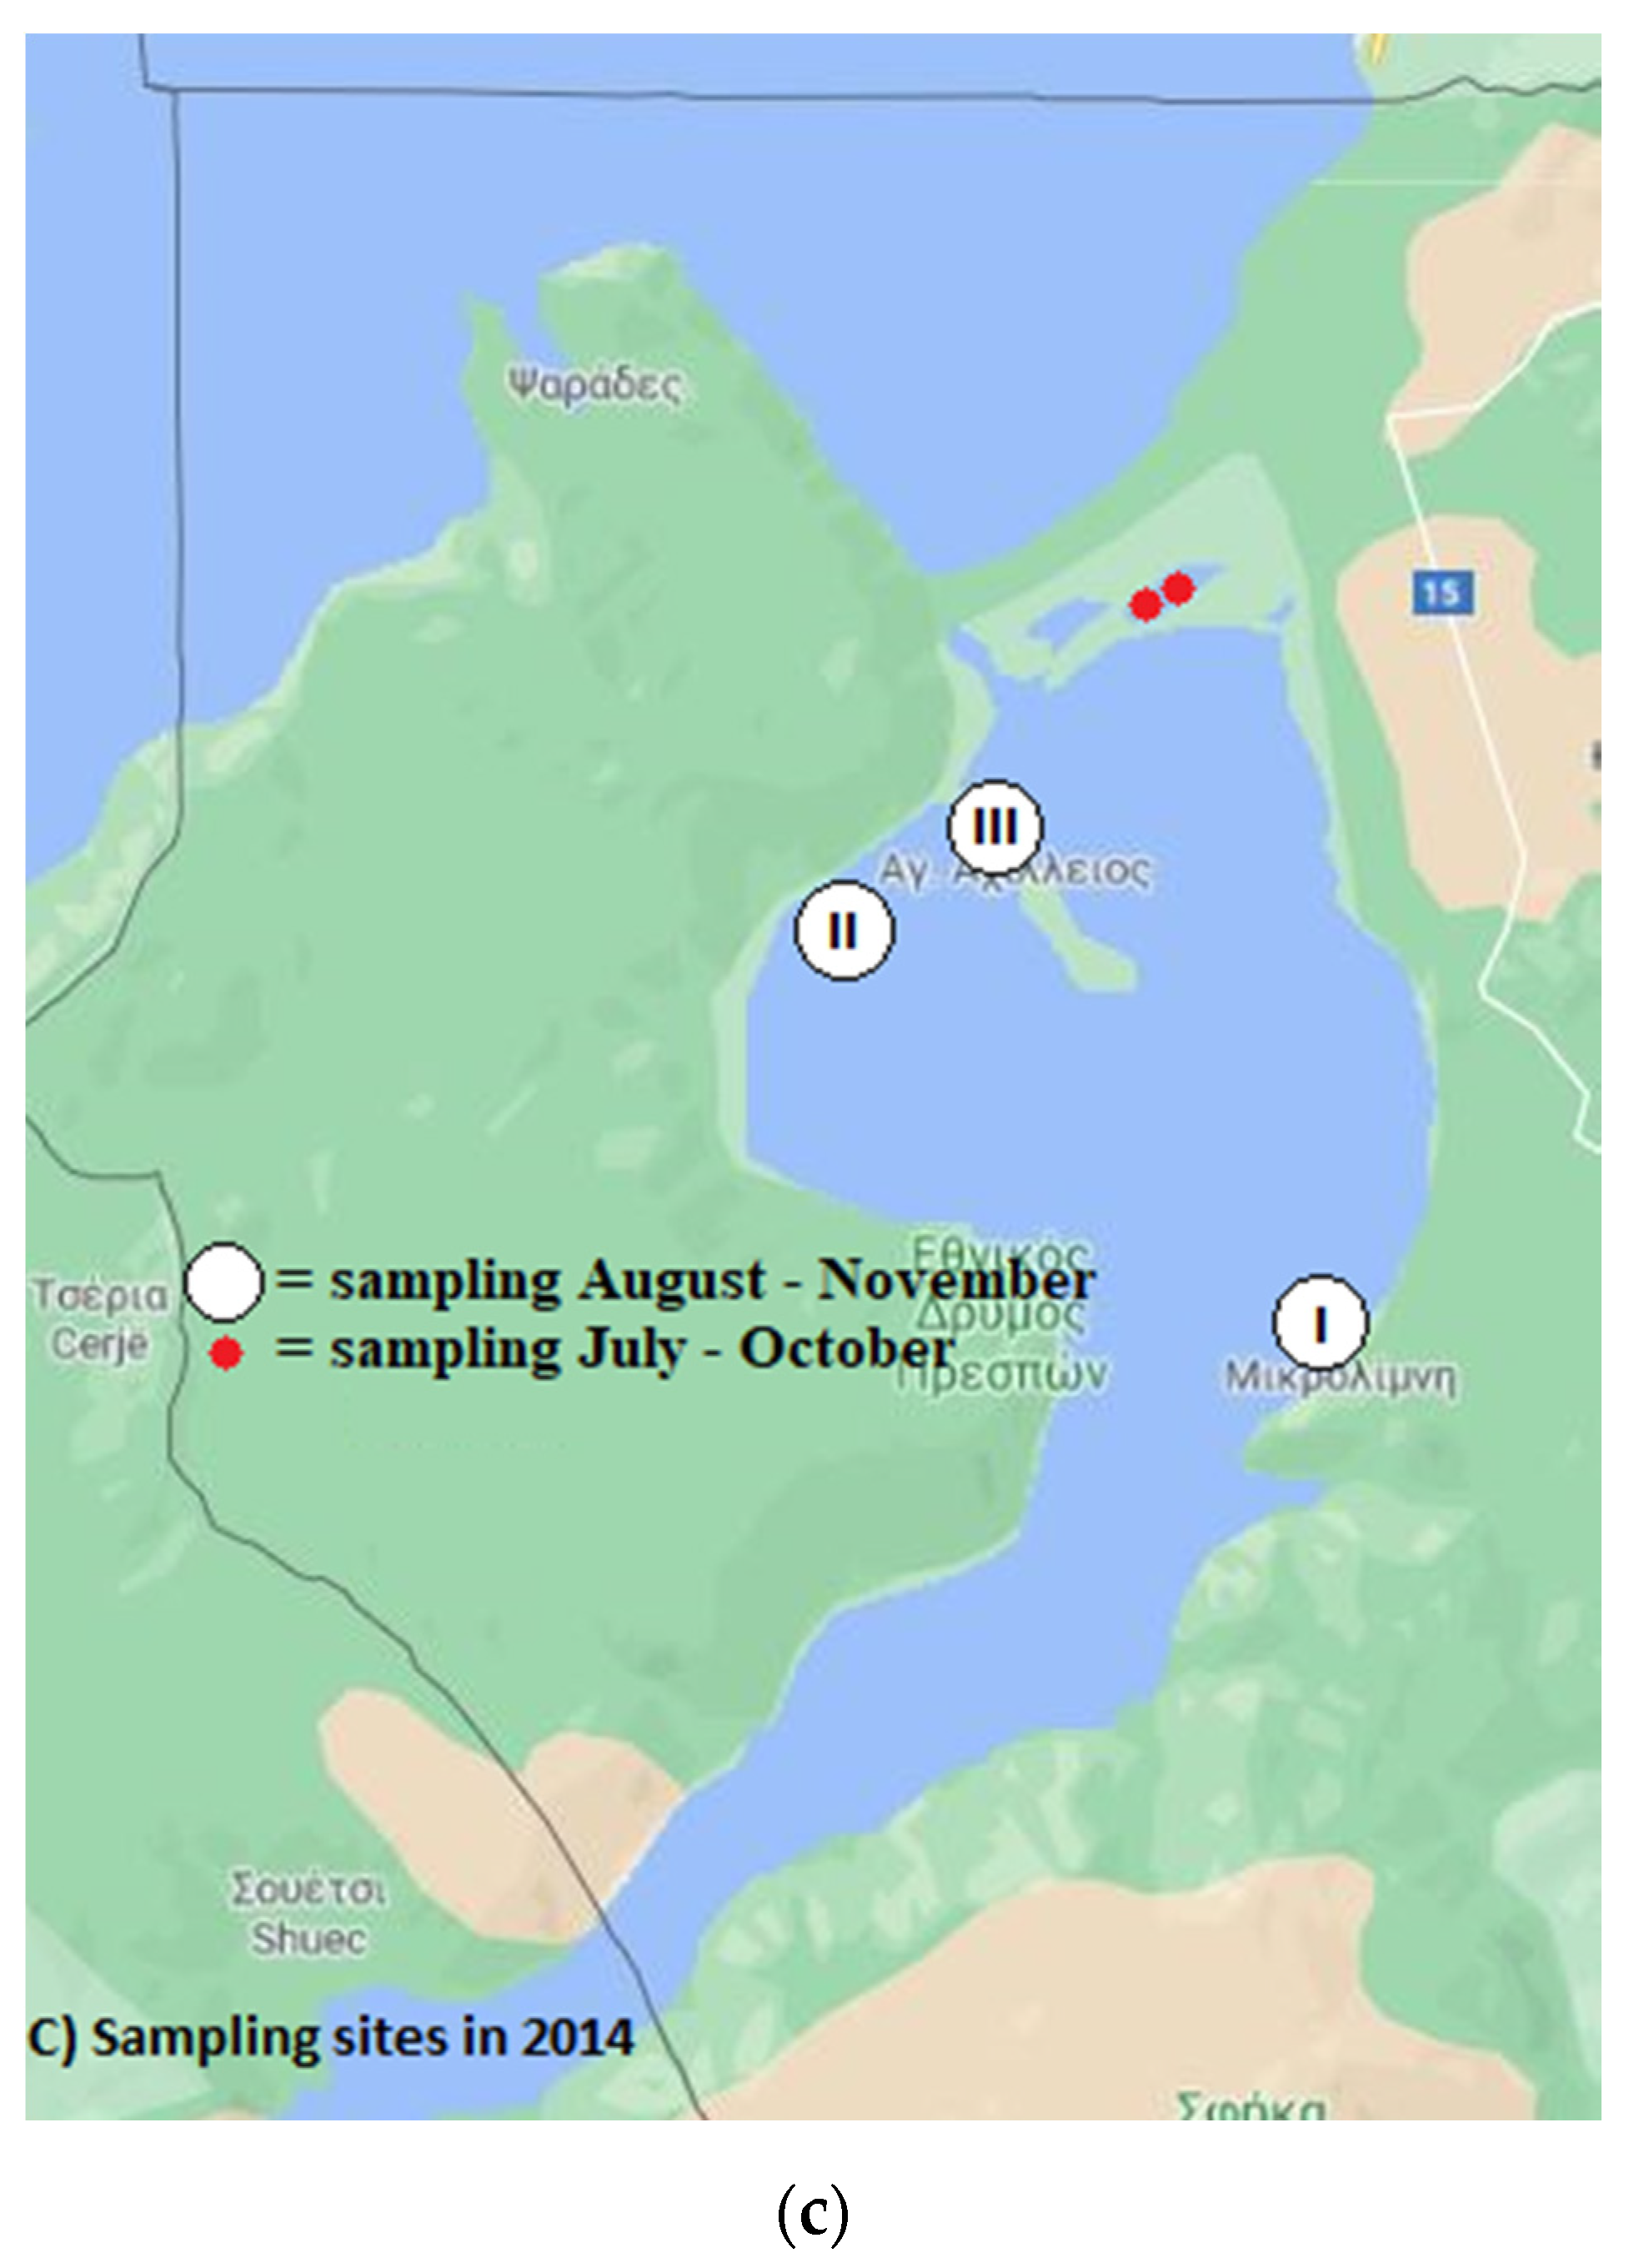
2.1.1. Water Sampling

Most of Lake Lesser Prespa lies in Greece (4841 ha) close to the border with North Macedonia, but a small section (500 ha) stretches into Albania (Figure 1). It is linked through a narrow channel to the larger Lake Great Prespa. Lake Lesser Prespa is situated 853 m above sea level, has an average depth of 4.2 m with a maximum depth of about 8.8 m [9]. It is a typical cyprinid lake well known for its bird fauna [38].
Samples were collected directly in high-density polyethylene (HDPE) bottles five times in the period from 3 July 2012 until 14 August 2012 at five different sites, of which two were located in the Greek part of Great Prespa (i.e., at I Psarades bay and II near the outlet of the river Agios Germanos) and three in Lesser Prespa (i.e., III Aghios Achillios village, IV waterway near pumping station and V near Mikrolimni stream outlet; Figure 1a). In addition, on 30 August 2012 in Great Prespa five additional sites were sampled (indicated by 1–5 in Figure 1a), while 16 sites were sampled on 31 August 2012 in Lesser Prespa (indicated by 6–21 in Figure 1a). Furthermore, on 26 September 2012 three samples were taken from the Vromolimni pond, where most pelicans breed, and two from sites nearby in Lesser Prespa (indicated by red dots in Figure 1a). On 24 September 2013 again three samples were taken from the Vromolimni pond, while on 3 September 2013 ten sites in Lesser Prespa were sampled (Figure 1b).
On 4 August 2014 a surface scum sample was collected near Mikrolimni village at Lake Lesser Prespa (indicated by I in Figure 1c). Later on, during 4, 8, 12, 20 September 2014 and 21, 30 October 2014 regular algal bloom sampling took place in a lakeshore site at the north part of Lake Lesser Prespa (indicated by II in Figure 1c). On 6 November 2014 algal bloom samples were collected near Agios Achillios village at the north part of Lesser Prespa (indicated by III in Figure 1c). Moreover, water samples were collected from Vromolimni Pond on 25 July 2014 and 21 October 21 2014.
On each site the total chlorophyll-a and cyanobacterial chlorophyll-a were determined using an AlgaeTorch (bbe Moldaenke GmbH, Schwentinental, Germany). Water temperature was measured by using an IntelliCAL™ LDO101 Rugged Luminescent/Optical Dissolved Oxygen probe (Hach Lange GmbH, Düsseldorf, Germany).

2.1.2. Animal Tissue Samples

In September 2013, the liver from a deceased young Dalmatian Pelican was removed for cyanotoxin analysis. This pelican had been released back into Vromolimni after having been treated for an injury. It weighed only 3.75 kg at the time of dissection, while it was reported to weigh 6.5 kg at its release. It had been dead for no more than two days, having probably died of exhaustion considering its weight loss and stomach full of parasites. Moreover, livers from three carps caught by local fishermen were collected in 2013. The carp livers were all collected from fish of approximately 50 cm in size that weighed 3–3.5 kg. Carp liver 1 and 2 were collected from fish caught in the south of Lesser Prespa, while liver 3 was collected from a carp caught in the north of Lesser Prespa.
In 25 June 2014 the liver, the stomach and two muscle tissue samples were removed from a deceased Dalmatian Pelican found at Lesser Prespa area for cyanotoxin analysis. It weighted 5–6 kg and showed signs of fatigue before death while nematode parasites were detected internally (stomach, beak). Later on 15 September 2014 the livers from two deceased Dalmatian Pelican and on 20 September 2014 the liver from a deceased Common Otter found at Lesser Prespa area were removed for cyanotoxins analysis too. All the animal tissue samples were stored in the freezer at −20 °C.

2.2. Sample Extraction

2.2.1. Cyanobacteria Samples

Cyanobacterial species in the samples were identified by light microscopy. Water samples, was glass-fiber filtered (Whatman GF/C, Whatman International Ltd., Maidstone, UK) and stored at −20 °C.
Before extraction, filters were transferred to 8 mL glass tubes and placed for two hours in a freeze-drier (Christ Alpha 1-2LD, Martin Christ Gefriertrocknungsanlagen GmbH, Osterode am Harz, Germany). Subsequently, MCs were extracted three times at 60 °C in 2.5 mL 75% methanol-25% Millipore water (v/v). Extracts were dried in a Speedvac (Thermo Scientific Savant SPD121P, Waltham, MA, USA) and reconstituted in 900 μL methanol. The reconstituted samples were transferred to 2 mL Eppendorf vials with a cellulose-acetate filter (0.2 μm, Grace Davison Discovery Sciences, Deerfield, IL, USA) and centrifuged for 5 min at 16,000× g (VWR Galaxy 16DH, VWR International, Buffalo Grove, IL, USA). Filtrates were transferred to amber glass vials for LC-MS/MS analysis. If needed, samples with high MC concentrations were diluted in methanol before re-analysis.

2.2.2. Animal Tissue Samples

All collected animal tissue samples, including liver, muscle and stomach samples, were freeze-dried and then grinded using a pestle and mortar. Five mg of each sample was transferred to a 2 mL Eppendorf tube. MCs were extracted three times at 60 °C in 0.5 mL 75% methanol-25% Millipore water (v/v). Extracts were dried in a SpeedVac and reconstituted in 600 μL methanol. The reconstituted samples were transferred to 2 mL Eppendorf vials with a cellulose-acetate filter and centrifuged for 5 min at 16,000× g. Filtrates were transferred to amber glass vials for MCs analysis.

2.3. LC-MS/MS Analysis

2.3.1. Microcystins and Nodularin

Cyanobacterial samples were analyzed for eight MC variants (dm-7-MC-RR, MC-RR, MC-YR, dm-7-MC-LR, MC-LR, MC-LY, MC-LW and MC-LF) and nodularin (NOD) by LC-MS/MS as described in [28]. MS/MS settings for each compound are shown in Table 3 in [28]. Calibration standards were obtained from DHI LAB Products (Hørsholm, Denmark) and prepared in methanol, samples were quantified against a calibration curve and subsequently corrected for recovery. Each sample was injected once. Information on recovery, repeatability, limit of detection and limit of quantification of the analysis is given in [28].

2.3.2. Anatoxins and Cylindrospermopsins

Cyanobacterial seston samples were analyzed for anatoxin-a, homoanatoxin-a, their metabolites dihydroanatoxin-a, dihydrohomoanatoxin-a, epoxyanatoxin-a and epoxyhomoanatoxin-a and for cylindrospermopsin, 7-epi-cylindrospermopsin and 7-deoxy-cylindrospermopsin by LC-MS/MS as described in [39]. MS/MS settings for each compound are shown in Table 3 in [28].

2.3.3. Saxitoxins

Cyanobacterial samples were analyzed for 10 saxitoxin/gonyautoxin (STX/GTX) variants (STX, dcSTX, NEO, dcNEO, GTX1, GTX2, GTX3, GTX4, dcGTX2, dcGTX3) and nodularin (NOD) by LC-MS/MS as described in [40]. MS/MS settings for each compound are shown in Table 1 in [40].

3. Results

3.1. Lake Great Prespa

In the summer of 2012, MCs were only occasionally detected at nearshore and offshore sites sampled at the Greek part of the lake and, if so, the total MC concentrations were below 0.2 µg L−1 (Figure 2a,b) (Tables S1 and S2). The mean cyanobacterial biomass in Lake Great Prespa on 30 August 2012, expressed as cyanobacterial chlorophyll-a concentrations, was on average 2.0 (±0.1 SD) µg L−1. Total chlorophyll-a concentrations were on average 5.9 (±2.1 SD) µg L−1 (Figure 3). Water temperature varied between 22.1–31.6 °C (mean 24.7 ± 2.1 SD).

3.2. Lake Lesser Prespa

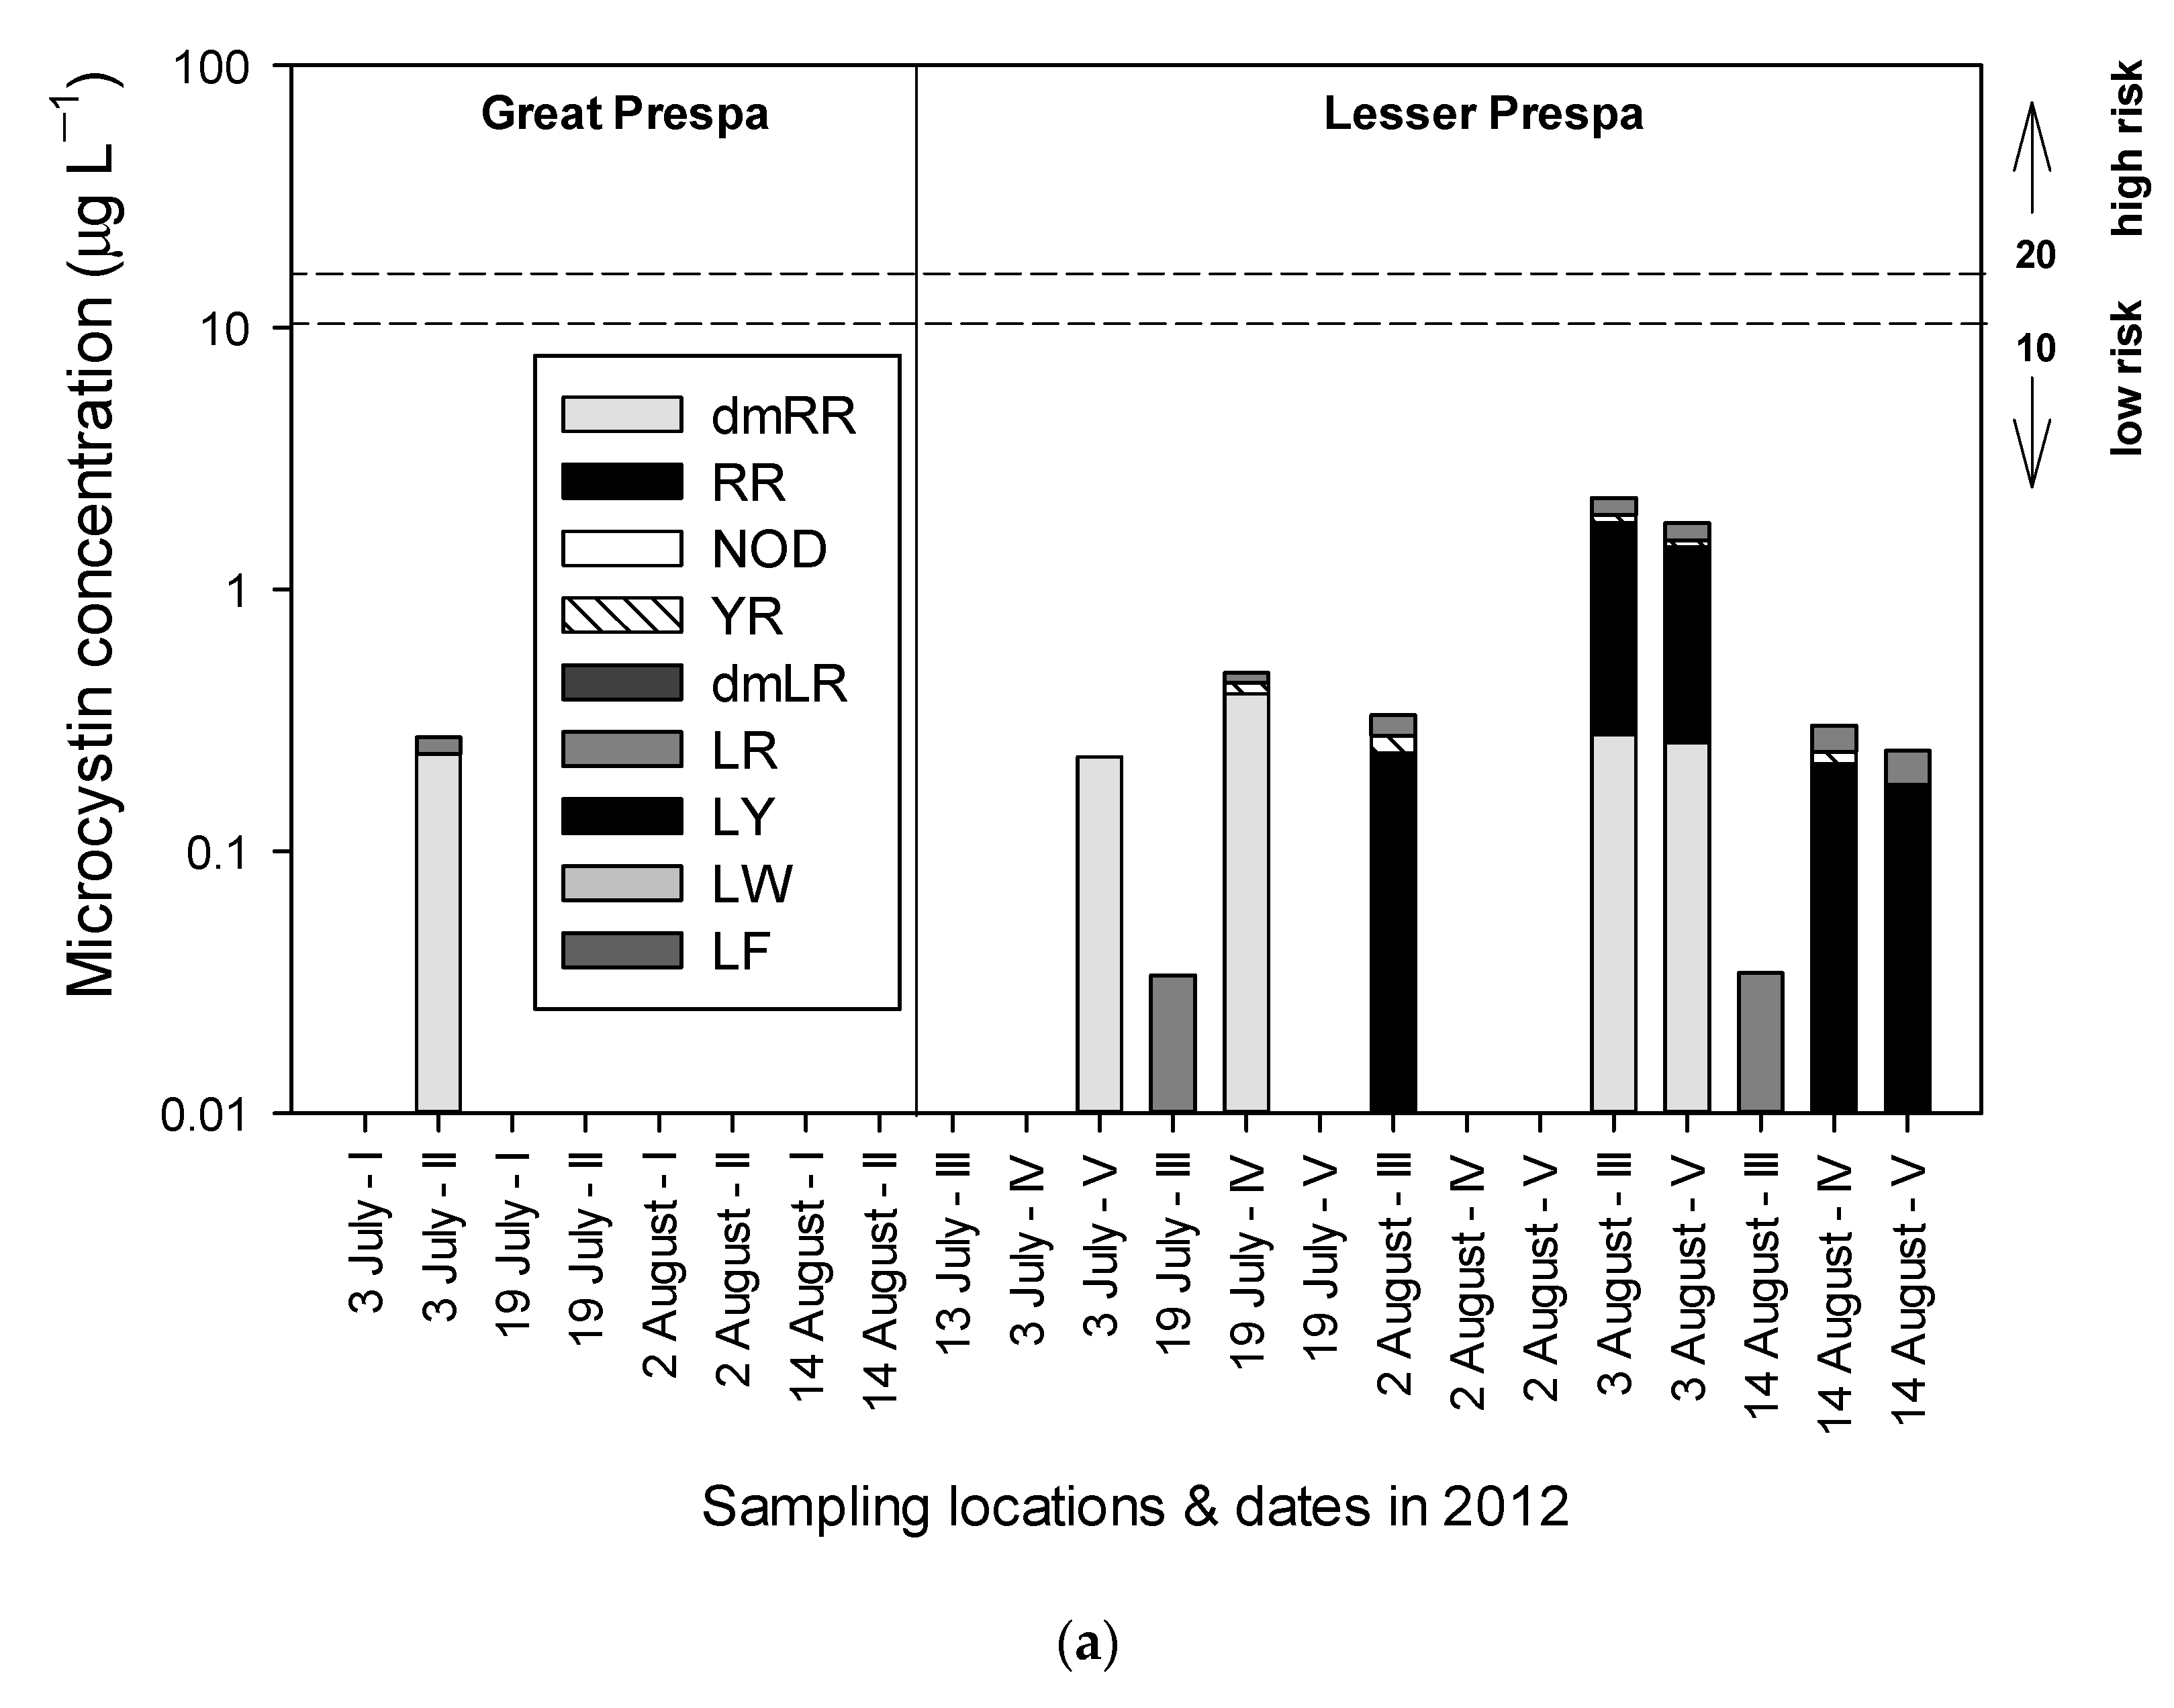
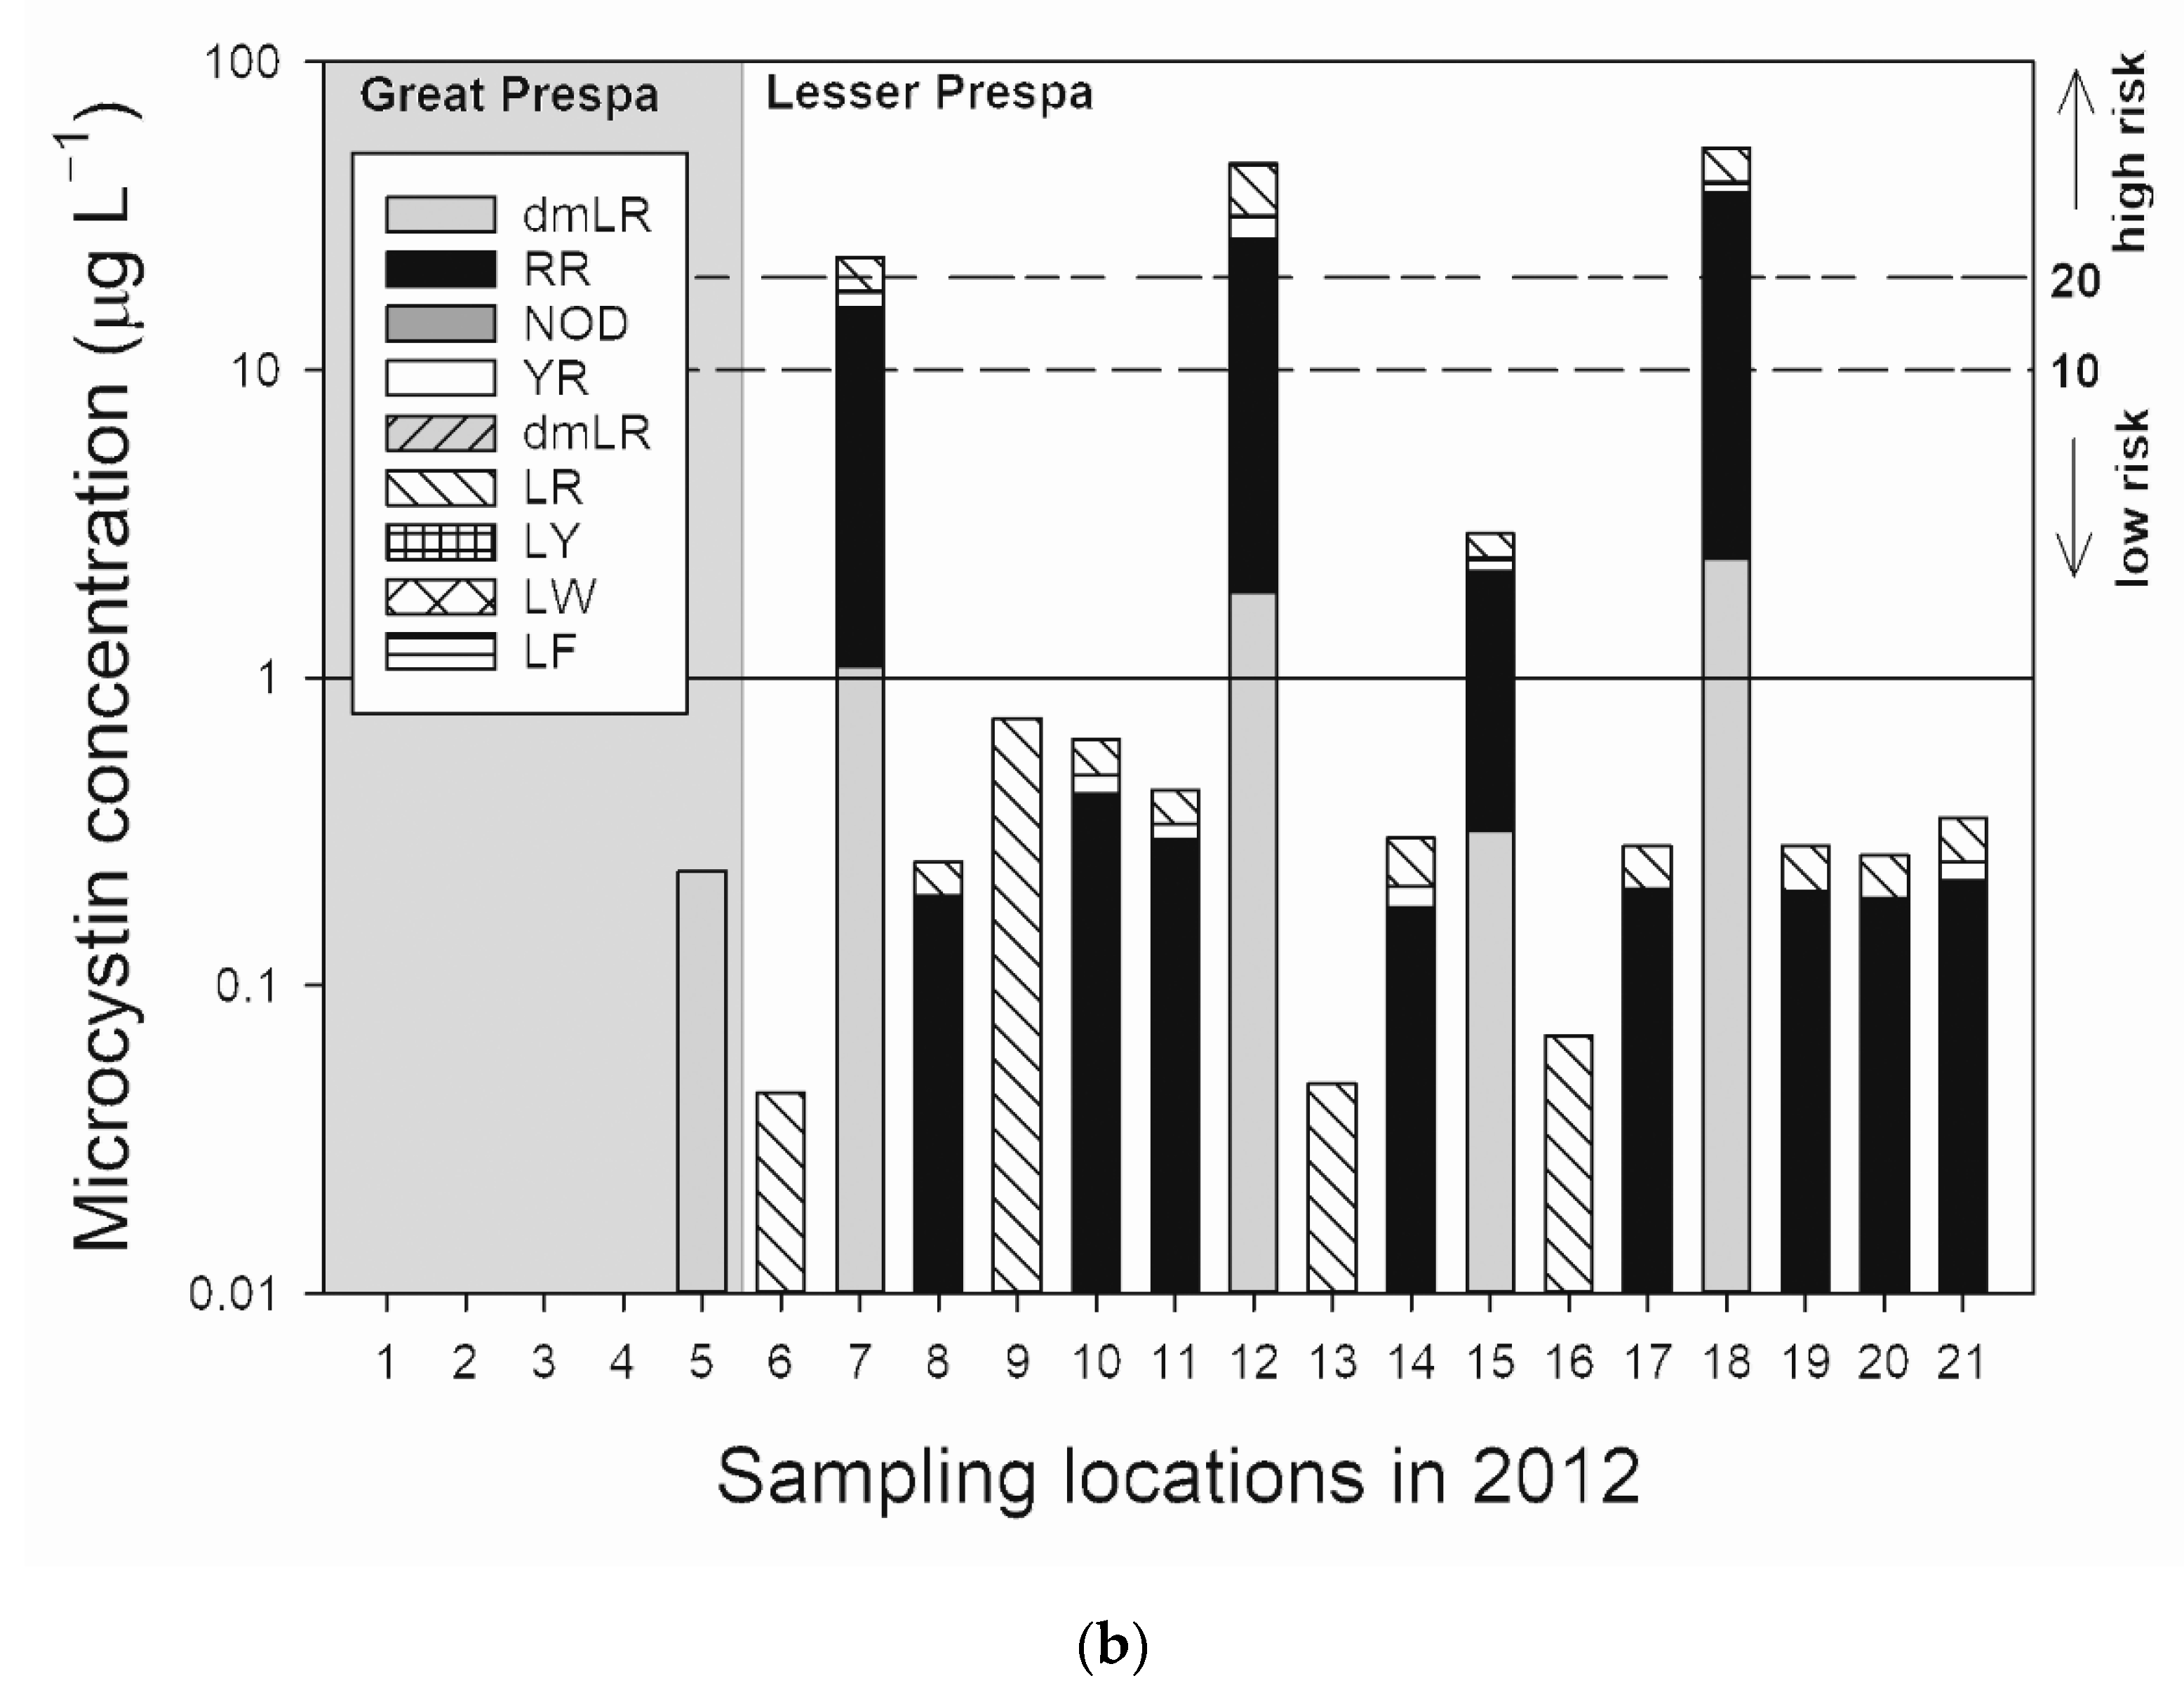
3.2.1. Sampling in 2012

In Lesser Prespa during 3 July –14 August 14 2012, rather low MC concentrations of up to 2.2 µg L−1 were detected near lakeshore sites (mean 0.4 ± 0.7 SD µg L−1) (Figure 2). However, during an extensive lake sampling on 31 August 2012, MC concentrations up to 52.4 µg L−1 were found (Figure 2b). The median MC concentration in lake Lesser Prespa on 31 August 2012 was 0.28 ± 0.76 SD µg L−1, the mean 8.1 µg L−1 with a standard deviation of 17.2 µg L−1 (Figure 2b) (Table S2). Total chlorophyll-a concentrations were ranging between 3 µg L−1 at site 14 to 390 µg L−1 at site 18 (Figure 3). The median chlorophyll-a concentration was 7.4 g L−1 which would classify the lake as mesotrophic, bordering to nearly eutrophic (cf. [42,43]). The MC:chlorophyll-a ratio in Lake Lesser Prespa in 2012 varied between 0.01 and 0.47. The highest chlorophyll-a concentrations were found particularly near the shores where cyanobacterial chlorophyll had a high share to the total chlorophyll-a (Figure 3). At these sites also the three highest MC concentrations were measured which exceeded 20 µg L−1 (sampling points 7, 12, and 18 with cyanobacterial chlorophyll-a concentrations of 50, 98 and 245 µg L−1 respectively) (Figure 2b and Figure 3). Water temperature during the sampling time on 31 August 2012 was ranging between 18.8–28.3 °C.
In the period 3 July – 14 August 2012 MC-RR comprised 70.5% (±2.8%) of the total MC-pool, followed by the variant dm-7-MC-RR (53 ± 40%), MC-LR (37 ± 36.5%) and MC-YR (7.7 ± 2.5%) (Figure 2a). No dm-7-MC-LR, MC-LW MC-LF variants or Nodularin (NOD) were detected (Figure 2a). The most abundant MC variant on 31 August 2012 was MC-RR that comprised 62% (±8%) of the total MC-pool, followed by MC-LR contributing 25% (±5%); the variant MC-YR contributed 8% (±3%), dm-7-MC-RR made-up 4% (±1%), and dm-7-MC-LR 1% of the total MC-pool (Figure 2b). The variant dm-7-MC-RR was detected at four sites in Lesser Prespa (LOD = 226 ng L−1), while dm-7-MC-LR was detected at eleven sites and quantified at 4 sites (LOD = 25 ng L−1). Moreover, at the sampling sites the phytoplankton community was dominated by Microcystis wesenbergii, Dolichospermum lemmermannii, and M. aeruginosa (Figure 4) which clearly indicates eutrophic conditions [44].

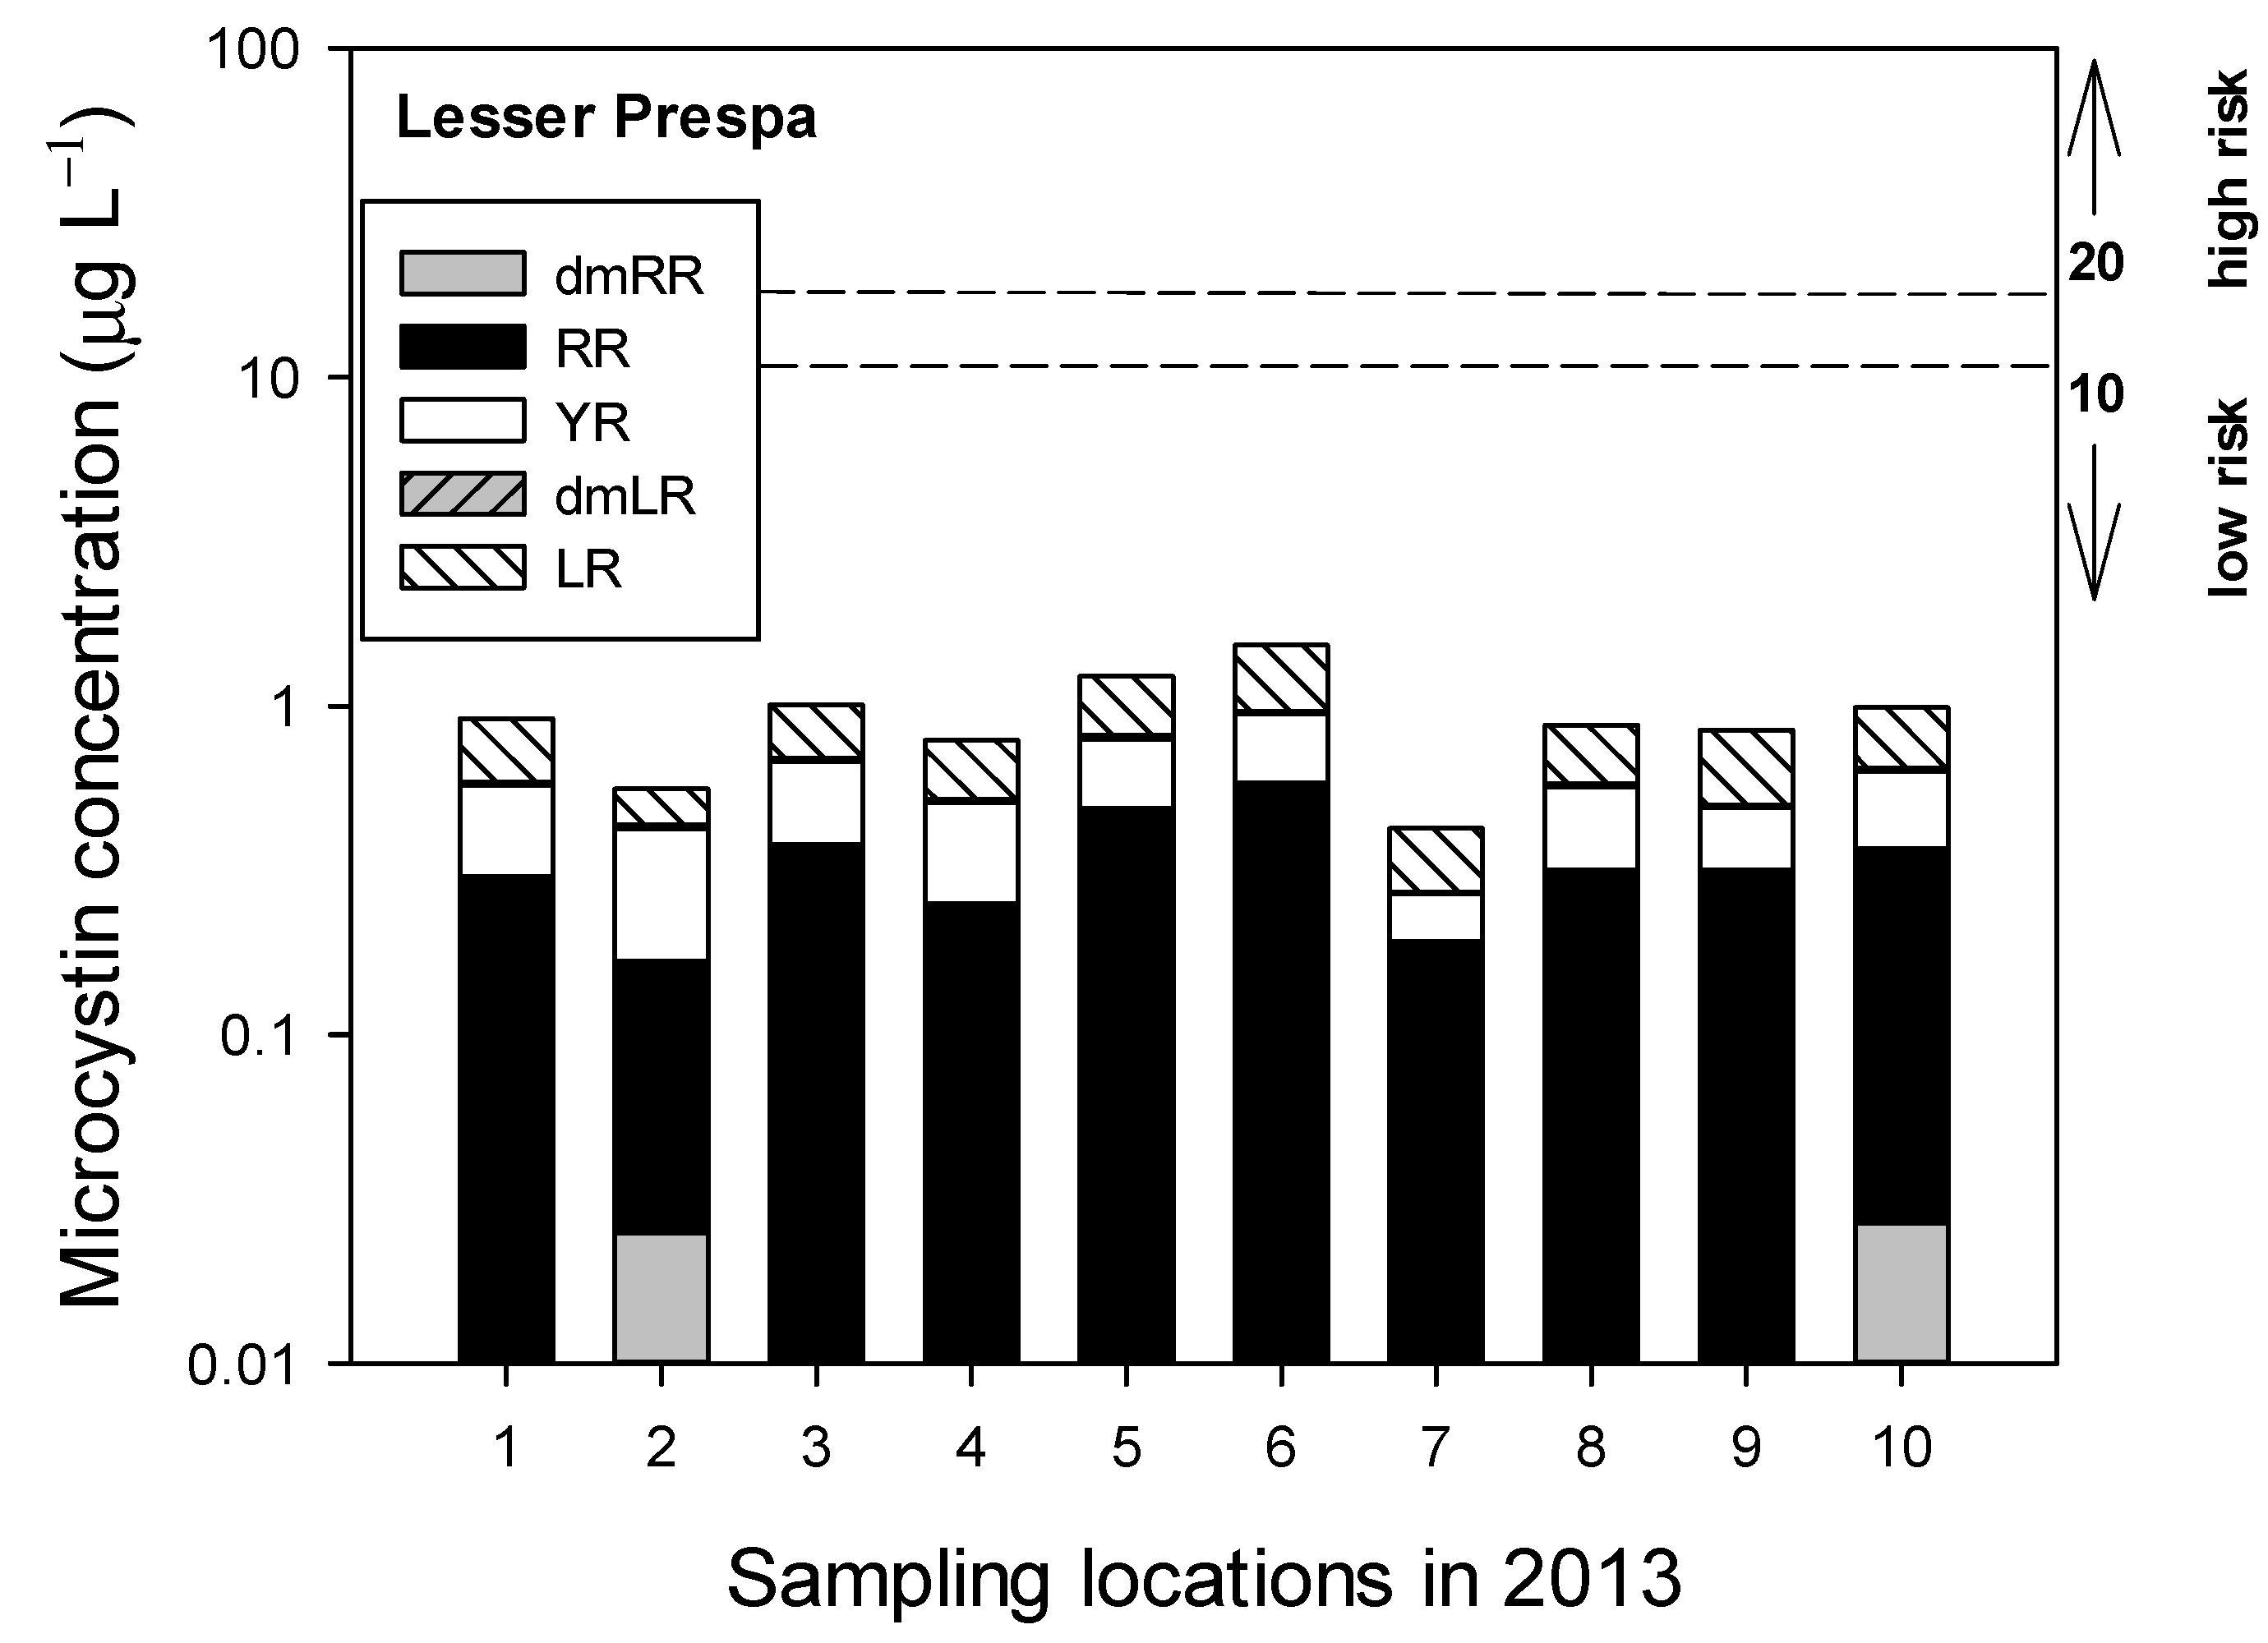
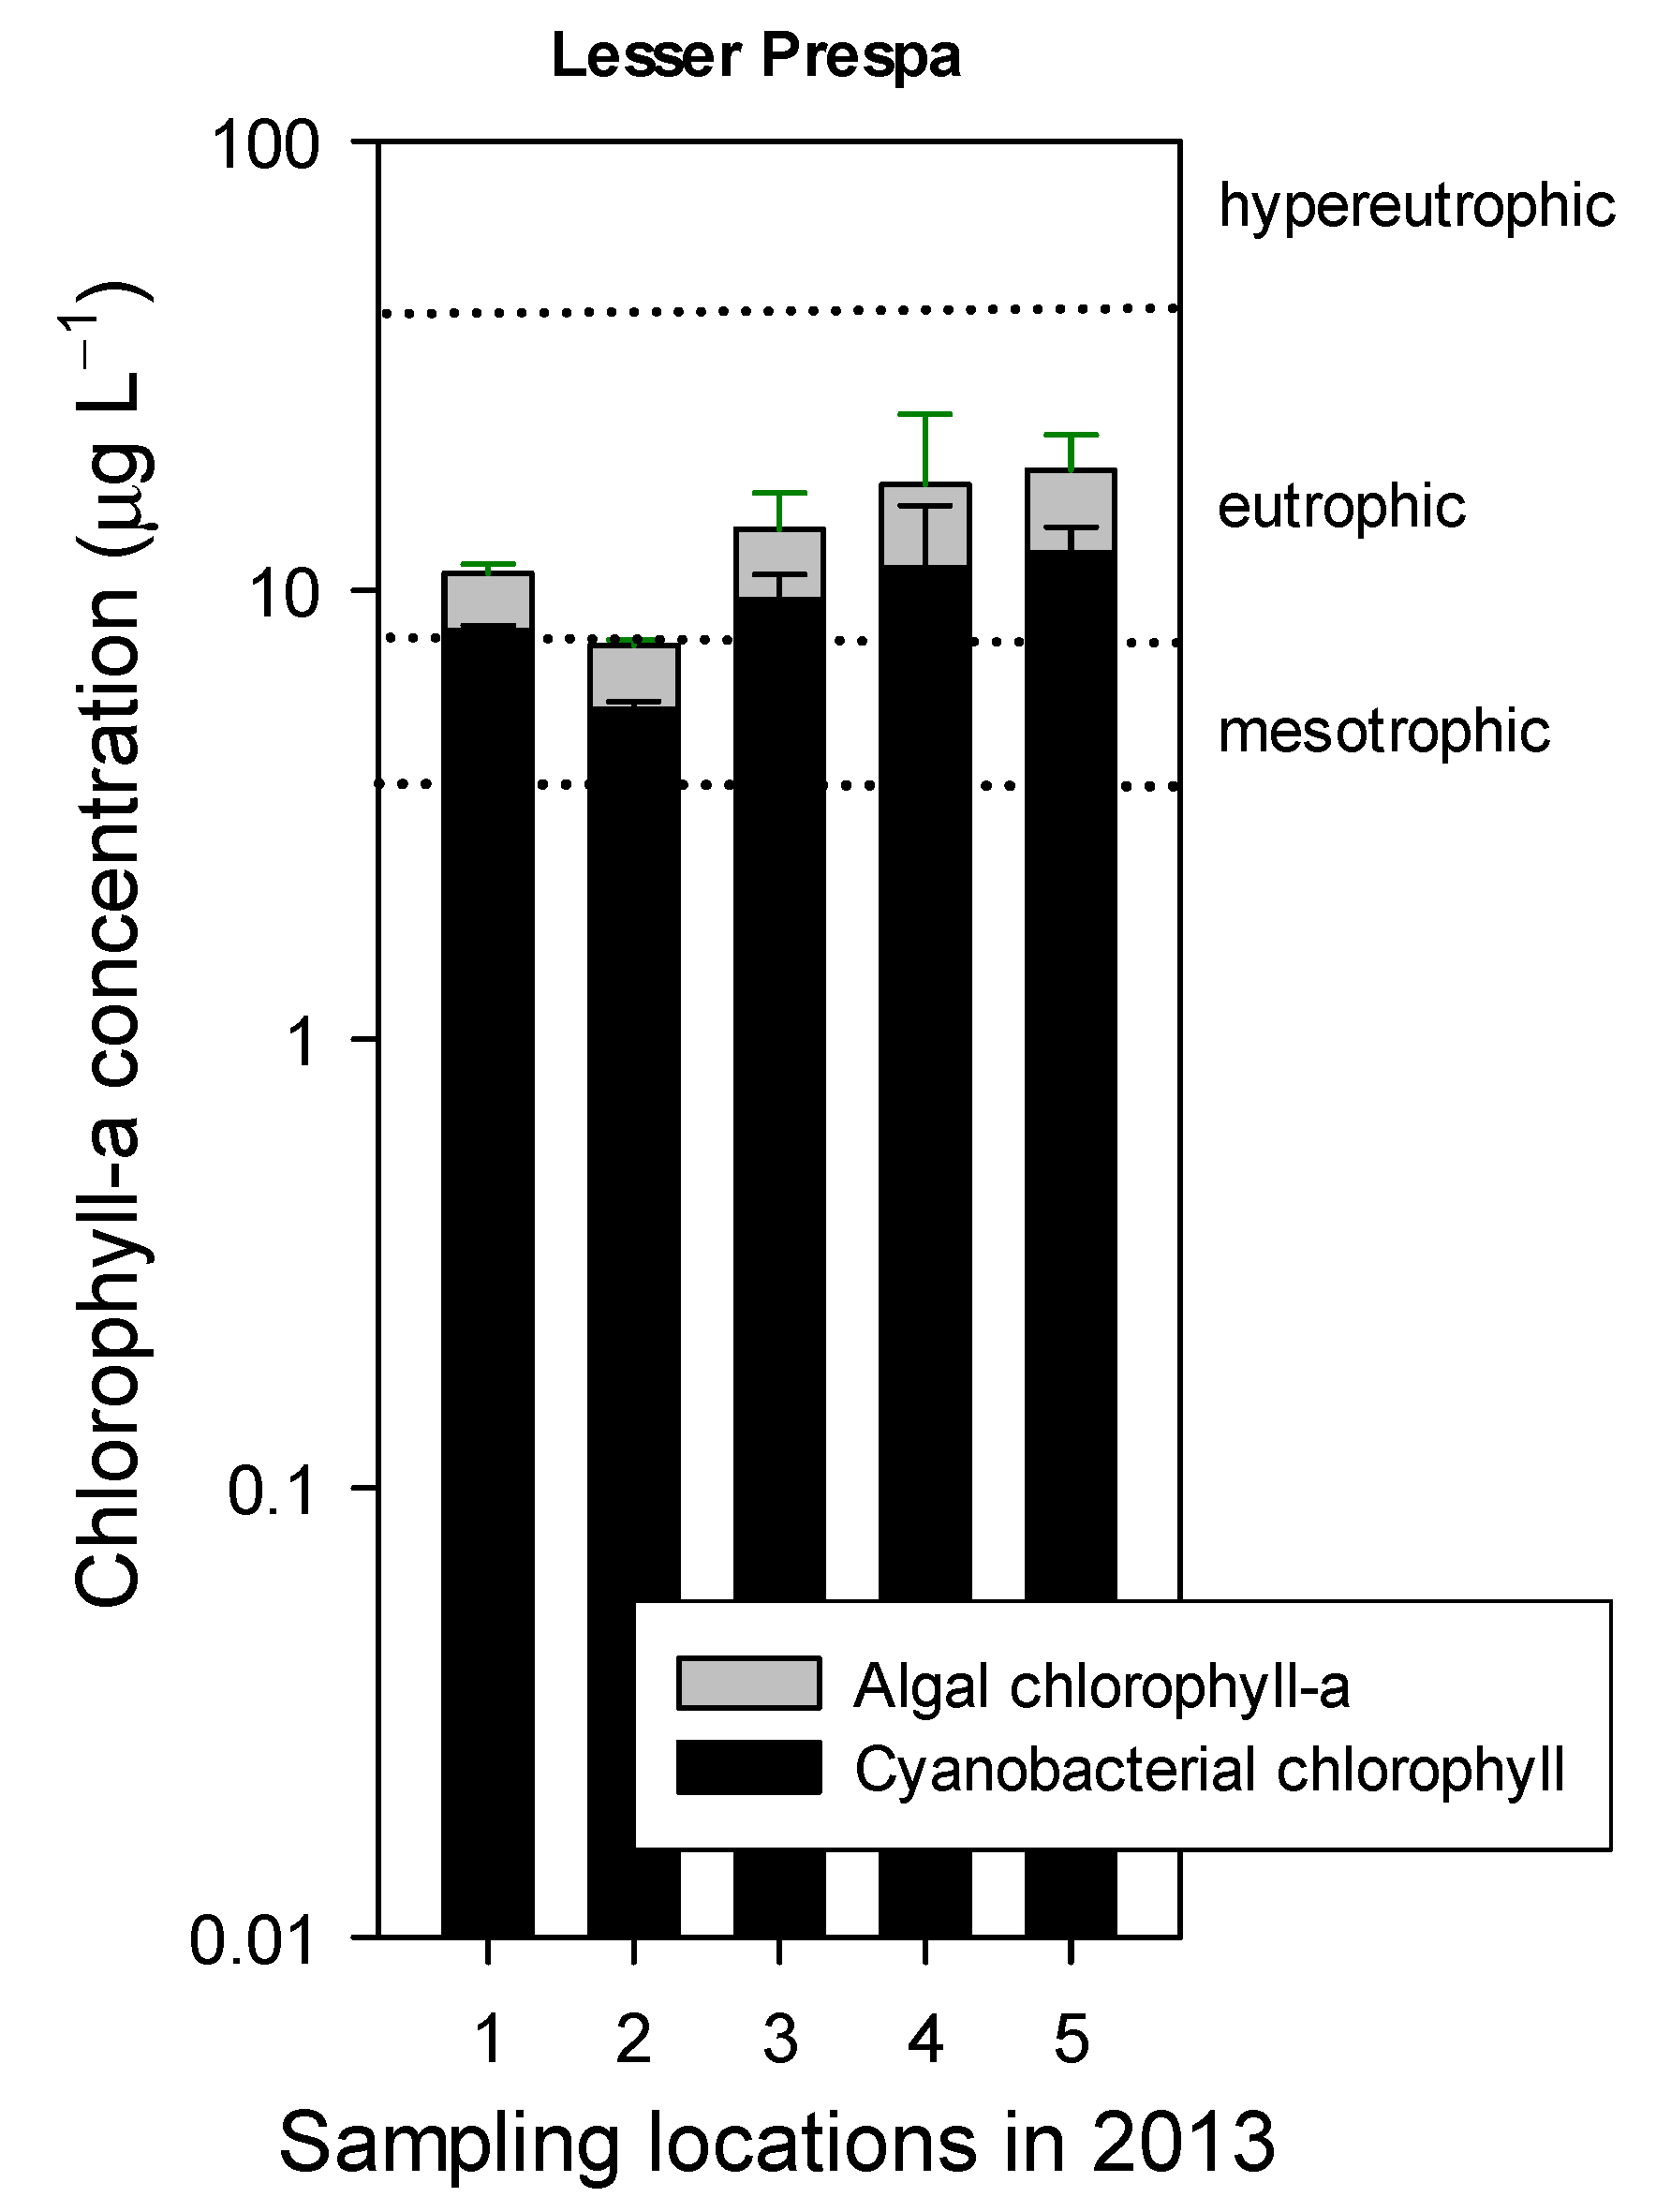
3.2.2. Sampling in 2013

On 3 September 2013, the mean MC concentration in ten sampling locations in Lake Lesser Prespa (Figure 1b) was 0.92 (±0.31 SD) µg L−1 with a range between 0.42 and 1.53 µg L−1 and showed low spatial heterogeneity (Figure 5, Table S3). The MC values were comparable to the ones measured in 2012 at sites where there was no cyanobacterial accumulation (0.51 ± 0.76 SD µg L−1). Nonetheless, a Mann-Whitney Rank Sum Test indicated that median total MC concentration in 2013 (0.90 ± 0.31 SD µg L−1) was significantly (p = 0.002) greater than the median total MC concentration in 2012 (0.28 ± 0.76 SD µg L−1).
The variants MC-RR and MC-LR made up 36% ± 5% and 34% ± 5% respectively of the total MC pool while the variant MC-YR contributed 28% (±8%) and dm-7-MC-RR 1% (±2%), dm-7-MC-LR each made-up 1% of the total MC-pool (Figure 5). This difference in relative contribution of MC-congeners may have been caused by differences in the relative abundance of different species or strains of cyanobacteria. MC-variants LY, LW, LF and nodularin (NOD) were not detected in 2013. A microscopic inspection of the water samples revealed a dominance M. wesenbergii and M. aeruginosa. Moreover, in the seston samples collected in early September 2013, no anatoxin-a, homoanatoxin-a nor their metabolites dihydroanatoxin-a, dihydrohomoanatoxin-a, epoxyanatoxin-a and epoxyhomoanatoxin-a were detected. Likewise, no cylindrospermopsin, 7-epi-cylindrospermopsin,7-deoxy-cylindrospermopsin, saxitoxins or gonyautoxins were found.
In September 2013 the median total chlorophyll-a concentration was 15.7 (mean total chlorophyll was 15.4 ± 5.6 SD µg L−1) (Figure 6). MC:chlorophyll-a ratio was ranging between 0.05–0.08 for sites 1 to 5. Moreover, median cyano-chlorophyll was 10.2 μg L−1 (mean cyano-chlorophyll was 10.4 ± 3.1 SD μg L−1) and most of the chlorophyll-a was cyanobacterial chlorophyll (Figure 6). No visible surface accumulation of cyanobacteria was observed in September 2013. Water temperature in the lake was significantly lower in September 2013 than in 2012 (p < 0.001) and fluctuated between 18.2 to 21.2 °C.

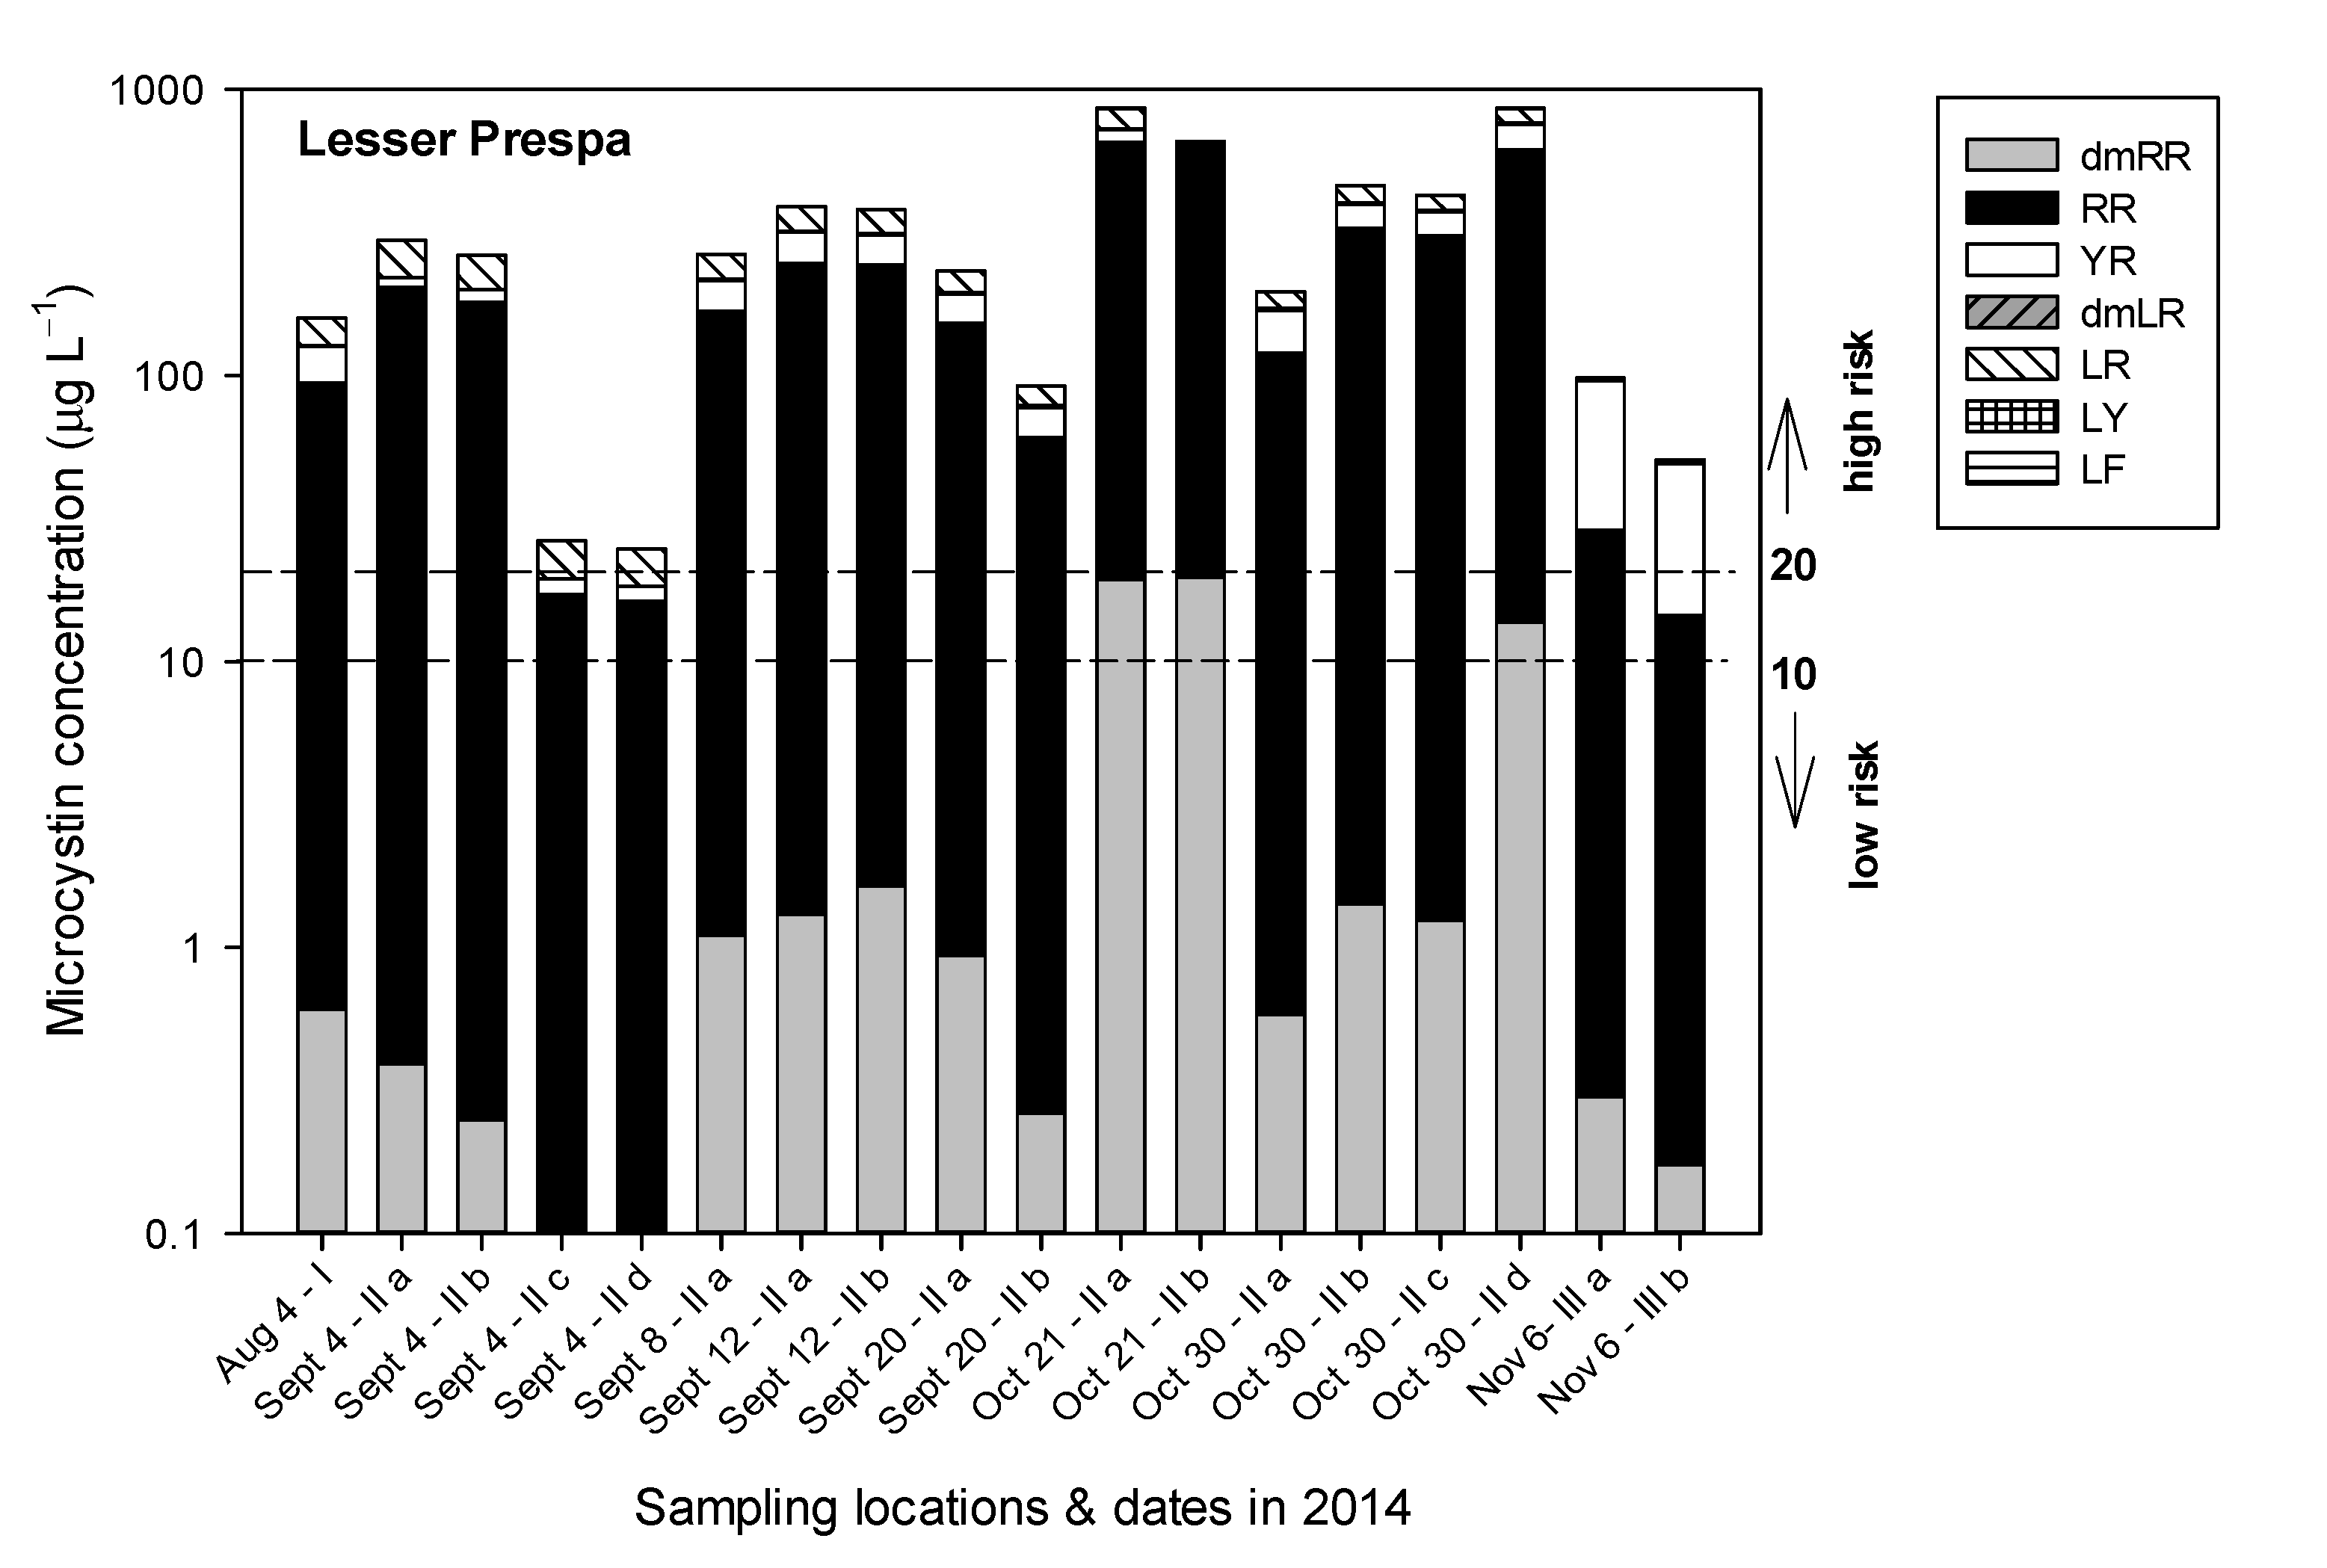
3.2.3. Sampling in 2014

During August–November 2014, dense accumulations (scums) of cyanobacteria (Figure A1 and Figure A2 in Appendix A) have been detected occasionally near the lakeshores of Lake Lesser Prespa (Figure 1c). The mean MC concentration in these locations was 310 ± 256 SD μg L−1 and were ranging between 25 and 861µg L−1 (Figure 7) (Table S4). In more detail, MC concentration in seston sample collected on 4 August 2014 at site I (near Mikrolimni village, Figure 1c) was 160 μg L−1 while total chlorophyll-a and cyanobacterial chlorophyll were up to 108 and 88 μg L−1 respectively at the same time. A regular algal-bloom sampling at site II (north-east lakeshores, Figure 1c) during September 2014 show that mean MC concentration was ranging from 153 ± 148 SD μg L−1 to 386 ± 7 SD μg L−1 while during October 2014 from 487 ± 276 SD μg L−1 to 761 ± 397 SD μg L−1 (Figure 7). Chlorophyll measurements at the algal bloom formations at site 2 during 4-12 September 2014 showed that total chlorophyll-a varied between 84–170 μg L−1 and cyanobacterial chlorophyll between 71–126 μg L−1. On 6 November 2014at site IIIa and IIIb (near Agios Achillios village, Figure 1c), MC concentration of a surface accumulation was up to 75 ± 34 SD μg L−1 (Figure 7). MC:Chlorophyll ratios in sites I and II (Figure 1c) were ranging between 0.2 and 3.2.
The variant MC-RR made up the largest part of the total MC pool (60 ± 20%) measured in the algal blooms at sites I, II and III (Figure 1c). Next, MC-YR and MC-LR were contributing almost equally 21% (±19%) and 20% (±10%). The variants dm-7-MC-RR (0.6 ± 0.8%), dm-7-MC-LR (1.0 ± 0.7%) and MC-LY (0.1 ± 0.1%) contributed much less to the total MC pool while nodularin (NOD) and MC-FW were not detected in any of the samples (Figure 7).

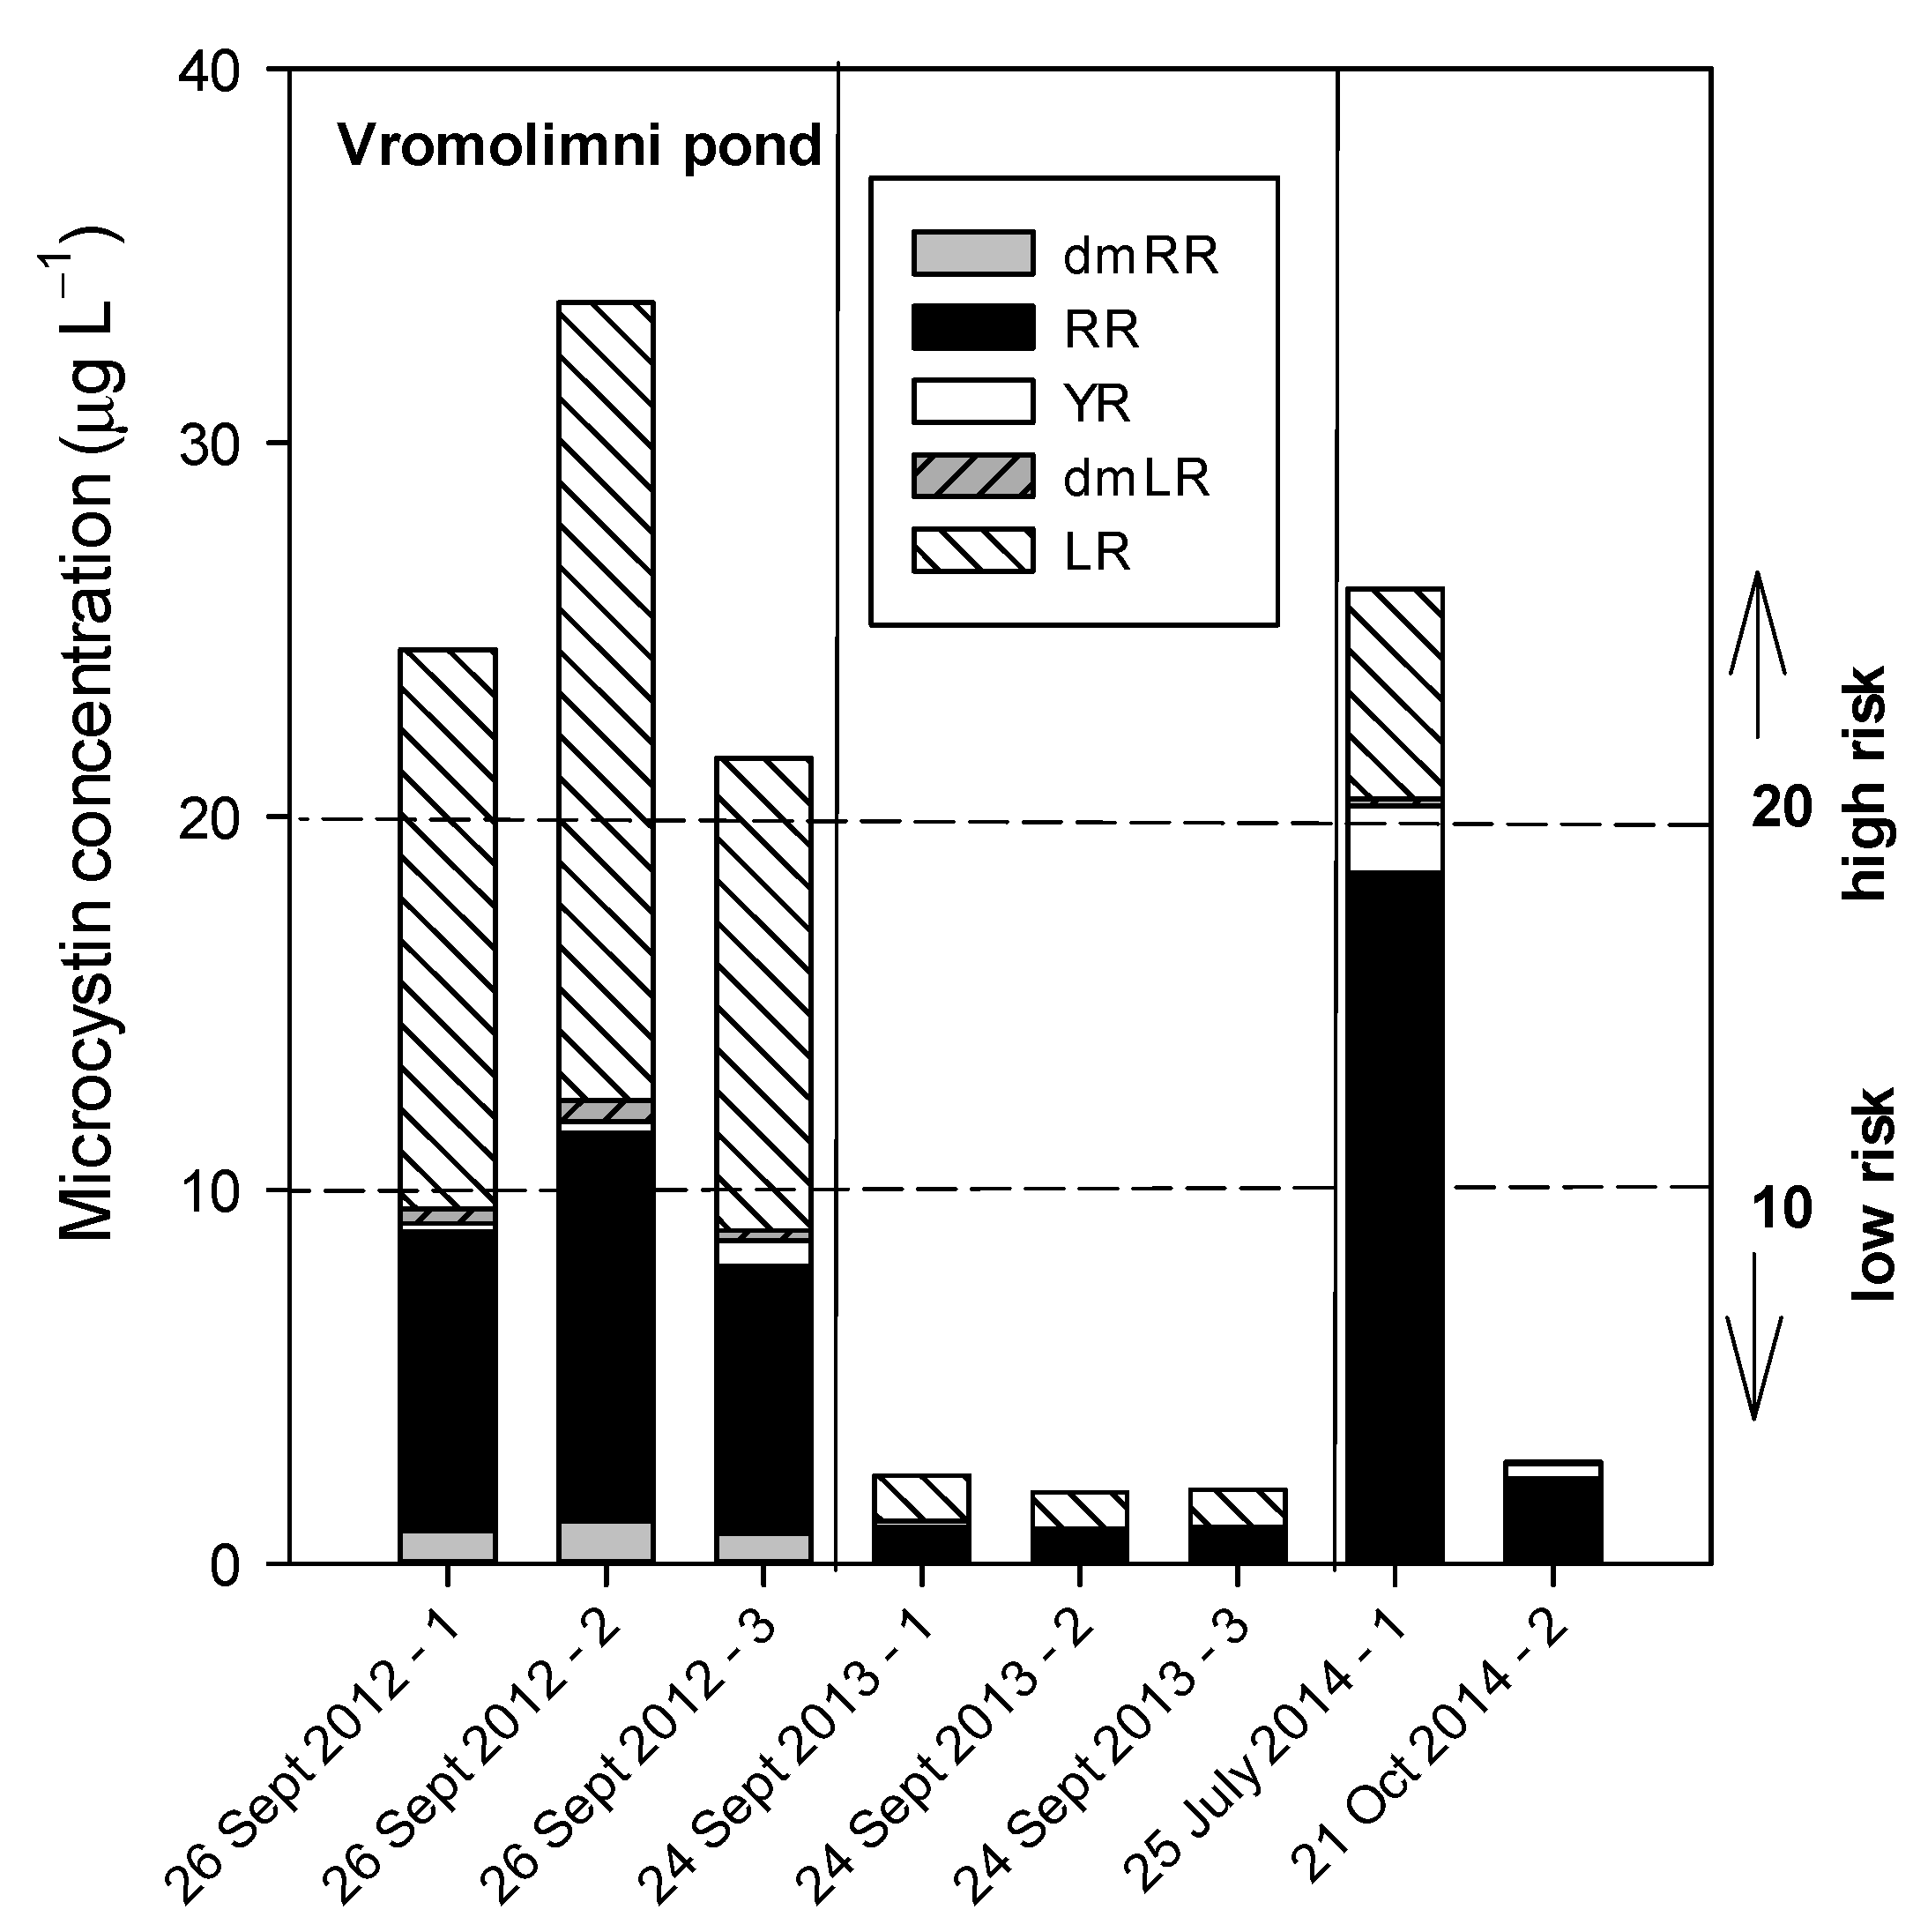
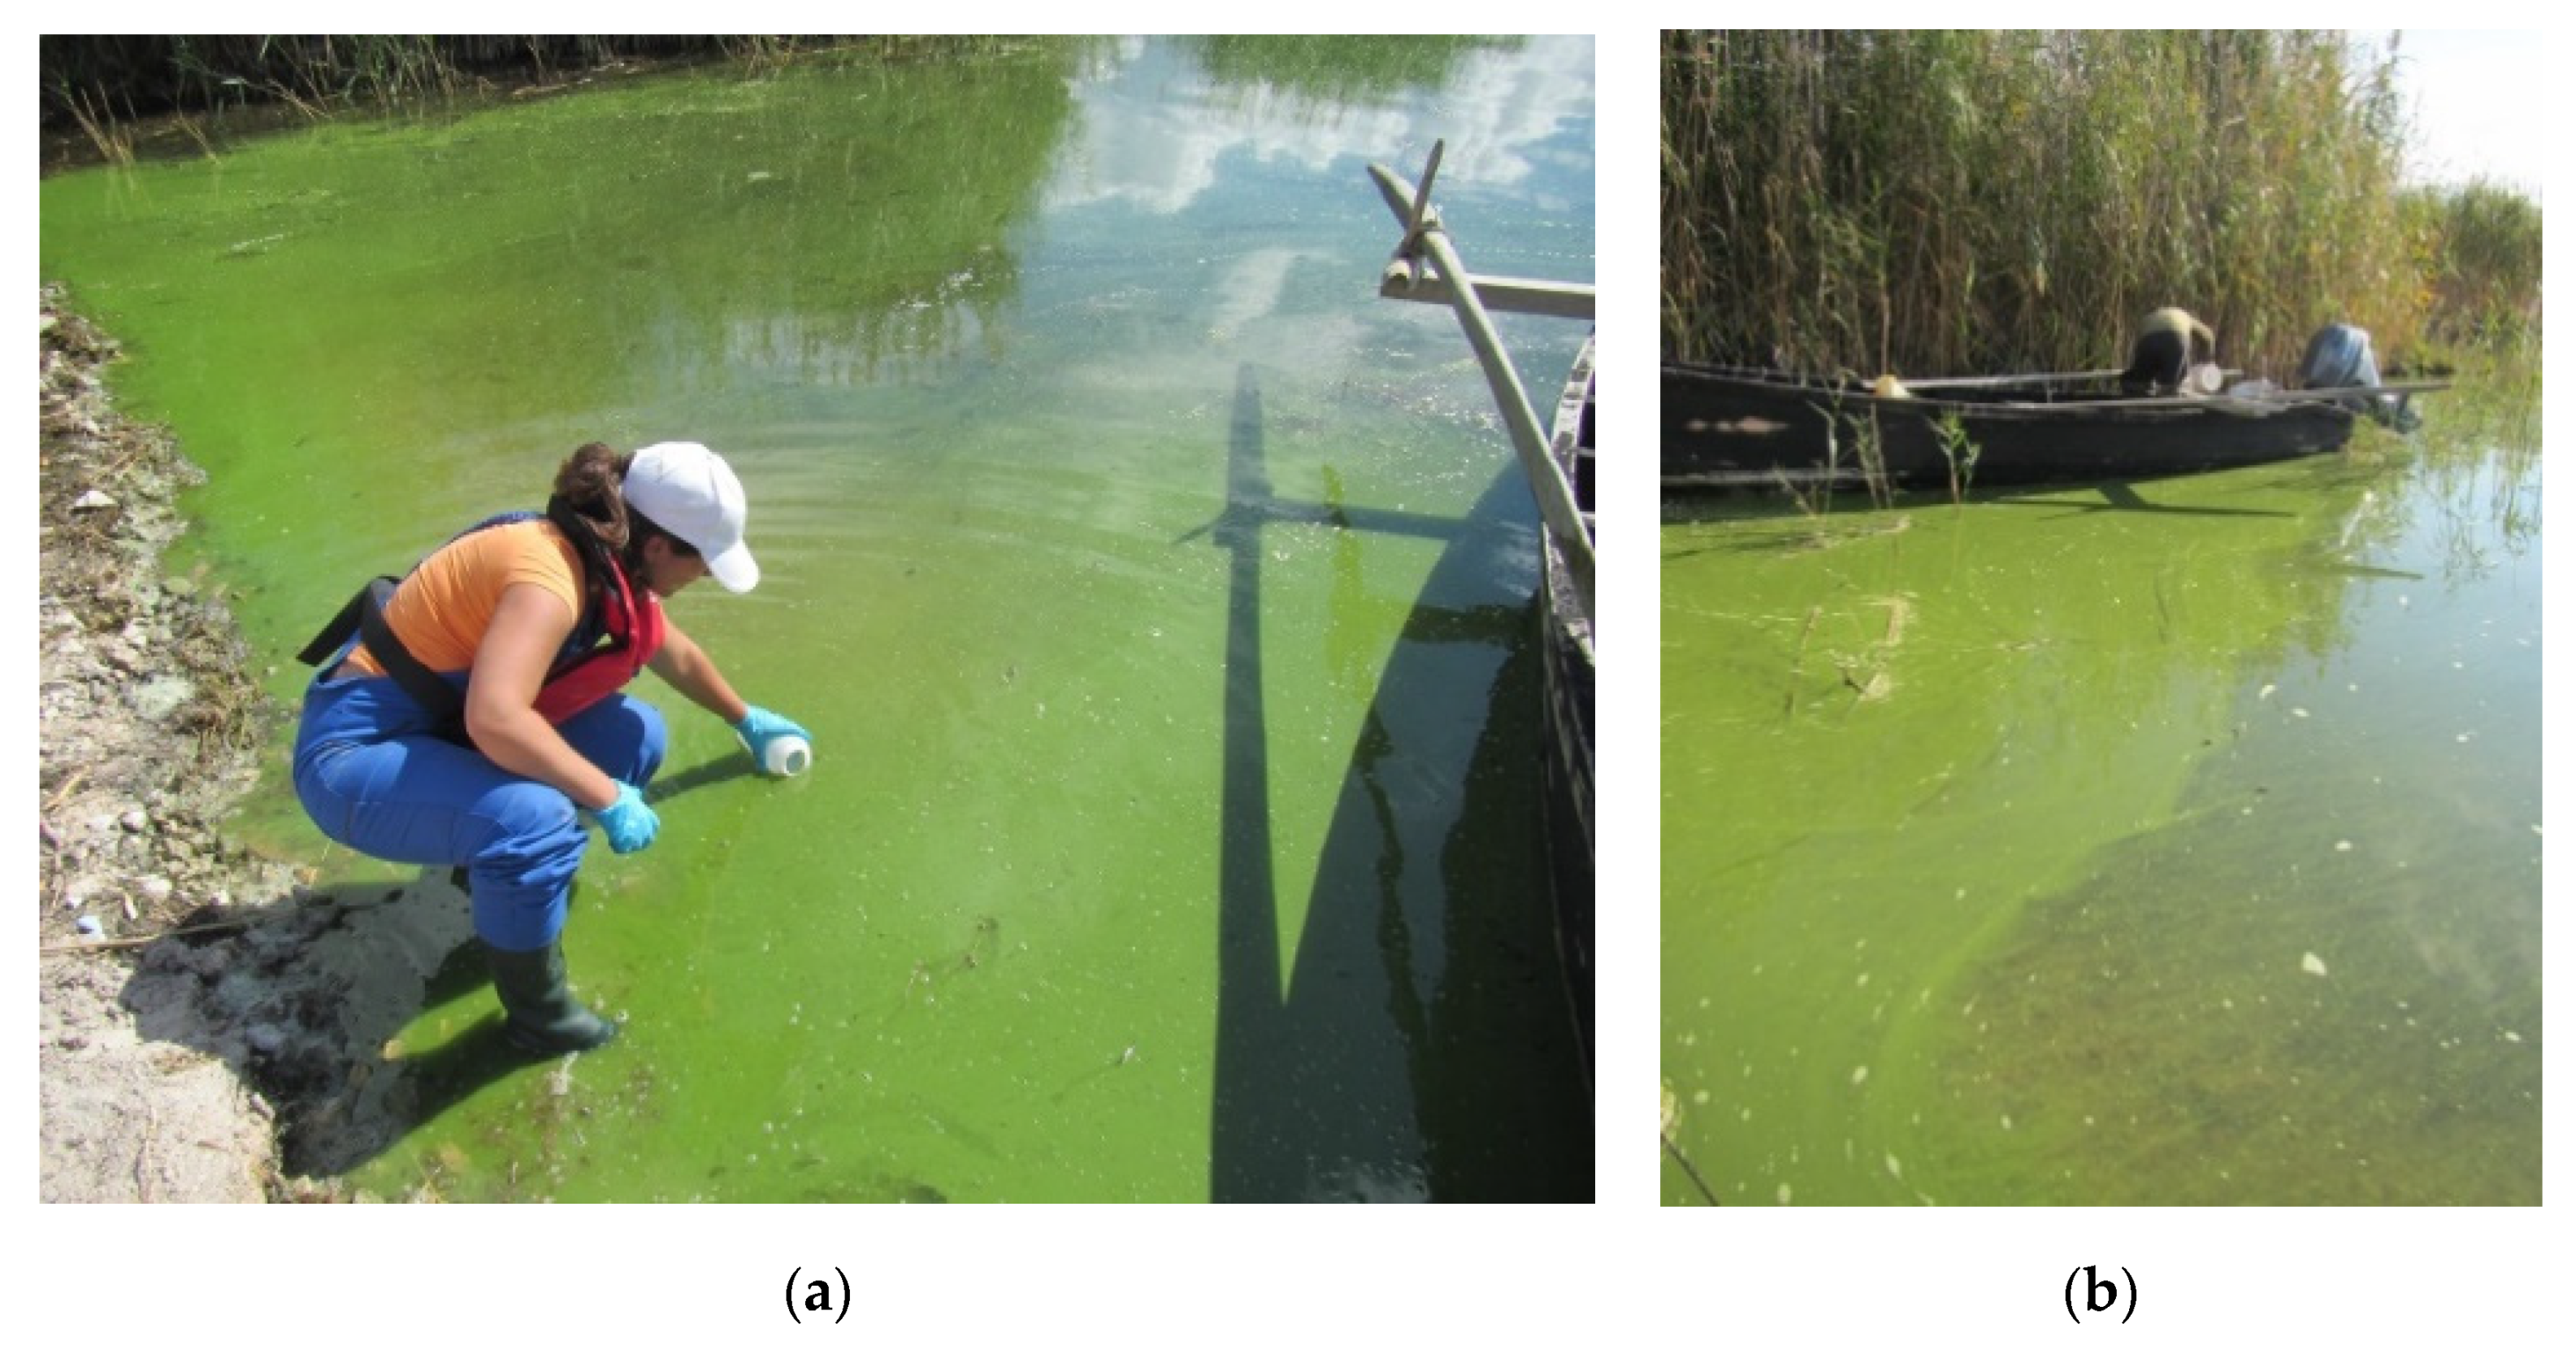
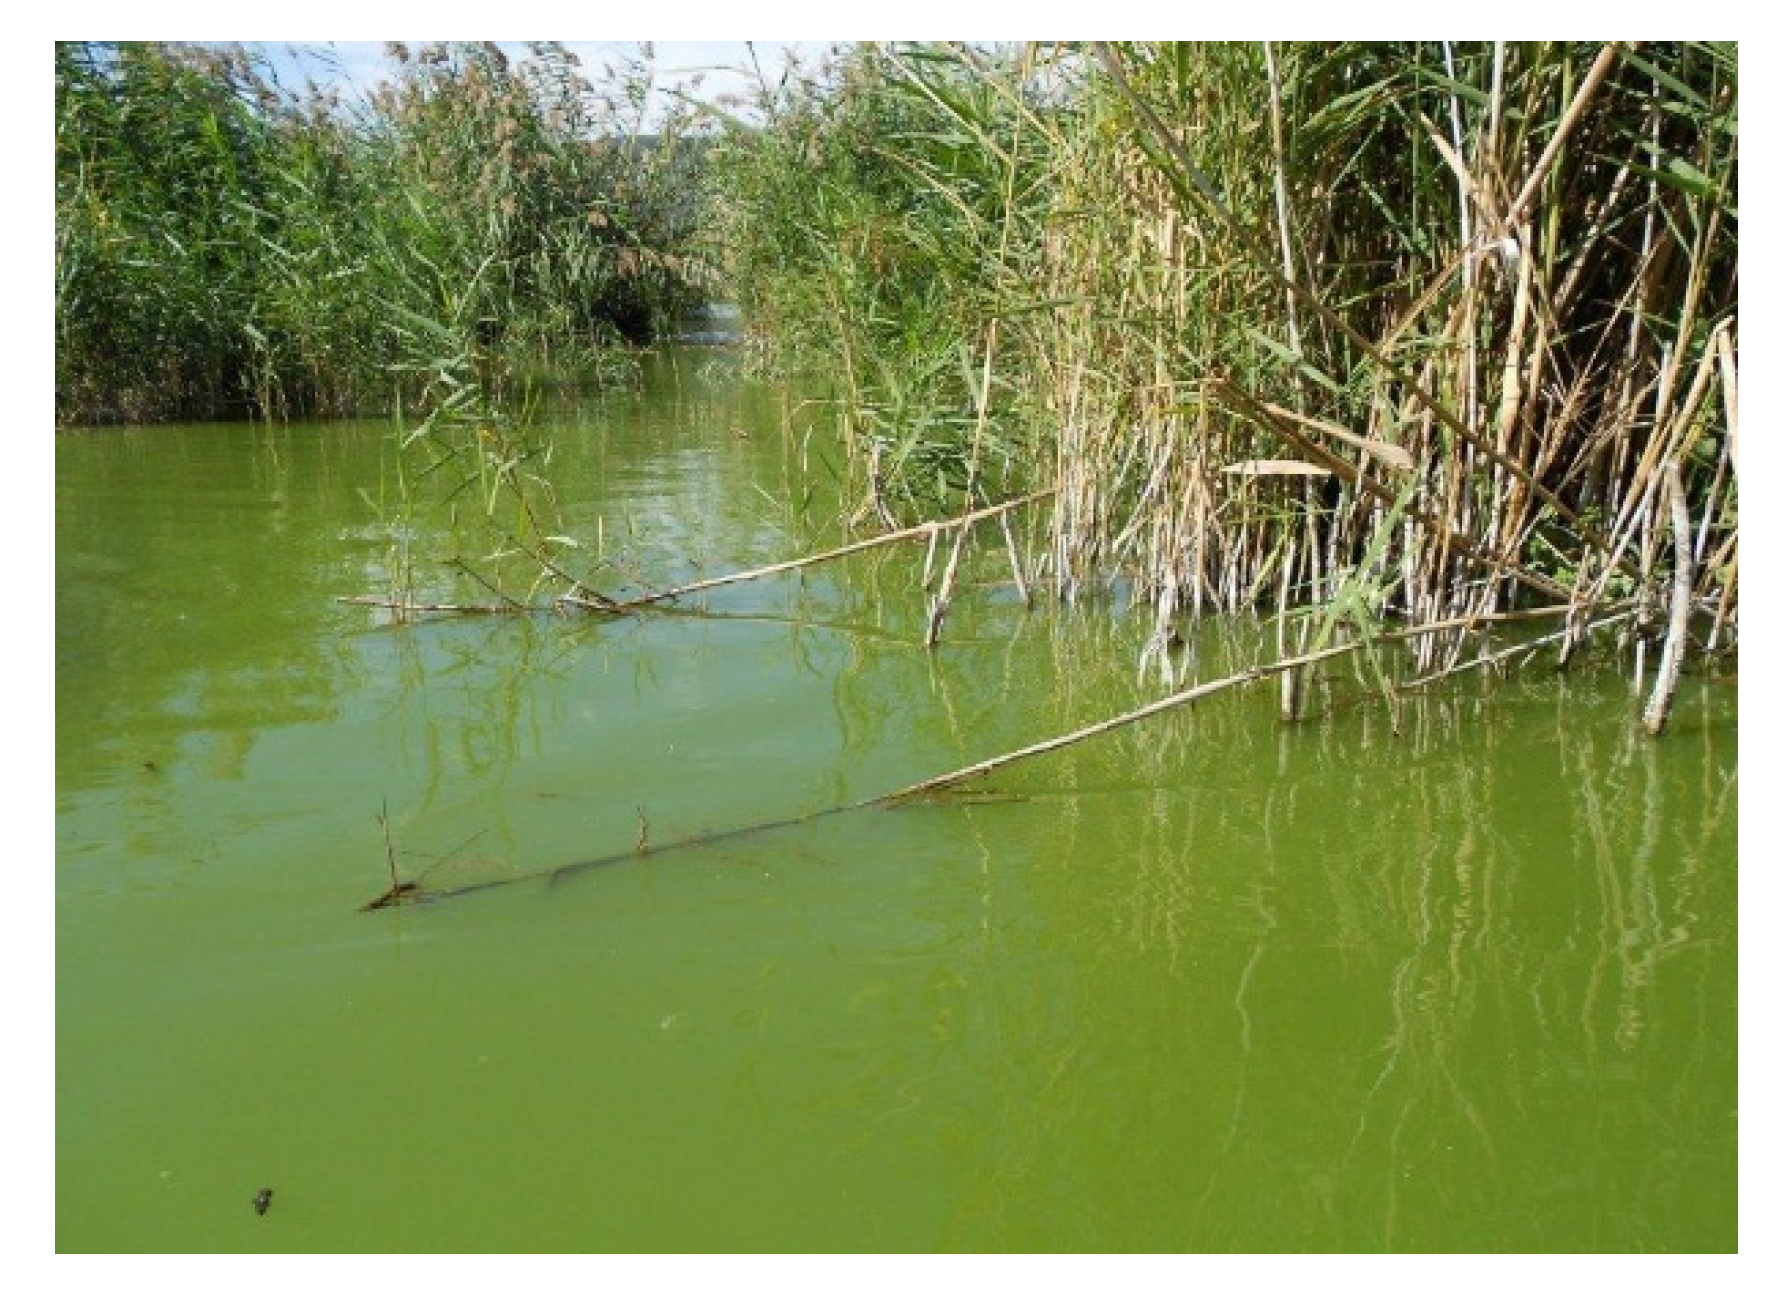
3.3. Pond Vromolimni

3.3.1. Sampling in 2012

On 26 September 2012, when most pelicans had left their breeding grounds the Vromolimni pond could be visited. Here, M. aeruginosa, M. wesenbergii, D. lemmermannii were also dominant. Planktothrix agardhii and green algal species belonging to the Scenedesmaceae were observed too. The total MC concentration in the Vromolimni pond was 26.6 (±6.4) µg L−1 and varied from 21.6 µg L−1 to 34 µg L−1 (Figure 8) (Table S5). The most abundant MC variant was MC-LR which comprised 61% (±2.3%) of the total MC-pool, followed by MC-RR contributing 32% (±1.3%). The variant dm-7-MC-RR made-up 3.6% (±0.2%), while MC-YR and dm-7-MC-LR each contributed about 1.5% to the total MC-pool. Variants MC-LY, MC-LF and MC-LW or nodularin were not found. No chlorophyll-a measurements were done in the ‘pea-green soup’ encountered in Vromolimni on the moment of sampling in 2012 (Figure A2, Appendix A), but in September 2013 cyanobacterial chlorophyll-a concentrations between 165 and 280 µg L−1 and total chlorophyll-a concentrations between 200 and 315 µg L−1 were measured.

3.3.2. Sampling in 2013

On 24 September 2013, the MC concentrations at the same sites in Vromolimni were considerably lower than in 2012 and on average 2.1 (±0.2) µg L−1 (Figure 8) (Table S5). Again MC-LR was the most dominant MC variant making up 51% (±1%) of the total MC-pool, while MC-RR contributed 43% (±1%), MC-YR 5% (±1%) and dm-7-MC-LR contributed 1% (±1%) to the total MC-pool.

3.3.3. Sampling in 2014

On 25 July 2014, MC concentrations at Vromolimni pond were similar to 2012 findings and on average 26.1 ± 0.63 SD µg L−1. MC-RR comprised 70.4% of the total MC-pool while MC-LR was making up to 22%, MC-YR up to 6.8% and trace amounts of the variants dm-7-MC-LR and dm MC-RR were found (Figure 8) (Table S5). In samples collected on 21 October 2014 the MC concentrations were much lower and on average 2.7 ± 0.2 SD µg L−1 (Figure 8). MC-RR comprised 81.3% of the total MC-pool while MC-YR was the second most dominant variant making up to 14.5%. Trace amounts of the variants dm-7-MC-LR and dm MC-RR were found while no MC-LR was detected in these samples (Figure 8).

3.4. Animal Tissue Samples

Two of the three carp livers collected in 2013 contained detectable amounts of MC; 0.8 and 1.9 µg MC g−1 dry weight (DW). The MC variants detected were MC-LR in both carp livers and dm-7-MC-LR made-up 2.8% of the total MC pool in one of the liver samples. A liver sample collected from a deceased Dalmatian Pelican in 2013 contained 1.0 ± 0.1 µg MC g−1 DW of which 98.7% consisted of MC-LR and of dm-7-MC-LR.
Additional tissue analysis in 2014 shows that MC amounts varied between 0.4–1.5 µg MC g−1 DW in two of the three deceased Dalmatian Pelicans. Mean MC concentration specifically in a liver sample was 0.9 ± 0.1 µg MC g−1 DW, in two muscle samples up to 0.6 ± 0.2 µg MC g−1 DW and in a stomach sample 0.7 ± 0.1 µg MC g−1 DW. Moreover, mean MC concentrations in one common otter liver was 0.7 ± 0.4 µg MC g−1 DW. In contrast to 2013 samples, the MC-RR variant comprised 100% of the total MC-pool in most of the tissue samples collected in 2014. Only the MC-YR variant made-up 11% in one of the pelican liver sample (with 89% MC-RR).

4. Discussion

4.1. Cyanotoxins in Prespa Waters

4.1.1. Lake Great Prespa

Low MC concentrations (<0.2 µg L−1) were detected sporadically at the five sampling sites in the Greek part of Lake Great Prespa in the summer of 2012. There are only few measurements of MCs available from previous studies for this large lake. During summer 2010 in the North Macedonian part of the lake MC concentrations exceeding 10 µg L−1 were found, with a maximum of 53 µg L−1 in the Northwestern part of the lake near the shore [15]. In general MC concentrations below 10 µg L−1 are viewed as posing little risk with a relatively low probability of adverse health effects, while those above 20 µg L−1 are considered to pose a potential risk of adverse health effects [41]. In 2010 in lake Great Prespa near Dolno Dupeni (North Macedonia) MC concentrations exceeded 10 µg L−1 and the water was dominated by bloom-forming Anabaena sp. (Anabaena affinis, Anabaena contorta) [15]. A study at the Greek part of Great Prespa during 2015–2016 reported Dolichospermum lemmermannii (formerly known as Anabaena lemmermannii or Anabaena flosaquae f. lemmermannii) as dominant cyanobacteria species [45]. In our survey at the Greek part of the lake, trace amounts of the variants MC-LR and dmMC-RR were found (Figure 2a,b). These MCs have been reported to be present in Anabaena [46], but MC profiles are dependent on environmental conditions [47].

4.1.2. Lake Lesser Prespa

In Lesser Prespa, in 2012 the MC concentrations clearly reflect a considerable heterogeneity (Figure 2a,b). This variability is also reflected in the chlorophyll-a concentrations (Figure 3). In the period 1990–1992 the chlorophyll-a concentration ranged between 5 and 54 µg L−1 with a mean value of 21 µg L−1, reflecting the eutrophic status of the lake [48]. Although the study by Tryfon in 2001 [48] shows a small variance in chlorophyll-a concentrations over depth, considerable differences were found between the years 1990 and 1992 [38]. During the previous studies only three mid-lake stations were sampled [19], and hence excluded near shore locations where accumulation of cyanobacteria likely occurs. In our study in 2012 we included near shore locations where algal blooms may occur which explains the clear differences in the spatial distribution of phytoplankton expressed as chlorophyll-a (Figure 3). Phytoplankton community was dominated by Microcystis wesenbergii, Dolichospermum lemmermannii, and Microcystis aeruginosa in samples collected in 2012 (Figure 4), which were also reported as dominant species in 1990–1992 [19,20,49]. Apparently no major changes in the dominating cyanobacteria species have occurred in Lake Lesser Prespa over the past two decades. Worth noting that Microcystis aeruginosa and Microcystis wesenbergii have been rarely detected in Great Prespa, where surface inflow is received from Lesser Prespa, while Dolichospermum lemmermannii was found in high abundance [45]. Relatively high MCs concentrations (exceeding 20 µg MC L−1) were measured in 2012 at several spots near the shores (Figure 2a). These spots were located in the southern, middle and northern part of the lake indicating that the accumulations may show considerable spatial heterogeneity. The relative distribution of MC-RR, MC-LR and MC-YR in samples collected in 2012 is comparable to the distribution (63%, 25% and 12% respectively) which has been measured in a sample taken in 1999 from Lake Lesser Prespa [33].
In September 2013, the MC concentrations in Lake Lesser Prespa showed much less spatial heterogeneity than in 2012 (Figure 5). As explained above, the variability in 2012 was caused by surface accumulation of cyanobacteria at certain sites, while this was not observed in September 2013. Since Dolichospermum species (formerly known as Anabaena) were observed, in 2013 the cyanotoxins survey was expanded and included anatoxins, cylindrospermopsins and saxitoxins [50]. However no other toxins than MCs were detected. In 2012 the most abundant MC variant MC-RR was more than twice as abundant as MC-LR (Figure 2a,b), whereas in 2013 there was hardly any difference (Figure 5). This difference in relative contribution of MC-congeners may have been caused by differences in the relative abundance of the cyanobacteria species or strains.
During August—November 2014 regular formations of algal blooms were observed on lee-side shores sites at Lesser Prespa were MC concentrations reached highest measured concentration of 861 µg L−1 (21 October 2014) (Figure 7). The MC variant concentrations in the scums were detected in the following order MC-RR > MC-YR > MC-LR > dm-7-MC-RR > dm-7-MC-LR > MC-LY. The total MC levels in all sites with scum formation were exceeding the ‘high risk’ threshold (20 µg MC L−1) which clearly indicates a severe threat for the aquatic organisms. These agglomerations near the lakeshore can be a result of water movements or remainders of earlier concentrated positively buoyant cyanobacteria. In that view, intensified monitoring is suggested to capture periods of calm weather with potential formation of surface scums and high concentrations on lee-side shores.

4.1.3. Vromolimni Pond

Vromolimni, which means ‘dirty water’ in Greek, is a main breeding area for Dalmatian Pelican and Great White Pelican for decades [9] which undoubtedly have led to a considerable nutrient enrichment of the pond stimulating growth of cyanobacteria [51]. In the Vromolimni pond relatively high MC concentrations were measured in 2012 and in July 2014 (Figure 8). While the most dominant MC variant in the lake was MC-RR, it was MC-LR in the pond in the majority of the samples. Dominant phytoplankton species in Vromolimni were similar to those observed in Lesser Prespa, yet different strains might have been present with different MC-profiles [52]. Nutrient analysis of pelican droppings revealed a molar TN:TP ratio of 1.6 and a NH4:PO4 ratio of 1.7 [53]. Such relatively high P enrichment implies that based on the Redfield ratio (P:N:C is 1:16:106; Redfield, 1958) the cyanobacteria may have been pushed into N-limitation [54,55,56]. Such N-limitation might not only lead to less MC production per unit biomass, but could also lead to a shift from more N-rich MC-variants, such as MC-RR, to less N-rich variants, such as MC-LR [57]. The latter variant also is about ten times more toxic than MC-RR [24].

4.2. Cyanotoxins in Biota at Prespa Area

Two of the three carp livers collected at Lake Lesser Prespa contained MCs up to 1.3 µg MC g−1 (dry weight). This is less than the approximately 10 µg MC g−1 DW found in carp liver from Lake Chaohu, China [58], but in the same range as the 0.37 µg MC g−1 DW in carp liver from Lakshmikund Pond, Varanasi, India [59], the ~0.1–0.2 µg MC g−1 fresh weight (FW) found in carp liver from Lake Karla, Greece [60], the ~0.1 µg MC g−1 FW in carp from Lago de Patzcuaro, Mexico [61]; and higher than the ~0.03 µg MC g−1 DW in carp liver from Lake Taihu, China [62]. Variability in MC content of carp livers in specimens from the same site as observed in carp from Lesser Prespa has also been reported elsewhere: Zhang et al. [63] mentioned 0.003 up to 0.17 µg MC g−1 DW in carp liver from Lake Taihu. Schmidt et al. [64] found MC-LR (3.5 µg kg−1 FW) only in one out of 15 carps caught in Grand Lake St. Marys (Ohio, USA). Moreover, the MCs detected in the carp liver did not reflect the MC composition of the seston of Lesser Prespa. Such discrepancies have also been found in other studies. For instance, Ni et al. [65] found seven MC variants, including MC-RR in the seston, but only two variants (MC-LR and MC-LY) in the liver of Bighead carp (species); Xie et al. [66] raised silver carp in tanks with MC-RR and MC-LR containing Microcystis, but found mostly only MC-RR in carp liver. Moreover, differences in relative abundances of MC-variants in different tissues has been observed, yet a clear physiological mechanism explaining the obvious differences in carp liver and surrounding seston is still lacking [66].
Although carp liver is not consumed by humans, it is highly likely that also the muscle tissue of these fish contained MCs. Several studies that examined different carp tissues on MCs found either comparable concentrations in these tissues as in the liver [57] or between 3 to 25 times lower concentrations [58,60,63,65,67]. Besides accumulation of MCs fish may also accumulate off-flavors produced by cyanobacteria that may lead to a lower quality for consumption and hence may have economic consequences as a result of reduced fish consumption [68]. The author’s culinary sampling of carp caught in Lesser Prespa and Great Prespa confirmed earthy and musty meat of specimens caught in Lesser Prespa, while this was not observed when carp caught in Great Prespa was consumed. Further research could include analysis of MCs in muscle tissue of carp and in other fish species that are not only consumed by waterbirds, but also being served in restaurants (of which some fried as a whole) and include analysis of geosmin and 2-methylisoborneol.
Detectable concentrations of MC were found in the analyzed tissues from Dalmatian Pelicans in 2013 and 2014 (0.4–1.5 µg MC g−1 DW) which were higher in the liver than in the stomach and muscle tissues. Comparable levels of MCs were found in the liver of an otter. The MC-profile of the Dalmatian Pelican’s tissues in 2013 matches with that of the carp in 2012, however, there is no solid proof the MCs originated from carp. On the other hand, the MC-profile of other deceased pelicans and the otter in 2014 had no similarity with that of the carps. In Lake Lesser Prespa the Dalmatian Pelican will feed preferably on Cyprinidae such as roach (Rutilus sp.), bleak (Alburnus sp.), rudd (Scardinius sp.) and also carp (Cyprinus carpio) ranging in length from 3 to 50 cm [69]. Hence, it is recommended to analyze more fish species from Lesser Prespa on MCs, as well as Dalmatian Pelicans and other piscivorous waterbirds to get more insight in MCs in these animals.
Information on cyanotoxins in pelicans is very scarce; Burns [70] mentioned anatoxin-a in the gut and the liver of a Great White Pelican during surveys in 2000 (0.51 to 43.3 μg g−1). Papadimitriou et al. [71] measured average MC concentrations of 231.1 ng/g in the liver of Dalmatian Pelicans collected in Karla reservoir (Greece) during summer 2016 by using immunological ELISA method. In the same study, significant differences were found between various waterbird tissues examined for MCs while detectable concentrations of saxitoxins and cylindrospermopsins were also recorded [71].
Likewise, more animals in the Lesser Prespa/Vromolimni habitat could be inspected on accumulation of MCs to shed light on the possible influence the regular cyanobacterial blooms may already have on wild life health. Moreover, seston incubation experiments at some future expected temperature and nutrient scenarios may indicate whether cyanobacteria bloom intensity will be aggravated and/or species composition may change. Experiments conducted already in 2013 with incubated seston from Lake Lesser Prespa and Vromolimni pond show that the simultaneous addition of nitrogen and phosphorus or nitrogen alone can enhance the cyanobacterial growth and the production of the toxic variant MC-LR. Warming seemed to increase cyanobacteria biomass in these treatments too [72].
Given the fact that Lesser Prespa is interconnected to downstream Great Prespa through a sluice gate, the transfer of toxin-producing cyanobacteria species to Great Prespa during high water discharge may be a matter of concern. Katsiapi et al., 2020 [45] already found that the hydrological connectivity as well as the high dispersal rates have affected the cyanobacterial metacommunity in Prespa lakes and can consist of critical drivers for potentially toxic bloom expansion in Great Prespa. Such emerging issue needs to be taken into consideration in lake management practices in order to prevent the further expansion of harmful cyanobacteria in the area.

5. Conclusions

In summer 2012 scattered and low microcystin (MC) concentrations of <0.2 μg MC L−1 were found in Great Prespa, whereas in Lesser Prespa MC concentrations ranged from 0.04 to 52 µg L−1. The highest MC concentrations in Lesser Prespa were found at sites where cyanobacteria had accumulated in 2012 and particularly in 2014 (25 and 861 µg L−1), which were reflected in the chlorophyll-a concentrations and indicated a poisoning risk (above 20 µg L−1). The main phytoplankton species in Lesser Prespa were Microcystis wesenbergii, Dolichospermum lemmermannii, and M. aeruginosa. In summer 2013 the MC concentrations in Lesser Prespa were lower, ranged from 0.4 to 1.5 µg L−1 and no surface accumulations were observed during sampling time. In Vromolimni pond, in which vicinity most pelicans were breeding, the MC concentrations in September 2012 and July 2014 were ranging from 21.6 to 34 µg L−1, which were much higher than the 2.1 µg L−1 measured in 2013 and the concentration of 2.7 µg L−1 measured in October 2014. Moreover, five MC variants were found in the Prespa Lakes area: MC-LR, MC-RR, MC-YR, dm-7-MC-LR and dm-7-MC-RR. The variants MC-LY, MC-LF and MC-LW were not detected; neither were nodularin, nor anatoxins, cylindrospermopsins or saxitoxins.
In two of three carp livers of specimens caught by fishermen in September 2013 MCs were found. MCs were also present in the tissues of four deceased Dalmatian Pelican in 2013 and 2014. The present study clearly elucidated the eutrophication pressure on the unique Prespa Lakes and wildlife as is evident from cyanobacteria blooms and MCs present in animal tissues. As the area and its lakes is an internationally recognized ‘shelter’ for endemic biodiversity and migratory birds, our study indicates that there is a need to mitigate the eutrophication of these lakes to prevent further deterioration and loss of ecosystem services. A system analysis revealing the lakes’ nutrient balances and internal fluxes seems an absolute necessity to underpin any plan to protect and rehabilitate the ecology of the Prespa Lakes.

Supplementary Materials

The following are available online at www.mdpi.com/xxx/s1,Table S1: Concentration of microcystin variants (dmRR, RR, YR, dmLR, LR, LY, LW, LF), nodularin (NOD) and total microcystin concentrations (µg L−1) at five locations in the Prespa lakes (see Figure 2(panel a) in main text) during summer 2012. n.d. indicates not detected, n.q. indicates not quantified, but detected, while -- means not analyzed, Table S2: Concentration of microcystin variants (dmRR, RR, YR, dmLR, LR, LY, LW, LF), nodularin (NOD) and total microcystin concentrations (µg L−1) at 21 locations in the Prespa lakes (see Figure 2(panel b) in main text) on 30, 31 August 2012. n.d. indicates not detected, n.q. indicates not quantified, but detected, Table S3: Concentration of microcystin variants (dmRR, RR, YR, dmLR, LR, LY, LW, LF), nodularin (NOD) and total microcystin concentrations (µg L−1) at ten locations in the Lake Lesser Prespa (see Figure 5 in main text) on 3 September 2013. n.d. indicates not detected, Table S4: Concentration of microcystin variants (dmRR, RR, YR, dmLR, LR, LY, LW, LF), nodularin (NOD) and total microcystin concentrations (µg L−1) at three locations in the Lake Lesser Prespa (see Figure 7 in main text) during 2014. n.d. indicates not detected, Table S5: Concentration of microcystin variants (dmRR, RR, YR, dmLR, LR, LY, LW, LF), nodularin (NOD) and total microcystin concentrations (µg L−1) at three locations in the Vromolimni pond (see Figure 8 in main text) during 2012–2014. n.d. indicates not detected.

Author Contributions

Conceptualization, V.M., M.L. and A.J.P.S.; investigation, V.M., C.F., F.v.O., methodology V.M., E.J.F. and M.L.; writing—original draft preparation V.M. and M.L.; formal analysis, V.M., M.L. and A.J.P.S.; visualization, V.M. and M.L.; review—editing, A.J.P.S., F.v.O., C.F., Y.J.M.V.; supervision, M.L. and A.J.P.S.; project administration, V.M., M.L. and A.J.P.S. All authors have read and agreed to the published version of the manuscript.

Funding

V.M was supported financially by the Society for the Protection of Prespa (SPP). E.J.F. was supported by grant 817.02.019 from the Netherlands Organization for Scientific Research (NWO), C.F. was supported by a FP7 Grant (Euroot; 289300) and an ERA-NET Plus Action Grant on Climate Smart Agriculture (Cinderella; FP 7 and NWO co-funded).

Institutional Review Board Statement

Ethical review and approval were waived for this study, as no experiments with animals were conducted. Tissues of deceased animals were analyzed. The animals had died either from a natural cause (pelicans, otter), or left-over tissue (livers of carp) was obtained from local fisherman who catch fish for consumption.

Informed Consent Statement

Not applicable.

Data Availability Statement

The data underlying this study have been uploaded to the Data Archiving and Networking Services (DANS) and are accessible using the following link: https://doi.org/10.17026/dans-2zk-fjj3.

Acknowledgments

Special thanks are given to Pim Engeltjes (MSc student, Wageningen University, The Netherlands) for conducting the cyanotoxin analysis in 2013, to the personnel of the SPP for collecting pelican samples in 2014 and to the Associate Ioanna Georgopoulou (Faculty of Veterinary Medicine, Aristotle University of Thessaloniki, Greece) for providing useful diagnosis on the cause of death of a pelican in 2014 and collecting the tissue samples for cyanotoxin analysis.

Conflicts of Interest

The authors declare no conflict of interest.

Appendix A

Figure A1. Photos showing the accumulation of surface cyanobacteria scums at the lakeshores of Lesser Prespa in 2014; site II on 4 September 2014 (Panel a) and 30 October 2014 (Panel b) and at site III on 10 November 2014 (Panel c) at Lake Lesser Prespa.
Water 13 00357 g0a1aWater 13 00357 g0a1b
Figure A2. Photo of Vromolimni pond water showing the excessive cyanobacteria growth during sampling on 26 September 2012 (photo provided by the Society for the Protection of Prespa).
Water 13 00357 g0a2

References

  1. De Figueiredo, D.R.; Azeiteiro, U.M.; Esteves, S.M.; Gonçalves, F.J.; Pereira, M.J. Microcystin-producing blooms—a serious global public health issue. Ecotoxicol. Environ. Saf. 2004, 59, 151–163. [Google Scholar] [CrossRef] [PubMed]
  2. O’Neil, J.M.; Davis, T.W.; Burford, M.A.; Gobler, C.J. The rise of harmful cyanobacteria blooms: The potential roles of eutrophication and climate change. Harmful Algae 2012, 14, 313–334. [Google Scholar] [CrossRef]
  3. Watson, S.B.; McCauley, E.; Downing, J.A. Patterns in phytoplankton taxonomic composition across temperate lakes of differing nutrient status. Limnol. Oceanogr. 1997, 42, 487–495. [Google Scholar] [CrossRef] [Green Version]
  4. Smith, V.H.; Tilman, G.D.; Nekola, J.C. Eutrophication: Impacts of excess nutrient inputs on freshwater, marine, and terrestrial ecosystems. Environ. Pollut. 1999, 100, 179–196. [Google Scholar] [CrossRef]
  5. Paerl, H.W.; Huisman, J. Blooms Like It Hot. Science 2008, 320, 57–58. [Google Scholar] [CrossRef] [Green Version]
  6. Dittmann, E.; Wiegand, C. Cyanobacterial toxins--occurrence, biosynthesis and impact on human affairs. Mol. Nutr. Food Res. 2006, 50, 7–17. [Google Scholar] [CrossRef]
  7. Funari, E.; Testai, E. Human health risk assessment related to cyanotoxins exposure. Crit. Rev. Toxicol. 2008, 38, 97–125. [Google Scholar] [CrossRef]
  8. Paerl, H. Nutrient and other environmental controls of harmful cyanobacterial blooms along the freshwater–marine continuum. In Cyanobacterial Harmful Algal Blooms: State of the Science and Research Needs; Hudnell, H.K., Ed.; Springer New York: New York, NY, USA, 2008; pp. 217–237. [Google Scholar]
  9. Crivelli, A.J.; Catsadorakis, G. Lake Prespa, Northwestern Greece: A Unique Balkan Wetland; Springer Science & Business Media: Berlin, Germany, 1997; Volume 351. [Google Scholar]
  10. Data from Ronald B. Mitchell. 2002–2021. International Environmental Agreements Database Project (Version 2020.1). Available online: http://iea.uoregon.edu/Date (accessed on 29 January 2021).
  11. Ramsar Site Information Service. Available online: https://rsis.ramsar.org/ris/60 (accessed on 30 November 2020).
  12. BirdLife International (2021) Species factsheet: Pelecanus crispus. Available online: http://www.birdlife.org (accessed on 29 January 2021).
  13. Malacou, M. Traditional ecological knowledge, conservation and socio-ecological perspectives in the Prespa transboundary Park. In Culture and Wetlands in the Mediterranean: An Evolving Story; Papayannis, T., Pritchard, D.E., Eds.; Med-INA: Athens, Greece, 2011. [Google Scholar]
  14. Matzinger, A.; Jordanoski, M.; Veljanoska-Sarafiloska, E.; Sturm, M.; Müller, B.; Wüest, A. Is Lake Prespa Jeopardizing the Ecosystem of Ancient Lake Ohrid? Hydrobiologia 2006, 553, 89–109. [Google Scholar] [CrossRef]
  15. Krstić, S. Environmental Changes in Lakes Catchments as a Trigger for Rapid EutrophicationA Prespa Lake Case Study. In Studies on Environmental and Applied Geomorphology; Piacentini, T., Miccadei, E., Eds.; InTech: London, UK, 2012. [Google Scholar]
  16. Löffler, H.; Schiller, E.; Kusel, E.; Kraill, H. Lake Prespa, a European natural monument, endangered by irrigation and eutrophication? Hydrobiologia 1998, 384, 69–74. [Google Scholar] [CrossRef]
  17. Stefanidis, K. Ecological Assessment of Lake of NW Greece with Emphasis on the Associations between Aquatic Macrophytes, Zooplankton and Water Quality; Department of Biology, University of Patras: Patras, Greece, 2012; 272p. [Google Scholar]
  18. Van der Schriek, T.; Giannakopoulos, C. Determining the causes for the dramatic recent fall of Lake Prespa (southwest Balkans). Hydrol. Sci. J. 2017, 62, 1131–1148. [Google Scholar] [CrossRef] [Green Version]
  19. Tryfon, E.; Moustaka-Gouni, M.; Nikolaidis, G. Planktic cyanophytes and their ecology in the shallow Lake Mikri Prespa, Greece. Nord. J. Bot. 1997, 17, 439–448. [Google Scholar] [CrossRef]
  20. Vardaka, E.; Moustaka-Gouni, M.; Cook, M.C.; Lanaras, T. Cyanobacterial blooms and water quality in Greek waterbodies. J. Appl. Phycol. 2005, 17, 391–401. [Google Scholar] [CrossRef]
  21. Onen, K.; Jones, G.J. Toxic Cyanobacteria in Water: A Guide to Their Public Health Consequences, Monitoring and Management. In Cyanobacterial Toxins; Chorus, I., Bartram, J., Eds.; WHO: London, UK, 1999; pp. 41–111. [Google Scholar]
  22. Doekel, S.; Marahiel, M.A. Biosynthesis of Natural Products on Modular Peptide Synthetases. Metab. Eng. 2001, 3, 64–77. [Google Scholar] [CrossRef] [PubMed]
  23. Kuiper-Goodman, T.; Falconer, I.R.; Fitzgerald, J. Toxic Cyanobacteria in Water: A Guide to Their Public Health Consequences, Monitoring and Management. In Human Health Aspects; Chorus, I., Bartram, J., Eds.; WHO: London, UK, 1999; pp. 41–110. [Google Scholar]
  24. Zurawell, R.W.; Chen, H.; Burke, J.M.; Prepas, E.E. Hepatotoxic cyanobacteria: A review of the biological importance of microcystins in freshwater environments. J. Toxicol. Environ. Health B Crit. Rev. 2005, 8, 1–37. [Google Scholar] [CrossRef]
  25. Pouria, S.; de Andrade, A.; Barbosa, J.; Cavalcanti, R.L.; Barreto, V.T.; Ward, C.J.; Preiser, W.; Poon, G.K.; Neild, G.H.; Codd, G.A. Fatal microcystin intoxication in haemodialysis unit in Caruaru, Brazil. Lancet 1998, 352, 21–26. [Google Scholar] [CrossRef]
  26. Miller, M.A.; Kudela, R.M.; Mekebri, A.; Crane, D.; Oates, S.C.; Tinker, M.T.; Staedler, M.; Miller, W.A.; Toy-Choutka, S.; Dominik, C.; et al. Evidence for a Novel Marine Harmful Algal Bloom: Cyanotoxin (Microcystin) Transfer from Land to Sea Otters. PLoS ONE 2010, 5, e12576. [Google Scholar] [CrossRef]
  27. Vanhove, M.P.M.; Kovačić, M.; Koutsikos, N.E.; Zogaris, S.; Vardakas, L.E.; Huyse, T.; Economou, A.N. First record of a landlocked population of marine Millerigobius macrocephalus (Perciformes: Gobiidae): Observations from a unique spring-fed karstic lake (Lake Vouliagmeni, Greece) and phylogenetic positioning. Zool. Anz. J. Comp. Zool. 2011, 250, 195–204. [Google Scholar] [CrossRef]
  28. Lürling, M.; Faassen, E. Dog Poisonings Associated with a Microcystis aeruginosa Bloom in the Netherlands. Toxins 2013, 5, 556. [Google Scholar] [CrossRef]
  29. Matsunaga, H.; Harada, K.I.; Senma, M.; Ito, Y.; Yasuda, N.; Ushida, S.; Kimura, Y. Possible cause of unnatural mass death of wild birds in a pond in Nishinomiya, Japan: Sudden appearance of toxic cyanobacteria. Nat. Toxins 1999, 7, 81–84. [Google Scholar] [CrossRef]
  30. Cook, C.M.; Vardaka, E.; Lanaras, T. Toxic Cyanobacteria in Greek Freshwaters, 1987—2000: Occurrence, Toxicity, and Impacts in the Mediterranean Region. Acta Hydrochim. Hydrobiol. 2004, 32, 107–124. [Google Scholar] [CrossRef]
  31. Gkelis, S.; Harjunpää, V.; Lanaras, T.; Sivonen, K. Diversity of hepatotoxic microcystins and bioactive anabaenopeptins in cyanobacterial blooms from Greek freshwaters. Environ. Toxicol. 2005, 20, 249–256. [Google Scholar] [CrossRef] [PubMed]
  32. Papadimitriou, T.; Kagalou, I.; Bacopoulos, V.; Leonardos, I.D. Accumulation of microcystins in water and fish tissues: An estimation of risks associated with microcystins in most of the Greek Lakes. Environ. Toxicol. 2010, 25, 418–427. [Google Scholar] [CrossRef] [PubMed]
  33. Gkelis, S.; Lanaras, T.; Sivonen, K. Cyanobacterial Toxic and Bioactive Peptides in Freshwater Bodies of Greece: Concentrations, Occurrence Patterns, and Implications for Human Health. Mar. Drugs 2015, 13, 6319–6335. [Google Scholar] [CrossRef] [PubMed] [Green Version]
  34. Christophoridis, C.; Zervou, S.; Manolidi, K.; Katsiapi, M.; Moustaka-Gouni, M.; Kaloudis, T.; Triantis, T.M.; Hiskia, A. Occurrence and diversity of cyanotoxins in Greek lakes. Sci. Rep. 2018, 8, 17877. [Google Scholar] [CrossRef] [PubMed] [Green Version]
  35. Otten, T.G.; Xu, H.; Qin, B.; Zhu, G.; Paerl, H.W. Spatiotemporal Patterns and Ecophysiology of Toxigenic Microcystis Blooms in Lake Taihu, China: Implications for Water Quality Management. Environ. Sci. Technol. 2012, 46, 3480–3488. [Google Scholar] [CrossRef] [PubMed]
  36. Pobel, D.; Robin, L.; Humbert, J.-F. Influence of sampling strategies on the monitoring of cyanobacteria in shallow lakes: Lessons from a case study in France. Water Res. 2011, 45, 1005–1014. [Google Scholar] [CrossRef] [Green Version]
  37. Lepistö, L.; Rapala, J.; Lyra, C.; Berg, K.A.; Erkomaa, K.; Issakainen, J. Occurrence and toxicity of cyanobacterial blooms dominated by Anabaena lemmermannii P. Richter and Aphanizomenon spp. in boreal lakes in 2003. Algol. Stud. 2005, 117, 315–328. [Google Scholar] [CrossRef]
  38. Koussouris, T.S.; Diapoulis, A.C.; Balopoulos, E.T. Assessing the trophic status of Lake Mikri Prespa, Greece. Ann. Limnol. Int. J. Limnol. 1989, 25, 17–24. [Google Scholar] [CrossRef]
  39. Faassen, E.J.; Harkema, L.; Begeman, L.; Lurling, M. First report of (homo)anatoxin-a and dog neurotoxicosis after ingestion of benthic cyanobacteria in The Netherlands. Toxicon 2012, 60, 378–384. [Google Scholar] [CrossRef]
  40. Rangel, L.M.; Ger, K.A.; Silva, L.H.S.; Soares, M.C.S.; Faassen, E.J.; Lürling, M. Toxicity overrides morphology on Cylindrospermopsis raciborskii grazing resistance to the calanoid copepod Eudiaptomus gracilis. Microb. Ecol. 2016, 71, 835–844. [Google Scholar] [CrossRef] [Green Version]
  41. Chorus, I.; Falconer, I.R.; Salas, H.J.; Bartram, J. Health risks caused by freshwater cyanobacteria in recreational waters. J. Toxicol. Environ. Health B Crit. Rev. 2000, 3, 323–347. [Google Scholar] [CrossRef] [PubMed]
  42. Nürnberg, G.K. Trophic State of Clear and Colored, Soft- and Hardwater Lakes with Special Consideration of Nutrients, Anoxia, Phytoplankton and Fish. Lake Reserv. Manag. 1996, 12, 432–447. [Google Scholar] [CrossRef]
  43. Caspers, H. OECD: Eutrophication of Waters. Monitoring, Assessment and Control; Organisation for Economic Co-Operation and Development: Paris, France, 1982; p. 154. [Google Scholar]
  44. Tryfon, E.; Moustaka-Gouni, M. Species composition and seasonal cycles of phytoplankton with special reference to the nanoplankton of Lake Mikri Prespa. Hydrobiologia 1997, 351, 61–75. [Google Scholar] [CrossRef]
  45. Katsiapi, M.; Genitsaris, S.; Stefanidou, N.; Tsavdaridou, A.; Giannopoulou, I.; Stamou, G.; Michaloudi, E.; Mazaris, A.D.; Moustaka-Gouni, M. Ecological Connectivity in Two Ancient Lakes: Impact upon Planktonic Cyanobacteria and Water Quality. Water 2020, 12, 18. [Google Scholar] [CrossRef] [Green Version]
  46. Sivonen, K.; Namikoshi, M.; Evans, W.R.; Carmichael, W.W.; Sun, F.; Rouhiainen, L.; Luukkainen, R.; Rinehart, K.L. Isolation and characterization of a variety of microcystins from seven strains of the cyanobacterial genus Anabaena. Appl. Environ. Microbiol. 1992, 58, 2495–2500. [Google Scholar] [CrossRef] [Green Version]
  47. Rapala, J.; Rapala, J.; Sivonen, K.; Lyra, C.; Niemelä, S.I. Variation of microcystins, cyanobacterial hepatotoxins, in Anabaena spp. as a function of growth stimuli. Appl. Environ. Microbiol. 1997, 63, 2206–2212. [Google Scholar] [CrossRef] [Green Version]
  48. Tryfon, E. Chlorophyll-a distribution in the shallow lake Mikri Prespa, Greece. Biologia 2001, 56, 17–23. [Google Scholar]
  49. Tryfon, E.; Moustaka-Gouni, M.; Nikolaidis, G.; Tsekos, I. Phytoplankton and physical-chemical features of the shallow Lake Mikri Prespa, Macedonia, Greece. Arch. Hydrobiol. 1994, 131, 477–494. [Google Scholar]
  50. Boopathi, T.; Ki, J.-S. Impact of Environmental Factors on the Regulation of Cyanotoxin Production. Toxins 2014, 6, 1951–1978. [Google Scholar] [CrossRef] [Green Version]
  51. Maliaka, V.; Verstijnen, Y.J.M.; Faassen, E.J.; Smolders, A.J.P.; Lurling, M. Effects of guanotrophication and warming on the abundance of green algae, cyanobacteria and microcystins in Lake Lesser Prespa, Greece. PLoS ONE 2020, 15, e0229148. [Google Scholar] [CrossRef] [Green Version]
  52. Bittencourt-Oliveira, M.; Oliveira, M.; Pinto, E. Diversity of microcystin-producing genotypes in Brazilian strains of Microcystis (Cyanobacteria). Braz. J. Biol. 2011, 71, 209–216. [Google Scholar] [CrossRef] [PubMed]
  53. Verstijnen, Y.J.M.; Maliaka, V.; Catsadorakis, G.; Lürling, M.; Smolders, A.J.P. Colonial nesting waterbirds as vectors of nutrients to Lake Lesser Prespa (Greece). Inland Waters 2021, in press. [Google Scholar] [CrossRef]
  54. Agha, R.; Cirés, S.; Wörmer, L.; Quesada, A. Limited stability of microcystins in oligopeptide compositions of Microcystis aeruginosa (Cyanobacteria): Implications in the definition of chemotypes. Toxins 2013, 5, 1089–1104. [Google Scholar] [CrossRef] [PubMed] [Green Version]
  55. Su, X.; Xue, Q.; Steinman, A.D.; Zhao, Y.; Xie, L. Spatiotemporal Dynamics of Microcystin Variants and Relationships with Environmental Parameters in Lake Taihu, China. Toxins 2015, 7, 3224–3244. [Google Scholar] [CrossRef] [PubMed]
  56. Van de Waal, D.B.; Smith, V.H.; Declerck, S.A.J.; Stam, E.C.M.; Elser, J.J. Stoichiometric regulation of phytoplankton toxins. Ecol. Lett. 2014, 17, 736–742. [Google Scholar] [CrossRef]
  57. Van de Waal, D.B.; Verspagen, J.M.H.; Lürling, M.; Van Donk, E.; Visser, P.M.; Huisman, J. The ecological stoichiometry of toxins produced by harmful cyanobacteria: An experimental test of the carbon-nutrient balance hypothesis. Ecol. Lett. 2009, 12, 1326–1335. [Google Scholar] [CrossRef]
  58. Xie, L.; Xie, P.; Guo, L.; Li, L.; Miyabara, Y.; Park, H.D. Organ distribution and bioaccumulation of microcystins in freshwater fish at different trophic levels from the eutrophic Lake Chaohu, China. Environ. Toxicol. 2005, 20, 293–300. [Google Scholar] [CrossRef]
  59. Singh, S.; Asthana, R.K. Assessment of microcystin concentration in carp and catfish: A case study from Lakshmikund pond, Varanasi, India. Bull. Environ. Contam. Toxicol. 2014, 92, 687–692. [Google Scholar] [CrossRef]
  60. Papadimitriou, T.; Katsiapi, M.; Kormas, K.A.; Moustaka-Gouni, M.; Kagalou, I. Artificially-born “killer” lake: Phytoplankton based water quality and microcystin affected fish in a reconstructed lake. Sci. Total Environ. 2013, 452–453, 116–124. [Google Scholar] [CrossRef]
  61. Berry, J.P.; Lee, E.; Walton, K.; Wilson, A.E.; Bernal-Brooks, F. Bioaccumulation of microcystins by fish associated with a persistent cyanobacterial bloom in Lago de Patzcuaro (Michoacan, Mexico). Environ. Toxicol. Chem. 2011, 30, 1621–1628. [Google Scholar] [CrossRef]
  62. Jia, J.; Luo, W.; Lu, Y.; Giesy, J.P. Bioaccumulation of microcystins (MCs) in four fish species from Lake Taihu, China: Assessment of risks to humans. Sci. Total Environ. 2014, 487, 224–232. [Google Scholar] [CrossRef] [PubMed]
  63. Zhang, D.; Xie, P.; Liu, Y.; Qiou, T. Transfer, distribution and bioaccumulation of microcystins in the aquatic food web in Lake Taihu, China, with potential risks to human health. Sci. Total Environ. 2009, 407, 2191–2199. [Google Scholar] [CrossRef] [PubMed]
  64. Schmidt, J.R.; Shaskus, M.; Estenik, J.F.; Oesch, C.; Khidekel, R.; Boyer, G.L. Variations in the microcystin content of different fish species collected from a eutrophic lake. Toxins 2013, 5, 992–1009. [Google Scholar] [CrossRef] [PubMed] [Green Version]
  65. Ni, W.; Zhang, J.; Luo, Y. Microcystin accumulation in bighead carp (Aristichthys nobilis) during a Microcystis-dominated bloom and risk assessment of the dietary intake in a fish pond in China. Environ. Sci. Pollut. Res. Int. 2017, 24, 8894–8902. [Google Scholar] [CrossRef]
  66. Xie, L.; Xie, P.; Ozawa, K.; Honma, T.; Yokoyama, A.; Park, H.-D. Dynamics of microcystins-LR and -RR in the phytoplanktivorous silver carp in a sub-chronic toxicity experiment. Environ. Pollut. 2004, 127, 431–439. [Google Scholar] [CrossRef]
  67. Adamovský, O.; Kopp, R.; Hilscherová, K.; Babica, P.; Palíková, M.; Pasková, V.; Navrátil, S.; Marsálek, B.; Bláha, L. Microcystin kinetics (bioaccumulation and elimination) and biochemical responses in common carp (Cyprinus carpio) and silver carp (Hypophthalmichthys molitrix) exposed to toxic cyanobacterial blooms. Environ. Toxicol. Chem. 2007, 26, 2687–2693. [Google Scholar] [CrossRef] [Green Version]
  68. Liang, H.; Zhou, W.; Zhang, Y.; Qiao, Q.; Zhang, X. Are fish fed with cyanobacteria safe, nutritious and delicious? A laboratory study. Sci Rep. 2015, 5, 15166. [Google Scholar] [CrossRef] [Green Version]
  69. Crivelli, A.J. Action Plan for the Dalmatian Pelican (Pelecanus crispus) in Europe; Station Biologique de la Tour du Valat: Arles, France, 1996; 29p. [Google Scholar]
  70. Burns, J. Toxic cyanobacteria in Florida waters. Adv. Exp. Med. Biol. 2008, 619, 127–137. [Google Scholar] [CrossRef]
  71. Papadimitriou, T.; Katsiapi, M.; Vlachopoulos, K.; Christopoulos, A.; Laspidou, C.; Moustaka-Gouni, M.; Kormas, K. Cyanotoxins as the “common suspects” for the Dalmatian pelican (Pelecanus crispus) deaths in a Mediterranean reconstructed reservoir. Environ. Pollut. 2018, 234, 779–787. [Google Scholar] [CrossRef]
  72. Maliaka, V.; Faassen, E.J.; Smolders, A.J.; Lürling, M. The Impact of Warming and Nutrients on Algae Production and Microcystins in Seston from the Iconic Lake Lesser Prespa, Greece. Toxins 2018, 10, 144. [Google Scholar] [CrossRef] [Green Version]
Figure 1. Sampling sites in Lake Great Prespa, Lake Lesser Prespa and pond Vromolimni in 2012 (Panel a) and 2013 (Panel b) and 2014 (Panel c).
Water 13 00357 g001aWater 13 00357 g001b
Figure 2. Concentrations (μg L−1) of different microcystin variants measured in samples collected in two nearshore locations at Lake Great Prespa (I, II) and three locations in Lesser Prespa (III,IV,V) between 3 July – 14 August 2012 (Panel a) and in samples collected on August 30th/31st 2012 at five sites in Lake Great Prespa (1–5) and sixteen sites in Lake Lesser Prespa (6–21) (Panel b). The dashed lines indicate levels below or above which the health risk associated with recreational activities may be low or high [41]. MC-variants LY, LW, LF and nodularin (NOD) were not detected.
Water 13 00357 g002aWater 13 00357 g002b
Figure 3. Cyanobacterial- (black bars) and eukaryote algal (gray bars) chlorophyll-a concentrations (μg L−1) in samples collected on 30 and 31 August 2012 at five sites in Lake Great Prespa (1–5) and sixteen sites in Lake Lesser Prespa (6–21). The total microcystin concentrations are also shown (circles; μg L−1). The different dotted lines indicate boundaries in trophic state based on chlorophyll-a concentrations [42,43].
Water 13 00357 g003
Figure 4. Microscopy pictures of dominant cyanobacteria in Lake Lesser Prespa (Greece) in summer 2012. M.w. = Microcystis wesenbergii, D.l. = Dolichospermum lemmermannii, M.a. = Microcystis aeruginosa, Ps. = Pseudanabaena–associated with the mucous of M. aeruginosa.
Water 13 00357 g004
Figure 5. Concentrations (μg L−1) of different microcystin variants measured in samples collected on 3 September 2013 at ten sites in Lake Lesser Prespa (1–10). The dashed lines indicate levels below or above which the health risk associated with recreational activities may be low or high [41]. MC-variants LY, LW, LF and nodularin (NOD) were not detected.
Water 13 00357 g005
Figure 6. Mean cyanobacterial- (black bars) and eukaryotic algal (grey bars) chlorophyll-a concentrations (μg L−1) in samples collected on 3 September 2013 at five sites in Lake Lesser Prespa (1–5). The different dotted lines indicate boundaries in trophic state based on chlorophyll-a concentrations [42,43].
Water 13 00357 g006
Figure 7. Concentrations (μg L−1) of different microcystin variants measured in samples collected on 4 August 2014 (site I), during 4–20 September 2014–21, 30 October 2014 (site II) and 6 November (site III) in 2014 in Lake Lesser Prespa (Figure 1c). Letters a, b and c indicate repeated samples taken from the same location. The dashed lines indicate levels below or above which the health risk associated with recreational activities may be low or high [41]. MC-variant LW and nodularin (NOD) were not detected.
Water 13 00357 g007
Figure 8. Concentrations (μg L−1) of different microcystin variants measured in samples collected on 26 September 2012, 24 September 2013, 25 July and 21 October 2014 at several sites in Vromolimni. MC-variants LY, LW, LF and nodularin (NOD) were not detected.
Water 13 00357 g008
Publisher’s Note: MDPI stays neutral with regard to jurisdictional claims in published maps and institutional affiliations.

