
Evaluating the Potential of a Water-Energy-Food Nexus Approach toward the Sustainable Development of Bangladesh


1
Texas AM Energy Institute, Texas AM University, College Station, TX 77843, USA
2
Department of Biological and Agricultural Engineering, Texas AM University, College Station, TX 77843, USA
3
Institute of Science Technology and Public Policy, Bush School of Government and Public Service, Texas AM University, College Station, TX 77843, USA
*
Author to whom correspondence should be addressed.
Water 2021, 13(3), 366; https://doi.org/10.3390/w13030366
Submission received: 30 November 2020
/
Revised: 24 January 2021
/
Accepted: 25 January 2021
/
Published: 31 January 2021
(This article belongs to the Special Issue Water Systems Using Affordable and Clean Energy)
Abstract
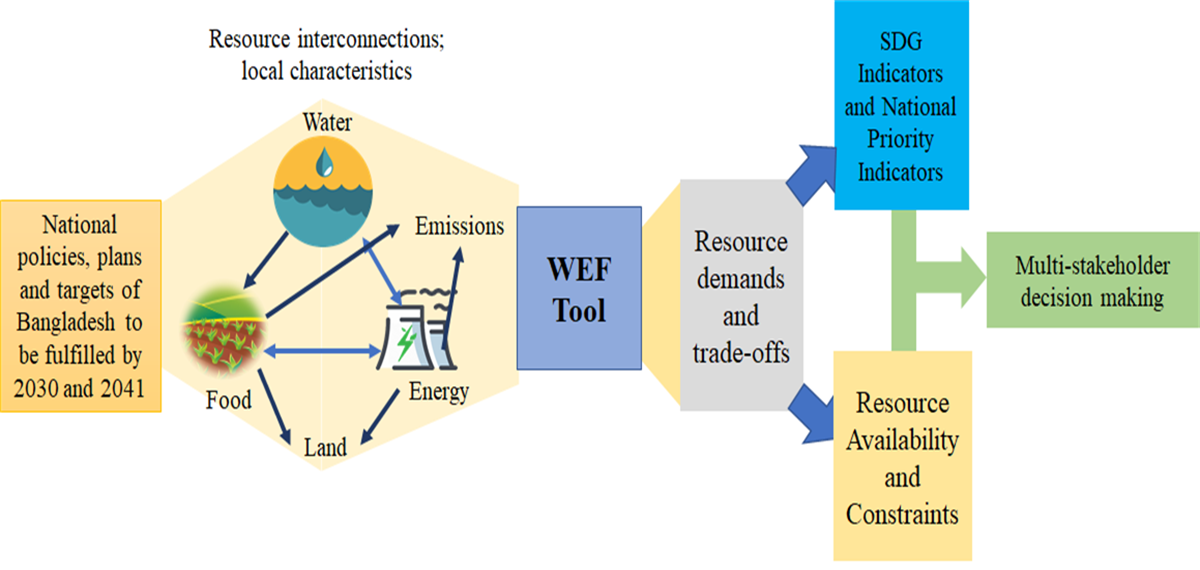
:In pursuit of continuous economic development, Bangladesh has undertaken long-term plans to boost its productivity in the agriculture, energy, and industrial sectors and to align with the United Nations Sustainable Development Goals (SDGs). Unless these strong interconnections and cross sectoral impacts are recognized, achievement of the future policy goals and national priorities of the concerned ministries regarding food self-sufficiency, cleaner energy sources, and water availability will be compromised. This study focuses on evaluating the impacts of cross-sectoral policy decisions on the interconnected resource systems at a national scale in Bangladesh. A quantitative analysis is performed to identify resource requirements, synergies, and trade-offs related to a set of future strategies. The analysis concludes by showing that land is the most limiting resource for future expansion and that fresh water will become a critical resource if alternative sources of water are not explored, and, that energy generation, if coal and other fossil fuels are favored over alternative energy sources, will significantly add to the total carbon emissions. Given the limitations of land available for agricultural expansion, of renewable water resources, and the challenges in meeting increasing water, energy, and food demands, the strong interdependencies among the interconnected resource systems must be accounted for. The SDG and national priority indicators are found to improve under scenarios for which resources are conserved via alternative sources.

1. Introduction
Water, energy, and food are at the core of human well-being, poverty alleviation, sustainable growth, and economic development [1,2,3,4,5,6,7,8]. Sustainable consumption and production of resources are central to the United Nations’ Sustainable Development Goals (SDGs) [9]. The concept of economic development has shifted toward ensuring security in core resources in an integrated manner [10,11,12]. With its increasing population and agenda for economic development, Bangladesh has promulgated long-term planning and is focused on championing economic growth, despite limited land and water resources. The pressure on resources is inevitable, yet manageable, if development planning acknowledges the complex interactions, local practices, and policies of the water, energy, and food sectors [11,12]. To align its national priorities with the sustainable development agenda of the United Nations [13], Bangladesh has developed prospective plans targeting future development of these sectors for 2030 and 2041 [14]. However, these plans might not fully reflect inter-sectoral interdependencies, such as those for water, energy, and food strategies. Notable concepts, frameworks, and methodologies have been developed to bring decision makers and scientists to a common platform for systematic understanding of sectoral resource interactions, synergies, and trade-offs [15,16]. The priority planning and policies can be screened through cross sectoral resource interactions to discover potential bottlenecks to future development that cannot be identified in isolation from one another. Over the past decade, the concept of the water-energy-food nexus has gained popularity among the research community to describe and address the interconnected nature of resource systems at different scales, which heavily influence social, economic, and environmental outcomes [17,18,19,20,21]. Considering the growing criticality of resource management in the context of Bangladesh, this paper uniquely aims to analyze the complex interactions across water, energy, and food sectors and builds on the Water-Energy-Food Nexus Tool 2.0 framework to evaluate a set of policy plans currently being explored in Bangladesh [17,18]. Specifically, this paper aims to identify and quantify the critical interconnections between water, energy, and food in the case of Bangladesh, develop an analytical tool to quantify resource requirements, trade-offs, and synergies associated with possible alternative scenarios for the food, water, and energy sectors by 2030 and 2041, and evaluate the socio-technical feasibility of the developed scenarios and their potential contributions for achieving the sustainable development goals.
2. Review of Literature
Water-energy-food (WEF) nexus discussions are traced back to the 2008 World Economic Forum in which the global challenges related to economic development were recognized as interdependent [22]. This was followed by the Bonn Conference (2011), which focused on ways to identify and quantify the interconnections between the three resource systems [10]. According to the Global Risk 2011 report, the water-food-energy nexus is highly influential in preserving human, social, and political securities. The urgency of identifying interlinkages in SDG thematic focus areas (especially SDG 2 for food, SDG 6 for water, and SDG 7 for energy) has grown since the declaration of the 2030 Agenda, leading to the creation of a working group under United Nations Inter-Agency and Expert Group on SDG (IAEG-SDG). Despite the emphasis by international organizations on WEF nexus, the core concept of nexus representation of resources seems seldom recognized by developing countries [18]. More recently, WEF has emerged as a useful concept for describing the complex, interdependent, interactive resource systems for a given social, economic, or environmental issue. However, researchers report that the introduction of the WEF nexus concept is context-dependent and the generalized use of such terms can be overlapping and ambiguous [19,20]. It is also important to note that conceptualization of the WEF nexus varies in scope, objectives, assessments, and understanding of the relevant drivers [21]. Existing nexus models vary in scale from regional to local, and in the levels of interactions [23]. Many tools and models developed in the past decade focused on answering critical questions in resource management in various contexts and at different scales [24]. The complexity and data intensity vary from one tool to another, as do the potential users of the tools. Gaps remain in developing quantitative tools to support integrative decisions by policy makers across sectors [25]. In the context of Bangladesh, national policy documents concerned with water, energy, and food are usually focused on water centric interactions [26]. This research customizes the Water-Energy-Food Nexus Tool 2.0 to address critical questions related to the development of WEF sectors in Bangladesh. The process is facilitated by a list of seven guiding questions (7QG) for stakeholder identification, scale, evaluation metrics, and scenarios [27,28].
3. Water, Energy, and Food Resources in Bangladesh: Present and Projecting Future Description
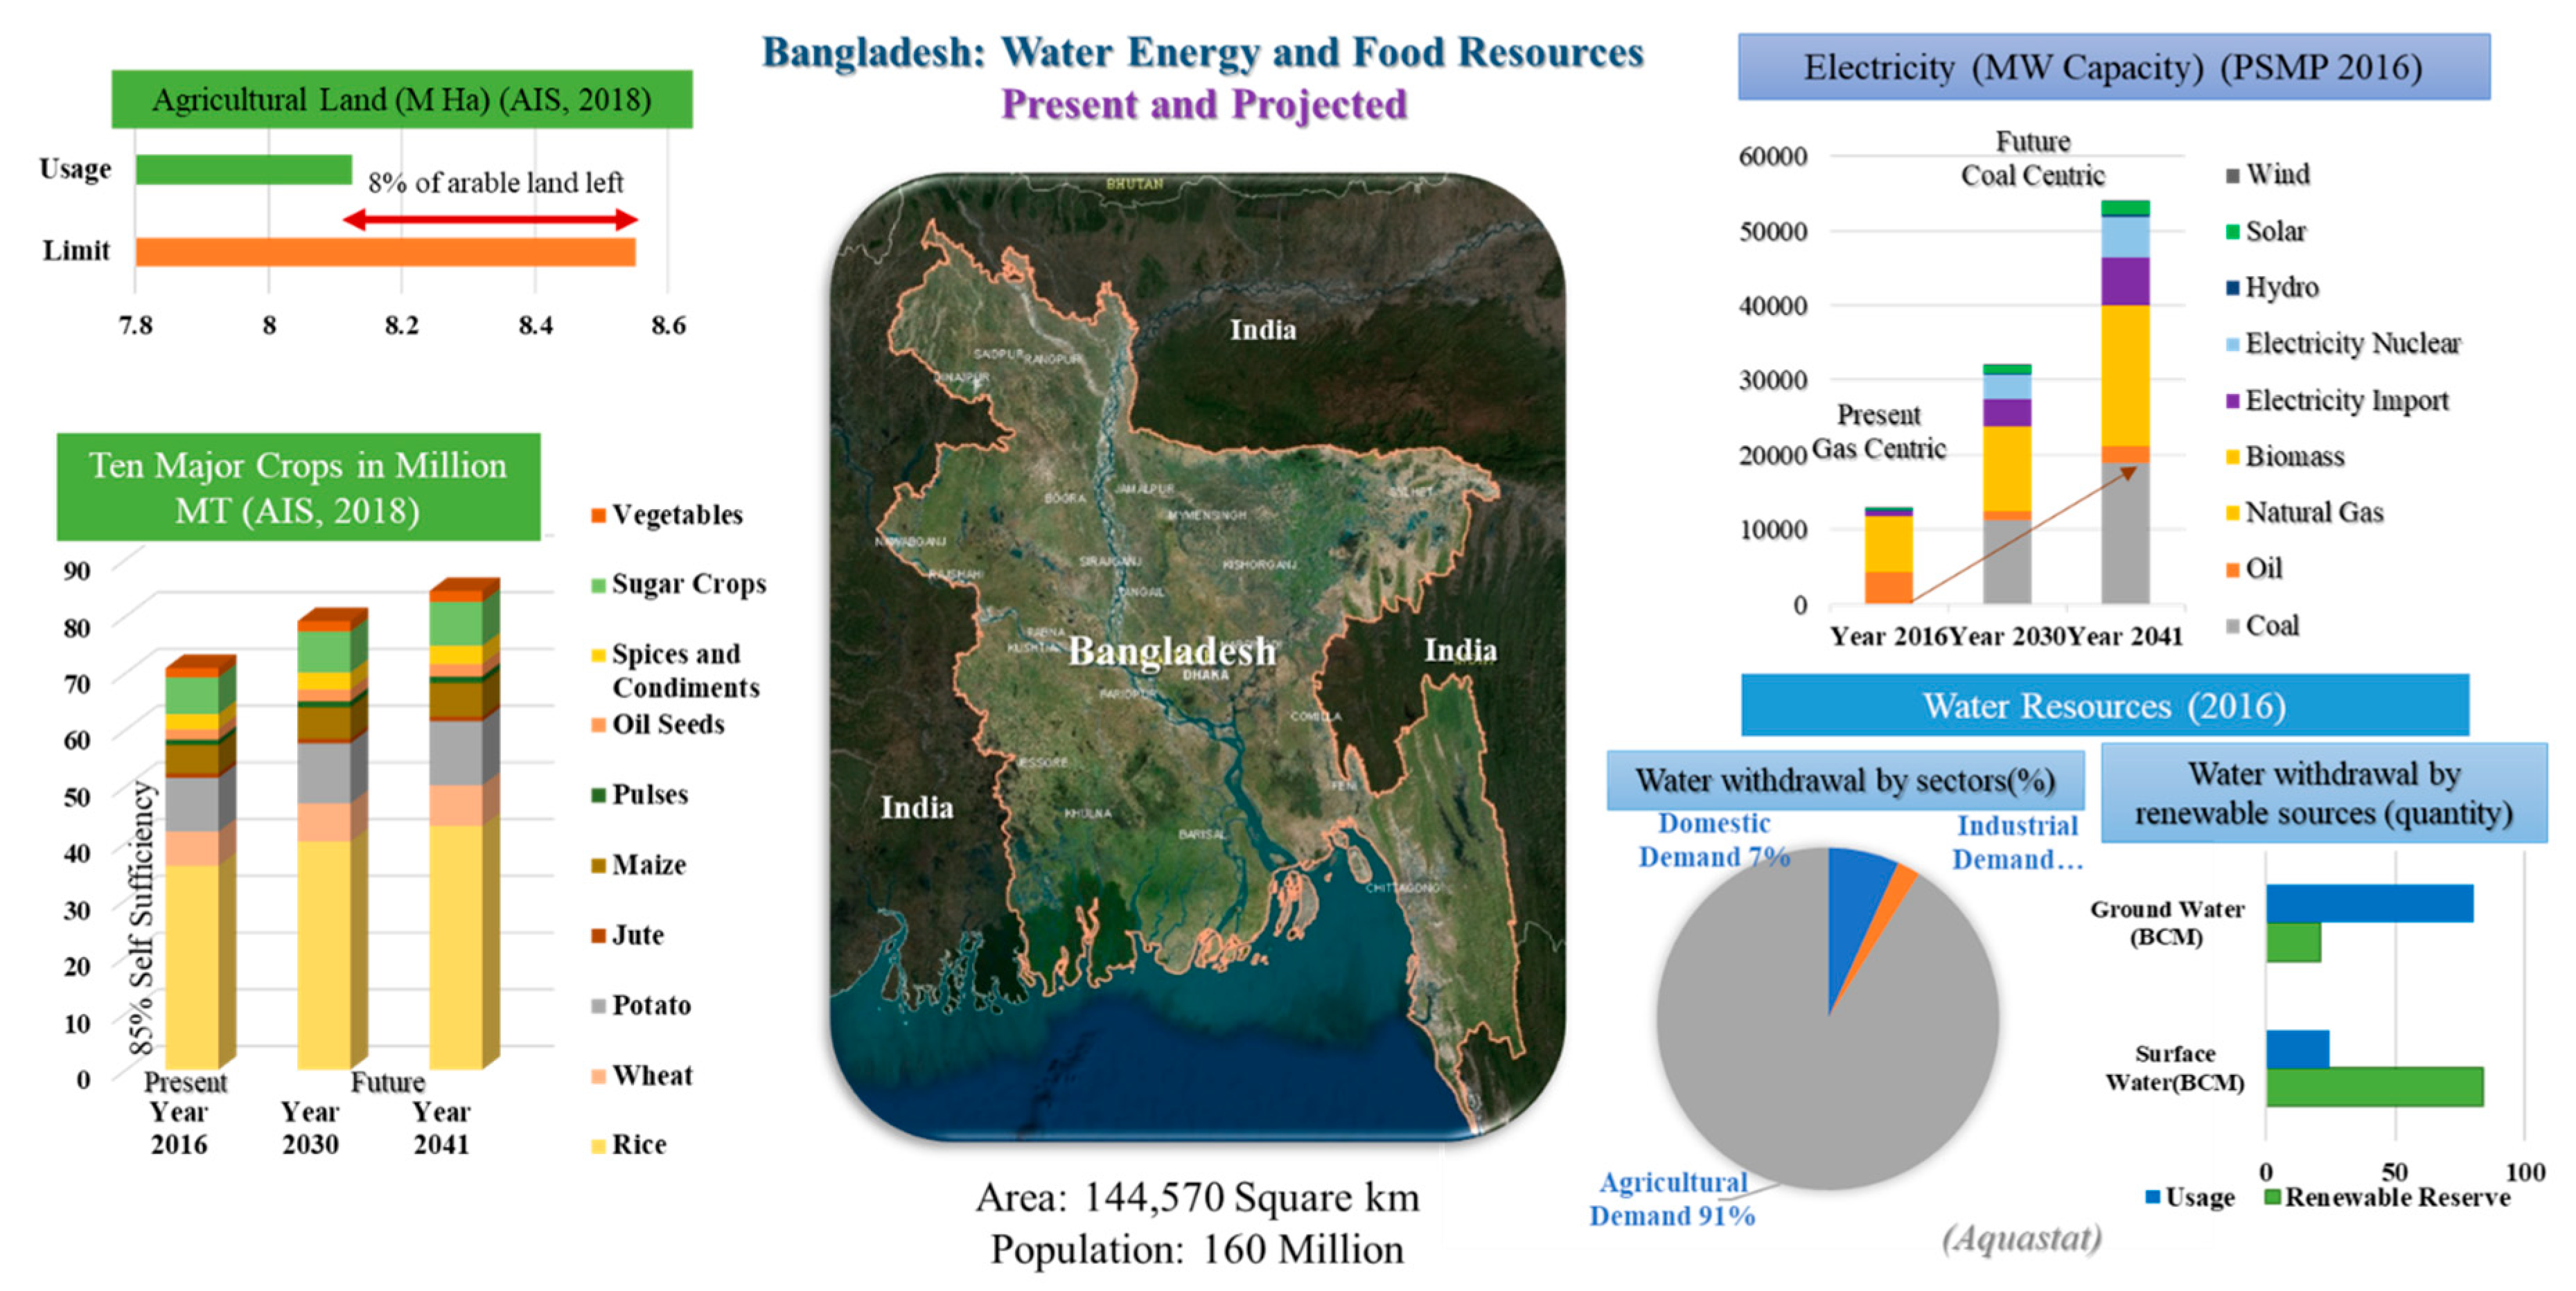
Bangladesh has limited land and ground water reserves for agriculture and has depleting energy resources [29]. Recent climate change patterns indicate that ‘too much water’ during the wet season and ‘too little’ water during the dry season have significantly shifted agriculture’s dependence on groundwater [18]. In 2008, 79% of the total water used in agriculture was withdrawn from the ground: a quantity beyond the national renewable groundwater limit (20 BCM). Increasing dependence on groundwater has increased stress on its availability to the agriculture-rich north west of the country as the groundwater table falls and becomes more vulnerable to arsenic poisoning [30]. As the rest of the world attempts to reduce dependency on fossil fuel, Bangladesh’s energy portfolio is projected to become more coal-intensive (up to 55% share in electricity generation) [31]. Food production in Bangladesh is rice dominated (around 51% of water used is for rice production), which is followed by nine other major crop groups [32]. Bangladesh’s combined self-sufficiency in 10 major crop groups is 85%. In 2016, net arable land for crop production in Bangladesh was 8.56 mega hectares [32]. Bangladesh has more than 300 cropping patterns and an aggregate 194% cropping intensity in food production. With the growing population and economic development, future food demand will vary in both quantity and quality [33].
The current policy of Bangladesh focuses solely on economic development, and energy solvency is a predominant issue in national planning. Many research publications, both national and international, suggest the economic development nexus is directly linked to energy consumption [34,35], but these give little consideration to the type and environmental impact of energy sources (domestic or industrial). While existing policies lack efficacy in regulating excessive use of groundwater by agriculture and industry, the choice of primary energy sources are more impactful than secondary sources due to the environmental impact of their conversion. Bangladesh formulated two long-term major development plans: Delta Plan (DP) 2100 and Power System Master Plan (PSMP) 2016 reflecting National Energy Policy, but these are not highly connected [26,31]. The energy sector of Bangladesh depends on domestic gas production coupled with imported oil and liquefied natural gas. Domestic coal production is limited. The only domestic energy source is natural gas, which will be depleted unless new reservoirs are discovered.
DP 2100 is one of the most comprehensive, long-term plans for water, land, environment, and ecological preservation and states that renewable energy will account for 20–30% of the total electricity. PSMP 2016 considered up to 10% integration of renewable energy for 2030. Although the seventh five-year plan includes projects and programs to strengthen productivity of lower yield crops, the SDG action plan of the Ministry of Agriculture has yet to acknowledge the growing diversification of crops and domestic production capacity [36]. Thus, it is conspicuous that, despite long-term visions for water, energy, and food, integrated security for these resources is not the focus of national policies. Figure 1 depicts the overall food and energy demand for 2016, and the projected demand for 2030 and 2041. Land and water resources available for agricultural expansion are limited with only 8% of arable land remaining. Due to increasing pressure on groundwater resources, strategic planning is required to sustain projected growth demands for food and energy.
4. Methodology
4.1. Quantifying Key Resource Systems’ Interactions
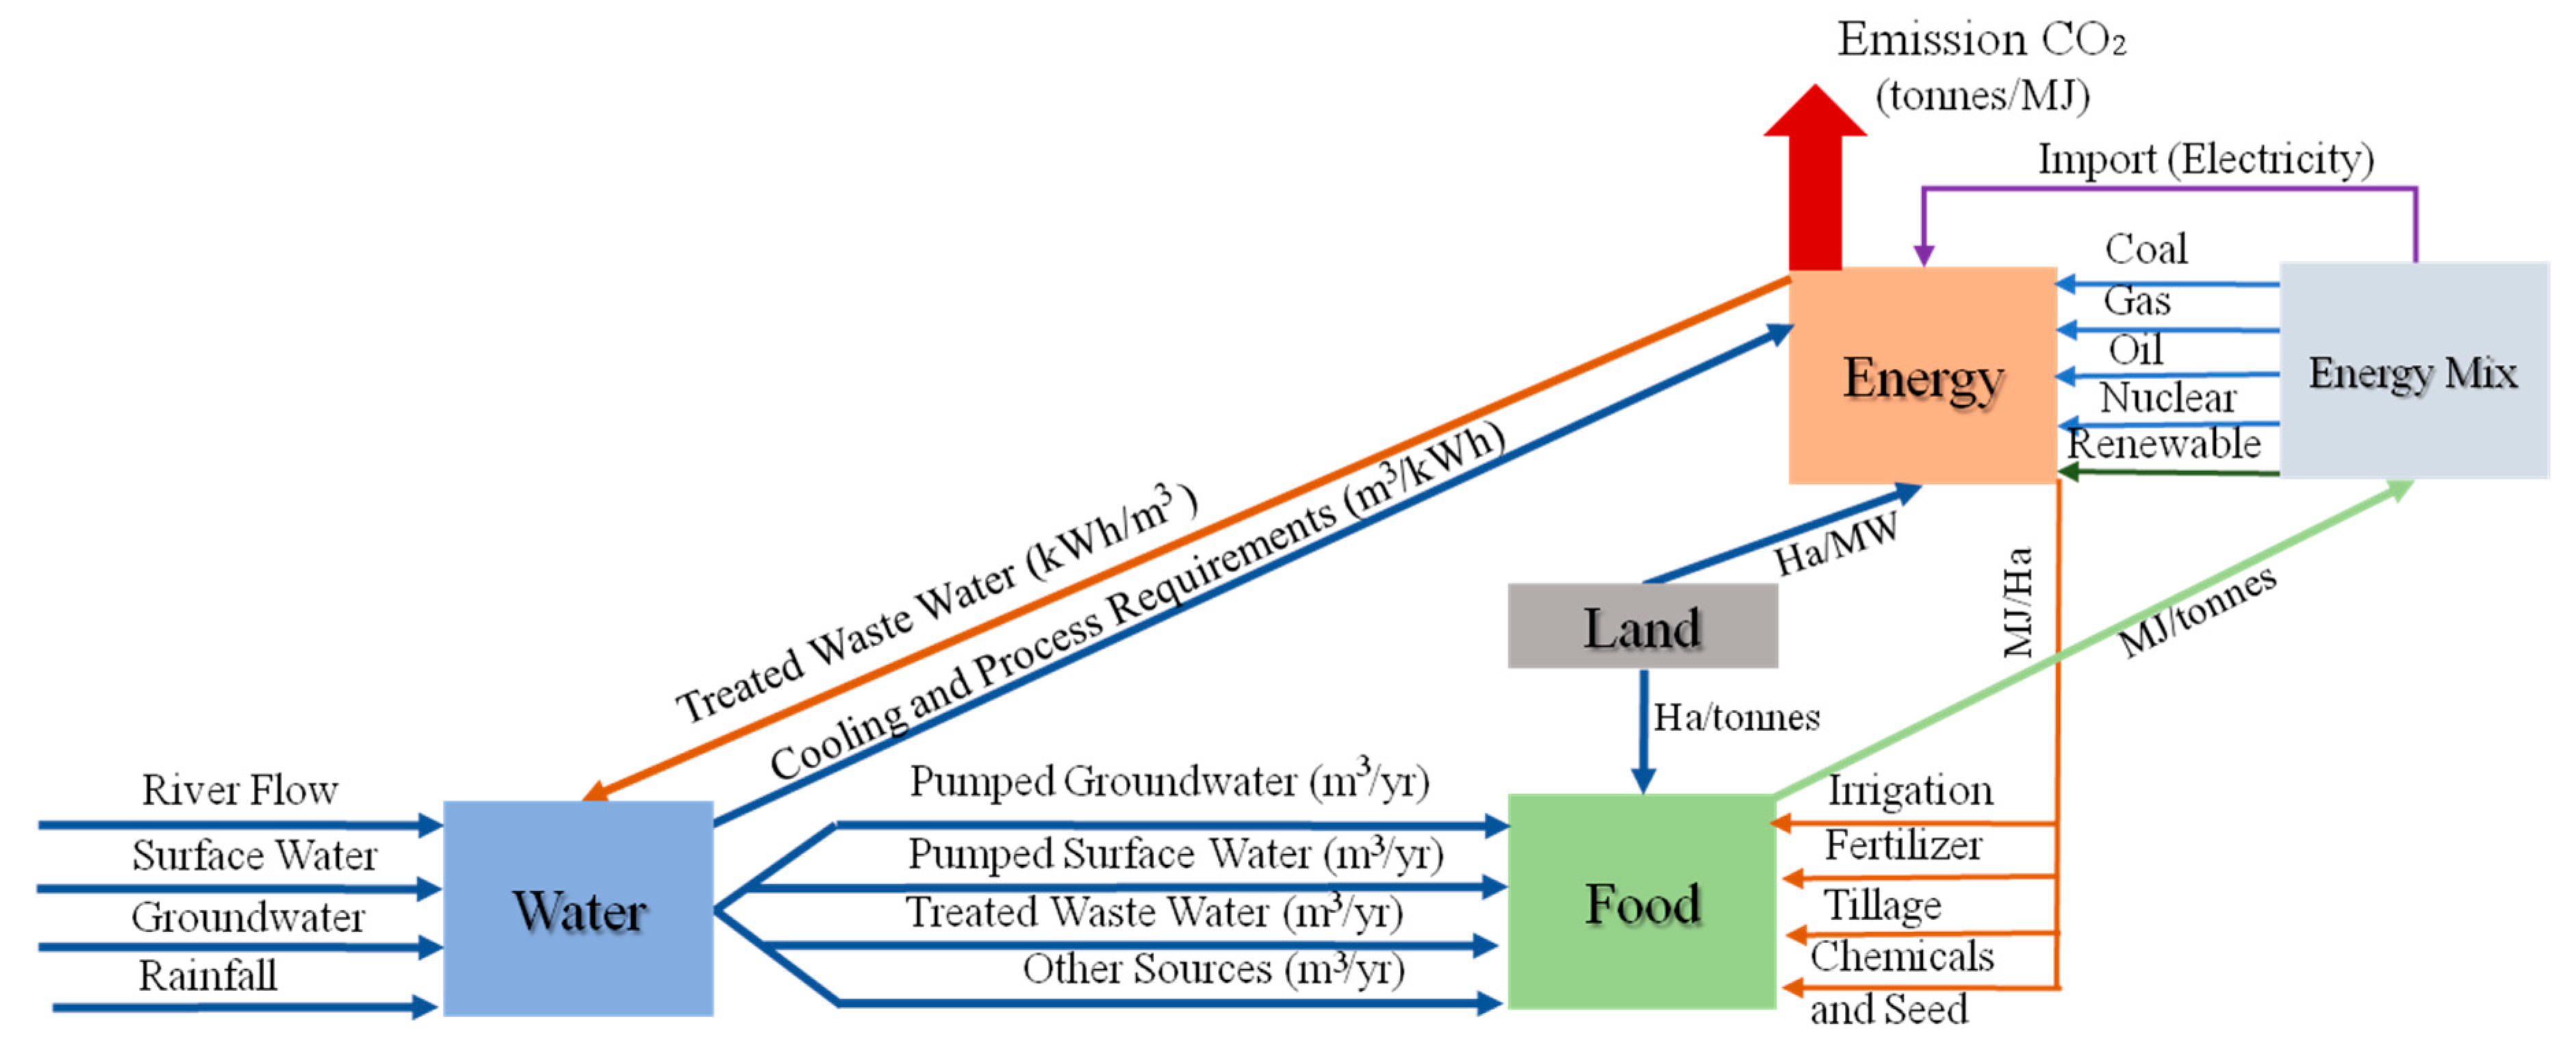
The key cross sectoral interactions can be quantified by defining the resource flow. Land, water, and energy requirements vary with the type of crop and volume of production. Land requirement (in Ha) can be calculated using local yields (tonnes/Ha). The amount of water needed can be assessed by using local water productivity (kg/m3) for each crop [37]. The volume of water withdrawn from different sources can be quantified by assigning the share of water from each source. Water withdrawal and wastewater treatment require energy (kWh/m3) and add to the emission (gCO2/kWh). Tillage, harvesting, fertilizer, and chemical requirements are both crop and local-practice dependent. Use of energy, in the form of mechanical energy (tillage), chemical energy (fertilizer, chemicals, and others), and irrigation can be quantified as kJ/Ha or kWh/Ha for different crops [38]. Demand for land (Ha/kWh) and water (m3/kWh) to generate or process energy depends on the technology and primary source of energy used [39,40]. The carbon footprint for each type of energy generation process is measured by emission per unit of electricity production (gCO2/kWh) [41].
The developed tool follows the WEF Nexus Tool 2.0 structure [17]. It is developed by turning the key interaction among resources into quantitative interactions. The tool consists of input options that reflect national food, energy, and water strategies. The following equations are used to capture some of the key interactions at a national scale.
WT represents total water demand for producing food and energy. EF is the total energy demand for producing food, where the first part of the equation quantifies the energy input in the form of chemicals, fertilizers, tillage, irrigation, and the second part quantifies the energy required to treat water for irrigation. FT is the projected population-adjusted food demand for different crops (food and animal feed), assuming a similar diet pattern as observed in base year 2016. LT is the net land demand for food production calculated by Equation (3) and projected energy demand. In Equation (4), cropping intensity is used to calculate the net arable land required for food production [33]. CE is the total carbon emission from electricity production under the given energy mix and volume of electricity generated. CF is the total carbon emission from the energy used for food to be produced calculated by Equation (3). and are carbon footprints for 10 major crops and nine major sources of energy, respectively.
WT, EF, FT, LT, CE, and CF are expressed in billion m3, in tera watt-hours, million metric tonnes, mega hectares, and in mega tonnes, respectively. Only electricity generation is considered for the energy sector, as it is static in nature and requires sustainable amounts of land, water, and carbon footprints. Figure 2 demonstrates the identified interactions among water, energy, and food resource systems for the analytical tool.
4.2. Scenario Development and Connecting Indicators
A set of scenarios for assessment are developed, each with three distinct portfolios: water by share from three sources, 10 major crop groups by individual self-sufficiency, and energy by share from nine primary sources. Each scenario reflects a distinct energy portfolio from the Power System Master Plan (PSMP) of Bangladesh for 2030 and 2041 [31]. The food demand was adjusted for population growth in 2030 and 2041. The quantity of electricity generated for 2030 and 2041 was kept identical to the projected generation mentioned in PSMP 2016. Assessments are used to calculate global SDG indicators, such as cereal yield (SDG 2), percentage of freshwater withdrawal from reserve and treated wastewater (SDG 6), emission from electricity production (SDG 7), and national priorities on land conservation for agriculture (National Priority Indicator 4: minimum 55% land conservation for agriculture) and renewable energy integration (National Priority Indicator 20: minimum 10% renewable energy in electricity generation) [14,42].
4.3. Scenario-Based Framework
The framework follows the 7QG to define the system-of-systems intended for study and their shared resources [27]. Each interaction among these resources results in resource flow from one resource subsystem to another. The resource security of each of the resources depends on the availability of commonly shared resources and the demand for that resource. Based on identified national food, water, and energy portfolios as well as the feasibility of a scenario, a set of strategies can be assessed with respect to the local characteristics of a resource interaction. Thus, the defined system can capture the local essence of resource interconnection. The cross sectoral resource interaction includes the water requirements for crop production, energy processing, and generation from conventional and non-conventional water sources. Food production and energy processing require land and agriculture that necessitates energy in the form of mechanical energy, fertilizers, chemicals, and irrigation. Land and water demand emission from electricity and food production depends on technology and efficiency.
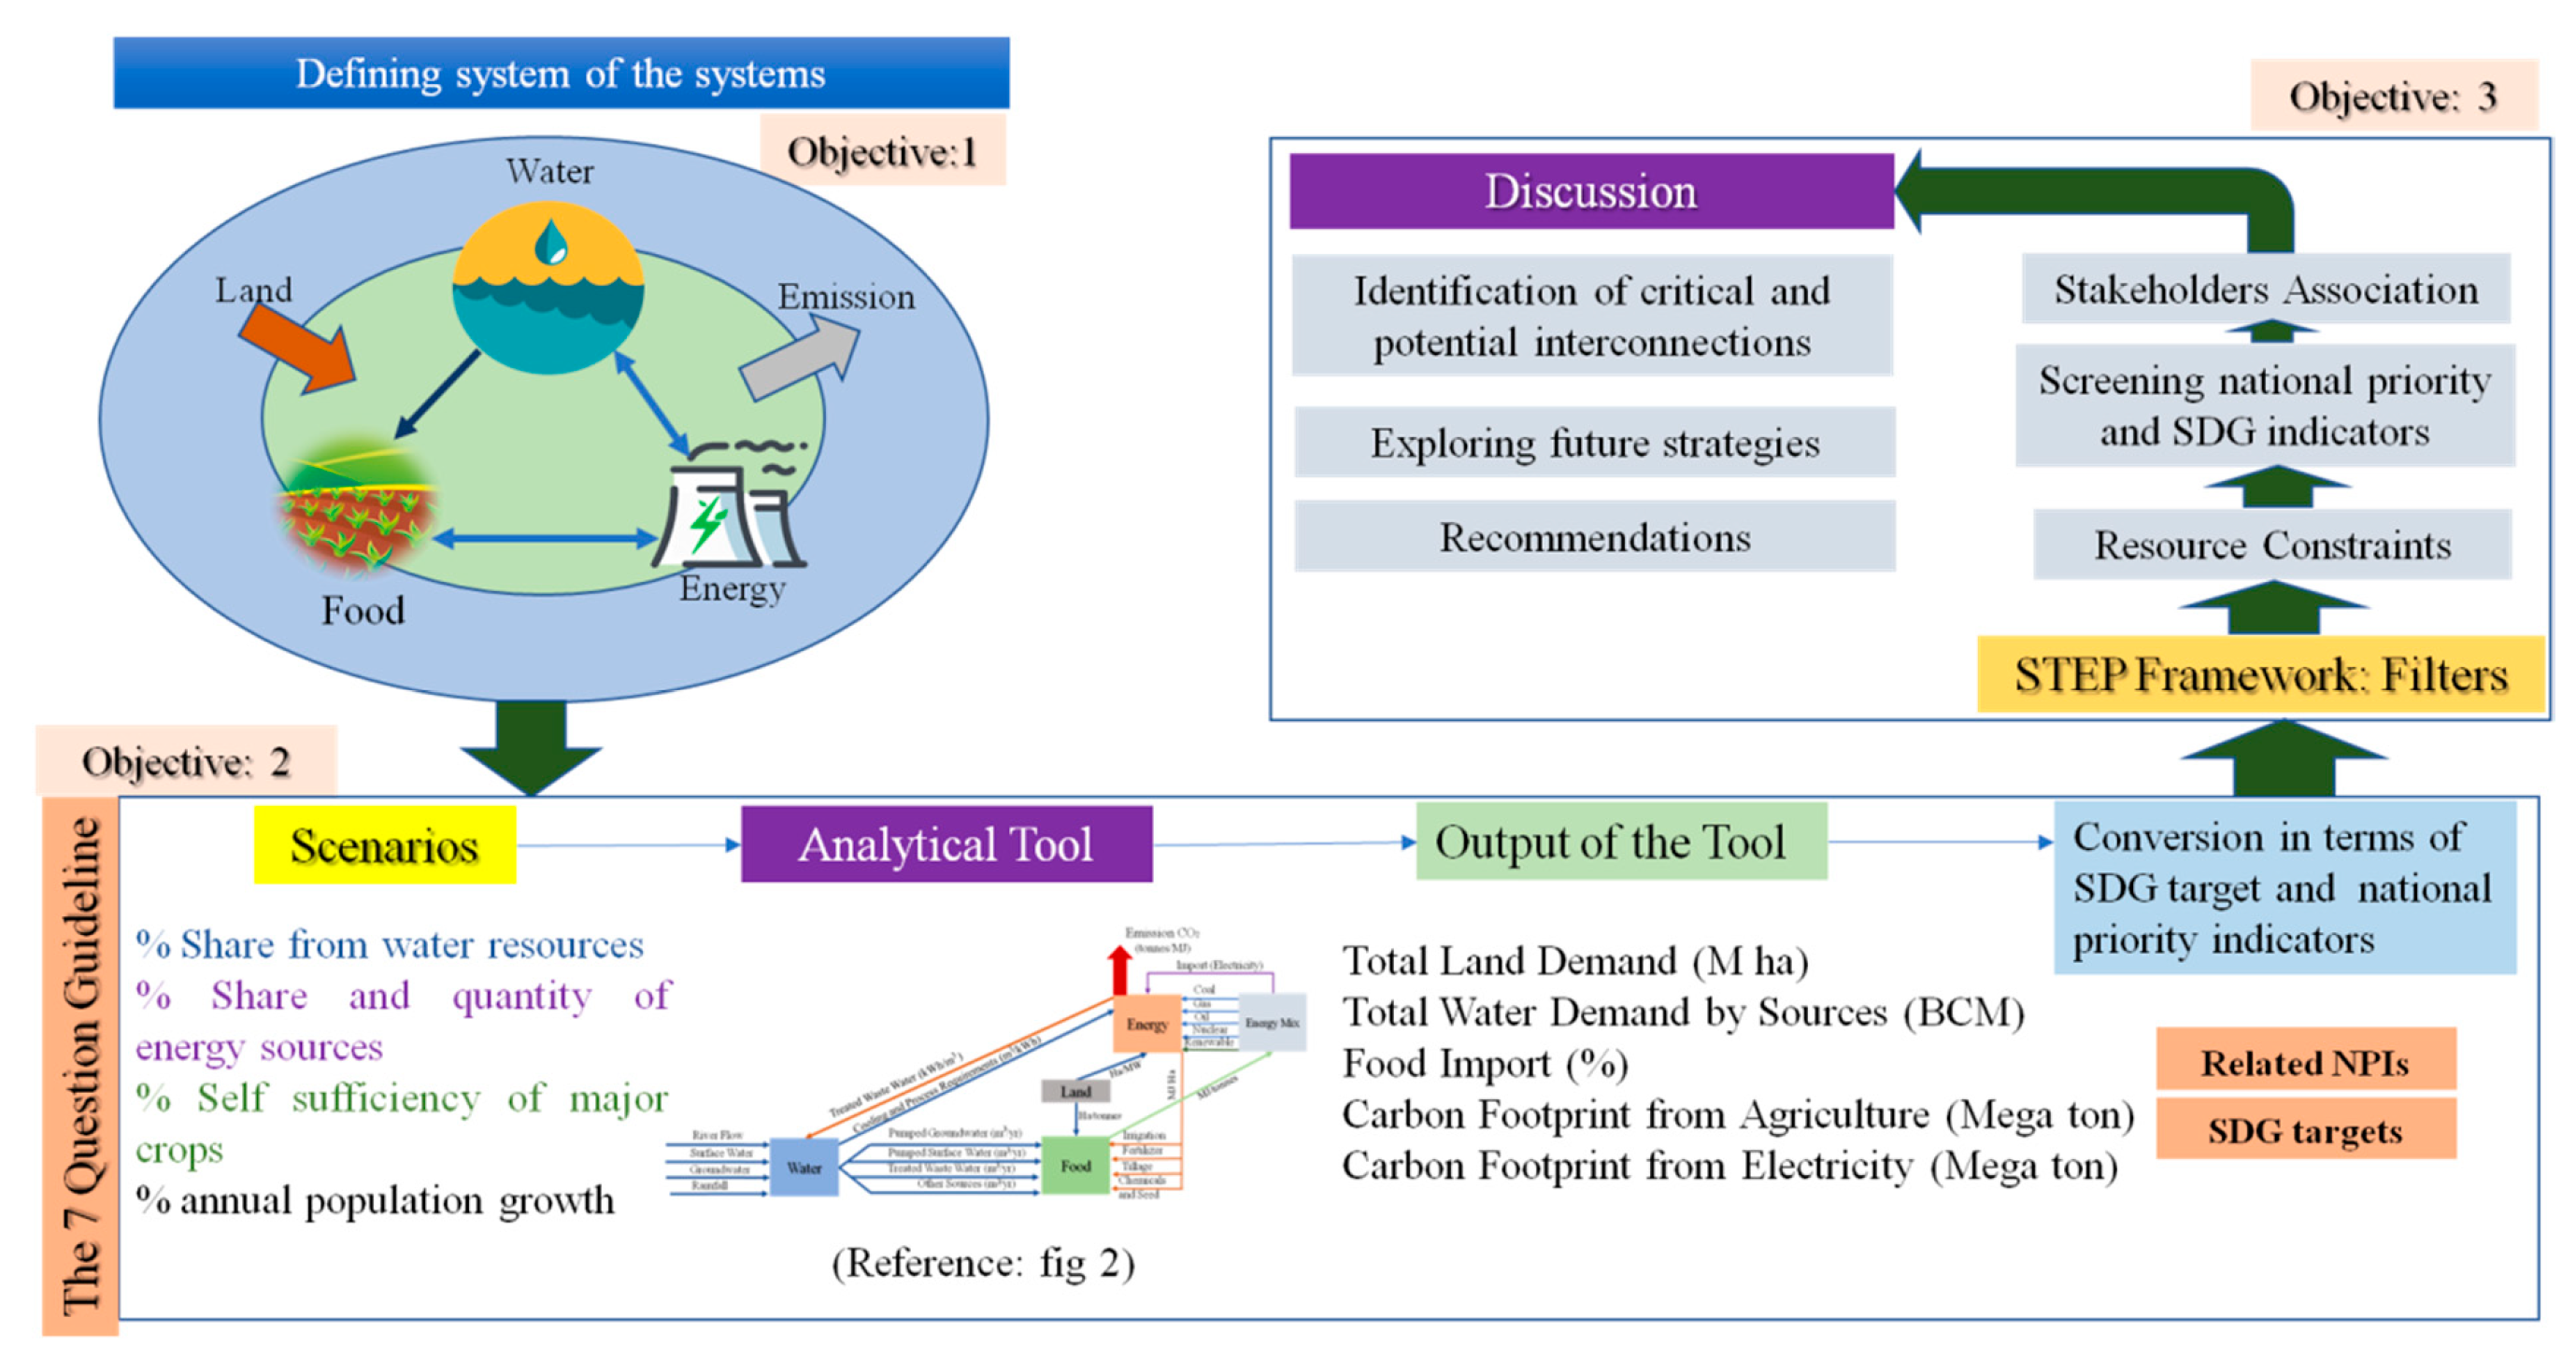
Figure 3 summarizes the conceptual methodology of the study. In phase 1, the interconnected system-of-systems is identified based on the cross sectoral interconnections of the core resources network (water, energy, and food) and the peripheral networks (land and emissions) in the environment of Bangladesh. A resource balance sheet for water, energy, and food are prepared for the base year (2016) and identify the national capacity for bio-physical resources and the local characteristics of cross sectoral resource flow. Based on the national projected food, energy, and water demands published in national priority planning, a resource balance in future timelines, 2030 and 2041, is produced.
In phase 2, the 7-Question Guideline is followed to develop the WEF nexus analytics. Phase 2 includes identification of the critical question of the study: developing the quantitative framework of the WEF interconnections at a national scale, identified in phase 1. The quantitative framework is used to assess different scenarios of national water, energy, and food decisions. Stakeholders or decision makers (ministries and autonomous bodies), per their individual roles and involvement with each of the resources, policies, and national priorities, are identified. The assessment parameters are set to provide a comparative platform for different scenarios. Assessments for each of the scenarios are then converted as indicators defined by national priorities, sustainable development goal targets, and holistic resource demands, to highlight whether any scenario exceeds the bio-physical resource limit. The input consists of food portfolios for 10 major crops, namely, rice, wheat, maize, potatoes, jute (cash crop), oil seeds, pulses, sugarcane, spices, and vegetables. The energy portfolio has fossil fuel, clean, and renewable energy options (coal, oil, gas, nuclear, imported electricity, biomass, wind, solar, and hydroelectricity). The energy input for food production comes from chemicals and mechanical input. However, as Bangladesh imports more than half of its chemical products for agriculture, emission for imported products were kept at zero. Three water resources are considered for the study: surface, ground, and treated wastewater. To ensure that the tool captures the local characteristics of resource interaction, multiple data sources were accessed. For crops, the national data for Bangladesh is collected from Agricultural National Service [32]. For energy, the global average for each of the technologies is considered. For the water resource balance, the AQUASTAT country-based database is accessed [43].
In Phase 3, by following the STEP 3 filter framework, assessments for each scenario, in terms of indicators of national priorities and assessments, are compared against one another to identify for which set of scenarios the projected outcomes attain national priorities. Sustainable Development Goal (SDG) targets with reduced pressure on resources, and how it involves the stakeholders identified in phase 2 [28]. The filters were set to screen scenarios that fall outside the resource constraints, stakeholder goals, and sustainable development indicators. Some critical and potential interconnections are identified to provide future scenarios.
5. Scenario Results
After developing the analytical tool that adapts the local characteristics in key resource interaction, the base year scenario in 2016 is developed to establish a benchmark for comparing other scenario options and to compare its results with published data. Table 1 lists the input and output for the tool and its comparison to the published data.
The tool outputs for the 2016 scenario are close to the published data except for water demand assessment, which accounts for 10 major crops and nine energy sources of electricity generation. The published energy demand for food production was estimated through simulation when no reliable, updated data sources were found. The assessed emission from electricity generation was found to be equal to the data published on the International Energy Agency (IEA) website [44].
The tool calculates future resource requirements by assuming:
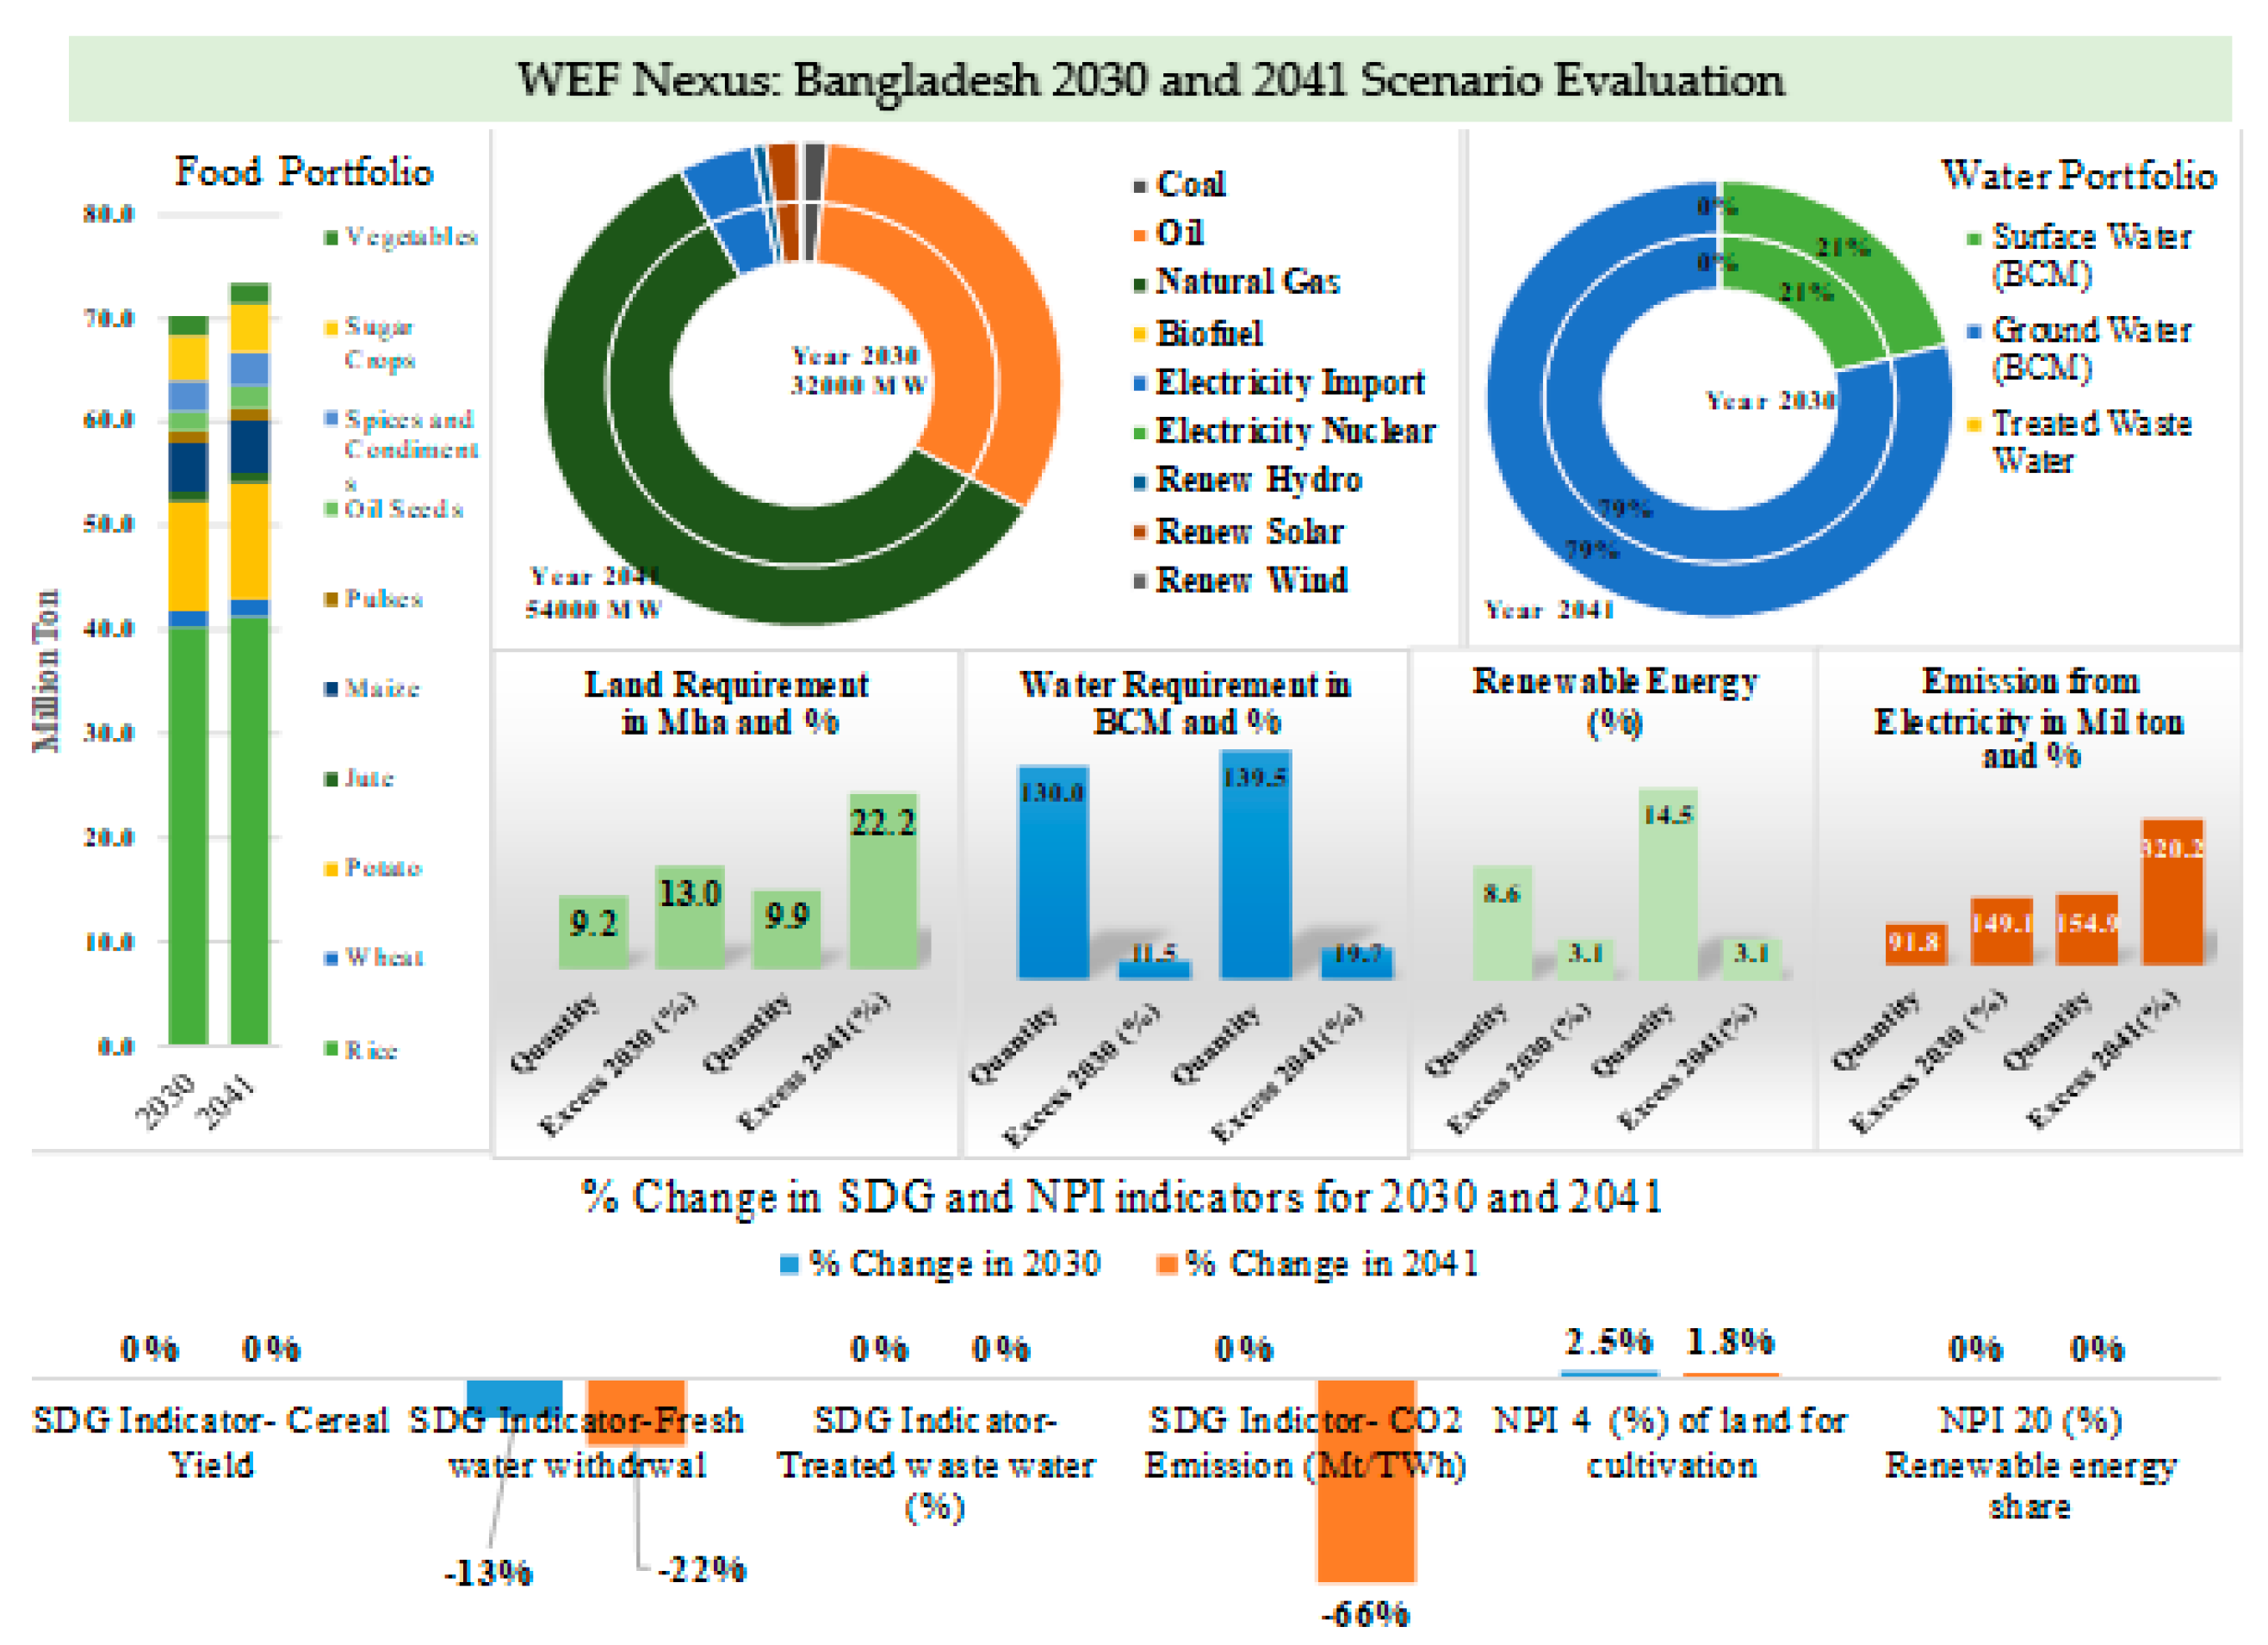
With the flexibility of changing self-sufficiency (from 0% to 100%) of 10 major crops as well as share of energy sources for electricity production and water resources, various scenarios can be considered. Table 2 lists scenarios that reflect the core plans of the Ministry of Agriculture (food), the Power Division (energy), and the Ministry of Water Resources (water) for years 2030 and 2041. The Business as Usual (BAU) scenario represents the same portfolios for water, energy, and food as year 2016. The developed tool takes a portfolio of food, water and energy as input and projects resource required to attain such scenario both in numbers. Figure 4 illustrates resource requirements and percentage change in SDG and NPI indicators, projected in the year 2030 and 2041 for the BAU scenario. Scenario 1 includes 100% self-sufficiency in major cereal production (major goal for Ministry of Agriculture in the future) and electricity generation being more carbon intensive. This scenario aims at 100% food self-sufficiency, 55% of coal for electricity production, and 21–79% of surface and groundwater, respectively, reflecting the PSMP 2016 plan for water. Scenario 2 explores 100% self-sufficiency in food with slight reduction in dependency on coal and groundwater. Scenarios 3, 4, and 6 represent a reduction in percent self-sufficiency (SS) in different crops, an increased share of renewables in energy, and an increased share of treated wastewater and surface water. From the BAU scenario to scenario 5, the population growth of Bangladesh was moderate [45]. For the last scenario, the population growth was kept at a lower variant to show how much self-sufficiency in food can be achieved if the demand increases at a slower pace [45].
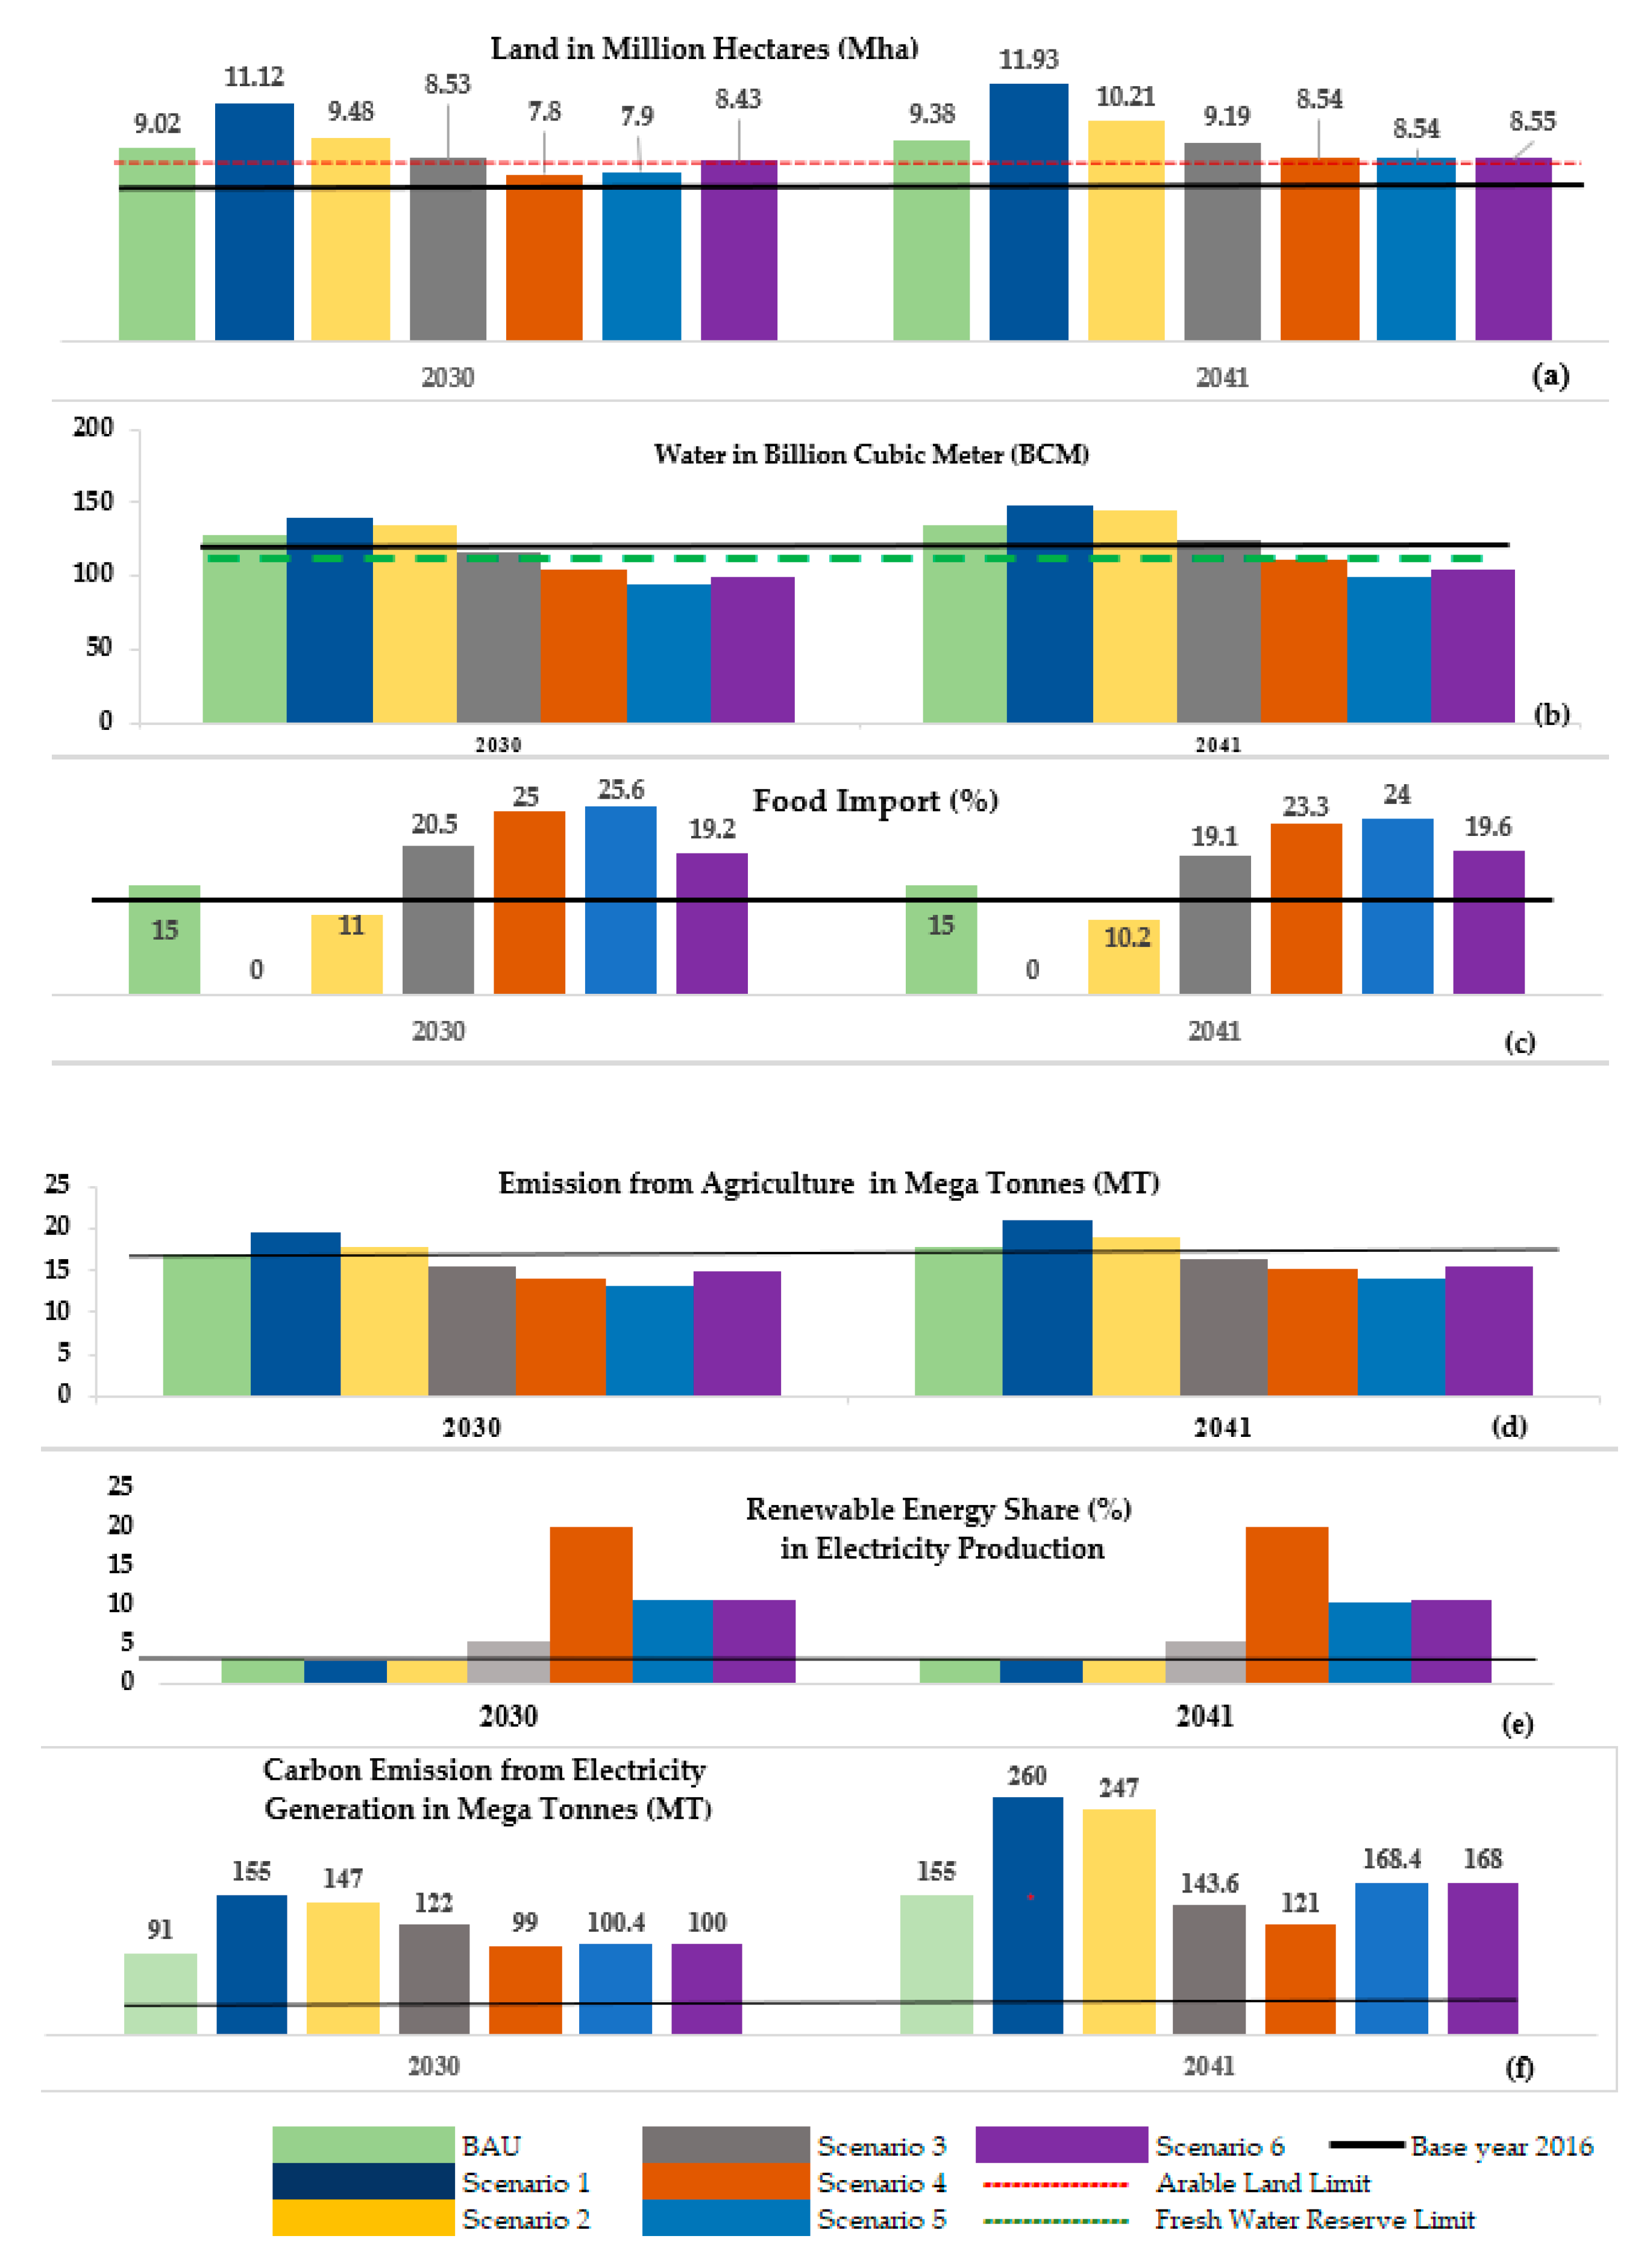
The different scenarios are assessed according to their water and land requirements, carbon emissions, share of food import, and share of renewable energy. Figure 5 provides a comparative representation of assessments for each scenario compared to base year 2016. The dark black line represents the resource requirements (Figure 5a,b), food import (Figure 5c), emissions from agriculture and electricity (Figure 5d,f), and renewable energy share (Figure 5e) for year 2016.
The BAU scenario represents the projected evaluation of base year 2016 resource portfolio. The dotted red line in Figure 5a shows the national arable land limit [32]. Dark lines in all graphs indicate base year assessments. In Figure 5b, the green dotted line indicates the national renewable water reserve capacity of Bangladesh [43]. Compared to base year resource demand (indicated by a dark black line in each of the graphs in the Figure 5), all the listed scenarios require more resources in the future.
Scenarios 1–3, including the BAU scenario, exceed resource constraints in land and water by year 2030. Scenario 4 requires more water resources than the national resource limit by year 2041. Scenarios 1–3, with the percent of SS projection above 78% (Figure 5c) and coal share over 35% with a limited, treated, wastewater share, are not achievable under prevailing local characteristics due to higher land and water demand compared to a national resource reserve. The emission from future electricity generation is nearly three and five times higher because of the quantity of electricity projected for 2030 and 2041, respectively. Still, a 5% increase in renewable energy share (scenario 4) replacing 5% coal can contribute up to 10% less reduction (Figure 5f). The carbon footprint for food production is sensitive to the volume of production and type of crop. The emission for producing cereals and vegetables are found higher than other crops (Figure 5d). For scenario 4, overall percent of SS in producing 10 major crops was kept below 78% with more renewable energy integration and a 5% share of water from treated wastewater. The scenario is found to be feasible in year 2030 within a national resource limit, but requires more water in 2041, which is beyond the reserved limit. Scenarios 5 and 6 projects at least 75% overall self-sufficiency in major crop production with 10% integration of renewable energy from either solar or wind energy and increasing treated wastewater and surface water shares under moderate population growth projection. The assessments for these scenarios show that Bangladesh have to depend significantly on food imports in cases of moderate population growth projected in year 2030 and 2041, as limited land and ground water resources are left for agricultural expansion. Yet, the carbon footprint in electricity production can be significantly improved by replacing the share of carbon with less polluting fossil fuel and renewable energy sources.
6. Discussion
The assessed scenarios allow exploration of the trade-offs associated with different cross-sectoral decisions. In addition to quantifying the resource requirements for different scenarios, it is useful to translate the impact these outputs represent on the national priority indicators and SDG indicators. This would facilitate the process of trade-off evaluation by the cross sectoral stakeholders from the different institutions. For instance, the Ministry of Agriculture (MoA), the lead in advancing SDG 2 (zero hunger) indicators, would be interested in food security, crop yield, and preservation of land and water resources to sustain crop self-sufficiency [46]. Power Division (PD) is responsible for implementing electricity generation infrastructures, relating its interest in carbon emission and renewable energy integration (SDG 7) [46]. The Ministry of Water Resources (MoWR) and Local Government Division (LGD) are the lead ministries for implementing SDG 6, coordinating the water management and allocation [46]. The developed tool and analytics provide a platform for different stakeholders to discuss and debate the coordination of national plans.
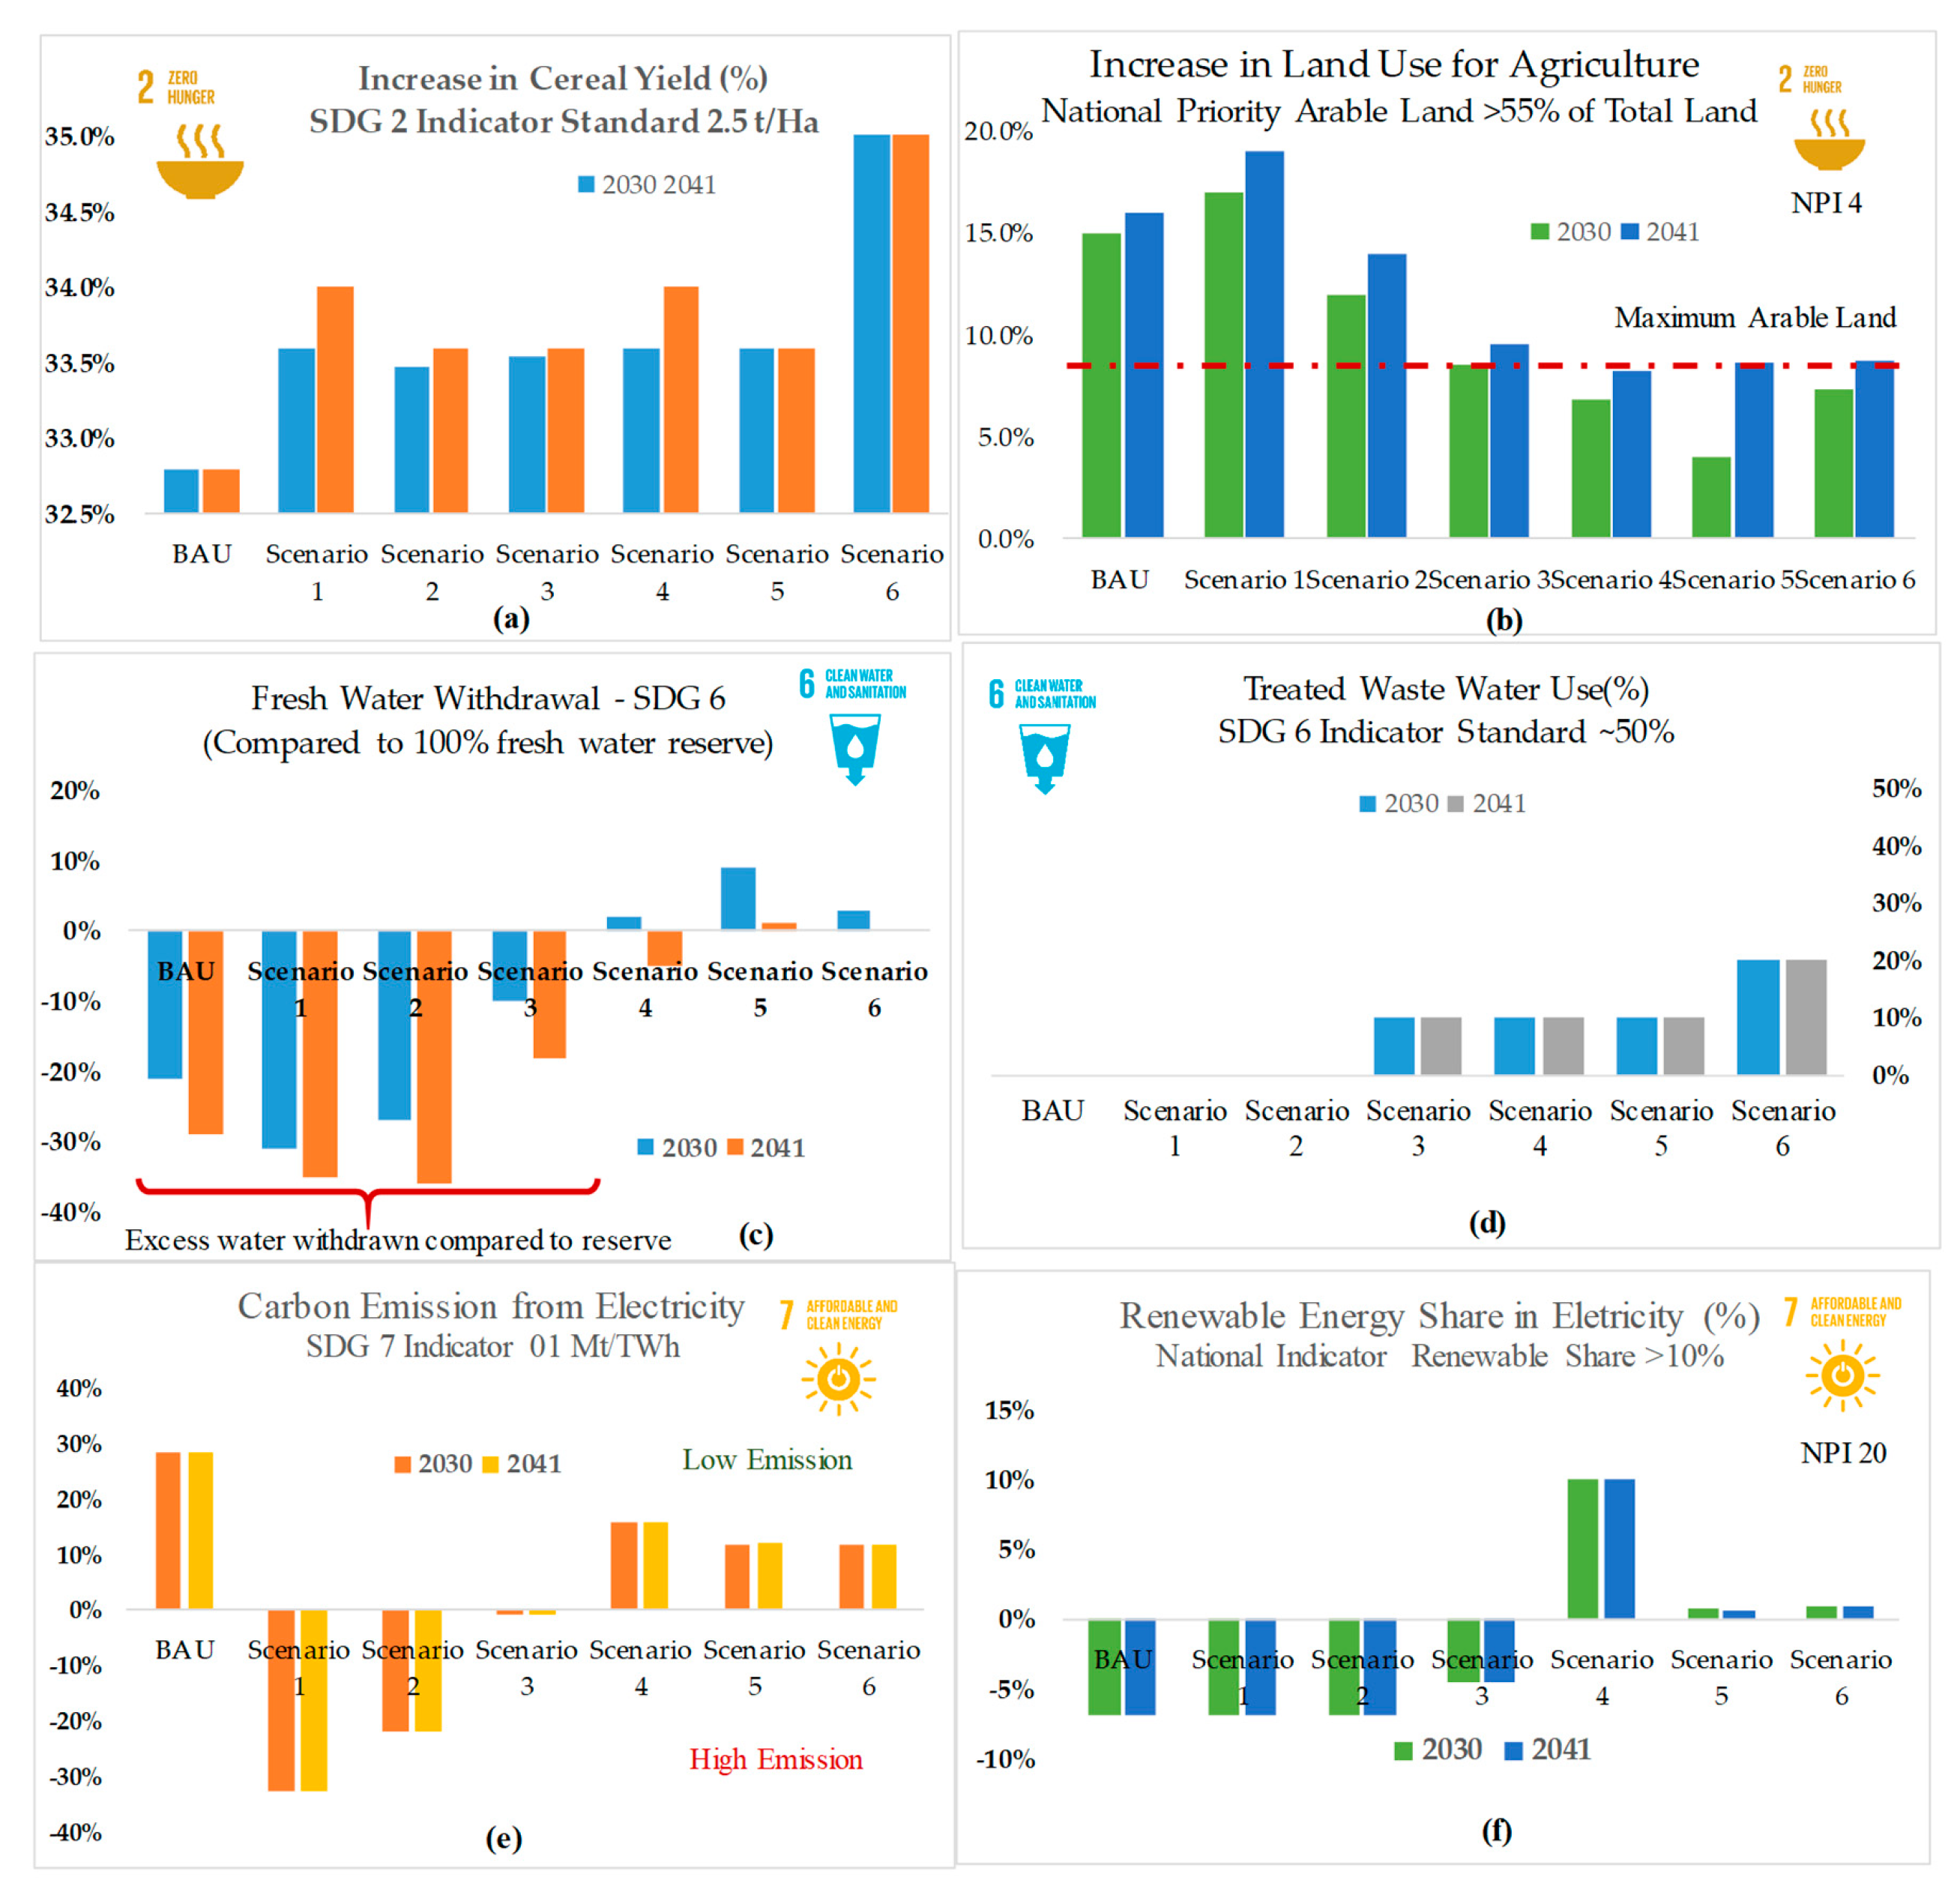
Figure 6 demonstrates the estimated impact of SDG and national priority indicators. Figure 6a,b capture the comparative representations of the indicator related to SDG 2 and national priority 4. For all scenarios, major cereal production is dominated by rice, while the share of maize in total cereal production is only 12%. Thus, the cereal yield for all scenarios is close to the rice yield in Bangladesh (3.1 t/Ha) compared to highly productive maize (8.25 t/Ha) [32]. Since the SDG standard for cereal yield is 2.5 t/Ha [], Bangladesh has already achieved the global cereal production standard (Figure 6a) where increasing the share of high yield crops can help to produce more food. Yet, the volume of production projected for 2030 and 2041 requires more land due to increasing demand. All the assessed scenarios require more land than the nationally projected minimum reserved for agricultural production (55%) [14]. It also provides an indication that, if Bangladesh wants to achieve greater food self-sufficiency, it must emphasize the production of high yield crops and consider exploring shifts in diet patterns.
Freshwater withdrawal exceeds the national, internal, renewable recharge (105 BCM). Even for the base year 2016, the calculated water withdrawal for agriculture and energy processing was found to be 16% higher than the national reserve limit. Since the actual volume of groundwater reserve is still unknown, with increasing water demand, higher dependency on groundwater has already resulted in lowering groundwater levels throughout the country. To ease the pressure on groundwater, scenarios 3–6 project increasing shares of the surface and treated wastewater to support the projected percent of SS in food and electricity production. It is important to mention that water demand for industry and domestic usage are found to be very low compared to agricultural usage [41]. A significant reduction in water pressure is found for a decreased percent of SS in food production coupled with 5–10% treated wastewater as a water source. Although the global SDG indicator for freshwater withdrawal is 25% of the total reserve, assessments focused on whether the water demand for scenarios are increasing or decreasing (Figure 6c). For all scenarios, the share of treated wastewater use is found to be under the SDG 6 indicator standard (25–50%) (Figure 6d).
Figure 6e,f shows the energy portfolio performances in terms of SDG 7, carbon footprint, and renewable energy share, respectively. The SDG threshold for emission from electricity generation is 1 Mt CO2/TWh [44]. For the projected energy mix in all scenarios, the base scenario, containing base year energy mix (55% natural gas), is assessed to be more environmentally-friendly and 30% lower in emission than the present average. As scenarios become less dependent on coal for electricity generation, the carbon footprint for electricity generation becomes lower, as dependency on coal is shifted to either a cleaner energy source (gas or nuclear, scenarios 2–3) or renewables (scenarios 3–6). The national priority for renewable energy mix (10%) is only attainable under scenarios 4–6, which also project low carbon footprints. Under the presented circumstances, scenarios 1–3, including the base scenario, are unattainable and show poor performance with respect to national priority and SDG indicators. However, scenarios 4–6 are found to be sustainable in the long term with overall food self-sufficiency around 76% and better SDG and national priority indicators.
The main question lies in what can be done to retain higher food self-sufficiency, even with limited resources. With the help of the nexus lens, the key interactions were revisited to identify critical and potential interactions. As mentioned, land and water resource limitations are the major constraints. Introducing high yield crop varieties or increasing the share of high yield crops in cultivation can be a solution for addressing resource constraint issues. From the tool assessment, it is seen that, if the overall cereal yield is increased from 3.34 to 5.2 t/Ha, demand for land and water will be drastically reduced, making even 100% self-sufficiency in major crop production feasible under resource constraints. Replacing 10% share of coal used in electricity generation with renewable energy can reduce the carbon footprint by 20%, according to the assessment estimates. Introducing a solar irrigation pump for agriculture can reduce emission and energy demand at least by 10% for crop production.
Using the Socio-Techno-Economic-Political (STEP) filter framework, the assessments found for scenarios are further screened to realize which of the scenarios are supported by resource constraints followed by the measuring performance with respect of SDG indicators and national priorities. Stakholder association with each of the scenarios are discussed. From the assessments for scenario 1–3, including business as usual (BAU) scenario, it is seen that arable land and fresh water demand for such scenarios will be higher than arable land and fresh water reserve, which excludes the viability of such scenarios under resource constraints.
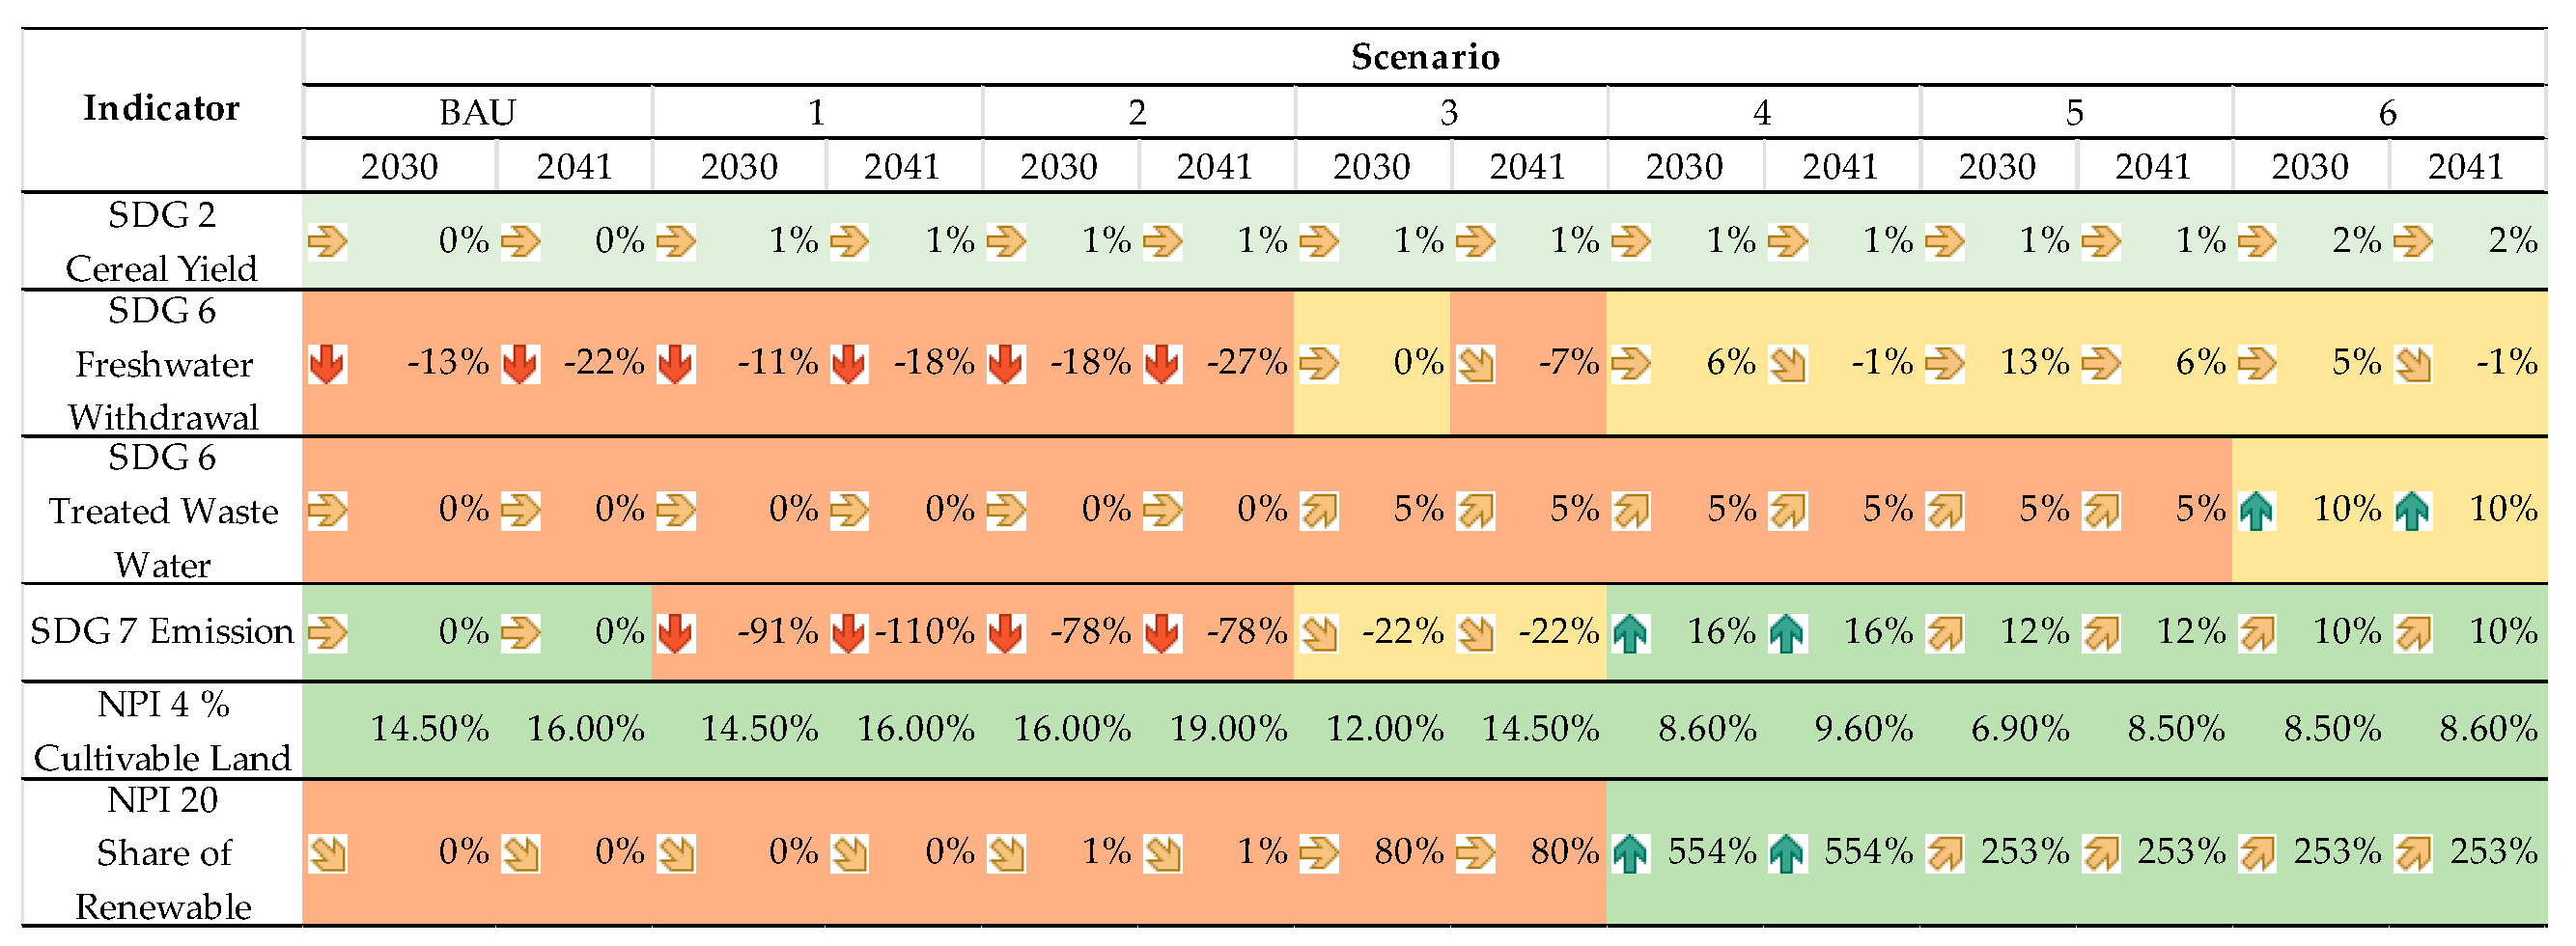
Figure 7 shows how each of the scenarios perform in terms of SDG and national priority indicators. According to SDG report 2020 [], all the scenarios are presented with respect to the upper and lower thresholds of 4 SDG indicators (cereal yield, fresh water withdrawal, treated waste water usage by percent, and emission per TWh of electricity production) indicators []. According to the standard values mentioned by Sachs et al., the green color indicates the SDG indicator is above the green threshold standard, yellow indicates the indicator is between the green and red threshold value of SDG, and red indicates that the below indicators went below the SDG standard. For NPIs, the green color indicates that, for all of the scenarios, the indicator is equal to or above the national target. Otherwise, it is colored red. From the table, it is conspicuous that scenarios 4, 5, and 6 show better performance in SDG and NPI indicators in the long-term. It is useful to mention that the cereal yield shown in different scenarios does not change much compared to BAU for two reasons. First, rice is the staple for the people of Bangladesh, thus, replacing the share of rice with high yield cereals (maize) that are not favorable considering seasonal cropping (rice can be cultivated throughout the year compared to maize, which is a winter crop) [33]. Second, it cannot be confidently asserted that Bangladesh can effectively plan on replacing high yield cereals (maize) with traditional cereals (rice) due to a general preference of diet (rice, as a staple, compared to maize, which is mostly used for animal feed). Although the national priority indicator set for cultivable land is to remain above 55% of the total land for all the scenarios, the land demand for crop production is assessed to be conspicuously higher. The SDG indicators for upper and lower thresholds for treated waste water are 50% and 15%, respectively [44]. Only scenario 6 considers 10%-treated wastewater for agriculture, which is below the SDG threshold value. Fresh water withdrawal is compared with an internal, renewable, water reserve for all the scenarios. Based on the assessments, the agricultural demand for water is nearly equal to the national water reserve. If the assessment had included all other associated calculations for the water cycle, the value would have been much lower. However, when the water demands for all the listed scenarios are compared, more production-intensive and coal energy-centric scenarios (scenario 1–3) demand more water. The demand for water can only be reduced if the share of water from treated wastewater facilities is increased. Thus, the SDG indicator for freshwater withdrawal can be improved by ensuring a greater share of treated wastewater and these two indicators show synergies for all the scenarios. The SDG indicator for energy (SDG 7) and NPI 20 (increasing renewable energy share) are also synergistic, as one indicator improving directly improves the other.
By implementing scenarios 1–3, the only improvements in SDG and NPI indicators were found for SDG 2 (cereal yield) and preserving cultivable land. However, the scenarios are bounded by resource restriction and degrade all other indicators shown in Figure 7. By implementing scenarios 4–6, all stakeholders can achieve both SDG and NPI in their respective fields of operation. It is worth mentioning that predicting the long-term future is uncertain, but representing each of the stakeholders’ long-term vision under a common and shared SDG/NPI platform can provide useful information for future planning. However, BAU and scenarios 1–3 represent the long-term goals of the Ministry of Agriculture (increased self-sufficiency in crop production) and power division (coal-based electricity generation). These scenarios also represent the risk of overexploitation of land and fresh water compared to the national limit, as well as high emission. Scenarios 4–6 represent scenarios that consider preservation of land and water with lower pollution by compromising self-sufficiency on food and increasing the share of renewables for electricity production. Preservation and reuse of water resources are within the common goals of the Ministry of Water Resources and Local Government Division. Thus, feasible scenarios have the potential to serve goals of the major stakeholders of the country without compromising SDG indicators and national priorities over the long-term. The methodology followed and the tool developed for this study helped create a rapid assessment for the resource trends with relative performance in terms of SDG targets in water, energy, and food sectors. The highlights of this scenario-based case study include:
- Self-sufficiency in food production is strongly population dependent. With limited arable land and fresh water reserves, self-sufficiency is more likely to be compromised under high population growth.
- Land is the scarcest resource. Food production requires more land since food demand is strongly driven by population growth and limited by physical constraints.
- Water is the most critical resource, if dependence on single ground water sources for irrigation, food production, and energy generation continues. Agriculture is still the dominant sector for water usage. Unless alternative resources are considered, over exploitation of ground water may critically affect the reserve and future food production capacity.
- Energy produced using fossil fuel impacts water and land resources less than food production. However, such fuel contributes to higher emission if the projected electricity generation becomes coal-dependent. Renewable energy integrations at a higher share strongly reduces the emission at the cost of land, which is found to be in short supply for food production.
- Possible solutions for land scarcity can be the introduction of high yield cereals, but it is connected to the diet habit as well as agricultural practices of the locals and climate. Bangladesh has yet to work on closing the yield gap for cereal production. If the cereal yield can be raised in the future, the land demand will be significantly low than the presented scenarios.
7. Assumptions and Limitations
The aim of the analysis developed in this study is to provide simplified trade-offs across a complex set of national plans. While developing the various scenarios, a set of assumptions were made that impose some inherent limitations.
- The key interactions are mainly water, energy, and food focused. Other resources consuming sectors, industries, household, fisheries, and livestock are not considered.
- The food portfolio does not include livestock, although the net domestic food demand includes animal feed. The cropping pattern and intensity of different crops are projected to be the same as the base year. These can definitely vary from year to year.
- The data to capture local characteristics in key resource interactions are difficult to find. The national averages do not represent the spatial and temporal diversity in the resource interactions.
- Water, land requirement, and the carbon footprint for different sources of energy for electricity production are taken from published global average data.
- Assessments did not include any financial projection for each of the scenarios: the price of crops imported, electricity imported, and development of surface water resources for irrigation are impractical to predict for a long-term future.
8. Conclusions
In this study, a Water-Energy-Food system assessment tool was developed to investigate the trade-offs associated with choices of different water, energy, and food strategies on Bangladesh’s national scale. The developed framework and tool allow the assessment of scenarios that reflect national plans to quantify their resource requirements and to highlight those that exceed available resources. The analysis indicated that the scarcity of critical resources, i.e., land and water, can jeopardize the success of future plans. Food production was found to be the most resource-consuming sector. Demand is domestic and population-driven. It is conspicuous that Bangladesh must plan most strategically for land use to sustain food self-sufficiency. Assessments for food scenarios that reflect the national plan indicate that achieving higher food self-sufficiency will require land and water beyond national resource limits and highlights strong food-water and food-land dependencies. Under such conditions, Bangladesh must consider achieving greater food security through a balance of improved self-sufficiencies and import. Long-term planning should focus on developing robust agricultural strategies (closing yield gaps for staples, introducing high yield varieties, and importing food that demands more land and water under local conditions) to cover the domestic food demand. However, ensuring accessibility to alternative water resources (treated wastewater, desalination, and surface water) for food production can reduce the pressure on groundwater reserves. Such approaches would require extensive financial, infrastructural, and technological investments when compared to conventional water use practices. Land and water demand for energy production are found to be significantly less compared to food production. Despite the country’s projection for coal-dependent energy generation, the impact of such a decision contributes more to carbon emission relative to water or land usage. Moreover, Bangladesh may face resource restrictions for introducing renewable energy at a large scale due to high land and water demand for such energy generation. The developed scenarios representing the Ministry of agriculture and Power Division plan showed a risk of overexploitation of land and freshwater resources that exceed nationally available limits. Other scenarios, which explored lower food self-sufficiency, while introducing further renewable energy and alternative water sources, are consistent with the goals of the Ministry of Water Resources and Local Government Division. The framework and tool in this paper offer a benchmark study building on which further studies could be developed in Bangladesh. Availing a platform that allows for evaluating these scenarios and the trade-offs that come with each could play a powerful role in creating an evidence-based dialogue between these key stakeholders, as the country continues to work toward achieving its national plans and the sustainable development goals.
Author Contributions
Conceptualization, B.D.; methodology, B.D. and M.N.K.; software, M.N.K.; validation, M.N.K.; formal analysis, M.N.K. and B.D.; data curation, M.N.K.; writing—original draft preparation, M.N.K. and B.D.; writing—review and editing, B.D.; visualization, M.N.K.; supervision, B.D.; project administration, B.D. All authors have read and agreed to the published version of the manuscript.
Funding
The authors gratefully acknowledge the Texas AM Energy Institute’s partial financial support of this work. This research was supported in part by the U.S. National Science Foundation INFEWS Award No. 1739977.
Institutional Review Board Statement
NA.
Informed Consent Statement
NA.
Data Availability Statement
NA.
Conflicts of Interest
The authors declare no conflict of interest.
References
- Bazilian, M.; Rogner, H.; Howells, M.; Hermann, S.; Arent, D.; Gielen, D.; Komor, P.; Steduto, P.; Mueller, A.; Tol, R.; et al. Considering the energy, water and food nexus: Towards an integrated modelling approach. Energy Policy 2011, 39, 7896–7906. [Google Scholar] [CrossRef]
- Bennett, C.J. What Is Policy Convergence and What Causes It? Br. J. Political Sci. 2018, 21, 215–233. [Google Scholar]
- Dai, J.; Wu, S.; Han, G.; Weinberg, J.; Xie, X.; Wu, X.; Yang, Q. Water-energynexus:Areviewofmethodsandtoolsformacro-assessment. Appl. Energy 2018, 210, 393–408. [Google Scholar] [CrossRef]
- Kurian, M. The water-energy-food nexus: Trade-offs, thresholds and transdisciplinary approaches to sustainable development. Environ. Sci. Policy 2017, 68, 97–106. [Google Scholar] [CrossRef]
- Mohtar, R.H.; Daher, B. Water-Energy-Food Nexus Framework for facilitating multi-stakeholder dialogue. Water Int. 2016, 41, 1–7. [Google Scholar] [CrossRef]
- Sarkodie, S.A.; Owusu, P.A. Bibliometric analysis of water–energy–food nexus: Sustainability assessment of renewable energy. Curr. Opin. Environ. Sci. Health 2020, 13, 29–34. [Google Scholar] [CrossRef]
- Simpson, G.B.; Jewitt, G.P.W. The Development of the Water-Energy-Food Nexus as a Framework for Achieving Resource Security: A Review. Front. Environ. Sci. 2019, 7, 8. [Google Scholar] [CrossRef] [Green Version]
- FAO. Walking the Nexus Talk: Assessing the Water-Energy-Food Nexus in the Context of the Sustainable Energy for All Initiative. 2014. Available online: http://www.fao.org/3/a-i3959e.pdf (accessed on 3 February 2021).
- Le Blanc, D. Towards Integration at Last? The Sustainable Development Goals as a Network of Targets. Sustain. Dev. 2015, 23, 176–187. [Google Scholar] [CrossRef]
- Hoff, H. Understanding the Nexus. Background Paper for the Bonn 2011 Conference: The Water, Energy and Food Security Nexus; Stockholm Environment Institute: Stockholm, Sweden, 2011. [Google Scholar]
- Howells, M.; Rogner, H. Water-energy nexus: Assessing integrated systems. Nat. Clim. Chang. 2014, 4, 246–247. [Google Scholar] [CrossRef]
- Nilsson, M.; Griggs, D.; Visbeck, M. Map the interactions between Sustainable Development Goals. Nature 2016, 534, 320–322. [Google Scholar] [CrossRef]
- United Nations. Sustainable Development Goals. 2015. Available online: https://sustainabledevelopment.un.org/?menu=1300 (accessed on 30 November 2020).
- SDG Cell. 39+1 Indicators, SDG Tracker-Bangladesh Development Mirror. Available online: https://sdg.gov.bd/page/thirty_nine_plus_one_indicator/5#1 (accessed on 30 November 2020).
- Zhang, C.; Chen, X.; Li, Y.; Ding, W.; Fu, G. Water-Energy-Food Nexus: Concepts, questions and methodologies. J. Clean. Prod. 2018, 195, 625–639. [Google Scholar] [CrossRef]
- Albrecht, T.R.; Crootof, A.; Scott, C.A. The Water-Energy-Food Nexus: A systematic review of methods for nexus assessment. Environ. Res. Lett. 2018, 13. [Google Scholar] [CrossRef]
- Daher, B.; Mohtar, R.H. Water–energy–food (WEF) Nexus Tool 2.0: Guiding integrative resource planning and decision-making. Water Int. 2015, 40, 1–24. [Google Scholar] [CrossRef]
- Gain, K.A.; Giupponi, C.; Benson, D. The water–energy–food (WEF) security nexus: The policy perspective of Bangladesh. Water Int. 2015, 40, 895–910. [Google Scholar] [CrossRef] [Green Version]
- Benson, D.; Gain, A.K.; Rouillard, J.J. Water governance in a comparative perspective: From IWRM to a ‘Nexus’ approach? Water Altern. 2015, 8, 756–773. [Google Scholar]
- Cairns, R.; Krzywoszynska, A. Anatomy of a buzzword: The emergence of ‘the water-energy-food nexus’ in UK natural resource debates. Environ. Sci. Policy 2016, 64, 164–170. [Google Scholar] [CrossRef]
- Food and Agriculture Organization. The Water-energy-food Nexus: A New Approach in Support of Food Security and Sustainable Agriculture. 2014. Available online: http://www.fao.org/3/a-bl496e.pdf (accessed on 3 February 2021).
- World Economic Forum. Water Security: The Water-Food-Energy-Climate Nexus: The World Economic Forum Water Initiative. 2011. Available online: http://www3.weforum.org/docs/WEF_WI_WaterSecurity_WaterFoodEnergyClimateNexus_2011.pdf (accessed on 3 February 2021).
- Sa’d Shannak, S.; Mabrey, D.; Vittorio, M. Moving from theory to practice in the water–energy–food nexus: An evaluation of existing models and frameworks. Water-Energy Nexus 2018, 1, 17–25. [Google Scholar] [CrossRef]
- Dargin, J.; Daher, B.; Mohtar, R.H. Complexity versus simplicity in water energy food nexus (WEF) assessment tools. Sci. Total Environ. 2019, 650, 1566–1575. [Google Scholar] [CrossRef]
- Food and Agriculture Organization. An Innovative Framework for the Food-Energy-Water Nexus. 2013. Available online: http://www.fao.org/3/i3468e/i3468e.pdf (accessed on 30 November 2020).
- Biswas, P.P. Development of Water-Energy-Food Conceptual Framework for Bangladesh. Mater’s Thesis, Bangladesh University of Engineering and Technology, Dhaka, Bangladesh, 2018. Dissertation/Thesis-Institute of Water and Flood Management; Web. 01 January 2021. [Google Scholar]
- Daher, B.; Mohtar, R.H.; Lee, S.; Assi, A. Modeling the Water-Energy-Food Nexus: A 7-Question Guideline. In Water-Energy-Food Nexus: Principles and Practices; Geophysical Monograph Series; Wiley Online Library: Hoboken, NJ, USA, 2017; Volume 6, pp. 55–66. [Google Scholar] [CrossRef]
- Daher, B.; Mohtar, R.H.; Pistikopoulos, E.; Portney, K.E.; Kaiser, R.; Saad, W. Developing Socio-Techno-Economic-Political (STEP) Solutions for Addressing Resource Nexus Hotspots. Sustainability 2018, 10, 512. [Google Scholar] [CrossRef] [Green Version]
- Billah, A.; Khan, A. Gas Extraction and Its Implication for Economic Sustainability of Bangladesh. Bangladesh Dev. Stud. 2001, 27, 1–34. [Google Scholar]
- Zahid, A. Groundwater Management Aspects in Bangladesh. Technical Report May 2015. Available online: https://www.researchgate.net/publication/320556522 (accessed on 3 February 2021).
- Ministry of Power, Energy and Mineral Resources, Government of Bangladesh (n.d.). Power System Master Plan 2016. Available online: https://powerdivision.portal.gov.bd/sites/default/files/files/powerdivision.portal.gov.bd/page/4f81bf4d_1180_4c53_b27c_8fa0eb11e2c1/(E)_FR_PSMP2016_Summary_revised.pdf (accessed on 3 February 2021).
- Agriculture Information Service. Krishi Diary 2018 of Bangladesh. Available online: https://www.ais.gov.bd (accessed on 3 February 2021).
- Nasim, M.; Shahidullah, S.M.; Saha, A.; Muttaleb, M.A.; Aditya, T.L.; Ali, M.A.; Kabir, M.S. Distribution of Crops and Cropping Patterns in Bangladesh. Bangladesh Rice J. 2017, 21, 1–55. [Google Scholar] [CrossRef] [Green Version]
- Alam, M.J.; Begum, I.A.; Buysse, J.; Van Huylenbroeck, G. Energy consumption, carbon emissions and economic growth nexus in Bangladesh: Cointegration and dynamic causality analysis. Energy Policy 2012, 45, 217–225. [Google Scholar] [CrossRef]
- Sarker, A.R.; Alam, K. Nexus between Electricity Generation and Economic Growth in Bangladesh. Asian Soc. Sci. 2010, 6, 16–22. [Google Scholar] [CrossRef] [Green Version]
- Ministry of Agriculture of Bangladesh. Agriculture Sector Action Plan for Achieving Sustainable Development (SDGs Action Plan). Available online: https://moa.portal.gov.bd/sites/default/files/files/moa.portal.gov.bd/page/a42e6e69_6044_469d_a53b_4a62498e2b68/Attachment%202.pdf (accessed on 3 February 2021).
- Amarasinghe, U.A.; Sharma, B.R.; Muthuwatta, L.; Khan, Z.H. Water for food in Bangladesh: Outlook to 2030. Int. Water Manag. Inst. 2014, 158, 24–46. [Google Scholar]
- Pishgar_Komleh, S.; Omid, M.; Keyhani, A. Study on Energy Use Pattern and Efficiency of Corn Silage in Iran by using Data Envelopment Analysis (DEA) Technique. Int. J. Environ. Sci. 2011, 1, 1094–1106. [Google Scholar]
- Larsen, M.A.D.; Drews, M. Water Use in Electricity Generation for Water-Energy Nexus Analyses: The European case. Sci. Total Environ. 2019, 651, 2044–2058. [Google Scholar] [CrossRef]
- World Strata Report. The Footprint of Energy: Land Use of U.S. Electricity Production 2017. Available online: https://www.strata.org/pdf/2017/footprints-full.pdf (accessed on 3 February 2021).
- Nuclear Association. Comparison of Lifecycle Greenhouse Gas Emissions of Various Electricity Generation Sources. Available online: https://www.world-nuclear.org/uploadedFiles/org/WNA/Publications/Working_Group_Reports/comparison_of_lifecycle.pdF (accessed on 3 February 2021).
- Sachs, J.; Schmidt-Traub, G.; Kroll, C.; Lafortune, G.; Fuller, G.; Woelm, F. The Sustainable Development Goals and COVID-19; Sustainable Development Report 2020; Cambridge University Press: Cambridge, UK.
- AQUASTAT. Bangladesh-Food and Agriculture Organization. Available online: https://www.fao.org/nr/water/aquastat/countries_regions/BGD/BGD-CPeng.pdf (accessed on 3 February 2021).
- International Energy Agency. Country Profile Bangladesh. Available online: https://www.iea.org/countries/Bangladesh (accessed on 3 February 2021).
- Roser, M. Future Population Growth. Available online: https://ourworldindata.org/future-population-growth (accessed on 3 February 2021).
- General Economics Division, Planning Commission of Bangladesh. Data Gap Analysis for Sustainable Development Goals (SDGs) Bangladesh Perspective. January 2017. Available online: https://www.sdg.gov.bd/public/img/upload/resources/5d39808e52dbc_doc_file.pdf (accessed on 3 February 2021).
Figure 1.
Resource balance and future resource demand of Bangladesh.

Figure 2.
Identified resource interactions of the system for the developed analytical tool.

Figure 3.
Conceptual framework for water, energy, and food assessment.

Figure 4.
Assessment of resource requirements projected for year 2030 and 2041 under BAU scenario. The percentage change in SDG and NPI indicators for the BAU scenario, compared to base year 2016.
Figure 4.
Assessment of resource requirements projected for year 2030 and 2041 under BAU scenario. The percentage change in SDG and NPI indicators for the BAU scenario, compared to base year 2016.

Figure 5.
Comparative evaluation of scenarios. (a) Land demand, (b) fresh water demand, and (c) food import. (d) Emission from crop production, (e) renewable energy share in electricity production, and (f) carbon emission for listed scenarios.
Figure 5.
Comparative evaluation of scenarios. (a) Land demand, (b) fresh water demand, and (c) food import. (d) Emission from crop production, (e) renewable energy share in electricity production, and (f) carbon emission for listed scenarios.

Figure 6.
Comparative impact on indicators, both SDG and national priority indicators (NPI) attributed to each of the assessed scenarios. (a) Variation in yield, (b) land required for food production, (c) fresh water withdrawal as the percent of national renewable water reserve, (d) treated waste water as a percentage of the total water usage, (e) carbon emission from electricity generation, and (f) renewable energy share in electricity.

Figure 7.
Second Filter-SDG Performance by an assessed value of the indicators.


Table 1.
Inputs and assessments for base year 2016 in comparison with published data sources.
| Input for Base Year 2016 | Output | ||||||
|---|---|---|---|---|---|---|---|
| Ten Major Crops | Electricity as a % Share | Assessed | Published | ||||
| Crop | Demand (MMT) 1 | %SS (Estimated) | Source | Share 7 | Net Land (M ha) | 8.03 | 7.94 2 |
| Rice | 36,000 | 96% | Coal | 1.60% | Water (BCM) | 109.5 | 67.75 3 |
| Wheat | 6000 | 23% | Oil | 32.00% | Food Import (%) | 15% | - |
| Potato | 9476 | 100% | Gas | 58.60% | Energy in Ag. (TWh) | 49.2 | 52 4 |
| Jute | 835 | 100% | Biomass | 0.00% | Energy in TWW (TWh) | - | - |
| Maize | 4900 | 85% | Import | 4.74% | % Renewable | 3.06 | 3.06 5 |
| Pulses | 1029 | 100% | Nuclear | 0.00% | Carbon Footprint | ||
| Oil Seeds | 1765 | 100% | Hydro | 0.80% | Ag.(MT CO2) | 7.67 | - |
| Spices | 2675 | 100% | Solar | 2.06% | Elect.(MT CO2) | 36.9 | 36.9 6 |
| Sugarcane | 6487 | 60% | Wind | 0.20% | |||
| Vegetables | 1634 | 100% | Water Resources as a % Share | ||||
| Surface | 21% | ||||||
| Ground | 79% | ||||||
Table 2.
Description of assessed scenarios.
| Input Portfolio | Scenarios | ||||||
|---|---|---|---|---|---|---|---|
| BAU | 1 | 2 | 3 | 4 | 5 | 6 | |
| Percentage of food self sufficiency (%SS) | 85% SS in major crops | 100% Self-sufficiency for 10 major crops | 100% SS in Cereal (Rice and Maize) | 85% SS in Rice 50% Jute | 80% Rice Maize, Pulses | 70% SS in Cereal 50% Jute, 100% SS in others | 80% SS in Cereal 50% in Jute |
| Percentage of share in energy mix | Coal 1.6% Gas 58.6% Oil 32% Import 4.74% Renewable Share 3.06% | Coal 55% Gas 15% Oil 4.5% Import 12.5% Nuclear 10% Renewable 3% | Coal 45% Gas 25% Oil 4.5% Import 12.5% Nuclear 10% Renewable 3% | Coal 35% Gas 35% Import 10% Oil 5% Nuclear 10% Renewable 5% | Coal 25% Gas 25% Solar 10% Hydro 5% Wind 5% | Coal 25% Gas 25% Import 15% Nuclear 15% Renewable 10% | Coal 25% Gas 25% Import 15% Nuclear 10% Solar 10% |
| Water sources | GW 79% SW 21% | GW 79% SW 21% | GW 70% SW 30% | GW 65% SW 30% TWW 5% | GW55% SW 40% TWW 5% | GW 50% SW 45% TWW 5% | GW 45% SW 45% TWW 10% |
| Population growth 2030 | 0.8% | 0.8% | 0.8% | 0.8% | 0.8% | 0.8% | 0.6% |
| Population growth 2041 | 0.6% | 0.6% | 0.6% | 0.6% | 0.6% | 0.6% | 0.5% |
GW = Groundwater. SW = Surface Water.
Publisher’s Note: MDPI stays neutral with regard to jurisdictional claims in published maps and institutional affiliations. |
© 2021 by the authors. Licensee MDPI, Basel, Switzerland. This article is an open access article distributed under the terms and conditions of the Creative Commons Attribution (CC BY) license (http://creativecommons.org/licenses/by/4.0/).
Share and Cite
MDPI and ACS Style
Nahidul Karim, M.; Daher, B. Evaluating the Potential of a Water-Energy-Food Nexus Approach toward the Sustainable Development of Bangladesh. Water 2021, 13, 366. https://doi.org/10.3390/w13030366
AMA Style
Nahidul Karim M, Daher B. Evaluating the Potential of a Water-Energy-Food Nexus Approach toward the Sustainable Development of Bangladesh. Water. 2021; 13(3):366. https://doi.org/10.3390/w13030366
Chicago/Turabian StyleNahidul Karim, Mohammad, and Bassel Daher. 2021. "Evaluating the Potential of a Water-Energy-Food Nexus Approach toward the Sustainable Development of Bangladesh" Water 13, no. 3: 366. https://doi.org/10.3390/w13030366
Note that from the first issue of 2016, this journal uses article numbers instead of page numbers. See further details here.