
Management of the Phosphorus–Cladophora Dynamic at a Site on Lake Ontario Using a Multi-Module Bioavailable P Model


1
Department of Civil & Environmental Engineering and Great Lakes Research Center, Michigan Technological University, Houghton, MI 49931, USA
2
National Institute of Water & Atmospheric Research Ltd. (NIWA), Riccarton, 8011 Christchurch, New Zealand
*
Author to whom correspondence should be addressed.
Water 2021, 13(3), 375; https://doi.org/10.3390/w13030375
Submission received: 8 November 2020
/
Revised: 5 January 2021
/
Accepted: 13 January 2021
/
Published: 31 January 2021
(This article belongs to the Special Issue Water-Quality Modeling)
Abstract
:The filamentous green alga Cladophora grows to nuisance proportions in Lake Ontario. Stimulated by high phosphorus concentrations, nuisance growth results in the degradation of beaches and clogging of industrial water intakes with attendant loss of beneficial uses. We develop a multi-module bioavailable phosphorus model to examine the efficacy of phosphorus management strategies in mitigating nuisance algal growth. The model platform includes modules simulating hydrodynamics (FVCOM), phosphorus-phytoplankton dynamics (GEM) and Cladophora growth (GLCMv3). The model is applied along a 25 km stretch of the Lake Ontario nearshore, extending east from Toronto, ON and receiving effluent from three wastewater treatment plants. Simulation results identify the Duffin Creek wastewater treatment plant effluent as a driving force for nuisance conditions of Cladophora growth, as reflected in effluent bioavailable phosphorus concentrations and the dimensions of the plant’s phosphorus footprint. Simulation results demonstrate that phosphorus removal by chemically enhanced secondary treatment is insufficient to provide relief from nuisance conditions. Tertiary treatment (chemically enhanced secondary treatment with ballasted flocculation) is shown to eliminate phosphorus-saturated conditions associated with the Duffin Creek wastewater treatment plant effluent, providing local relief from nuisance conditions. Management guidance presented here has wider application at sites along the highly urbanized Canadian nearshore of Lake Ontario.
1. Introduction
Filamentous green algae of the genus Cladophora are found in freshwater and marine ecosystems worldwide, favoring environments with unidirectional flow (rivers) or periodic wave action (lakes and estuaries [1]). The alga grows attached to solid substrate to the depth of light penetration and is typically limited by nitrogen (N) in marine and estuarine systems [2,3] and by phosphorus (P) in freshwaters [4,5,6]. Cladophora glomerata (hereafter Cladophora), is native to the Laurentian Great Lakes and is the most commonly observed member of that system’s attached algal community [7]. An ephemeral macroalga, Cladophora grows rapidly through spring and early summer until canopy self- shading and, ultimately, unfavorable light and temperature conditions lead to senescence, detachment and transport of sloughed biomass [8,9]. Where P enrichment stimulates production, algal debris fouls beaches, clogs water intakes [7,10] and poses threats to wildlife (hosting avian botulism [11]) and public health (hosting bacterial pathogens [12]).
Cladophora is presumed to have been present in the postglacial waterbodies predating today’s Great Lakes [13], supported there by phosphorus levels unimpacted by human activity. The timeline for the Great Lakes phosphorus-Cladophora dynamic, well described by Higgins et al. [7], tracks an increase in population pressure and attendant phosphorus discharges over the first half of the 20th century, leading to widespread conditions of nuisance algal growth. The earliest conclusive evidence of nuisance conditions of beach fouling by Cladophora is that for 1933 in Lakes Erie and Ontario [14]; records of nuisance conditions at sites on Lakes Michigan and Huron followed in the 1960s and 1970s [7]. A binational call for action in controlling nuisance growth of Cladophora [15]), contributed support for implementation of phosphorus management programs on the Great Lakes in the late 1970s and early 1980s. These efforts achieved a marked reduction in both the phosphorus nutrition and areal biomass density of the alga [16]. This reprieve was, however, short lived, as clearing of the water column by invasive dreissenid mussels, beginning in the 1990s, extended the depth of colonization by Cladophora, increasing production by up to a factor of six and leading to a resurgence in beach fouling despite a continued reduction in P nutrition through phosphorus management [17].
Management of the phosphorus–Cladophora dynamic in the post resurgence 21st century must proceed with a clear understanding of changes manifested in the Lake Ontario ecosystem over the past 50 years. In the 1970s, concentrations of soluble reactive phosphorus (SRP, μgP⋅L−1), the P component directly assimilated by algae, averaged 13 μgP⋅L−1 in the open waters of Lake Ontario; a level indicative of a eutrophic state [18] and P-saturated Cladophora growth (as described in this manuscript). During this time, areal densities of Cladophora biomass (as dry mass, DM) averaged 206 gDM⋅m−2 at 7 sites extending across the north shore of Lake Ontario [16]; a level representative of nuisance growth. Such a system would be said to be ‘whole lake forced’ with respect to Cladophora growth, i.e., having phosphorus levels sufficient to support nuisance conditions lakewide with colonization dictated only by the depth of light penetration and the availability of substrate for attachment. The impacts of phosphorus management, manifested beginning in 1978, and mussel-driven benthification/oligotrophication, first noted in 1999, have reduced open lake SRP levels in Lake Ontario to an average of 1.8 ± 0.7 μgP⋅L−1 [18,19]; concentrations representing oligotrophy [18]. Thus, nuisance conditions of Cladophora growth in Lake Ontario are no longer ‘whole lake forced’, but rather are ‘locally driven’ by proximate point and nonpoint sources of phosphorus [6]. This transition was clearly recognized by the Agreement Review Committee (ARC, [19], a binational team of scientists and managers advising Canada and the United States on technical issues relating to revision of the Great Lakes Water Quality Agreement (GLWQA). While applauding accomplishments relating to trophic state improvements in offshore waters, ARC [20] noted a failure to address eutrophication in the Great Lakes nearshore. Subsequently, Higgins et al. [6] surveyed conditions at 7 sites in the Canadian (4) and U.S. (3) waters of Lake Ontario (including both highly urbanized locations and those where adjacent land use intensity was minimal) and recommended that effective management of Cladophora blooms be accomplished through control of phosphorus loading at local scales while ensuring that phosphorus levels do not increase lakewide.
The need to direct management attention to nearshore waters brings with it challenges, as this coastal environment serves simultaneously as a source of drinking water, a recreational resource, the repository for wastes (treated at varying levels of efficiency) and the point of entry for nutrients sustaining lakewide ecosystem function. Eutrophication of many inland waters is attributable to the widespread application of secondary (2°) treatment of wastes produced by a burgeoning and increasingly urbanized population [21]. Along the western and adjoining northern shore of Lake Ontario (Figure 1), lies an almost unbroken urban landscape extending from St. Catharines, ON near the Niagara River to Oshawa, ON near the eastern boundary of the Greater Toronto Area (GTA) [22] (2003, p. 627). Rising populations occupying the coastline turn almost exclusively to Lake Ontario for both water supply and wastewater disposal; even as current treatment technologies seem to be nearing their practical design limits [22] (p. 628). Community and regional wastewater treatment plant (WWTP) effluents are discharged to the Lake Ontario nearshore indirectly via tributaries and directly through outfalls placed at various distances from the shore.
Phosphorus loads delivered to the nearshore pass across and become transiently, but dynamically, resident in shallow nearshore waters before moving offshore where dilution and assimilation serve to reduce concentrations to open lake conditions [23]. At discharge, WWTP effluents carry ~200–400 μgSRP⋅L−1, more than two orders of magnitude higher than offshore levels (~1 μg SRP⋅L−1). When entrained by longshore currents, tributary and effluent plumes are episodically distributed along the coastline over their period of residency in the nearshore (see [23]). The continuous, but positionally dynamic, presence of a P-rich plume in nearshore waters can result in nuisance growth of Cladophora where the phosphorus footprint overlies colonizable substrate (cobbles and bedrock) at locations with light penetration to the bottom. Contemporary conditions of nuisance Cladophora growth in Lake Ontario have been reported at urban locations in both the U.S. (Rochester, NY) [24] and Canada (Greater Toronto Area, [6,25].
2. Objectives, Approach and Modeling Philosophy
The overarching objective of this paper is to describe the development and application of a mathematical model supporting the management of nuisance growth of Cladophora in Great Lakes waters. We seek to accomplish this objective through attention to three sub-objectives:
- Assembly of a multi-module water quality modeling platform that integrates the role of mass transport and phosphorus–phytoplankton dynamics in determining Cladophora nutrient status and thus in mediating nuisance growth of the alga;
- Communication, in a fashion suitably transparent for a broad spectrum of readers, the manner in which decisions are made in characterizing model source and sink terms, particularly with respect to incorporation of the concept of phosphorus bioavailability;
- Demonstration of model application in exploring the efficacy of point source phosphorus management in reducing or eliminating nuisance Cladophora growth at a locally forced site on the north shore of Lake Ontario.
Water quality models have become increasingly complex in an effort to more completely capture changes to the Great Lakes food web and the attendant biokinetic processes mediating constituent fate. This complexity comes at a price, however, when the mathematics outpaces the understanding of the system being modeled [26]. Modelers working with multi-module nutrient-phytoplankton-zooplankton-detritus (NPZD) platforms have recognized this and crafted hydrodynamic and biokinetic frameworks by adopting a level of complexity consistent with their study system and research objectives [27,28,29,30,31]. Here, we follow the guidance of Chapra et al. [32] in seeking a parsimonious framework which appropriately balances model complexity and the level of reliability required for management applications [33].
Formulation of our approach was informed by the increasing frequency with which multi-module mathematical models are being applied in water quality studies. The increased application of multi-module platforms to the Great Lakes reflects the need to pair hydrodynamic and water quality modules where significant spatial gradients exist, e.g., fecal bacteria contamination in the nearshore [34] and phytoplankton dynamics lakewide [35]. More recently, process- or organism-specific modules have been developed and paired with mass transport and biokinetic modules to facilitate simulation of complex, emerging issues (e.g., ecosystem engineering by invasive dreissenid mussels [29]). Our approach has also been informed by policies promulgated under the GLWQA of 2012: first to maintain levels of algal biomass (here, with respect to Cladophora) below those constituting a nuisance condition and second, to accommodate the concept of phosphorus bioavailability in management applications. While it has been recognized for decades that the availability of P for assimilation by algae differs significantly among the components of the total phosphorus (TP, μgP⋅L−1) analyte [36,37,38], we are not aware of any management models that have previously accommodated the phenomenon. Finally, our objective has been informed by an expressed local and regional interest in restoring beneficial uses in the Lake Ontario nearshore lost to fouling by nuisance growth of Cladophora.
3. Study Site and Problem Statement
This research focuses on a 25 km stretch of Lake Ontario shoreline extending east from the Highland Creek WWTP (located near the eastern boundary of Toronto, ON) to the Corbett Creek WWTP (located near the eastern boundary of Whitby, ON) and including the City of Pickering and the Towns of Ajax and Whitby (Figure 1). The study site receives discharges from three tributaries (the Rouge River and Duffins and Carruthers Creeks) and three wastewater treatment plants (Highland Creek, Duffin Creek and Corbett Creek). Monitoring of locations between the discharge of the Rouge River and the eastern boundary of the Town of Ajax [27,39,40] has revealed waters enriched with phosphorus to concentrations exceeding levels (as developed below) found to be saturating for Cladophora growth. Enrichment is particularly associated with the footprint of the Duffin Creek WWTP effluent plume [27,39]. The study area is well colonized by Cladophora, covering 30–100% of the bottom [39,41,42] to depths of 20–25 m [17,42] The nutritional status of Cladophora (stored P content) mirrors that of the SRP footprint, with P-enriched algae found to be associated with the Duffin Creek WWTP effluent plume [39,43]. Beach deposition by sloughed Cladophora is common in summer and fall at several locations within the study area (Figure 2), leading to loss of beneficial uses including recreation and revenue from operation of a nuclear power generating station [44].
In 2016, the Minister of the Environment, Conservation and Parks for the Province of Ontario (MECP) issued an order requiring that the Duffin Creek WWTP prepare a Phosphorus Reduction Action Plan (PRAP) to determine the lowest levels of effluent phosphorus achievable for both current (contemporary flow of 343,000 m3⋅d−1) and future (maximum permitted design flow of 630,000 m3⋅d−1) operating conditions. Development of the PRAP considered three levels of phosphorus removal: a contemporary Baseline case (chemically enhanced secondary treatment), an Optimized Secondary Treatment case (Baseline case with optimum chemical dosing locations and combinations of iron and polymer) and a Tertiary Treatment case (chemically enhanced secondary treatment with ballasted flocculation). The analysis presented here simulates nearshore SRP concentrations and nutritional status of Cladophora (P-limited or P-saturated growth) across the matrix of flows and treatment options specified in the Duffin Creek WWTP PRAP. Testing of model performance includes contemporary discharges from the Highland Creek and Corbett Creek WWTPs, located to the west and east of the Duffin Creek plant, respectively. Future scenarios (engineered options) are examined for the Duffin Creek WWTP as a standalone discharge and in concert with discharges for the Highland Creek and Corbett Creek WWTPs. The analysis seeks to determine, as well, the impact of increases in the volume of flow treated and the accompanying increase in bioavailable phosphorus (BAP) load from the Duffin Creek WWTP and the efficacy of treatment strategies at the facility in reducing effluent BAP concentrations (pursuant to the PRAP).
4. Modeling Platform
In this work, we have developed a modeling platform (Figure 3) consisting of three modules: a hydrodynamic module that accommodates the complex mass transport conditions characteristic of the Great Lakes nearshore, a biokinetic module that simulates SRP and phytoplankton biomass (chlorophyll, Chl) and a module providing a mechanistic treatment of Cladophora nutrient status. The hydrodynamic module simulates turbulent mixing and current velocity across a whole lake grid, with enhanced resolution in the nearshore study area. The biokinetic module accepts mass transport output from the hydrodynamic module and point source phosphorus loads from WWTPs and simulates SRP and chlorophyll (Chl) dynamics. The Cladophora module is applied in establishing the relationship between ambient SRP levels and the nutrient status of Cladophora in describing the alga’s response to various phosphorus management scenarios.
Generally, modelers have the choice of implementing modules in a coupled (online) fashion, embedded in a single platform, or in a linked (offline) manner, where output from one module feeds forward to another. Application of a linked framework is appropriate only where there is no feedback, e.g., phosphorus dynamics and Cladophora growth do not impact hydrodynamics and Cladophora growth has no impact on phosphorus dynamics (see material below with respect to the latter). We have chosen a linked approach as this offers advantages with respect to run time, thus encouraging a higher degree of interaction in model testing and application.
4.1. FVCOM: The Hydrodynamic Module
The Finite Volume Community Ocean Model (FVCOM) is used in this study to simulate hydrodynamic conditions (i.e., water temperature, the current field and diffusive mass transport) in Lake Ontario. FVCOM is widely applied in estuarine and coastal ocean environments [45,46,47,48] and in the Great Lakes [49,50,51,52]. FVCOM has been used in both standalone hydrodynamic modeling [23] and linked or coupled with a water quality model, e.g., [31]. FVCOM has also been adopted as the official operational forecasting model of the U.S. National Oceanic and Atmospheric Administration’s Great Lakes Environmental Research Laboratory (NOAA GLERL).
FVCOM, developed by Chen et al. [53,54], is a prognostic, three-dimensional, unstructured grid, finite volume, primitive-equation model that solves a system of equations quantifying momentum, continuity, temperature, salinity, and density. The calculation is closed physically and mathematically using the 2.5 level turbulence submodel [55] for vertical mixing and the formulation of Smagorinsky [56] for horizontal diffusion. The system of equations is solved numerically using the finite volume method in the integral form of the primitive equations over an unstructured triangular grid mesh and vertical sigma layers. FVCOM is configured to model physical dynamics for all of Lake Ontario, thus supporting simulation of large scale background circulation and offshore forcing of nearshore transport. A refined resolution is applied to the nearshore study area to enhance the model’s capability to track the more complex dynamics of point source discharges.
The modeling domain has been extended beyond the region of management interest (Pickering–Ajax–Whitby, 25 km of shoreline) to include the nearshore from a point ~10 km west of the Highland Creek WWTP to a point ~20 km east of the Corbett Creek WWTP, a total distance of ~60 km (Figure 1). Lakeward, the domain extends a distance of ~28 km with depths ranging from 0 to 130 m and averaging ~76 m. This domain size is required so that full expression of WWTP plumes is realized (see also [30]). Within this domain, Cladophora colonizes solid substrate for a lakeward distance of ~3.0 km (to a depth of ~20 m) resulting in an area with a mean depth of 12.25 m. The FVCOM model configuration includes 41,442 horizontal grid elements and 22,590 nodes, with a resolution varying from 2–4 km in the open lake to 50–150 m in the targeted nearshore area, and 20 evenly spaced vertical sigma coordinate layers with a resolution of <1 m in the nearshore and 5–10 m in the open lake. Concentrations of SRP and Chl are specified for the longshore and offshore boundaries of the study system to isolate the model grid from external inputs received from the east and west of the site and focus simulations on coastal waters where interactions between the three WWTP discharges and the open waters of the lake occur.
FVCOM calculates a suite of physical parameters (e.g., water temperature, turbulent mixing coefficients, current field, free surface elevation, and shortwave radiation) that are passed forward to the linked biokinetic module (Figure 3) for calculation of the time rate of change in constituent concentrations (here, soluble reactive phosphorus and chlorophyll),
![Water 13 00375 i001]() where C is the constituent concentration, t is time, (u,v,w) are the velocity vector components in coordinate directions (x,y,z) and Kh and Kv are, respectively, the horizontal and vertical turbulent diffusion coefficients. With no significant external inputs of chlorophyll, the source term in Equation (1) includes only point source phosphorus loads (Section 4.2.4, Equation (2)) and the sink term represents the loss of SRP to phytoplankton uptake (Section 4.2.4, Equations (2) and (3)).
where C is the constituent concentration, t is time, (u,v,w) are the velocity vector components in coordinate directions (x,y,z) and Kh and Kv are, respectively, the horizontal and vertical turbulent diffusion coefficients. With no significant external inputs of chlorophyll, the source term in Equation (1) includes only point source phosphorus loads (Section 4.2.4, Equation (2)) and the sink term represents the loss of SRP to phytoplankton uptake (Section 4.2.4, Equations (2) and (3)).

FVCOM requires input of regional atmospheric forcing conditions (including downward solar radiation, wind speed and direction, air temperature, atmospheric pressure, relative humidity and cloud cover), derived here from the National Centers for Environmental Prediction (NCEP) Climate Forecast System Version 2 (CFSv2) (https://rda.ucar.edu/datasets/ds094.1/). Performance of FVCOM was tested against measurements of water temperature and current velocity at the study site and found to perform satisfactorily (Figure 4; see also [23]).
In the present study, we simulated hydrodynamic conditions for 2014 and 2016 using the approach of Huang et al. [23]. FVCOM simulations were initialized on March 1st with a homogenous water temperature of 2 °C and run continuously to the end of October (~8 months). The first 30 days of the run (March) are considered a spin up period, allowing the model to gradually and systematically adjust to ambient flow and temperature conditions. Output from the remaining portion of the run (April–October) is used for statistical analysis and as hydrodynamic forcing conditions for the biokinetic model. Additional information regarding the application of FVCOM to the study site is detailed by Huang et al. [23].
4.2. GEM: the Biokinetic Module
The pioneering effort of Chen et al. [57] on Lake Michigan set the stage for the present generation of models co-simulating biological and physical dynamics on the Great Lakes. Work to follow focused on the biokinetic component of this framework. A generalized biological model was developed by Tian et al. [58] and extended as the Generalized Adaptive Biogeochemical Ocean Model, with a goal of providing a fully modular and flexible platform that could evolve and transition in parallel with changes occurring in aquatic ecosystems [59]. This tool was then restructured and added to the FVCOM platform as the Generalized Ecosystem Model (GEM; [60]), allowing users to select from a family of pre-built ecosystem (NPZDB) models having nutrients, phytoplankton, zooplankton, detritus and bacteria as state variables; although not all components are necessarily included in each application. Users can also develop their own model using a pool of functions and coefficients provided [60].
Among the first linked/coupled model applications was that of Leon et al. [27] to Lake Ontario using the Estuary and Lake COmputer Model (ELCOM) coupled with CAEDYM (Computational Aquatic Ecosystem DYnamics Model) and of Luo et al. [61] to Lake Michigan using FVCOM and the Flexible Biological Model (FBM). Subsequently, users have applied one and three dimensional frameworks, in linked and coupled fashion, to Great Lakes environments (e.g., Rowe [62], FVCOM/de novo biokinetics, Lake Michigan) and Luo et al. ([63], FVCOM/FBM, Lake Michigan). Next, efforts sought to accommodate changes to the Great Lake ecosystem accompanying invasion by dreissenids (zebra mussels, Dreissena polymorpha, and quagga mussels, Dreissena rostriformis bugensis). Rowe et al. [29] extended GEM to include a mussel component in examining spatial and temporal patterns of productivity in Lake Michigan as influenced by dreissenids. Shen et al. [64] applied a de novo 1D hydrodynamic model and a standard NPZD model (also extended to include a mussel component) in characterizing dreissenid mediation of the vertical distribution of SRP and particulate phosphorus (PP) and the ratios of those P components in the Lake Michigan offshore. Shen et al. [31] used GEM with an added mussel component to quantify the source/sink nature of a Lake Michigan nearshore colonized by mussels and to characterize spatial and temporal variability in nearshore-offshore transport of PP and SRP. Most recently, Bravo et al. [30] added both mussels and Cladophora to their biokinetic platform, facilitating simulation of the phosphorus–mussel–Cladophora dynamic.
4.2.1. Bioavailable Phosphorus
The concept of bioavailability recognizes that TP is comprised of components that differ in the degree to which they are available to support algal uptake. As SRP (orthophosphate) is the only form of phosphorus that autotrophs can directly assimilate [65], it is considered the only TP component that is fully and freely available to algae [66]. Particulate P requires solubilization to dissolved organic P (DOP, μgP⋅L−1) and DOP requires enzyme-mediated hydrolysis to SRP. This transformation is performed by bacteria, phytoplankton and zooplankton and is also a feature of the metabolism of higher organisms (e.g., dreissenid mussels). The bioavailable fraction (fbio, 0→1) of each TP component may be determined using algal bioassays [67] and it has been observed that, in general, fbio,SRP > fbio,DOP > fbio,PP, with fbio,SRP~1, i.e., (Auer et al., In Preparation).
The TP analyte has a long history of use as a trophic state indicator [68,69]. Dissolved phosphorus (DP, μgP⋅L−1), also referred to as total dissolved phosphorus (TDP, μgP⋅L−1) and being equal to the sum of SRP + DOP, is finding increasing use in NPZD models as the phosphorus pool meeting the demand for assimilation by phytoplankton [28,29,30,31]. Both TP and DP are imperfect metrics in this application, as neither accurately represents the form of the nutrient that is fully and freely available, i.e., each contains a refractory fraction that is not transformed to SRP. The biokinetic module utilized here evolves from the framework of Rowe et al. [29], adapted to accommodate our interest in bioavailable phosphorus. Adoption of a bioavailable P approach offers an opportunity to avoid the issues associated with labile/refractory P components and to significantly reduce the complexity of the parent biokinetic framework (compare Figure 5a,b).
In the traditional NPZD approach, P loads are input to models as the individual TP components (SRP/DOP/PP or DP/PP). Following discharge, those components may then be partitioned into various P pools (e.g., labile/refractory and phytoplankton/zooplankton/detritus), transformed by processes that describe P cycling through the food web and ultimately determine water column SRP concentrations. While this approach has value in food web applications, it brings into play a host of coefficients and process algorithms with various degrees of uncertainty [26], thus compromising the model’s reliability in support of management. In the BAP approach, there is a single P state variable, SRP, for which source-sink terms accommodated and quantified. External BAP inputs (expressed as SRP) include the measured SRP concentration plus the bioavailable fraction of DOP and PP; the assumption being that the bioavailable portion of the non-SRP fractions are converted to SRP over relatively short time scales (see [67]) relative to their retention time in the nearshore (see [23]).
4.2.2. Mussels as a Biokinetic Source Term
As the distribution of quagga mussels proceeded lakeward to include colonization of profundal habitat, several modeling studies investigated the impact of mussels in regulating phytoplankton and phosphorus dynamics in the offshore waters of the Great Lakes, e.g., the vertical distribution of phytoplankton [62,64], nearshore-offshore transport of phosphorus [31] and the impact of phosphorus loads on lakewide production [19]. Most recently, Li et al. [70] employed a mass balance approach in demonstrating the capacity of mussels to retard the response of whole lake phosphorus levels to changes in external load, here at a time scale of years to decades.
Considerable attention has also been directed to mussel P cycling in the Great Lakes nearshore, where it has been posited that mussel SRP excretion could sustain nuisance algal growth drawing only upon the PP reserves of offshore waters. The nearshore case differs significantly from that addressed in a whole lake context by Li et al. [70] as the water residence time is must shorter in coastal environments (days to weeks) and the proximity to point source and riverine discharges is much greater [29]. Early work in conceptualizing a dreissenid-driven nearshore phosphorus shunt [71] and publication of the first in situ measurements of mussel SRP excretion [72] helped motivate field studies interpreted to suggest that mussel cycling was the dominant P source fueling nuisance growth of the alga [73,74]. More recently, researchers have mechanistically incorporated mussel recycling in models simulating phosphorus dynamics in Lake Michigan [28,29,30,31,61].
The impact of mussel SRP excretion on water column levels of the nutrient has been shown to vary widely, likely due to differences in the physical environment (turbulence-driven mixing in the water column depth) and food availability (water column PP concentration) [75,76]. For example, in modeling the deep, oligotrophic offshore waters of Lake Michigan, Shen et al. [31] found that mussel presence elevated SRP levels < 0.2 μgP⋅L−1 above that with mussels absent. At the other extreme, we have calculated that mussel excretion would increase SRP concentrations >10 μgP⋅L−1 above baseline for the shallow, eutrophic waters of Oneida Lake, NY; this based on microcosm measurements made by Turner [77]. Additionally, excretion rates may vary with mussel size distribution and density as well as cessation of filtration in response to sediment resuspension events.
The variability and uncertainty inherent in mechanistically representing mussel SRP excretion as a source term in management modeling represents a particular challenge. The BAP approach offers an alternative by assuming that all of the bioavailable PP loaded to the system will be filtered by mussels and recycled with 100% efficiency. While this estimate is conservatively high, it is known that mussel feces/pseudofeces include a bioavailable fraction (Auer, unpublished) and that relatively little of the P assimilated by mussels is retained in mussel biomass [78]. Thus, we do not explicitly include mussel recycling in our framework, as it is implicitly present through the BAP loading concept.
4.2.3. Cladophora as a Biokinetic Sink Term
At our study site, Cladophora colonizes approximately 50% of the benthic habitat at depths <12 m [39] and accounts for 50% of the primary production at a similar location (depths <12 m) on Lake Ontario [73]. It is reasonable, therefore, to posit that the alga serves as a P sink through uptake (see [31]). For example, Fillingham [28] calculated that, in the Lake Michigan nearshore, P uptake by Cladophora occurred at a rate an order of magnitude greater than that of phytoplankton. Similarly, Bootsma and Liao [76] determined that the SRP flux attributable to Cladophora uptake was, on occasion, several times greater than that excreted by mussels. Thus, some modeling platforms have included SRP uptake by Cladophora as a sink term [28,30].
We examined this sink term by comparing the rate of P accrual (kgP⋅d−1) through Cladophora uptake and storage with the rate of P discharge (kgP⋅d−1) by the Duffin Creek WWTP and by all three study site plants combined. The calculation was performed for a 20 km stretch of shoreline centered on the Duffin Creek WWTP and extending 2 km offshore, the extent of colonization by Cladophora (≤20 m). This 40 km2 area is overlain by the phosphorus footprint of the Duffin Creek WWTP effluent [23] and has depths of light penetration sufficient to support growth of the alga. The areal rate of P accrual by Cladophora (2.01 × 10⁻⁴ gP⋅m−2⋅d−1 2.01 × 10⁻⁷ kgP⋅m−2⋅d−1) was calculated as the product of the net rate of biomass accrual (0.18 gDM⋅m−2⋅d−1) and the season average algal P content (0.11 P as %DM 1.1 × 10⁻³ gP⋅gDM−1, n = 34; [39]). The net rate of biomass accrual was calculated as the average summer standing crop (22 gDM⋅m−2, August 2012, n = 19; [39] divided by the accrual period (120 days, May-August). Multiplying the areal rate of P accrual by the prescribed area of the calculation (40 km2 4 × 10⁷ m2) yields a rate of P accrual of 4.4 kgP⋅d−1. This represents 3.3% of the bioavailable P load from the Duffin Creek WWTP (130 kgP⋅d−1) and 2.5% for the three WWTPs combined (244 kgP⋅d−1; see Section 4.2.6 below). Based on these calculations, we decided not to include P uptake by Cladophora as a sink term in our biokinetic module. We note that the significance of Cladophora uptake varies with the maximum standing crop. Thus, higher rates of biomass accrual such as the 3 to 4.1 gDM⋅m−2⋅d−1 applied for the Lake Michigan nearshore at Milwaukee, WI by Bravo et al. [30] may suggest a different conclusion. However, with respect to our objective of exploring the efficacy of management options, it would not be appropriate to include uptake by Cladophora as a P sink. That is, considering P uptake by Cladophora as an extension of the wastewater treatment process where control of the alga is the management goal.
4.2.4. Biokinetic Framework
Consistent with our decision to introduce P loads as their bioavailable fraction, and to maintain a parsimonious approach, we adopt the biokinetic framework of Rowe et al. [29] and adapt it to focus on two state variables: SRP and Chl, the former being the TP component fully and readily available for utilization by algae (Cladophora) and the latter, a proxy for phytoplankton biomass, which can potentially mediate the size of the point source phosphorus footprint through uptake. Phosphorus enters the system as a BAP (SRP) loading, is assimilated by phytoplankton in proportion to the algal growth rate and leaves the system directly through mass transport and indirectly through settling and horizontal mass transport of SRP and phytoplankton. We eliminate phosphorus pools and pathways associated with P (phytoplankton respiration, zooplankton grazing and mortality and transfer to the detritus pool and subsequent mineralization) consistent with our interest in maintaining a conservative (high) estimate of the role of phytoplankton in mediating the SRP footprint.
Thus, the kinetic framework of Rowe et al. [29] is reduced to two state variables with the mass balances given by,
where SRP is the soluble reactive phosphorus concentration (expressed here as mgP⋅m−3), t is time (d), WSRP is the SRP load (mgP⋅d−1), V is volume (m3), dChl/dt is the rate of phytoplankton biomass accrual (mgChl⋅m−3⋅d−1) and aP:Chl is the dimensionless phosphorus to chlorophyll ratio for phytoplankton. Note that SRP loads are nonzero only at those model cells receiving point source inputs and that SRP mass transport is treated as described in Equation (1). The chlorophyll (phytoplankton) mass balance is given by,
where Chl is the chlorophyll concentration (expressed here as mg⋅m−3), μmax (d−1) is the maximum specific growth rate coefficient, kmort (d−1) is a mortality coefficient which collectively represents loss of phytoplankton biomass to respiration, grazing and death, vs (m⋅d−1) is the phytoplankton settling velocity, Δz (m) is the thickness of the (sigma) layer and φ represents functions describing the mediation of growth by temperature (T), light (I) and nutrients (N; here SRP):
where Topt is the optimal temperature for growth (°C) and αT is a coefficient (°C−1) describing the slope of the suboptimal and supraoptimal limbs of the temperature response curve;
where αI and βI are coefficients specifying the ascending and descending slopes of the light response curve, mgC⋅mgChl−1⋅s−1⋅W−1 and xChl:C is the ratio of Chl to C in phytoplankton, mgChl⋅mgC−1; and where Ks is the SRP half-saturation coefficient for growth, µgSRP⋅L−1. Coefficients values contained within Equations (2)–(6) and utilized in performance testing and application of the GEM module are provided in Table 1.
4.2.5. Boundary and Initial Conditions
FVCOM/GEM requires specification of SRP and Chl concentrations at the nearshore-offshore boundary which, in our configuration, essentially circumscribes the domain (Figure 1 inset). Open lake boundary conditions of SRP and Chl can significantly influence the direction (source-sink nature) and magnitude of diffusive and advective mass transport (FVCOM; Equation (1)). SRP especially merits attention for boundary condition specification as concentrations of the nutrient in the oligotrophic, offshore waters of Lake Ontario are characteristic of P-limited Cladophora growth. Thus, offshore SRP concentrations will be a factor in determining the endpoint nutritional status of Cladophora. In the case of chlorophyll, we seek to have the offshore boundary condition concentration reflect seasonal dynamics so that the role of phytoplankton as a P sink is appropriately represented.
It is a challenge to identify true open lake boundary values for SRP at a site influenced by P-rich effluents from multiple WWTPs. This is especially the case here for locations within the footprint of the Duffin Creek WWTP [23]. SRP concentrations exceeding the offshore boundary level are observed downcurrent of the plant’s outfall [39], with the position of the plume varying at a frequency of hours to days [23]. Additionally, temporal variation in offshore boundary SRP concentrations (seasonal reduction by a factor of 5 in Lake Michigan [31] may be observed following the onset of thermal stratification.
In our study, we measured spring (18 April 2014) surface water SRP concentrations at 11 stations extending along a transect from a point in the nearshore proximate to the Duffin Creek WWTP outfall lakeward to a station 23 km offshore (Supplementary Material, Figure S1). The mean SRP concentration for the first three transect stations beyond the diffuser (4–12 km offshore) was 0.56 ± 0.06 μgP⋅L−1, increasing to 0.89 ± 0.11 μgP⋅L−1 for the balance of the transect (14–23 km offshore), with an all station average of 0.79 ± 0.18 μgP⋅L−1. We also included in our analysis surface water SRP levels measured at 3 stations (Supplementary Material, Figure S1) during the Environment Canada spring and summer surveys [79]. Concentrations at these stations averaged 1.23 ± 0.68 μgP⋅L−1 (17 April 2012) and 1.87 ± 1.21 μgP⋅L−1 (13 April 2013) for the two spring surveys and 0.27 ± 0.12 μgP⋅L−1 (27 August 2013) for the summer survey. Finally, we included monitoring results from Howell [39] sampled at 18–19 stations in the study area in May–August and October of 2012 and June and July of 2013, limiting measurements of SRP to the near bottom environment (~10 cm above the lakebed). Howell [39] reported that, on occasion, external loading directly influenced near bed SRP concentrations (see also [27]). In adding the data of Howell [39] to our analysis, we focused on the 25th percentile for each date as a means of eliminating external source effects. Values for the 25th percentile SRP concentration were typically higher early in the year, declining in summer and increasing again at turnover. The collective database for SRP developed from these three monitoring efforts mirrors the response of boundary condition SRP levels to changes in the stratification regime as described for Lake Michigan by Shen et al. [31]: elevated concentrations early in the year, depletion during summer stratification and elevation at fall mixing (Figure 6a). Interannual variation is also apparent, with differences observed in early spring and in the timing of depletion (Figure 6a). For our application, we specify a time variable offshore SRP boundary condition: initially at 1.03 μgP⋅L−1, dropping to 0.24 μgP⋅L−1 in mid-June and remaining at that level until turnover (Figure 6a).
Specification of boundary conditions for chlorophyll is more straightforward than for SRP. Here, we draw upon a high resolution (daily), long term surface water Chl data set collected by MECP at a site ~2 km offshore of Ajax, ON (Supplementary Material, Figure S1) and corrected for quenching [80]. For the interval 2012–2016, chlorophyll levels increased from an average of 0.5 ± 0.25 μgChl⋅L−1 in early May to an average of 1.1 ± 0.56 μgChl⋅L−1 in early June and remained at that level into September (Figure 6b). These MECP results satisfactorily represent measurements made at the site by others: Malkin et al. [74], sampling in 2007 and 2008, median of 1.3 μgChl⋅L−1 and maximum of 2.3 μgChl⋅L−1 and Howell [41], sampling in 2012 and 2013, median of 0.4–0.6 μgChl⋅L−1 and maximum of 2.8 μgChl⋅L−1. In our application, we utilize the MECP data to specify a time variable Chl boundary condition (Figure 6b).
Specification of an initial condition for state variables can play an important role in determining the level of model performance early in the simulation. The initial boundary condition values for chlorophyll and phosphorus were also specified as the initial conditions throughout the model domain, and allowed to equilibrate during a 30-day spin up period.
4.2.6. Determination of Loads
Loads input to the FVCOM-GEM model do not include chlorophyll, as concentrations of algal biomass in tributary and point source discharges are negligible. Similarly, tributary phosphorus inputs are not included here, as these account for only ~1% of the total SRP load during the spring–summer Cladophora growth period (see [23]). Thus, phosphorus load determination is limited to that from the Highland Creek, Duffin Creek and Corbett Creek WWTPs (Figure 1), with daily average discharge and TP concentrations obtained from Annual Performance Reports for the three WWTPs. The Duffin Creek WWTP experienced atypically high effluent phosphorus levels from October 2014 through 2016, due in part to having treatment units offline for refurbishment (lower residence time, less efficient sedimentation). While data for 2016 (Table 2), the year with the most spatially and temporally complete in-lake SRP data, serve well in testing model performance (Section 5.1), effluent SRP concentrations for the period January through September 2014 (Table 2) better represent typical operating conditions (2011–September 2014) and were selected for use in simulating engineering options (Section 5.2).
Loads are determined for bioavailable phosphorus and input to FVCOM-GEM as SRP. The bioavailable P load (WTP,bio, mgP⋅d−1) is calculated as the product of the WWTP effluent bioavailable TP concentration (TPbio, expressed here as mgP⋅m−3) and the WWTP discharge rate (ω, m3⋅d−1),
The value of TPbio is calculated as the product of the fraction bioavailable (fbio, dimensionless) and the ratio (r, dimensionless) of the TP component to the TP concentration for each TP component. These are then summed and multiplied by the TP concentration,
Values of r and f (Table 2) were determined by conducting soluble- and particulate-phase algal bioassays [67] on the Duffin Creek WWTP effluent and were carried forward as being representative of the other two study system plants.
The BAP approach carries with it the assumption that transformation kinetics proceed at a rate as fast as or faster than that for flushing of the nearshore system by mass transport. The 99% flushing time for the study site has been calculated to be 7–8 days [23]. Measurements made on the Duffin Creek WWTP effluent show that conversion of bioavailable DOP → SRP is completed in 3–4 days; thus, the assumption is satisfactory for DOP. The bioavailable PP component is transformed more slowly, achieving two-thirds conversion in 8 days. Bioavailable PP accounts for 9% of the total BAP load at this plant, thus the potential error associated with the flushing assumption in on the order of 3% for PP; we believe this to be satisfactory as well.
4.3. GLCM v3: The Cladophora Model
The Great Lakes Cladophora Model v3 [81] is the newest version of the mechanistic mass balance tool originally developed by Canale and Auer [6] and advanced by Tomlinson et al. [82]. In the linked modeling approach used here, the GLCM v3 may receive time series of SRP concentrations from FVCOM-GEM and solve mass balance equations for Cladophora areal biomass (X, gDM⋅m−2) and areal stored phosphorus (S, gP⋅m−2) over the algal growing season (nominally May–September). Alga-specific stored phosphorus content (Q, P as %DM) is calculated as areal stored P divided by the areal biomass (Q = S/X). The mass balance on biomass includes a source term, gross growth, and two sink terms, respiration and loss to sloughing (detachment). The gross growth rate is calculated as the product of a maximum specific gross growth rate coefficient and functions for light and temperature, f (I,T), and the stored phosphorus content of the alga, f (Q). The value of f (I,T), ranging from 0 to 1, is determined from a three dimensional matrix fit to laboratory measurements of gross photosynthesis [9,83]. The value of f (Q), ranging from 0 to 1, is determined by a fit of the Droop function [84] to paired measurements of the gross growth rate and alga-specific stored P content [81]. The respiration rate is calculated in a manner similar to that for gross photosynthesis, based on a maximum specific light-enhanced respiration rate coefficient, a response matrix for light-enhanced respiration (f (I,T)) and a basal respiration rate that varies as a function of temperature, f (T). Sloughing loss of biomass is calculated as the product of a maximum specific sloughing rate coefficient and factors accommodating near-bottom turbulence and vulnerability to detachment, i.e., self-shading-induced senescence. The mass balance on areal stored P includes a source term, SRP uptake, and sink terms for loss to respiration and sloughing. Phosphorus uptake rates are determined through application of a Michaelis–Menten function mediating the uptake response to water column SRP levels and a feedback mechanism mediating the uptake response to changes in alga-specific P reserves (e.g., an increase in Q reduces uptake). Changes in alga-specific stored P content thus reflect the balance between areal stored phosphorus accrual through uptake and areal biomass accrual through growth. The GLCM v3 requires input of environmental forcing conditions including hourly incident light (photosynthetically active radiation, µE⋅m−2⋅s−1), period average water column and algal mat light attenuation coefficients, daily water temperature (°C) and daily ambient SRP (µgP⋅L−1).
Enhancements made in developing the GLCM v3 include redefinition of the f (I,T) matrices, reformatting of the growth algorithm to accommodate self-shading (canopy effect [9]), determination of rates of phosphorus uptake based on radioisotope measurements, additional paired measurements of growth and stored P content supporting application of the Droop function and implementation of a new physically and physiologically driven sloughing function drawing on the self-shading model and measurements of near bottom current velocities. The GLCM v3 was performance tested [81] using published datasets for Lakes Huron and Michigan [82], Lake Erie [85] and Lake Ontario [25]. For this work, the GLCM v3 was calibrated using a new Cladophora biomass time series collected in 2020 from 6 m depth at a site (43.810401 N, 79.0268892 W) located 1.5 km east of the Duffins Creek WWTP (Figure 1). Input forcing conditions included hourly photosynthetically active radiation (PAR from the NOAA meteorological station at Muskegon, MI), daily lake bottom temperature (OPG Lake Current Monitoring System buoy at Darlington, ON) and a representative SRP concentration of 1.5 µgP⋅L−1 (see Section 5.2 below). The simulation was run from late May to early October with initial conditions of 23 gDM⋅m−2 of biomass and 0.13% stored P at a depth of 6 m. A light attenuation coefficient value of 0.43 m−1 and a light attenuation coefficient through the algal mat of 30 m−1 were used. Five model coefficients pertaining to growth, respiration, and sloughing were retained from model performance testing with uniform coefficients applicable across Lakes Michigan, Huron, Erie and Ontario [81]. The GCLM v3 performed well over the entire seasonal interval (Figure 7).
4.4. Model Implementation
The three modules constituting the model platform (Figure 3) are run in serial (linked) fashion. FVCOM is first applied to determine a suite of physical conditions (water temperature, the current field and diffusive mass transport) describing study site hydrodynamics. These results are passed along to the GEM module (FVCOM-GEM in this usage) where BAP loads are added and a time series of SRP and Chl is generated. These results are first used for testing GEM module performance and then in exploring the efficacy of phosphorus treatment options in mediating nearshore SRP levels. Finally, the GLCM v3 is applied to establish the SRP concentration at which Cladophora growth departs from linearity (entering a P-saturated phase), our metric for quantifying the efficacy of treatment options.
5. Results and Discussion
5.1. Testing Model Performance
Of the three platform modules two have been performance tested previously (FVCOM [23] and GLCM v3 [81]) and found acceptable for use at the study site. Additional performance testing information is presented above (FVCOM, Section 4.1 and GLCM v3, Section 4.3). Attention is thus focused on the performance of the biokinetic module (FVCOM/GEM) with respect to the SRP and Chl state variables. For SRP, we compared model output with measurements made in 2016 by the Toronto and Region Conservation Authority [40]. The TRCA monitoring program has been in place since 2007, but it was only in 2016 (most recent year of public record) that SRP detection limits suitable for application to the phosphorus–Cladophora dynamic (0.2–0.5 μgP⋅L−1) have been achieved. In 2016, monitoring was performed monthly from May through November (except September) at 25 surface stations (13 having bottom collections) extending east 11 km from the mouth of the Rouge River (Pickering, ON) to Pickering Beach (Ajax, ON) and lakeward a distance of ~5 km (Supplementary Material, Figure S2). Field data and model predictions exhibit a considerable degree of spatiotemporal variability, reflecting the dynamic nature of effluent plumes [23]. No systematic spatial patterns, however, were discernable in the observations, either alongshore or nearshore to offshore. Because the sampling stations represent relatively few points in this dynamic landscape, and because the objective of our work is to characterize the nature of the SRP footprint across the entire area of colonized substrate over the Cladophora growing season, we compared model output and observations in aggregate, rather than pairwise. The interquartile ranges of the data and model output overlap on all dates (Figure 8a,b). The median of the observations agrees nearly perfectly with model output both at the surface and bottom in June and July and at the bottom in May. The model slightly overpredicts surface SRP concentrations in May, and slightly underpredicts concentrations in late August. Overall, however, there is very good agreement in both magnitude and variability of SRP between model and data (Figure 8a,b).
Evaluation of model performance for chlorophyll utilized the MECP buoy data described above (Section 4.2.5). Simulation results are those for model nodes immediately adjoining the MECP buoy site. Model-calculated daily mean surface chlorophyll levels for 2016 are compared with daily measurements made at the MECP buoy in Figure 9. The simulation tracks long term trends in chlorophyll levels (spring increase and stable summer conditions), but mutes some of the more short term variability, likely due to the simplistic treatment of phytoplankton biomass (e.g., single functional type, no explicit representation of grazers). Most importantly, the model accurately reflects the magnitude and seasonal trend of the chlorophyll standing crop and thus its role as an SRP sink. The mean May–August surface value measured at the buoy (0.84 µg⋅L−1) is not significantly different than the modeled value (0.88 µg L−1; paired t-test p = 0.3).
5.2. Representing the Phosphorus–Cladophora Dynamic
In order to represent the phosphorus–Cladophora dynamic in a management context, e.g., analysis of the impact of increasing phosphorus loads and the efficacy of improved phosphorus removal, it is necessary to specify a target concentration that is ecologically meaningful in such applications. Here we use the upper bound of the range of SRP concentrations reflecting P-limited growth and thus responsive to management of ambient SRP. That upper bound was established by applying the GLCM v3 to develop a relationship between ambient SRP concentration and seasonal maximum Cladophora biomass (Figure 10). The rate of biomass accrual is seen to increase in a linear fashion with SRP to a concentration of ~1.5 μgP⋅L−1. Beyond this point the relationship departs from linearity, indicating the onset of P-saturation, and eventually reaches a P-saturated asymptote.
Phosphorus dynamics in a coastal region influenced by point source discharges are striking both spatially and temporally. Depending on the magnitude of the discharge, phosphorus footprints may extend over kilometer-scale distances in the longshore dimension and lakeward for several kilometers [23,27,30]. Concentrations diminish with distance from the discharge and vary temporally as the plume is entrained, mixed and transported by prevailing currents (Figure 11a; see also [23]). Ambient concentrations of SRP also exhibit vertical structure (Figure 11b) that develops as the discharge loses momentum, seeks an equilibrium density position within the water column and undergoes mixing forced by the turbulence characteristic of shallow nearshore waters. The result is a dynamic SRP footprint exhibiting a heterogeneity that is difficult to resolve in a snapshot fashion that captures the capacity to support Cladophora nutrition. To meet this challenge, we focus solely on model output at bottom nodes, the location of Cladophora colonization; although there was no statistically significant difference (p > 0.3) between surface, bottom and depth-averaged concentrations. We then represent the SRP footprint as a two-dimensional plot (with concentrations averaged over the 120-day simulation period) from which the dimensions of the P-saturated region are easily identified. This approach serves well in resolving spatial aspects of point source discharges, particularly the longshore and offshore dimensions of the plume.
5.3. Simulating the Impact of Engineered Options
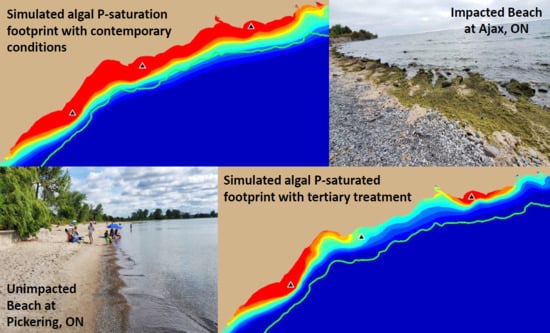
At present, the Pickering–Ajax–Whitby, ON nearshore receives effluent from the Highland Creek, Duffin Creek and Corbett Creek WWTPs (Figure 1), all performing chemically enhanced secondary treatment. These discharges create P-saturated SRP footprints extending for longshore distances of ~11, ~17 and ~3 km for the Highland Creek, Duffin Creek and Corbett Creek WWTPs, respectively (Figure 12a–c). Cumulatively, the P-saturation footprint for the three WWTPs extends along ~35 km of Lake Ontario shoreline (Figure 12d). The footprints also extend offshore to overlie a significant portion of the colonizable Cladophora substrate, including depth-optimal locations (Figure 12). Simulations of the impact of engineered options for P-removal at the Duffin Creek WWTP are examined both for locations proximate to this discharge and those impacted by adjoining discharges.
Analysis of engineered options proceeds from the Phosphorus Reduction Action Plan (PRAP, described in Section 3) as mandated by MECP in 2016 for the Duffin Creek WWTP. Engineered options are examined only for the Duffin Creek WWTP, which is the largest of the three study area point sources and the facility charged with developing the PRAP. Thus, the first of two scenario groups explores engineered options for reducing effluent BAP (SRP) levels (the PRAP mandate) and eliminating the occurrence of nuisance algal growth (the GLWQA mandate) under contemporary discharge rates at the Duffin Creek WWTP. A second scenario group examines the impact of increasing the flow treated at the Duffin Creek WWTP. Presently operating with a discharge of ~316 million liters per day (MLD), one-half of its maximum permitted design flow of 630 MLD, this plant is well positioned to accommodate the increases in population projected for its service area. These two scenarios constitute a 2 × 3 matrix of six cases (flow x treatment) simulated for 2014 effluent phosphorus levels (see Section 4.2.6) with: Baseline Treatment conditions (chemically enhanced secondary treatment), an Optimized Secondary treatment option (the most effective of several combinations of iron salt and polymer addition to primary and secondary unit operations [86] and Tertiary Treatment (chemically enhanced secondary treatment with sedimentation by ballasted flocculation [87,88]). Results are examined within the context of hydrodynamic mediation of effluent plume fate in the Lake Ontario nearshore, i.e., transport favored by coastal jets, limiting offshore plume migration and extending impacts in the longshore dimension as discharges are increased.
5.3.1. The Baseline Treatment Case
Simulation of the Baseline Treatment Case, representing contemporary flow and chemically enhanced secondary treatment efficiency, predicts that P-saturated conditions will extend to the east and west of the Duffin Creek WWTP outfall for a total longshore distance of ~17 km (Figure 13a). The P-saturated plume (red) is predicted to reach offshore for a distance of 2 km, thus covering an area of ~19 km2 including ~30% of the full footprint bottom substrate having a light environment suitable for colonization by Cladophora. Simulation of the contemporary treatment efficiency at the maximum permitted design flow predicts the expansion of the area of the P-saturated footprint by more than double to 39 km2 and the lakeward extension of coverage to 60% of the colonizable substrate (Figure 13b). Simulation results of P-forcing of Cladophora growth under contemporary levels of treatment and flow are consistent with attributions of P-enrichment and an abundance of attached algae biomass made by others at the study site [6,27,41,89] and with recent observations of beach degradation and cooling water intake fouling (Figure 2).
5.3.2. The Optimized Secondary Treatment Case
The bioavailable P load is reduced by 31% for the Optimized Secondary Treatment case, resulting in a predicted reduction in the longshore dimension of the P-saturation footprint from ~17 to ~10 km and, in the offshore direction, from ~2 to ~1.5 km versus the contemporary Baseline case (compare Figure 13a,c). The colonizable area overlain by P-saturating conditions is predicted to be reduced by 45% from ~19 km2 to ~10 km2. However, conditions of P-saturation continue to overlie bottom substrate having a light environment particularly favorable for Cladophora growth. An increase in discharge to the maximum permitted design flow is predicted to expand the footprint of P-saturation in both the longshore (~19 km) and offshore (~2 km) dimensions, increasing the area to ~24 km2 (compare Figure 13c,d).
5.3.3. The Tertiary Treatment Case
The Tertiary Treatment case represents a reduction in the effluent SRP concentration from 260 μgP⋅L−1 (for the Baseline case) or 100 μgP⋅L−1 (for the Optimized Secondary Treatment case) to <5 μgP⋅L−1. Additionally, tertiary treatment with ballasted flocculation technology yields a particulate P fraction with negligible bioavailability (Auer, unpublished). The result is a loading reduction from 105 kgP⋅d−1 (98%; for the Baseline Treatment case) and 72 kgP⋅d−1 (97%; for the Optimized Secondary Treatment case) to 2 kgP⋅d−1. Application of the tertiary treatment is predicted to eliminate P-saturated conditions associated with the Duffin Creek WWTP effluent plume across the study site (Figure 13e) for both contemporary and maximum permitted design flow conditions (Figure 13f). Accordingly, Cladophora growth is largely mediated by SRP levels reflecting the offshore boundary condition and the discharge plumes of adjoining WWTP plants.
5.3.4. Developing a Management Plan
While attention to a local source input is the clear first choice in managing the phosphorus–Cladophora dynamic, planning efforts should place technology implementation in a fuller context. Simulation of implementation of tertiary treatment at the Duffin Creek WWTP had a striking impact on predicted P levels in the adjoining Ajax nearshore (compare Figure 14a,b); a result not particularly surprising given the magnitude of that plant’s discharge (2nd largest for Canadian waters of Lake Ontario) and the degree of improvement in removal efficiency achievable (98%, previous section; also Table 2b). Period average SRP concentrations under contemporary flows are predicted to fall within the P-limited range across the Ajax, ON portion of the study site (Figure 14b) and to be maintained within that range at the maximum permitted design flow (Figure 14c). Implementation of tertiary treatment at the Duffin Creek WWTP is predicted to lower period average SRP concentrations to 1.1–1.2 μgP⋅L−1 over this stretch of the nearshore, reducing levels of Cladophora biomass production and supporting recovery of lost beneficial uses. These simulation results are consistent with the recommendation of Higgins et al. [6] that effective control of Cladophora blooms in Lake Ontario should occur through management of P loading at local scales.
In this and other highly urbanized locations, however, it is further necessary to consider the impact of plume overlap with adjoining WWTPs as factors mediating nuisance conditions (see Figure 11 of [23]). Such overlap is apparent in the results of a multiple point source simulation of SRP concentrations for contemporary flow baseline and tertiary treatment at the Duffin Creek WWTP (Figure 15). Here, period average SRP levels remain below the target concentration of 1.5 μgP⋅L−1, but regularly exceed that target on a daily basis over the critical first half of the growing season (May and June; see Figure 7). This is the case to the west of the Duffin Creek WWTP outfall (Figure 15; Stations W1-W3) where the Highland Creek WWTP SRP footprint has its primary manifestation. To the east, the impacts of the smaller (Table 2b) and more distant Corbett Creek WWTP are much less. Particularly, spikes in SRP concentration at stations proximate to the Highland Creek WWTP outfall are greater in magnitude and in frequency than those to the east (Figure 15). Thus, overlap with the Highland Creek WWTP plume has the potential to dampen the impact of tertiary treatment at the Duffin Creek WWTP, especially at sites to the west of Ajax, ON (compare Figure 13e,f and Figure 14b,c).
Finally, we draw attention to the recommendation of Higgins et al. [6] that management of phosphorus in reducing/eliminating nuisance growth of Cladophora ensure that lakewide P concentrations (here the open water boundary condition) do not increase. The significance of this aspect of management is apparent in the manner in which time series simulations of SRP (Figure 16) mirror the step reduction in the offshore boundary condition attending seasonal drawdown by phytoplankton (Figure 6a). Note that, in the absence of the Highland Creek WWTP discharge, SRP levels remain below the target concentration over the entire season (Figure 16), eliminating the day-scale target exceedance (Figure 15) predicted for the critical May–June interval of the Cladophora growth season.
We thus build on the recommendations of Higgins et al. [6], offering guidance for management of nuisance growth of Cladophora that would include implementation of advanced technologies for local source phosphorus control, avoidance of SRP plume overlap with adjoining local sources and maintenance of lakewide (offshore) SRP concentrations that can accommodate residual SRP inputs without exceeding the target concentration for P-limitation of the alga.
6. Cladophora Management in Perspective
The ‘modeling for management’ exercise presented here takes its place as the next logical step in a continuum that began almost five decades ago with the signing of the Great Lakes Water Quality Agreement of 1972. That Agreement included a call for the construction and operation of municipal wastewater treatment plants to remove phosphorus from their effluents to the extent necessary to prevent nuisance growth of algae limiting any beneficial water use. Subsequently, the International Joint Commission declared that “Cladophora is a big problem” [15] and studies were initiated to explore the phosphorus–Cladophora dynamic and identify engineered options for point source controls that would mitigate nuisance growth [5,89]. Implementation of such controls at a site on Lake Huron demonstrated the efficacy of such an approach [90]. Regulation of effluent phosphorus discharge applied in the late 1970s and early 1980s resulted in striking reductions in phosphorus concentrations in Lake Ontario [19] and an attendant decline in the status of phosphorus nutrition in and biomass production by Cladophora [16,17]. This apparent path to recovery of lost beneficial uses was interrupted in the 1990s with the invasion of Lake Ontario by dreissenid mussels. Filtration activity by mussels increased water clarity, expanding the area of colonizable substrate available to Cladophora and resulting in a resurgence of nuisance conditions [17,25,91].
Despite a binational recommendation to focus on eutrophication in Great Lakes coastal waters [20] and the continued embodiment in the GLWQA of 2012 of a mandate to control nuisance algal growth, there has been no progress in promulgating management plans or regulatory standards focusing on the phosphorus–Cladophora dynamic. We believe that this management gridlock may be attributed to several features of the science-policy-regulatory continuum. On the scientific front, uncertainty has been an expressed with regard to the capacity of mussels to stimulate nuisance Cladophora growth by drawing solely upon plankton from the oligotrophic, offshore waters of Lake Ontario as a source of particulate P; i.e., in the absence of a local P-source discharging to the nearshore [39,41]. An improved understanding of the extent of point source bioavailable phosphorus footprints can contribute to disambiguation of this point [23]. On the management side, there remains no plan for addressing nuisance growth of Cladophora nearly a century following the first documentation of degraded conditions along the Toronto, ON nearshore of Lake Ontario [14]. With no plan in place, there is no enforceable regulatory guidance at a time when municipal wastewater treatment facilities have demonstrated a lack of institutional will to move beyond the technologies of the 1970s to address the Cladophora problem [86]. We treat these topics below before summarizing our findings in a broader context, i.e., that of the Great Lakes Water Quality Agreement of 2012.
6.1. Dreissenid Mussels and Locally Forced Nuisance Cladophora Growth
The conceptualization of dreissenid mussel impacts on Great Lakes water quality as offered by Hecky et al. [71] has been validated over the past 15 years: mussel filtration has significantly increased transparency in Lake Ontario [19] and field studies have demonstrated that mussels have the capacity to elevate near-bottom SRP to ecologically meaningful levels [72,92]. Yet, Leon et al. [27], working at the Ajax, ON site, were successful in simulating major water quality variables of significance to nuisance Cladophora growth despite exclusion of dreissenid mussels and associated nutrient cycling from their three-dimensional hydrodynamic-ecological model. Additionally, Howell [39,41] found no significant correlation between Dfreissena biomass and Cladophora biomass over the full range of co-colonized depths (3–5, 5–8, 8–11 and 19–21 m) at his Ajax, ON study site. These findings call into question phosphorus stimulation by mussels as the cause of a resurgence in nuisance growth. This position is well supported by the work of Kuczynski et al. [17] who clearly demonstrated that the resurgence in nuisance growth of Cladophora has tracked increases in transparency (and thus expansion of colonizable substrate) rather than the P-nutrition of the alga which has, in fact, declined in the post-dreissenid period.
The lack of uniformity in the occurrence of nuisance conditions at sites across the Lake Ontario nearshore has further contributed to resolution of the nuisance Cladophora–dreissenid question. For example, levels of phosphorus nutrition (stored P content) have been found to be higher at Ajax, ON (large local P source) than further to the east on Lake Ontario at Cobourg, ON (small local sources). This suggests that local sourcing of PP is of more importance than mussel presence, given that dreissenids are common across this entire stretch of shoreline [42]. Based on a 7-site survey of Cladophora in Canadian and U.S. waters of Lake Ontario, Higgins et al. [6, p.116) concluded that “there was little evidence that P from metabolic waste products of dreissenid mussels was sufficient to produce severe blooms in absence of localized P enrichment.” A similar endpoint was reached as a result of observations from a 48-station survey along the northern and eastern shores of Lake Ontario where significant beach accumulation of sloughed Cladophora was observed only where a local source of phosphorus was identifiable [93].
We conclude that while both Cladophora [94] and dreissenid mussels [42] are ubiquitous in the Lake Ontario nearshore, nuisance conditions of algal growth are not [7]. It is important to remember that mussels do not make phosphorus, but only transform and recycle the nutrient. A local source of phosphorus is required and the magnitude of that source determines the extent of nearshore degradation. We agree that mussel recycling has the capacity to bring phosphorus levels in the coastal waters of Lake Ontario a step closer to P-saturation (and stimulation of algal growth) and that more stringent controls on point sources are required to maintain beneficial uses of the nearshore. However, as stated by Higgins et al., [7], effective management of Cladophora blooms in Lake Ontario should occur through managing P loading at local scales while ensuring lakewide P concentrations do not increase.
6.2. Mixing Zones and the Phosphorus Footprint
Design for the discharge of wastewater effluents to Lake Ontario is based on the concept of a mixing zone, defined as an area of water contiguous to a point source where water quality does not comply with one or more Provincial Water Quality Objectives (PWQOs). In the Province of Ontario, Water Management Policy 5 [95] states that “mixing zones should be as small as possible [minimizing the area of PWQO noncompliance] and not interfere with beneficial uses”. The intent of the approach is to separate incompatible uses within this near-continuous urban community that turns to Lake Ontario for recreation and, almost exclusively, for water supply and wastewater disposal [22]. Regulation of the phosphorus discharge from the Duffin Creek WWTP is presently based on the PWQO for the partially bioavailable TP analyte (20 μgP⋅L−1) as developed for offshore waters. The result is a perception of the attendant phosphorus footprint, having dimensions measured on a scale of hundreds of meters [96], Figure 4, Figure 5 and Figure 6). As demonstrated here, the (fully bioavailable) SRP footprint for the Duffin Creek WWTP has dimensions measured on a scale of tens of kilometers.
Footprint size is management critical here as elevated concentrations overlie substrate colonizable by Cladophora. While application of an SRP-based PWQO awaits promulgation by provincial regulatory authorities, it becomes clear that the scale of the problem is greater than that generally anticipated and appreciated. Recent modeling exercises have, however, provided confirmation of the nature of the footprint. Huang et al. [23] determined that the SRP footprint associated with the Duffin Creek WWTP (simulated as a conservative substance) has dimensions of ~17 km (longshore) by 2.5 km (offshore). Similarly, Bravo et al. [30] examined phosphorus dynamics in the Lake Michigan nearshore at Milwaukee, WI, a region noted for nuisance growth of Cladophora [97]. It was determined that the total phosphorus footprint for the South Shore WWTP (Milwaukee, WI) extended approximately 20–25 km over the longshore axis and 2–4 km offshore. These findings are consistent with those presented here for our Lake Ontario study site where the P-saturated SRP footprint was found to extend 17 km in the longshore direction and 2 km offshore. Simply stated, the mixing zone concepts developed in the 1970s for wastewater discharges to the Great Lakes, no longer adequately describe the potential for impact by point source nutrient enrichment.
6.3. Advanced Phosphorus Treatment and Nuisance Cladophora Growth
Degradation of environmental quality associated with nuisance growth of Cladophora has been occurring and continues to occur across the Pickering–Ajax–Whitby beaches and nearshore waters of Lake Ontario. The contribution of point sources to the Cladophora problem and the need for more stringent phosphorus control have been regularly and broadly recognized in the related body of knowledge [6,23,27,30,71,91,97]. Yet, step changes in wastewater treatment technologies are rare events in the management of receiving waters. It has been a half century since phosphorus removal was mandated for treatment facilities discharging to the Great Lakes. It has been almost two decades since Rao et al. [22], (p. 627–628) concluded that current treatment technologies seem to be nearing their practical design limit, even as the demand for suitable waste disposal facilities continues to rise at an ever increasing rate. The Duffin Creek WWTP is operated by York and Durham Regions (Figure 1 inset) and serves 80% of the residents and businesses in the former and 100% of those in the latter [98]. With current populations of 1.2 and 0.7 million, York and Durham Regions, are projected to increase in population by 67 and 86%, respectively, by 2051 [99,100].
Model simulations presented here have demonstrated that contemporary treatment levels at the Duffin Creek WWTP result in phosphorus concentrations in the Pickering–Ajax–Whitby nearshore sufficient to stimulate nuisance growth of Cladophora (Figure 10 and Figure 13a). Increases in plant flow projected to accompany increases in population growth are predicted to extend the area of Cladophora habitat exposed to P-saturating conditions, resulting in additional nuisance growth and attendant loss of beneficial uses (compare Figure 13a,b). Optimization of the secondary treatment presently applied at the Duffin Creek WWTP would provide little relief from degradation of the coastal environment (compare Figure 13a,c). Our simulations demonstrate that implementation of tertiary treatment (here, chemically enhanced secondary with ballasted flocculation) would dramatically reduce phosphorus concentrations at the study site, resulting in mitigation of nuisance conditions and recovery of lost beneficial uses, even at the maximum permitted design flow (Figure 13e,f and Figure 14).
6.4. Summary of Management Implications
The results presented here have both local and regional significance. Locally, the Cladophora problem has been a persistent feature of the Lake Ontario coastal zone, degrading beaches and nearshore waters at Ajax, ON [91] and resulting in tens of millions of dollars in lost revenue through cooling water intake fouling at the OPG Pickering Nuclear Generating Station [101]. These losses of beneficial use may be attributed to local forcing by the discharge from the Duffin Creek WWTP, the major contributor of bioavailable phosphorus to the study area [91]. That contribution is clearly reflected here in the dimensions of the footprint for saturating SRP concentrations.
Such discharges (and accompanying nuisance conditions) are common on Lake Ontario (with 24 WWTPs located between St. Catharines and Cobourg, ON [102]) and across the Great Lakes, suggesting that our results have broad application. Management of locally-forced nuisance Cladophora growth will proceed from a foundation in science → formulation of policy → promulgation of regulations → implementation of treatment technologies. Connectivity in following the path from a foundation in science to implementation is provided by the Great Lakes Water Quality Agreement, the purpose of which is to restore and maintain the chemical, physical, and biological integrity of the waters of the Great Lakes. Annex 4 of the GLWQA of 2012 includes a Lake Ecosystem Objective to manage phosphorus discharges so that levels of algal growth below those constituting a nuisance condition are maintained. The Agreement embraces a suite of Principles and Approaches providing guidance in meeting this Objective. Several of these resonate particularly strongly with the problem addressed along the Pickering–Ajax–Whitby nearshore of Lake Ontario, including:
- A call to action,anti-degradation: implement all reasonable and practicable measures to maintain or improve existing water quality in areas that meet or exceed Agreement Objectives.We have shown here that degradation persists in nearshore waters where a local source exists, despite the fact that the open waters of Lake Ontario meet target TP concentrations;prevention: anticipate and prevent pollution to reduce risks to the environment.We have demonstrated that increases in flow from the Duffin Creek WWTP will serve to extend and exacerbate nuisance conditions along the Pickering–Ajax–Whitby nearshore;
- A commitment to follow the science,science-based and adaptive management: implementing programs based on the best available science while assessing effectiveness of actions and adjusting future actions to achieve objectives as outcomes and ecosystem processes become better understood.We have demonstrated that existing treatment actions do not provide relief from nuisance conditions in the post dreissenid era (i.e., following the invasion of dreissenids;precaution: where there are threats of serious or irreversible damage, lack of full scientific certainty shall not be used as a reason for postponing cost-effective measures to prevent environmental degradation.We have made a case that, while dreissenid phosphorus cycling may increase P levels in the near-bottom environment, the P supply required to support nuisance growth is not available absent a local source; and
- A mandate for advanced treatment,adequate treatment: treating wastewater to achieve applicable water quality standards.While there are presently no water quality standards relating to the phosphorus–Cladophora dynamic, we have developed and presented here a relationship between SRP and the nutritional status of the alga defining the transition from P-limited to P-saturated conditions and demonstrated that P-limitation cannot be achieved through application of chemically enhanced secondary treatment;innovation: considering and applying advanced and environmentally friendly ideas, methods and efforts;We have demonstrated that an advanced technology, tertiary treatment as chemically enhanced secondary with ballasted flocculation, would serve to achieve P-limiting conditions in the Pickering–Ajax–Whitby nearshore. This technology has been applied successfully at a major WWTP within the Lake Ontario watershed for over 15 years.
The Pickering–Ajax–Whitby nearshore of Lake Ontario is part of an “unbroken urban landscape with an increasing demand for clean water and for suitable waste disposal facilities … [even as] current treatment technology seems to be nearing its practical design limit” [22]. Conditions supporting Cladophora growth have changed in the post dreissenid era [17], necessitating “more stringent controls on point sources to maintain beneficial uses” [71]. The control of “Cladophora blooms in Lake Ontario should occur through managing P loading at local scales while ensuring lakewide P concentrations do not increase” [7]. Thus, we echo the work of others and the principles and objectives of the Great Lakes Water Quality Agreement of 2012 in recommending that tertiary treatment for phosphorus removal be implemented as a means of controlling nuisance growth of Cladophora along the Pickering–Ajax–Whitby nearshore of Lake Ontario. Finally, we offer the insight of Leon et al. [27] who suggested that, while “our results may be most pertinent to our locality … there are many such outfalls around the coast of Lake Ontario and elsewhere in the Great Lakes”.
Supplementary Materials
The following are available online at https://www.mdpi.com/2073-4441/13/3/375/s1, Figure S1: Sampling station locations for soluble reactive phosphorus boundary condition determination: Michigan Tech survey (filled circles) and Environment Canada survey (open circles). Diamonds represent (west to east): Highland Creek WWTP, Duffin Creek WWTP and Corbett Creek WWTP, Figure S2: Sampling locations for model calibration: circles represent Toronto and Region Conservation Authority SRP monitoring stations. Square is Ministry of the Environment, Conservation and Parks chlorophyll monitoring buoy. Diamonds represent (west to east): Highland Creek WWTP, Duffin Creek WWTP and Corbett Creek WWTP.
Author Contributions
Conceptualization, M.T.A., C.P.M., A.K., C.H., P.X.; Data curation, C.P.M., A.K., C.H.; Formal analysis, M.T.A., C.P.M., A.K., C.H., P.X.; Funding acquisition, M.T.A.; Investigation, C.P.M., A.K., C.H., P.X.; Methodology, C.P.M., A.K., C.H., P.X.; Project administration, M.T.A.; Supervision, M.T.A.; Visualization, M.T.A., C.P.M., C.H.; Writing—original draft, M.T.A., C.P.M., A.K., C.H., P.X.; Writing—review & editing, M.T.A., C.P.M., A.K. All authors have read and agreed to the published version of the manuscript.
Funding
This work was funded by a research grant to Michigan Technological University under Contract No. 01-2013-2019 with the Town of Ajax, Ontario.
Institutional Review Board Statement
Not applicable.
Informed Consent Statement
Not applicable.
Data Availability Statement
Not applicable.
Acknowledgments
The work presented here is dedicated to Paul Wealleans and to the memory of Barb Hodgins, citizen scientists and dedicated stewards of the Lake Ontario nearshore.
Conflicts of Interest
The authors declare no conflict of interest.
References
- Dodds, W.K.; Gudder, D.A. The ecology of Cladophora. J. Phycol. 1992, 28, 415–427. [Google Scholar] [CrossRef]
- Lee, V.; Olsen, S. Eutrophication and management initiatives for the control of nutrient inputs to Rhode Island coastal lagoons. Estuaries 1985, 8, 191–202. [Google Scholar] [CrossRef]
- Pedersen, M.F.; Borum, J. Nutrient control of algal growth in estuarine waters. Nutrient limitation and the importance of nitrogen requirements and nitrogen storage among phytoplankton and species of macroalgae. Mar. Ecol. Prog. Ser. 1996, 142, 261–272. [Google Scholar] [CrossRef] [Green Version]
- Auer, M.T.; Canale, R.P. Ecological studies and mathematical modeling of Cladophora in Lake Huron: 3. The dependence of growth rates on internal phosphorus pool size. J. Great Lakes Res. 1982, 8, 93–99. [Google Scholar] [CrossRef]
- Canale, R.P.; Auer, M.T. Ecological studies and mathematical modeling of Cladophora in Lake Huron: 5. Model development and calibration. J. Great Lakes Res. 1982, 8, 112–125. [Google Scholar] [CrossRef]
- Higgins, S.N.; Pennuto, C.M.; Howell, E.T.; Lewis, T.W.; Makarewicz, J.C. Urban influences on Cladophora blooms in Lake Ontario. J. Great Lakes Res. 2012, 38 (Suppl. 4), 116–123. [Google Scholar] [CrossRef]
- Higgins, S.N.; Malkin, S.Y.; Todd Howell, E.; Guildford, S.J.; Campbell, L.; Hiriart-Baer, V.; Hecky, R.E. An ecological review of Cladophora glomerata (Chlorophyta) in the Laurentian Great Lakes 1. J. Phycol. 2008, 44, 839–854. [Google Scholar] [CrossRef]
- Higgins, S.N.; Hecky, R.E.; Guildford, S.J. The collapse of benthic macroalgal blooms in response to self-shading. Freshw. Biol. 2008, 53, 2557–2572. [Google Scholar] [CrossRef]
- Kuczynski, A.; Bakshi, A.; Auer, M.T.; Chapra, S.C. The canopy effect in filamentous algae: Improved modeling of Cladophora growth via a mechanistic representation of self-shading. Ecol. Model. 2020, 418, 108906. [Google Scholar] [CrossRef]
- Leon, L.F.; Smith, R.E.; Malkin, S.; Depew, D.; Hecky, R.E. Modeling and Analysis of Cladophora Dynamics and Their Relationship to Local Nutrient Sources in a Nearshore Segment of Lake Ontario, #4253501; Final Report for OPG; University of Waterloo: Waterloo, ON, Canada, 2009; p. 64. [Google Scholar]
- Chun, C.L.; Ochsner, U.; Byappanahalli, M.N.; Whitman, R.L.; Tepp, W.H.; Lin, G.; Johnson, E.A.; Peller, J.; Sadowsky, M.J. Association of toxin-producing Clostridium botulinum with the macroalga Cladophora in the Great Lakes. Environ. Sci. Technol. 2013, 47, 2587–2594. [Google Scholar] [CrossRef]
- Ishii, S.; Yan, T.; Shively, D.A.; Byappanahalli, M.N.; Whitman, R.L.; Sadowsky, M.J. Cladophora (Chlorophyta) spp. harbor human bacterial pathogens in nearshore water of Lake Michigan. Appl. Environ. Microbiol. 2006, 72, 4545–4553. [Google Scholar] [CrossRef] [PubMed] [Green Version]
- Taft, C.E.; Kishler, W.J. Cladophora as Related to Pollution and Eutrophication in Western Lake Erie; Water Resources Center, Ohio State University: Columbus, OH, USA, 1973; p. 103. [Google Scholar]
- Neil, J.H.; Owen, G.E. Distribution, environmental requirements and significance of Cladophora in the Great Lakes. In Proceedings of the 7th Annual Conference on Great Lakes Research, Toronto, ON, Canada, 6–7 April 1964; pp. 113–121. [Google Scholar]
- Shear, H.; Konasewich, D.E. Cladophora in the Great Lakes. In Proceedings of the Workshop at the International Joint Commissions’s Regional Office, Windsor, ON, Canada, 19–21 February 1975. [Google Scholar]
- Painter, D.S.; Kamaitis, G. Reduction of Cladophora biomass and tissue phosphorus in Lake Ontario, 1972–1983. Can. J. Fish. Aquat. Sci. 1987, 44, 2212–2215. [Google Scholar] [CrossRef]
- Kuczynski, A.; Auer, M.T.; Brooks, C.N.; Grimm, A.G. The Cladophora resurgence in Lake Ontario: Characterization and implications for management. Can. J. Fish. Aquat. Sci. 2016, 73, 999–1013. [Google Scholar] [CrossRef] [Green Version]
- Dove, A. Long-term trends in major ions and nutrients in Lake Ontario. Aquat. Ecosyst. Health Manag. 2009, 12, 281–295. [Google Scholar] [CrossRef]
- Dove, A.; Chapra, S.C. Long-term trends of nutrients and trophic response variables for the Great Lakes. Limnol. Oceanogr. 2015, 60, 696–721. [Google Scholar] [CrossRef]
- Agreement Review Committee (ARC). Review of the Great Lakes Water Quality Agreement. Report to the Great Lakes Binational Executive Committee, Vol. 2: Final Review Working Group Reports to ARC. 2007. Available online: http://www.agreementreview.net/docs/GLWQA%20Review%20Draft%20ARC%20Report_En.pdf (accessed on 12 January 2021).
- Reynolds, C.S.; Davies, P.S. Sources and bioavailability of phosphorus fractions in freshwaters: A British perspective. Biol. Rev. 2001, 76, 27–64. [Google Scholar] [CrossRef]
- Rao, Y.R.; Murthy, R.C.; Chiocchio, F.; Skafel, M.G.; Charlton, M.N. Impact of proposed Burlington and Hamilton sewage discharges in western Lake Ontario. Water Qual. Res. J. Can. 2003, 38, 627–645. [Google Scholar] [CrossRef]
- Huang, C.; Kuczynski, A.; Auer, M.T.; O’Donnell, D.M.; Xue, P. Management transition to the Great Lakes nearshore: Insights from hydrodynamic modeling. J. Mar. Sci. Eng. 2019, 7, 129. [Google Scholar] [CrossRef] [Green Version]
- Makarewicz, J.C.; Howell, E.T. The Lake Ontario Nearshore Study: Introduction and summary. J. Great Lakes Res. 2012, 38 (Suppl. 4), 2–9. [Google Scholar] [CrossRef]
- Malkin, S.Y.; Guildford, S.J.; Hecky, R.E. Modeling the growth response of Cladophora in a Laurentian Great Lakes to the exotic invader Dreissena and to lake warming. Limnol. Oceanogr. 2008, 53, 1111–1124. [Google Scholar] [CrossRef] [Green Version]
- Pauer, J.J.; Melendez, W.; Lowe, L.; Rashliegh, B. Great Lakes modeling: Are the mathematics outpacing the data and our understanding of the system? Presented at the 2018 Meeting of the International Association for Great Lakes Research, Toronto, ON, Canada, 18–22 June 2018. [Google Scholar]
- Leon, L.F.; Smith, R.E.H.; Malkin, S.Y.; DePew, D.; Hipsey, M.R.; Antenucci, J.P.; Higgins, S.N.; Heckey, R.E.; Rao, R.Y. Nested 3D modeling of the spatial dynamics of nutrients and phytoplankton in the Lake Ontario nearshore zone. J. Great Lakes Res. 2012, 38 (Suppl. 4), 171–183. [Google Scholar] [CrossRef]
- Fillingham, J.H. Modeling Lake Michigan Nearshore Carbon and Phosphorus Dynamics. Ph.D. Thesis, The University of Wisconsin-Milwaukee, Milwaukee, WI, USA, 2015. [Google Scholar]
- Rowe, M.D.; Anderson, E.J.; Vanderploeg, H.A.; Pothoven, S.A.; Elgin, A.K.; Wang, J.; Yousef, F. Influence of invasive quagga mussels, phosphorus loads, and climate on spatial and temporal patterns of productivity in Lake Michigan: A biophysical modeling study. Limnol. Oceanogr. 2017, 62, 2629–2649. [Google Scholar] [CrossRef]
- Bravo, H.R.; Bootsma, H.; Khazaei, B. Fate of phosphorus from a point source in the Lake Michigan nearshore zone. J. Great Lakes Res. 2019, 45, 1182–1196. [Google Scholar] [CrossRef]
- Shen, C.; Liao, Q.; Bootsma, H.A. Modelling the influence of invasive mussels on phosphorus cycling in Lake Michigan. Ecol. Model. 2020, 416, 108920. [Google Scholar] [CrossRef]
- Chapra, S.C.; Flynn, K.F.; Rutherford, J.C. Parsimonious model for assessing nutrient impacts on periphyton-dominated streams. J. Environ. Eng. 2014, 140, 04014014. [Google Scholar] [CrossRef]
- Chapra, S.C. Surface Water-Quality Modeling; Waveland Press: Long Grove, IL, USA, 2008. [Google Scholar]
- Liu, L.; Phanikumar, M.S.; Molloy, S.L.; Whitman, R.L.; Shively, D.A.; Nevers, M.B.; Schwab, D.J.; Rose, J.B. Modeling the transport and inactivation of E. coli and enterococci in the near-shore region of Lake Michigan. Environ. Sci. Technol. 2006, 40, 5022–5028. [Google Scholar] [CrossRef]
- Pauer, J.J.; Anstead, A.M.; Melendez, W.; Rossmann, R.; Taunt, K.W.; Kreis, R.G. The Lake Michigan eutrophication model, LM3-Eutro: Model development and calibration. Water Environ. Res. 2008, 80, 853–861. [Google Scholar] [CrossRef]
- Young, T.C.; DePinto, J.V.; Flint, S.E.; Switzenbaum, M.S.; Edzwald, J.K. Algal availability of phosphorus in municipal wastewater. J. Water Pollut. Control Fed. 1982, 54, 1505–1516. [Google Scholar] [CrossRef]
- Young, T.C.; DePinto, J.V. Algal-availability of particulate phosphorus from diffuse and point sources in the lower Great Lakes basin. In Sediment/Freshwater Interaction; Springer: Dordrecht, The Netherlands, 1982; pp. 111–119. [Google Scholar]
- Sonzogni, W.C.; Chapra, S.C.; Armstrong, D.E.; Logan, T.J. Bioavailability of phosphorus inputs to lakes. J. Environ. Qual. 1982, 11, 555–563. [Google Scholar] [CrossRef]
- Howell, E.T. Influences on water quality and abundance of Cladophora, a shore-fouling green algae, over urban shoreline in Lake Ontario. Water 2018, 10, 1569. [Google Scholar] [CrossRef] [Green Version]
- TRCA. Web Address. 2020. Available online: http://arcgis01.trca.on.ca/nswq/ (accessed on 26 January 2021).
- Howell, E.T. Cladophora (green algae) and dreissenid mussels over a nutrient loading gradient on the north shore of Lake Ontario. J. Great Lakes Res. 2018, 44, 86–104. [Google Scholar] [CrossRef]
- Wilson, K.A.; Howell, E.T.; Jackson, D.A. Replacement of zebra mussels by quagga mussels in the Canadian nearshore of Lake Ontario: The importance of substrate, Round Goby abundance, and upwelling frequency. J. Great Lakes Res. 2006, 32, 11–28. [Google Scholar] [CrossRef]
- Kuczynski, A. Toward A New Modeling Approach for Management of Nuisance Cladophora Growth in the Great Lakes. Ph.D. Thesis, Michigan Technological University, Houghton, MI, USA, 2017. [Google Scholar]
- Gilligan, K. Is Algae the New Nuisance Neighbour for the Pickering Nuclear Station? Available online: https://www.durhamregion.com/news-story/8800254-is-algae-the-new-nuisance-neighbour-for-the-pickering-nuclear-station (accessed on 26 January 2021).
- Xue, P.; Chen, C.; Ding, P.; Beardsley, R.C.; Lin, H.; Ge, J.; Kong, Y. Saltwater intrusion into the Changjiang River: A model-guided mechanism study. J. Geophys. Res. Ocean. 2009, 114. [Google Scholar] [CrossRef]
- Xue, P.; Chen, C.; Beardsley, R.C. Observing system simulation experiments of dissolved oxygen monitoring in Massachusetts Bay. J. Geophys. Res. Ocean. 2012, 117. [Google Scholar] [CrossRef] [Green Version]
- Zhao, L.; Chen, C.; Vallino, J.; Hopkinson, C.; Beardsley, R.C.; Lin, H.; Lerczak, J. Wetland-estuarine-shelf interactions in the Plum Island Sound and Merrimack River in the Massachusetts coast. J. Geophys. Res. 2010, 115, C10039. [Google Scholar] [CrossRef] [Green Version]
- Beardsley, R.C.; Chen, C.; Xu, Q. Coastal flooding in Scituate (MA): A FVCOM study of the 27 December 2010 nor’easter. J. Geophys. Res. Oceans 2013, 118, 6030–6045. [Google Scholar] [CrossRef] [Green Version]
- Anderson, E.J.; Schwab, D.J. Predicting the oscillating bi-directional exchange flow in the Straits of Mackinac. J. Great Lakes Res. 2013, 39, 663–671. [Google Scholar] [CrossRef]
- Bai, X.; Wang, J.; Schwab, D.J.; Yang, Y.; Luo, L.; Leshkevich, G.A.; Liu, S. Modeling 1993–2008 climatology of seasonal general circulation and thermal structure in the Great Lakes using FVCOM. Ocean Model. 2013, 65, 40–63. [Google Scholar] [CrossRef]
- Xue, P.; Schwab, D.J.; Hu, S. An investigation of the thermal response to meteorological forcing in a hydrodynamic model of Lake Superior. J. Geophys. Res. Oceans 2015, 120, 5233–5253. [Google Scholar] [CrossRef]
- Ye, X.; Anderson, E.J.; Chu, P.Y.; Huang, C.; Xue, P. Impact of water mixing and ice formation on the warming of Lake Superior: A model-guided mechanism study. Limnol. Oceanogr. 2019, 64, 558–574. [Google Scholar] [CrossRef]
- Chen, C.; Liu, H.; Beardsley, R.C. An unstructured grid, finite-volume, three-dimensional, primitive equations ocean model: Application to coastal ocean and estuaries. J. Atmos. Ocean. Technol. 2003, 20, 159–186. [Google Scholar] [CrossRef]
- Chen, C.; Beardsley, R.C.; Cowles, G. Finite Volume Coastal Ocean Model. Oceanography 2006, 19, 78. [Google Scholar] [CrossRef] [Green Version]
- Mellor, G.L.; Yamada, T. Development of a turbulence closure model for geophysical fluid problems. Rev. Geophys. 1982, 20, 851–875. [Google Scholar] [CrossRef] [Green Version]
- Smagorinsky, J. General circulation experiments with the primitive equations: I. The basic experiment. Mon. Weather. Rev. 1963, 91, 99–164. [Google Scholar] [CrossRef]
- Chen, C.; Ji, R.; Schwab, D.J.; Beletsky, D.; Fahnenstiel, G.L.; Jiang, M.; Johengen, T.H.; Vanderploeg, H.; Eadie, B.; Budd, J.W.; et al. A model study of the coupled biological and physical dynamics in Lake Michigan. Ecol. Model. 2002, 152, 145–168. [Google Scholar] [CrossRef] [Green Version]
- Tian, R.C.; Lermusiaux, P.F.J.; McCarthy, J.J.; Robinson, A.R. A Generalized Prognostic Model of Marine Biogeochemical-Ecosystem Dynamics: Structure, Parameterization and Adaptive Modeling. #67; Harvard Reports in Physical/Interdisciplinary Ocean Science; Harvard University: Cambridge, MA, USA, 2004; p. 60. [Google Scholar]
- Lermusiaux, P.F.J.; Evangelinos, C.; Tian, R.; Haley, P.J.; McCarthy, J.J.; Patrikalakis, N.M.; Robinson, A.R.; Schmidt, H. Adaptive Coupled Physical and Biogeochemical Ocean Predictions: A Conceptual Basis; Springer: Berlin/Heidelberg, Germany, 2004; pp. 685–692. [Google Scholar]
- Chen, C.; Beardsley, R.C.; Cowles, G.; Qi, J.; Lai, Z.; Gao, G.; Stuebe, D.; Xu, Q.; Xue1, P.; Ge, J.; et al. An Unstructured Grid, Finite-Volume Coastal Ocean Model FVCOM User Manual, 3rd ed.; Department of Fisheries Oceanography, School for Marine Science and Technology, University of Massachusetts-Dartmouth: New Bedford, MA, USA, 2011; p. 315. [Google Scholar]
- Luo, L.; Wang, J.; Schwab, D.; Vanderploeg, H.; Leshkevich, G.; Bai, X.; Hu, H.; Wang, D. Simulating the 1998 spring bloom in Lake Michigan using a coupled physical-biological model. J. Geophys. Res. Ocean. 2012, 117, C10011. [Google Scholar] [CrossRef] [Green Version]
- Rowe, M.D.; Obenour, D.R.; Nalepa, T.F.; Vanderploeg, H.A.; Yousef, F.; Kerfoot, W.C. Mapping the spatial distribution of the biomass and filter-feeding effect of invasive dreissenid mussels on the winter-spring phytoplankton bloom in Lake Michigan. Freshw. Biol. 2015, 60, 2270–2285. [Google Scholar] [CrossRef]
- Luo, L.; Wang, J.; Hunter, T.; Wang, D.; Vanderploeg, H.A. Modeling spring-summer phytoplankton bloom in Lake Michigan with and without riverine nutrient loading. Ocean Dyn. 2017, 67, 1481–1494. [Google Scholar] [CrossRef]
- Shen, C.; Liao, Q.; Bootsma, H.A.; Troy, C.D.; Cannon, D. Regulation of plankton and nutrient dynamics by profundal quagga mussels in Lake Michigan: A one-dimensional model. Hydrobiologia 2018, 815, 47–63. [Google Scholar] [CrossRef]
- Correll, D. Phosphorus: A rate limiting nutrient in surface waters. Poult. Sci. 1999, 78, 674–682. [Google Scholar] [CrossRef]
- Reynolds, C.S. The Ecology of Phytoplankton; Cambridge University Press: Cambridge, UK, 2006. [Google Scholar]
- Dijkstra, M.L.; Auer, M.T.; Kuczynski, A.; Lambert, R. Determination of bioavailable phosphorus in water samples using bioassay methods. MethodsX 2020, 7, 100807. [Google Scholar] [CrossRef] [PubMed]
- Carlson, R.E. A trophic state index for lakes1. Limnol. Oceanogr. 1977, 22, 361–369. [Google Scholar] [CrossRef] [Green Version]
- Chapra, S.C.; Dobson, H.F.H. Quantification of the lake trophic typologies of Naumann (surface quality) and Thienemann (oxygen) with special reference to the Great Lakes. J. Great Lakes Res. 1981, 7, 182–193. [Google Scholar] [CrossRef]
- Li, J.; Ianaiev, V.; Huff, A.; Zalusky, J.; Ozersky, Y.; Katsev, S. Benthic invaders control the phosphorus cycle in the world’s largest freshwater ecosystem. PNAS 2021, 118. [Google Scholar] [CrossRef] [PubMed]
- Hecky, R.E.; Smith, R.E.; Barton, D.R.; Guildford, S.J.; Taylor, W.D.; Charlton, M.N.; Howell, T. The nearshore phosphorus shunt: A consequence of ecosystem engineering by dreissenids in the Laurentian Great Lakes. Can. J. Fish. Aquat. Sci. 2004, 61, 1285–1293. [Google Scholar] [CrossRef]
- Ozersky, T.; Malkin, Y.; Barton, D.R.; Hecky, R.E. Dreissenid phosphorus excretion can sustain C. glomerata growth along a portion of Lake Ontario shoreline. J. Great Lakes Res. 2009, 35, 321–328. [Google Scholar] [CrossRef]
- Malkin, S.Y.; Bocaniov, S.A.; Smith, R.E.; Guildford, S.J.; Hecky, R.E. In situ measurements confirm the seasonal dominance of benthic algae over phytoplankton in nearshore primary production of a large lake. Freshw. Biol. 2010, 55, 2468–2483. [Google Scholar] [CrossRef]
- Depew, D.C.; Houben, A.J.; Guildford, S.J.; Hecky, R.E. Distribution of nuisance Cladophora in the lower Great Lakes: Patterns with land use, near shore water quality and dreissenid abundance. J. Great Lakes Res. 2011, 37, 656–671. [Google Scholar] [CrossRef]
- Arnott, D.L.; Vanni, M.J. Nitrogen and phosphorus recycling by the zebra mussel (Dreissena polymorpha) in the western basin of Lake Erie. Can. J. Fish. Aquat. Sci. 1996, 53, 646–659. [Google Scholar] [CrossRef]
- Bootsma, H.A.; Liao, Q. Nutrient cycling by dreissenid mussels. In Quagga and Zebra Mussels; CRC Press: Boca Raton, FL, USA, 2013; pp. 555–574. [Google Scholar] [CrossRef]
- Turner, C.B. Influence of zebra (Dreissena polymorpha) and quagga (Dreissena rostriformis) mussel invasions on benthic nutrient and oxygen dynamics. Can. J. Fish. Aquat. Sci. 2010, 67, 1899–1908. [Google Scholar] [CrossRef]
- Kuenzler, E.J. Phosphorus budget of a mussel population. Limnol. Oceanogr. 1961, 6, 400–415. [Google Scholar] [CrossRef]
- Dove, A. Environment and Climate Change Canada, Canada Centre for Inland Waters, 867 Lakeshore Road, Burlington, ON L7S 1A1, Canada). Personal Communication. 2020. [Google Scholar]
- Howell, E.T. Ontario Ministry of Environment, Conservation and Parks, 125 Resources Rd, Toronto, ON M9P 3V6, Canada). Personal Communication. 2020. [Google Scholar]
- Kuczynski, A.; Auer, M.T.; Taylor, W.D.; Bakshi, A.; Chapra, S.C. Development, calibration, and confirmation of the Great Lakes Cladophora Model v3. Ecol. Model. In Review.
- Tomlinson, L.M.; Auer, M.T.; Bootsma, H.A.; Owens, E.M. The Great Lakes Cladophora Model: Development, testing, and application to Lake Michigan. J. Great Lakes Res. 2010, 36, 287–297. [Google Scholar] [CrossRef]
- Graham, J.M.; Auer, M.T.; Canale, R.P.; Hoffmann, J.P. Ecological studies and mathematical modeling of Cladophora in Lake Huron: 4. Photosynthesis and respiration as functions of light and temperature. J. Great Lakes Res. 1982, 8, 100–111. [Google Scholar] [CrossRef]
- Droop, M. Vitamin B12 and marine ecology. IV. The kinetics of uptake, growth and inhibition in Monochrysis lutheri. J. Mar. Biol. Assoc. U.K. 1968, 48, 689–733. [Google Scholar] [CrossRef]
- Higgins, S.N.; Hecky, R.E.; Guildford, S.J. Modeling the growth, biomass, and tissue phosphorus concentration of Cladophora glomerata in eastern Lake Erie: Model description and field testing. J. Great Lakes Res. 2005, 31, 439–455. [Google Scholar] [CrossRef]
- CH2M. Duffin Creek WPCP Phosphorus Reduction Action Plan Study: Final Report; CH2M: Toronto, ON, Canada, 2018. [Google Scholar]
- Lambert, R.S.; Auer, M.T.; Effler, S.W.; Greene, M.R.; Downer, B.E.; Kuczynski, A. Onondaga to Ontario: Management of bioavailable phosphorus in municipal wastewaters for control of Cladophora. J. Great Lakes Res. 2015, 41, 1106–1113. [Google Scholar] [CrossRef]
- Auer, M.T.; Xue, P.; Kuczynski, A. The Phosphorus—Cladophora Dynamic in Lake Ontario: Management of the Duffin Creek WPCP Discharge. Final Project Report. Town of Ajax, Ajax, ON Canada; 2018, p. 68.
- Canale, R.P.; Auer, M.T.; Matsuoka, Y.; Heidtke, T.M.; Wright, S.J. Optimal cost control strategies for attached algae. J. Environ. Eng. 1983, 109, 1225–1242. [Google Scholar] [CrossRef]
- Canale, R.P.; Auer, M.T. Ecological studies and mathematical modeling of Cladophora in Lake Huron: 7. Model verification and system response. J. Great Lakes Res. 1982, 8, 134–143. [Google Scholar] [CrossRef]
- Auer, M.T.; Tomlinson, L.M.; Higgins, S.N.; Malkin, S.Y.; Howell, E.T.; Bootsma, H.A. Great Lakes Cladophora in the 21st century: Same algae—different ecosystem. J. Great Lakes Res. 2010, 36, 248–255. [Google Scholar] [CrossRef]
- Dayton, A.I.; Auer, M.T.; Atkinson, J.F. Cladophora, mass transport, and the nearshore phosphorus shunt. J. Great Lakes Res. 2014, 40, 790–799. [Google Scholar] [CrossRef]
- Kuczynski, A. From Whole-Lake to Local-Source Driven Nuisance Cladophora Growth: Implications for a Shift in Modeling and Phosphorus Management in the Great Lakes. Unpublished, manuscript in preparation.
- Brooks, C.; Grimm, A.; Shuchman, R.; Sayers, M.; Jessee, N. A satellite-based multi-temporal assessment of the extent of nuisance Cladophora and related submerged aquatic vegetation for the Laurentian Great Lakes. Remote Sens. Environ. 2015, 157, 58–71. [Google Scholar] [CrossRef]
- Ministry of the Environment (MOE). Water Management Policies, Guidelines and Provincial Water Quality Objectives of the Ministry of Environment and Energy; Queen’s Printer for Ontario: Toronto, ON, Canada, 1994; p. 19, (Plus Appendices). [Google Scholar]
- CH2M. Class Environmental Assessment to Environmental Study to Address Outfall Capacity Limitations at the Duffin Creek Water Pollution Control Plant; CH2MHill: Toronto, ON, Canada, 2013. [Google Scholar]
- Bootsma, H.A.; Rowe, M.D.; Brooks, C.N.; Vanderploeg, H.A. Commentary: The need for model development related to Cladophora and nutrient management in Lake Michigan. J. Great Lakes Res. 2015, 41, 7–15. [Google Scholar] [CrossRef]
- York Region 2020. Available online: https://www.york.ca/wps/portal/yorkhome/environment/yr/waterandwastewater/duffincreekwastewatertreatmentfacility/duffincreekwastwatertreatmentfacility/!ut/p/z1/zZPfb9owEMf_lj7wGHxxEmL2lmaUJAVCtVJIXqr8cELaxKbGwNhfP8MqTROFduoizS_Wnb53vvucD8VogWKWbKsykRVnSa3sKO49-s7Q97xbCEKTuOBA6ATYJjCwDDQ_CuDMcQDFH4m_IIgvp39AMYpXWZWjqMBWAmlONINafc3ERaqlBPc1moOZ5jTpmVl6UGdMruQSRXvxmHEmKZMd2HPxrIy1rOTm6FjyhnaAsm0lOGuOrl0iqUhYvkvWkh6NDuSboqhYJih9_u2WgibyEFMkWVVXcn-ie1uGgvdoqXFgMXbHpeo5kUutYgVHi9PC0OJjhZ3ozslQVD29vMSOondA9l2ixf-Hb36YrgKIsdnzdBcC0O0--DcT9_5ujDE8wInAC4kS2FPrK_F0uMWvggsfTs2orHn6azcclhpEDUPQggoquhuh3EspV-svHVAt73bdkvOypt2MNx14K2TJ1wrmn0oUqa2wz30EfQhovq3oDs0YF42q5NtfLoEHry_YxHU8ZwhTuJ_ZcDewTdIbjacj-7MvvNMAbje93m56o9X0pF325N_ACXxwdUelHxoDAxzsu-TaCMjkpt3RknbZh-2yD9uFE34WzqqZzRpiWHVJZN9_surtqBgPDDMKtj-uJ9rlq7y6-gm9cG4l/dz/d5/L2dBISEvZ0FBIS9nQSEh/#.YBcFHDFKipo (accessed on 26 January 2021).
- York Region 2020. Available online: https://www.york.ca/wps/portal/yorkhome/yorkregion/yr/regionalofficialplan/!ut/p/z1/tVJLc5swGPwtOXDE-pAM0vSm0NSAnx3HteGSASoeLSCCFVP311eOc-lMYreToItG36xWu6tFEdqhqIkPZR6rUjZxpc9h5Dz4fOJ73hSC5Zi5wGHJA0wZsClF22cAvLE4oOhf7l8ARJfpv6EIRW1afkeh4zgEbHBMxmxmjp2MmEkWC5OmTNAY49Si6QmdNqpVBQqP3UMqGyUaZcBRdj_1Ya9K9fQ8KGQtzuNO5DoLA857XMksK9MyrtoqblBwzZ8OEHdzd55rlbEqzLLJJNq9yqWh5Y_Hx4hriSddvxTafYTG7cm0Vonx2PEsFwLwlgz8L3Rlf2aeBa59BTDFL4AL_6CDyCuZnCvDm4Qw7bgTmehEN3rq9LhQqt1_MsCAvu9HuZR5JUaprA147Uoh99r-30gU6rLQN9NeW2h7KEWPNo3saq1k_Z_d8ODlBcpc7vEJrOB-Q-HrHR0zZzZfzeh7X7higA5Kj_Gw9Paw9MOG43_M1wY-uBbX9BNyR4Bj32W3JGCLBQyrngxKz4dtDh82HP7e5rT1ZlMzYleHWbb2zSg5kt-3C3PiJqy_z-qLW8hvbv4ALuolOQ!!/dz/d5/L2dBISEvZ0FBIS9nQSEh/ (accessed on 26 January 2021).
- Durham Region 2020. Available online: https://www.durham.ca/en/doing-business/envision-durham.aspx (accessed on 26 January 2021).
- Arron, G.P.; Camacho, F. Development of the Algae Run Assessment (Predictive) Tool at Pickering Nuclear; Kineretics Inc.: Toronto, ON, Canada, 2007; 54p. [Google Scholar]
- Makarewicz, J.C.; Booty, W.G.; Bowen, G.S. Tributary phosphorus loading to Lake Ontario. J. Great Lakes Res. 2012, 38, 14–20. [Google Scholar] [CrossRef]
Figure 1.
Study site and modeling domain along the Lake Ontario nearshore, centered on Pickering, Ajax and Whitby ON. Triangles identify the location of in-lake wastewater treatment plant discharges. Tributary entry to Lake Ontario is indicated as T1 (Rouge River), T2 (Duffins Creek) and T3 (Carruthers Creek). The solid line represents the 20 m depth contour, the approximate offshore limit to colonization by Cladophora. The inset includes the position of the study site model grid within the whole-lake grid used in hydrodynamic simulations. The locations of the Regional Municipalities of York and Durham, containing the area served by the Duffin Creek wastewater treatment plant are indicated in the inset as well.

Figure 2.
Impacts of nuisance growth of Cladophora: (a) beach deposition at Veterans Point, Ajax, ON (image by Paul Wealleans) and (b) algal debris captured at the cooling water intake for the Ontario Power Generation (OPG) Pickering Nuclear Generating Station (image by Long Vu, OPG).
Figure 2.
Impacts of nuisance growth of Cladophora: (a) beach deposition at Veterans Point, Ajax, ON (image by Paul Wealleans) and (b) algal debris captured at the cooling water intake for the Ontario Power Generation (OPG) Pickering Nuclear Generating Station (image by Long Vu, OPG).

Figure 3.
The modeling platform utilized in this work illustrating the three component modules (hydrodynamics, biokinetics and Cladophora nutritional status) and their inputs, outputs and interactions.
Figure 3.
The modeling platform utilized in this work illustrating the three component modules (hydrodynamics, biokinetics and Cladophora nutritional status) and their inputs, outputs and interactions.

Figure 4.
Performance testing of the hydrodynamic model (FVCOM): (a) daily averaged longshore current velocity at 5 m; positive values are W→E and negative values E→W, (b) cross-shore current; positive values are onshore, N, and negative values are offshore, S and (c) surface temperature measured at National Data Buoy Center (NDBC) Buoy 45159 (Supplementary Material, Figure S1).

Figure 5.
Conceptualization of the phosphorus–phytoplankton dynamics (GEM) model as applied (a) by Rowe et al. [29] and (b) in this work.
Figure 5.
Conceptualization of the phosphorus–phytoplankton dynamics (GEM) model as applied (a) by Rowe et al. [29] and (b) in this work.

Figure 6.
Determination of boundary conditions: (a) soluble reactive phosphorus and (b) chlorophyll; with bars representing the standard deviation of the mean daily value.
Figure 6.
Determination of boundary conditions: (a) soluble reactive phosphorus and (b) chlorophyll; with bars representing the standard deviation of the mean daily value.

Figure 7.
GLCMv3 model fit to field measurements made at a depth of 6m at the Lake Ontario study site in 2020. Dots are the mean of triplicate measurements and bars represent the standard deviation for those means for each sampling date. Data used with permission of Ontario Power Generation, Inc.
Figure 7.
GLCMv3 model fit to field measurements made at a depth of 6m at the Lake Ontario study site in 2020. Dots are the mean of triplicate measurements and bars represent the standard deviation for those means for each sampling date. Data used with permission of Ontario Power Generation, Inc.

Figure 8.
Results of model performance testing for soluble reactive phosphorus concentrations in 2016: (a) surface water and (b) bottom water. Diamonds represent observed median concentrations with the 25th and 75th percentiles indicated by bars. Dashed line represents daily median modeled concentrations with the 25th and 75th percentiles for each daily median shaded in gray.

Figure 9.
Results of model performance testing for surface water chlorophyll. Circles represent 2016 observed concentrations and the dashed line represents 2016 median modeled concentrations. The gray shaded area represents the 25th and 75th percentiles for daily observations over the (expanded) 2012–2016 interval, included to reflect observed interannual variability.

Figure 10.
Management metric for the phosphorus–Cladophora dynamic: the relationship between ambient soluble reactive phosphorus concentration and normalized seasonal maximum Cladophora biomass, illustrating the departure from P-limited growth as concentrations exceed an upper bound of 1.5 μgP⋅L−1.
Figure 10.
Management metric for the phosphorus–Cladophora dynamic: the relationship between ambient soluble reactive phosphorus concentration and normalized seasonal maximum Cladophora biomass, illustrating the departure from P-limited growth as concentrations exceed an upper bound of 1.5 μgP⋅L−1.

Figure 11.
Model-simulated SRP concentrations with the Duffin Creek WWTP as a sole-source discharge at contemporary levels of phosphorus removal and flow: (a) for bottom water at a station proximate to the wastewater treatment plant (WWTP) outfall and at stations to the east and west. Station depths are >5 and <10 m; the red line represents the metric for P-limited growth (1.5 μgP⋅L−1) and (b) vertical profiles at the station most proximate to the Duffin Creek WWTP outfall. Profiles presented left to right are not a progressive time series, but are ordered to systematically illustrate variability in the position and magnitude of the plume as mediated by the vertical density gradient and turbulence.

Figure 12.
Simulations of the bottom water SRP footprint for (a) the Highland Creek WWTP, (b) the Duffin Creek WWTP and (c) the Corbett Creek WWTP as sole-source discharges with contemporary treatment levels and flows and (d) the resulting multiple source discharge. The green line represents the maximum lakeward extent of Cladophora colonization (to the 20 m depth).

Figure 13.
Sole-source simulation of the bottom water SRP footprint for the Duffin Creek WWTP under contemporary treatment (Baseline; panels (a,b)) and two engineered treatment options (Optimized 2°, panels (c,d) and Tertiary, panels (e,f)), each for contemporary and maximum permitted design flow.
Figure 13.
Sole-source simulation of the bottom water SRP footprint for the Duffin Creek WWTP under contemporary treatment (Baseline; panels (a,b)) and two engineered treatment options (Optimized 2°, panels (c,d) and Tertiary, panels (e,f)), each for contemporary and maximum permitted design flow.

Figure 14.
Model-simulated, multiple-source, bottom water SRP footprint for the Pickering–Ajax–Whitby nearshore receiving discharges from the Highland Creek, Duffin Creek and Corbett Creek WWTPs before and after implementation of tertiary treatment at the Duffin Creek WWTP: (a) pre-implementation, contemporary flow, (b) post-implementation contemporary flow and (c) post implementation maximum permitted design flow.

Figure 15.
Model-simulated, multiple-source, bottom water SRP concentrations proximate to the Duffin Creek WWTP outfall and stations to the east and west. Simulations are for contemporary (baseline) treatment (black) and tertiary treatment (dark red), both with contemporary flow. Conditions are the contemporary case for discharges from the Highland Creek and Corbett Creek WWTPs. The red line represents the metric for P-limited growth (1.5 μgP⋅L−1).

Figure 16.
Model-simulated surface water SRP concentrations at a station proximate to the Duffin Creek WWTP outfall (see map inset, Figure 15). Simulations represent a multiple-source discharge with contemporary treatment and flow at the Highland Creek and Corbett Creek WWTPs and tertiary treatment and contemporary flow at the Duffin Creek WWTP (black line) and a sole-source discharge at the Duffin Creek WWTP with tertiary treatment and contemporary flow (red line). The dashed line represents the metric for P-limited growth (1.5 μgP⋅L−1).


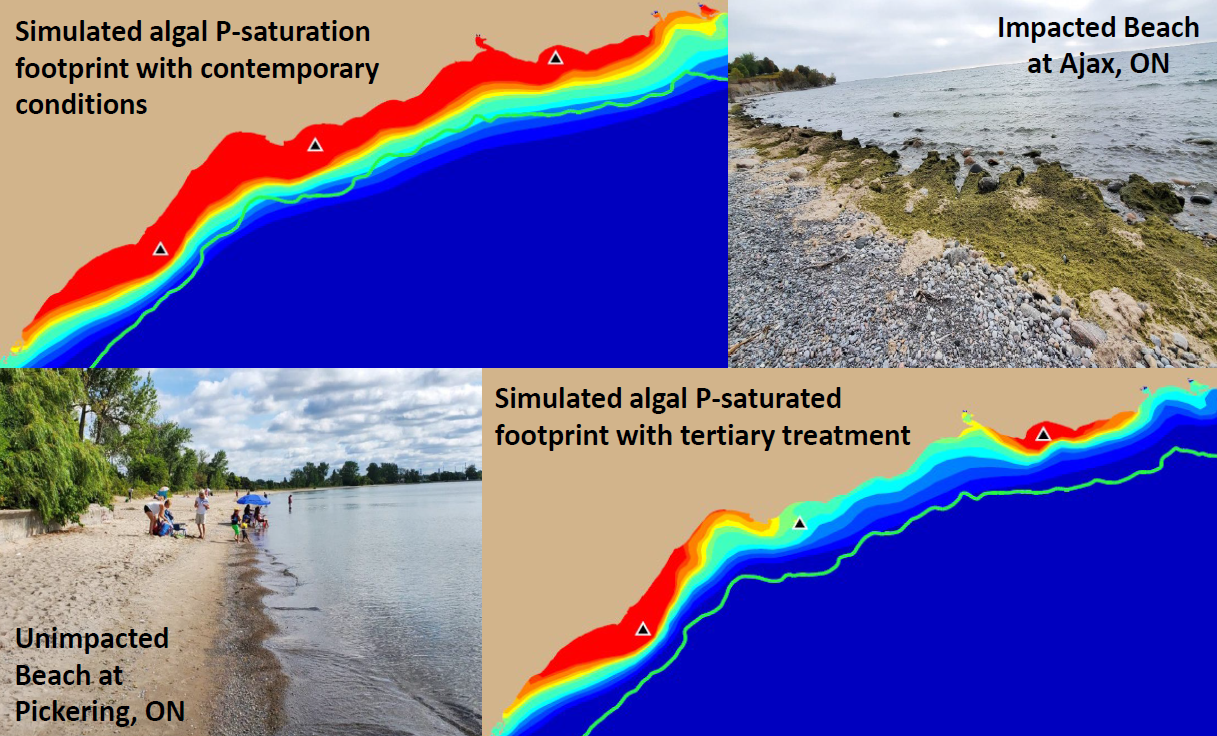
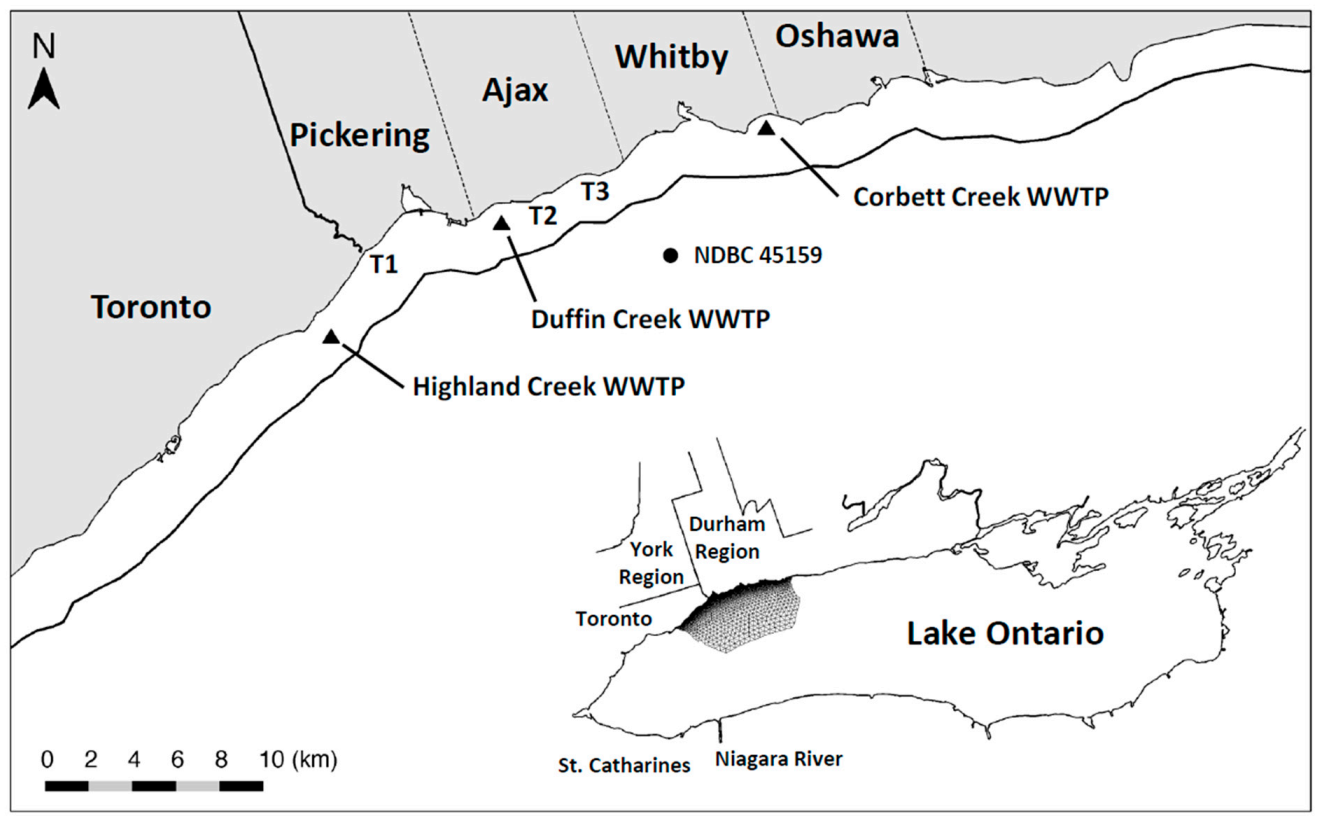
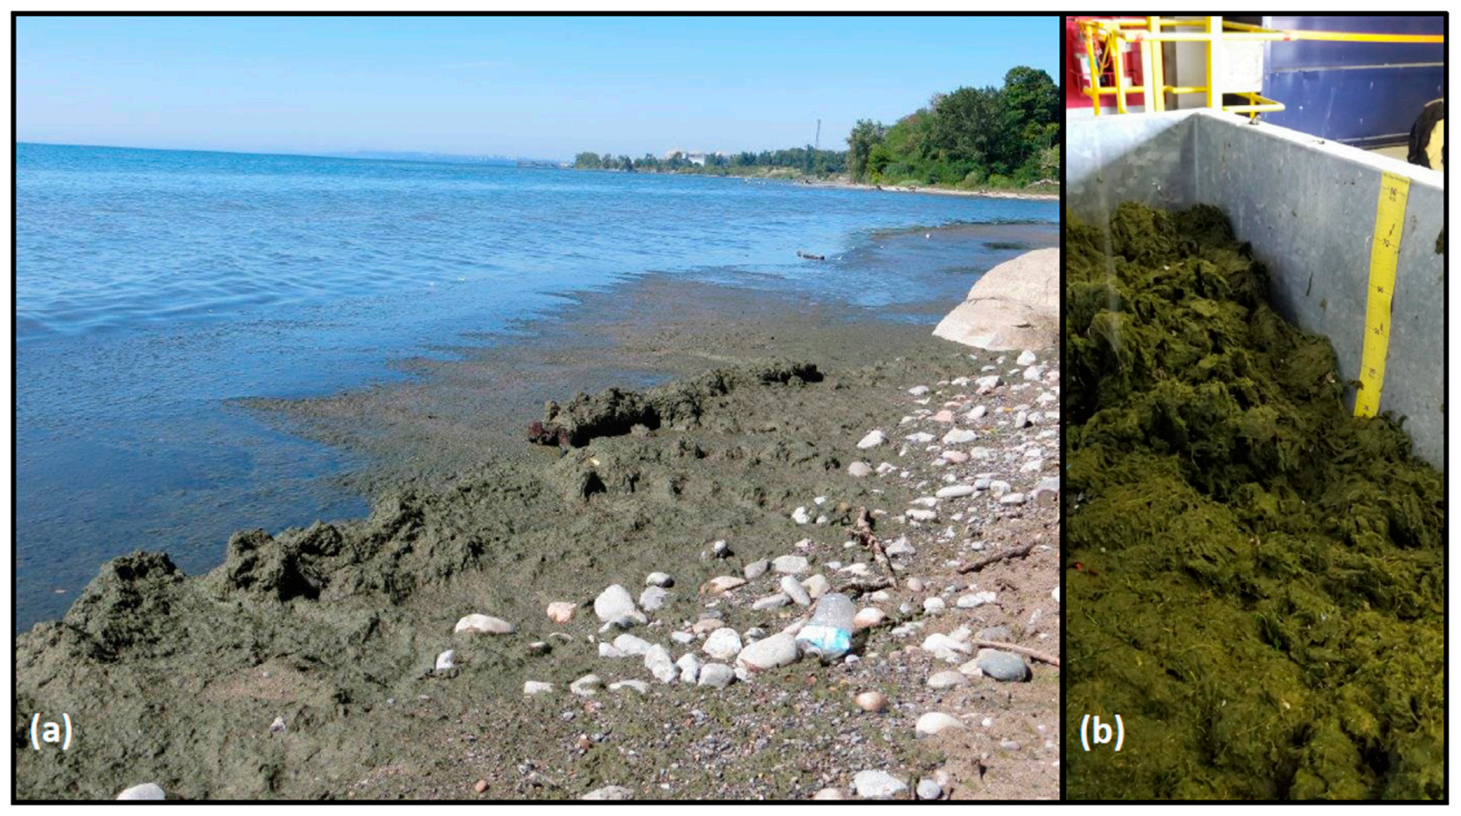
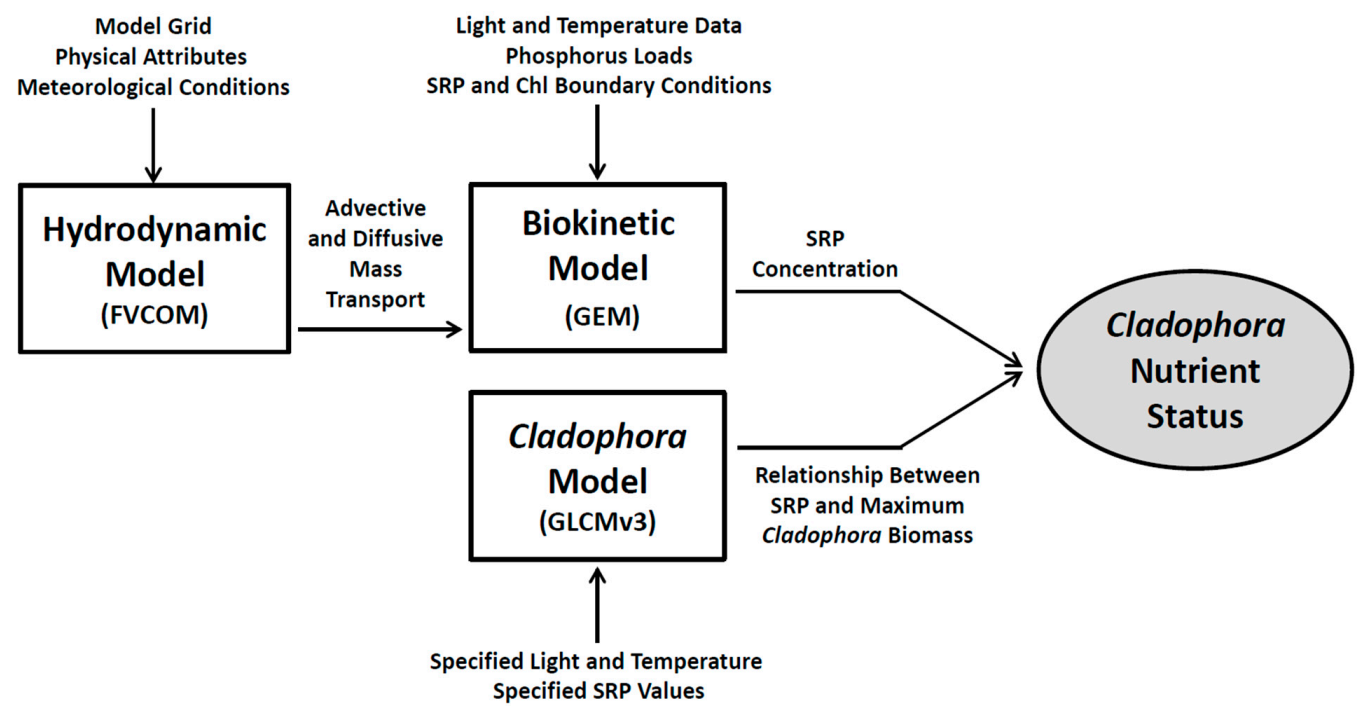
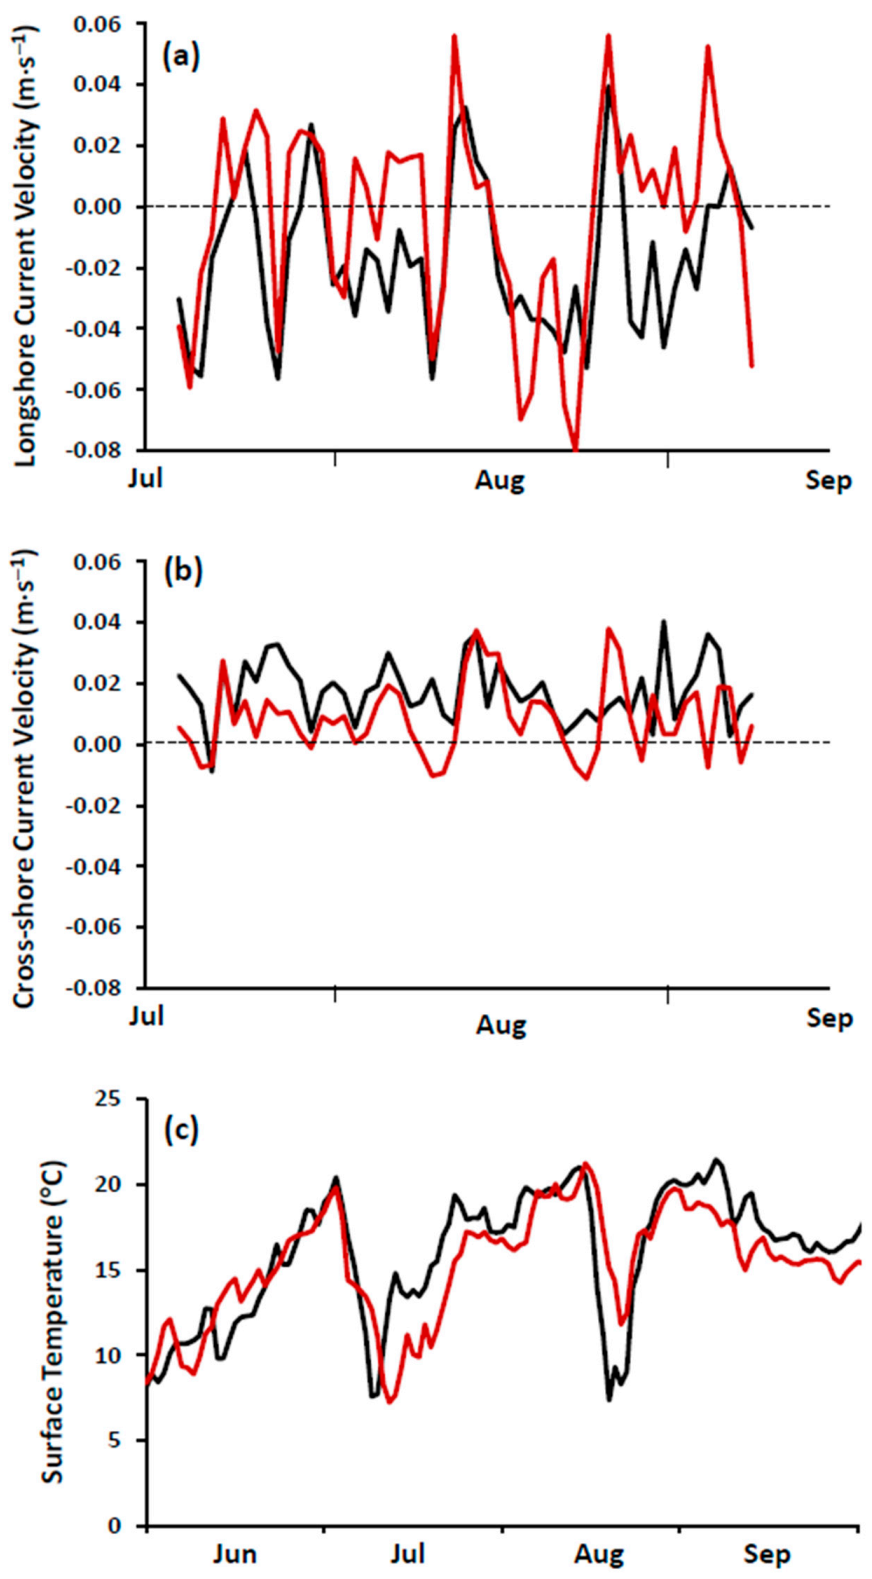
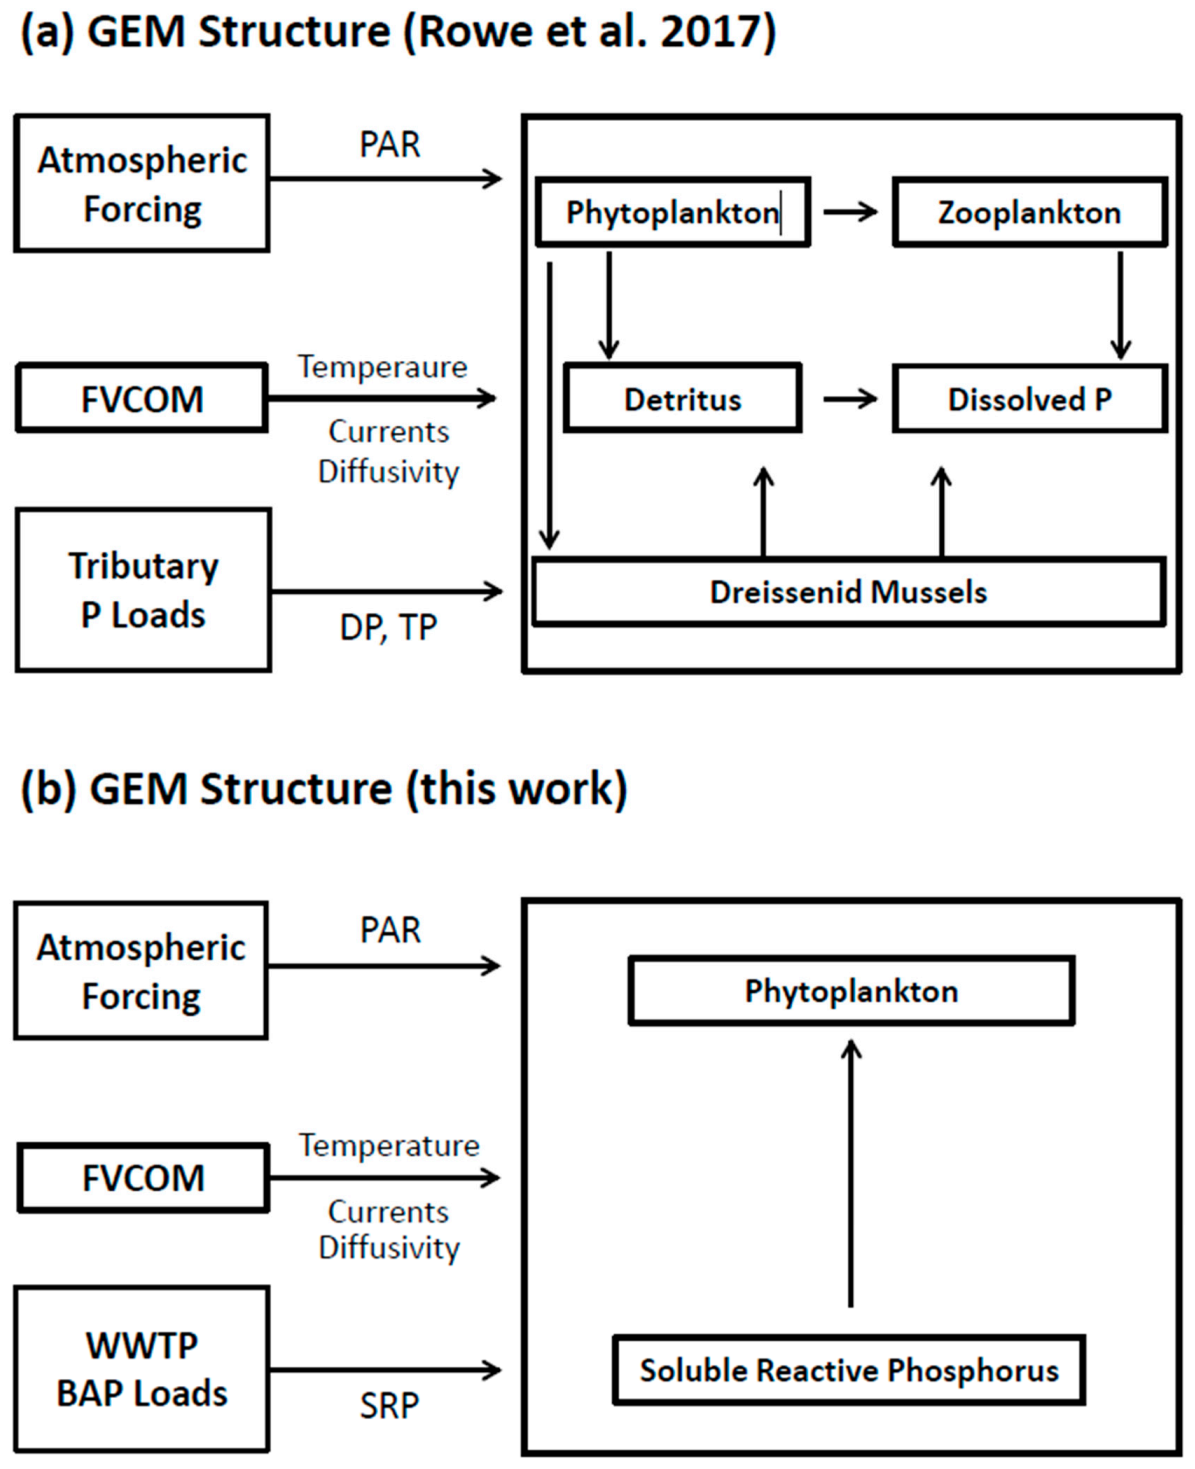
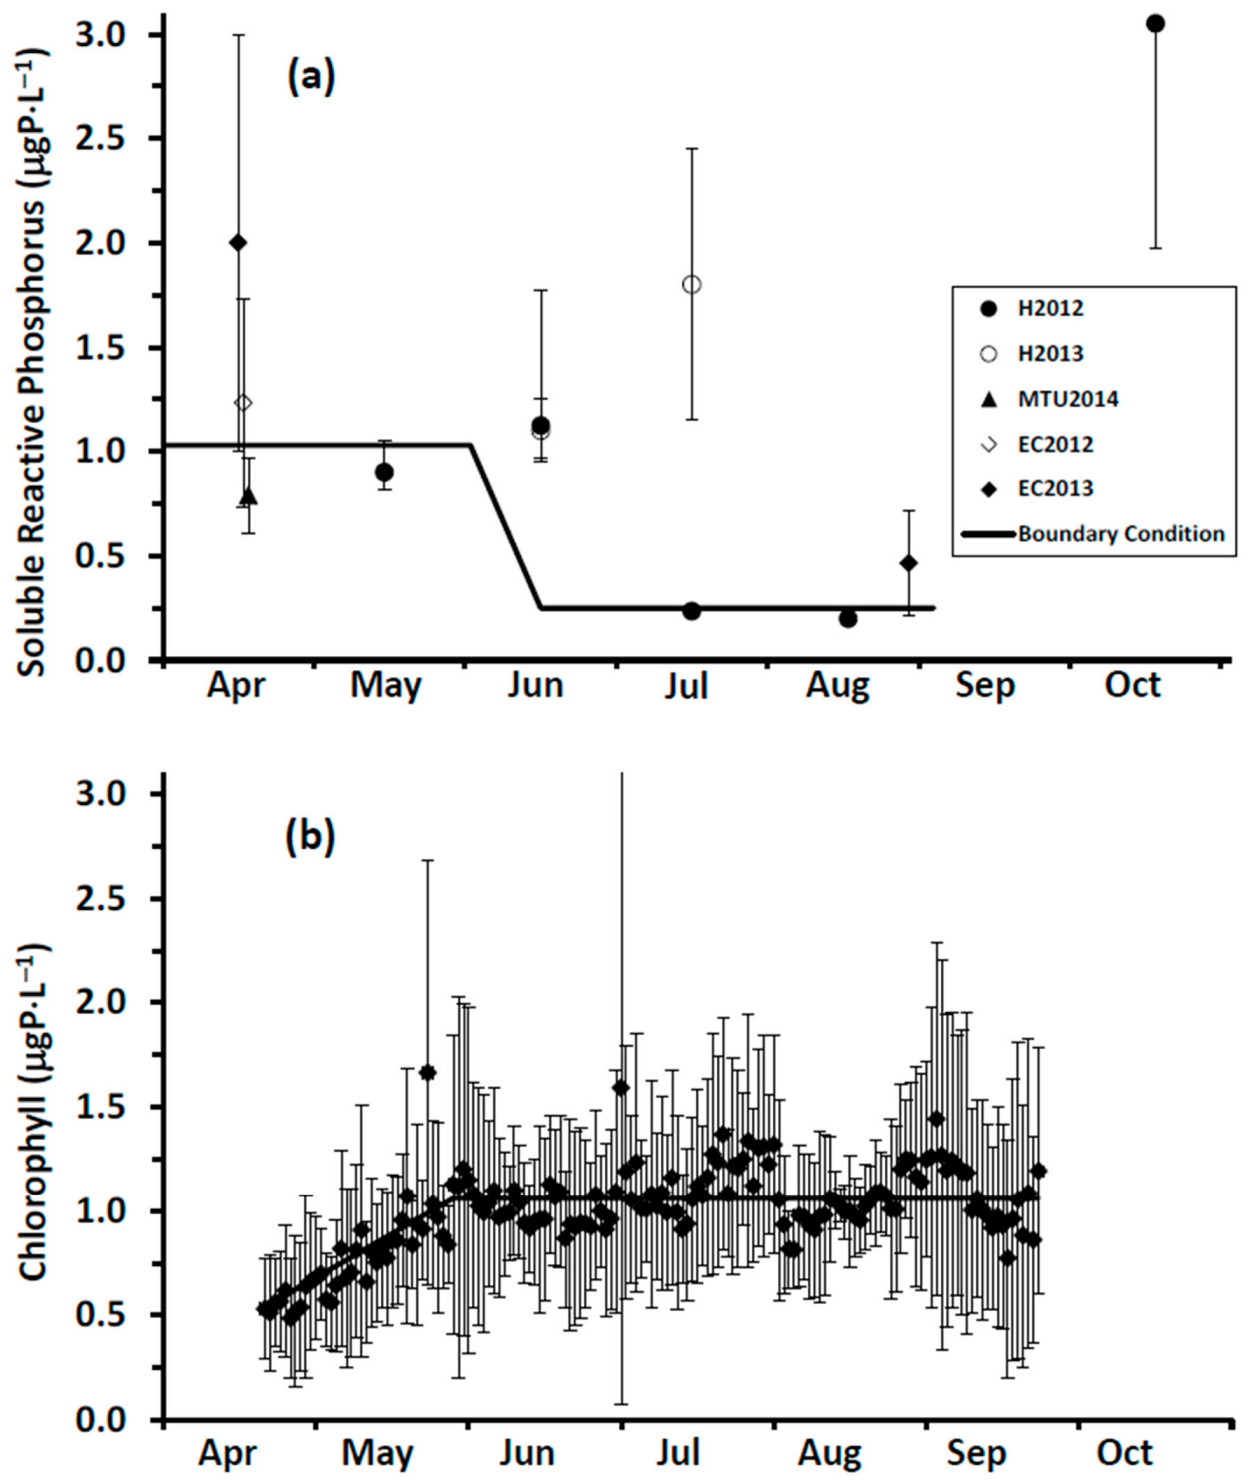
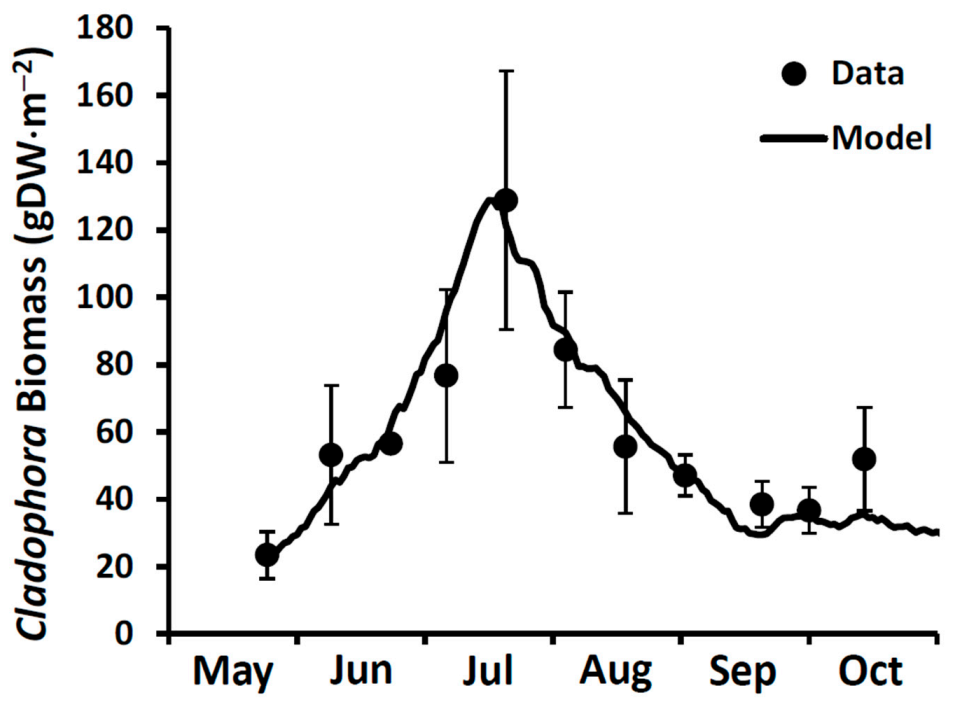
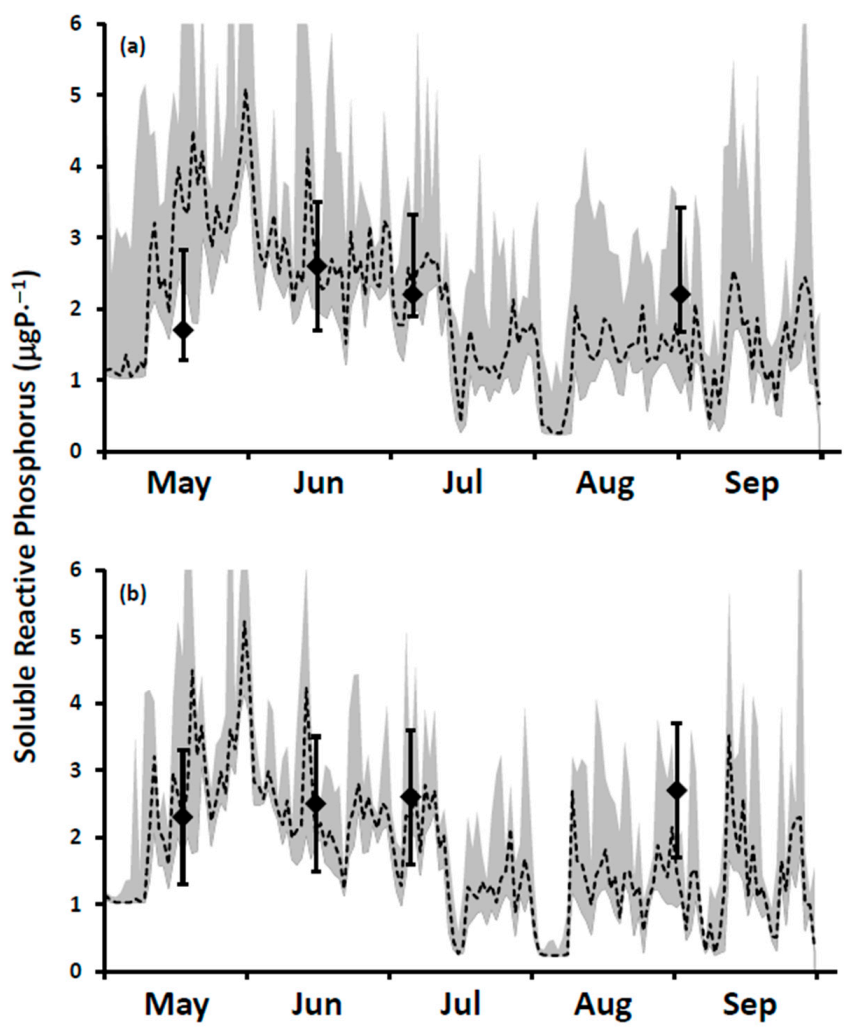
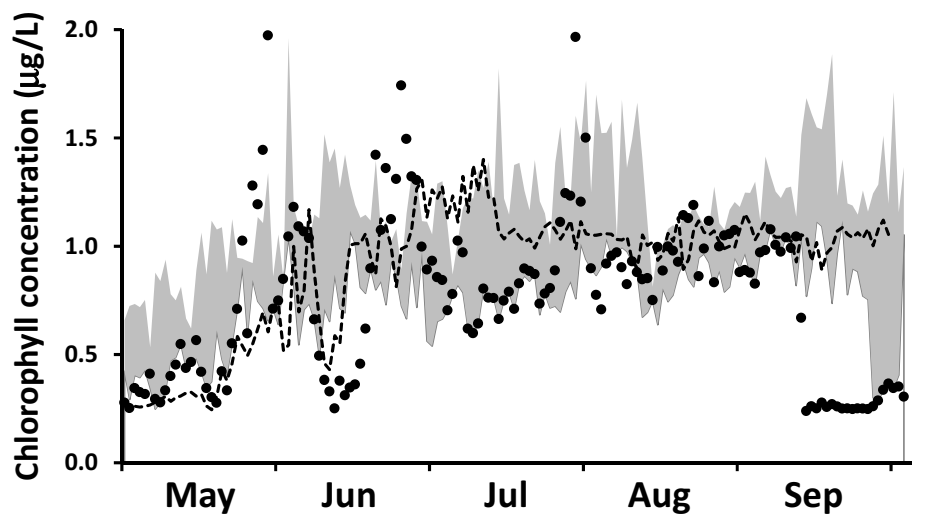
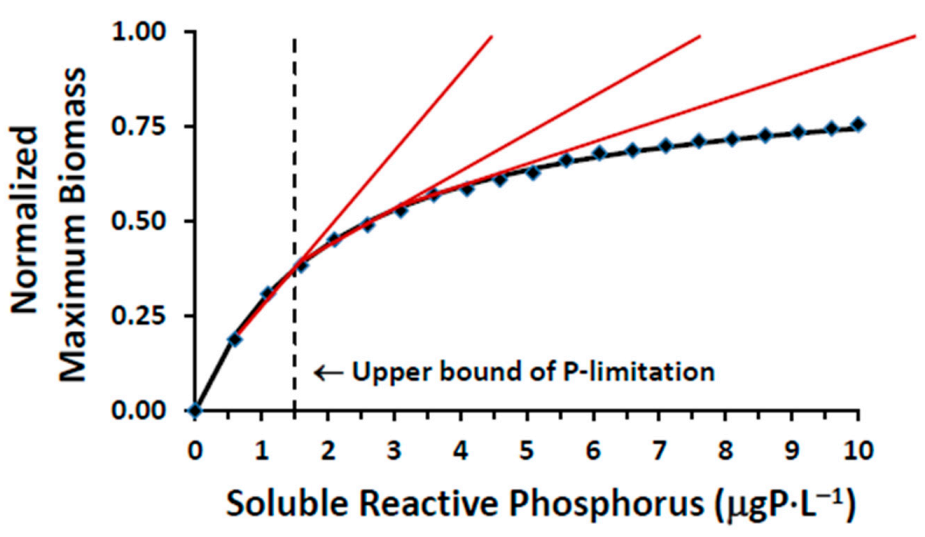
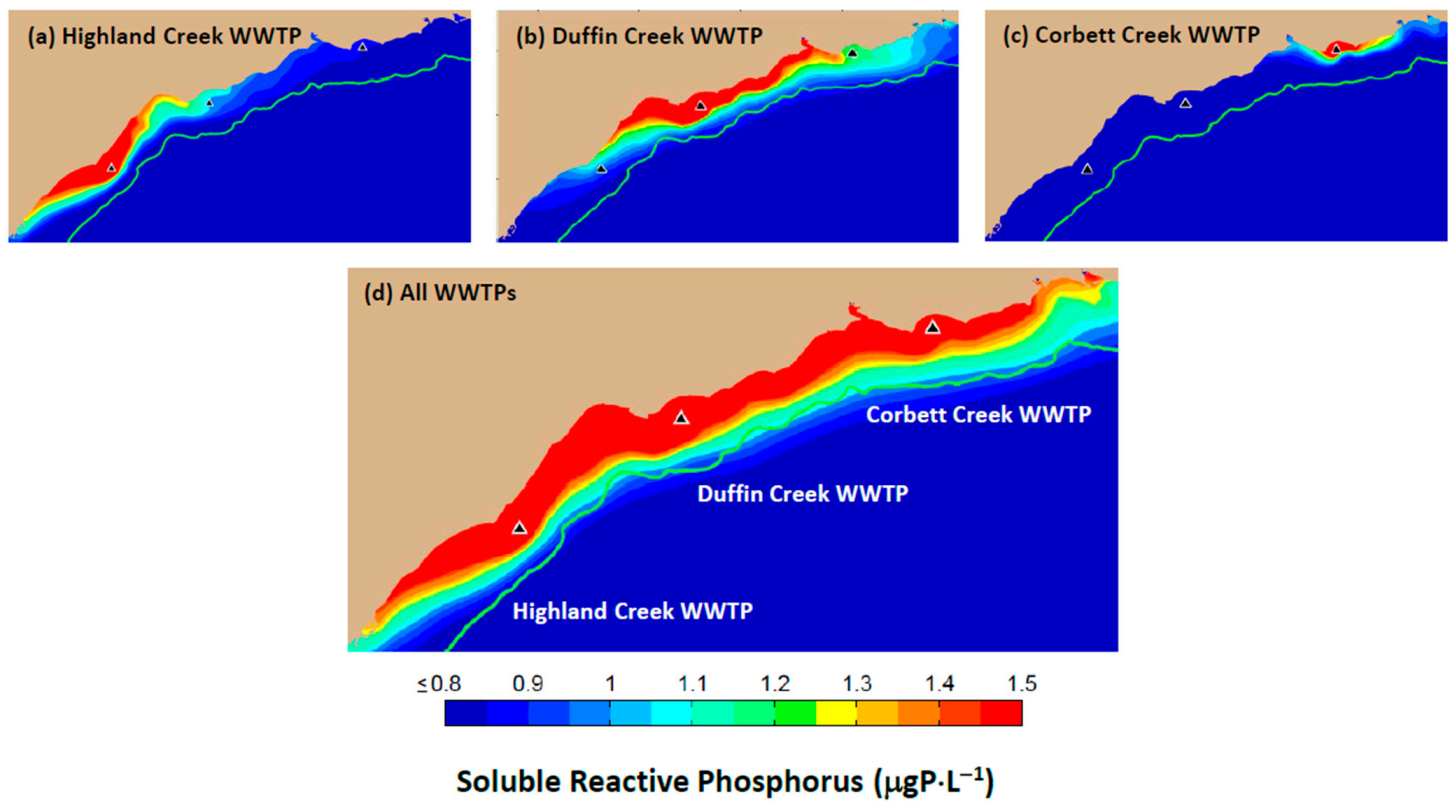
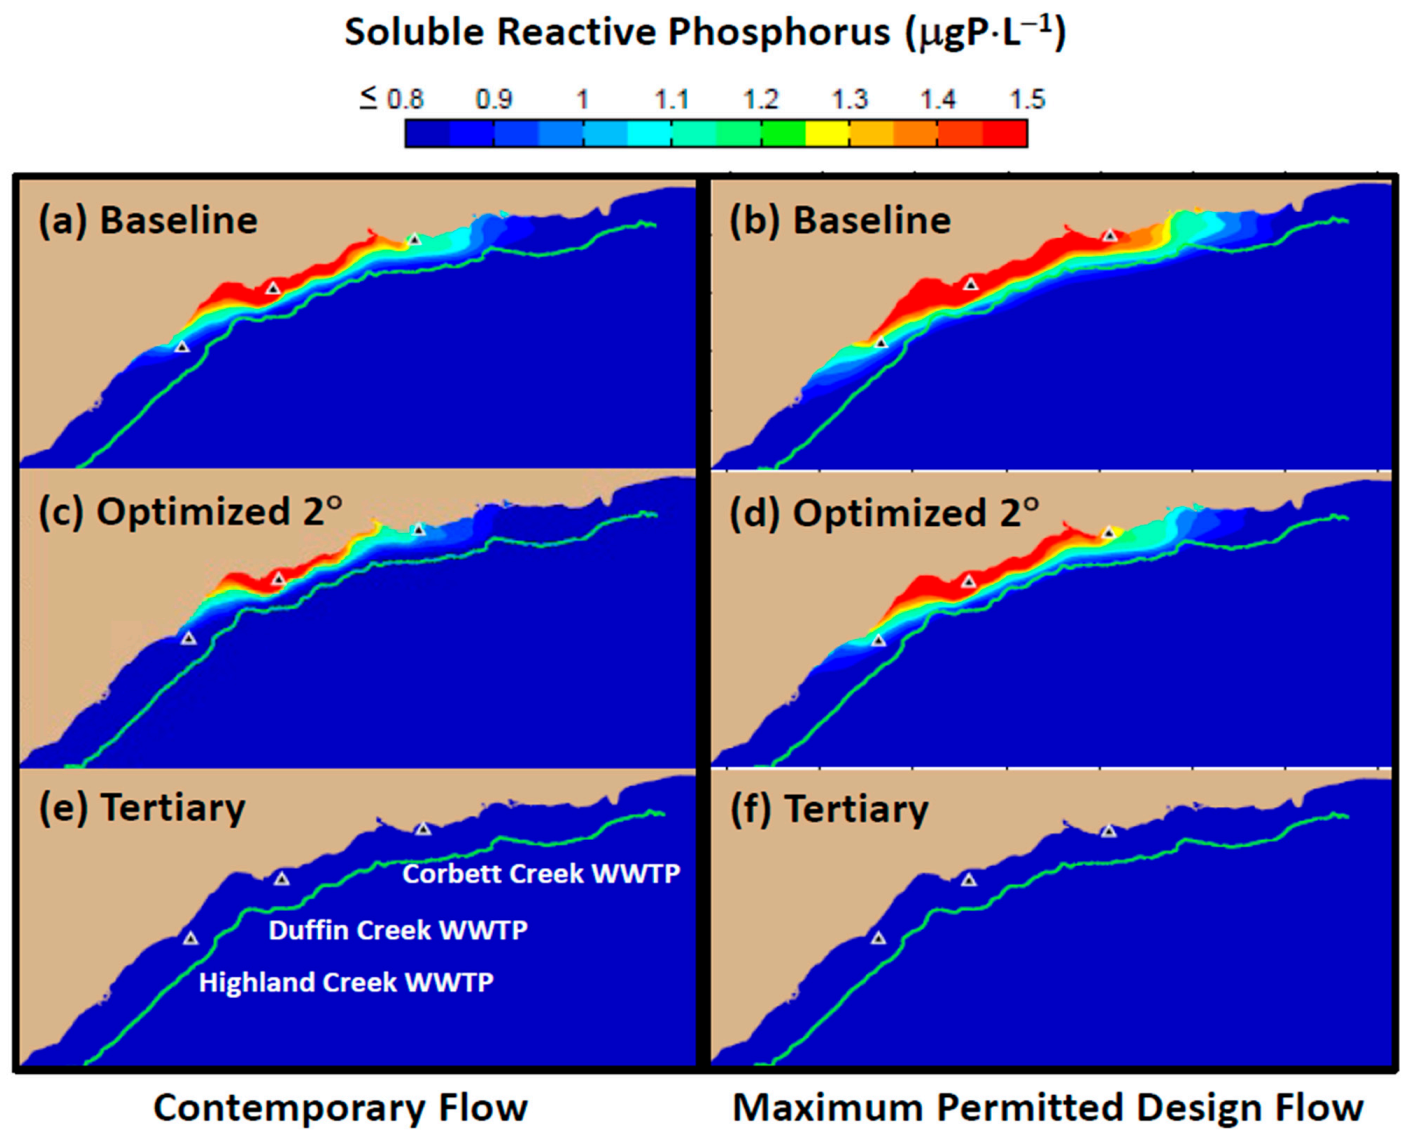
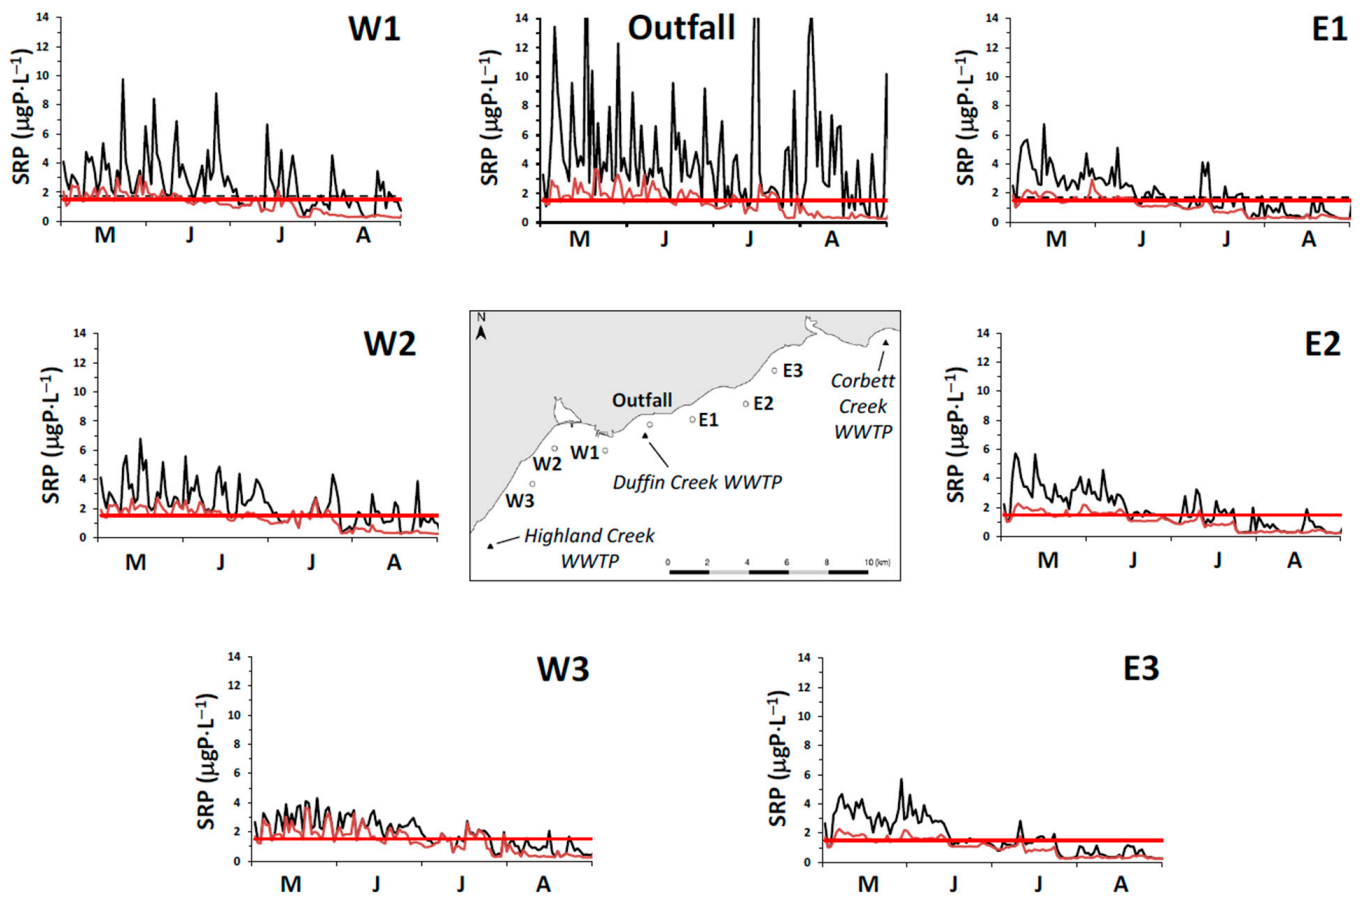
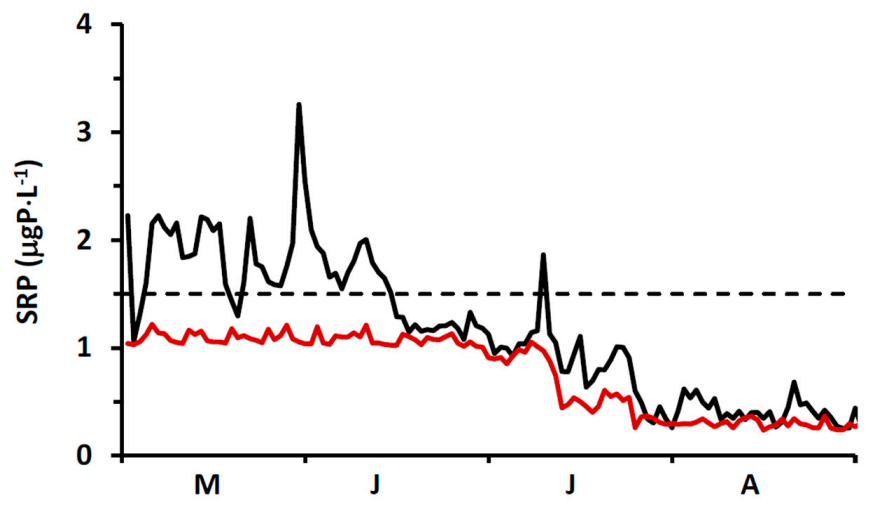
Table 1.
GEM module biolinetic coefficients.
| Parameter | Description | Units | Value |
|---|---|---|---|
| µmax | maximum specific growth rate | d−1 | 0.48 |
| aP:Chl | P to Chl ratio in phytoplankton | mgP⋅mgChl−1 | 1.32 |
| kmort | Mortality | d−1 | 0.01 |
| vs | settling velocity | m⋅d−1 | 0.10 |
| αT | temperature coefficient | °C−1 | 0.035 |
| Topt | optimal temperature for growth | °C | 25.0 |
| αI | light coefficient | mgC⋅mgChl−1⋅d−1⋅W−1 | 1.4 |
| βI | light coefficient | mgC⋅mgChl−1⋅d−1⋅W−1 | 0.003 |
| xChl:C | Chl to C ratio in phytoplankton | mgChl⋅mgC−1 | 0.019 |
| Ks | half-saturation coefficient | mgP | 2.0 |
Table 2.
Effluent characteristics and coefficients used in calculating total and bioavailable phosphorus loads.
Table 2.
Effluent characteristics and coefficients used in calculating total and bioavailable phosphorus loads.
| (a) Wastewater treatment plant bioavailable phosphorus loads (expressed here as kgP⋅d−1) for 2016 as used in testing model performance. | ||||||||
| Component | ω m3⋅d−1 | TP mgP⋅m−3 | TPbio mgP⋅m−3 | WTP kgP⋅d−1 | WTP,bio kgP⋅d−1 | |||
| Highland Creek | 163,194 | 743 | 0.577 | 121.3 | 93.9 | |||
| Duffin Creek | 315,649 | 532 | 0.413 | 167.9 | 130.4 | |||
| Corbett Creek | 46,340 | 553 | 0.429 | 25.6 | 19.9 | |||
| Total | 525,183 | 314.8 | 244.2 | |||||
| (b) Duffin Creek wastewater treatment plant bioavailable phosphorus loads (expressed here as kgP⋅d−1) for 2014 as used in examining engineered options. | ||||||||
| Component | ω m3⋅d−1 | TP mgP⋅m−3 | TPbio mgP⋅m−3 | WTP kgP⋅d−1 | WTP,bio kgP⋅d−1 | |||
| Baseline | ||||||||
| 2014 | 343,000 | 365 | 306 | 125 | 105 | |||
| Full Permit | 630,000 | 365 | 306 | 230 | 193 | |||
| Optimized 2° | ||||||||
| 2014 | 343,000 | 350 | 210 | 120 | 72 | |||
| Full Permit | 630,000 | 450 | 310 | 284 | 195 | |||
| Tertiary | ||||||||
| 2014 | 343,000 | 86 | 6 | 30 | 2 | |||
| Full Permit | 630,000 | 86 | 6 | 54 | 4 | |||
| (c) Coefficients for determination of bioavailable phosphorus load: r, the fraction of TP represented by a component and fbio, the fraction of a component that is bioavailable. | ||||||||
| Coefficient | TP | SRP | DOP | PP | ||||
| r, component ratio to TP | - | 0.60 | 0.28 | 0.12 | ||||
| fbio, component bioavailable fraction | 0.78 | 1.00 | 0.27 | 0.83 | ||||
Publisher’s Note: MDPI stays neutral with regard to jurisdictional claims in published maps and institutional affiliations. |
© 2021 by the authors. Licensee MDPI, Basel, Switzerland. This article is an open access article distributed under the terms and conditions of the Creative Commons Attribution (CC BY) license (http://creativecommons.org/licenses/by/4.0/).
Share and Cite
MDPI and ACS Style
Auer, M.T.; McDonald, C.P.; Kuczynski, A.; Huang, C.; Xue, P. Management of the Phosphorus–Cladophora Dynamic at a Site on Lake Ontario Using a Multi-Module Bioavailable P Model. Water 2021, 13, 375. https://doi.org/10.3390/w13030375
AMA Style
Auer MT, McDonald CP, Kuczynski A, Huang C, Xue P. Management of the Phosphorus–Cladophora Dynamic at a Site on Lake Ontario Using a Multi-Module Bioavailable P Model. Water. 2021; 13(3):375. https://doi.org/10.3390/w13030375
Chicago/Turabian StyleAuer, Martin T., Cory P. McDonald, Anika Kuczynski, Chenfu Huang, and Pengfei Xue. 2021. "Management of the Phosphorus–Cladophora Dynamic at a Site on Lake Ontario Using a Multi-Module Bioavailable P Model" Water 13, no. 3: 375. https://doi.org/10.3390/w13030375
Note that from the first issue of 2016, this journal uses article numbers instead of page numbers. See further details here.