1. Introduction
Urban densification [
1], climate change [
2,
3], and sewer system degradation have direct impacts on the water sector in cities. While climate change is expressed as an increase in rainfall intensity and occurrence, the urban densification and expansion results in decrease of pervious areas. This lead to a generation of massive stormwater runoff and overall change in the natural water cycle [
4]. Combined with the degradation of the existing urban drainage systems [
5], cities require management approaches, which should be the basis for resilient and sustainable urban water systems.
In the past, conventional urban stormwater management has focused on the principle of collecting and effectively transporting the runoff outside the city [
6]. This practice however, has been increasingly recognized as not appropriate and unsustainable under sustainable transformation and climate change [
7]. As an alternative, new approaches have been developed and conceptionalized in recent two decades to manage the stormwater decentrally to relive the centralized infrastructure [
8] and to restore the natural water balance [
9]. These approaches include stormwater best management practices (BMPs) [
10], blue green infrastructure (BGI) [
11], low-impact development (LID) [
12], water sensitive urban design (WSUD) [
13], and sponge city concepts (SC) [
14]. Though the frame of those concepts may vary in context and applicability, they share a common objective of using technologies—such as green (retention) roofs, vegetated swales, bio-retention cells, trench infiltration, infiltration shafts, etc.—to mitigate the storm-water runoff in urban areas. A variety of the blue-green technologies so called low-impact developments (LIDs) have been already well established especially in developed countries [
4]. Furthermore, some forerunner countries like Australia or Singapore adapted strategies to impelement the LIDs to reduce the impacts of the stormwater runoff within the cities [
15,
16]. While most of the implementation strategies focus on newly built areas [
14,
17], few address the transformation of already existing urban areas [
18,
19] towards decentralized management approach of stormwater management.
The implemented LIDs are reported in fragmented, small-scale structured case studies. Most of the results are subject to a single example of the technology or selected demonstration projects and case studies [
20]. This is mostly due to the fact that the effect of the LIDs on urban water cycle and pollution control can only be determined either through modeling or pilot studies. This makes the planning of the LIDs in an urban environment more difficult and time consuming and the results inapplicable to other regions.
Though some strategies do exist for the transformation of the already existing urban area towards dezentralized management approach of stormwater runoff, these are country and sometimes even city specific [
21,
22]. Therefore, a systematic strategy for the transformation of current urban areas towards dezentralized management approaches is needed. In addition, cities need assistance in evaluating the practical potential for transformation of their urban area to decentralized solutions.
In this aspect, a novel approach has been developed for urban areas to define the potentials of decentralized management of urban stormwater at block level through LIDs. This paper presents the so-called MUST-B approach (the Management of Urban STormwater at Block-level) for potential assessment of LIDs for already existing urban environments. The approach was developed and tested in the City of Leipzig.
2. Materials and Methods
2.1. Study Area
The new approach for potential analysis presented in this study was applied to a northern part of the city of Leipzig. The study area was defined by the characteristics of the drainage network system rather than the administration boundary. Furthermore, the selected study area, as one of the main catchment areas of the drainage network of the city, presented a variety of urban structures and degree of sealed (impervious) surfaces. The study area covers 792 ha, including residential, commercial, and recreation area such as green parks. It is estimated that the population within the study area is around 47,500 inhabitants.
2.2. Principles of the MUST-B Approach
The potential analysis of LIDs presented here allows a first estimation of the transformation capacity of existing urban area towards decentralized management of stormwater. Precisely, the MUST-B approach is used to estimate the maximum capacity of LIDs for reducing urban runoff through local measures such as infiltration and retention. The approach was based on the following concepts:
- (a)
The urban area was divided into urban blocks as smaller functional units, which enables easy planning of the LIDs as well as simple down- and up-scaling process. The traditional units, in which the urban areas are divided currently for stormwater modeling and simulations are based on the catchment of the drainage network and are rather not suitable for planning of LIDs.
- (b)
The calculation of maximum capacity of the LIDs aims at minimizing and when possible avoiding any form of runoff from and between the functional units (blocks). Ideally, a complete avoidance of the transport/export of stormwater outside the unit boundary, e.g., through existing sewer networks or new pipelines between the functional units, is to be achieved.
Based on these principal concepts, the MUST-B approach uses urban block as the smallest functional unit. An urban block is defined in this study as an inner-city built-up area, which is surrounded by traffic areas (streets, railways, and river). Based on that assumption, the traffic areas are excluded from the analysis, because they fulfill an important function in traditional urban drainage infrastructure and the infiltration of stormwater from traffic areas is subject to special restrictions due to the pollution.
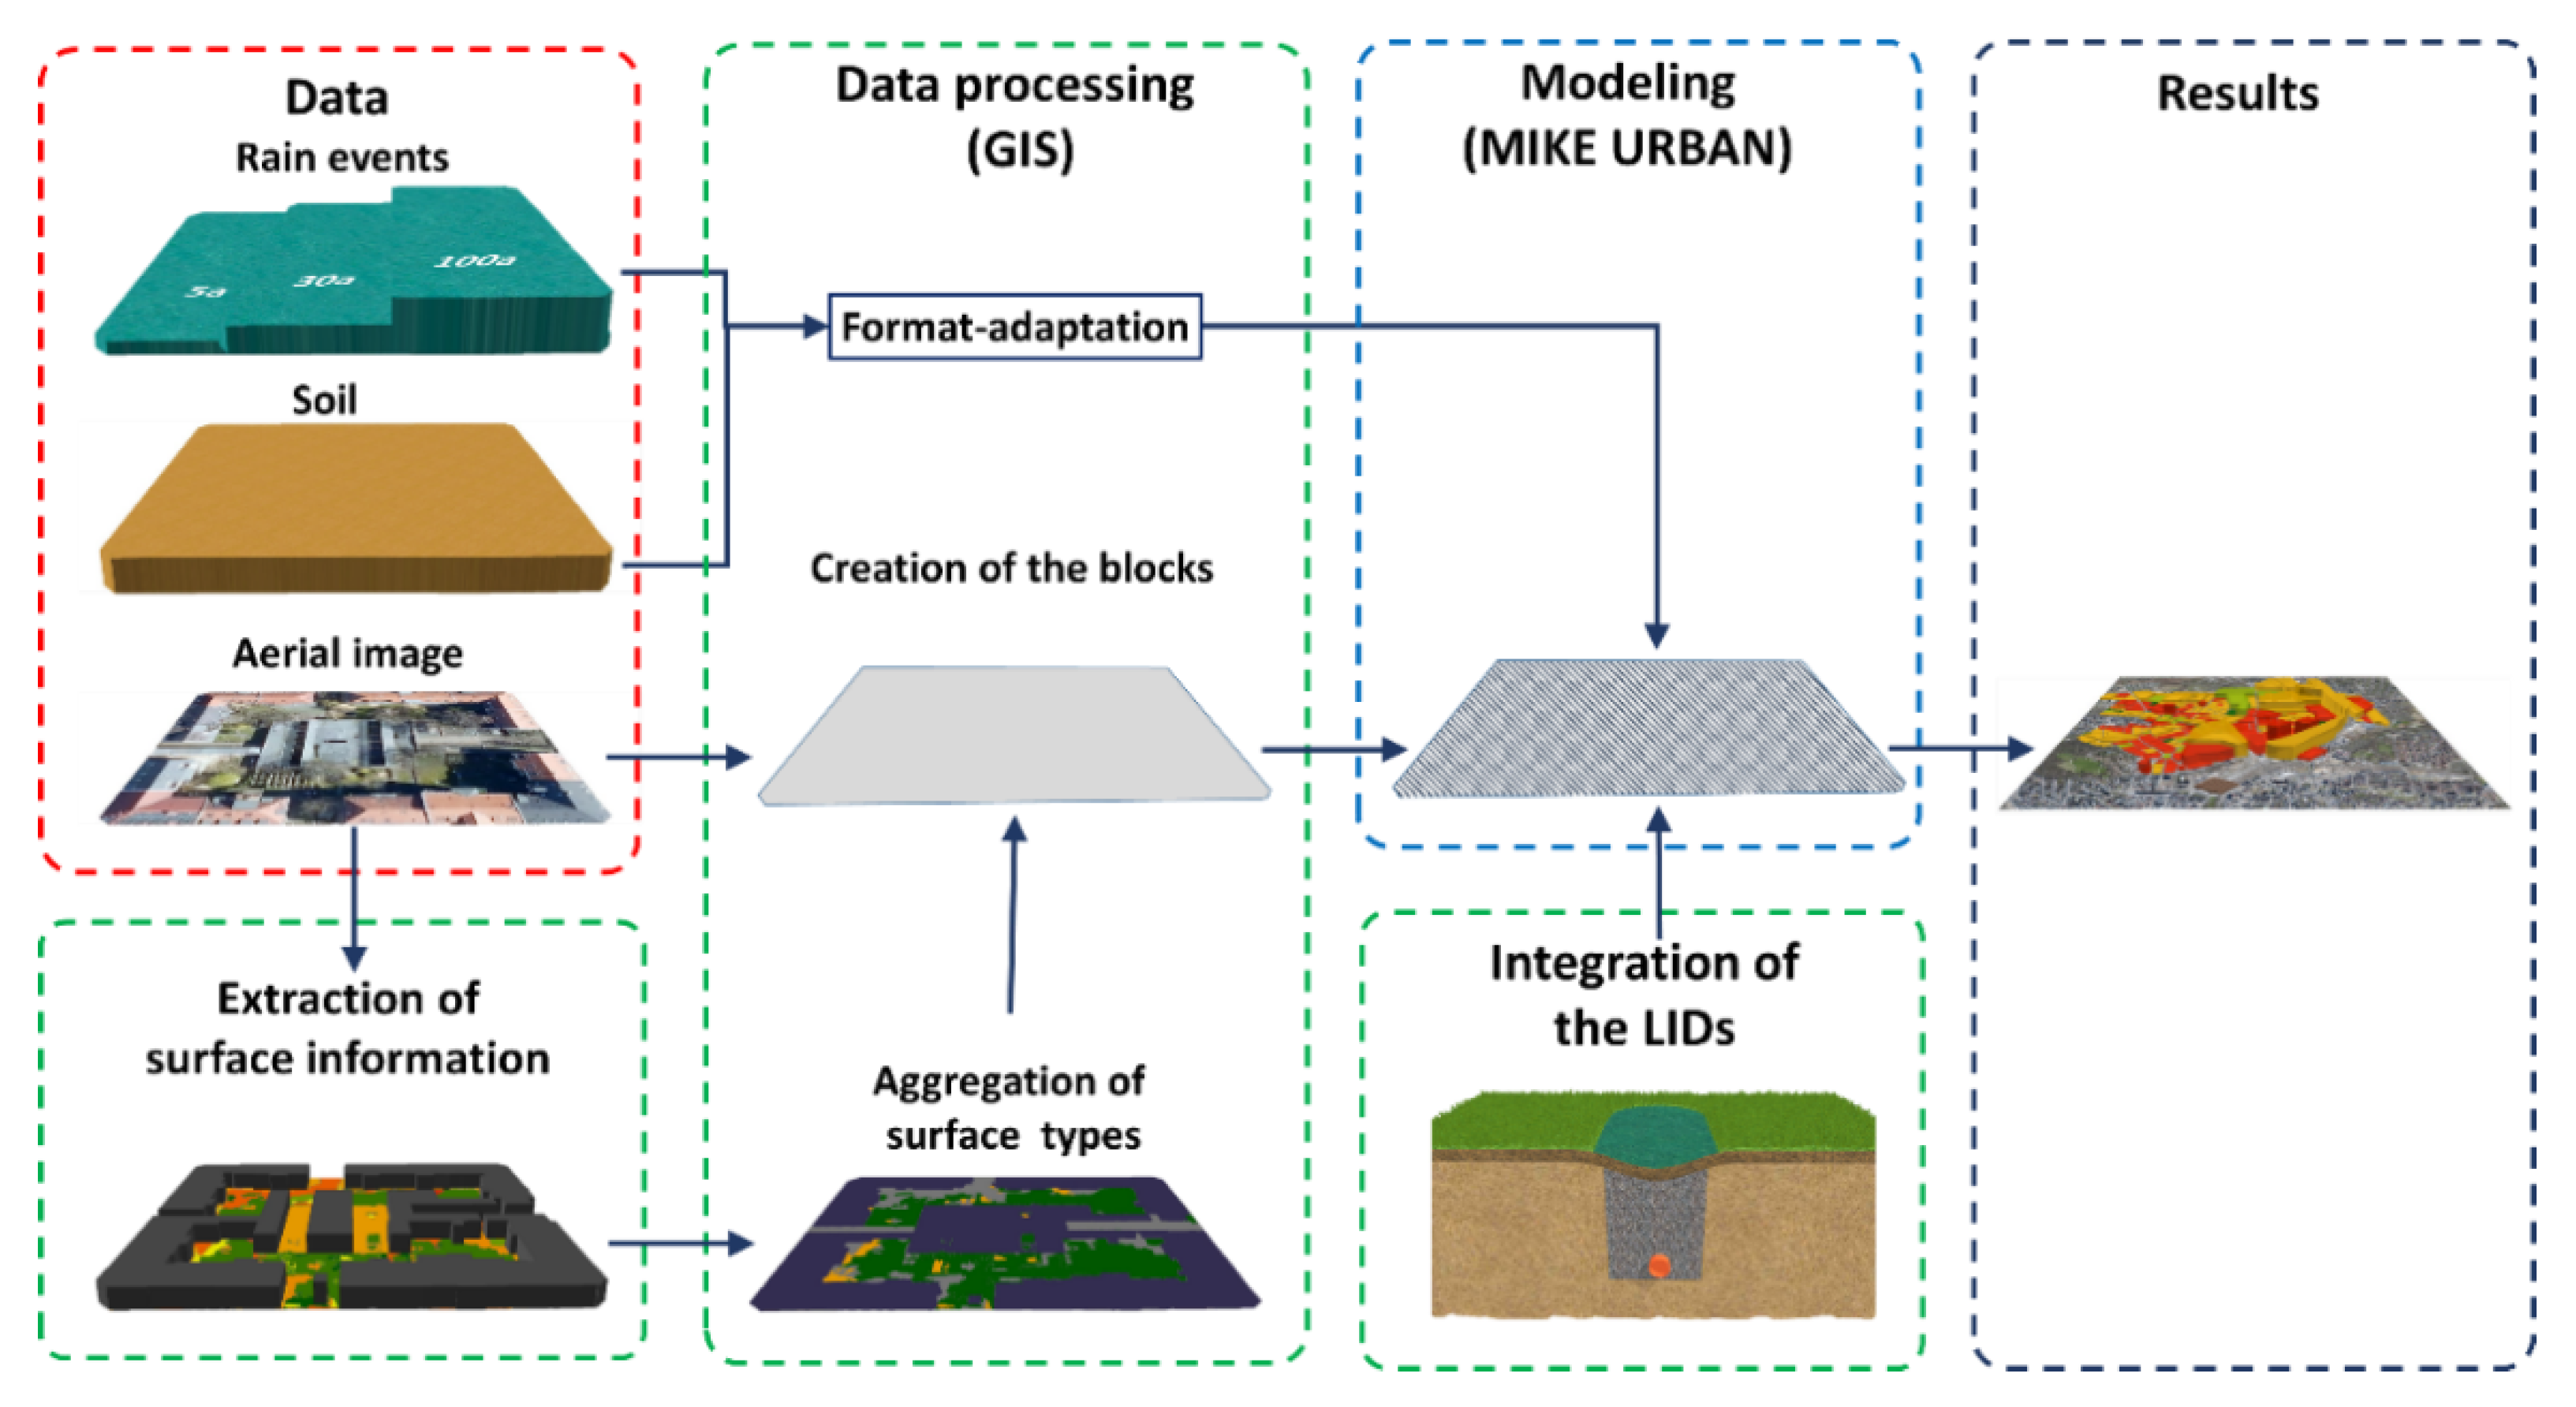
The MUST-B approach uses data on rainfall events, soil hydraulic conductivity, and surface perviousness as an input for the modeling. Yet, the analysis and the simulations are carried out on the urban blocks, instead of the entire urban area. It also assimilates the LIDs in the simulation and estimates the minimum space requirement for the maximum efficiency of the LIDs (
Figure 1). The main advantage of the MUST-B approach is that it can be applied on a small scale as well as to a neighborhood, and can also be quickly transferred to large urban areas by aggregating the block modules.
2.3. Data Requirement
The traditional modeling of stormwater runoff requires a complex data such as drainage network, surface sealing, digital elevation model, soil characteristics and rain data. By dividing the complex urban area into blocks and excluding the streets (and thus the drainage network under the streets) the data requirement for modeling can be reduced. Additionally, the traditional modeling process, which consists of multi-step simulation (hydrological and hydrodynamic analysis) is reduced to a single-step process (only hydrologic analysis) [
23]. Thus MUST-B analysis can be carried out based on the data, which are usually available on a local level of the cities and communities and thus avoiding a cost-intensive new data-collection and the use of complex modeling programs.
The main input data are high resolution aerial images, and soil and rain data. While the aerial image serves as a basis for the extraction of the infrastructure such as streets, buildings and data on vegetation, from which the sealed surface can be derived, the soil and rain data are used for the modeling and simulation of the stormwater runoff. The blocks are also created based on the aerial photograph and the extracted infrastructure.
2.4. Data Processing
Surface sealing: For reliable results of designing and modeling of LIDs for stormwater management, a precise description of the surfaces is essential. These data are often generated by high-resolution aerial images. In the MUST-B approach, high-resolution multi-spectral aerial image (10 × 10 cm, blue, green, red, near infrared) of the study area was used to identify the surface (types) sealing. The surface types were defined for the spatial landscape features in vector format based on the specifications of the ATKIS feature type catalog (ATKIS
®-OK) [
24]. From the derived surface types (roads, buildings, vegetation), four different degrees of perviousness were defined: (1) Buildings and houses (perviousness = 0%); (2) other impervious surfaces (perviousness = 0%); (3) partly pervious area (perviousness = 50%); and (4) pervious area (perviousness = 100%).
Urban blocks: The blocks were created based on the infrastructure extracted, and the land-use from the aerial image. The area along the traffic routes, streets, and rivers were excluded from the study area, which resulted in the creation of individual city blocks.
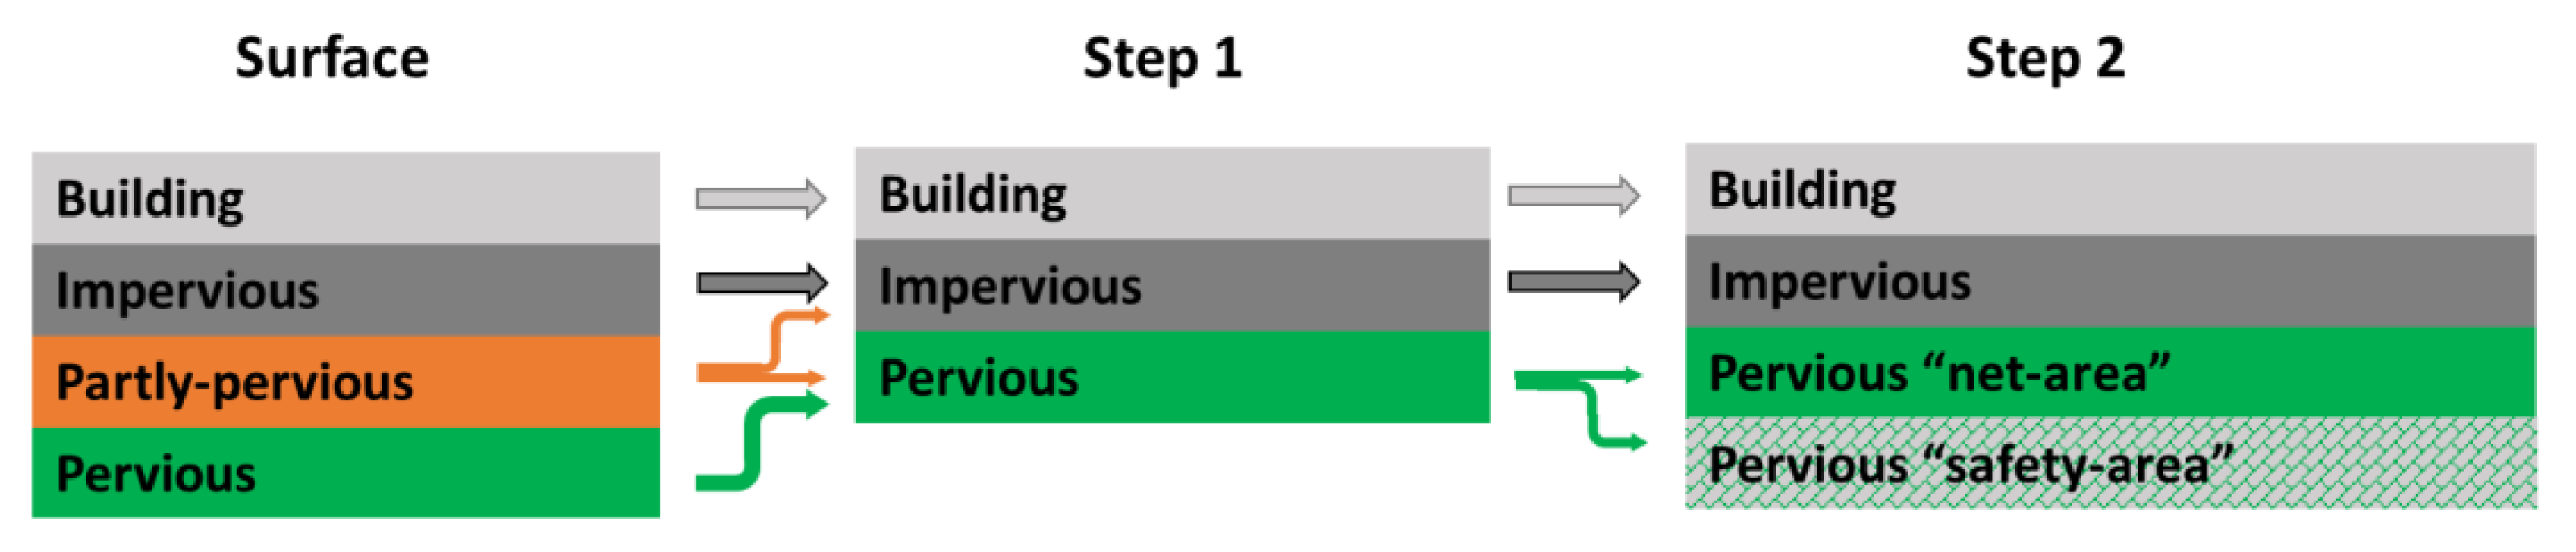
Aggregation of the surface information into the blocks: The four degrees of perviousness were further processed in two consecutive steps and aggregated to the blocks so that each block had attribute information on the pervious and impervious block-surfaces. In the first step, 50% of the partly pervious surface area was assigned to the impervious and 50% to the pervious areas. Then the total pervious area was divided into two categories: (a) the pervious “safety area” along the buildings which is not available for the construction of LIDs and (b) the remaining pervious “net area” which is available for the construction of infiltration LIDs.
According to DWA-A 138 [
25], a safety distance (at least 1.5 × h cellar depth + 0.5 m) from existing buildings must be maintained for the construction of an infiltration systems for rainwater. Since the exact depths of the individual building cellars are not known in the study area, an average value of 3 m depth was taken into account and the safety distance was set at 5 m (4.5 m + 0.5 m) from the buildings. The pervious area outside this distance was defined as pervious ‘net area’ for each block and considered as potential area for the construction of an infiltration systems (
Figure 2).
Once the ‘net area’ was determined for each block, the blocks were then divided into four different groups depending on the relation of the ‘net area’ and the total block area from lowest (1–25%) to highest (76–100%).
Soil and precipitation data: Traditionally, stormwater infiltration and retention infrastructure are designed to withstand the runoff of certain rainfall events. In Germany, a requirement for LIDs defined by the DWA is to mitigate the runoff of a 5 years rainfall event [
25]. However, considering the increasing frequency of extreme rainfall events globally [
26], three different return periods of rainfall events were considered in this study: 5 years, 30 years, and finally 100 years. For the study area this resulted in a 2 h of precipitation of 30 mm, 50 mm, and 60 mm, respectively. The precipitation data were acquired in a time series format ready for modeling in accordance with KOSTRA 2010 [
27].
In addition to the precipitation data, soil properties—in particular the soil hydraulic conductivity coefficient (kf)—are of crucial importance for planning, designing and modeling of LIDs. In this study instead of focusing on the local soil condition, soils with two different hydraulic conductivity coefficients were considered: high permeability (kf = 10−4 m/s) and low permeability (kf = 10−6 m/s).
2.5. Definition of Scenarios
In this study, different LIDs and combinations of LIDs were considered. A total of seven scenarios were created to estimate the transformability of the current state of the urban area to decentralized stormwater management.
The ‘current situation’ was considered in scenario 0 for each block as basis for comparison in order to enable a quantification of the efficiency of LIDs in the different scenarios.
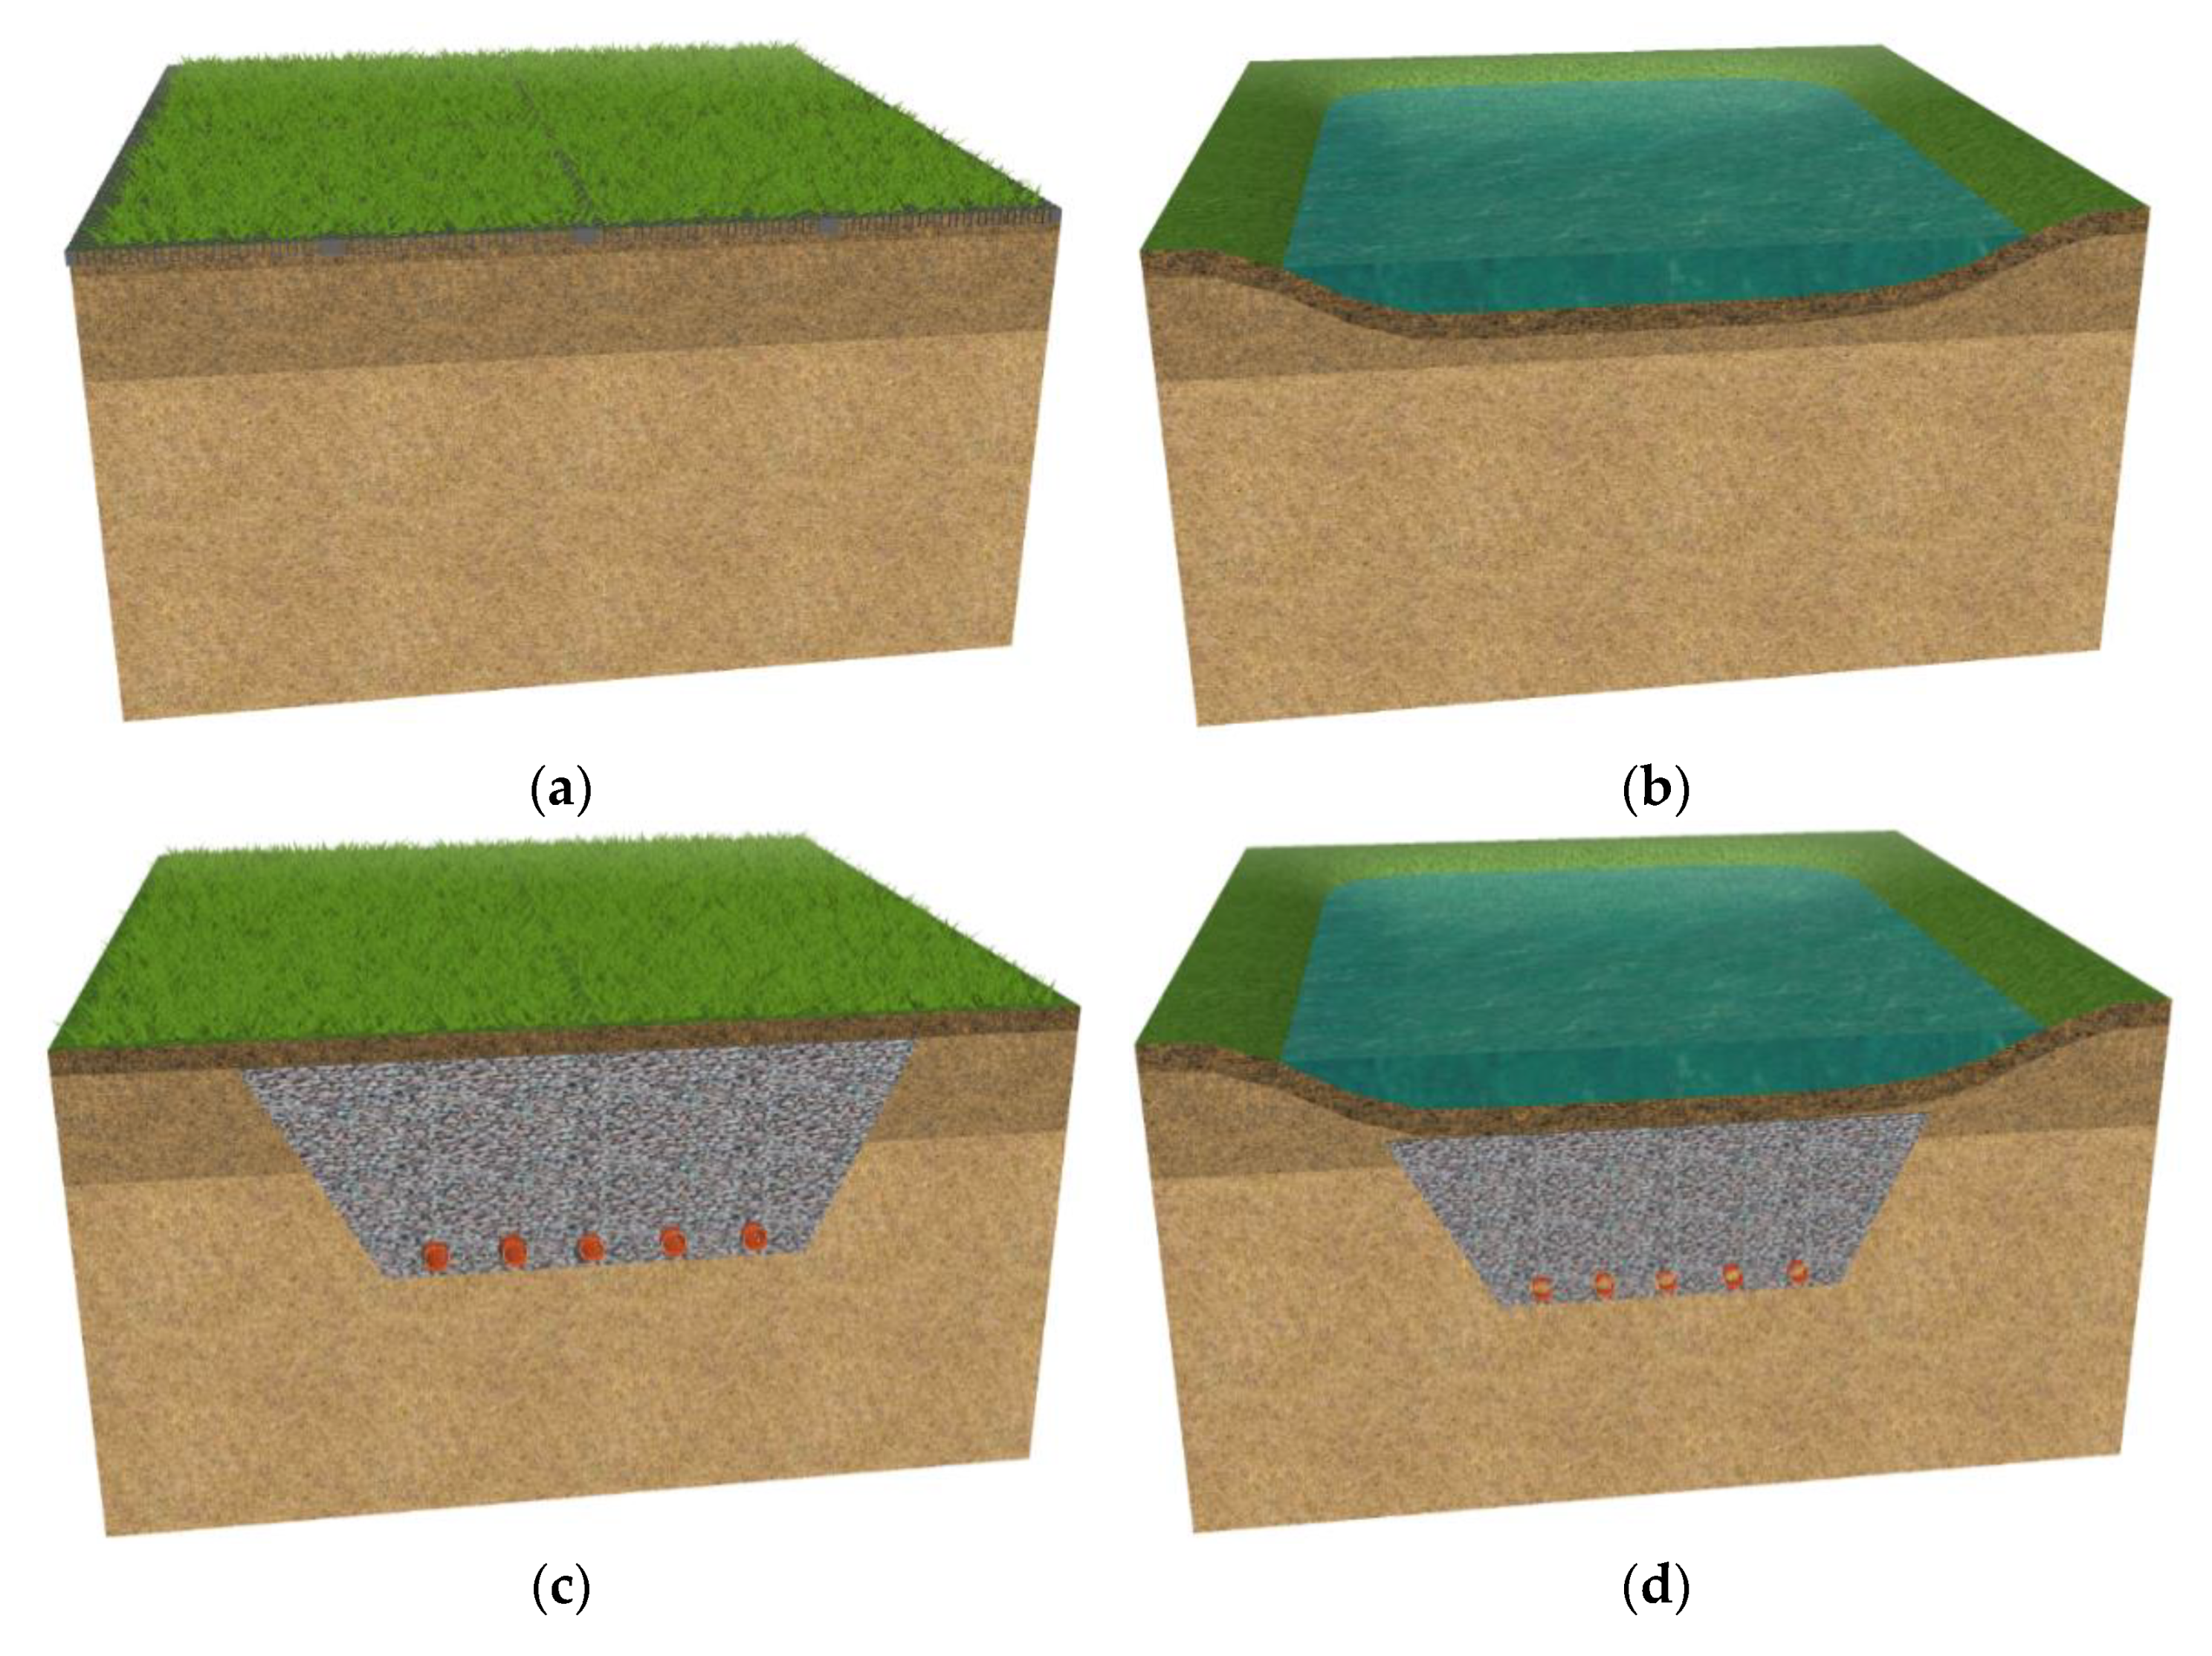
In Scenarios 1 to 7, LIDs were considered either as a single component or as combination. The technical specifications of the LIDs used for the simulation of stormwater management are shown schematically in
Figure 3 and were adapted from [
25]. The LIDs, except the shaft infiltration and extensive roof greening, were considered to be built only on the pervious ‘net area’.
2.5.1. Scenario 1: Surface Infiltration
In surface infiltration, stormwater is diverted from the impervious surfaces of a block and evenly distributed over a pervious area (such as a courtyard) where large-scale infiltration is allowed. This type of infiltration requires high soil permeability and a large area because it does not provide retention capacity.
2.5.2. Scenario 2: Swale Infiltration
In this scenario, surface runoff is collected in a vegetated swale about 30 cm deep and infiltrates through a vegetative soil layer. The trough is used as retention space (300 L/m2), which reduces the area required compared to surface infiltration.
2.5.3. Scenario 3: Trench Infiltration
The purpose of the subsurface trench infiltration is to collect the stormwater runoff from the impervious surface in an underground retention trench where it infiltrates. The infiltration trench usually is filled with gravel or plastic crates. For the modeling, a conventional subsurface gravel system with a structure height of 1 m was considered. The system has an effective retention capacity of approx. 35% of the trench volume or an effective retention volume of 350 L/m2.
2.5.4. Scenario 4: Trough-Trench Infiltration
With this LID, the stormwater runoff is collected from the impervious block-surfaces in a swale and there it is infiltrated via a vegetative soil layer into a subsurface gravel-filled infiltration trench. An advantage of the trough-trench infiltration is the increased retention volume, which is reflected in a low requirement of space. For the modeling it was assumed that the soil layer between the swale and the infiltration trench is approx. 20 cm thick and has a pore volume of 40%. Thus, the effective retention volume of the whole LID can be calculated at 730 L/m2.
2.5.5. Scenario 5: Combination of Green Roof and Trough-Trench Infiltration
In this scenario, the retention volume of the block can possibly be increased by extensive roof greening. According to Zehnsdorf and Trabitzsch [
28], the “standard structure” of an extensive green roof was considered with a substrate layer of 10 cm height and with an effective pore volume of approximately 50%. This results in a retention volume of 50 L/m
2 green roof. The roof overflow is discharged into the trough-trench infiltration together with the runoff of other impervious surfaces. Since the specific costs per m
3 retention volume for green roofs are significantly higher than that of the trough-trench infiltration [
29], green roofs were only considered in the modeling for those blocks, which do not have enough space available for the construction of a trough-trench infiltration system.
2.5.6. Scenario 6: Combination of Green Roof, Trough-Trench Infiltration, and Infiltration Shaft
Scenario 6 builds on the previous Scenario 5 and considers only those blocks that show residual surface runoff due to high portion of impervious surface and not enough space for the implementation of above mentioned LIDs. The goal of Scenario 6 is to completely avoid any runoff by further measures. It is assumed that the runoff from the impervious areas and the green roof will enter the trough-trench infiltration, as in Scenario 5. In the case of high portion of sealed surface and extreme rainfall events, the remaining overflow from the trough-trench infiltration is then transferred to a shaft infiltration so that no runoff occurs. The advantages of the shaft infiltration are its relatively small space requirement and the possibility of construction under impervious or partly pervious surfaces (parking lot, paved areas).
2.5.7. Scenario 7: Combination Trough-Trench Infiltration and Infiltration Shaft
With the aim of avoiding residual surface runoff in heavily sealed blocks, Scenario 7 builds on Scenario 4 and combines the trough-trench infiltration with the shaft infiltration for those blocks that still show residual runoff in Scenario 4. The overflow from the trough-trench infiltration is led into the shaft infiltration.
2.6. Dimensioning of LIDs
The dimensioning of the LIDs for each block was carried out according to DWA (2005) using the technological parameters summarized in
Figure 3. The size (area) of the LIDs is mainly determined by the surface runoff from the impervious areas (roof area + pavements, parking lots, etc.) and the soil permeability.
First, a rough estimate was made for each LID and rainfall event. For instance, in the case of a five-year rainfall event and a coefficient of permeability at 10
−5 m/s, the calculated trough area was reported as approx. 6% of the impervious area [
25]. This approximated LID area was integrated in the modeling as initial area input and the results were checked whether the block produced runoff or not. For those blocks, where the calculated area of the LID exceeded the pervious ‘net area’, the total ‘net area’ was assumed as the size of the LID.
Subsequently, a series of surface runoff modeling with MIKE URBAN (see
Section 2.7) was carried out, in which the LIDs where designed and modeled together with the precipitation data and the soil hydraulic conductivity. Based on the results of the modeling the minimum size of the LIDs was determined in an iterative procedure as follows:
Scenario 1–4: For those blocks that did not produce any runoff as a result of the modeling with MIKE URBAN considering the initial LID area, the area of the LID was gradually reduced (10%) until the minimum size (area) was reached and the simulation results indicated that the blocks produced runoff.
If a block produced a residual runoff, the area of the LID was increased in steps of 5% and the simulation was carried out until no more runoff could be detected. When the available pervious ‘net area’ for the construction of the LID was fully utilized, the runoff was quantified and defined as residual runoff and potential discharge to sewer.
For Scenarios 5 and 6, an additional retention space in form of green roof was modeled for those blocks that did not offer enough space for LIDs and still have a residual runoff. The potentially available areas in these blocks for a green roof (green roof, gravel roof, and flat roof) were identified, based on aerial photographs and a digital elevation model, using the program developed by Ansel et al. [
30] in a separate study. Then the green roofs were aggregated into the blocks for further stormwater runoff simulation. In the simulation, a maximum retention of 50 mm was assumed for green roofs with throttled runoff.
For the Scenarios 6 and 7, it was assumed that for blocks with residual runoff a supplementary shaft infiltration is installed, which is built underground (possibly under a impervious surface). The volume of the shaft infiltration was conservatively assumed as the volume of the residual runoff.
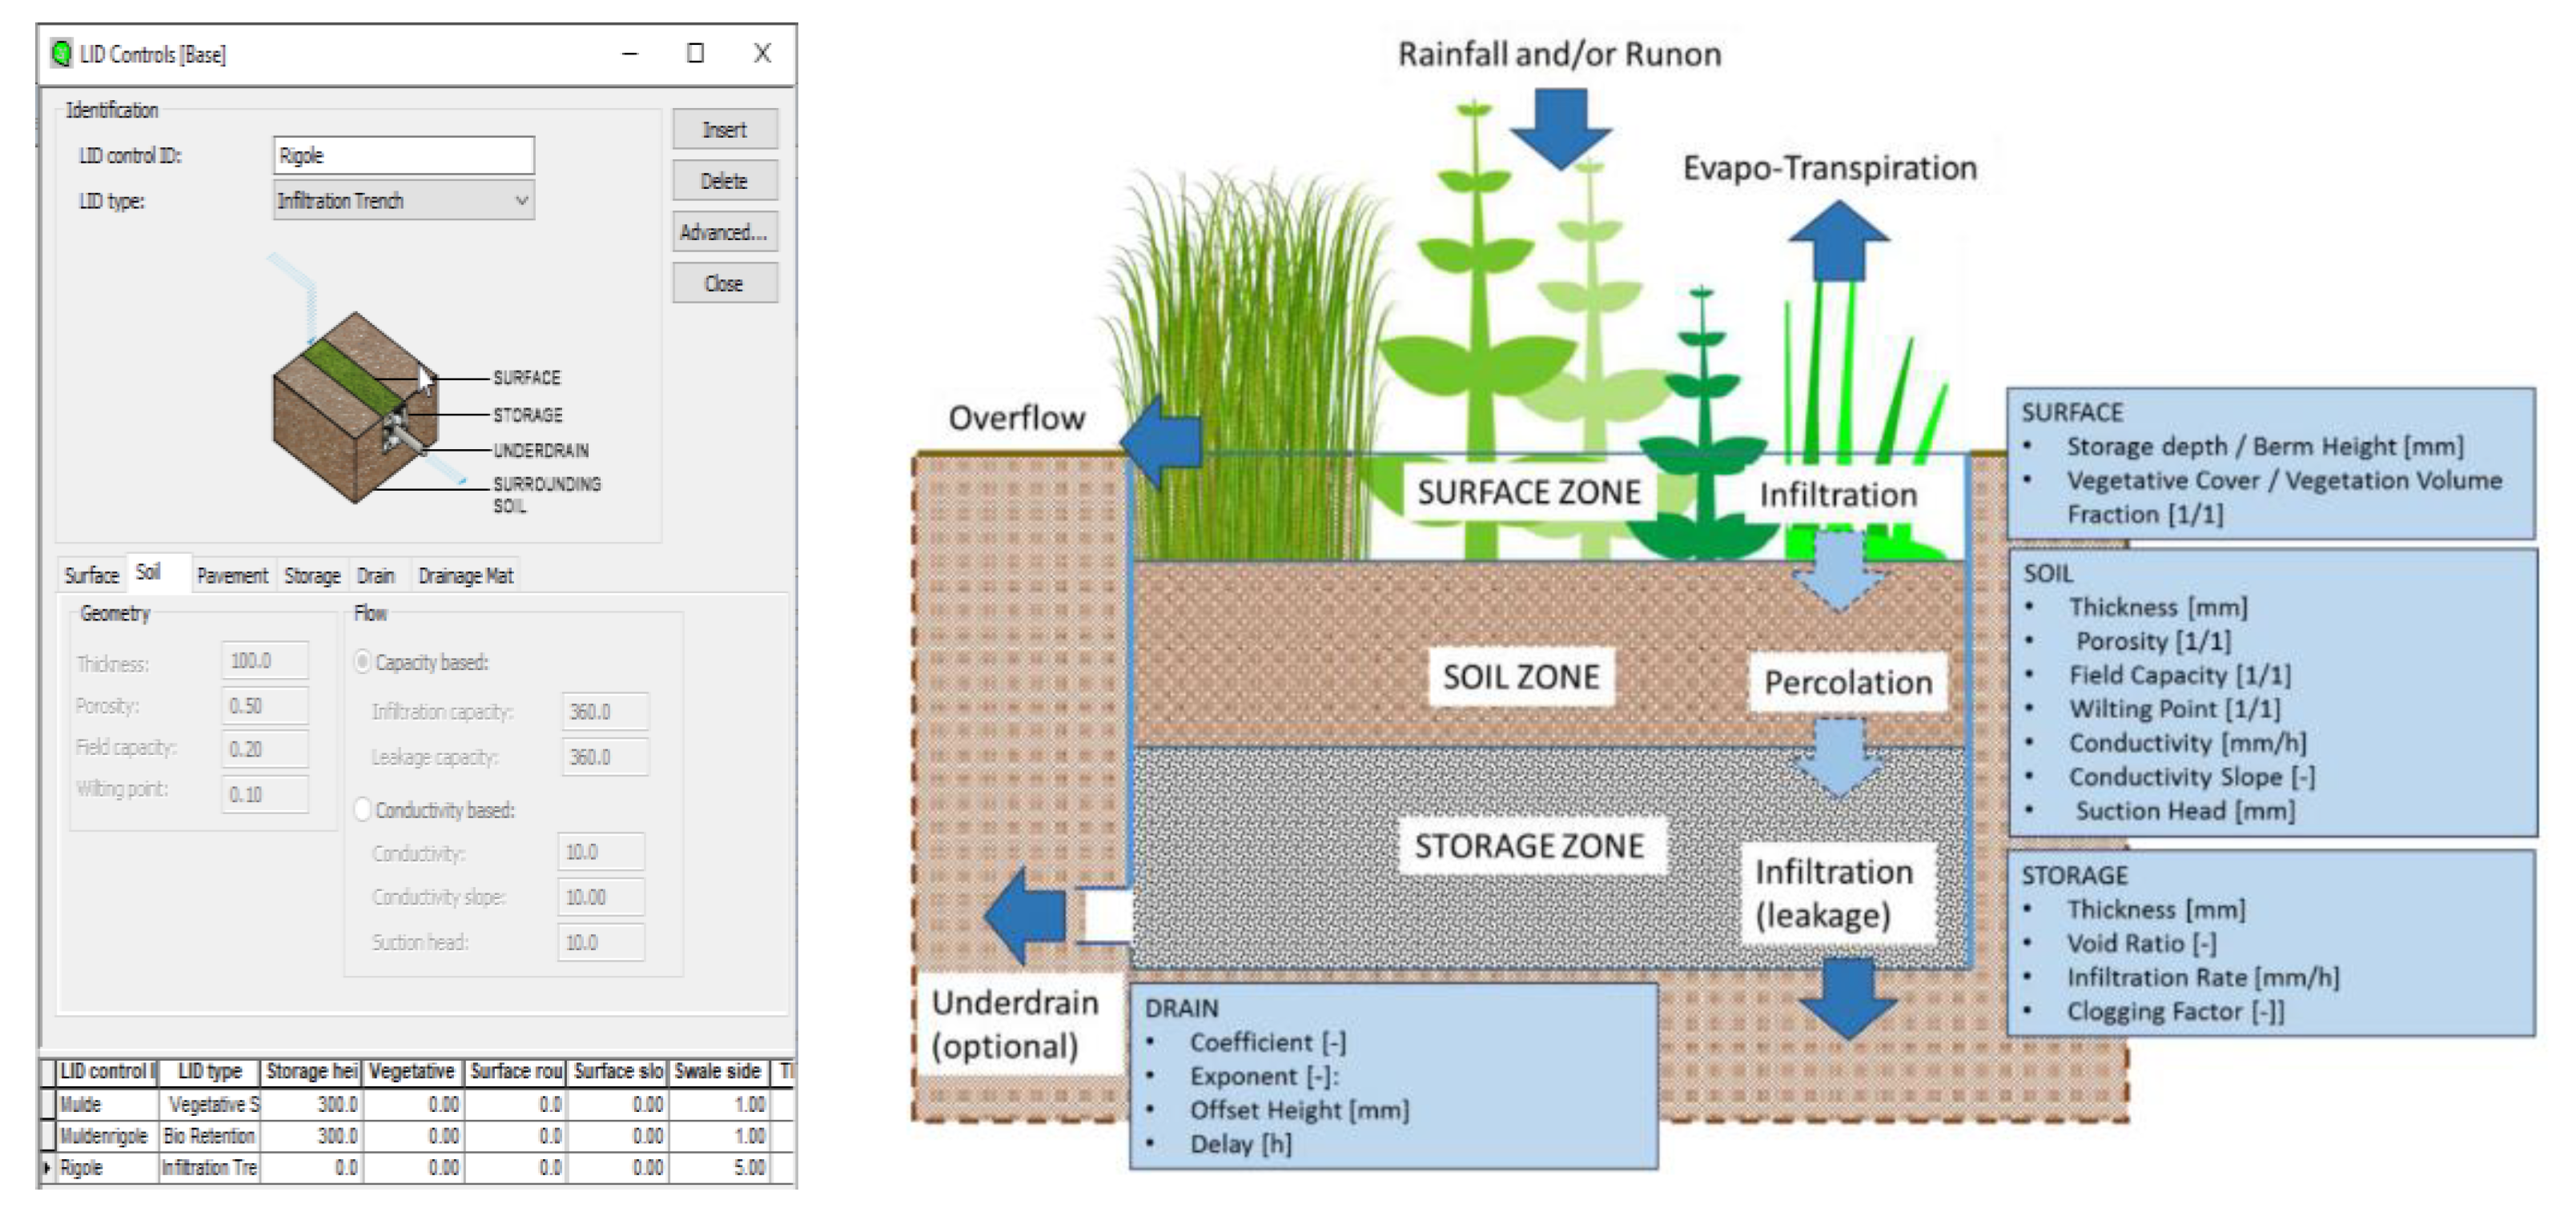
2.7. Modeling with MIKE URBAN
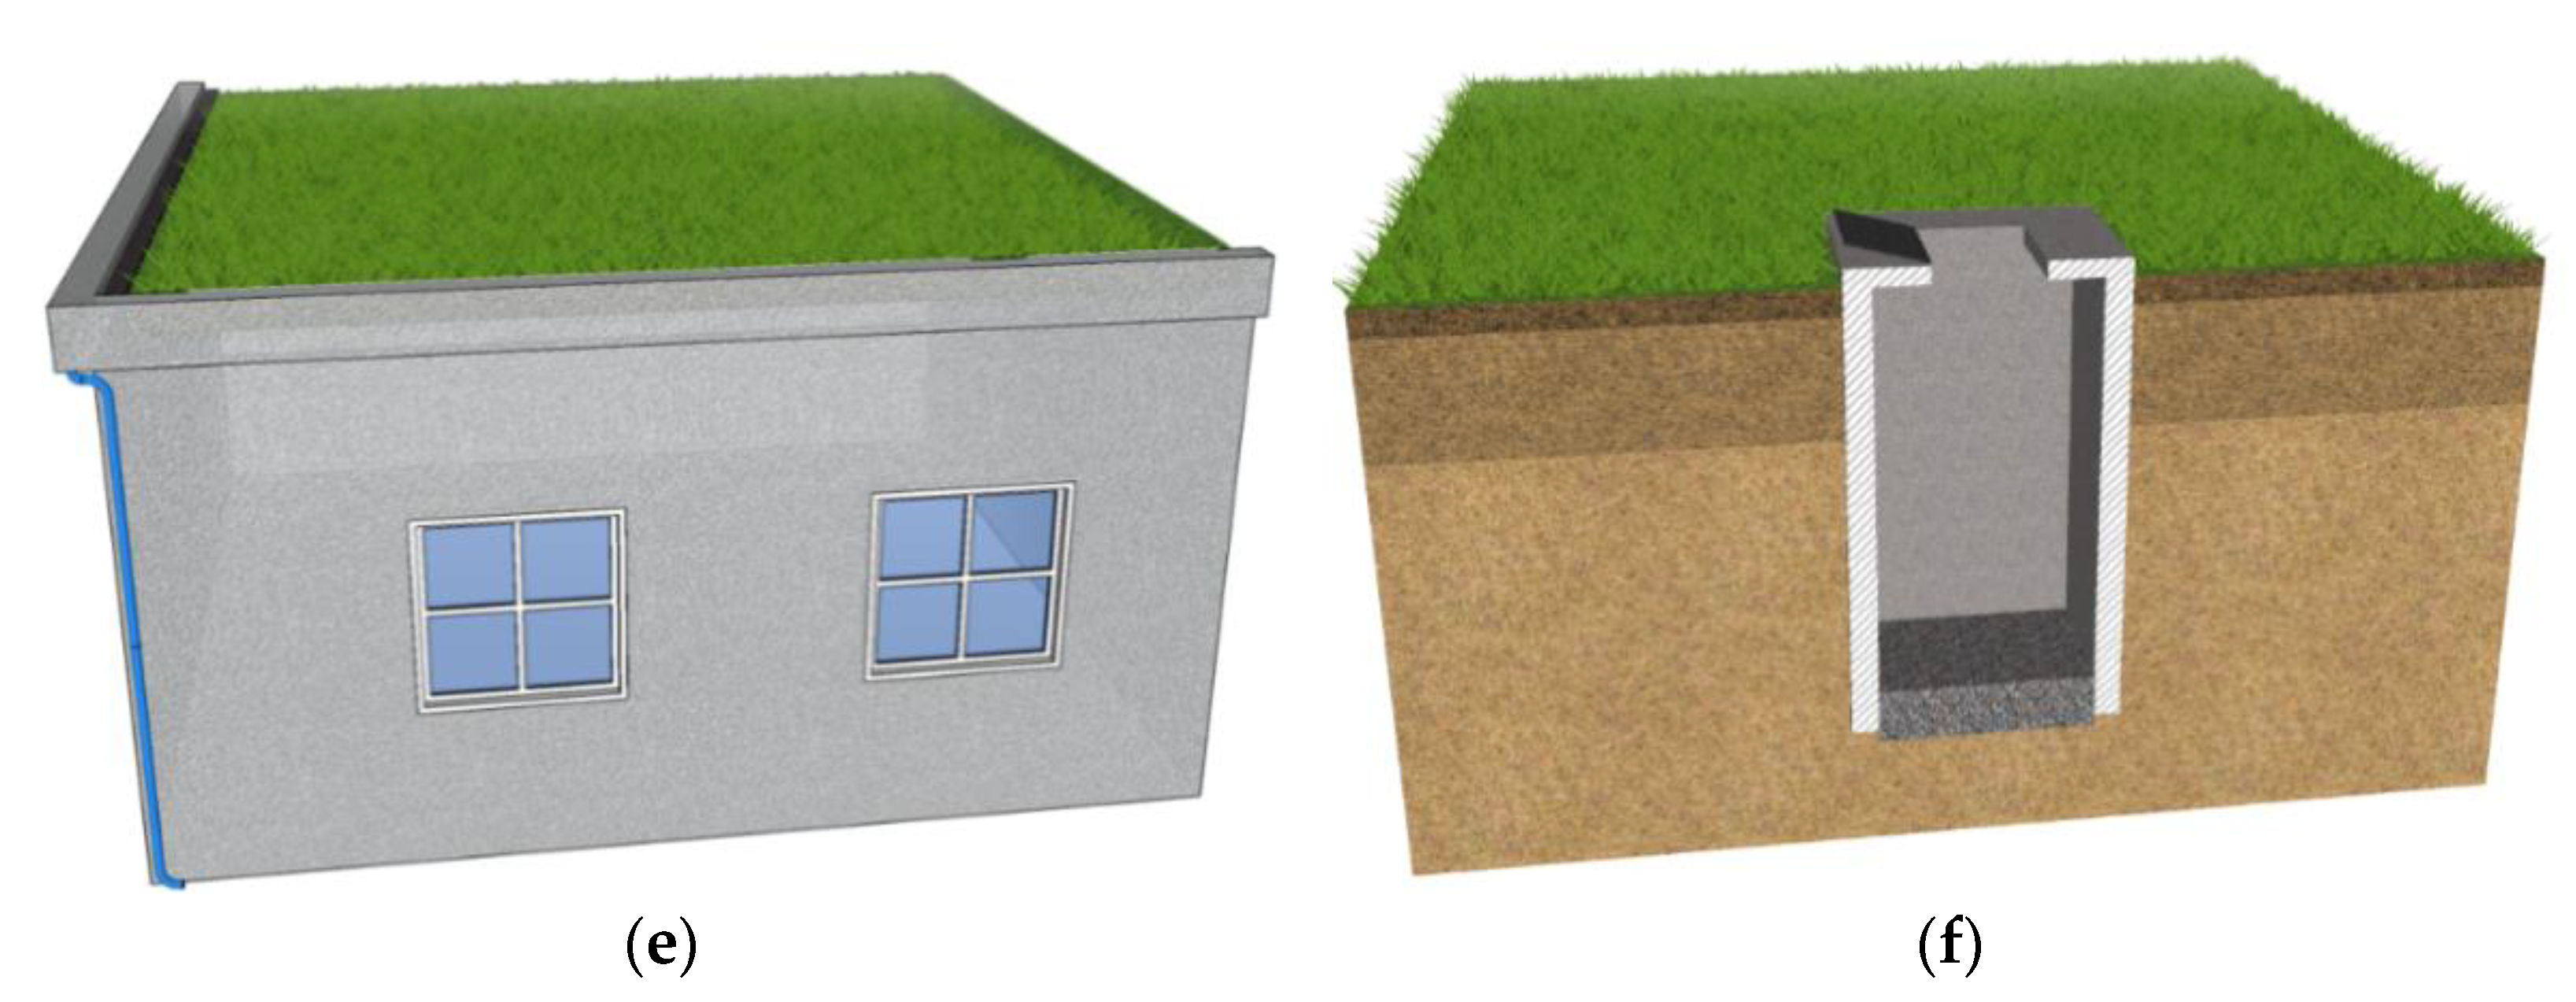
The stormwater run-off simulation for each block was carried out with the software package MIKE URBAN from DHI (MIKE URBAN, Hørsholm, Danmark). The individual LIDs can be integrated in MIKE URBAN as shown in
Figure 4. Thereby, the LIDs were adjusted with regard to technology design, dimensioning and materials used according to
Figure 3.
The hydrological surface model integrated in MIKE URBAN is based on the kinematic wave approach as a non-linear storage model [
31]. The catchment areas are considered as reservoirs (containers) with the precipitation as inflow and the evaporation, infiltration, and surface runoff as outflow. Due to the fact that the stormwater runoff was modeled for two hours, the evaporation was neglected in this study.
For the simulation of Scenario 0, the runoff from the impervious area together with the overflow from the previous area was defined as residual runoff and potential discharge to sewer network. However, in the simulations for Scenarios 1–7, the runoff from the impervious surface and the overflow of the impervious area were considered to discharge into the LIDs. For the scenarios (Scenario 5–7) with combinations of LIDs, the overflow of the green roof was discharged into the trough-trench infiltration and the overflow of the trough-trench infiltration was discharged to the shaft infiltration. To simplify the modeling, the complete runoff of the roof areas was considered to discharge into the LIDs (not considering the runoff to the street side).
2.8. Cost Analysis
Additionally, a cost analysis was carried out to express the economic impact of using LIDs for a decentralized stormwater management. While the specific investment costs of the LIDs were calculated on basis of German unit cost for construction [
32] and verified with the costs reported by other studies, an average of operation and maintenance (O&M) costs estimated by several sources was incorporated and used in this study. The net present value of the specific costs were estimated in accordance with DWA [
33] for 40 years of time span with a discount rate of 3%. Finally the annualized cost was estimated and applied to the calculated areas of the LIDs in order to compare annual expenditures of the scenarios and the run-off mitigation impact (
Table 1).
3. Results
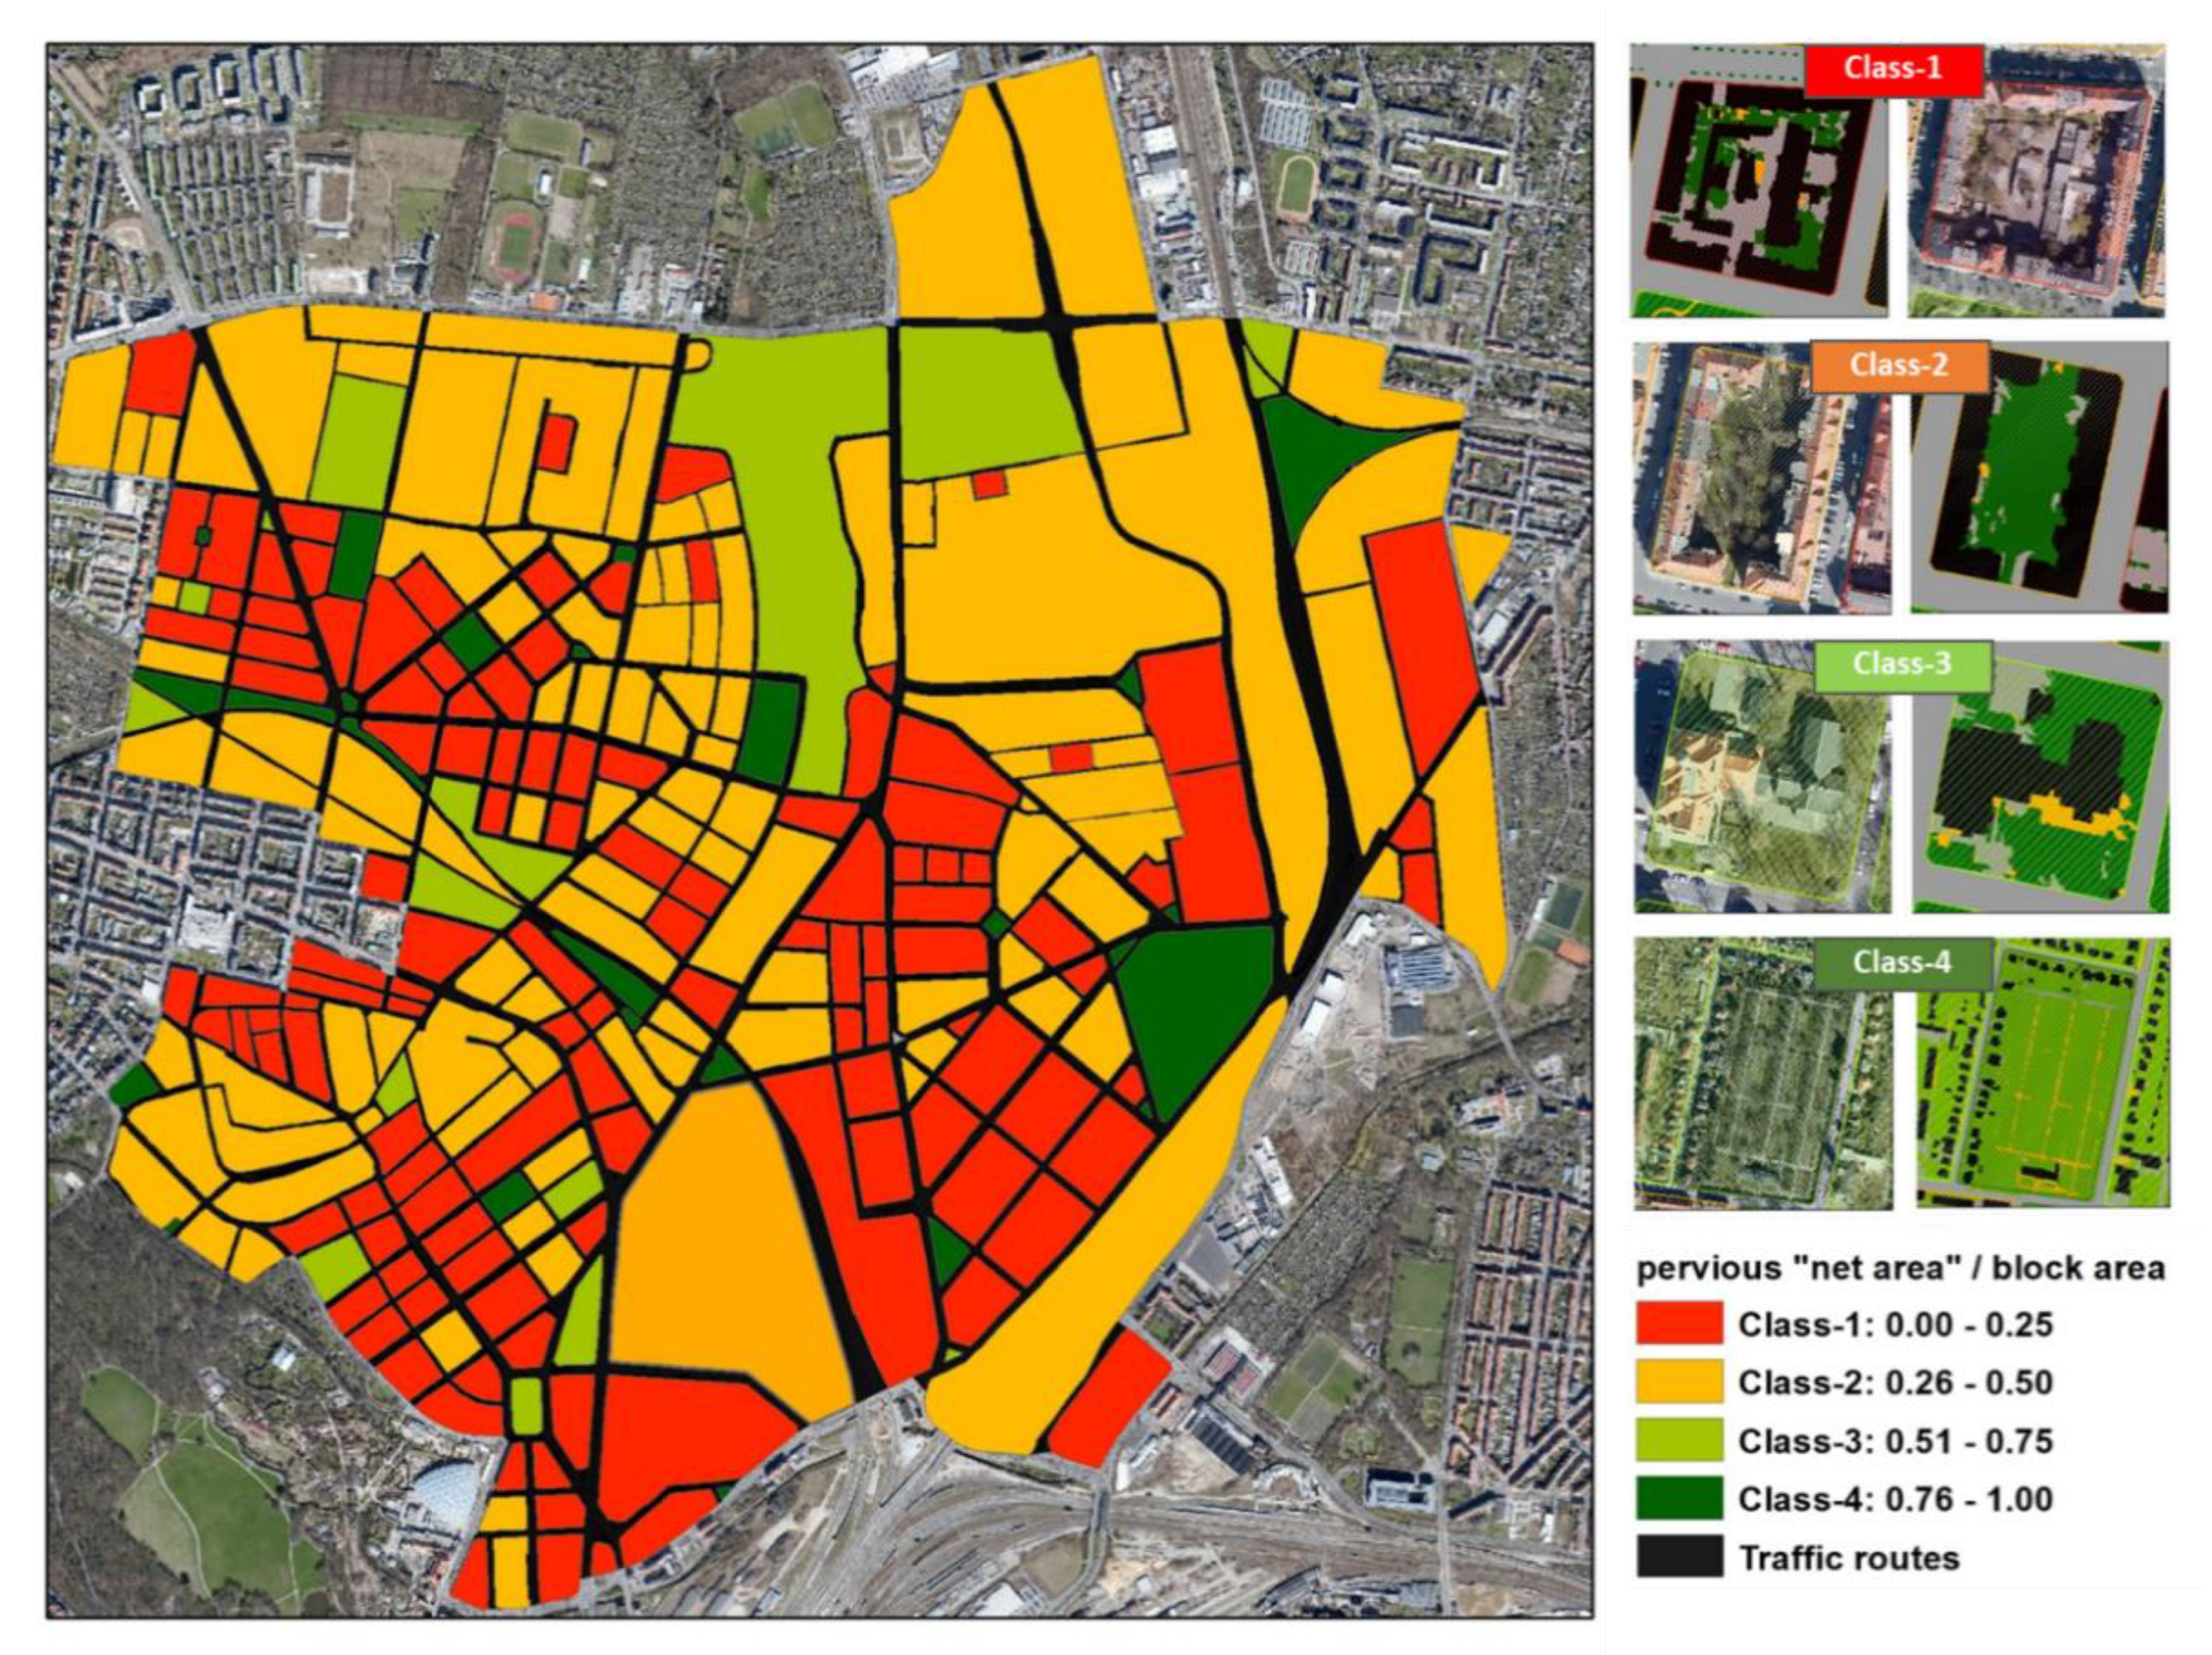
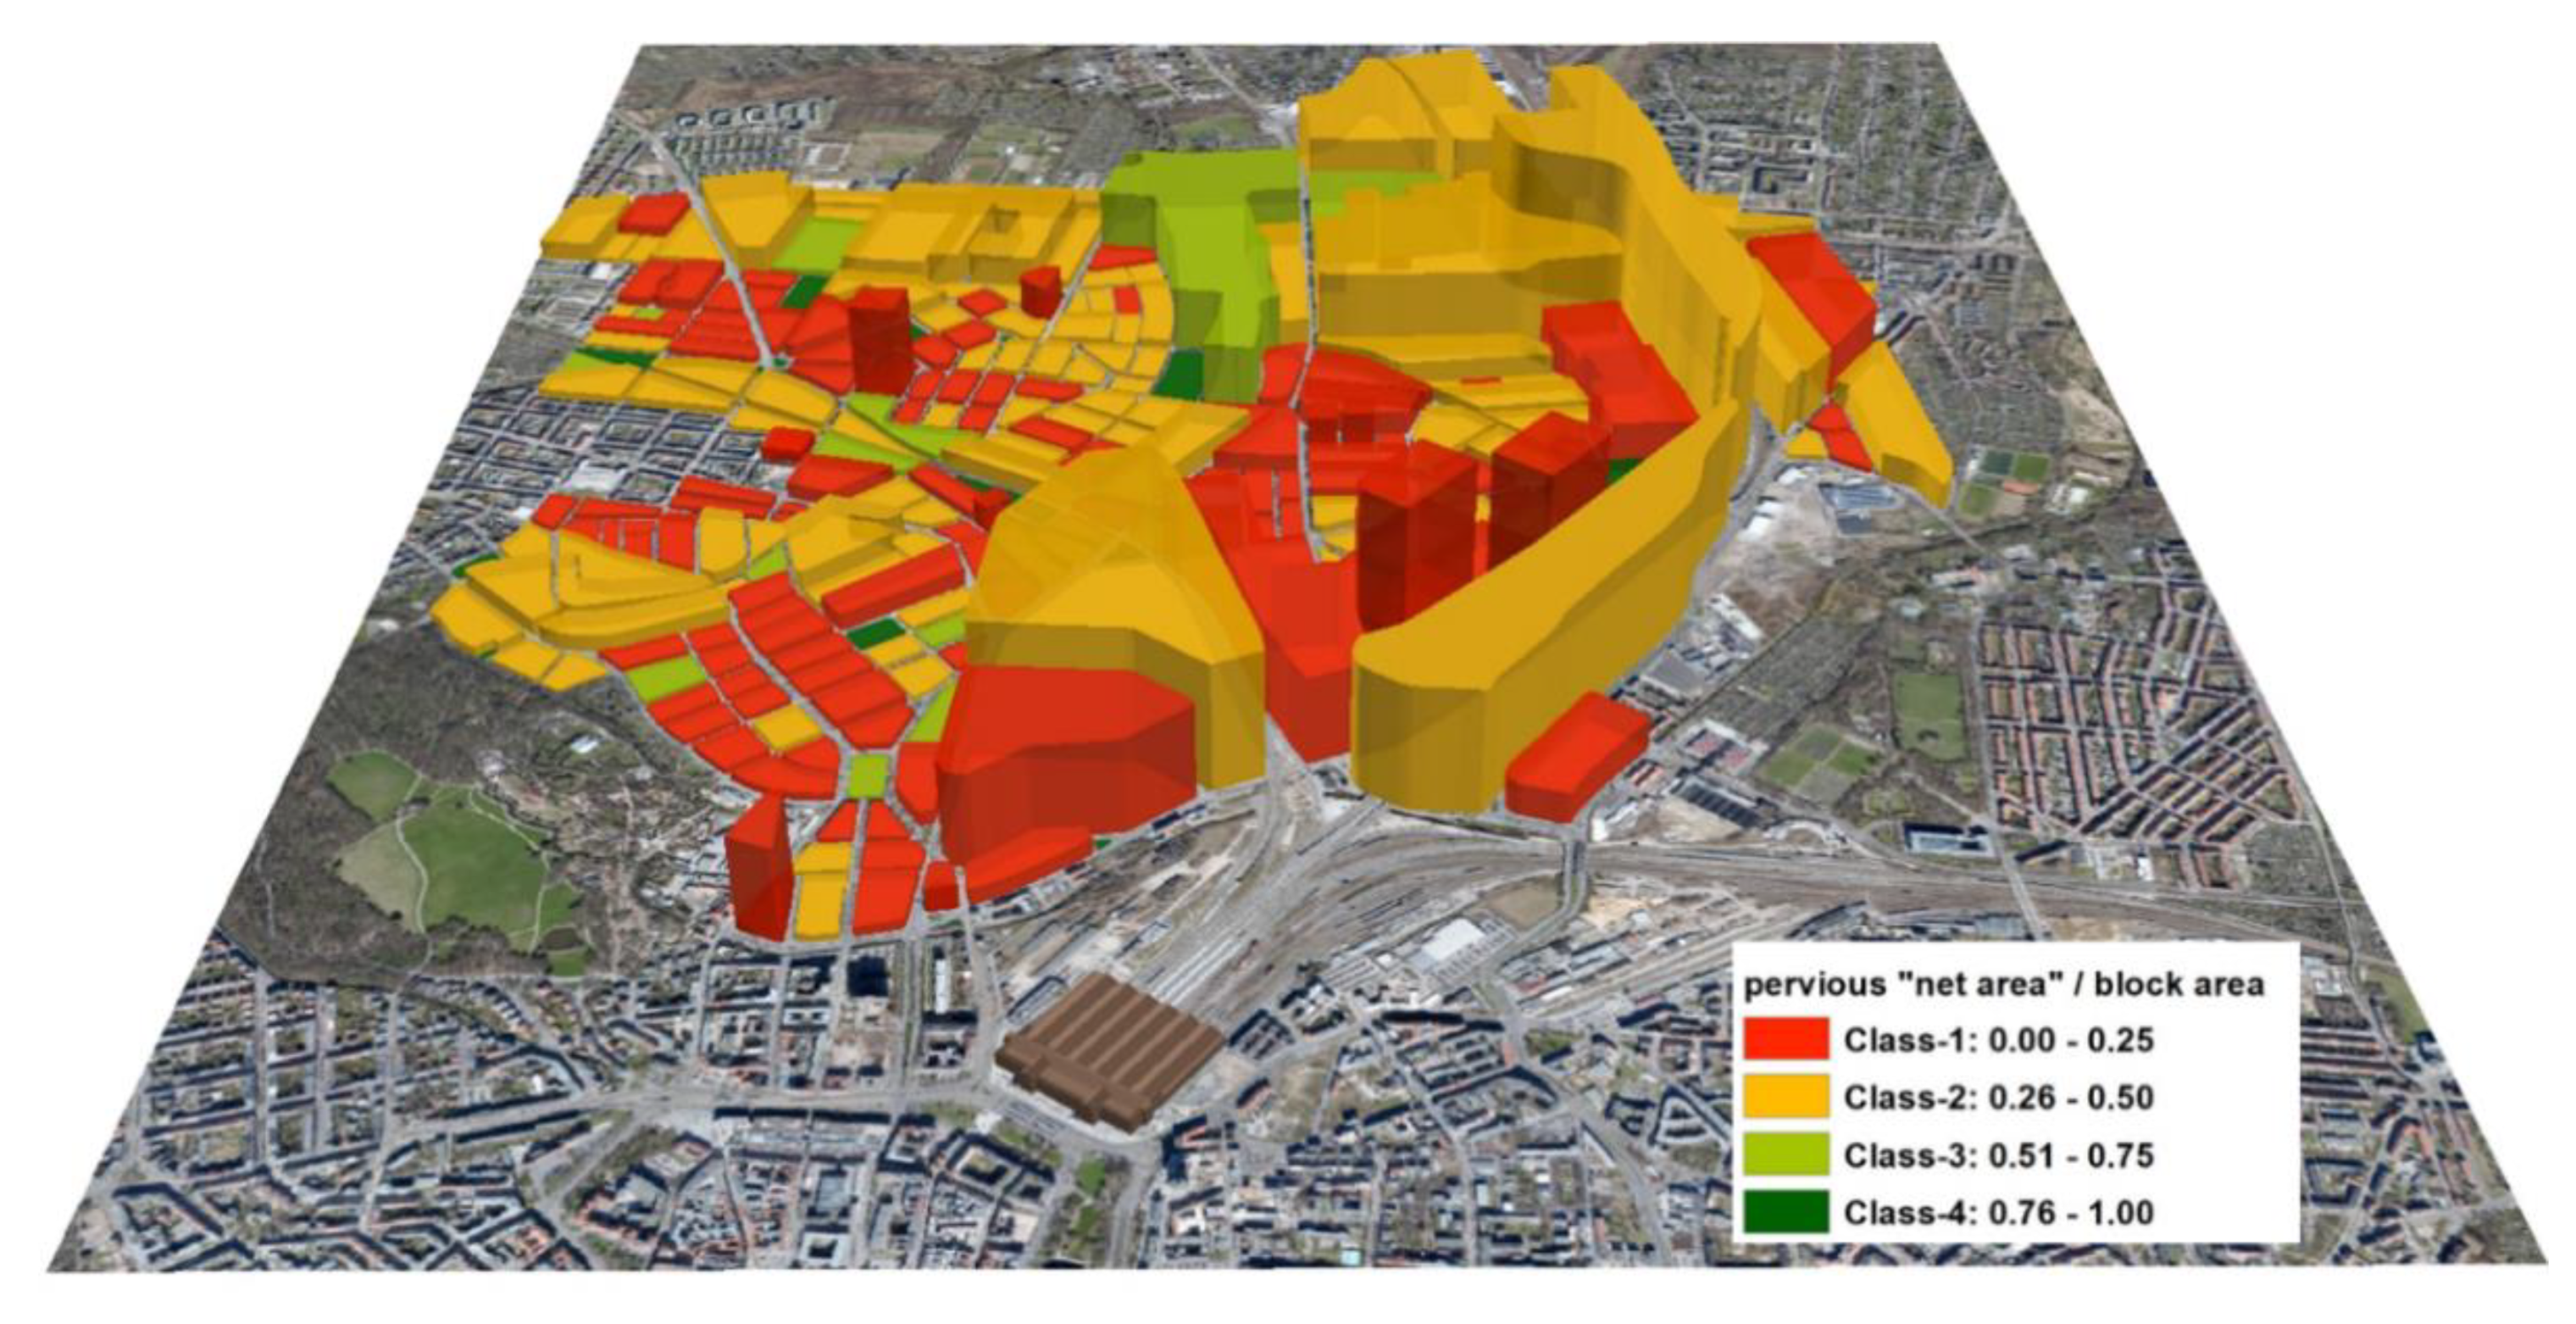
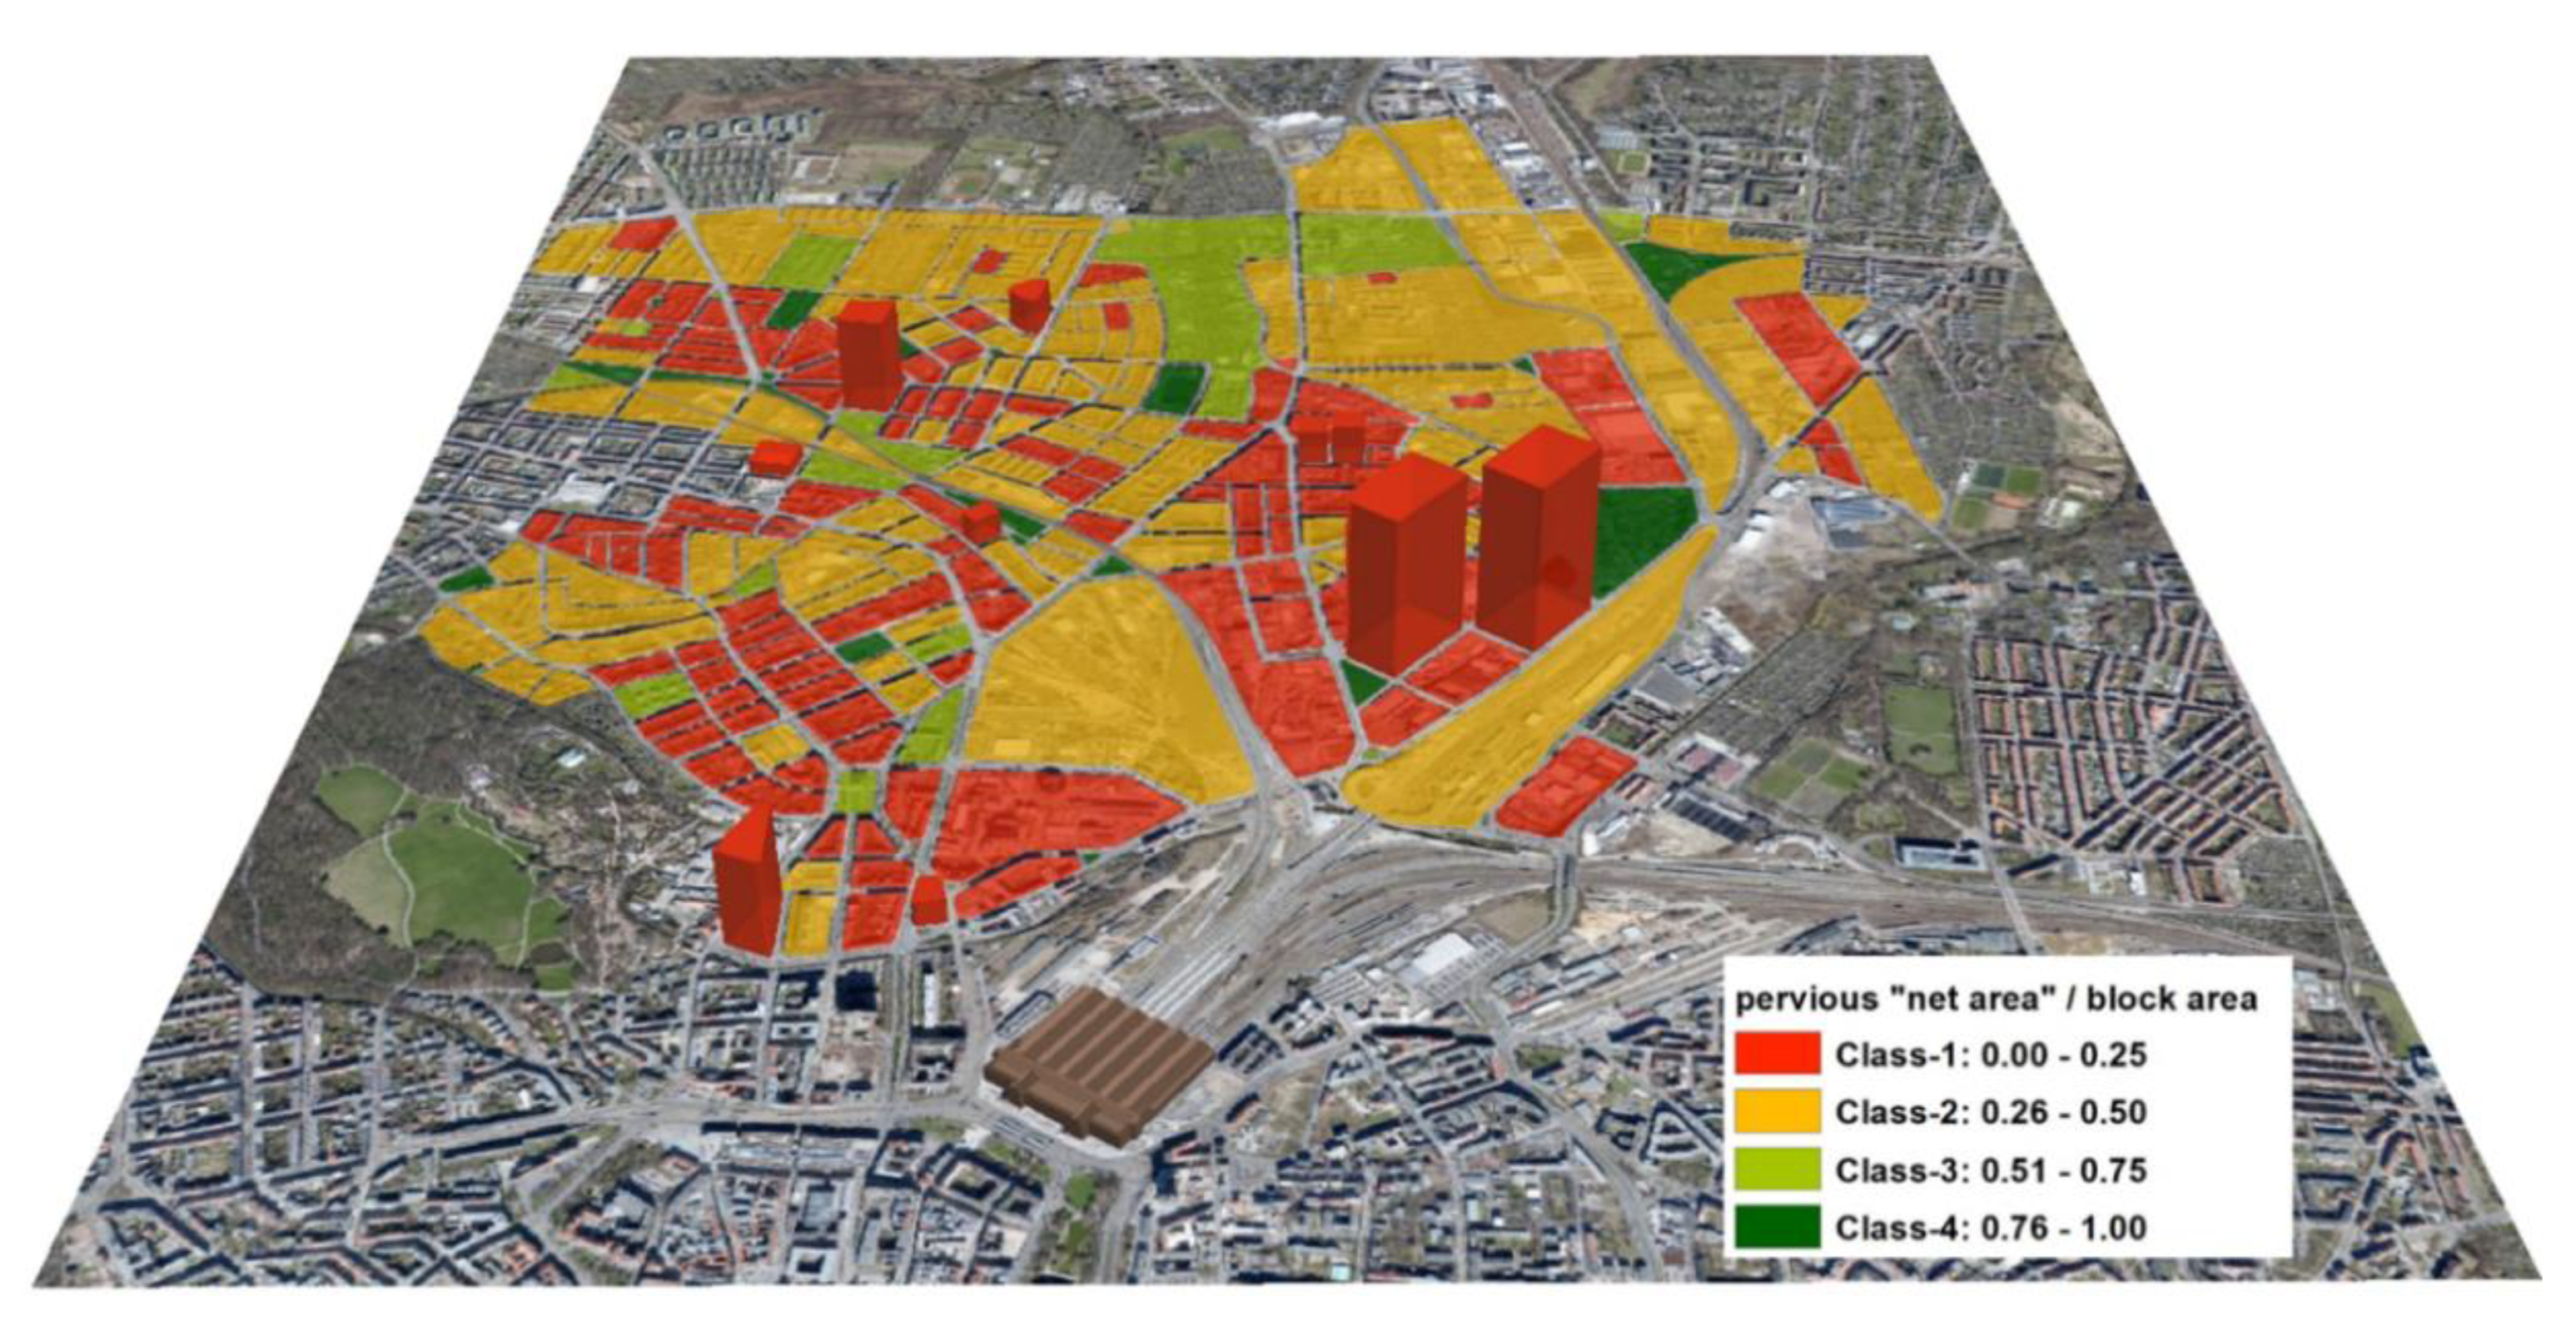
3.1. Urban Blocks
The study area Leipzig-North, which covers 792 ha was divided into 267 urban blocks and the traffic area. The blocks range in size from 0.05 ha to 30 ha and have a total area of 647 ha, while the traffic area covers 145 ha. The blocks were divided into four classes based on the attribute information on the pervious ‘net area’ and the total area (
Figure 5). The class-1 with a degree of pervious area ranging from 1% to 25% consists of 122 blocks (46% of the block number) with a total area of 196 ha (30% of the total block area). Class-2 consists of 100 blocks (37% of the block number), which cover 352 ha (54% of the total block area). The class-3 had 14 blocks (5% of the block number) and covered 59 ha (9% of the total block area). The remaining 31 blocks (11% of the block number) covering 40 ha (7% of the total block area) belong to class-4 (see
Figure 4). As summarized for the entire area, the impervious surface covered an area of 317 ha (49% of the total block area), the pervious surface covered an area of 330 ha (51% of the block area), while 102 ha of the total pervious area was classified as safety area which is not suitable for construction of infiltration systems, leaving 228 ha (35% of the total block area) suitable for the construction of LIDs.
3.2. Hydrological Modeling
Simulation results for three rainfall events showed that a total of 213,391 m3, 320,466 m3, and 392,392 m3 of stormwater was generated within 2 h of a 5-, 30-, and 100-year rainfall events, respectively. The runoff produced by the blocks differed depending on the specific scenario.
Scenario-0 reflects the current situation of the study area. The 30-year rainfall event on a soil with high permeability (k
f = 10
−4 m/s) results in a surface runoff of 151,895 m
3/2 h (47% of the stormwater volume) (
Table 2), which currently discharges in the existing sewer system (
Figure 6). The runoff volume increases to 263,877 m
3 as the permeability of the soil (k
f = 10
−6 m/s) decreases. This corresponds to 82% of the stormwater volume generated in 2 h.
In Scenario-1, the surface infiltration shows an efficiency of over 90% for a soil with high permeability (k
f = 10
−4 m/s) for a 30-year rainfall event. This means that only 10% of the stormwater volume is discharged in the sewer system as runoff. However, the land (space) required for this type of infiltration system is more than 75% of the available ‘net area’ under this scenario (
Table 3). For low permeability soils (k
f = 10
−6 m/s), there is nearly no further reduction in surface runoff compared to Scenario 0 indicating that the available ‘net area’ is fully utilized for the construction of the infiltration system. Thus, highlighting the significance of the LIDs with retention capacity to effectively minimize surface runoff.
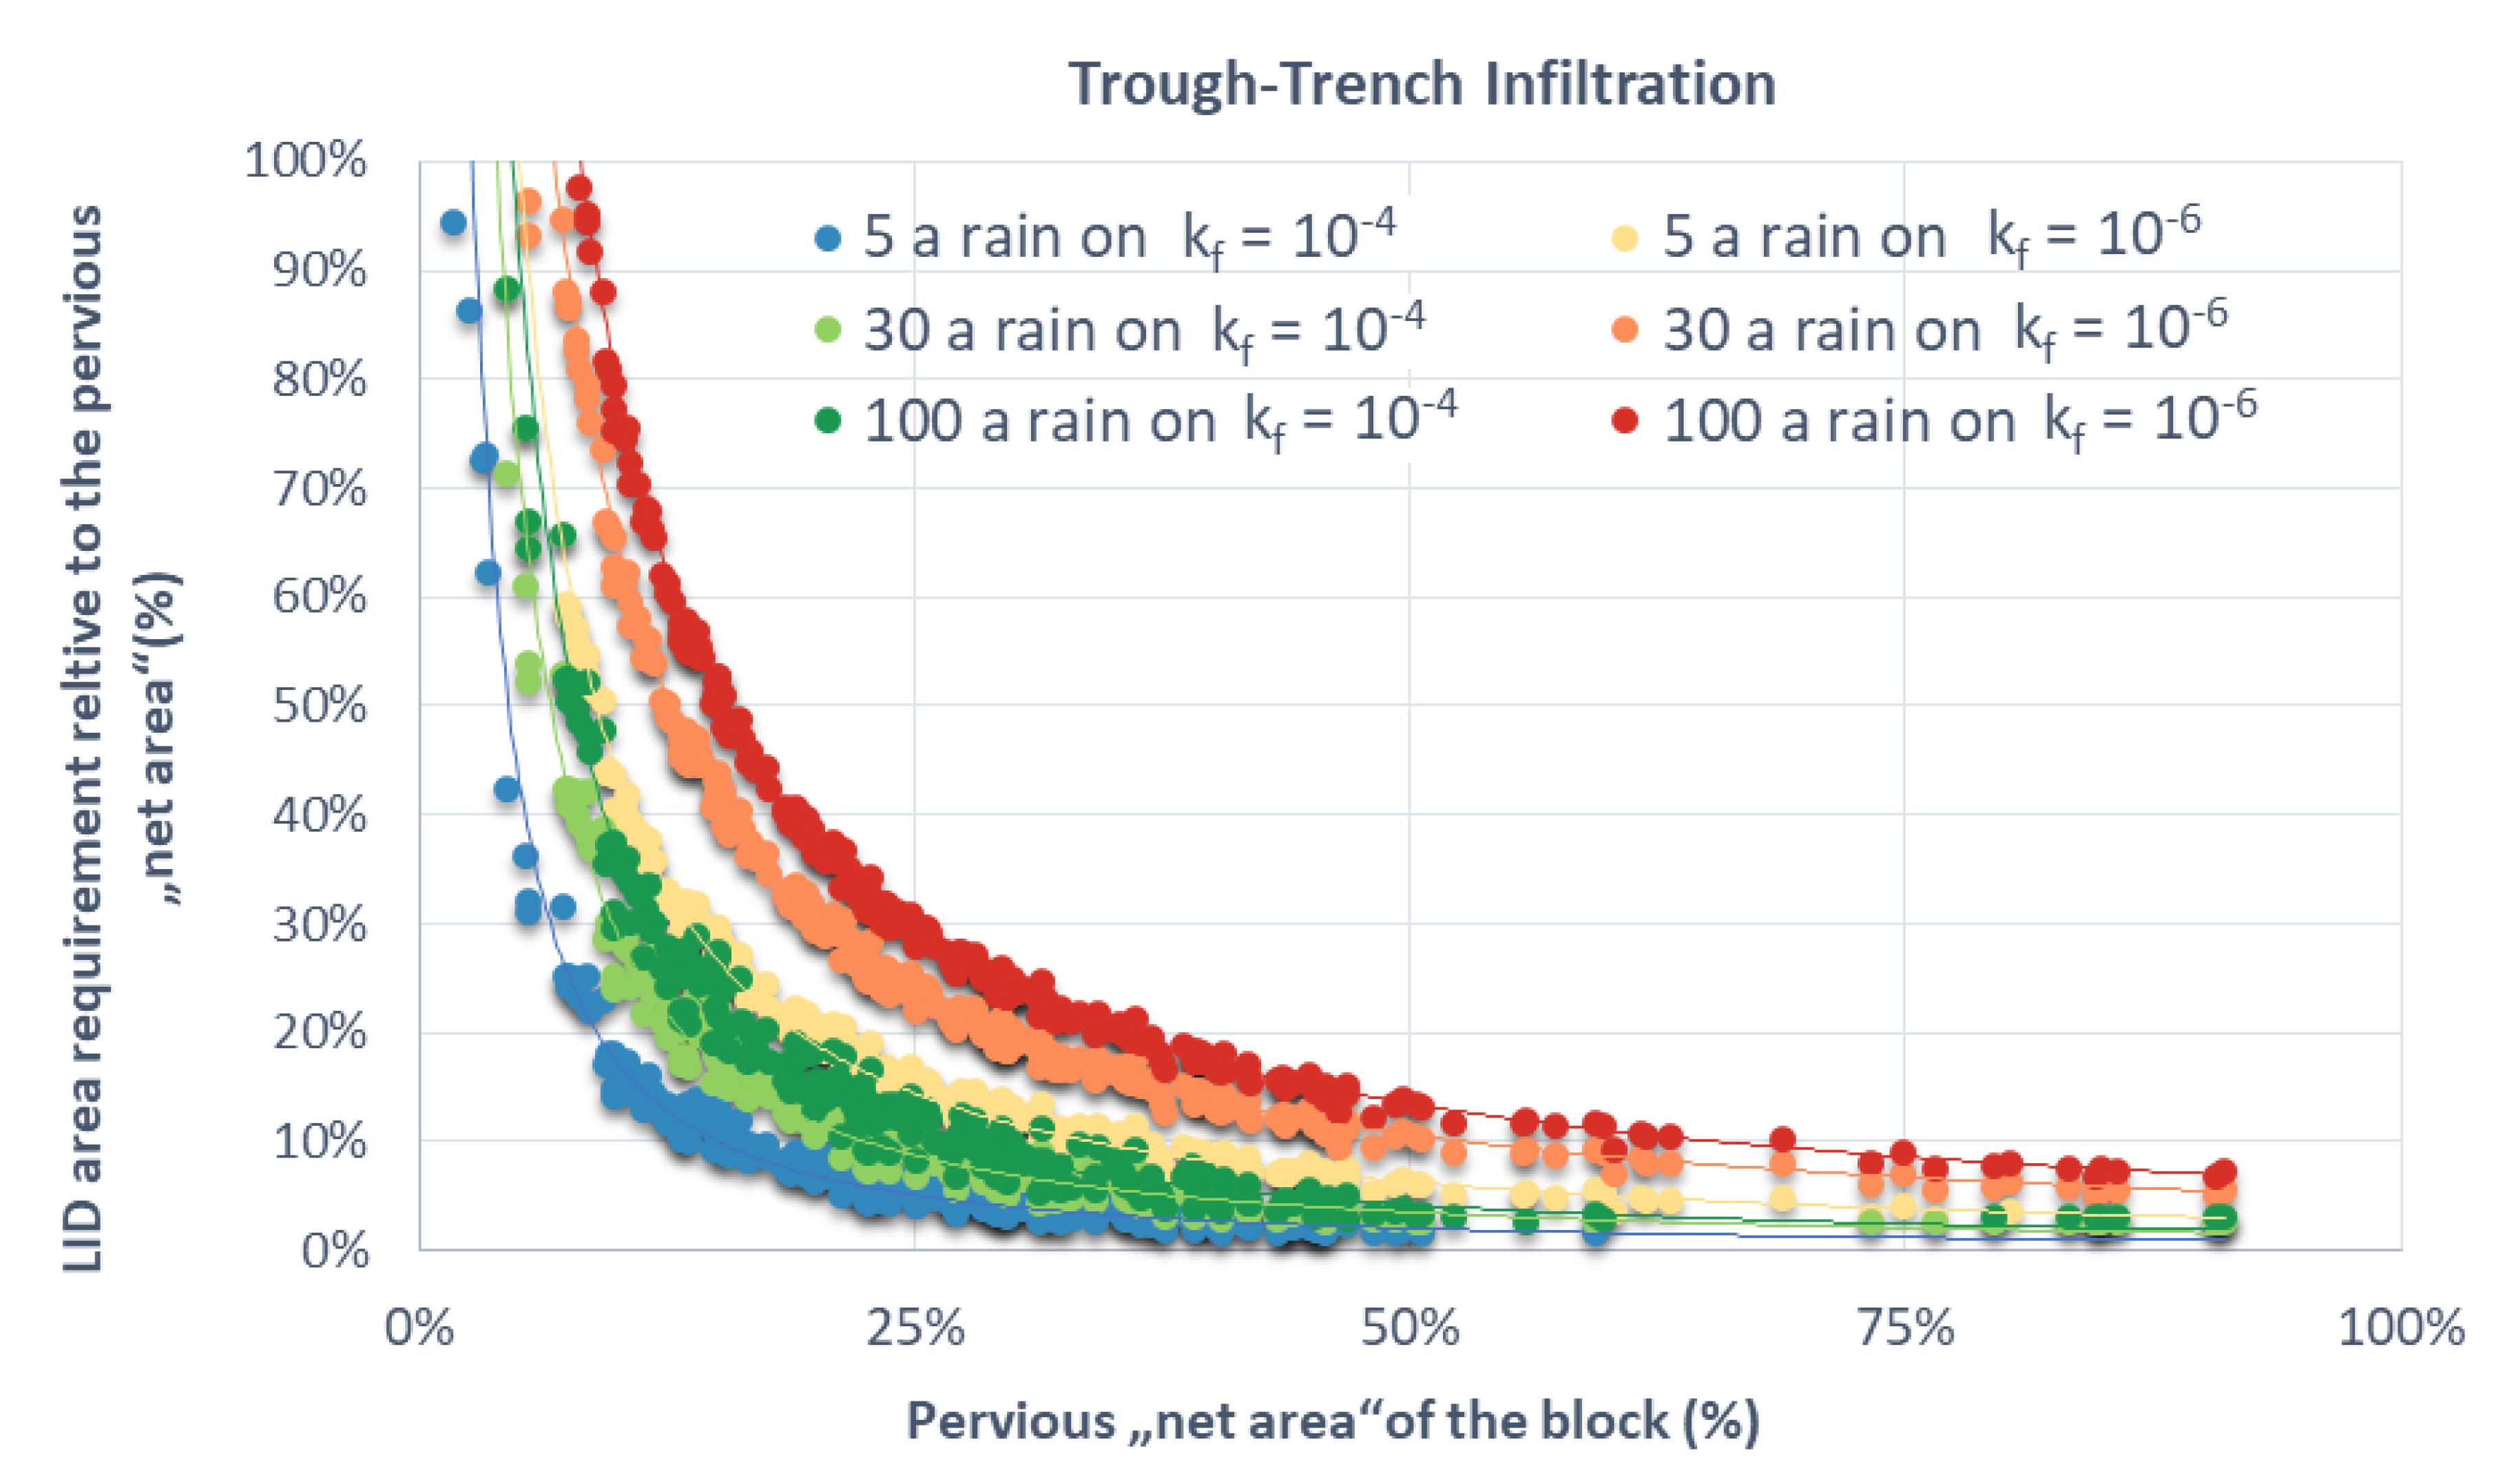
Simulation results for trough-trench infiltration were selected as an example of a LID with retention capacity (
Figure 7). For a 30-year rainfall event, the blocks equipped with trough-trench infiltration show a total runoff of 1226 m
3 in 2 h for a soil with high permeability (k
f = 10
−4 m/s). Relative to the stormwater of 320,466 m
3, the scenario shows nearly complete retention/infiltration (99.6%) of stormwater with a land requirement of only 6% of the available pervious “net area”. For a soil with low permeability, the total runoff is 3439 m
3 (retention/infiltration 98.9%) with a land use of 15.5% of the available area (
Figure 7).
Up to 100% reduction of the runoff was achieved through the combinations of LIDs (Secnarios 5–7) for both high (k
f = 10
−4 m/s) and low permeable soils (k
f = 10
−6 m/s) even for the extreme rainfall events (
Table 2), revealing the high potentials of the LIDs in urban blocks.
3.3. Space Requirement of the LIDs
The results show that the reduction in surface runoff depends on the LID used and the distribution of impervious and pervious surfaces. Using the average space requirements for each LID (from the 267 blocks), a summary was prepared for the entire study area. In parallel, the results of the specific cost analysis were summarized for the entire study area and each scenario.
The results indicate that there is no simple trade-off between area demanded and costs. The cost analysis shows that the annualized costs of the scenarios ranged between 0.4 million €/year to 3.6 million €/year, depending on the type of the LID, soil, and the return period of the rainfall events.
The most cost-effective scenario with 0.4–0.8 million €/a for the soil with high permeability proved to be swale infiltration (Scenario 2), with an effectiveness of more than 99% reduction of the initial stormwater volume through retention and infiltration. Despite the increase in costs by a factor of 4 (€1.7–€3.4 million/yr) the swale infiltration remains the most cost-effective LID among the scenarios even for the low permeability soil (k
f = 10
−6 m/s). However, the space requirement for the trough infiltration is much higher compared to other LIDs such as trench infiltration (Scenario 3) and trough-trench infiltration (Scenario 4) (see
Table 3).
It is shown that coupling trough-trench infiltration with other LIDs (Scenario 5–7) has no significant impact on annual costs.
Surface infiltration (Scenario 1) is only conditionally suitable for use in urban blocks and is only applicable at relatively high costs (€1.5–2.5 million/year) with an efficiency of >90% for well-drained soil conditions.
In the model, the permeability of the soil has the greatest influence on the annual costs. Reducing the permeability of the soil from high (kf = 10−4 m/s) to low (kf = 10−6 m/s) leads to an increase in annual costs by a factor of about 3 for all scenarios considered, despite showing the same efficiency (>99%). In comparison, an increase in rainfall intensity has a smaller impact. Sizing the LID for a heavy rainfall event of 100 years increased the specific costs for the LIDs by a factor of about 2 compared to a five-year rainfall event.
4. Discussion
Many studies have demonstrated the positive effects of LIDs on mitigating runoff and restoring the urban water cycle [
20,
38,
39,
40]. However, a direct literature-based comparison of individual LIDs is often not possible because the results described depend on local conditions such as soil permeability, rainfall intensity, and the degree of sealed area.
Considering this, the MUST-B approach described here offers distinct advantages. The first factor that distinguishes the MUST-B approach from other methods and approaches is the basic principle of the approach to divide the complex urban area into smaller functional units (urban blocks). By forming city blocks, MUST-B provides a unified analysis process for each block rather than dealing with a highly complex urban environment.
The urban blocks used in the MUST-B approach lay the foundation for an analysis method that can systematically define the potential of LIDs in any urban setting. In addition, the MUST-B approach is distinguished by the exclusion of the traffic area from the analysis, which greatly facilitates the modeling of LIDs within the city, as the exclusion of streets also means that the urban drainage system does not need to be considered in the model.
In terms of analysis methodology, the MUST-B approach bisects the computational modeling process by relying only on the hydrologic process rather than also performing the hydrodynamic calculations commonly used for stormwater runoff modeling [
23]. Nonetheless, the approach provides analyses for reducing stormwater runoff into existing urban drainage systems, contributing to decision making for expansion or redevelopment of aging sewer systems.
There are similar approaches for modeling and simulation of LIDs reported by Liu et al. [
41] and Xu et al. [
42], where the study area is divided in similar functional units. However, while Liu et al. [
41] focused on using only roof greening on available roof area to mitigate the stormwater runoff, Xu et al. [
42] developed a method to quantify the capacity of transporting runoff between the blocks. Transporting the runoff between blocks was not an option in this study, due to the high costs involved in such options.
The cost estimate ignores the strong influence of further local impacts on the costs (e.g., economies of scale, accessibility, gradient), which overlay the systematic impacts of net area, LID-type, soil permeability, and rainfall events that are worked out here. This local effects should be taken into account when advancing from a potential analysis as being done here.
In addition, above mentioned studies focused on designing LIDs on available areas and finding the effect on the runoff mitigation, while our study systematically analyzed the maximum potential of reduction of stormwater runoff through various LIDs aiming at minimizing the runoff as much as possible.
Another factor which sets the MUST-B approach apart from the traditional methodology is the fact, that the results of the MUST-B approach can be applied to other cities easily due to the advantage of using urban blocks as functional units. For instance, based on the results (sizes of the various LIDs), a sizing chart could be developed which can be used for other cities to define the required size of the LID, once the constellation of the pervious and impervious surfaces are known (
Figure 8). However, it has to be stated that these regressions only apply to the LIDs with the same technical specifications as the current study.
The obtained formulas of the exponential regression curves were summarized for the Scenarios 1 to 4 in
Table 4. The regression formula can be used to manually calculate the area required to construct the LID for blocks as a function of the available ‘net area’ without the need for hydrological modeling.
Following an example for a block with the dimensions:
- (a)
Total area of the urban block: 10,000 m2.
- (b)
Pervious “net area”: 2500 m2 (pervious “net area”/total area = 0.25 (25%))
For a 30-year rainfall event on a soil with low permeability (k
f = 10
−6 m/s), the percentage of area required for a trough-trench infiltration is calculated using the regression formula shown in
Table 4
where:
Accordingly, for a trough-trench infiltration to fully retain and infiltrate the water from a 30-year rainfall event, a proportion of the available ‘net area’ of 0.23 (=23%) is required. For the exemplary block, this corresponds to an area requirement for the trough-trench infiltration of 2500 m2 × 0.23 = 575 m2.
Finally, the MUST approach can be applied to both small and large urban areas. Scaling of the model is accomplished through the aggregation of individual city blocks and thus does not make the application more complex even at a larger scale.
5. Conclusions
The developed modeling approach MUST-B allows a fast generation of software based technological concepts for the estimation of the potential for a decentralized stormwater management in urban environments. The modeling approach is based on the urban block as the smallest functional unit for precipitation management and is easily scalable to larger urban areas due to the functional aggregation of the blocks. The data on which the approach is based are usually available at local level, e.g., in the geodata service of cities and municipalities. This eliminates the need for cost-intensive new data collection. The case study of the Leipzig-Nord district demonstrates the great potential of decentralized urban stormwater mangement for the mitigation of stormwater runoff on city block level within existing urban structures.
Decentralized measures on block level can retain and infiltrate almost 100% of the precipitation water, even for extreme conditions (low permeable soil: kf = 10−6 m/s) and extreme rainfall events (100-year, 2 h, 60 mm). Thus, hydraulic loads of existing wastewater infrastructures are reduced, flood hazards are avoided and the local water balance is alleviated.
The results of the potential analysis imply that effective technical possibilities for decentralizing stormwater management are also possible in the course of redensification of inner-city areas and the associated reduction of pervious areas at city block level.
The inhabitant-specific costs for an areal decoupling of urban blocks from rainfall sewer in the Leipzig-Nord district of >99% (permeable soil kf = 10−4 m/s, 30-year rainfall event) were estimated to be approx. 13€ per inhabitant and year for the most favorable technology variant.
Computer simulation and visualization of urban decentralized precipitation management options facilitates decision making for different target groups and is a useful planning basis for its implementation. For users, this model approach is easy to follow and with the input data described, transferability to other urban neighborhoods is ensured.
The development of integrated water and urban transformation concepts is a highly complex challenge in terms of sustainability and implementation-there can be no standard transformation recipe that is valid for all cities. Ultimately, individualized solutions must be developed whose implementation options are determined not only by technological, economic and ecological effects, but also by the applicable legal framework. In this regard, the MUST-B approach is a solid basis for further adjustments. Nevertheless, this study shows that typologies can be used at urban block level for existing neighborhoods that ensure transferability.


 ,
, 


