Article

Plasticity in Reproductive Traits, Condition and Energy Allocation of the Non-Native Pyrenean Gudgeon Gobio lozanoi in a Highly Regulated Mediterranean River Basin

by
Fátima Amat-Trigo
1,
Mar Torralva
1,
Daniel González-Silvera
2,
Francisco Javier Martínez-López
2 and
Francisco José Oliva-Paterna
1,*
1
Department of Zoology and Physical Anthropology, Faculty of Biology, University of Murcia, 30100 Murcia, Spain
2
Department of Physiology, Faculty of Biology, University of Murcia, 30100 Murcia, Spain
*
Author to whom correspondence should be addressed.
Water 2021, 13(3), 387; https://doi.org/10.3390/w13030387
Submission received: 18 December 2020 / Revised: 24 January 2021 / Accepted: 29 January 2021 / Published: 2 February 2021
(This article belongs to the Special Issue Ecology and Conservation of Freshwater Fishes Biodiversity)

Abstract

:
The invasion success of non-native fish, such as Pyrenean gudgeon Gobio lozanoi in several Iberian rivers, is often explained by the expression of its life history traits. This study provides the first insights into the reproductive traits, fish condition, and energy allocation (protein and lipid contents of tissues) of this species, along a longitudinal gradient in one of the most regulated river basins in the Iberian Peninsula, the Segura river. Larger sizes of first maturity, higher fecundity and larger oocytes were found in fluvial sectors with the most natural flow regimes, characterised by a low base flow with high flow peaks in spring and autumn. A delay in the reproductive period, lower fish condition and no differences in sex-ratio were observed in fluvial sectors with a high increase in base flow and notable inversion in the seasonal pattern of flow regime. Lipid contents in the liver and gonads were stable during the reproductive cycle and decreases in muscle were noted, whereas ovarian and liver proteins increased. In relation to energy allocation for G. lozanoi, an intermediate energy strategy was observed between income and capital breeding. Our results support the hypothesis that the high plasticity of G. lozanoi population traits plays a significant role in its success in a highly regulated Mediterranean river basin. Understanding the mechanisms by which flow regulation shapes fish populations in Mediterranean type-rivers could inform management actions.

1. Introduction

Flow regulation is one of the most widespread anthropogenic alterations in natural aquatic ecosystems and plays an important role in habitat development, food sources availability and the distribution of organisms [1,2]. There are many studies that confirm the impact of flow regulation (i.e., dams and weirs) on the structure and functioning of rivers, and in particular, how they affect populations of fish worldwide [3,4,5]. Stream flow is a factor which has been considered as an important force shaping fish population traits [6,7] and life-histories [8,9], and several flow alteration studies have already shown significant effects on population traits such as, for instance, growth and maturation [5], changes in the timing of spawning and spawning areas [10,11], recruitment failure [12,13] and even changes in reproductive traits [3,14].
In relation to reproductive strategies, nutrient acquisition and energy allocation to reproduction are essential for energy balance in order to meet survival, growth and reproduction demands and, consequently, to develop the most competitive strategy [7]. Thus, the management of energy reserves and allocation during the reproduction process determines the reproductive strategy [15]. Fish species that can use the energy previously stored in tissues for the development and maturation of reproductive features have been referred to as capital breeders [16,17], and this strategy is typical of total spawners or species with synchronous oocyte development [15]. Alternatively, income breeding strategists include species that are not able to store energy and where reproduction success is determined by the environmental resources at the time of reproduction [18]. This strategy is more common in many small, batch-spawning fishes with asynchronous oocyte development [15]. Between these two extreme strategies, some species show intermediate characteristics of both energy allocation strategies [19,20,21].
This study is focused on the reproductive strategy and energy allocation dynamics during the reproductive cycle of the Pyrenean gudgeon, Gobio lozanoi Doadrio and Madeira 2004 (Actinopterygii, Cyprinidae; Supplementary Material 1, Figure S1), which is an endemic species from the Iberian Peninsula and the south of France [22]. The species has been translocated into several Iberian catchments as live bait for angling and, nowadays, is widely distributed across the Iberian Peninsula, with established populations in many rivers [23,24]. Some authors consider this species as having a high capacity to spread and as being able to behave invasively, increasing its density rapidly and occupying new habitats [24]; a process which is probably favoured by river regulation and artificial impoundments [25]. It has already been suggested that this non-native species may have potential impacts on the environment and native species throughout several Iberian basins [23,25,26,27]. Some examples include interspecific competition for food resources [28,29] or disease transmission [30].
Freshwater biotas are especially vulnerable to new invasive fish, particularly in areas with high endemism, such as the Mediterranean basins [26,31,32]. The non-native populations of G. lozanoi have been previously classified as opportunistic strategists (sensu Winemiller and Rose [33]), but also as intermediate strategists because they use strategies ranging from periodic to opportunistic [34]. Thus, non-native populations of G. lozanoi are characterised by early maturity, low fecundity, multiple spawnings per year and have a long reproductive span [34]. However, there is a scarcity of studies that have dealt with the biology and reproductive traits of non-native populations of G. lozanoi [35,36,37]. Consequently, the negative effects of the species on native fish may not yet have been fully elucidated. In addition, no studies exist that have included a physiological approach to energy allocation dynamics in reproductive strategies.
A greater understanding of the phenotypic plasticity involved in the adaptation of non-native fishes to local conditions is an important tool for control programs [38]. According to Ribeiro and Leunda [39], there is a clear need for biological information about G. lozanoi population traits across the Iberian Peninsula and especially in its non-native river basins, which could be an important knowledge gap hampering effective control and management. Moreover, the life history variability of fish seems to play a key role in driving invasion success and significant intraspecific plasticity has often been observed in the process of acclimatization to new habitats [40,41]. However, nothing is known about the intraspecific variability of G. lozanoi along gradients in the same watershed or in terms of comparisons between populations located at different flow regimes. Taking into account that reproductive investment can be understood as the result of the energy balance between survival, growth and reproduction demands in order to achieve the most competitive strategy [7,15], the goal of this study was to analyse the reproductive traits and the energy balance of G. lozanoi in an invaded Mediterranean basin. The two main hypotheses proposed were: firstly, the reproduction strategy could show inter-population plasticity due to different flow scenarios and it is expected to be closer to an opportunistic strategy in fluvial sectors with the most unpredictable flow regimes. Secondly, energy allocation mechanisms should be closer to income breeding strategies according to its reproductive traits. For this purpose, the following specific objectives have been proposed: (a) to describe the reproductive and fish condition cycles of G. lozanoi in five fluvial sectors; (b) to describe the energy allocation (proteins and lipids contents) among tissues in this target fish; and (c) to analyse the relationships among reproductive traits, fish condition and patterns of energy allocation.

2. Materials and Methods

2.1. Ethical Information
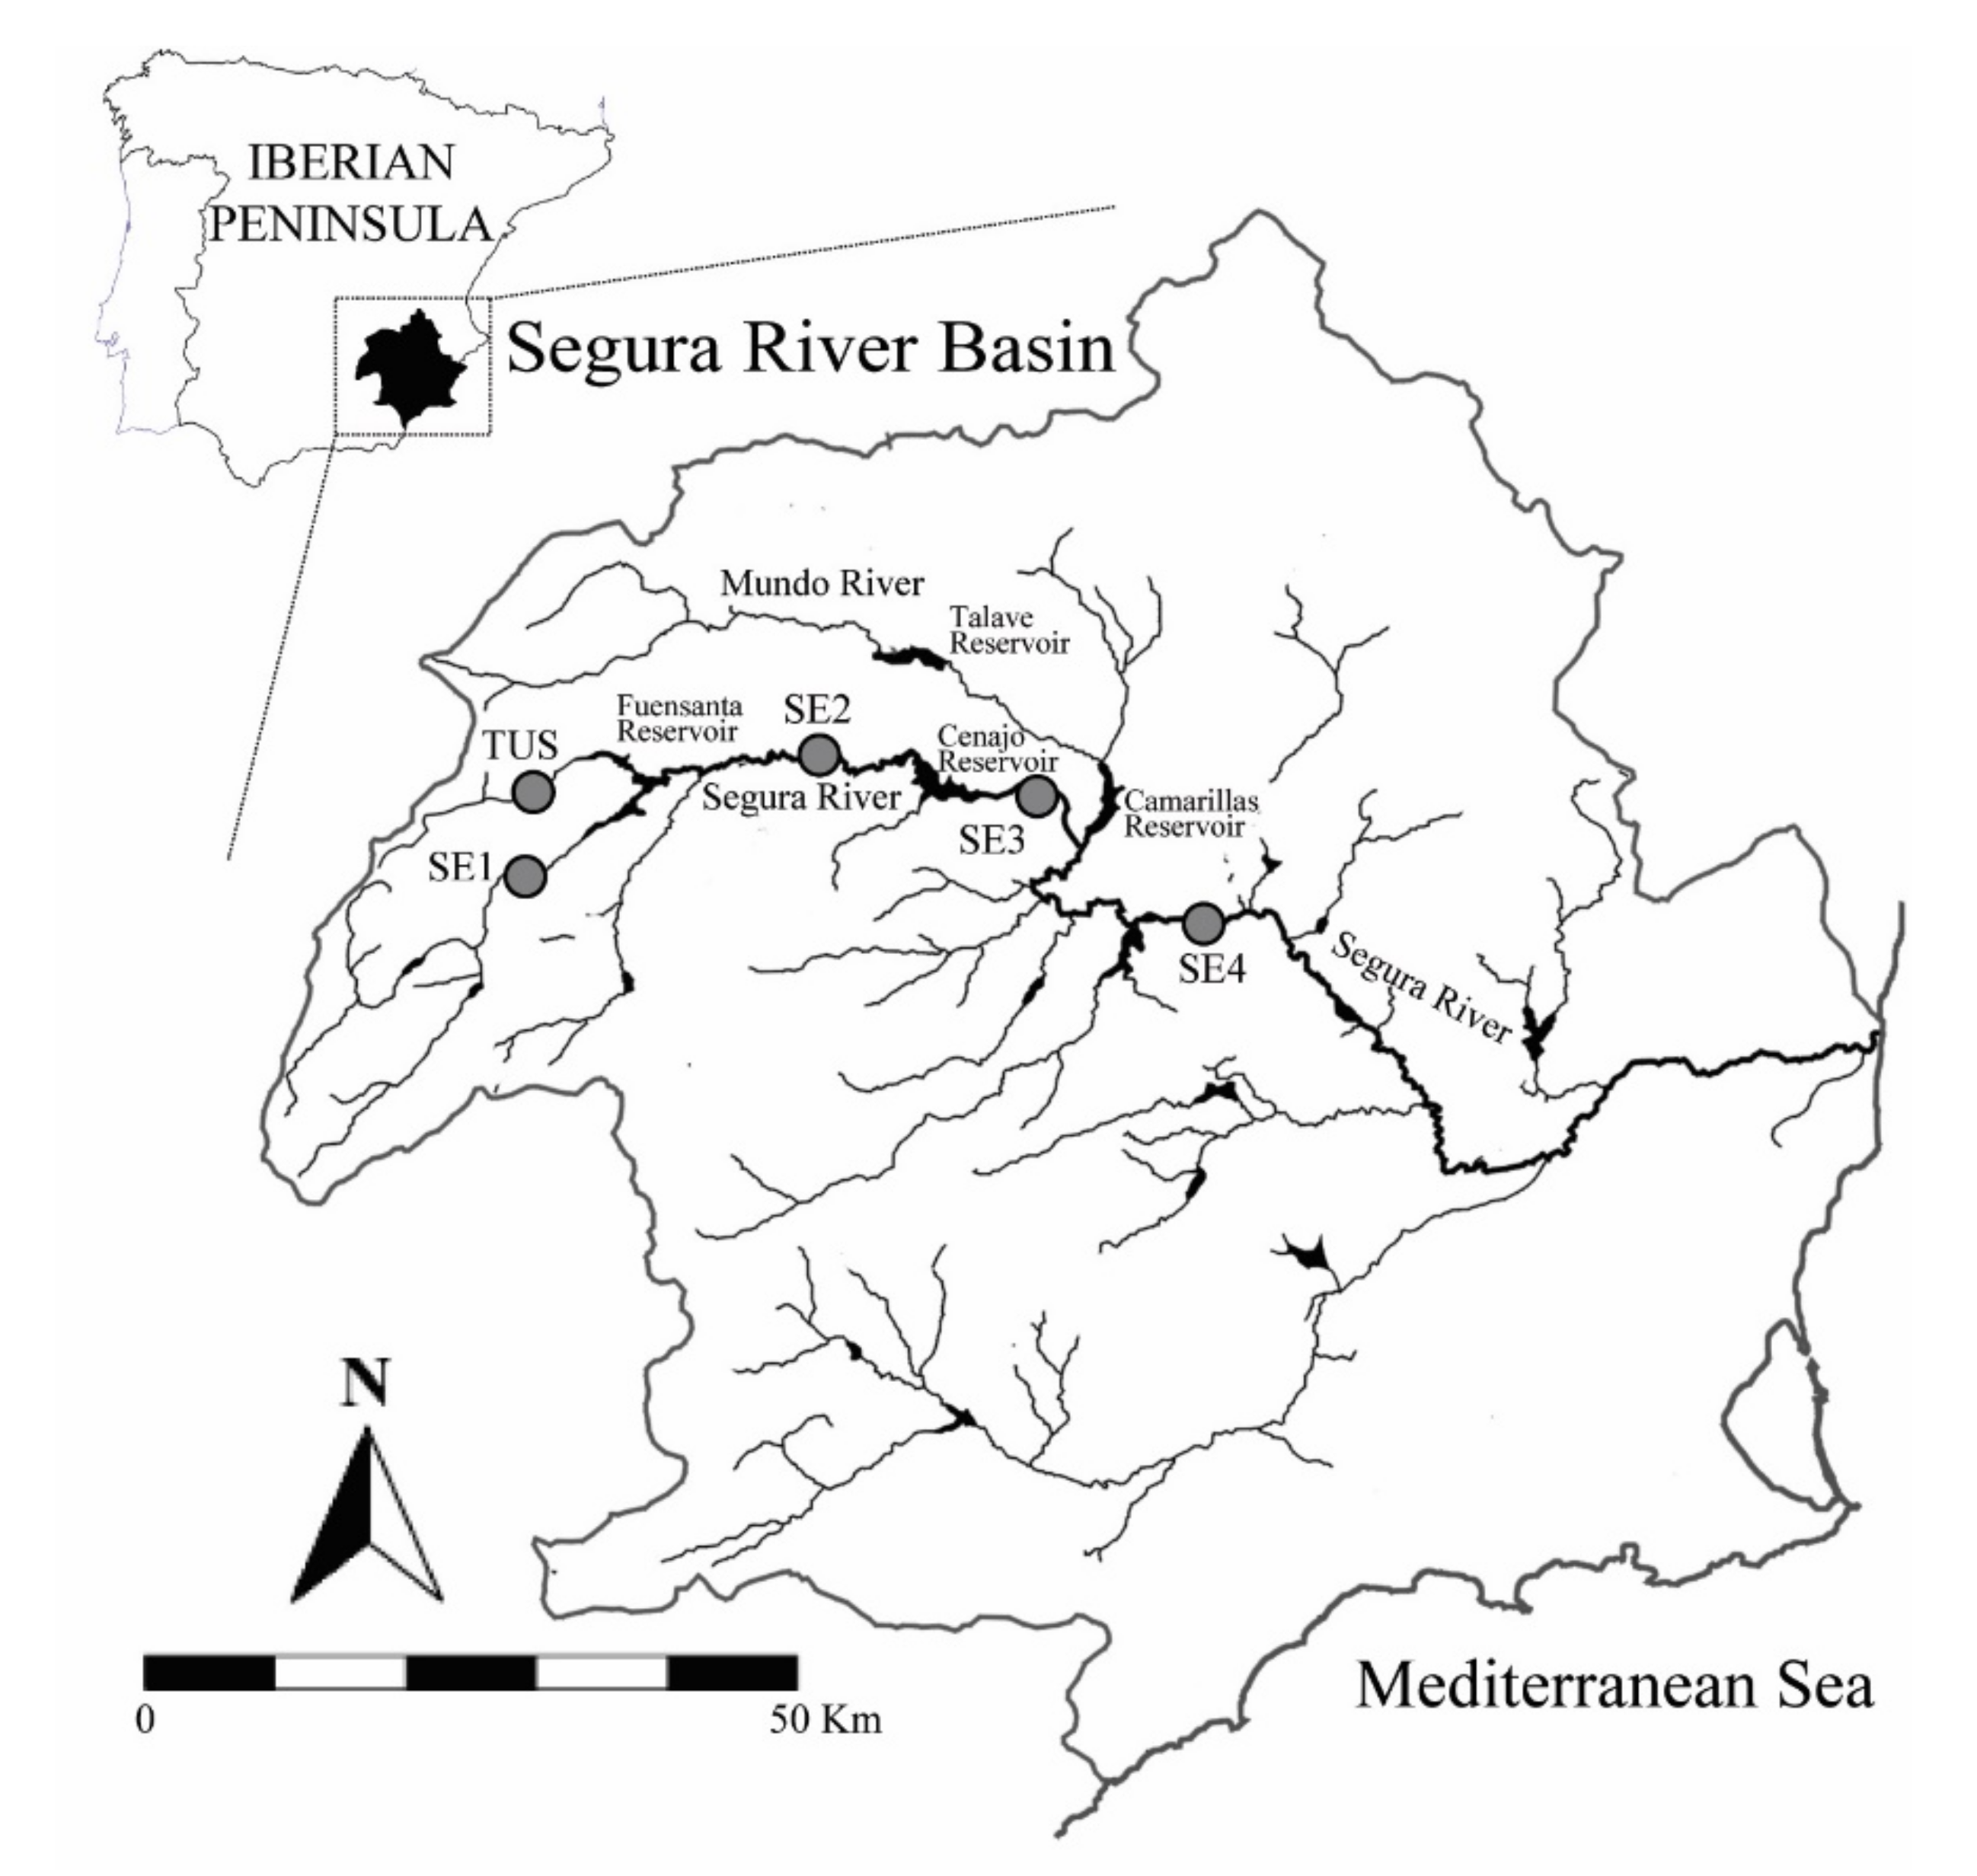
The care and use of experimental animals complied with University of Murcia and Spanish Law 32/2007 and RD 53/2013 animal welfare laws, guidelines and policies, as approved by Ministry of the Presidency, Relations with the Courts and Democratic Memory. The specific permit AUF20150077 was approved by the Regional Ministry of Water, Agriculture and Environment of Murcia and Castilla-La Mancha and it allowed us to sacrifice the non-native species of the Segura River Basin.

2.2. Study Area

This study was conducted in the upper and middle parts of the Segura River Basin (drainage area of 18,870 km2), a highly regulated river located in the southeast of the Iberian Peninsula (Figure 1). The Segura River Basin is characterised by a typical Mediterranean climate with a pronounced spatial and seasonal hydrological variability. Currently, this basin is highly regulated in terms of irrigation supply and human water demands, which have greatly modified the natural flow regime, resulting in changes in flow magnitude and a reverse seasonal flow pattern in some areas [42,43]. Supplementary Material 1 provides an accurate description about the flow regime characteristics of the sampled streams.
Sampling fluvial sites were selected following flow regime criteria. They were located along the longitudinal gradient of the basin in different hydrological sectors separated by large dams (Figure 1; Table 1). The flow characteristics ranged from natural (TUS) to reverse flow regimes (SE3 and SE4) (Supplementary Material 1, Figure S1 and Table S1). Each sampling site was characterised by the following six environmental variables (Table 1): altitude (Alt) (meters above sea level), ecological status sensu EU Water Framework Directive (Status) (with the following categories: 1 = high; 2 = good; 3 = moderate; 4 = poor), conductivity (µS cm−1), Fluvial Habitat Index (FHI) [44], Riparian Quality Index (RQI) [45] and 2015 mean monthly temperature (°C). These six selected environmental variables are among the ecological drivers that play a significant role in the freshwater fish ecology, and also in biological invasion processes by fishes, of the Mediterranean-type rivers [39,40].
Since first recorded in the upper region in the 1980s, G. lozanoi has been registered in fluvial sectors and reservoirs along the Segura River Basin [23,27]. The ichthyofauna of this basin is characterised by low species richness and the fish assemblage composition is dominated by non-native species [27]. The studied species share resources and habitats with native cyprinids, such as the southern iberian barbel Luciobarbus sclateri (Günther, 1868) and the south iberian chub Squalius pyrenaicus (Günther, 1868), and with several non-native fish to the basin, such as the pumpkinseed Lepomis gibbosus (Linnaeus, 1758), bleak Alburnus alburnus (Linnaeus, 1758), common carp Cyprinus carpio (Linnaeus, 1758), iberian straight-mouth nase Pseudochondrostoma polylepis (Steindachner, 1864), northern pike Esox lucius (Linnaeus, 1758), pike-perch Sander lucioperca (Linnaeus, 1758) and largemouth black bass Micropterus salmoides (Lacepèd, 1802).

2.3. Field Sampling and Laboratory Procedures

Fish were collected by electrofishing (1800 W DC generator at 200–300 V, 2–3 A) during a one-year study period (January–December 2015). One fisherman with an electric dip-net, supported by two assistants each with a non-electric dip-net, removed fish following a zigzagging and upstream direction of each sampling stretch (100 m long), which was blocked off with barrier nets (samplings were carried out between 10 a.m. and 4 p.m.). Samples were taken once every two weeks in spring and summer, and monthly during the rest of the year (Supplementary Material 1, Table S2). A total of 2333 G. lozanoi were caught (TUS: 437; SE1: 478; SE2: 385; SE3: 485 and SE4: 548) and, in accordance with Spanish regulations, immediately sacrificed in a water tank with an overdose of anaesthetic solution (1:10 solution of clove oil dissolved in ethanol 70%), before being placed on ice and then they were stored at −20 °C in the laboratory.
Fork length (LF ± 1 mm), total and eviscerated masses (MT and ME ± 0.1 g) and organ masses (hepatic and gonad, MH and MG ± 0.001 g) of a subsample of 1982 fish were recorded (TUS: 382; SE1: 403; SE2: 365; SE3: 366 and SE4: 466). Gonads were visually inspected for sex determination (male, female or immature), and also to determinate the reproductive stage (i.e., quiescence, maturation, spawning and postspawning). A subsample of 133 mature specimens (110 females, TUS: 20; SE1: 25; SE2: 24; SE3: 17 and SE4: 24, and 23 males, TUS: 13 and SE4: 10), with fork lengths ranging from 7.2 to 11.2 cm was used to estimate fecundity, oocyte size and physiological macronutrients (protein and lipid content in tissues). Due to protein and lipid quantification methods, there were not enough testis masses to perform physiological analysis in every sampling site. To quantify protein and lipid content in the muscle, liver and gonad, samples were weighed and protein levels were determined using the method of Bradford (1976) [46] and expressed as percentages. Total lipids were extracted following the method of Folch et al. (1957) [47]. Samples were weighed and homogenized in 5 mL of chloroform/methanol (2:1 v/v) and washed with KCl (0.88% w/v). The weight of lipids was determined gravimetrically after evaporation of the solvent and expressed as percentages. Finally, these fish were aged, counting true annuli from scales taken between the lateral line and dorsal fin origin.
Ovarian development and fecundity were studied using the gravimetric method [48]. To make sure that the ovary was homogenous in structure (number and size of oocytes), small portions of anterior, middle and distal parts were compared, and no significant differences were found (ANOVA, p > 0.05). Therefore, all oocytes present in a subsample from the mid-region of the right ovarian lobe (5% of the total weight of the gonad) were placed in Gilson liquid, shaken periodically to soften gonadal tissue and to disperse oocytes, washed with distilled water and preserved in 70% ethanol for following analyses [37]. Image processing program ImageJ v1.80 (available at https://imagej.nih.gov/ij/) was used to count and measure oocytes. Fecundity was determined in 39 mature females caught from April to July. Fecundity was analysed at three levels: potential (FecPOT), absolute (FecABS) and batch fecundity (FecBAT). These levels were determined by counting the total number of opaque and vitellogenic oocytes, total number of vitellogenic oocytes and total number of vitellogenic oocytes of the last mode representing size before spawning, respectively [48,49]. Oocyte size at each level of fecundity (ØPOT, ØABS, ØBAT) and maximum diameter (ØMAX) were assessed.

2.4. Statistical Analyses

Sex-ratio was analysed for the whole population and in every sampling site. The degree of significance of the obtained results was established in χ2 at a p-value of p < 0.05. Linear regressions of fecundity to fork length were fitted by least-squares method to log-transformed data.
Analyses of length-mass relationships were performed to study temporal variation in somatic condition (SC), hepatosomatic condition (HC) and gonadal activity (GSI) using the predicted values of ME, MH and MG from analysis of covariance, respectively. The statistical approach included the application of a covariance analysis (ANCOVA) using ME, MH and MG as dependent variables, LF as the covariate (log-transformed data) and reproductive stage (quiescence, maturation, spawning and postspawning stage) as a factor. The analysis was developed by sampling site and sex separately. Differences between dependent–covariate relationships were tested to check that the covariate by-factor interaction (homogeneity of slopes) was significant (p < 0.05). If the covariate by-factor interaction was not significant, standard ANCOVA was applied to obtain predicted values (predicted ME, MH and MG values). When differences were found, a post hoc Bonferroni test for multiple comparisons was performed. Student’s t-test was used to evaluate differences in fish conditions (somatic and hepatosomatic condition), gonadal activity, and protein and lipid content between sexes.
Analyses of variance (ANOVA) were performed to determine differences in protein and lipid content among the different temporal phases and to evaluate differences among sampling sites at each reproductive stage in fish conditions, gonadal activity, fecundity, oocyte diameter and percentage of proteins and lipids in tissues, followed by the Tukey HSD (honestly significant difference) test post-hoc comparisons if significant differences among populations were found. When data did not show homogeneity of variances, Welch’s analysis of variance (ANOVA) followed by T3 of Dunnett for pairwise multiple comparisons were used. The non parametric tests of the Kruskal–Wallis H-test and Mann–Whitney U-test were used when data did not fit normal distribution. Relations between fish condition, gonadal activity, fecundity, oocyte diameter and percentage of proteins and lipids by tissue were analysed using Spearman’s correlation coefficients.
Size of first maturity was estimated after running binary logistic regressions (immature-mature individuals) for each sampling site by sex (Supplementary Material 2). Differences in first maturity among sampling sites were tested using generalised estimating equations (GEE), with binomial errors and the logit link function.

3. Results

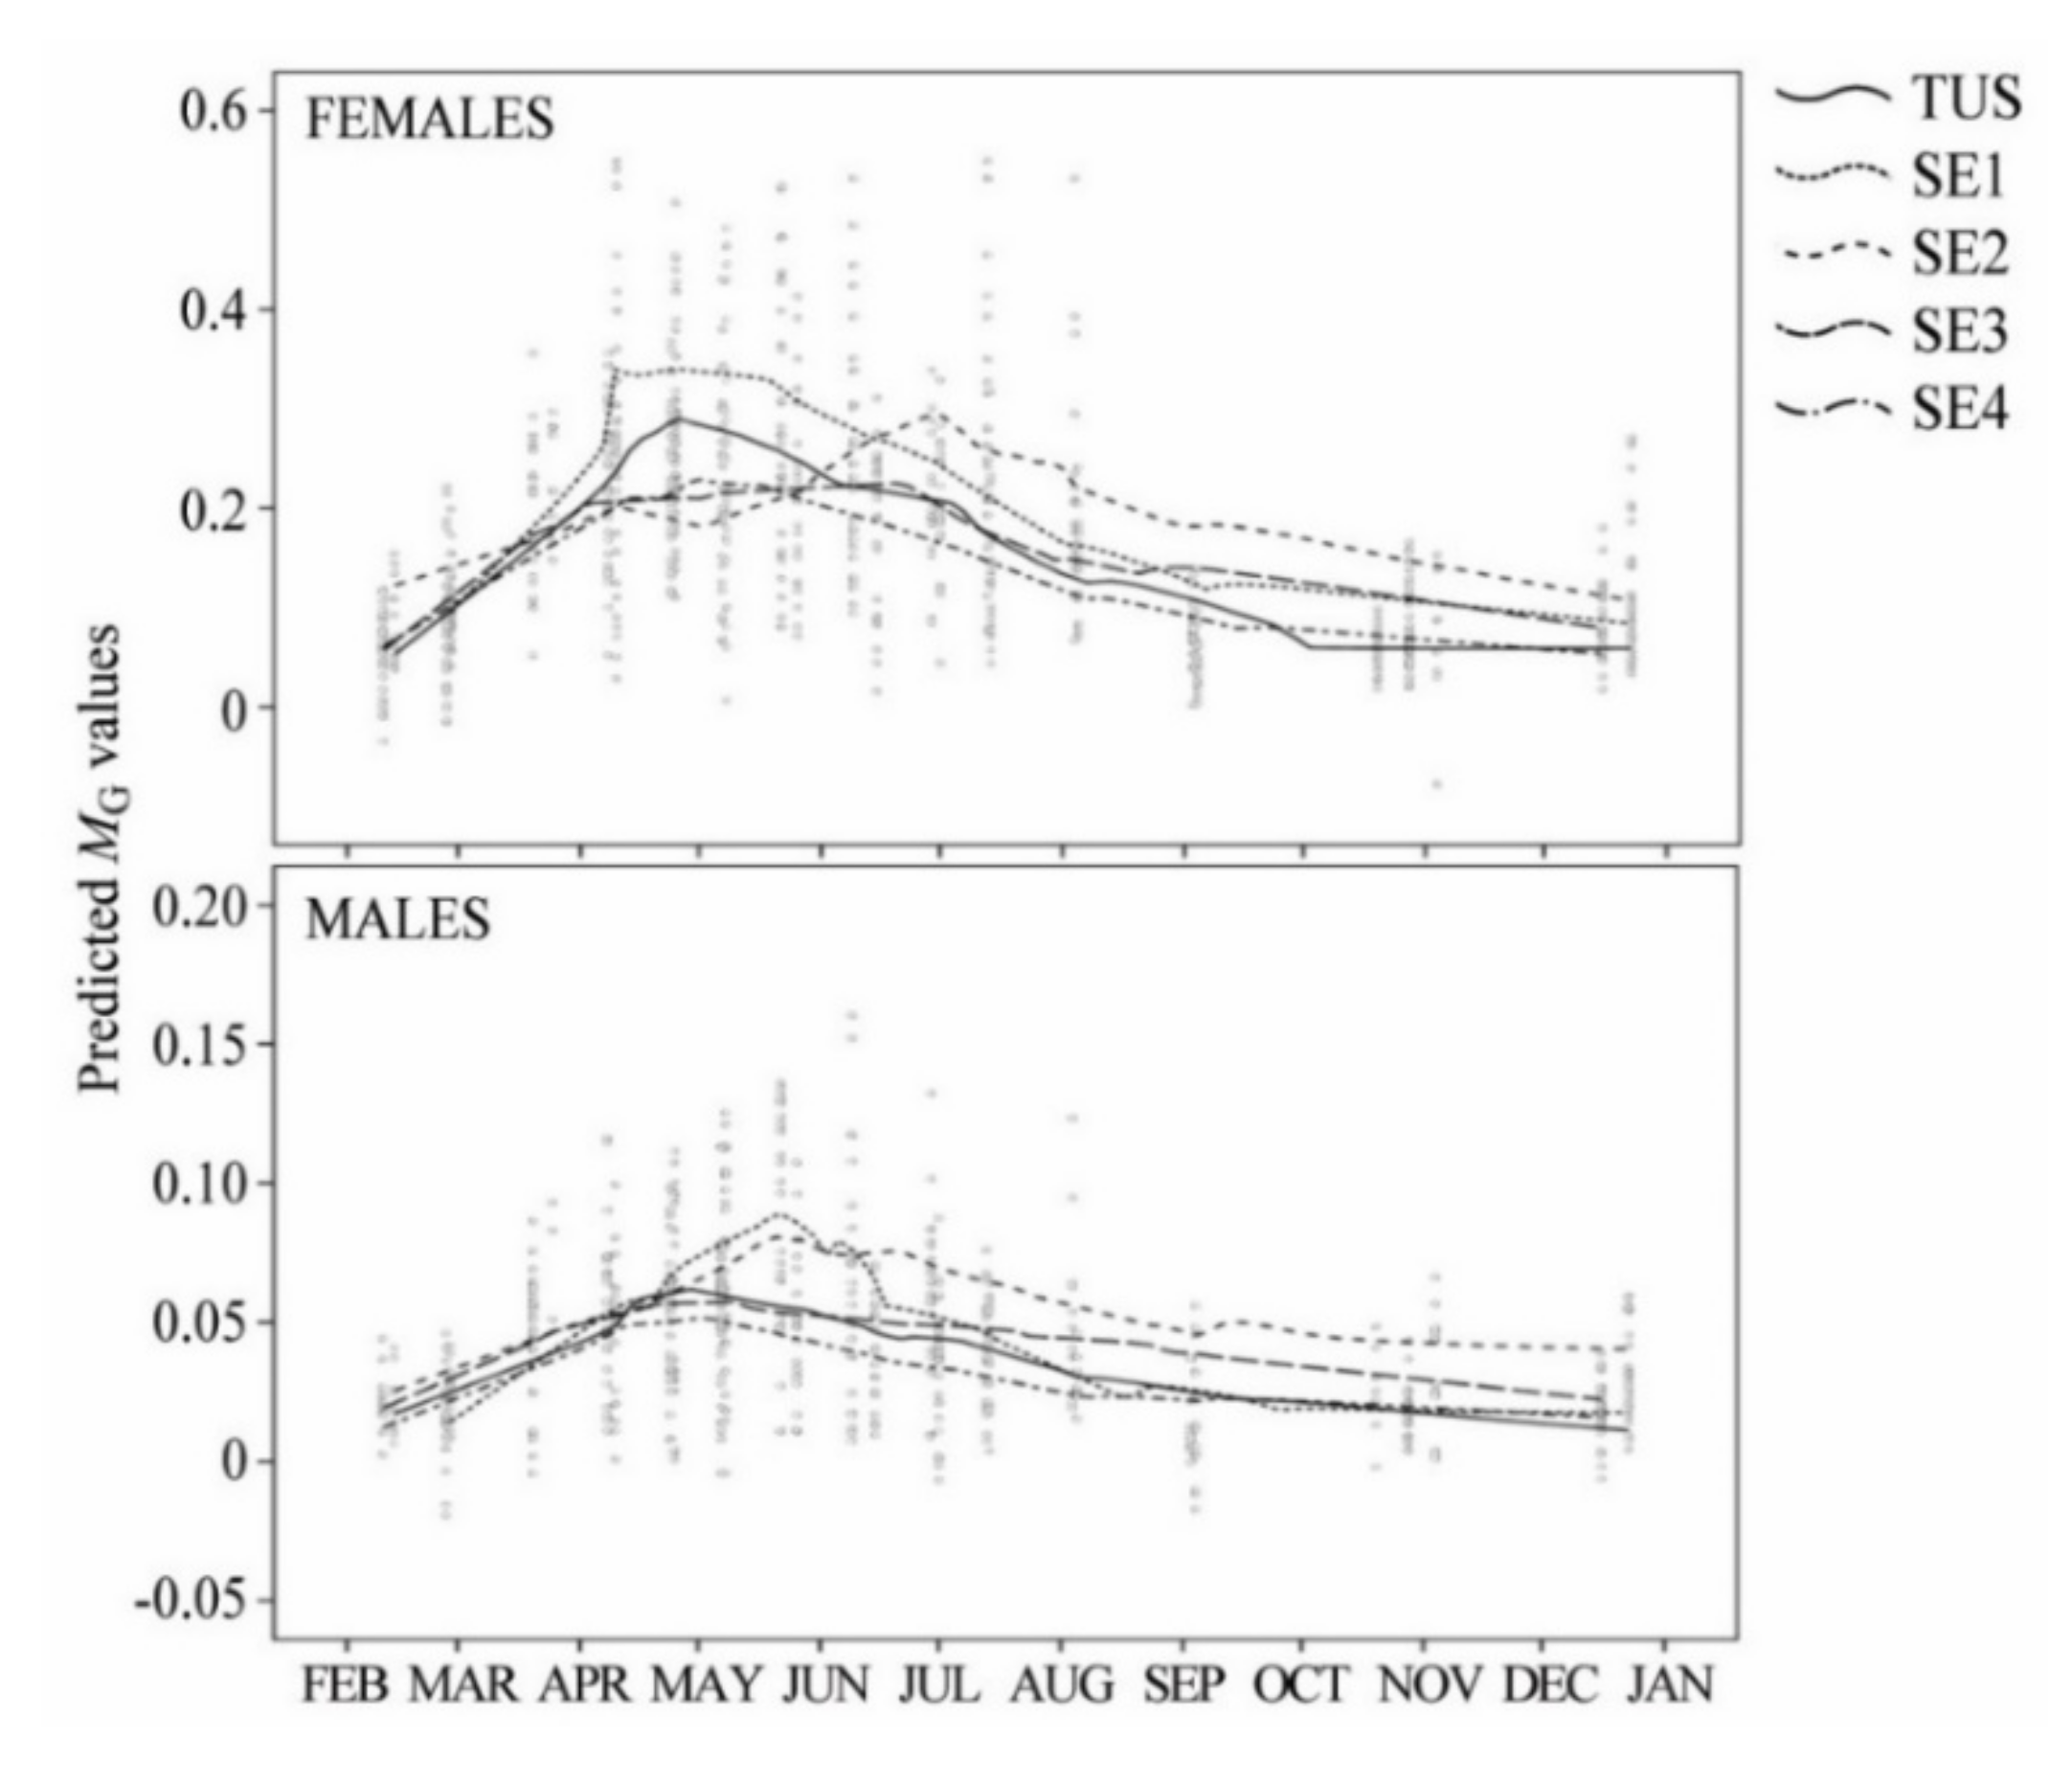
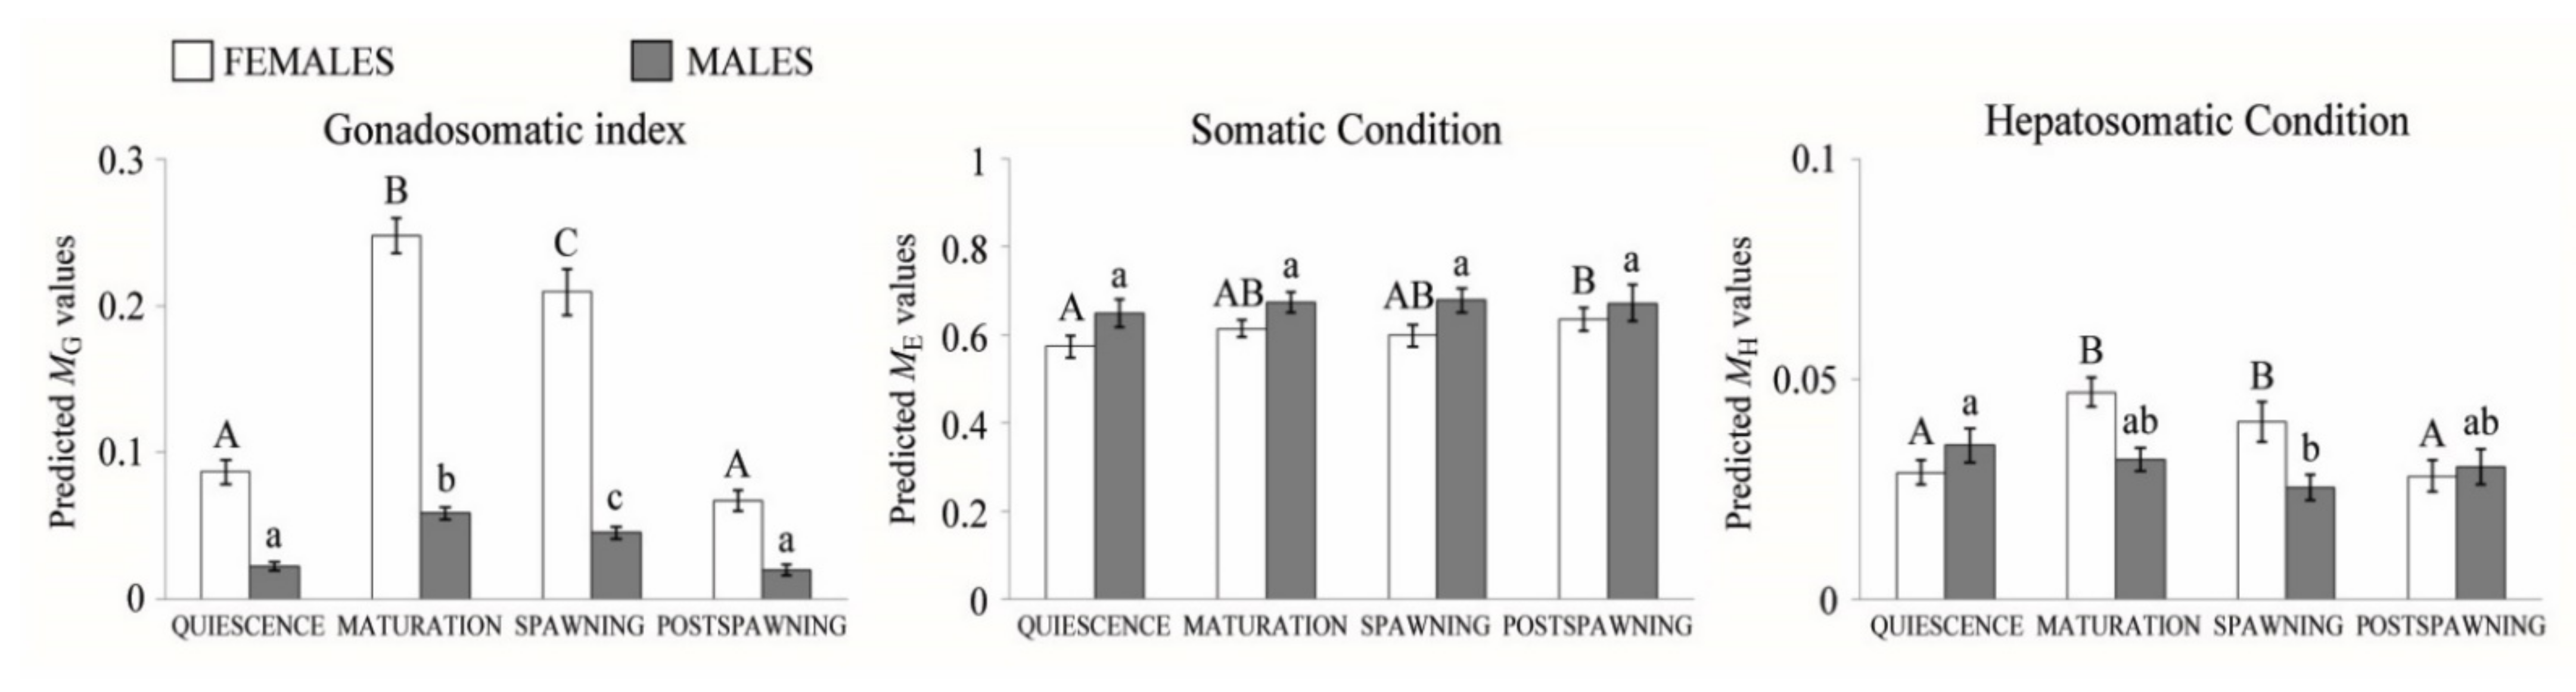
3.1. Reproductive Cycle and Temporal Variation in Fish Condition

The results of the ANCOVA test to estimate the effects of the factor on the LF-ME, LFMH and LFMG relationships are shown in the Supplementary Material 3, Tables S3 and S4. In both sexes, significant differences were observed among reproductive stages in the five sampling sites for fish SC, HC and GSI (Figure 2; Supplementary Material 3, Tables S3 and S4).
The reproductive cycle was fitted by the ANCOVA predicted MG values as a Gonadosomatic index (GSI) showing significant temporal differences in the gonadal activity (Figure 2). Both sexes showed a similar reproductive cycle in which four temporal stages were identified based on the GSI values (Figure 2): (1) the quiescence stage, with low values of GSI in winter; (2) the maturation stage, when GSI values rise up steeply—especially in March—and reach the maximum values at the beginning of May in females (except females from SE2) and also in males from TUS, SE3 and SE4, however, in males from SE1 and SE2, maturation was observed in late May; (3) the spawning stage, when GSI values are steady or decreasing moderately until late summer or early fall, and (4) the regression stage or postspawning, when GSI continues to decrease and reaches minimum values (Figure 2). The female gonadosomatic index was significantly higher than the male’s in all reproductive stages (Student’s t-test; quiescence stage: t = −14.56 p < 0.001; maturation stage: t = −28.97 p < 0.001; spawning stage: t = −20.21 p < 0.001; postspawning stage: t = −11.54 p < 0.001). Significant differences in the gonadal activity among reproductive stages were found in the total population (Figure 3) and when sampling sites were analysed individually for both sexes (Table 2). The GSI was significantly different among sampling sites for the total of fish (both males and females) (females Kruskal–Wallis, χ2 = 46.17, p < 0.001; males Kruskal–Wallis, χ2 = 20.09, p < 0.001), SE1 and SE2 populations showing higher GSI values and SE4 the lowest values in both sexes (Table 2).
The somatic condition (SC) and hepatosomatic condition (HC) varied over the reproductive cycle with the exception of SC of males (Figure 3), and they showed significant differences among reproductive stages in both sexes in most sampling sites when they were analysed individually (Table 2). Male SC was significantly higher than for the females in most reproductive stages (Student’s t˗test; quiescence stage: t = 3.83, p < 0.001; maturation stage: t = 4.01, p < 0.001; spawning stage: t = 4.29, p < 0.001), whereas female HC showed higher values than the males’ during maturation and at spawning (Student’s t-test; maturation stage: t = −7.13, p < 0.001; spawning stage: t = −5.49, p < 0.001). Fish conditions in all males showed significant differences among sampling sites (SC ANOVA, F(4, 598) = 15.56, p < 0.001; HC Welch ANOVA, F(4, 236.26) = 15.24, p = 0.001), SE3 and SE4 showed the lowest SC and HC values (Table 2). In all females, fish conditions also showed significant differences among sampling sites (SC Welch ANOVA, F(4, 327.68) = 39.99, p < 0.001; HC Kruskal–Wallis, χ2 = 73.99, p < 0.001), SE1 showed the highest SC and HS values, while SE3 and SE4 showed the lowest in both conditions (Table 2).

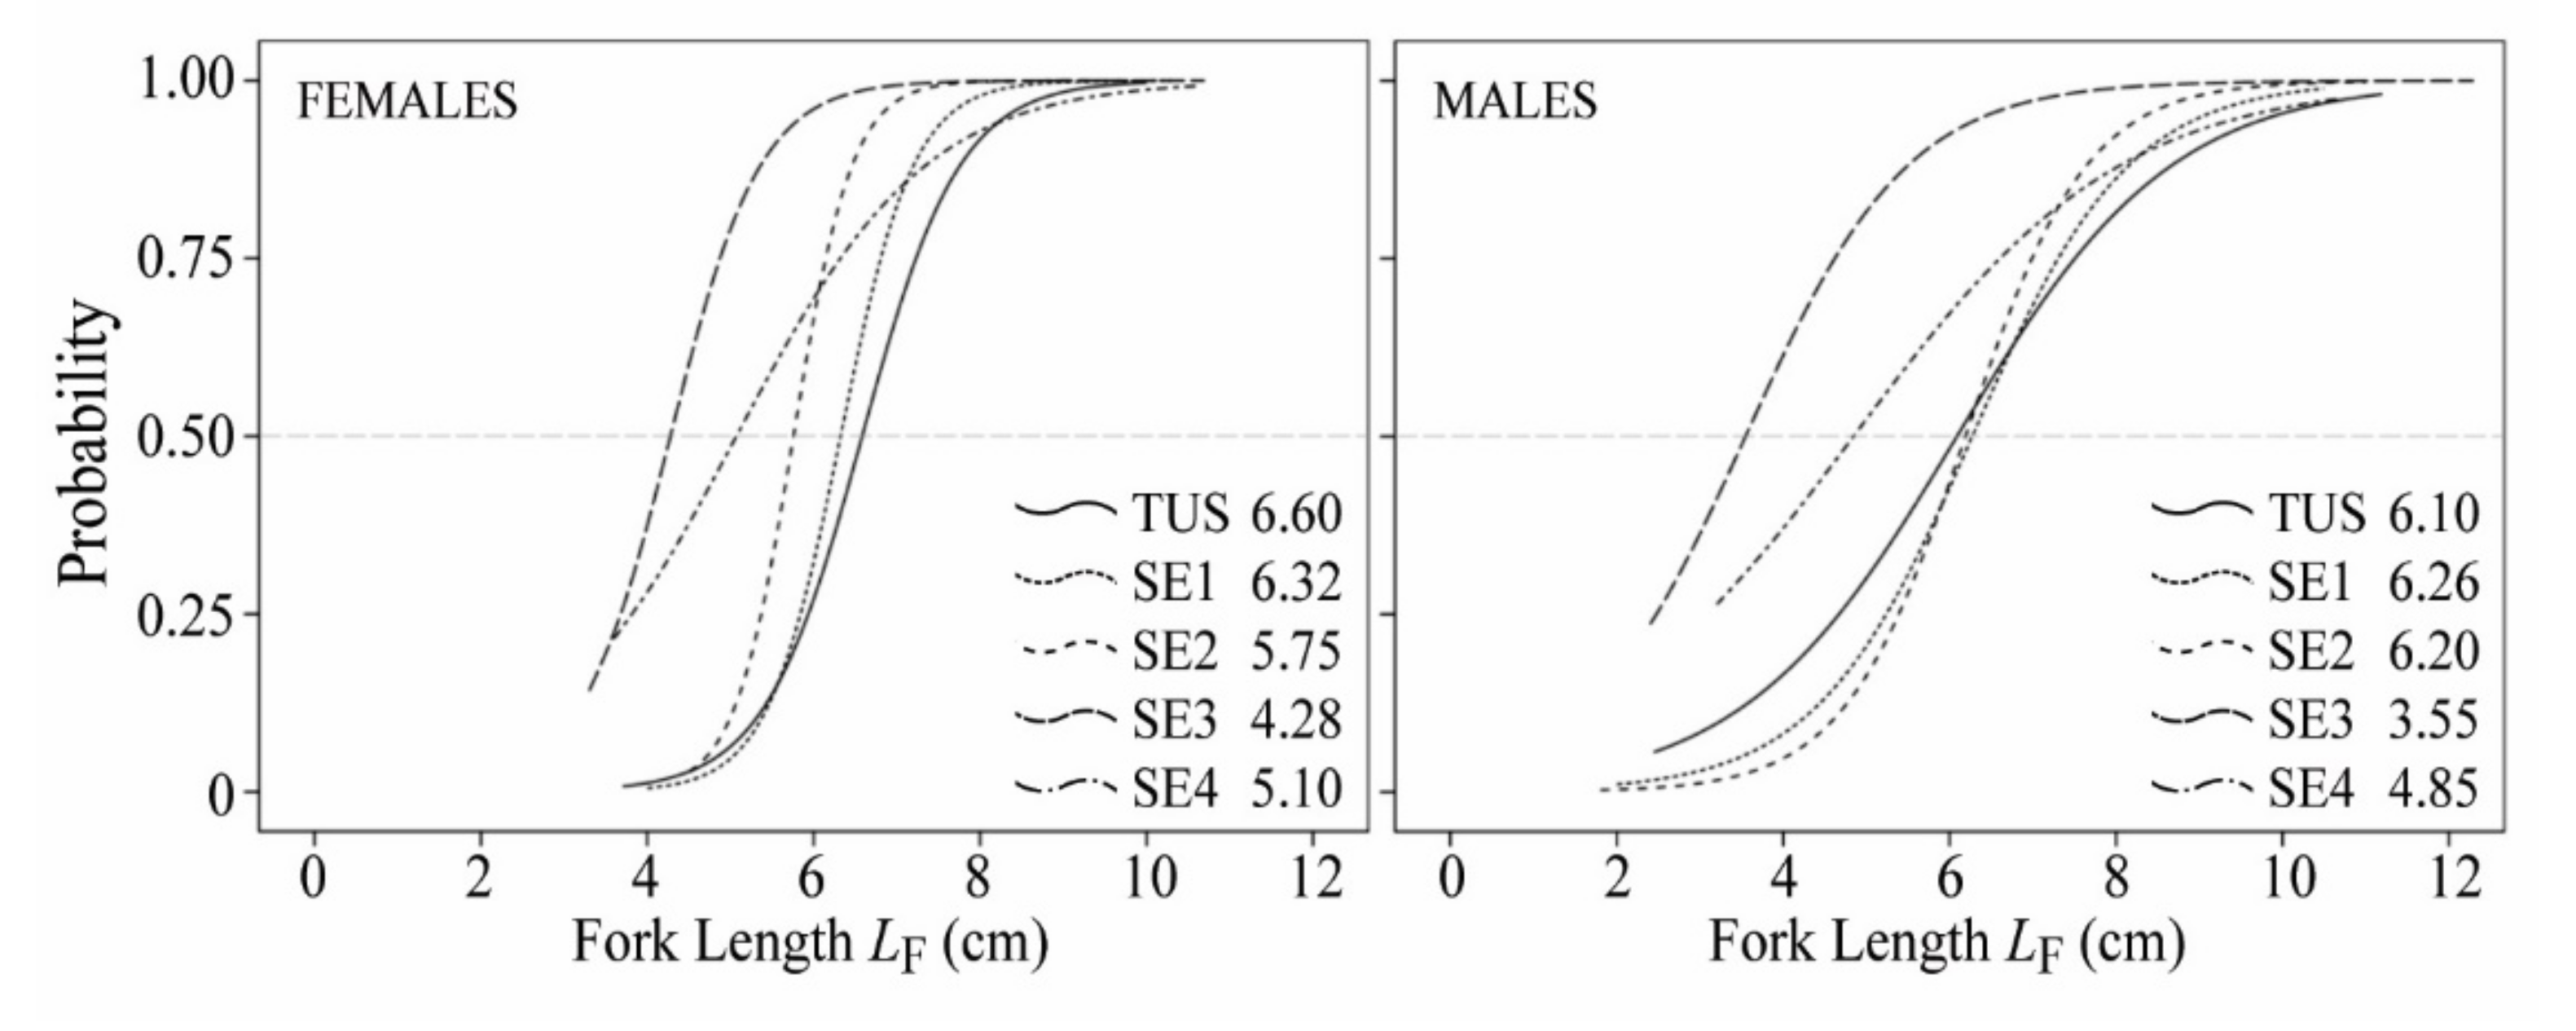
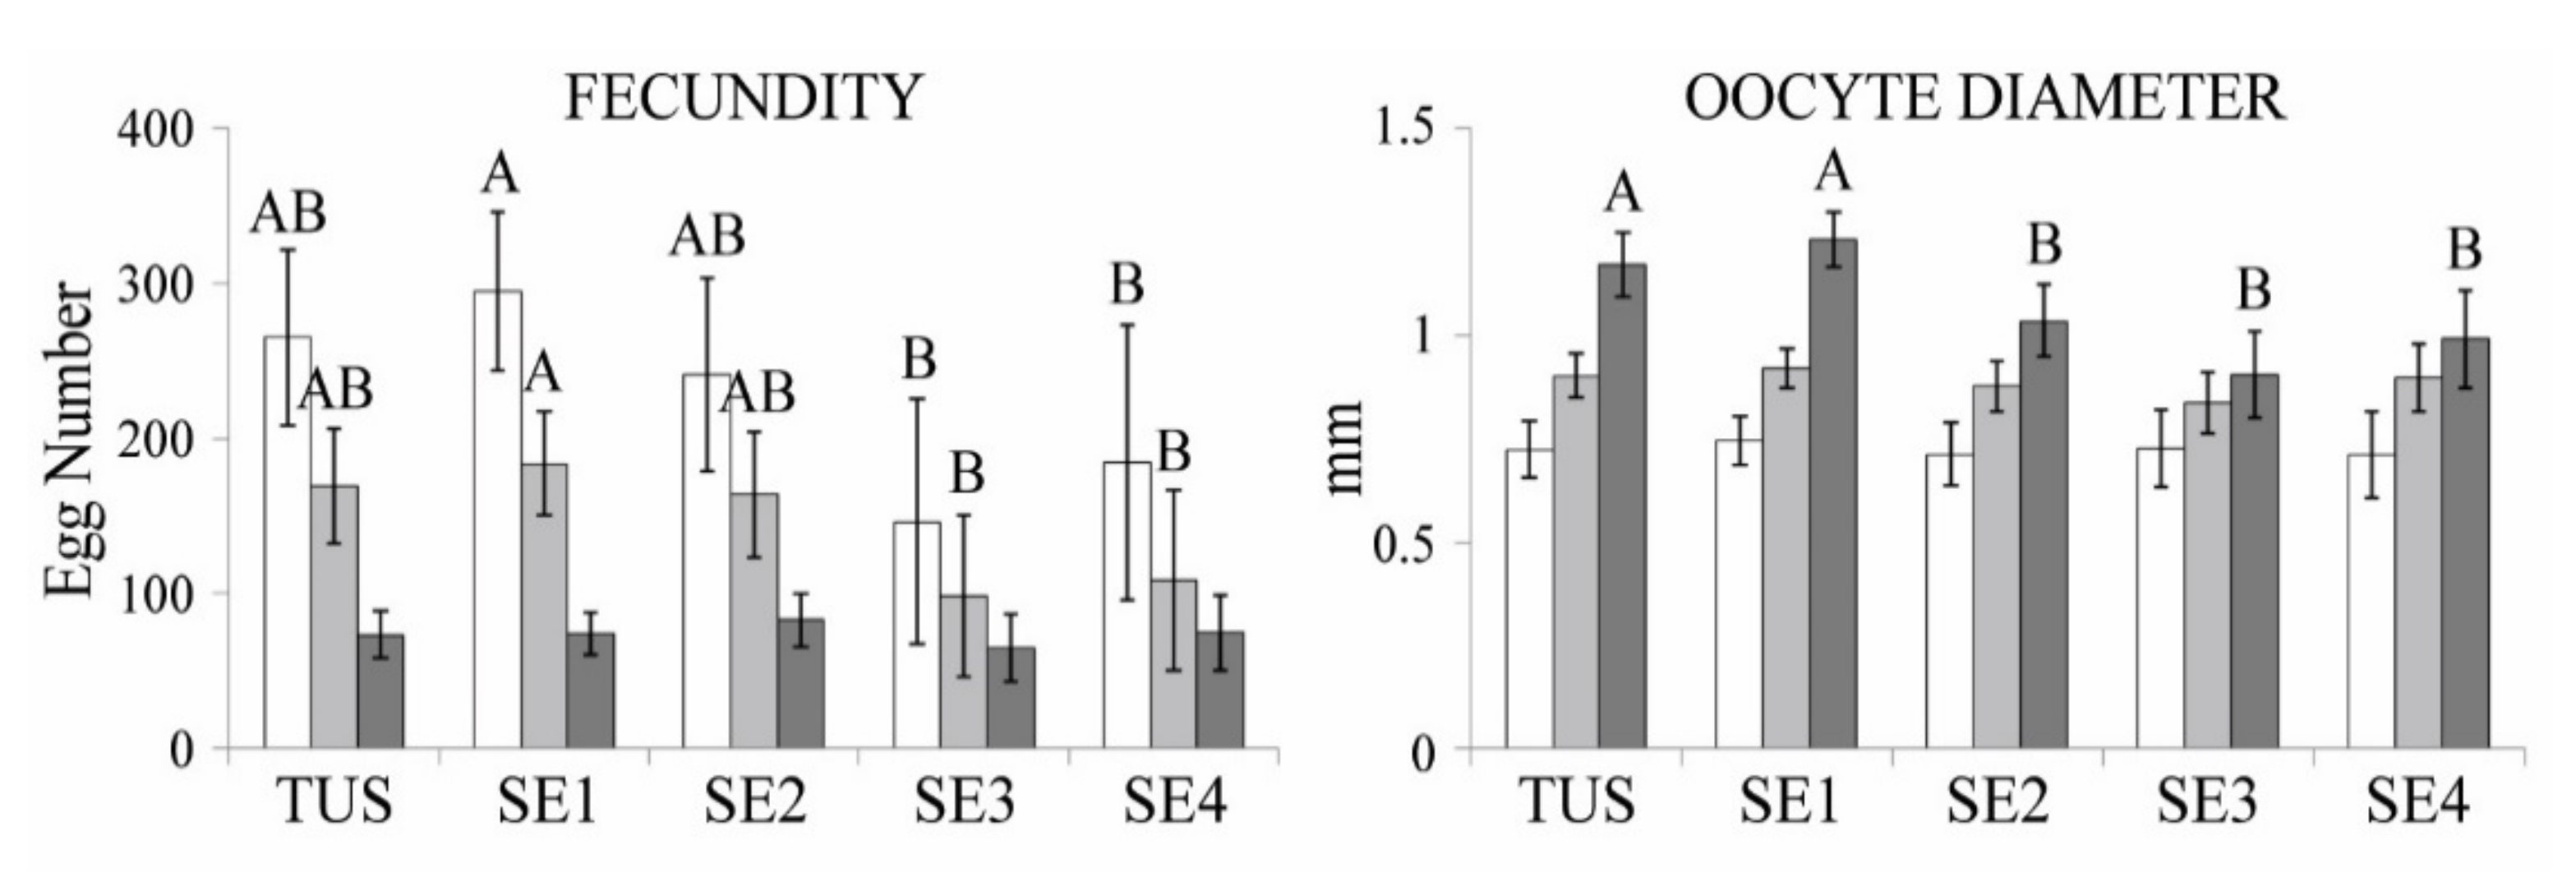
3.2. Population Structure and Reproduction Traits

Gobio lozanoi fish ranged from 1.8 cm to a maximum LF of 12.3 cm (a male caught in SE3). Total males (LF 7.6 ± 1.6 cm) were significantly longer than females (LF 7.1 ± 1.5 cm) (Student’s t˗test, t = 5.55, p < 0.001). Both sexes show significant differences among sampling sites in the total data (females ANOVA, F(4, 922) = 16.99, p < 0.001; males Welch ANOVA, F(4, 308.18) = 2.57, p = 0.038). Shorter females were found in TUS (6.5 ± 0.2) and SE3 (6.8 ± 0.2) and larger ones in SE1, SE2 and SE4 (7.5 ± 0.2, 7.4 ± 0.2 and 7.4 ± 0.2, respectively), while in males individuals in SE2 (7.9 ± 0.3) were larger than in TUS (7.2 ± 0.3).
The overall sex-ratio (696 males, 928 females) was significantly skewed towards females (χ2 = 33.14, p < 0.001) in the whole study period, with females being significantly more abundant in all sampling sites with the exception of SE3, which did not show differences between males and females (χ2 = 1.43, p = 0.23).
Length at first maturity in males ranged between 3.55 cm LF in SE3 and 6.26 cm LF in SE2, while female range was between 4.28 cm LF in SE3 and 6.60 cm LF in TUS. Above these lengths all individuals were considered mature (Figure 4). However, only significant differences in length at first maturity were found among sites in males (GEE: Wald-χ2(4) = 13.57 p = 0.009), finding significantly larger fish at first maturity in TUS, SE1 and SE2 populations (Figure 4).
Oocytes larger than 0.25 mm in diameter were considered opaque and all oocytes above 0.55 mm of diameter were vitellogenic. Fecundity data from each sampling site are summarised in Table 3. No significant differences were found in fecundity and oocyte diameters by age (ANCOVA, p > 0.05) and fork length was not significant as a covariable when oocyte diameters were analysed, which indicates no effect of fish size on egg diameters in the studied fish. Significant differences were found in potential (ANCOVA F(1, 4, 39) = 3.27, p = 0.023) and absolute fecundity (ANCOVA F(1, 4, 39) = 2.90, p = 0.037) among sampling sites. SE1 showed the highest number of oocytes and SE3 showed the lowest ones at a given length (Bonferroni post hoc: p = 0.023 and p = 0.037, respectively). Only the diameter of batch fecundity showed significant differences among sampling sites (ANCOVA F(1, 4, 37) = 9.96, p < 0.001). Batch oocyte diameters in TUS and SE1 populations were larger than in SE2, SE3 and SE4 (Bonferroni post hoc: p < 0.001) (Figure 5).

3.3. Protein and Lipid Contents

Significant differences in the percentages of proteins and lipids were found in tissues during the whole period studied (Table 4). Females showed maximum protein values in the gonads and maximum lipid values in the liver, while males presented highest protein and lipid values in the liver (Table 4). Comparisons between sexes revealed that females showed significantly higher protein and lipid percentages than males in the muscles (Student’s t˗test, t = −4.46, p < 0.001; t = −3.97, p < 0.001, respectively), while the percentage of protein in the liver was higher in males (Student’s t˗test, t = 4.51, p < 0.001). In the gonads, the ovary protein content was higher (Student’s t˗test, t = −9.75, p < 0.001), but the testis showed higher values of lipid content (Student’s t˗test, t = 3.14, p = 0.005).
Percentages of protein and lipid content in tissues showed significant differences during the reproductive cycle and the lipid–protein dynamic was different between sexes (Figure 6). The lipid percentage in the muscle decreases from quiescence to spawning stages in both sexes (ANOVA: female F(3, 106) = 11.26, p < 0.001; male F(3, 19) = 6.33, p = 0.008) (Figure 5). In the liver, protein percentages in females reached higher values at spawning (ANOVA F(3, 104) = 5.32, p = 0.002), but no differences were found in the percentages of lipid contents in this tissue (Figure 6). No significant differences were found in the percentages of protein and lipid contents in the liver in males during the reproductive cycle. The protein percentage in the ovary increased until the spawning stage (ANOVA F(3, 103) = 8.73, p < 0.001), but decreased in testis (ANOVA F(2, 19) = 9.670, p = 0.001), whereas no significant differences were found in gonadal lipids during the reproductive cycle (Figure 6).

3.4. Fish Metrics Relationships

Fish conditions (SC and HC) and GSI were positively correlated with fecundity and the percentage of ovary proteins. SC had a positive relationship with batch oocyte diameter only, whereas HC and GSI were positively correlated with potential, absolute and maximum oocyte diameters (Table 5). Fish conditions and GSI were positively correlated with the percentage of ovary protein, whereas SC and HC had a negative relationship with the percentage of muscle lipids. Moreover, the percentages of ovary proteins and lipids were positively correlated with absolute fecundity and oocyte diameters (ØPOT, ØABS, ØBAT, ØMAX). Absolute oocyte diameter (ØABS) was positively related to the percentage of proteins in the liver and negatively related to the percentage of muscle lipids (Table 5).

4. Discussion

Reproductive cycles of freshwater fish depend on a set of environmental factors and rheophilic fish, such as the target species, usually need flow requirements to activate migration processes, gonadal maturation and spawning success [50]. Reproduction is related to stream flow, photoperiod and temperature cues [8,51] and there must be optimal conditions for all these variables to coincide in time for gonadal activation to begin. Similar temporal dynamics of the gonadosomatic index were found in another studied population of G. lozanoi in an upper fluvial sector of the Segura River Basin [37]. However, in other non-native populations of G. lozanoi located more to the north of the Iberian Peninsula, where environmental factors are different, shorter maturation and spawning periods were observed [35,36].
During this study, several intraspecific differences in reproductive traits among populations inhabiting different hydrological sectors have been observed. Indeed, temporal dynamics of the gonadosomatic index showed two different patterns: one of them increased steeply, reaching a peak GSI value in April and May, just in the most upper sites, and the other one showed a slight GSI increase until June and July. The maturation delay, found mainly in SE2 and SE3 fluvial sectors, could be related to the lack of flow cues, such as spring peak flows present in TUS and SE1. Hydrological sector SE2 did not show any high flow peak during the year and SE3 is located right below the Cenajo dam which starts to release water in March, while other hydrological sectors showed high flows in early February (Supplementary Material 1; Figure S1). Thus, the increase in flow stability or reduction in natural flow disturbances, together with an imbalance between temperatures and flow peaks may be affecting the onset of the gonadal activation [8,52]. Furthermore, the spawning delay observed below the Cenajo dam (SE3) and the disruption of temperature increase (due to hypolimnetic cold water selective releases from the reservoir) may cause gonadal regression or failed oocyte development [9], which could explain the lower GSI values observed in fish inhabiting this fluvial sector.
Fish conditions (somatic and hepatosomatic) showed different patterns between sexes, suggesting that condition investment was not the same for both sexes during the reproductive cycle. The SC patterns of both sexes were not observed in other non-native populations of G. lozanoi in the Iberian Peninsula, which showed two peak values of somatic condition at the beginning and at the end of spawning, with minimum values in October [35]. Temporal dynamics of the HC of females were similar to the GSI pattern, increasing at the beginning of the activation stage and decreasing at the end of spawning. In indeterminate batch spawners such as G. lozanoi [35,36], oocyte recruitment is continuous during the spawning season and high liver mass (high HC) could confirm an intense liver activity for vitellogenesis, while in determinate batch spawners or total spawners the hepatosomatic activity decreases during the reproductive cycle due to the completion of vitellogenesis prior to spawning [53,54]. Moreover, fish conditions showed differences among different flow regimes during the reproductive cycle. In fact, only in the hydrological sector where flow was constant all year round (SE2) was no significant variability observed for these parameters. No drastic flow events and homogenization of flow conditions may favour the stability of fish investment because fish inhabiting unstable environments with seasonal flash floods may require high levels of energy reserves, such as high somatic and hepatosomatic conditions; a high investment to increase reproductive success [8,55,56]. On the other hand, the unnatural concurrence of very high flows during the reproductive event (maturation and spawning) implies energy redistribution in fish between survivals in suboptimal environments and reproductive investment [7], which could explain the lower values of fish conditions and GSI in these hydrological sectors (SE3 and SE4).
Previous studies of G. lozanoi in the Iberian peninsula observed maximum size ranges between 10.1 to 14.0 [23], whereas the population studied here showed a maximum length (FL) of 12.3 cm. The smallest individuals were observed in sampling sites located in the most natural flow conditions (TUS), and the largest ones were observed in SE4 and SE2. Larger maximum sizes of fish populations usually correlate with more stable environments, where abiotic fluctuations, such as flow peaks, are less significant and food sources are more readily available, so lower mortality rates can be observed [57]. Furthermore, low-flow periods, typical of dry summers in the Mediterranean basins, reduce food and habitat availability and may be affecting growth rates as has been observed in other Mediterranean cyprinids [8].
Hydrologic conditions are, for sure, one of the main drivers responsible for shaping the reproductive success and reproductive strategy used [6]. In this study, the analysed reproductive traits showed significant intraspecific variability which could be related to flow conditions at the basin scale. There were a higher number of females in all populations, apart from directly below the Cenajo dam (SE3). Thus, very high flows could be increasing female mortality rates after reproductive investment, which was higher than male investment; this has been recorded in other non-native populations of G. lozanoi in the Iberian Peninsula [36]. In addition, variability in sexual maturity is a compensatory population response to different environmental factors [58,59]. Many studies relate high mortality in populations to early maturation in order to compensate the decrease observed in the number of adults and maximize the egg production capacity [59,60]. In general, sexual maturity of non-native populations of G. lozanoi in the Iberian Peninsula was reached at a young age and most of the individuals aged 2+ or greater than 7.0 cm in fork length were mature [35,36,37]. In this study, the shortest mature males were 3.55 cm (LF) and females were 4.28 cm (LF), representing the smallest sizes found in the whole Peninsula. Highly disturbed areas or extreme environmental conditions and unregulated flow conditions (natural hydrological sectors in this study) are expected to be associated with early maturation, which is typical of opportunistic strategies [3,33]. However, in this study, a shorter length of first maturation was observed in flow regulated sectors, where natural disturbances are buffered, although some other environmental perturbations may be acting as well.
The studied population showed a lower absolute fecundity compared to other populations of G. lozanoi in the Iberian Peninsula [35,36]. In spite of this, oocyte diameters (between 0.84 and 0.92 mm) were larger than in other Iberian populations, which scattered oocyte diameters of 0.76, 0.76 and 0.73 mm in the Matarraña, Moros and Ucero rivers, respectively [35,36]. These results could indicate that a trade-off between egg size and fecundity is established [58]. Furthermore, higher fecundity and larger oocytes were observed in more natural flow areas, while populations inhabiting more altered flows and with reverse regimes showed a lower number and size of oocytes. Production of larger oocytes could be a compensatory strategy to produce larger larvae which will be more resistant to low flow stress factors in dry summers, while the production of a high number of eggs can ensure the survival of the species against the high mortality rates of eggs and larvae in areas with very variable and unpredictable flows [58,59]. On the one hand, the first hypothesis of this study suggested an opportunistic life-history strategy (small size, short longevity, early maturity, low fecundity, multiple spawnings per year and long reproductive periods) (sensu Winemiller and Rose, 1992 [33]) in more natural flow conditions, because this strategy is more associated with Iberian native and non-native species inhabiting unregulated Mediterranean rivers with strong seasonal flow patterns [61]. On the other hand, characteristics closer to a periodic life-history strategy (large body size, late maturation, high fecundity and a reduced spawning period) would be expected in more predictable and hydrologically stable environments. However, later maturity and a higher number and size of oocytes were observed in more natural flow sectors; later maturity, higher fecundity and small oocytes were found in the most stable flow sector, and populations with earlier maturity and lower number and size of oocytes were found in hydrological sectors with reverse flow regimes. We hypothesised that our studied populations would show intermediate characteristics between opportunistic and periodic life-history strategies, as previously described [34]. The results were not conclusive enough to establish strong correlations between the life strategy of G. lozanoi and flow conditions. Although reproductive strategies and reproductive success are directly related to hydrologic conditions [6], the flow effect is probably not strong enough to drastically change the reproductive strategy of populations of G. lozanoi that live in the same basin and may share the same genetic pool. The intraspecific variability observed in some reproductive traits suggests a certain degree of effect caused by flow regimes, however, its plasticity allows the species to survive flow regulation events at several scales, as well as to resist the long-term environmental stress typical of Mediterranean-type rivers [62].
Percentages of lipid contents in liver and gonads were stable during the reproductive cycle in both sexes. The increase in protein contents in females’ livers at the beginning of reproduction could suggest synthesis activity in the liver of the yolk and eggshell proteins which are transported to the ovarian tissues for oocyte vitellogenesis and maturation [58,63]. Ovarian protein content also increased during the reproductive cycle in response to the oocyte development and maturation [64,65]. In females, during gonadal maturation ovarian and liver lipid contents did not vary and protein content increased in both tissues. This could indicate that enough energy was available during the spawning to develop gonads and store energy in the liver. Additionally, in the absence of other energy sources, feeding during the reproductive season might provide energy for vitellogenesis [66,67,68]. The reproduction investment of studied populations strongly depends on food availability and provides rapid transport from ecosystem productivity to reproduction, which may allow continuous adjustments of the reproductive effort to food intake [15,69]. These findings provide evidence of the energy intake of G. lozanoi during the reproductive season which is typical of income breeders. However, the decrease in lipid percentage content in muscles during the reproductive cycle in females could be suggesting energy allocation to reproduction from muscle. The use of muscle tissue as an energy source has been documented for several fish, such as salmonids [70]. This pattern could suggest that G. lozanoi exhibits an intermediate strategy (income–capital breeding strategy) in which stored energy in muscles is also required for reproduction [71,72].
Higher fecundity and oocyte diameter were correlated with better somatic and hepatosomatic condition, as well as gonadosomatic index, suggesting fish condition plays an important role during recruitment and development of oocytes [73]. Moreover, proteins and lipids of ovary tissue also showed a positive correlation with absolute fecundity and oocyte sizes supporting the fact that a greater mobilization of macronutrients to gonads favours recruitment and oocyte quality. Thus, food availability has an important influence on reserves of protein and lipid in the tissues and there is a food-dependent variation in stored lipid energy which affects the reproductive potential of individual fish [16,74].

5. Conclusions

In summary, flow conditions have an important effect on some reproductive traits of G. lozanoi, reflected as intraspecific variations in the most of studied parameters. However, this intraspecific variability was not conclusive enough to classify populations either as opportunistic strategists in unpredictable flow sectors, or as periodic strategists in areas that show stable flow regimes. Moreover, protein and lipid contents in tissues during the reproductive cycle provide some insight into the energy allocation during the reproduction of this species, which suggests that current food intake is the main—but not only—energy source for this species to reproduce, since they also use part of the energy supplement they store. Hence, G. lozanoi can be classified as an income–capital breeder. Comparative studies of reproductive traits and energy balance are a powerful approach to understanding life-history trade-offs of species, and they may serve as excellent models for studies of plasticity and adaptation of breeding strategies to new environmental conditions in exotic species. Further studies are needed to increase the knowledge about phenotypic plasticity in species that may be potential invaders since the lack of information could be hiding negative effects on other species, as well as on the environment.

Supplementary Materials

The following are available online at https://www.mdpi.com/2073-4441/13/3/387/s1. Supplementary Material 1: Flow Characterisation of Sampling Sites. Supplementary Material 2: Immature-Mature Determination. Supplementary Material 3: ANCOVA Results. Supplementary Material 4: Picture of the target species.

Author Contributions

F.A.-T. study design, data collection, data analysis and manuscript preparation; M.T. resources, study design, manuscript preparation and review; D.G.-S. data collection and data analysis; F.J.M.-L. resources and data analysis; F.J.O.-P. conceptualization, resources, study design, data collection, data analysis, manuscript preparation and review. All authors have read and agreed to the published version of the manuscript.

Funding

Financial support was partially provided by LIFE+ Segura Riverlink (Project LIFE12 ENV/1140). F.A.T. held a doctoral fellowship (FPU13/00235) from the Spanish Ministry of Education.

Institutional Review Board Statement

Ethical review and approval were waived for this study, due to the care and use of experimental animals complied with University of Murcia and Spanish Law 32/2007 and RD 53/2013 animal welfare laws.

Informed Consent Statement

Not applicable.

Data Availability Statement

Data is contained within the article or supplementary material.

Acknowledgments

The authors would like to thank J.M. Zamora, A. Zamora, J. Franco, A. Guerrero and A. Sánchez for their participation in fish collecting and E. Martínez (EMC I Traducciones) and Catherine Gutmann Roberts for English review. We also are grateful to L. Gabaldón and E. Aledo for helping in the processing of sampling permits.

Conflicts of Interest

The authors declare no conflict of interest. The funders had no role in the design of the study; in the collection, analyses, or interpretation of data; in the writing of the manuscript, or in the decision to publish the results.

References

  1. Bunn, S.E.; Arthington, A.H. Basic principles and ecological consequences of altered flow regimes for aquatic biodiversity. Environ. Manag. 2002, 30, 492–507. [Google Scholar] [CrossRef] [PubMed] [Green Version]
  2. Schinegger, R.; Palt, M.; Segurado, P.; Schmutz, S. Untangling the effects of multiple human stressors and their impacts on fish assemblages in European running waters. Sci. Total. Environ. 2016, 573, 1079–1088. [Google Scholar] [CrossRef] [PubMed] [Green Version]
  3. Mims, M.C.; Olden, J.D. Fish assemblages respond to altered flow regimes via ecological filtering of life history strategies. Freshw. Biol. 2013, 58, 50–62. [Google Scholar] [CrossRef]
  4. Oliveira, J.M.; Segurado, P.; Santos, J.M.; Teixeira, A.; Ferreira, M.T.; Cortes, R.V. Modelling stream-fish functional traits in reference conditions: Regional and local environmental correlates. PLoS ONE 2012, 7, 15–17. [Google Scholar] [CrossRef] [PubMed]
  5. Bergerot, B.; Hugueny, B.; Belliard, J. Relating life-history traits, environmental constraints and local extinctions in river fish. Freshw. Biol. 2015, 60, 1–13. [Google Scholar] [CrossRef]
  6. Mims, M.C.; Olden, J.D. Life history theory predicts fish assemblage response to hydrologic regimes. Ecol. Soc. Am. 2012, 93, 35–45. [Google Scholar] [CrossRef]
  7. Stearns, S.C. The Evolution of Life Histories; Oxford University Press: New York, NY, USA, 1992. [Google Scholar]
  8. Alexandre, C.M.; Ferreira, M.T.; Almeida, P.R. Life history of a cyprinid species in non-regulated and regulated rivers from permanent and temporary Mediterranean basins. Ecohydrology 2014, 8, 1137–1153. [Google Scholar] [CrossRef]
  9. Bailly, D.; Agostinho, A.A.; Suzuki, H.I. Influence of the flood regime on the reproduction of fish species with different reproductive strategies in the Cuiabá River, Upper Pantanal, Brazil. River Res. Appl. 2008, 24, 1218–1229. [Google Scholar] [CrossRef]
  10. Cambray, J.A.; King, J.M.; Bruwer, C. Spawning behaviour and early development of the Clanwilliam yellowfish (Barbus capensis; Cyprinidae), linked to experimental dam releases in the Olifants River, South Africa. Regul. Rivers Res. Manag. 1997, 13, 579–602. [Google Scholar] [CrossRef]
  11. Tan, X.; Li, X.; Lek, S.; Li, Y.-F.; Wang, C.; Li, J.; Luo, J. Annual dynamics of the abundance of fish larvae and its relationship with hydrological variation in the Pearl River. Environ. Biol. Fishes 2010, 88, 217–225. [Google Scholar] [CrossRef]
  12. Miranda, R.; Oscoz, J.; Leunda, P.M.; García-Fresca, C.; Escala, M.C. Effects of weir construction on fish population structure in the River Erro (North of Spain). Ann. Limnol. 2005, 41, 7–13. [Google Scholar] [CrossRef]
  13. Vasconcelos, L.P.; Alves, D.C.; Gomes, L.C. Fish reproductive guilds downstream of dams. J. Fish Biol. 2014, 85, 1489–1506. [Google Scholar] [CrossRef] [PubMed]
  14. Tedesco, P.A.; Hugueny, B.; Oberdorff, T.; Dürr, H.H.; Mérigoux, S.; De Mérona, B. River hydrological seasonality influences life history strategies of tropical riverine fishes. Oecologia 2008, 156, 691–702. [Google Scholar] [CrossRef] [PubMed]
  15. McBride, R.S.; Somarakis, S.; Fitzhugh, G.R.; Albert, A.; Yaragina, N.A.; Wuenschel, M.J.; Alonso-Fernández, A.; Basilone, G. Energy acquisition and allocation to egg production in relation to fish reproductive strategies. Fish Fish. 2015, 16, 23–57. [Google Scholar] [CrossRef] [Green Version]
  16. Henderson, B.A.; Wong, J.L.; Nepszy, S.J. Reproduction of walleye in Lake Erie: Allocation of energy. Can. J. Fish. Aquat. Sci. 1996, 53, 127–133. [Google Scholar] [CrossRef]
  17. Kennedy, J.; Skjæraasen, J.E.; Nash, R.D.M.; Thorsen, A.; Slotte, A.; Hansen, T.; Kjesbu, O.S. Do capital breeders like Atlantic herring (Clupea harengus) exhibit sensitive periods of nutritional control on ovary development and fecundity regulation? Can. J. Fish. Aquat. Sci. 2010, 67, 16–27. [Google Scholar] [CrossRef]
  18. Peebles, E.; Hall, J.; Tolley, S. Egg production by the bay anchovy Anchoa mitchilli in relation to adult and larval prey fields. Mar. Ecol. Prog. Ser. 1996, 131, 61–73. [Google Scholar] [CrossRef]
  19. Brown, M.L.; Murphy, B.R. Seasonal dynamics of direct and indirect condition indices in relation to energy allocation in largemouth bass Micropterus salmoides (Lacepede). Ecol. Freshw. Fish 2004, 13, 23–36. [Google Scholar] [CrossRef]
  20. Ganias, K. Determining the indeterminate: Evolving concepts and methods on the assessment of the fecundity pattern of fishes. Fish. Res. 2013, 138, 23–30. [Google Scholar] [CrossRef]
  21. Mollet, F.M.; Engelhard, G.H.; Vainikka, A.; Laugen, A.T.; Rijnsdorp, A.D.; Ernande, B. Spatial variation in growth, maturation schedules and reproductive investment of female sole Solea solea in the Northeast Atlantic. J. Sea Res. 2013, 84, 109–121. [Google Scholar] [CrossRef] [Green Version]
  22. Doadrio, I.; Madeira, M.J. A new species of the genus Gobio Cuvier, 1816 (Actynopterigii, Cyprinidae) from the Iberian Peninsula and southwestern France. Graellsia 2004, 60, 107–116. [Google Scholar] [CrossRef]
  23. Amat-Trigo, F. Gobio—Gobio Lozanoi. In Enciclopedia Virtual de los Vertebrados Españoles; Sanz, J.J., Oliva Paterna, F.J., Eds.; Museo Nacional de Ciencias Naturales: Madrid, Spain, 2017. [Google Scholar]
  24. Doadrio, I.; Perea, S.; Garzón-Heydt, P.; González, J.L. Ictiofauna Continental Española. Bases para su Seguimiento; DG Medio Natural y Política Forestal; MARM: Madrid, Spain, 2011. [Google Scholar]
  25. Muñoz-Mas, R.; Fukuda, S.; Vezza, P.; Martínez-Capel, F. Comparing four methods for decision-tree induction: A case study on the invasive Iberian gudgeon (Gobio lozanoi; Doadrio and Madeira, 2004). Ecol. Inform. 2016, 34, 22–34. [Google Scholar] [CrossRef]
  26. Leunda, P. Impacts of non-native fishes on Iberian freshwater ichthyofauna: Current knowledge and gaps. Aquat. Invasions 2010, 5, 239–262. [Google Scholar] [CrossRef]
  27. Oliva-Paterna, F.J.; Verdiell-Cubedo, D.; Ruiz-Navarro, A.; Torralva, M. La ictiofauna continental de la Cuenca del río Segura (S.E. Península Ibérica): Décadas después de Mas (1986). An. Biol. 2014, 37–45. [Google Scholar] [CrossRef]
  28. Valladolid, M.; Przybylski, M. Feeding relations among cyprinids in the Lozoya River (Madrid, central Spain). Pol. Arch. Hydrobiol. 1996, 43, 213–223. [Google Scholar]
  29. Oscoz, J.; Leunda, P.M.; Miranda, R.; Escala, M.C. Summer feeding relationships of the cooccurring Phoxinus phoxinus and Gobio lozanoi (Cyprinidae) in an Iberian river. Folia Zool. 2006, 55, 418–432. [Google Scholar]
  30. Saraiva, A.; Hermida, M.; Costa, M.J.; Maia, C.; Reis, A.R.; Cruz, C.; Valente, A. First record ofPhilometra ovata (Nematoda) infection in Gobio lozanoiin Portugal. J. Fish Biol. 2008, 73, 2288–2292. [Google Scholar] [CrossRef]
  31. Hermoso, V.; Clavero, M. Threatening processes and conservation management of endemic freshwater fish in the Mediterranean basin: A review. Mar. Freshw. Res. 2011, 62, 244–254. [Google Scholar] [CrossRef]
  32. Muñoz-Mas, R.; García-Berthou, E. Alien animal introductions in Iberian inland waters: An update and analysis. Sci. Total. Environ. 2020, 703, 134505. [Google Scholar] [CrossRef]
  33. Winemiller, K.O.; Rose, K.A. Patterns of life-history diversification in North American fishes: Implications for population regulation. Can. J. Fish. Aquat. Sci. 1992, 49, 2196–2218. [Google Scholar] [CrossRef]
  34. Vila-Gispert, A.; Moreno-Amich, R. Life-history patterns of 25 species from European freshwater fish communities. Environ. Biol. Fishes 2002, 65, 387–400. [Google Scholar] [CrossRef]
  35. Lobón-Cerviá, J.; Torres, S. On the growth and reproduction of two populations of gudgeon (Gobio gobio L.) in Central Spain. Acta Hydrobiol. 1984, 1, 101–115. [Google Scholar]
  36. Lobon-Cervia, J.; Montańges, C.; Sostoa, A. Influence of environment upon the life history of gudgeon, Gobio gobio (L.): A recent and successful colonizer of the Iberian Peninsula. J. Fish Biol. 1991, 39, 285–300. [Google Scholar] [CrossRef]
  37. Miñano, P.A.; García-Mellado, A.; Oliva-Paterna, F.J.; Torralva, M. Edad, crecimiento y reproducción de Gobio gobio L. (Pisces, Cyprinidae) en un tramo regulado del río Segura (SE España). Anim. Biodivers. Conserv. 2003, 26, 67–77. [Google Scholar]
  38. Britton, J.R.; Gozlan, R.E.; Copp, G.H. Managing non-native fish in the environment. Fish Fish. 2011, 12, 256–274. [Google Scholar] [CrossRef]
  39. Ribeiro, F.; Leunda, P.M. Non-native fish impacts on Mediterranean freshwater ecosystems: Current knowledge and research needs. Fish. Manag. Ecol. 2012, 19, 142–156. [Google Scholar] [CrossRef]
  40. Almeida, D.; Stefanoudis, P.V.; Fletcher, D.H.; Rangel, C.; da Silva, E. Population traits of invasive bleak Alburnus alburnus between different habitats in Iberian fresh waters. Limnologica 2014, 46, 70–76. [Google Scholar] [CrossRef]
  41. García-Berthou, E. The characteristics of invasive fishes: What has been learned so far? J. Fish Biol. 2007, 71, 33–55. [Google Scholar] [CrossRef]
  42. Belmar, O.; Velasco, J.; Martinez-Capel, F. Hydrological classification of natural flow regimes to support environmental flow assessments in intensively regulated Mediterranean rivers, Segura River basin (Spain). Environ. Manag. 2011, 47, 992–1004. [Google Scholar] [CrossRef] [Green Version]
  43. Sánchez-Pérez, A.; Oliva-Paterna, F.J.; Colin, N.; Torralva, M.; Górski, K. Functional response of fish assemblage to multiple stressors in a highly regulated Mediterranean river system. Sci. Total. Environ. 2020, 730, 1–10. [Google Scholar] [CrossRef]
  44. Pardo, I.; Álvarez, M.; Casas, J.; Moreno, J.L.; Vivas, S.; Bonada, N.; Alba-Tercedor, J.; Jáimez-Cuéllar, P.; Moyà, G.; Prat, N.; et al. El hábitat de los ríos mediterráneos. Diseño de un índice de diversidad de hábitat. Limnetica 2002, 21, 115–133. [Google Scholar]
  45. González del Tánago, M.; García De Jalón, D.; Lara, F.; Garilleti, R. Riparian quality index (RQI) for assessing riparian conditions in the context of the Water Framework Directive. Ing. Civ. 2006, 143, 97–108. [Google Scholar]
  46. Bradford, M.M. A rapid and sensitive method for the quantitation of microgram quantities of protein utilizing the principle of protein-dye binding. Anal. Biochem. 1976, 72, 248–254. [Google Scholar] [CrossRef]
  47. Folch, J.; Lees, M.; Stanley, G.S. A simple method for the isolation and purification of total lipids from animal tissues. J. Biol. Chem. 1957, 226, 497–509. [Google Scholar] [CrossRef]
  48. Bagenal, T.B.; Braum, E. Eggs and early life history. In Methods for Assessment of Fish Production in Fresh Waters; Bagenal, T.B., Ed.; Blackwell Scientific Publications: Oxford, UK, 1978; pp. 165–201. [Google Scholar]
  49. Murua, H.; Kraus, G.; Saborido-Rey, F.; Witthames, P.R.; Thorsen, A.; Junquera, S. Procedures to estimate fecundity of marine fish species in relation to their reproductive strategy. J. Northwest Atl. Fish. Sci. 2003, 33, 33–54. [Google Scholar] [CrossRef]
  50. Humphries, P.; King, A.J.; Koehn, J.D. Fish, flows and flood plains: Links between freshwater fishes and their environment in the Murray-Darling River System, Australia. Environ. Biol. Fishes 1999, 56, 129–151. [Google Scholar] [CrossRef]
  51. Munz, J.T.; Higgins, C.L. The influence of discharge, photoperiod, and temperature on the reproductive ecology of cyprinids in the Paluxy River, Texas. Aquat. Ecol. 2013, 47, 67–74. [Google Scholar] [CrossRef]
  52. Olden, J.D.; Naiman, R.J. Incorporating thermal regimes into environmental flows assessments: Modifying dam operations to restore freshwater ecosystem integrity. Freshw. Biol. 2010, 55, 86–107. [Google Scholar] [CrossRef]
  53. Rinchard, J.; Kestemont, P. Liver changes related to oocyte growth in roach, a single spawner fish, and in bleak and white bream, two multiple spawner fish. Int. Rev. Hydrobiol. 2003, 88, 68–76. [Google Scholar] [CrossRef]
  54. Dahle, R.; Taranger, G.L.; Karlsen, Ø.; Kjesbu, O.S.; Norberg, B. Gonadal development and associated changes in liver size and sexual steroids during the reproductive cycle of captive male and female Atlantic cod (Gadus morhua L.). Comp. Biochem. Physiol. Part A Mol. Integr. Physiol. 2003, 136, 641–653. [Google Scholar] [CrossRef]
  55. Moyle, P.B.; Cech, J.J. Fishes: An Introduction to Ichthyology; Pearson Prentice Hall: Upper Saddle River, NJ, USA, 2004. [Google Scholar]
  56. Vila-Gispert, A.; Zamora, L.; Moreno-Amich, R. Use of the condition of Mediterranean barbel (Barbus meridionalis) to assess habitat quality in stream ecosystems. Arch. Hydrobiol. 2000, 148, 135–145. [Google Scholar] [CrossRef]
  57. Harvey, B.C.; Nakamoto, R.J.; White, J.L. Reduced Streamflow Lowers Dry-Season Growth of Rainbow Trout in a Small Stream. Trans. Am. Fish. Soc. 2006, 135, 998–1005. [Google Scholar] [CrossRef]
  58. Wootton, R.J. Ecology of Teleost Fishes; Fish and Fisheries Series 1; Chapman and Hall: London, UK, 1990. [Google Scholar]
  59. Saborido-Rey, F. Ecología de la Reproducción y Potencial Reproductivo en las Poblaciones de Peces Marinos; Instituto de Investigaciones Marinas (CSIC): Pontevedra, Spain; Universidad de Vigo: Pontevedra, Spain, 2004. [Google Scholar]
  60. Aparicio, E.; De Sostoa, A. Reproduction and growth of Barbus haasi in a small stream in the N. E. of the Iberian Peninsula. Arch. Hydrobiol. 1998, 142, 95–110. [Google Scholar] [CrossRef]
  61. Vila-Gispert, A.; Alcaraz, C.; García-Berthou, E. Life-history traits of invasive fish in small Mediterranean streams. Biol. Invasions 2005, 7, 107–116. [Google Scholar] [CrossRef]
  62. Gasith, A.; Resh, V.H. Streams in Mediterranean Climate Regions: Abiotic Influences and Biotic Responses to Predictable Seasonal Events. Annu. Rev. Ecol. Syst. 1999, 30, 51–81. [Google Scholar] [CrossRef] [Green Version]
  63. Arukwe, A.; Goksøyr, A. Eggshell and egg yolk proteins in fish: Hepatic proteins for the next generation: Oogenetic, population, and evolutionary implications of endocrine disruption. Comp. Hepatol. 2003, 2, 1–21. [Google Scholar] [CrossRef] [Green Version]
  64. Grande, M.; Murua, H.; Zudaire, I.; Arsenault-Pernet, E.J.; Pernet, F.; Bodin, N. Energy allocation strategy of skipjack tuna Katsuwonus pelamis during their reproductive cycle. J. Fish Biol. 2016, 89, 2434–2448. [Google Scholar] [CrossRef]
  65. Nunes, C.; Silva, A.; Soares, E.; Ganias, K. The Use of Hepatic and Somatic Indices and Histological Information to Characterize the Reproductive Dynamics of Atlantic SardineSardina pilchardusfrom the Portuguese Coast. Mar. Coast. Fish. 2011, 3, 127–144. [Google Scholar] [CrossRef]
  66. Beuchel, J.S.; Marschall, E.A.; Aday, D.D. Energy allocation patterns in a multiple spawning sunfish: Evidence for an income-based reproductive strategy. Fish. Manag. Ecol. 2013, 20, 508–517. [Google Scholar] [CrossRef]
  67. Johnson, R.B. Lipid Deposition in Oocytes of Teleost Fish During Secondary Oocyte Growth. Rev. Fish. Sci. 2009, 17, 78–89. [Google Scholar] [CrossRef]
  68. Saborido-Rey, F.; Murua, H.; Tomkiewicz, J.; Lowerre-Barbieri, S. Female Reproductive Strategies: An Energetic Balance Between Maturation, Growth and Egg Production. In 4th Workshop on Gonadal Histology of Fishes, El Puerto de Santa Maria, Spain, 16–19 June 2010; Wyanski, D.M., Brown-Peterson, N.J., Eds.; Digital CSIC: El Puerto de Santa Maria, Spain, 2010; pp. 15–18. Available online: http://hdl.handle.net/10261/24937 (accessed on 17 January 2018).
  69. Stephens, P.A.; Boyd, I.L.; McNamara, J.M.; Houston, A.I. Capital breeding and income breeding: Their meaning, measurement, and worth. Ecology 2009, 90, 2057–2067. [Google Scholar] [CrossRef] [PubMed]
  70. Wiegand, M.D. Composition, accumulation and utilization of yolk lipids in teleost fish. Rev. Fish Biol. Fish. 1996, 6, 259–286. [Google Scholar] [CrossRef]
  71. Zudaire, I.; Murua, H.; Grande, M.; Pernet, F.F.; Bodin, N.N. Accumulation and mobilization of lipids in relation to reproduction of yellowfin tuna (Thunnus albacares) in the Western Indian Ocean. Fish. Res. 2014, 160, 50–59. [Google Scholar] [CrossRef] [Green Version]
  72. Henderson, B.A.; Morgan, G.E. Maturation of walleye by age, size and surplus energy. J. Fish Biol. 2002, 61, 999–1011. [Google Scholar] [CrossRef]
  73. Henderson, B.A.; Trivedi, T.; Collins, N.C. Annual cycle of energy allocation to growth and reproduction of yellow perch. J. Fish Biol. 2000, 57, 122–133. [Google Scholar] [CrossRef]
  74. Henderson, B.A.; Wong, J.L. Control of lake trout reproduction: Role of lipids. J. Fish Biol. 1998, 52, 1078–1082. [Google Scholar] [CrossRef]
Figure 1. Sampling sites location for Gobio lozanoi in the Segura River basin at south-eastern Iberian Peninsula, Spain.
Water 13 00387 g001
Figure 2. Temporal variation in gonad activity (predicted MG values, MG is gonad mass) along the study period for the five studied populations (TUS, SE1, SE2, SE3 and SE4) for both sexes of Gobio lozanoi. The lines represent the adjusted model Loess for each population.
Water 13 00387 g002
Figure 3. Mean predicted MG, ME and MH values by ANCOVA (LF as covariate) in each reproductive stage (quiescence, maturation, spawning and postspawning) for both sexes of Gobio lozanoi. Letters show significant differences (Welch’s analysis of variance p < 0.05 and T3 of Dunnett post hoc tests) among reproductive stages in females (capital letters) and in males (lowercase letters).
Water 13 00387 g003
Figure 4. Predicted probability of maturity according to fork length for females and males for the five studied populations (TUS, SE1, SE2, SE3 and SE4) of Gobio lozanoi.
Water 13 00387 g004
Figure 5. Estimated marginal means (by ANCOVA) ± IC 95% at 9.0 cm of fork length for oocyte number and diameter of opaque plus vitelogenic oocytes (potential fecundity; white bars), and of vitelogenic oocytes (absolute fecundity; grey bars) and oocytes of batch fecundity (dark grey bars). Letters show significant differences (ANCOVA, Bonferroni post hoc tests) among sampling sites.
Water 13 00387 g005
Figure 6. Mean and ± IC 95% percentages of proteins and lipids in muscle, liver and gonads by reproductive stages. White bars represent female values and grey bars represent the male ones. The letters show significant differences (ANOVA, p < 0.05) among reproductive stages by post hoc comparison Tukey test. Capital letters for female data and lower case letters for male data.
Water 13 00387 g006
Table 1. Habitat variable values of each sampling site where Gobio lozanoi populations were assessed in the Segura River Basin.
Sampling SiteCodeLatitudeLongitudeAltitude
(m.a.s.l.)
StatusConductivity
(µs cm−1)
IHFRQIWater Tempeture
(°C, ± 95% Cl)
TusTUS38°24′40.5″ N2°19′01.3″ W8091399.44 ± 9.89846515.63 ± 2.77
CampingSE138°17′48.0″ N2°24′42.3″ W6851374.33 ± 8.06619814.71 ± 2.15
LeturSE238°24′31.9″ N2°06′33.5″ W4601362.62 ± 4.21688013.04 ± 1.59
Bajo CenajoSE338°21′50.9″ N1°46′17.2″ W3632383.28 ± 3.73677712.49 ± 1.28
Hoya GarcíaSE438°14′30.6″ N1°32′35.7″ W2002686.19 ± 55.20667016.25 ± 2.01
Altitude (meters above sea level), ecological status (1–4); water conductivity (±0.1); Fluvial Habitat Index (IHF); Riparian Quality Index (RQI), and water temperature (Mean and 95% Cl Confidence limits).
Table 2. Mean predicted ME, MH and MG values by ANCOVA (LF as covariate) in each reproductive stage for both sexes of Gobio lozanoi. ANOVA results of comparison of somatic condition (SC), hepatosomatic condition (HC) and gonad activity (GSI) among reproductive stages in each sampling site are showed and significant p-values are included. Codes of sampling sites (TUS, SE1, SE2, SE3, and SE4) from the Segura River Basin were included.
Sampling Site Reproductive StagesANOVA
TotalQuiescenceMaturationSpawningPostspawningdfFp
FEMALES
SCTUS0.6510.5690.6790.6830.62934.8510.004
SE10.6960.6350.7360.6860.68935.1240.002
SE20.6340.6640.6250.6050.66530.9080.443
SE30.4880.5030.4800.4660.51130.3480.791
SE40.5830.5430.5980.5670.63834.6560.004
HSTUS0.0430.0240.0590.0510.021320.996<0.001
SE10.0510.0360.0740.0400.025343.062<0.001
SE20.0440.0370.0410.0570.04331.6030.199
SE30.0250.0200.0270.0290.02331.8880.135
SE40.0340.0280.0440.0320.02636.3090.001
GSITUS0.1790.0570.2930.2050.058361.079 <0.001
SE10.2250.0990.3520.2120.0743107.369 <0.001
SE20.1960.1420.1880.3230.098333.643<0.001
SE30.1610.0840.2060.2290.058349.019<0.001
SE40.1400.0630.2340.1530.0543146.528 <0.001
MALES
SCTUS0.6970.6410.7470.7250.58633.4090.022
SE10.7450.6710.8210.7560.62036.767<0.001
SE20.7410.7790.6860.7750.77631.9200.133
SE30.6100.5780.6210.5850.69031.4070.249
SE40.6380.6310.6280.6360.70032.1710.101
HSTUS0.0310.0340.0360.0300.02131.5610.206
SE10.0300.0440.0360.0250.018311.160<0.001
SE20.0480.0530.0480.0440.04430.4370.727
SE30.0260.0230.0280.0210.03734.4720.007
SE40.0250.0330.0250.0200.03236.7240.001
GSITUS0.0400.0170.0630.0410.012337.531<0.001
SE10.0520.0200.0850.0500.014352.044<0.001
SE20.0540.0380.0570.0870.026311.223<0.001
SE30.0400.0190.0550.0420.031352.816<0.001
SE40.0370.0160.0500.0320.017346.862 <0.001
Means no normalised data and Kruskal–Wallis analysis of variance.
Table 3. Mean, minimum and maximum values of potential fecundity (FecPOT), absolute fecundity (FecABS) and batch fecundity (FecBAT) of Gobio lozanoi. Linear regression of fecundities and fork length (LF) are shown (significant p-values are included). Codes of sampling sites (TUS, SE1, SE2, SE3, and SE4) from the Segura River Basin were included.
SitePotential FecundityAbsolute FecundityBatch Fecundity
MeanMinMaxMeanMinMaxMeanMinMax
TUS239.389401152.47125065.837101
LogFecPOT = −3.64+ 6.30 LogLFLogFecVIT = −1.61 + 3.987 LogLFLogFecBAT = −1.942 + 3.988 LogLF
r2 = 0.82p = 0.001r2 = 0.54p = 0.015r2 = 0.72p = 0.004
SE1311.25111461194.58783247933152
LogFecPOT = −4.337 + 7.045 LogLFLogFecVIT = −3.783 + 6.266 LogLFLogFecBAT = −4.511 + 6.628 LogLF
r2 = 0.62p = 0.007r2 = 0.56p = 0.013r2 = 0.70p = 0.003
SE2248.13136389168.5833178542140
LogFecPOT = −2.023 + 4.634 LogLFLogFecVIT = −3.482 + 5.974 LogLFLogFecBAT = −3.444 + 5.575 LogLF
r2 = 0.75p = 0.012r2 = 0.77p = 0.010r2 = 0.63p = 0.018
SE3117.4411817936103563574
LogFecPOT = −3.085 + 5.509 LogLFLogFecVIT = −0.861 + 1.154 LogLFLogFecBAT = −4.143 + 6.165 LogLF
r2 = 0.94p = 0.033r2 = 0.34p = 0.417r2 = 0.86p = 0.073
SE4220.2570427132.54125285.537124
LogFecPOT = −3.671 + 6.115 LogLFLogFecVIT = −3.942 + 6.172 LogLFLogFecBAT = −2.105 + 4.119 LogLF
r2 = 0.91p = 0.044r2 = 0.95p = 0.023r2 = 0.77p = 0.121
Table 4. Percentage of lipids and proteins in each tissue of Gobio lozanoi. All p-values in Kruskal–Wallis test are significant (<0.001).
Muscle %Liver %Gonad %Kruskal–Wallis
nRangeMeannRangeMeannRangeMeanχ2
FemaleProtein1104.18–11.106.951084.10–15.149.691070.28–25.599.9986.016
Lipid1080.40–1.350.731050.52–18.796.941091.05–9.093.00265.237
MaleProtein233.49–8.185.67239.26–18.1312.51230.16–8.992.6854.916
Lipid230.39–0.970.58232.45–22.427.18211.84–8.734.6546.484
n, Number of individuals, range of minimum and maximum values and Kruskal–Wallis test.
Table 5. Correlation matrix of fish somatic condition (SC), hepatosomatic condition (HC), gonad activity (GSI), fecundity, oocyte size and proteins and lipids percentages by tissues in females of Gobio lozanoi. Spearman’s coefficient above the diagonal and p-values below the diagonal.
SCHCIGSFecPOTFecABSFecBATØPOTØABS
SC-0.713 **0.426 **0.491 **0.386 **0.749 **0.0320.155
HC<0.001-0.816 **0.415 **0.635 **0.755 **0.465 **0.472 **
IGS<0.001<0.001-0.267**0.611 **0.748 **0.570 **0.470 **
FecPOT<0.001<0.0010.005-0.695 **0.744 **0.0790.136
FecABS<0.001<0.001<0.001<0.001-0.768 **0.732 **0.680 **
FecBAT<0.001<0.001<0.001<0.001<0.001-0.0150.058
ØPOT0.744<0.001<0.0010.413<0.0010.924-0.925 **
ØABS0.138<0.001<0.0010.192<0.0010.720<0.001-
ØBAT0.0230.2460.5200.0090.0020.2790.013<0.001
ØMAX0.141<0.001<0.0010.016<0.0010.184<0.001<0.001
% PMUS0.5810.8700.8600.3680.3870.4700.7600.959
% PLIV0.8880.6950.6750.0060.2160.0500.4600.036
% POVA0.015<0.0010.0030.072<0.0010.739<0.001<0.001
% LMUS0.0050.0250.1780.6690.3650.8520.2500.001
% LLIV0.1390.7540.3030.0990.104−0.9100.5760.380
% LOVA0.7070.8470.5330.4500.0200.8130.003<0.001
ØBATØMAX% PMUS% PLIV% POVA% LMUS% LLIV% LOVA
SC0.347 *0.142−0.0540.0140.234 *−0.267 **−0.146−0.037
HC0.1860.556 **0.0160.0380.435 **−0.215 *−0.031−0.019
IGS0.1030.627 **−0.0170.0410.282 **−0.130−0.101−0.060
FecPOT0.401 **0.228 *0.087−0.259 **0.1730.0410.1610.073
FecABS0.466 **0.780 **0.088−0.1260.467 **−0.0920.1670.233 *
FecBAT0.1730.2120.116−0.308 *−0.054−0.030−0.018−0.038
ØPOT0.383 *0.874 **−0.0290.0710.587 **−0.1110.0550.565 **
ØABS0.570 **0.922 **−0.0050.216 *0.682 **−0.326 **0.0930.661 **
ØBAT-0.896 **−0.1900.1070.384 **−0.234−0.0300.284
ØMAX<0.001-−0.0340.0540.605 **−0.1740.1320.583 **
% PMUS0.2340.724-−0.070−0.0540.0960.1750.134
% PLIV0.5070.5740.466-0.119−0.255 **−0.279 **0.030
% POVA0.013<0.0010.5740.217-−0.213 *0.1430.368 **
% LMUS0.1410.0600.3170.0070.026-0.240*−0.083
% LLIV0.8550.1790.0730.0040.1460.013-0.141
% LOVA0.0250.0010.1620.753<0.0010.3890.148-
FecPOT, potential fecundity; FecABS, absolute fecundity; FecBAT, batch fecundity; ØPOT, oocyte size at potential fecundity; ØABS, oocyte size at absolute fecundity; ØBAT, oocyte size at batch fecundity; ØMAX, maximum oocyte size; % PLIV, percentage of proteins in liver; % PMUS, percentage of proteins in muscle; % PGON, percentage of proteins in gonads; % LLIV, percentage of lipids in liver; % LMUS, percentage of lipids in muscle; % LGON, percentage of lipids in gonads; ** significance level of p < 0.01; * significance level of p < 0.05.
Publisher’s Note: MDPI stays neutral with regard to jurisdictional claims in published maps and institutional affiliations.

