
Satellite Imageries and Field Data of Macrophytes Reveal a Regime Shift of a Tropical Lake (Lake Ziway, Ethiopia)


1
Laboratory of Ecology and Biodiversity, Department of Biology, Vrije Universiteit Brussel (VUB), 1050 Brussels, Belgium
2
Department of Environmental Health Science, Haramaya University, 235 Harar, Ethiopia
3
Department of Hydrology and Hydraulic Engineering, Vrije Universiteit Brussel, 1050 Brussels, Belgium
*
Author to whom correspondence should be addressed.
Water 2021, 13(4), 396; https://doi.org/10.3390/w13040396
Submission received: 12 January 2021
/
Revised: 29 January 2021
/
Accepted: 31 January 2021
/
Published: 3 February 2021
(This article belongs to the Section Hydrology)
Abstract
:Lake Ziway is one of the largest freshwater lakes located in the central Ethiopian rift valley. The lake shoreline is dominated by macrophytes which play an important role in immobilizing run-off pollution, stabilize sediments and support biodiversity. Monitoring the spatio-temporal changes of great lakes requires standardized methods. The aim of this study was to assess the current and long-term trends of macrophyte distribution, surface water area and the water level of Lake Ziway using remote sensing images from 1986 to 2016 with additional hydro-meteorological data. A supervised image classification with classification enhancement using Normalized Difference Aquatic Vegetation Index (NDAVI) and Normalized Difference Vegetation Index (NDVI) was applied. The classification based on NDAVI revealed eight target classes which were identified with an overall producer’s accuracy of 79.6%. Contemporary open water and macrophyte fringes occupied most of the study area with a total area of 407.4 km2 and 60.1 km2, respectively. The findings also revealed a regime shift in the mean water level of the lake and a decline in macrophyte distribution. The long-term water surface area of Lake Ziway also decreased between 1986 and 2016. The changes in water level could be explained by climate variability in the region and strong anthropogenic disturbance. A decline in water level was also associated with lowered surface water area, lakeward retreated macrophyte fringes and enhanced landward encroachment of mudflats, and resulted in a succession of macrophytes with semi-terrestrial vegetations.
1. Introduction
The impact of anthropogenic stressors and climate change on water-level and aquatic vegetation has been evident in recent decades [1,2,3] ENREF_1. The interaction between anthropogenic stressors, land-use change, and water-level variability affects aquatic macrophytes to a great extent [4,5,6,7]. Aquatic macrophytes are a diverse group of photosynthetic organisms that grow permanently or periodically in wetlands, the shoreline of lakes and along streams [8,9,10,11]. They can be classified into four functional groups as emergent, floating-leaved and rooted, free-floating, and submerged, based on their growth form, morphology, and adaptation to the environment [12,13]. Macrophytes are an integral part of aquatic ecosystems and play an important role in immobilizing pollutants, regulating oxygen production and global carbon cycle, stabilizing sediments and protecting shore erosion [5,11,14].
Distribution and composition of macrophyte communities are influenced by nutrient load, and climatic and hydrological conditions such as spatial and temporal variations of water level [7,11,15,16,17,18]. Lake water level changes provide an opening for seedling recruitment for perennial emergent aquatic plants [19,20,21]. On the contrary, a low water level causes succession and terrestrialization of aquatic ecosystems [22,23,24,25]. Climatic conditions such as temperature and rainfall fluctuations also affect germination rates of aquatic vegetation [11,26,27,28].
Timely recording and mapping of spatio-temporal distribution and composition of macrophytes is necessary to understand factors which influence distribution and composition of macrophytes [29,30,31]. Conventional field survey approaches for macrophyte monitoring can give good estimates and provide reliable and reproducible taxonomic information [32,33,34,35,36,37]. However, these methods cannot capture whole-lake macrophyte cover or their patchy distribution and are hindered by technical and logistical limitations [33,38]. Alternative approaches such as remote sensing techniques and the use of satellite imagery can provide data covering large areas in space and time [29,30,39,40,41,42,43].
Different remote sensing techniques have been developed to systematize the identification and change detection of aquatic vegetation from satellite data [44,45,46,47] and recent advances in satellite image resolution make it possible to classify multiple species with higher accuracy level [37,48,49]. Recent developments in specifically designed vegetation indices for aquatic vegetation have improved identification and detection of macrophytes from medium resolution satellite images [42,46,50,51].
Satellite images are also useful to demarcate the surface water from the surrounding aquatic vegetation and to detect changes in the surface water area due to natural or anthropogenic influences [52,53,54,55]. This makes it easier to delineate the distribution of macrophytes from the surface water and to determine the relationship between macrophyte distribution and the surface water area of lakes [56,57].
There is a continuous and rapid change in the distribution of macrophytes and the surface water area of tropical aquatic ecosystems [58,59,60]. Thus, there is a need for a comprehensive approach to detect such changes [48,53]. Changes in surface water area and macrophyte vegetation cover from multi band satellite images can be achieved using different methods [46,52,61]. The use of change detection techniques is especially important to monitor the rapid hydrodynamics of tropical lakes [39,47,53]. Most tropical lakes are under rapid change due to anthropogenic disturbances and climate change. Therefore, understanding the change in surface water fluctuations and macrophyte distribution is essential for lake ecosystem monitoring. Thus, the aim of this study was to assess the current and changing trends of macrophyte distribution, surface water area and the water level of Lake Ziway using field data, multi temporal satellite images, and hydro-meteorological data. In addition, we investigated the relationship between distribution and change of macrophyte cover with selected hydro-metrological parameters.
2. Materials and Methods
2.1. Study Area
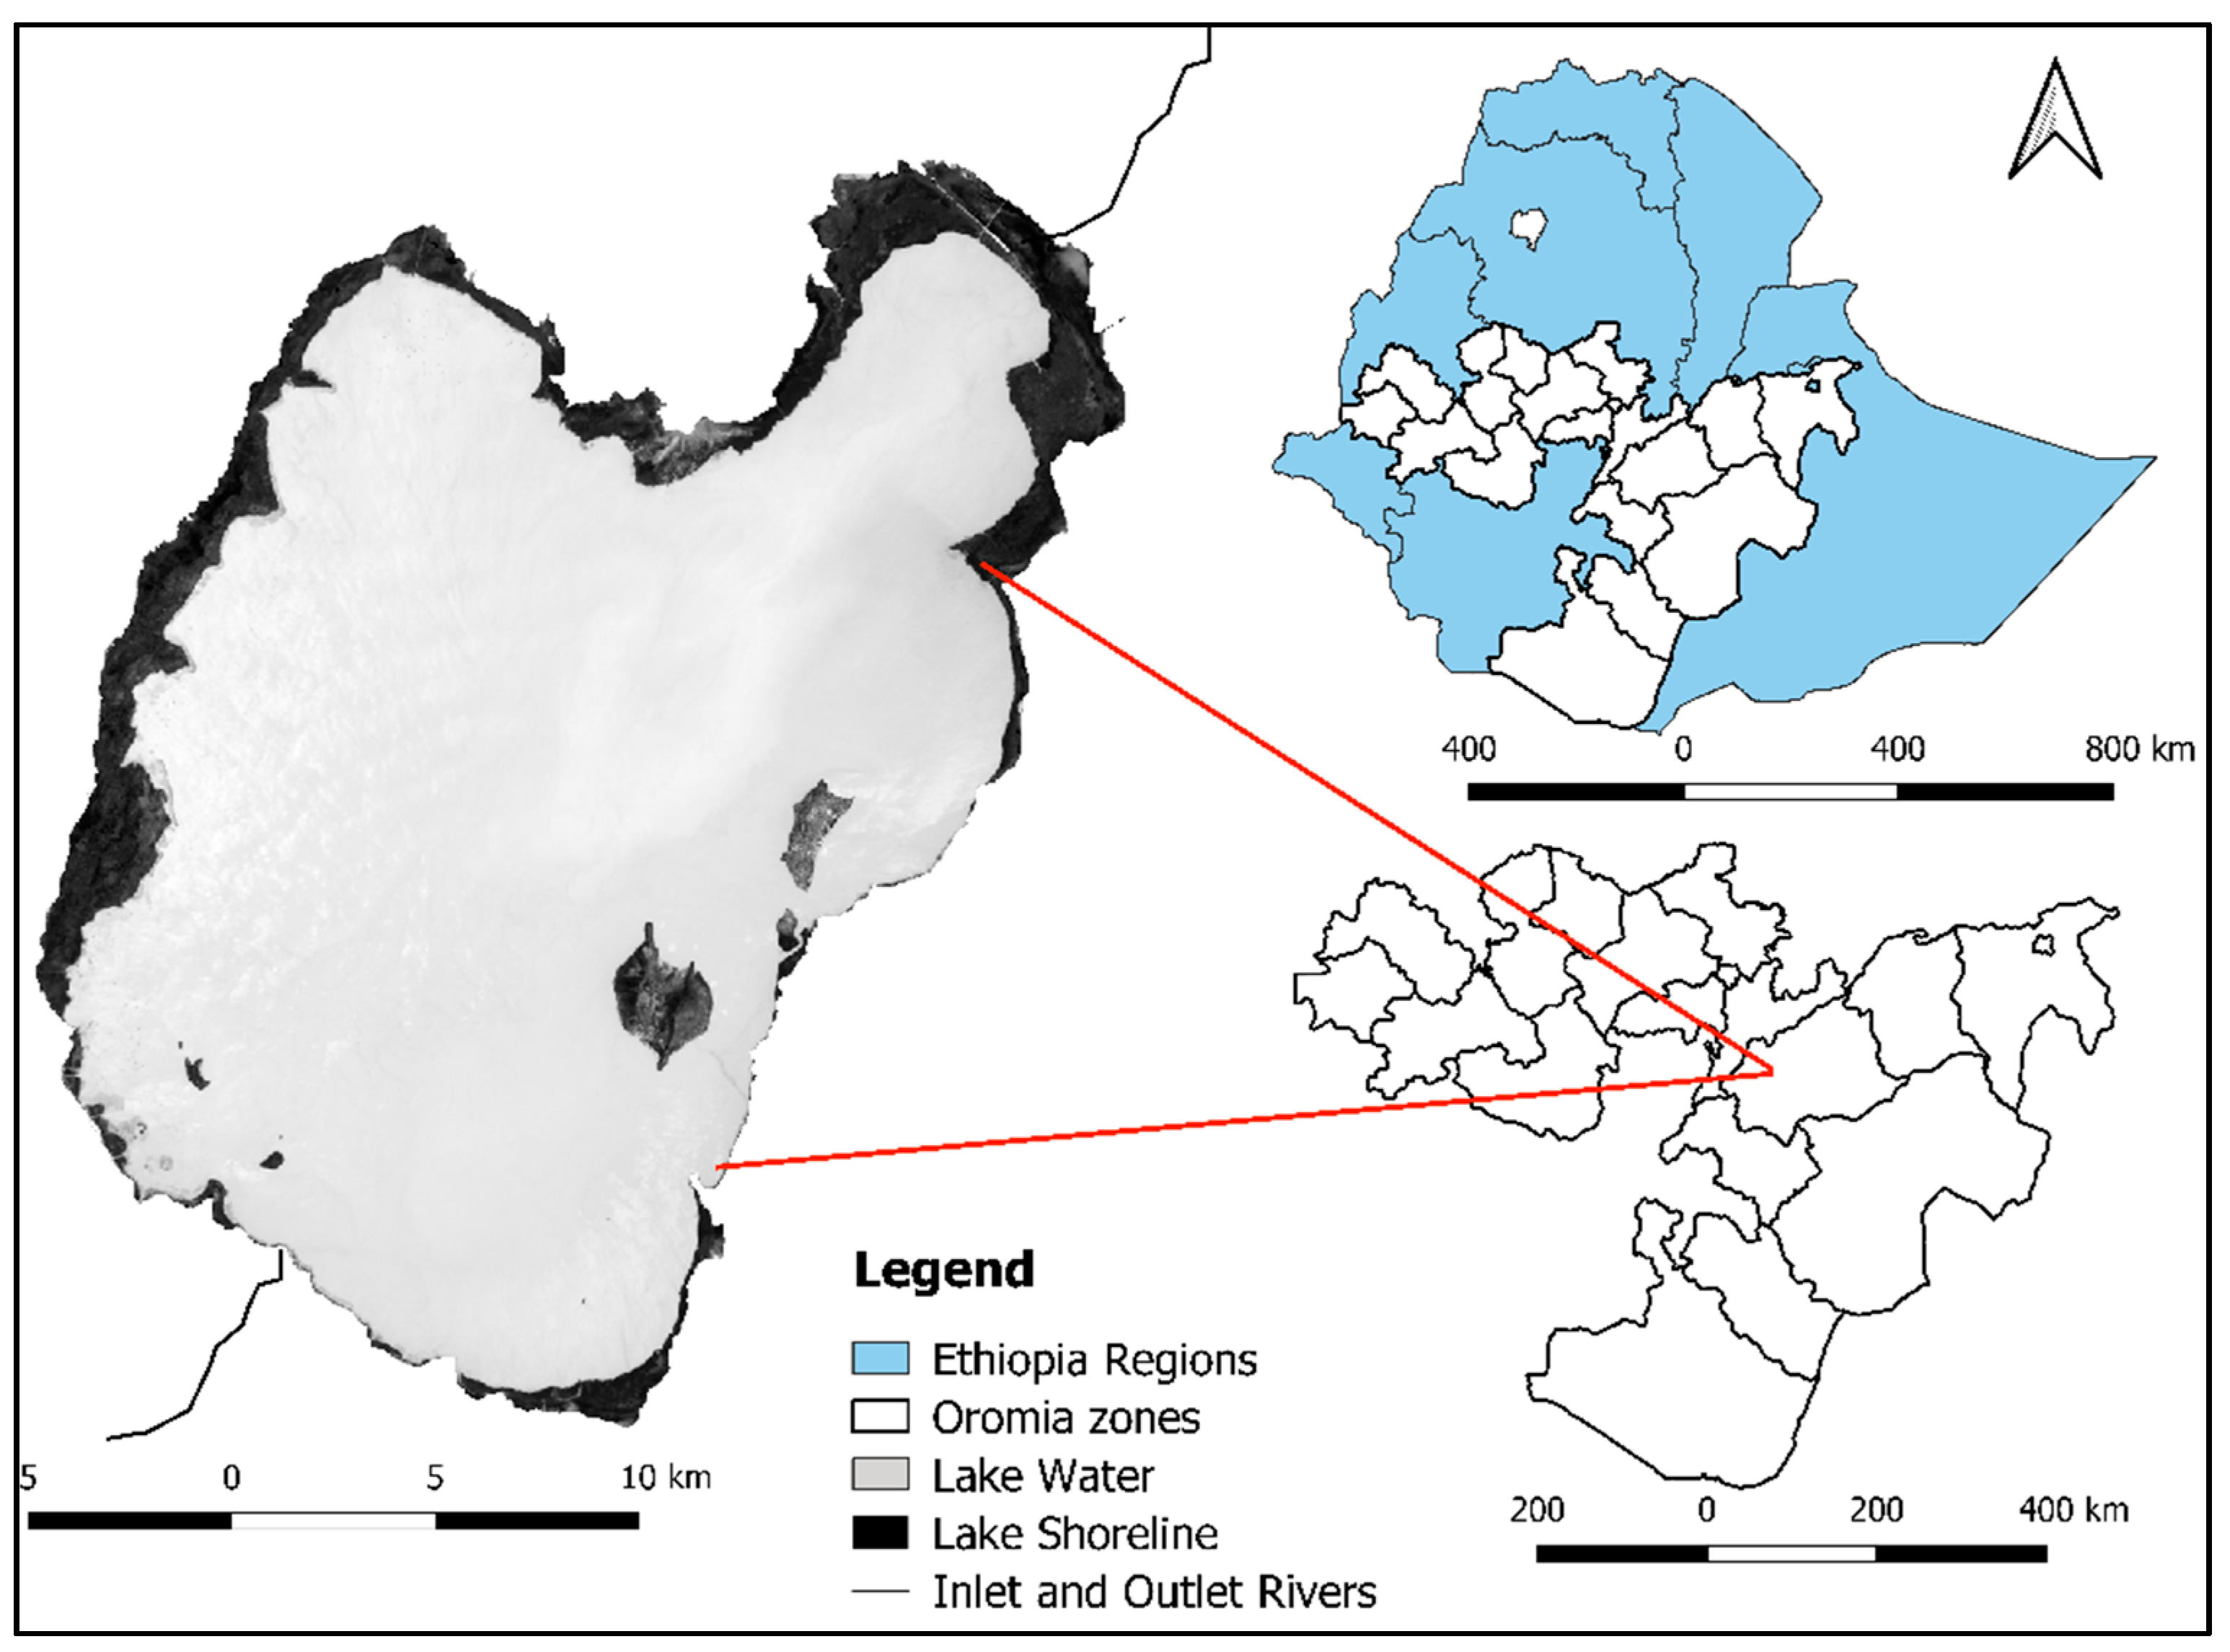
Lake Ziway (Figure 1) is one of the largest freshwater lakes in the central Ethiopia rift valley. It is located within 8.0073°N, 38.8415° E coordinates and at an elevation of 1636 m above sea level. It has a maximum of 31 km length and 20 km width, with a total surface area of 485 km2. It has an average depth of 4 m and the maximum depth reaches up to 9 m. The Meki and Katar rivers are the two main feeders of the lake, whereas the Bulbula River which flows to Lake Abijat is the only outlet from Lake Ziway. The total catchment area of the lake is up to 7025 km2. The shores of the lake are covered by different macrophytes and semi-terrestrial vegetations.
2.2. Ground Reference Data and Macrophyte Sampling
A ground-based field survey was conducted in the last week of September 2016 to ensure agreement between the satellite images from October and what was seen on the ground. October is the end of the wet season and the water level will be close to the maximum annual water level of the lake. Field survey on the shoreline was carried out to mark ground control points with GPS handsets (Garmin GPS 60 with an accuracy of ± 6 m) within homogenous areas of target classes with at least 60 m × 60 m dimension [62]. A preliminary survey was conducted to identify potential macrophyte distribution patches around the lake. In addition, Google earth map, Google time lapse and previous studies were used as information sources. A total of 437 ground-truth points were collected (Figure S1) and at each sampling location multiple photos, photo numbers, and descriptive notes were recorded. All points and necessary supplementary data were copied to a pre- prepared Excel data sheet. All ground control points were saved as .csv and .txt formats.
Macrophytes were collected manually from different sampling locations and rinsed in situ, blotted, pressed on cardboard and transported to the Plant Biology and Nature Management (APNA) laboratory, Vrije Universiteit, Brussels, Belgium, for identification. Identification was made at the species level using previous studies of the lake [16], photographs and expert-based knowledge. Macrophyte species from all four functional groups were identified. Emergent macrophytes including Phragmites australis, Typha latifolia, Cyperus articulates, Echinochloa colona, Cyperus papyrus, Echinochloa stagnina, Schoenoplectus corymbosus were identified. Two floating-leaved and rooted macrophytes (Nymphaea lotus and Nymphoides indica) were also found on some parts of the shoreline. Free floating and submerged macrophytes observed in the lake were Pistia stratiotes and Potamogeton schweinfurthii, respectively. Another dominant type of vegetation in the shoreline of the lake was the semi-terrestrial Aeschynomene elaphroxylon which was distributed along different parts of the lake.
2.3. Hydro-Meteorological Data
The necessary hydro-meteorological data (rainfall, temperature and lake water level) of the study site and the catchment area were acquired from the National Meteorological Agency of Ethiopia (NMAE) and the Ethiopia Ministry of Water, Irrigation and Electricity (MoWIE). Rainfall from different stations in the catchment of the lake was summed and used to estimate the areal depth of the rainfall corresponding to Lake Ziway. A time series data set from 1980–2012 was used, despite the presence of many incomplete data series for each of the hydro-meteorological parameters considered. To assess the association between macrophyte distribution and hydro-meteorological parameters (water level, rainfall, and temperature), three months data prior to October (July, August, and September) were used. We hypothesized that the three months rainfall and temperature prior to October would influence germination or vegetative growth of macrophytes at the shorelines.
2.4. Satellite Data Acquisition and Image Pre-Processing
Landsat 8 OLI, Landsat ETM+ and Landsat 5 TM were downloaded from the United States Geological Survey (USGS) website (https://earthexplorer.usgs.gov). Landsat 8 OLI images acquired on 6 October 2016 were used to classify the current macrophyte and other target classes’ distribution. October is the end of the wet season in Ethiopia and macrophytes develop to their full extent. Although a short time difference between ground data collection and the selected satellite data acquisition was observed, the change in aquatic vegetation growth in such a short time is not expected to create a significant difference in macrophyte development and coverage. Only images with less than 10% cloud cover were selected for this study. Landsat images from different years and sensors were used to analyze the change in macrophyte coverage, semi-terrestrial vegetation, and lake surface water area change. All acquired images were referenced in the World Geodetic System (WGS84) datum. Details and specifications of satellite images used in this study are presented in Table S1.
All downloaded satellite images were imported into the Semi-Automatic Classification (SCP) Plugin for QGIS [63]. Radiance values were converted into surface reflectance based on the image-based dark object subtraction (DOS) atmospheric correction approach [64] in the semi-automatic plugin (SCP). A radiometric correction was also applied using the semi-automatic plugin (SCP) to remove radiometric defects, haze and to improve the visual impact of true and false color composites. The lake extent at the maximum inundation zone, with aquatic and semi-terrestrial vegetation, was delineated and digitized based on visible spectral-radiometric differences in the images and reference data from a wet season. The images were clipped using the digitized polygons as a shape file.
2.5. Extraction of Vegetation and Water Features
Vegetation indices were used to identify the distribution of macrophytes and other target classes. There are different mathematical combinations which were developed to extract vegetation and water features (Table 1). Most of these involve ratios between differences and sums of the visible and near-infrared (NIR) spectral bands. One of the most commonly used is the Normalized Difference vegetation Index (NDVI) which has been mostly used to capture terrestrial vegetation characteristics including growth and above ground biomass [65]. In addition to NDVI, we have applied the Normalized Difference Aquatic Vegetation Index (NDAVI) and the Water Adjusted Vegetation Index (WAVI) which are designed to capture aquatic vegetation spectral response. [46,51]. Similarly, most of the methods for extraction of water bodies were developed based on the band ratio of near-infrared to visible band [52,66]. In this study, the delineation of lake surface water area was performed using the Modified Normalized Difference Water Index (MNDWI) [66]. This is the modification of the Normalized Difference Water Index (NDWI) developed by [52]. MNDWI is better than NDWI to enhance water features and reduce values of built-up land from positive to negative. As Ziway town is close to one side of the lake, we preferred MNDWI over NDWI. MNDWI was calculated for all images acquired from different periods, and water usually has positive MNDWI values. However, the influence of turbidity and the surrounding vegetation was considered, and a threshold was set based on the reference data. MNDWI values greater than 0.2 were set as a threshold to reclassify MNDWI values as water. The extracted water surfaces were also visually inspected and validated. The equations of different vegetation and water indices (Table 1) were calculated using the band calculation tool in SCP.
2.6. Target Classes Separability
A region of interest (ROI) for each target class was created based on the ground reference data. Target class separability performance of NDAVI, WAVI, and NDVI was tested using selected regions of interest (ROIs) for each target class. The mean and standard deviation of NDAVI, WAVI, and NDVI for each target class was extracted from selected regions of interest (ROIs) and used to test the separability between target classes. The separability performance of the indices was tested using the Jeffries–Matusita Distance (J–MDIST) between classes [46,67]. Separability based on J–MDIST was calculated between each pair of target classes for each ROI. Then the values between each pair of ROIs were averaged to assess overall separability obtained based on NDAVI, WAVI, and NDVI. The two best-performing indices were selected based on J–MDIST values.
2.7. Image Classification, Accuracy Assessment and Validation
A combination of unsupervised and supervised image classification was performed. K-means clustering unsupervised classification (Figure S2) was applied, with a total of 15 clusters, using Semi-Automatic Classification (SCP) Plugin for QGIS 3.4 [63]. The heterogeneity of the study area was considered to decide the number of clusters. The outputs from unsupervised classification were associated with field observation data and used to select a training region of interest (ROI) for supervised classification.
The supervised classification was performed using the Semi-Automatic Classification (SCP) Plugin Version [63] for QGIS 3.4 [68]. NDVI and NDAVI generated from the original satellite data bands in Landsat 8 OLI were used as input datasets in combination with the original bands. In SCP, the user is required to create training polygons or regions of interest (ROI) for each class and we created eight macro classes (target classes). Based on the unsupervised classification and the vegetation indices, the four dominant macrophytes (Phragmites, Echinochloa, Cyperus, and Typha) were each identified as a macro class. The rest of the macrophytes were assigned as a mixed macrophytes class. Additionally, mudflat, water, and semi-terrestrial vegetation were included as separate target classes. More than 80 training samples or ROIs were selected for each class using the ROI Pointer in SCP. Selection of the training samples was performed based on the region growing algorithm in SCP, which selects pixels which are similar to the reference data pixel or the seed. The parameter spectral distance in the region growing algorithm was set from 0.001 to 0.04 depending on the target class. The minimum and maximum width was 40 and 100 pixels, respectively. This included only spectrally homogeneous areas in each training site. The ROIs were selected and validated using the ground truth data from field survey, the results from unsupervised classification, vegetation indices and true and false color composites. After validation of all the training samples, the maximum likelihood classifier (MLC) algorithm was used to conduct the supervised classification. Classification enhancement was applied using the band calculation tool in the SCP based on the NDVI and NDAVI datasets to minimize confusion between classes. Subsequently, the final classification map (NDVI based and NDAVI based) and a classification report which consists of the area distribution of each target class was generated.
To validate the representation of classified target classes, accuracy assessment was performed. An error matrix which compares the classification output from the satellite images with reference data was prepared. In this study, more than 400 ROIs of up to 30 pixels in size were created at random points. The created ROIs were interpreted and assigned to respective target class using the reference data, color composites and vegetation indices (NDVI and NDAVI). Finally, the confusion matrix which shows the producer’s and the user accuracy was generated.
2.8. Change Detection
The change in area distribution of four major classes, namely open water, macrophytes (all groups together), semi-terrestrial vegetation, and mudflats between 1986 and 2016 was assessed. We have applied NDAVI and MNDWI to calculate the area distribution of the four major classes. The MNDWI and NDAVI maps were converted into a pseudo color image and a threshold was set for each class using the reference data from 2016 as a base map. The MNDWI and NDAVI maps were reclassified based on the thresholds and visual interpretation of Google time lapse images and topographic maps from different years. The accuracy of the thresholds set was assessed based on the reference data and image from 2016.
2.9. Statistical Analysis
The Mann–Kendall (MK) test, which is a non-parametric test used to investigate monotonic trends [69,70] without assuming any type of distribution, was used in order to detect trends for in situ-measured long term hydro-meteorological data. We used Pettit’s homogeneity test [71] to detect change points of the time series water level dataset. Pettit’s test is also a non-parametric test mostly used to detect a break (a shift in the means of a dataset) at a certain period. Spearman correlation was used to analyze the relationship between macrophytes distribution area and NDAVI with selected hydro-meteorological parameters (rainfall, temperature, water level and lake surface area). The statistical tests were performed in XLSTAT Version 2017.5, Addinsoft inc., New York, NY, USA [72].
3. Results
3.1. Macrophyte Vegetation Types and Target Class Separability
Based on the field survey, macrophyte vegetation types from all four functional macrophyte groups were identified. The majority of identified macrophyte vegetation were emergent macrophytes including Typha latifolia, Phragmites australis, Cyperus articulates, Echinochloa colona, Cyperus papyrus, Echinochloa stagnina and Schoenoplectus corymbosus. Two floating-leaved and rooted macrophytes (Nymphaea lotus and Nymphoides indica) were also found in some parts of the shoreline. Free floating and submerged macrophytes observed in the lake were Pistia stratiotes and Potamogeton schweinfurthii, respectively. Another dominant type of vegetation in the shoreline of the lake was the semi-terrestrial Aeschynomene elaphroxylon which was distributed along different parts of the lake.
We have identified four dominant emergent macrophyte classes (Typha, Cyperus, Phragmites and Echinochloa) separately and the rest were categorized as mixed macrophytes class. In addition, semi-terrestrial vegetation, mudflat and water were included as target classes. As we used medium resolution satellite images, the sparser submerged macrophytes could not be differentiated from the surface water of the lake and were included as part of the open water.
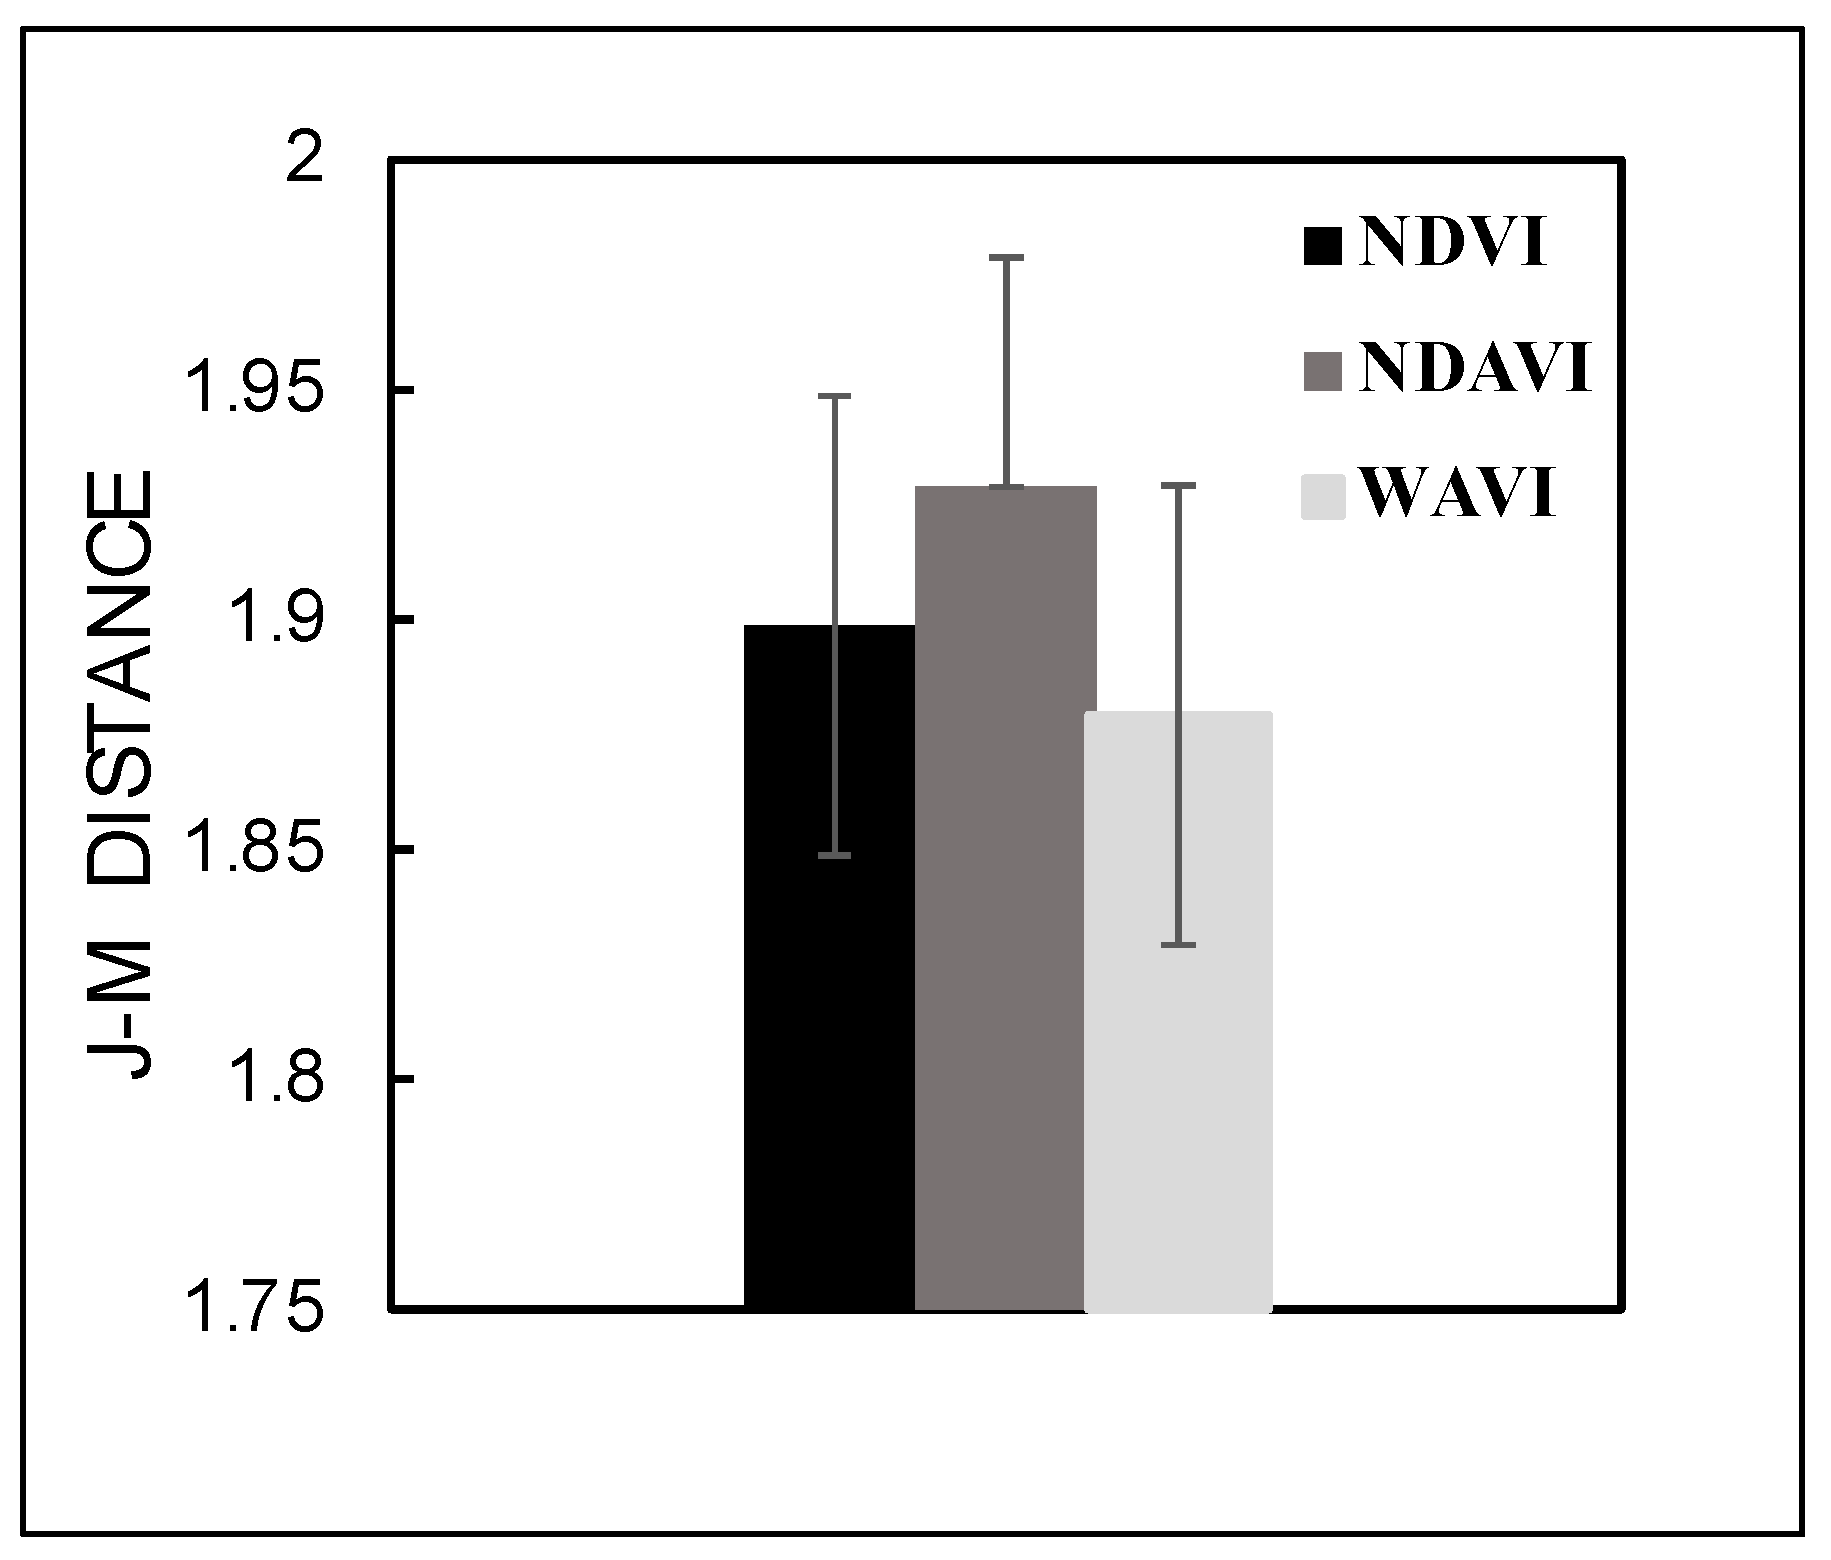
An assessment using WAVI, NDVI and NDAVI based on the regions of interest (ROIs) distinguished eight target classes. The average and standard deviation J-MDIST values for WAVI, NDVI and NDAVI were 1.88 ± 0.041, 1.90 ± 0.046 and 1.93 ± 0.06, respectively (Figure 2). The average separability performance of NDAVI and NDVI was greater than WAVI. NDAVI performed better in delineating Phragmites, Cyperus and Typha from the open water. Moreover, it performed better to separate mixed macrophytes and Echinochiloa from mudflat. Additionally, NDVI was better at delineating the semi-terrestrial vegetation from other classes. Therefore, two vegetation indices (NDAVI and NDVI) with better separability performance were used for supervised classification.
3.2. Image Classification and Accuracy
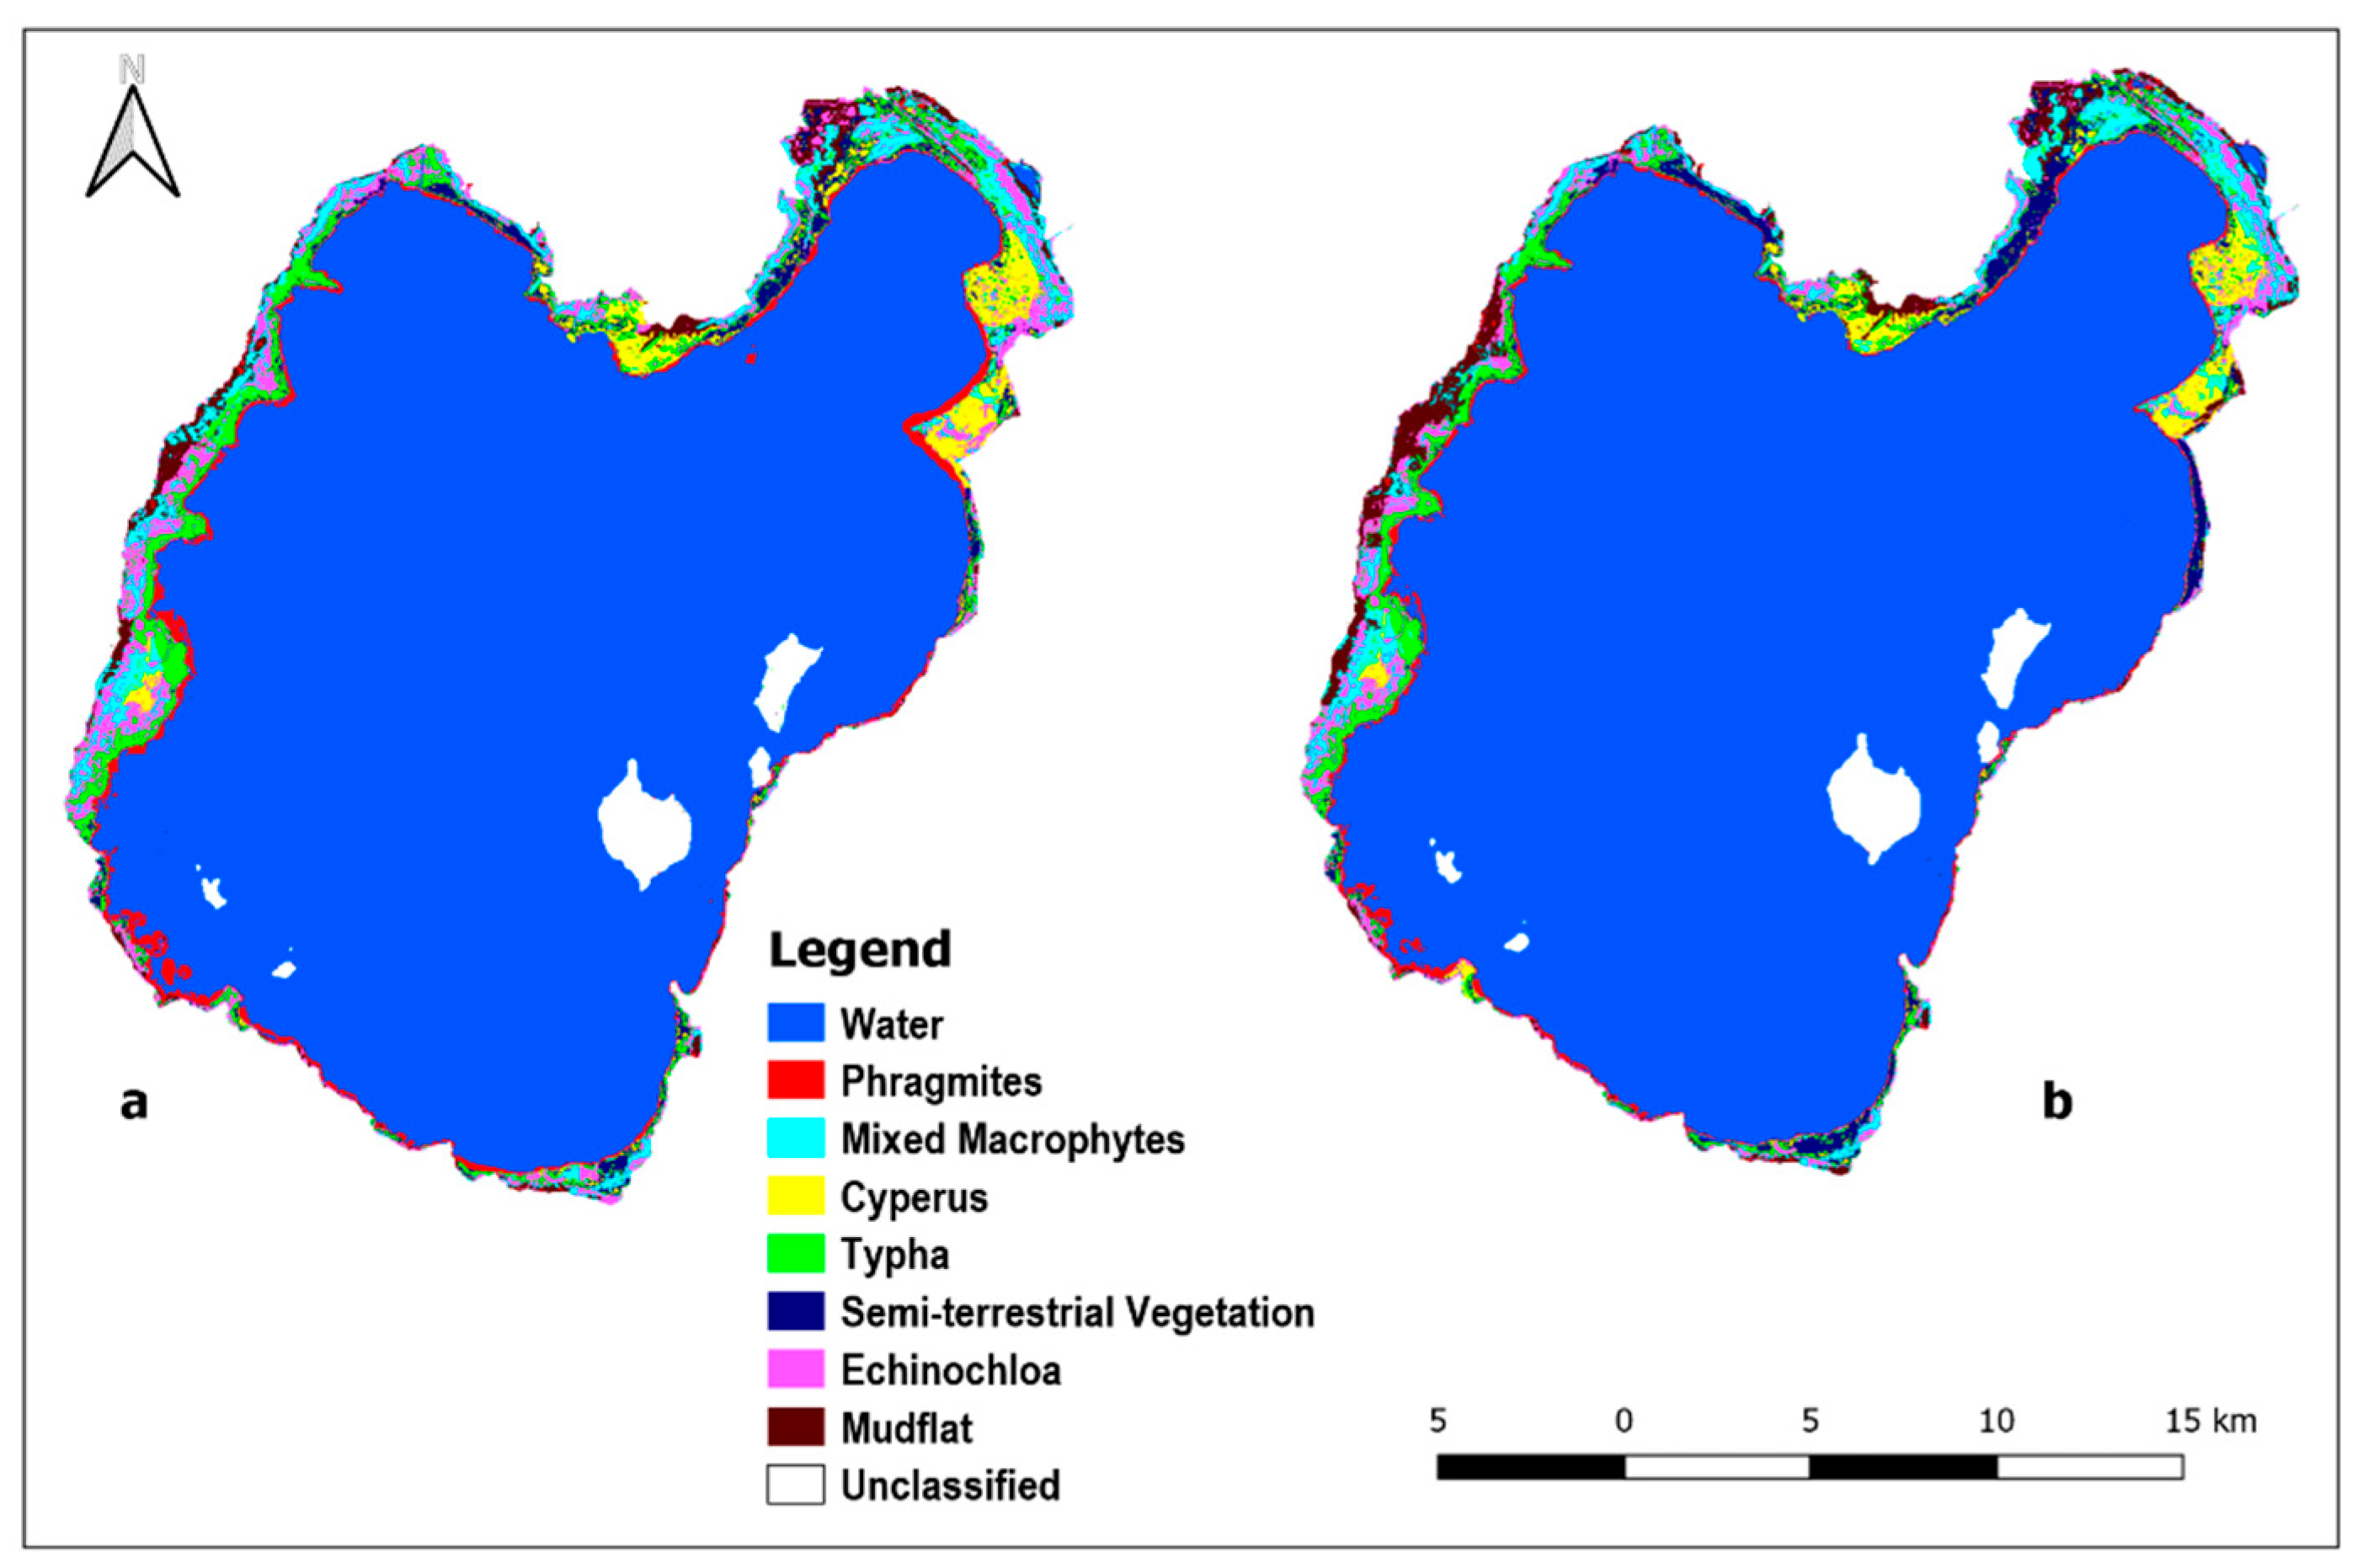
A supervised classification from Landsat 8 OLI images acquired in October 2016 was performed. The final classification maps based on NDVI and NDAVI showed the distribution of eight target classes in the study area (Figure 3a,b). The four mono-specific emergent macrophytes and additional four target classes covered a total area of 484.4 km2 (Table 2). Water was the major target class which occupied 84.3% (NDVI based) and 84.1% (NDAVI based) of the total area (Table 2, Figure 3a,b). All groups of macrophytes covered around 13% (NDAVI based) and 12.4% (NDVI based) of the total area.
Among macrophytes, Typha was dominant with a total distribution of 3.5% (NDAVI based) and 2.8% (NDVI based). In contrast, Phragmites covered the smallest area with only 1.7% (NDAVI based) and 1.4% (NDVI based). The total area under the class mixed macrophytes was reduced from 2.9% (NDVI based) to 2.4% when we applied NDAVI based classification. Similarly, the area covered with Mudflat was reduced from 1.8% (NDVI based) to 1.4% (NDAVI based) classification. Echinochloa and Cyperus also showed small increment in total area when NDAVI based classification was used. NDAVI delineated both Typha and Phragmites from water and Mudflat better than NDVI. In contrast, the distribution of semi-terrestrial vegetation was reduced from 1.5% to 1.4% when NDAVI based classification was applied (Table 2, Figure 3a,b). The confusion matrix (Table S2) presented the classification accuracy for NDAVI and NDVI based supervised classification.
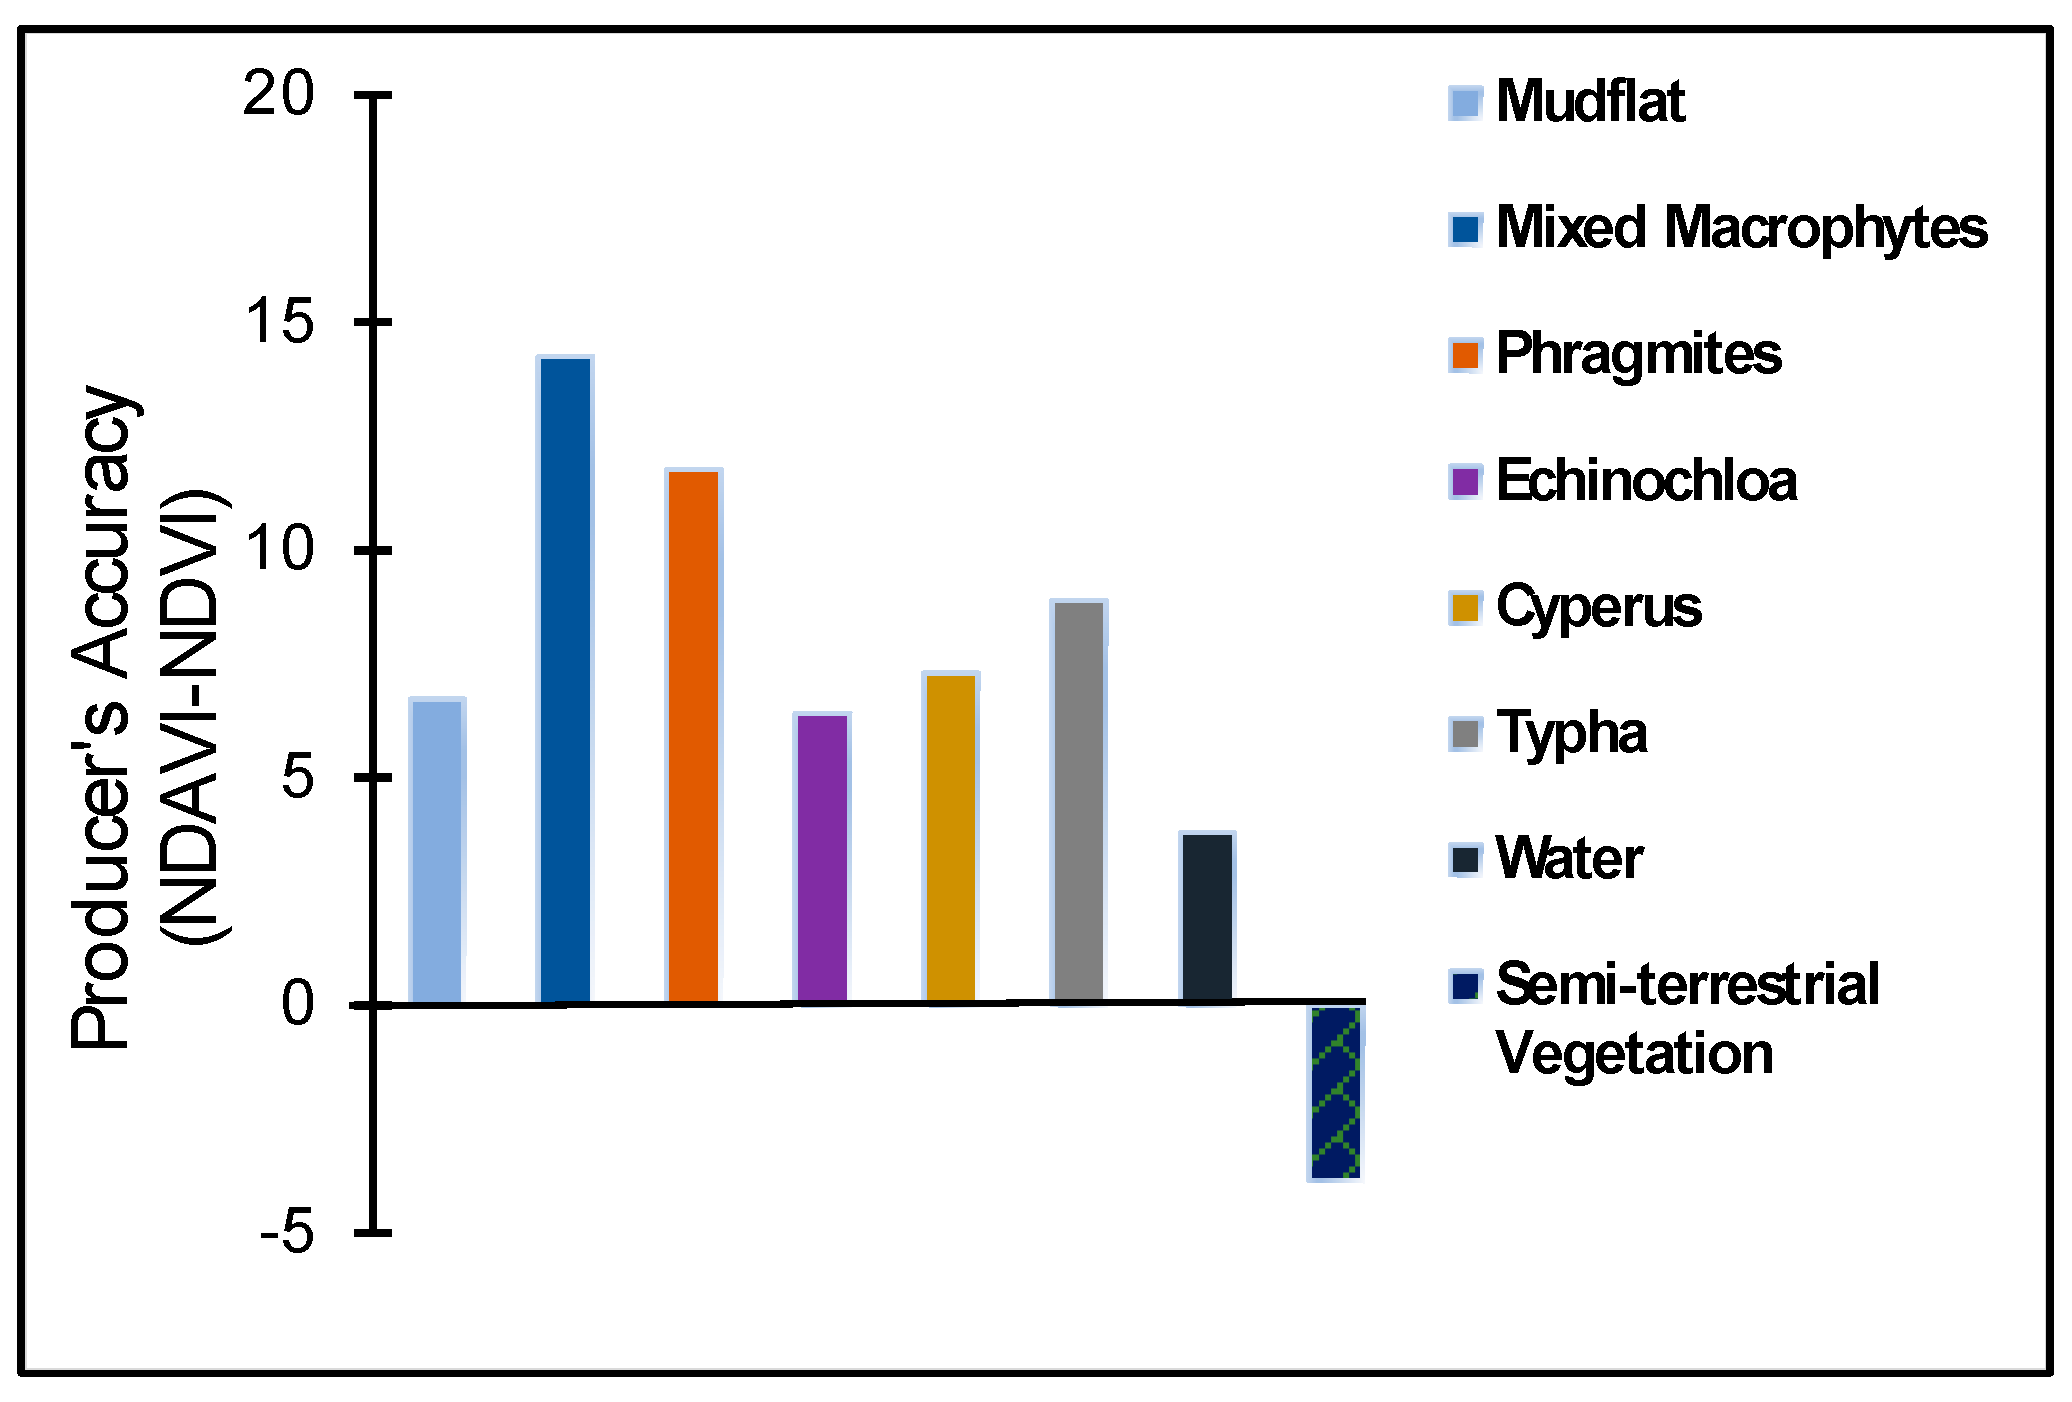
The overall producer’s accuracy for NDVI based classification was 72.5% and it was improved to 79.6% for NDAVI based classification. The NDAVI based classification showed a better performance in distinguishing Phragmites with a producer’s accuracy of 81.8%, compared to NDVI based classification with a producer’s accuracy of 70.0%. Similarly, NDAVI based classification improved producer’s accuracy for Echinochloa, Cyperus, Typha and water to 74.5%, 79.5%, 79.7% and 88.4 compared to NDVI based classification with a producer’s accuracy of 68.1%, 72.2%, 70.7% and 84.5%, respectively. The producer’s accuracy value for semi-terrestrial vegetation decreased from 88.8% (NDVI based) to 85% (NDAVI based). The producer’s accuracy difference between NDAVI based and NDVI based supervised classification for each target class favored NDAVI, except for semi-terrestrial vegetation (Figure 4).
The mixed macrophytes class was the most overestimated target class and showed the lowest producer’s accuracy with only 58.2% (NDVI based) and 73.2% (NDAVI based) classification. Visual interpretation of the classified images showed a logical pattern of macrophytes and semi-terrestrial vegetation around the lake. The distribution of Phragmites at the inner edge of the lake followed by Typha or Cyperus and Echinochiloa represents the observed orientation of the macrophyte vegetation during the field survey. The largest distribution of semi terrestrial vegetation around the northern part of the lake was also mapped correctly.
3.3. Hydro-Meteorological Parameters Trend and Regime Shift
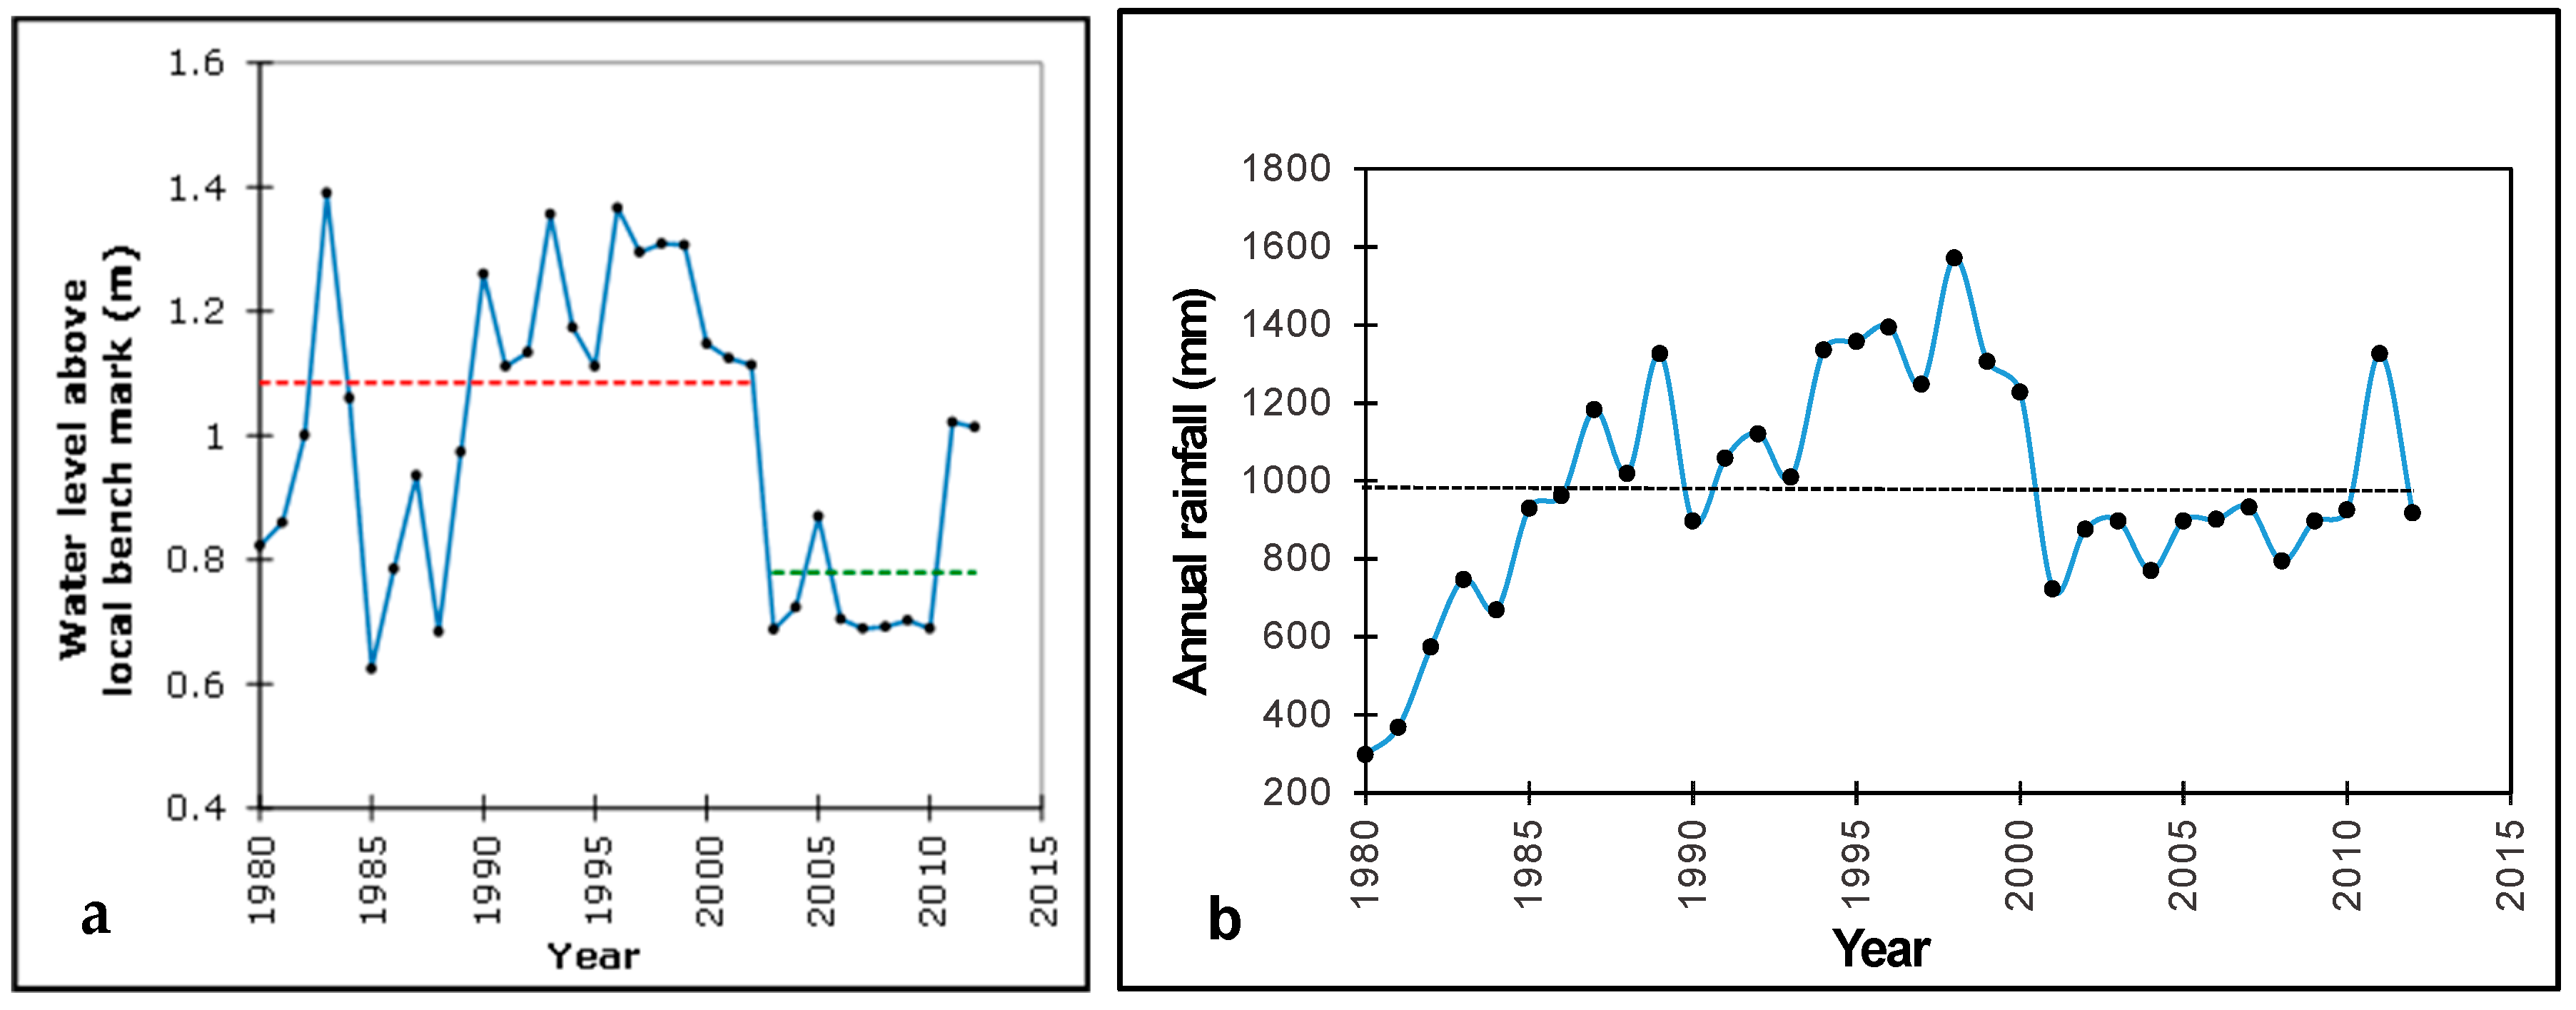
The non-parametric Mann-Kendall test revealed a decreasing trend in the long-term water level of the lake (S= −146, p = 0.044) between 1980 and 2012. Analysis of regime shift using the Pettit homogeneity test showed a regime shift in the mean water level of the lake (K= 160, p = 0.029) that occurred in 2003 (Figure 5a). The average water level above the local benchmark before and after the regime shift were 1.085 and 0.779 m, respectively. Mann-Kendell trend analysis also indicated a decreasing trend in the water level of the lake in October (S = −154, p = 0.039). However, the long-term rainfall at Lake Ziway catchment area (Figure 5b) did not show a monotonic trend (S = 6, p = 0.149), although there was a shift towards less rainfall since 2001–2010. Similarly, there was no monotonic trend in the mean annual temperature (S =59, p = 0.270) between 1980 and 2012.
3.4. Change Detection of Target Classes
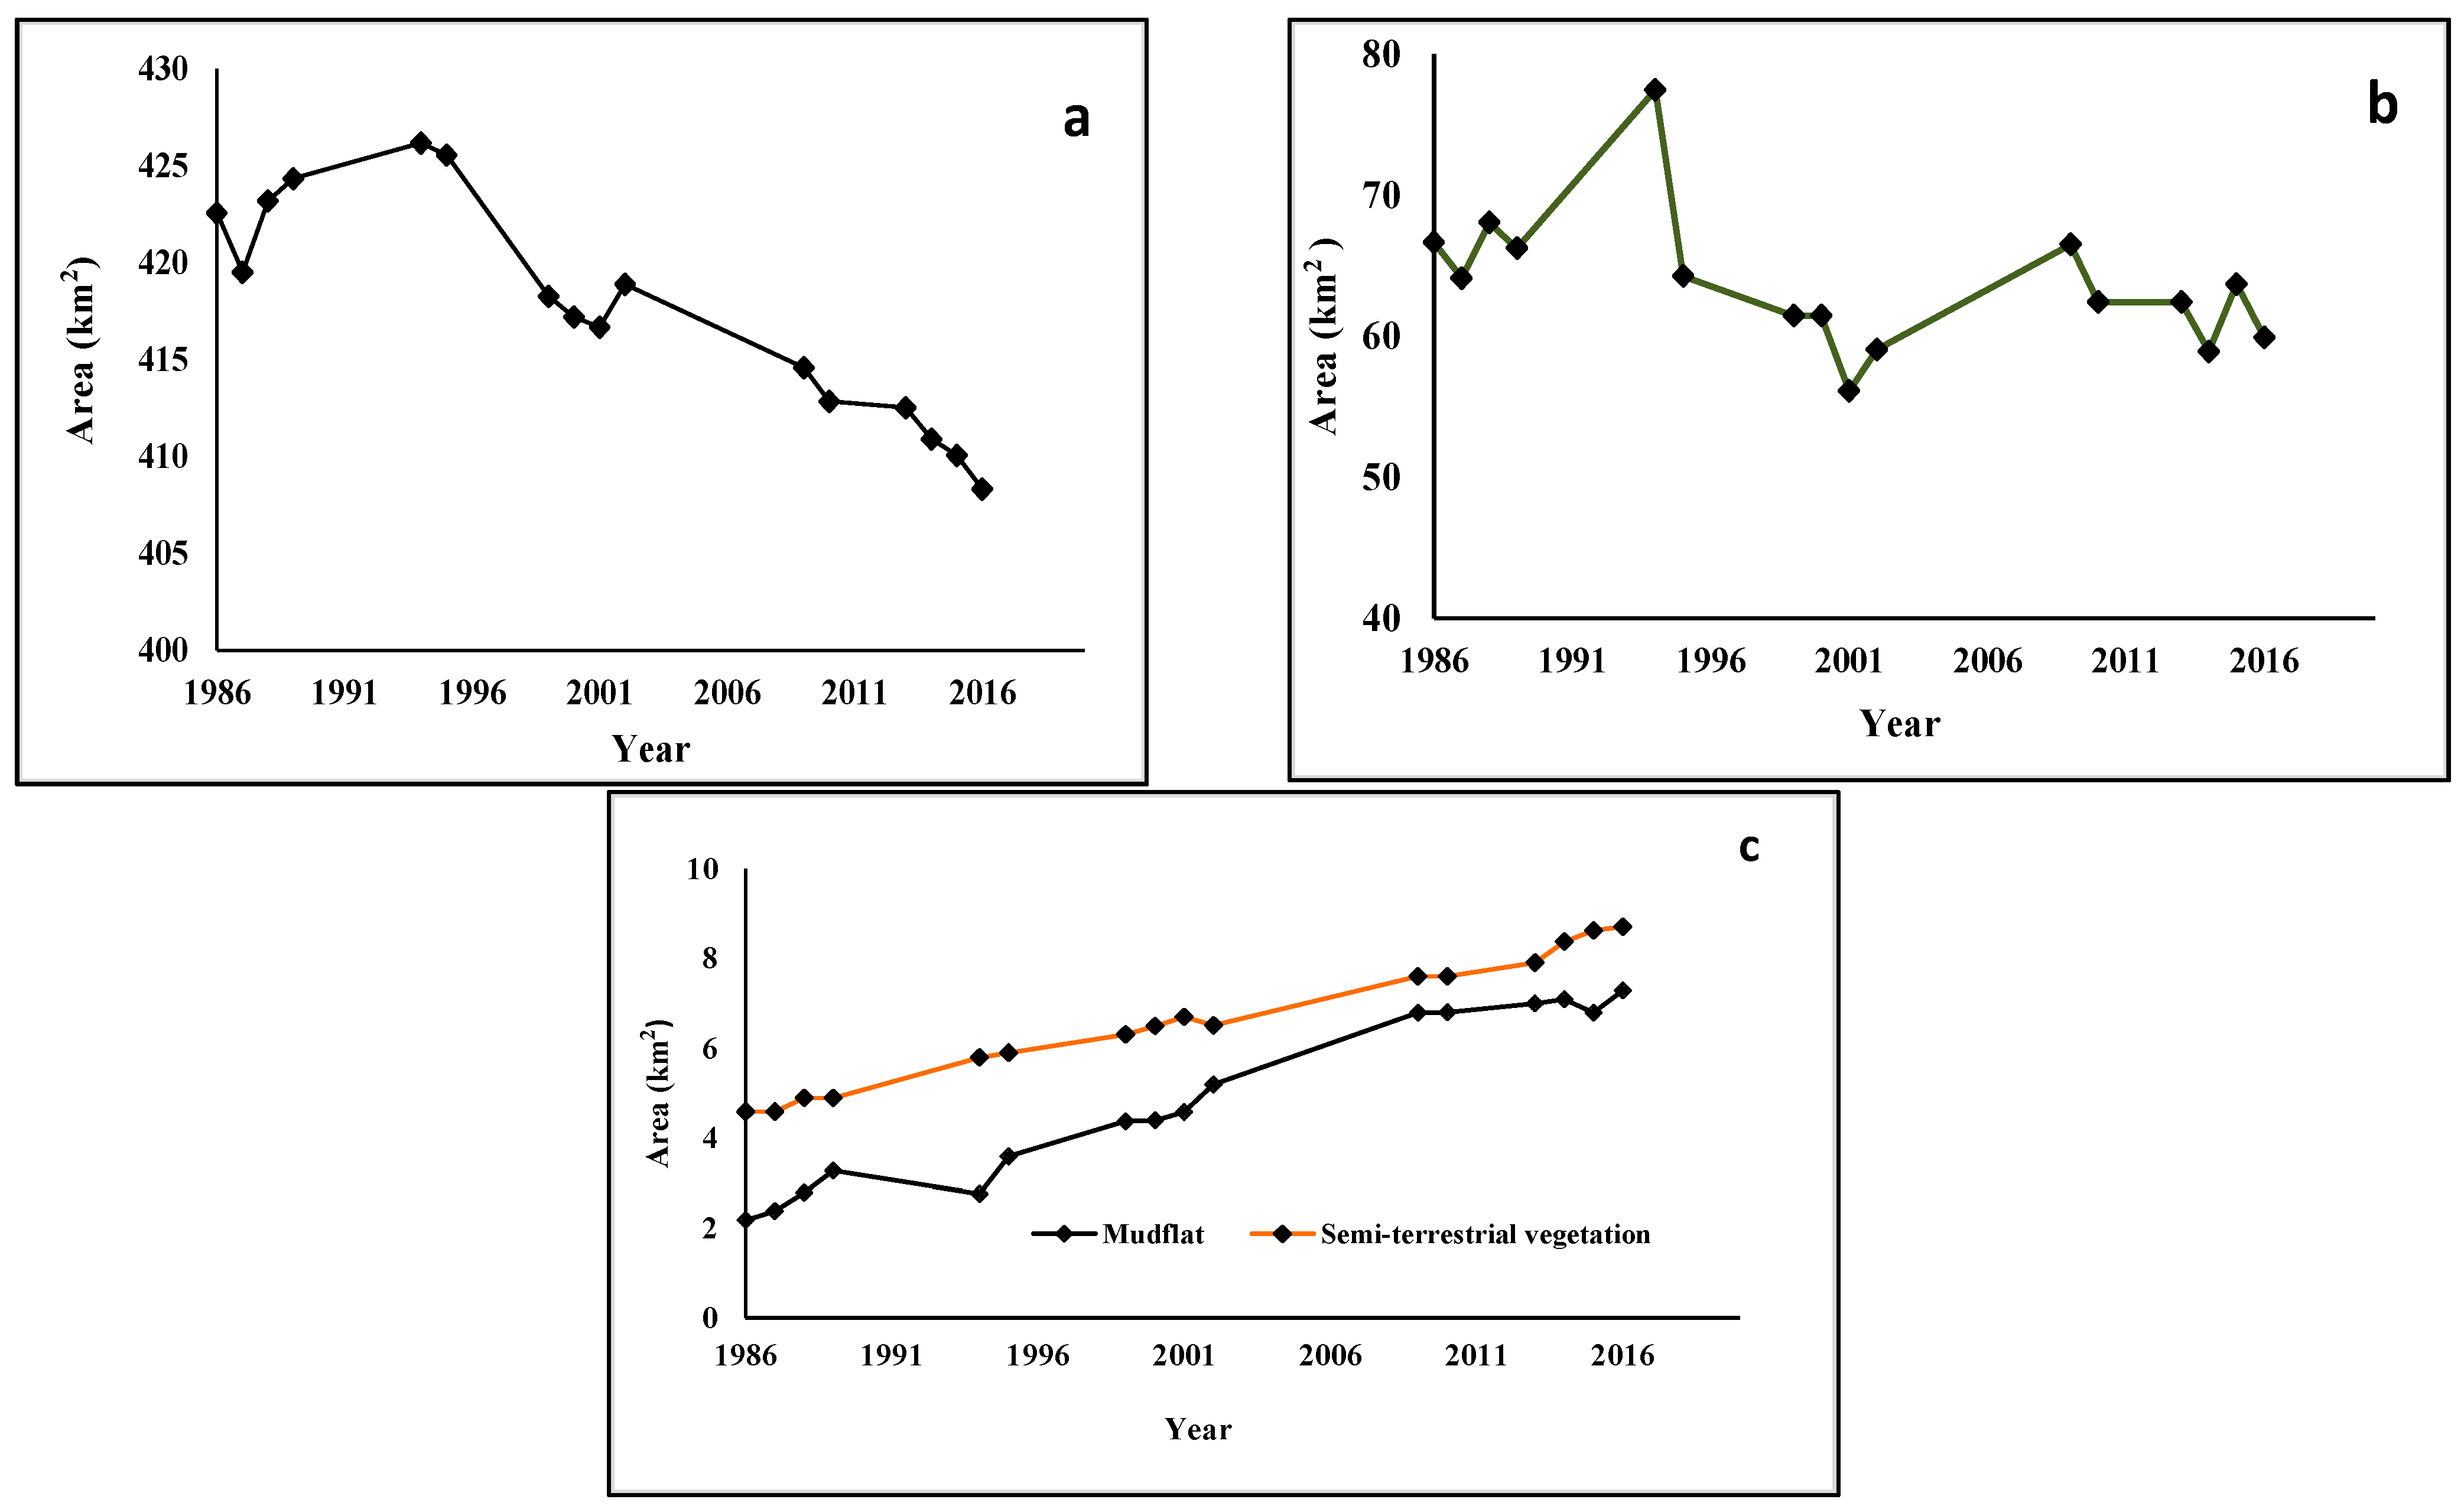
The change in the surface water area of Lake Ziway and the surrounding macrophytes, semi-terrestrial vegetation and mudflat was assessed. The surface water area changed between different periods and the overall change between 1986 and 2016 showed a decreasing trend, except between 1986 and 1995 which showed an increasing trend (422.2 km2 to 426.3 km2) on four occasions (Figure 6a). The minimum surface water area of Lake Ziway was 407.4 km2 which was observed in 2016.
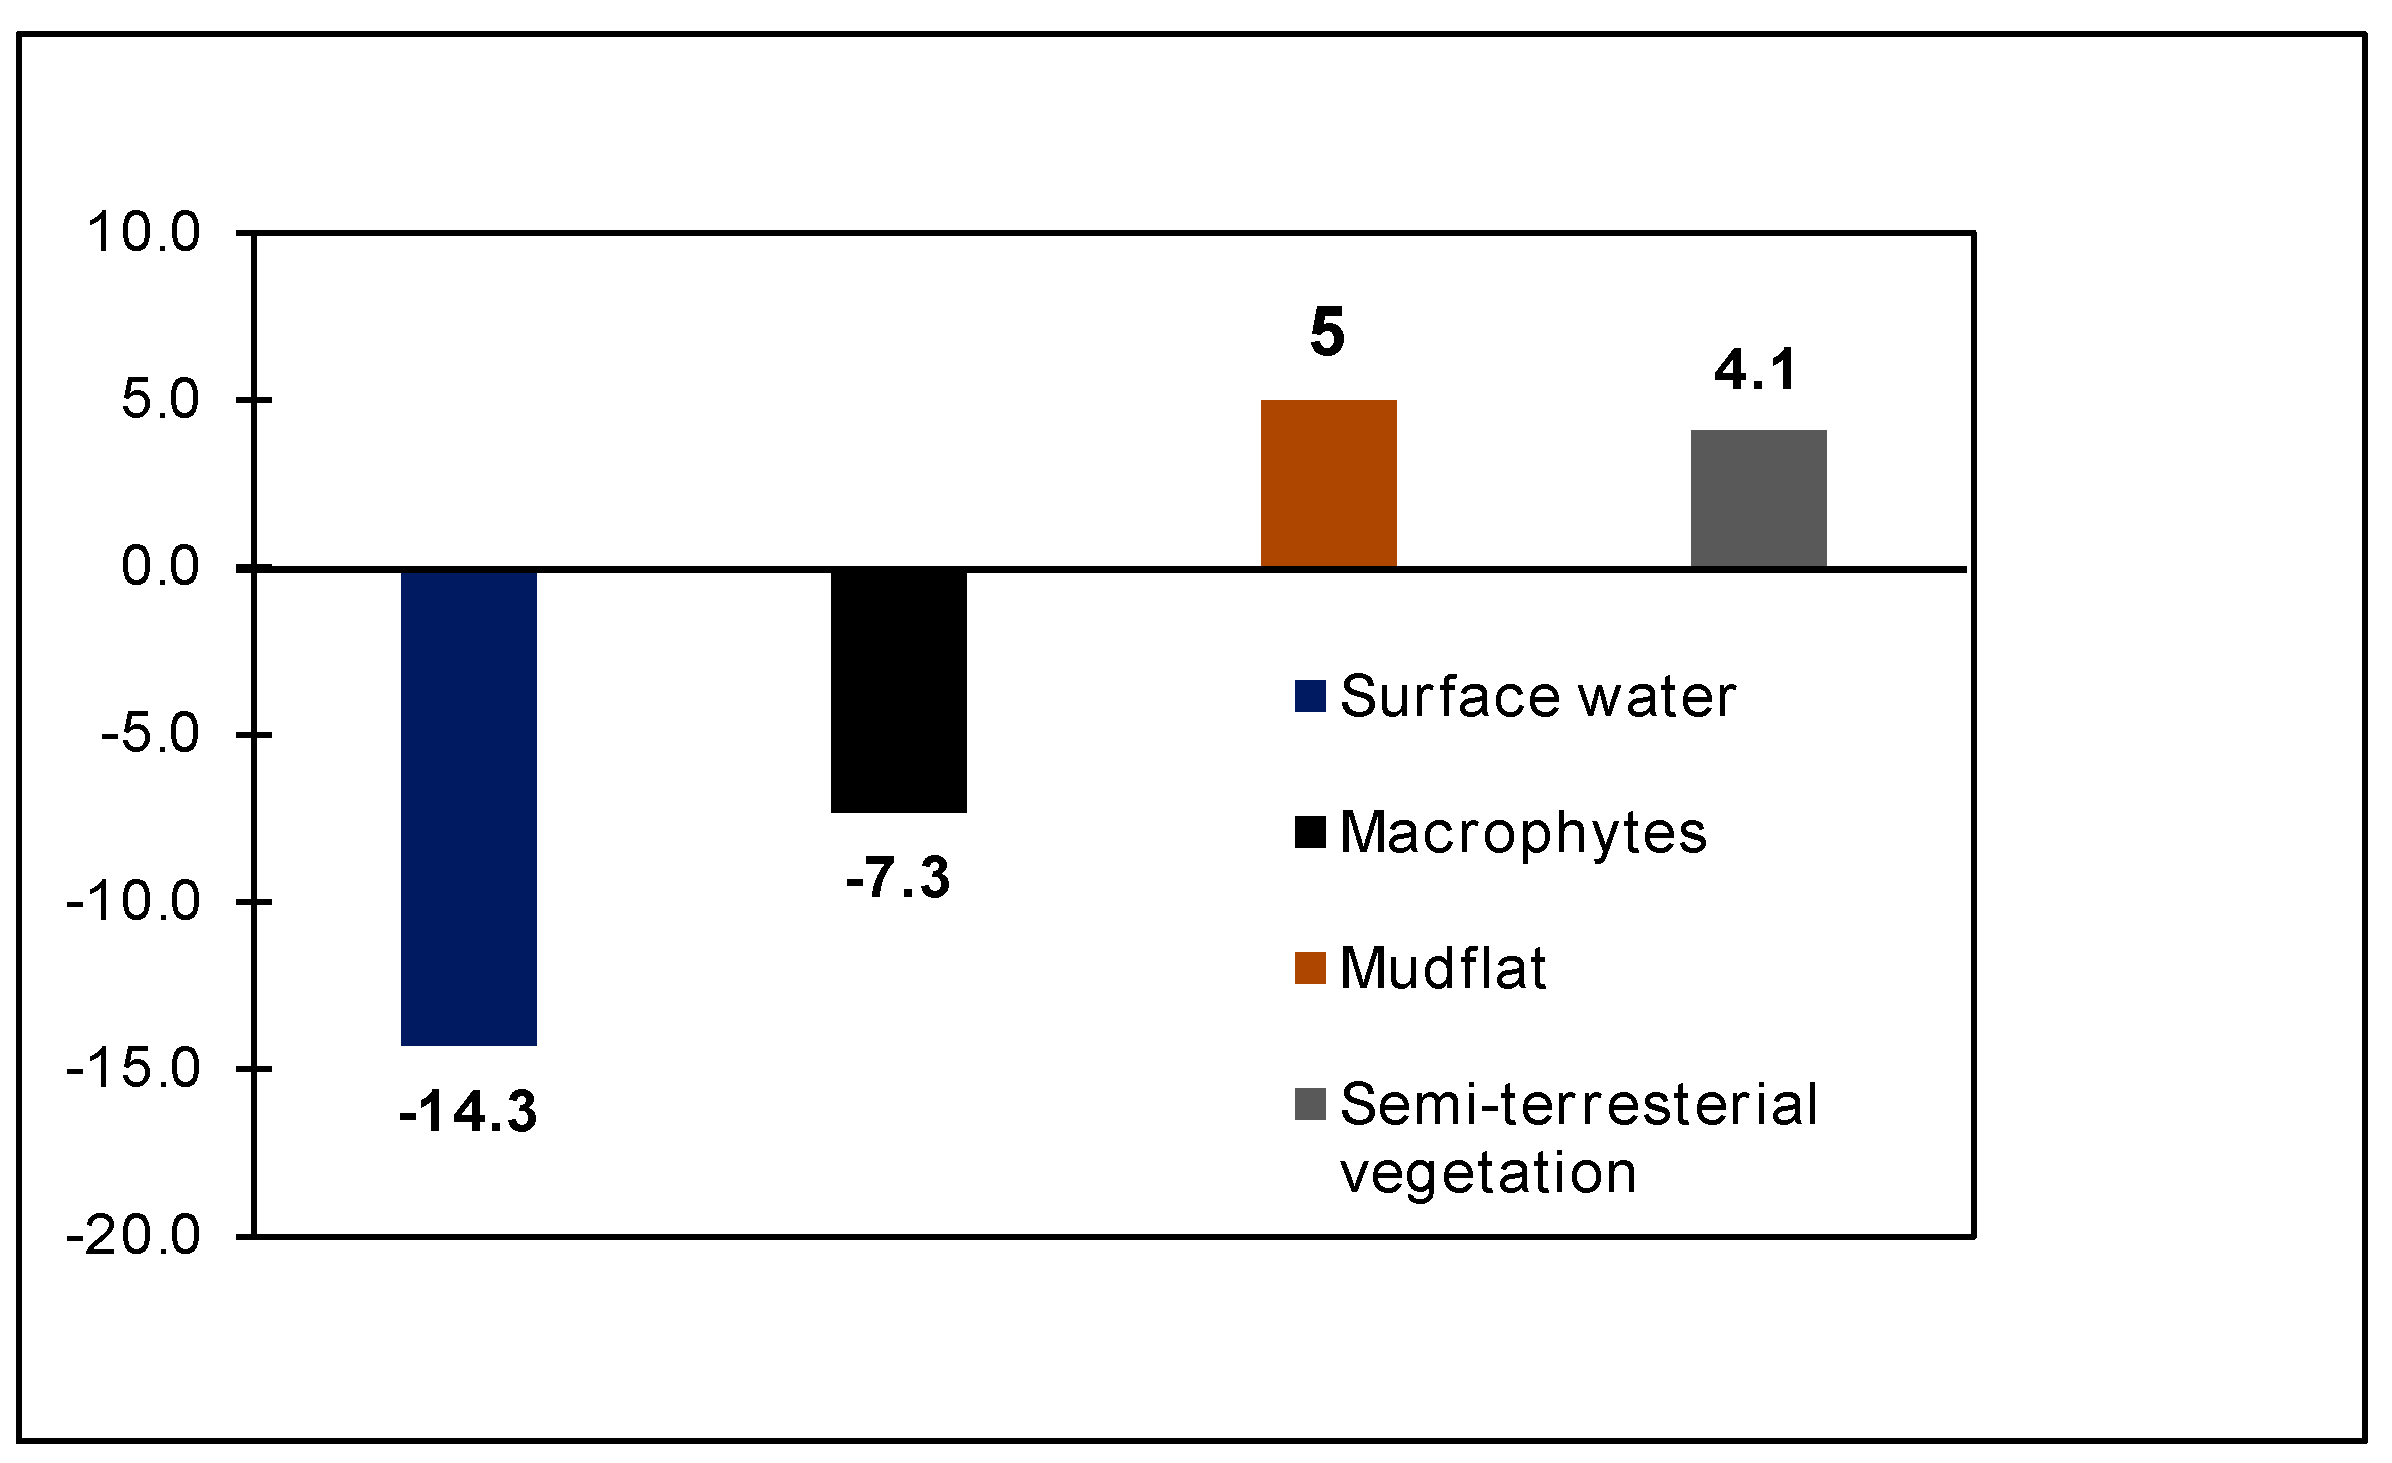
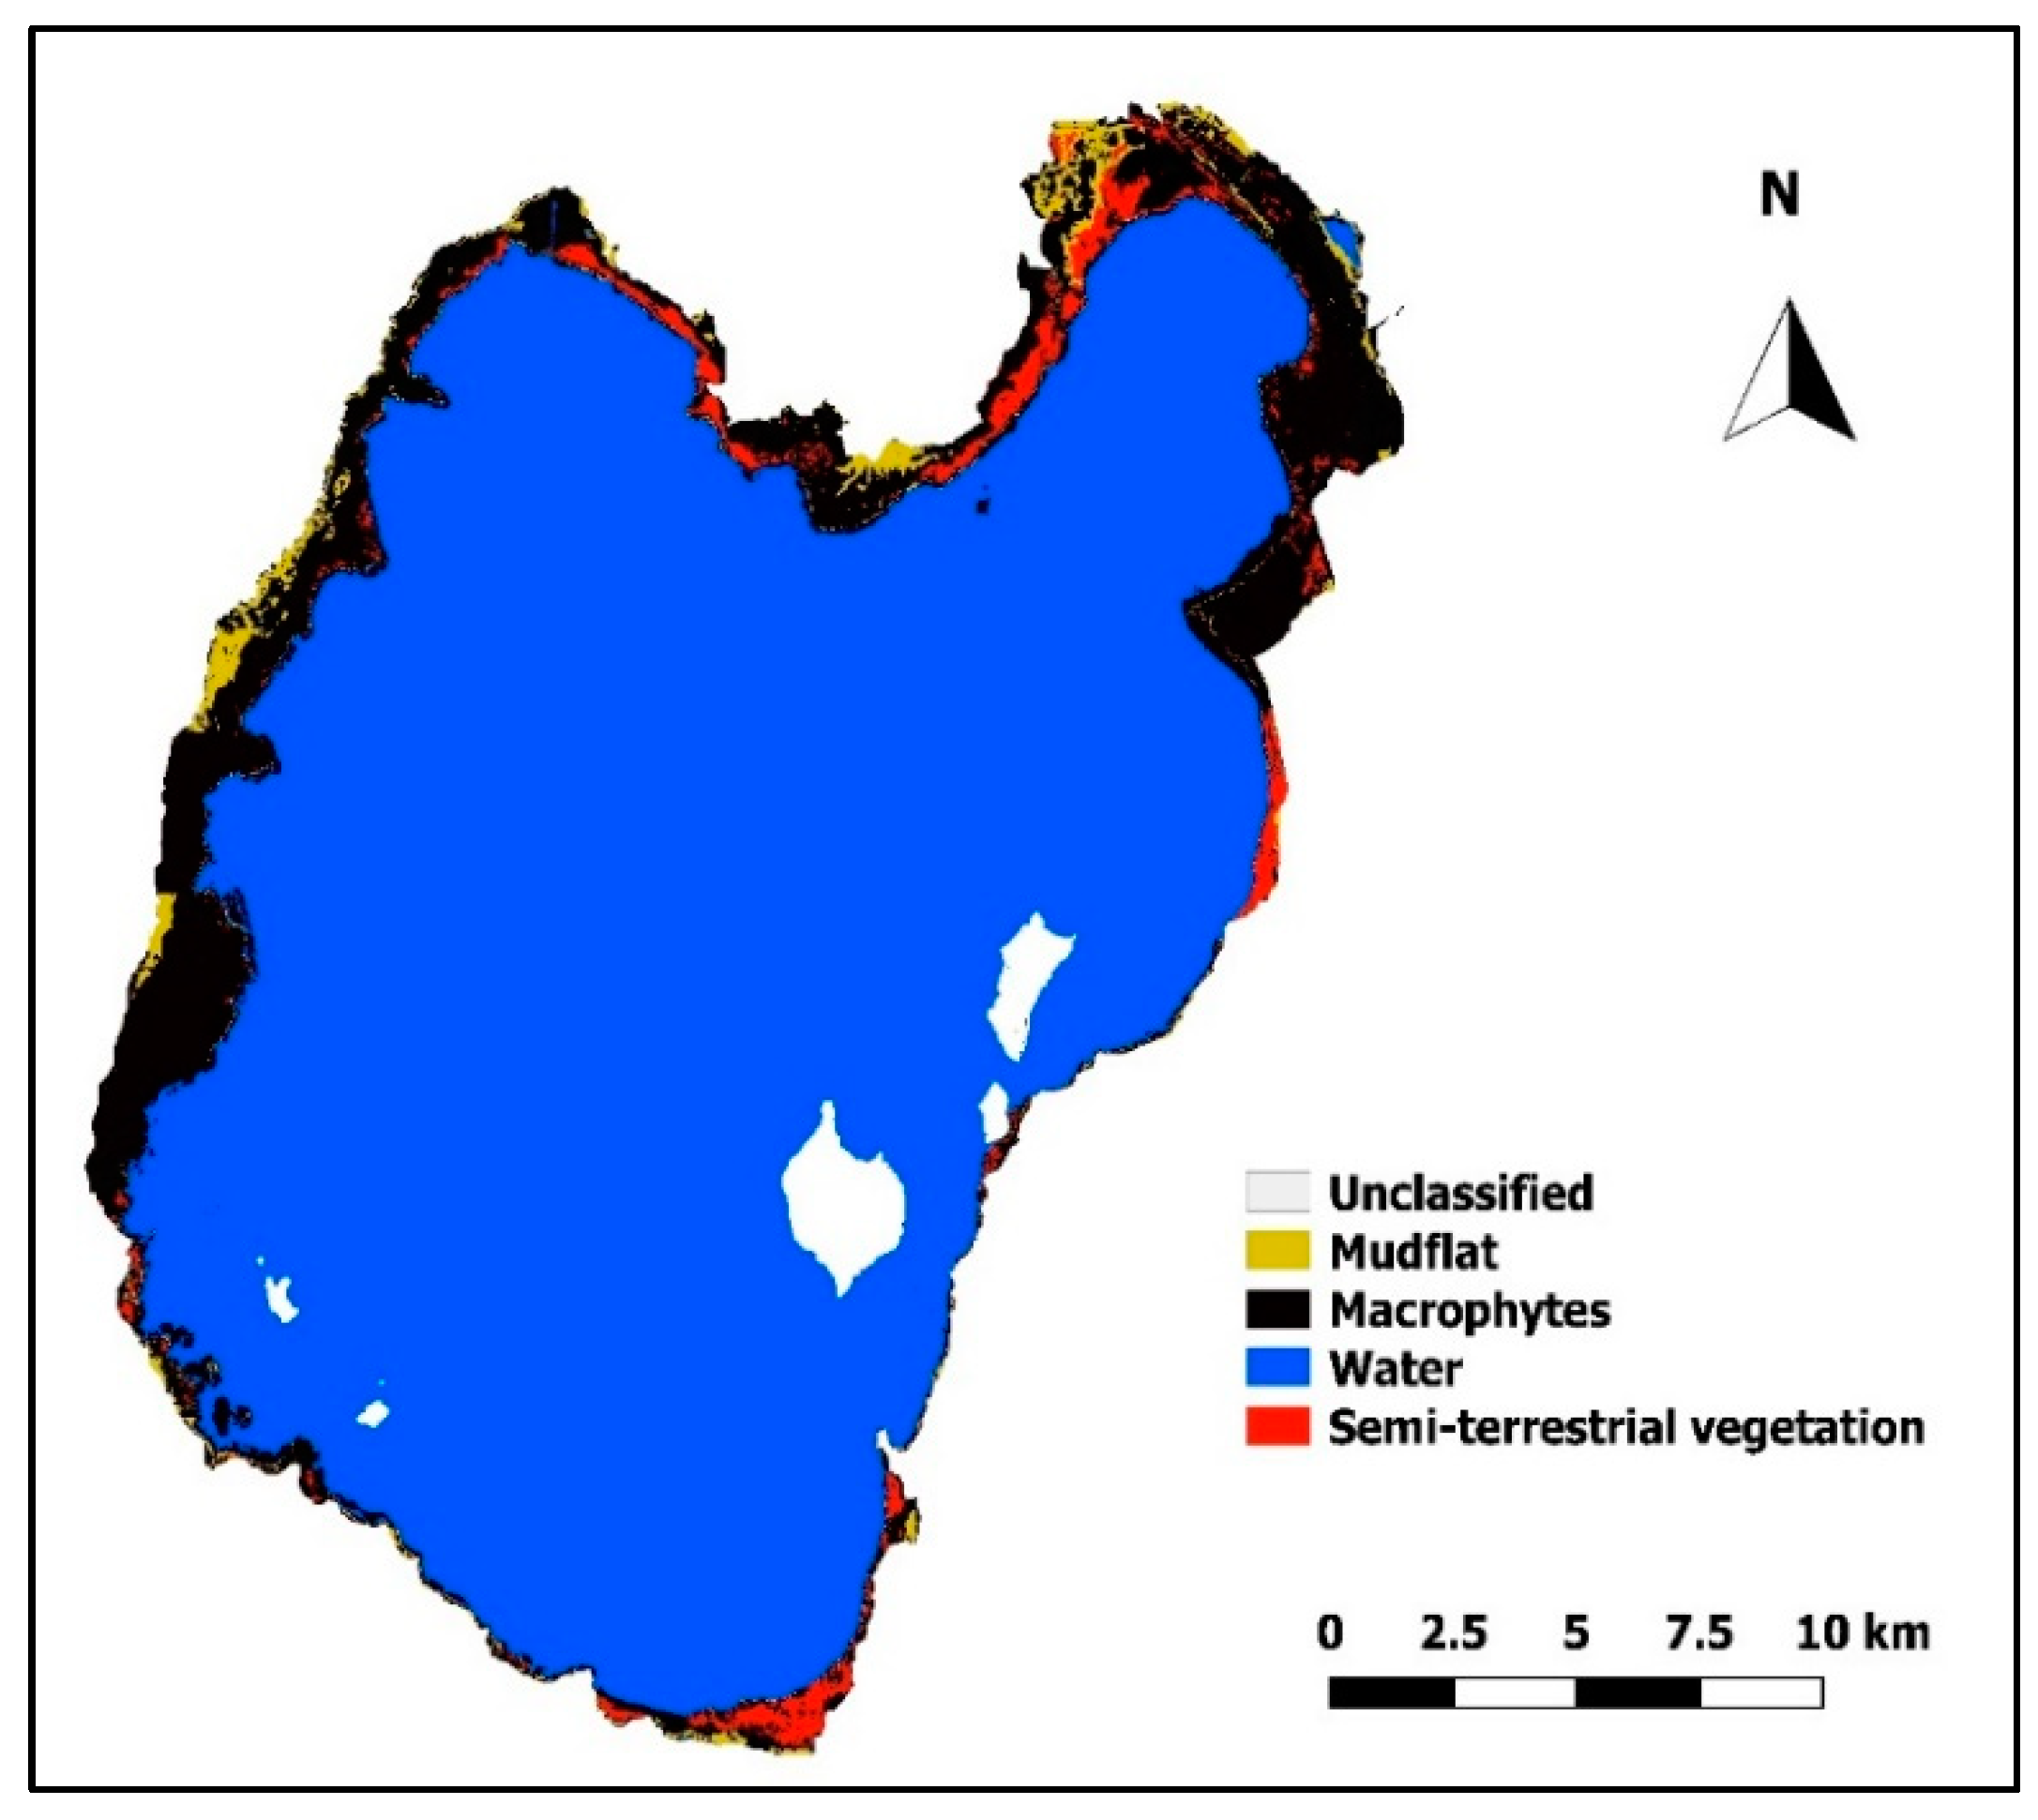
The maximum reduction of the surface water area of the lake was observed between 1994 and 2014. During this period the lake surface water area decreased by 18 km2. The overall surface water area change from 1986 to 2016 was 14.3 km2 (3.3%) (Figure 7). A decreasing trend was also observed in macrophyte distribution (Figure 6b). The total area reduced from 67.4 km2 in 1986 to 60.1 km2 in 2016 (Figure 7). On the contrary, semi-terrestrial vegetation and mudflat showed an overall increasing trend between 1986 and 2016 (Figure 6c). The mudflat increased from 2.3 km2 to 7.3 km2 in the specified period, whereas semi-terrestrial vegetation increased from 4.6 km2 to 8.7 km2 in the same period (Figure 7). The current distribution of the four major target classes (NDAVI based) generated using Landsat OLI image from October 2016 is presented in Figure 8.
3.5. Effect of Hydro-Meteorological Parameters on Macrophytes Distribution
We investigated the effect of different hydro-meteorological parameters on the macrophyte distribution area and NDAVI values of macrophyte vegetation. Spearman correlation showed a positive significant correlation between the macrophyte distribution area and the surface water area (r = 0.736, p = 0.014, n= 16). A similar significant positive correlation was observed between NDAVI values and the surface water area (r = 0.518, p = 0.017, n = 16). The average July-September rainfall also showed a significant positive correlation with macrophyte distribution area (r = 0.621, p = 0.031, n = 12) and NDAVI (r = 0.536, p = 0.042, n = 12). A non-significant positive correlation (r = 0.354, p = 0.443, n = 12) was observed between the surface water area and the average July-September rainfall. There was little or no correlation between selected hydro-meteorological parameters with macrophyte distribution area and/or NDAVI values (Table S3).
4. Discussion
4.1. Mapping Distribution of Macrophytes Using Remote Sensing
The use of remote sensing in combination with field survey is a useful approach to monitor aquatic ecosystems periodically. In this study, we used Landsat 8 OLI images to map the distribution of macrophytes in a tropical lake, Lake Ziway and achieved an overall classification accuracy of 79.6% (NDAVI based) and 72.5% (NDVI based). The high spectral similarity and a short ecotone between macrophyte communities make it difficult to achieve a higher accuracy using medium resolution images [37]. In addition, the intermingled presence of Mudflat and water in the field of view reduces the reflectance of macrophyte communities [46]. Suggestions to improve classification accuracy relied on better spatial resolution of images whereas less emphasis was given to changes as a result of a difference in spectral bands and indices [54,73]. The use of spectral bands and indices for classification enhancement was suggested [74,75]. In this study, we have applied supervised classification with classification enhancement using spectral bands and indices (NDVI and NDAVI) which ensured an overall producer’s accuracy better than some of the previous studies [45,50]. We found an acceptable classification accuracy from a moderate resolution image and target classes with a close spectral profile [45,76]. Macrophytes with sparse canopy, especially situated at the edge towards the open water such as Phragmites, had lower reflectance compared to species with luxurious canopy. In such cases, the use of spectral bands such as the blue band in Landsat 8 OLI, is useful to discriminate mudflat and water from vegetation, better than red band [73]. Thus, NDAVI performed better than NDVI in delineating sparse canopy vegetation with high water and mudflat background. Moreover, the classification enhancement based on reference data, spectral bands and indices helped to reclassify wrongly assigned pixels and minimized the confusion between target classes.
4.2. Macrophyte Distribution Was Associated with Rainfall and Surface Water Area
Eco-hydrological factors that influence the distribution of macrophytes include seasonal periodicity in rainfall, the extent of inundation and moisture gradient [18,27,77]. In Lake Ziway, the macrophyte distribution area and NDAVI exhibited a positive association with both the average July to September rainfall and lake surface water area. Most aquatic vegetation has a persistent seed bank, which can stay for more than a year and can show seed dormancy during dry seasons [11,15]. One of the main factors that determines the extent of germination pattern after extended seed dormancy is rainfall [78]. The extent of rainfall influences the emergence of seedlings from seeds in the sediment. These scenarios are noticeable in seasonally flooded wetlands in arid and semi-arid regions [11,25,79].
The water depth of inundated areas related to rainfall intensity also determines macrophyte distribution. The rainfall between July and September inundated seasonally receded shorelines and increased the water depth in the study site [59] and provides a favorable condition for floating and floating-leaved and rooted macrophytes. Moreover, macrophytes such as Schoenoplectus and Cyperus articulatus show maximum standing crops in highly inundated regions [26,77,80]. A wider inundated area with high standing crop and shoot densities will see a rise in percentage vegetative ground cover and result in a higher reflectance in the near-infrared region, and higher NDAVI [43,81]. Therefore, the change in NDAVI showed the variation in the extent of newly emerged healthy macrophytes at the landward edge following the rainy season. The lag between peak of vegetation spectral indices and cumulative rainfall was also evident as discussed in previous studies [43,82,83].
4.3. Anthropogenic Disturbances and Climate Variability Affected Lake Ziway’s Water Level
Long term water level fluctuations are due mainly to climatic conditions or a sustained anthropogenic disturbance [60,84,85]. In our study, the long-term water level of Lake Ziway showed a decreasing trend, similar to that of neighboring Ethiopian rift lakes, in the past three decades [86,87,88]. The change in water level of the lake was minimal until the beginning of the 21st century and has shown an abrupt regime shift since 2003. Although the long-term annual rainfall of the watershed did not show a monotonic decreasing trend, the extreme drought which occurred in 2002 and 2003 [89], and the June to September seasonal rainfall variability in the watershed [88,90], could attribute for the observed change. Moreover, before the 1980s the water balance for Lake Ziway was between river flows, evaporation and rainfall [59,88]. However, water abstraction and supplying rivers diversion for irrigation has become an additional factor since the 1980s. Although, the annual water abstraction was only around 28 × 106 m3 until 1998, the introduction of large scale floriculture and horticulture farms in the catchment increased the volume of water withdrawn from the lake [59,86]. The floriculture industry which occupied less than 50 hectares before 2003 increased to 2000 hectare in 2006 and reached 3000 hectares in 2015 [91]. The majority of these farms were located in the Ethiopian rift valley and more than 50 farms were pumping water from Lake Ziway and doubled the amount of water abstraction [92,93]. Diversion of the feeder Meki and Katar rivers for irrigation also affected the water balance [94]. A similar scenario was observed in Lake Naivasha after the introduction of floriculture [60]. According to [85,95] a change from a smooth and gradual to a drastic regime shift may result from large external factors such as water abstraction and flood gate regulation. Thus, the abrupt change in mean water level observed at Lake Ziway in 2003 could be a result of the extreme drought that occurred in the region and of an extensive water abstraction and river diversion.
4.4. Anthropogenic Disturbances and Water Level Fluctuations Caused Land Cover Change
A shift in water level of shallow lakes disrupts ecosystem functioning and causes a change between clear and turbid stable states which in turn alter the distribution of macrophytes’ growth form and diversity [15,24,42]. This is mostly observed in littoral habitats which can be easily affected by moderate water level fluctuations [17,96]. In Lake Ziway, a decreasing trend in macrophyte distribution was considerably associated with a decline in the surface water area, whereas the semi terrestrial vegetation and the mudflat distribution increased over the last 30 years. A shift in water level causes a shoreline recession and a shift of the distribution of macrophytes towards the open water [21]. As the water level drops, changes occur in the distribution and diversity of shoreline macrophytes. If a decline in the water level of a lake is continuous with slow recovery and refill time, native macrophytes may be replaced by invasive aquatic and semi terrestrial species [36,85,97]. Our study showed a decline in the surface water area and in macrophyte distribution. In contrast, the distribution of Aeschynomene elaphroxylon, a semi-terrestrial form of vegetation, expanded around the lake. The species was observed only in some parts of the lake prior to the early 2000s [16].
A similar change in the distribution of Aeschynomene elaphroxylon was observed in Lake Chad [96]. Aeschynomene elaphroxylon grows after native emergent macrophytes receded from the shoreline as a result of an extended decline in water level [96,97]. The higher dominance of tolerant emergent macrophytes and the low species diversity at Lake Ziway also indicated the impact of water level change [16,31]. A decline in water level coupled with the dominance of emergent macrophytes and advancement of the littoral zone indicates an ongoing ecological succession towards a marsh [21,97,98]. Mudflats increase at the outer fringe (landward) and not towards the inner fringe (lakeside). The recession of the water and increased mudflat area enhanced shoreline encroachment for agriculture. This was reflected in the digitized total area at the maximum inundation shoreline which was encroached upon by agricultural land.
5. Conclusions
Our study showed the use of remote sensing imagery with field data to explore the ongoing and long-term spatio-temporal changes in Lake Ziway. The overall moderate classification accuracy obtained from a moderate resolution image and target classes with a close spectral profile were deemed acceptable. Therefore, the results obtained in this study indicated the potential of freely available medium resolution Landsat and similar satellite images to monitor the spatio-temporal changes of tropical great lakes in a reproducible and continuous manner. The findings also showed a decline in long-term water level of the lake and distribution of macrophytes. Despite the absence of a long-term monotonic decreasing trend in annual rainfall, a regime shift in water level of the lake corresponded to two consecutive years of severe drought in the region. Moreover, the long-term change in water level and macrophyte distribution in Lake Ziway was also associated with strong anthropogenic disturbances. The beginning of extensive water abstraction and river diversion for large scale floriculture and irrigation farms was observed in the same period with a decline in lake water level. Thus, the ongoing climate change in the region coupled with strong anthropogenic disturbances may explain the observed progressive water level and macrophytes change. Macrophyte distribution has also been associated with water level and hydro-meteorological factors. As a result, there was a continuous ecological succession along the shores of the lake because of water level fluctuation. A decline in macrophyte distribution resulted in the extension of semi-terrestrial vegetation, land cover change and encroachment of mudflats by agriculture. A comprehensive analysis of the water balance and aquatic vegetation in future research can reveal the full extent of the current change.
Supplementary Materials
The following are available online at https://www.mdpi.com/2073-4441/13/4/396/s1, Figure S1: Collected Ground truthing points on Lake Ziway and the surrounding, Figure S2: Unsupervised classification map of Lake Ziway, Table S1: Details and specifications of satellite images used in this study, Table S2: Confusion matrix of NDAVI based and NDVI based classification for eight target classes from Lake Ziway and the surrounding. The number of correctly classified pixels are indicated in Bold. The values in the parentheses are the Kappa coefficients Table S3: Spearman correlation between selected Hydro meteorological parameters with average NDAVI values, macrophytes distribution area and surface water area.
Author Contributions
Conceptualization, Y.T.D., L.T. and A.A.; Data curation Y.T.D., A.A.; methodology, validation, Formal analysis, Y.T.D.; Funding acquisition, L.T.; Investigation, Y.T.D.; Methodology, Y.T.D., L.T. and A.A.; Resources, L.T. and A.A.; Supervision, L.T., A.A., and B.V.; Writing—original draft preparation, Y.T.D.; Writing—review and editing, Y.T.D. and L.T.; All authors have read and agreed to the published version of the manuscript.
Funding
A financial support for the field work (BAS 42) was provided by Plant Biology and Nature Management laboratory (APNA) of Vrije Universiteit Brussels.
Institutional Review Board Statement
Not Applicable.
Informed Consent Statement
Not Applicable.
Data Availability Statement
The satellite imageries are available on United States Geological Survey (USGS) website (https://earthexplorer.usgs.gov). Hydro meteorological data can be accessed from Ethiopian National Meteorological Agency and Ethiopian Ministry of Water, Irrigation.
Acknowledgments
Y.T.D. would like to thank Vlaamse Interuniversitaire Raad (VLIR-UOS) for funding his two year Master program study. We gratefully acknowledge Ethiopian National Meteorological Agency and Ethiopian Ministry of Water, Irrigation for the necessary hydro meteorological data.
Conflicts of Interest
The authors declare no conflict of interest.
References
- Zhang, Y.; Jeppesen, E.; Liu, X.; Qin, B.; Shi, K.; Zhou, Y.; Thomaz, S.M.; Deng, J. Global loss of aquatic vegetation in lakes. Earth-Sci. Rev. 2017, 173, 259–265. [Google Scholar] [CrossRef]
- Jeppesen, E.; Søndergaard, M.; Liu, Z. Lake Restoration and Management in a Climate Change Perspective: An Introduction. Water 2017, 9, 122. [Google Scholar] [CrossRef] [Green Version]
- Sand-Jensen, K.; Riis, T.; Vestergaard, O.; Larsen, S.E. Macrophyte decline in Danish lakes and streams over the past 100 years. J. Ecol. 2000, 88, 1030–1040. [Google Scholar] [CrossRef]
- Franklin, P.; Dunbar, M.; Whitehead, P. Flow controls on lowland river macrophytes: A review. Sci. Total Environ. 2008, 400, 369–378. [Google Scholar] [CrossRef]
- La Toya, T.K.; Jacob, D.L.; Hanson, M.A.; Herwig, B.R.; Bowe, S.E.; Otte, M.L. Macrophytes in shallow lakes: Relationships with water, sediment and watershed characteristics. Aquat. Bot. 2013, 109, 39–48. [Google Scholar]
- Akasaka, M.; Takamura, N.; Mitsuhashi, H.; Kadono, Y. Effects of land use on aquatic macrophyte diversity and water quality of ponds. Freshwat. Biol. 2010, 55, 909–922. [Google Scholar] [CrossRef]
- Lawniczak-Malińska, A.E.; Achtenberg, K. Indicator values of emergent vegetation in overgrowing lakes in relation to water and sediment chemistry. Water 2018, 10, 498. [Google Scholar] [CrossRef] [Green Version]
- Seddon, B. Aquatic macrophytes as limnological indicators. Freshwat. Biol. 1972, 2, 107–130. [Google Scholar] [CrossRef]
- Junk, W.; Howard-Williams, C. Ecology of aquatic macrophytes in Amazonia. In The Amazon; Springer: Berlin, Germany, 1984; pp. 269–293. [Google Scholar]
- Alahuhta, J.; Kanninen, A.; Vuori, K.-M. Response of macrophyte communities and status metrics to natural gradients and land use in boreal lakes. Aquat. Bot. 2012, 103, 106–114. [Google Scholar] [CrossRef]
- Chappuis, E.; Gacia, E.; Ballesteros, E. Environmental factors explaining the distribution and diversity of vascular aquatic macrophytes in a highly heterogeneous Mediterranean region. Aquat. Bot. 2014, 113, 72–82. [Google Scholar] [CrossRef]
- Chambers, P.; Lacoul, P.; Murphy, K.; Thomaz, S. Global diversity of aquatic macrophytes in freshwater. In Freshwater Animal Diversity Assessment; Springer: Berlin, Germany, 2007; pp. 9–26. [Google Scholar]
- Thomaz, S.; Esteves, F.; Murphy, K.; Dos Santos, A.; Caliman, A.; Guariento, R. Aquatic macrophytes in the tropics: Ecology of populations and communities, impacts of invasions and human use. Trop. Biol. Conserv. Manag. 2009, 4, 27–60. [Google Scholar]
- Engelhardt, K.A.; Ritchie, M.E. Effects of macrophyte species richness on wetland ecosystem functioning and services. Nature 2001, 411, 687–689. [Google Scholar] [CrossRef] [PubMed]
- Van Geest, G.; Coops, H.; Roijackers, R.; Buijse, A.; Scheffer, M. Succession of aquatic vegetation driven by reduced water-level fluctuations in floodplain lakes. J. Appl. Ecol. 2005, 42, 251–260. [Google Scholar] [CrossRef]
- Tamire, G.; Mengistou, S. Macrophyte species composition, distribution and diversity in relation to some physicochemical factors in the littoral zone of Lake Ziway, Ethiopia. Afr. J. Ecol. 2013, 51, 66–77. [Google Scholar] [CrossRef]
- Zhu, J.; Deng, J.; Zhang, Y.; Peng, Z.; Hu, W. Response of Submerged Aquatic Vegetation to Water Depth in a Large Shallow Lake after an Extreme Rainfall Event. Water 2019, 11, 2412. [Google Scholar] [CrossRef] [Green Version]
- Tan, W.; Xing, J.; Yang, S.; Yu, G.; Sun, P.; Jiang, Y. Long Term Aquatic Vegetation Dynamics in Longgan Lake Using Landsat Time Series and Their Responses to Water Level Fluctuation. Water 2020, 12, 2178. [Google Scholar] [CrossRef]
- Lawniczak, A.; Zbierska, J.; Choiński, A.; Szczepaniak, W. Response of emergent macrophytes to hydrological changes in a shallow lake, with special reference to nutrient cycling. Hydrobiologia 2010, 656, 243–254. [Google Scholar] [CrossRef] [Green Version]
- Triest, L.; Sierens, T.; Terer, T. Diversity and fine-scale spatial genetic structure of Cyperus papyrus populations in Lake Naivasha (Kenya) using microsatellite markers. Hydrobiologia 2014, 737, 131–144. [Google Scholar] [CrossRef]
- Carmignani, J.R.; Roy, A.H. Ecological impacts of winter water level drawdowns on lake littoral zones: A review. Aquat. Sci. 2017, 79, 803–824. [Google Scholar] [CrossRef] [Green Version]
- Dolinar, N.; Regvar, M.; Abram, D.; Gaberščik, A. Water-level fluctuations as a driver of Phragmites australis primary productivity, litter decomposition, and fungal root colonisation in an intermittent wetland. Hydrobiologia 2016, 774, 69–80. [Google Scholar] [CrossRef]
- Zhang, X.; Wan, A.; Wang, H.; Zhu, L.; Yin, J.; Liu, Z.; Yu, D. The overgrowth of Zizania latifolia in a subtropical floodplain lake: Changes in its distribution and possible water level control measures. Ecol. Eng. 2016, 89, 114–120. [Google Scholar] [CrossRef]
- Luo, F.-L.; Jiang, X.-X.; Li, H.-L.; Yu, F.-H. Does hydrological fluctuation alter impacts of species richness on biomass in wetland plant communities? J Plant Ecol 2016, 9, 434–441. [Google Scholar] [CrossRef]
- Bezabih, B.; Mosissa, T. Review on distribution, importance, threats and consequences of wetland degradation in Ethiopia. Int. J. Water Res. Environ. Eng. 2017, 9, 64–71. [Google Scholar]
- Harvey, R.M.; Pickett, J.R.; Bates, R.D. Environmental factors controlling the growth and distribution of submersed aquatic macrophytes in two South Carolina reservoirs. Lake Reserv. Manag. 1987, 3, 243–255. [Google Scholar] [CrossRef] [Green Version]
- Kitamura, K.; Kakishima, S.; Uehara, T.; Morita, S.; Tainaka, K.-I.; Yoshimura, J. The Effects of Rainfall on the Population Dynamics of an Endangered Aquatic Plant, Schoenoplectus gemmifer (Cyperaceae). PLoS ONE 2016, 11, e0157773. [Google Scholar] [CrossRef] [PubMed]
- Zhang, Y.; Liu, X.; Qin, B.; Shi, K.; Deng, J.; Zhou, Y. Aquatic vegetation in response to increased eutrophication and degraded light climate in Eastern Lake Taihu: Implications for lake ecological restoration. Sci. Rep. 2016, 6, 1–12. [Google Scholar] [CrossRef]
- Jakubauskas, M.E.; Peterson, D.L.; Campbell, S.W.; deNoyelles, F., Jr.; Campbell, S.D.; Penny, D. Mapping and monitoring invasive aquatic plant obstructions in navigable waterways using satellite multispectral imagery. In Proceedings of the ISPRS Commission I Mid-term Symposium in Conjunction with Pecora 15/Land Satellite Information Conference on Integrated Remote sensing at the Global, Regional and Local Scale, Denver, CO, USA, 10–15 November 2002; pp. 105–114. [Google Scholar]
- Hunter, P.; Gilvear, D.; Tyler, A.; Willby, N.; Kelly, A. Mapping macrophytic vegetation in shallow lakes using the Compact Airborne Spectrographic Imager (CASI). Aquat. Conserv. Mar. Freshw. Ecosyst. 2010, 20, 717–727. [Google Scholar] [CrossRef]
- Burlakoti, C.; Karmacharya, S.B. Quantitative analysis of macrophytes of Beeshazar Tal, Chitwan, Nepal. H. J. Sci. 2004, 2, 37–41. [Google Scholar] [CrossRef]
- Penning, W.E.; Dudley, B.; Mjelde, M.; Hellsten, S.; Hanganu, J.; Kolada, A.; van den Berg, M.; Poikane, S.; Phillips, G.; Willby, N. Using aquatic macrophyte community indices to define the ecological status of European lakes. Aquat. Ecol. 2008, 42, 253–264. [Google Scholar] [CrossRef]
- Vis, C.; Hudon, C.; Carignan, R. An evaluation of approaches used to determine the distribution and biomass of emergent and submerged aquatic macrophytes over large spatial scales. Aquat. Bot. 2003, 77, 187–201. [Google Scholar] [CrossRef]
- Zhao, D.; Jiang, H.; Yang, T.; Cai, Y.; Xu, D.; An, S. Remote sensing of aquatic vegetation distribution in Taihu Lake using an improved classification tree with modified thresholds. J. Environ. Manag. 2012, 95, 98–107. [Google Scholar] [CrossRef] [PubMed]
- García-Girón, J.; Fernández-Aláez, C.; Fernández-Aláez, M.; Alahuhta, J. Untangling the assembly of macrophyte metacommunities by means of taxonomic, functional and phylogenetic beta diversity patterns. Sci. Total Environ. 2019, 693, 133616. [Google Scholar] [CrossRef] [PubMed]
- Lindholm, M.; Alahuhta, J.; Heino, J.; Hjort, J.; Toivonen, H. Changes in the functional features of macrophyte communities and driving factors across a 70-year period. Hydrobiologia 2020, 847, 3811–3827. [Google Scholar] [CrossRef] [Green Version]
- Birk, S.; Ecke, F. The potential of remote sensing in ecological status assessment of coloured lakes using aquatic plants. Ecol. Indic. 2014, 46, 398–406. [Google Scholar] [CrossRef]
- Beck, M.W.; Hatch, L.K.; Vondracek, B.; Valley, R.D. Development of a macrophyte-based index of biotic integrity for Minnesota lakes. Ecol. Indic. 2010, 10, 968–979. [Google Scholar] [CrossRef] [Green Version]
- Valta-Hulkkonen, K.; Kanninen, A.; Pellikka, P. Remote sensing and GIS for detecting changes in the aquatic vegetation of a rehabilitated lake. Int. J. Remote Sens. 2004, 25, 5745–5758. [Google Scholar] [CrossRef]
- Silva, T.S.; Costa, M.P.; Melack, J.M.; Novo, E.M. Remote sensing of aquatic vegetation: Theory and applications. Environ. Monit. Assess. 2008, 140, 131–145. [Google Scholar] [CrossRef]
- Albright, T.P.; Ode, D.J. Monitoring the dynamics of an invasive emergent macrophyte community using operational remote sensing data. Hydrobiologia 2011, 661, 469–474. [Google Scholar] [CrossRef]
- Jiang, H.; Zhao, D.; Cai, Y.; An, S. A method for application of classification tree models to map aquatic vegetation using remotely sensed images from different sensors and dates. Sensors 2012, 12, 12437–12454. [Google Scholar] [CrossRef] [Green Version]
- Prabhakara, K.; Hively, W.D.; McCarty, G.W. Evaluating the relationship between biomass, percent groundcover and remote sensing indices across six winter cover crop fields in Maryland, United States. Int. J. Appl. Earth Obs. Geoinf. 2015, 39, 88–102. [Google Scholar] [CrossRef] [Green Version]
- Jakubauskas, M.; Kindscher, K.; Fraser, A.; Debinski, D.; Price, K. Close-range remote sensing of aquatic macrophyte vegetation cover. Int. J. Remote Sens. 2000, 21, 3533–3538. [Google Scholar] [CrossRef] [Green Version]
- Rivera, S.; Landom, K.; Crowl, T. Monitoring macrophytes cover and taxa in Utah Lake by using 2009–2011 Landsat digital imagery. Rev. De Teledetección 2013, 39, 106–115. [Google Scholar]
- Villa, P.; Bresciani, M.; Bolpagni, R.; Pinardi, M.; Giardino, C. A rule-based approach for mapping macrophyte communities using multi-temporal aquatic vegetation indices. Remote Sens. Environ. 2015, 171, 218–233. [Google Scholar] [CrossRef] [Green Version]
- Yu, W.; Zhou, W.; Qian, Y.; Yan, J. A new approach for land cover classification and change analysis: Integrating backdating and an object-based method. Remote Sens. Environ. 2016, 177, 37–47. [Google Scholar] [CrossRef]
- Ashraf, M.; Nawaz, R. A comparison of change detection analyses using different band algebras for baraila wetland with Nasa’s multi-temporal Landsat dataset. Int. J. Geogr. Inf. Syst. 2015, 7, 1. [Google Scholar] [CrossRef] [Green Version]
- Husson, E.; Hagner, O.; Ecke, F. Unmanned aircraft systems help to map aquatic vegetation. Appl. Veg. Sci. 2014, 17, 567–577. [Google Scholar] [CrossRef]
- Wang, L.; Dronova, I.; Gong, P.; Yang, W.; Li, Y.; Liu, Q. A new time series vegetation–water index of phenological–hydrological trait across species and functional types for Poyang Lake wetland ecosystem. Remote Sens. Environ. 2012, 125, 49–63. [Google Scholar] [CrossRef]
- Villa, P.; Bresciani, M.; Braga, F.; Bolpagni, R. Comparative assessment of broadband vegetation indices over aquatic vegetation. IEEE J. Sel. Top. Appl. 2014, 7, 3117–3127. [Google Scholar] [CrossRef]
- McFeeters, S.K. The use of the Normalized Difference Water Index (NDWI) in the delineation of open water features. Int. J. Remote Sens. 1996, 17, 1425–1432. [Google Scholar] [CrossRef]
- Ouma, Y.O.; Tateishi, R. A water index for rapid mapping of shoreline changes of five East African Rift Valley lakes: An empirical analysis using Landsat TM and ETM+ data. Int. J. Remote Sens. 2006, 27, 3153–3181. [Google Scholar] [CrossRef]
- Ji, L.; Geng, X.; Sun, K.; Zhao, Y.; Gong, P. Target detection method for water mapping using Landsat 8 OLI/TIRS imagery. Water 2015, 7, 794–817. [Google Scholar] [CrossRef] [Green Version]
- Sisay, A. Remote sensing based water surface extraction and change detection in the central rift valley region of ethiopia. Am. J. Geogr. Inf. Syst. 2016, 5, 33–39. [Google Scholar]
- Hui, F.; Xu, B.; Huang, H.; Yu, Q.; Gong, P. Modelling spatial-temporal change of Poyang Lake using multitemporal Landsat imagery. Int. J. Remote Sens. 2008, 29, 5767–5784. [Google Scholar] [CrossRef]
- Zhang, H.-w.; Huai-Liang, C. The Application of Modified Normalized Difference Water Index by Leaf Area Index in the Retrieval of Regional Drought Monitoring. In Proceedings of the 2016 International Conference on Service Science, Technology and Engineering (SSTE 2016), Suzhou, China, 15–16 May 2016; pp. 396–404. [Google Scholar]
- Alemayehu, T.; Ayenew, T.; Kebede, S. Hydrogeochemical and lake level changes in the Ethiopian Rift. J. Hydrol. 2006, 316, 290–300. [Google Scholar] [CrossRef]
- Ayenew, T.; Legesse, D. The changing face of the Ethiopian rift lakes and their environs: Call of the time. Lakes Reserv. Res. Manag. 2007, 12, 149–165. [Google Scholar] [CrossRef]
- Awange, J.L.; Forootan, E.; Kusche, J.; Kiema, J.; Omondi, P.; Heck, B.; Fleming, K.; Ohanya, S.; Gonçalves, R. Understanding the decline of water storage across the Ramser-Lake Naivasha using satellite-based methods. Adv. Water Resour. 2013, 60, 7–23. [Google Scholar] [CrossRef]
- Lu, X.; Shaoqing, Z. The comparative study of three methods of remote sensing image change detection. In Proceedings of the 17th International Conference on Geoinformatics, Fairfax, VA, USA, 12–14 August 2009; pp. 1–4. [Google Scholar] [CrossRef]
- Bright, T.A.; Getlein, S.; Jarrett, J.; Tripp, S.; Moeller, J. Remote Sensing Users’ Guide, Version 1.0; Army Environmental Center Aberdeen Proving Ground Md Environmental Quality Div: Hampton, VA, USA, 1997. [Google Scholar]
- Congedo, L. Semi-Automatic Classification Plugin Documentation. Available online: https://fromgistors.blogspot.com/p/semi-automatic-classification-plugin.html (accessed on 7 March 2017).
- Chavez, P.S. Image-based atmospheric corrections-revisited and improved. Photogramm. Eng. Remote Sens. 1996, 62, 1025–1035. [Google Scholar]
- Rouse, J.; Haas, R.; Schell, J.; Deering, D. Monitoring vegetation systems in the Great Plains with ERTS. In Third Earth Resources Technology Satellite-1. Dec. Goddard Space Flight Cent. NASA 1974, 351, 309–317. [Google Scholar]
- Xu, H. Modification of normalised difference water index (NDWI) to enhance open water features in remotely sensed imagery. Int. J. Remote Sens. 2006, 27, 3025–3033. [Google Scholar] [CrossRef]
- Bhattacharyya, A. On a measure of divergence between two statistical populations defined by their probability distributions. Bull. Calcutta Math. Soc. 1943, 35, 99–109. [Google Scholar]
- QGIS.org. QGIS Geographic Information System. Open Source Geospatial Foundation. Available online: https://qgis.org/en/site/ (accessed on 22 June 2020).
- Mann, H.B. Nonparametric tests against trend. Econometrica 1945, 13, 245–259. [Google Scholar] [CrossRef]
- Kendall, M.G. A new measure of rank correlation. Biometrika 1938, 30, 81–93. [Google Scholar] [CrossRef]
- Pettitt, A. A non-parametric approach to the change-point problem. J. Roy. Stat. Soc. Ser. C. 1979, 28, 126–135. [Google Scholar] [CrossRef]
- XLSTAT by Addinsoft. XLSTAT VERSION 2017.5. Available online: https://www.xlstat.com/en/news/xlstat-version-2017-5 (accessed on 20 September 2017).
- Barsi, J.A.; Lee, K.; Kvaran, G.; Markham, B.L.; Pedelty, J.A. The spectral response of the Landsat-8 operational land imager. Remote Sens. 2014, 6, 10232–10251. [Google Scholar] [CrossRef] [Green Version]
- Viña, A.; Gitelson, A.A.; Nguy-Robertson, A.L.; Peng, Y. Comparison of different vegetation indices for the remote assessment of green leaf area index of crops. Remote Sens. Environ. 2011, 115, 3468–3478. [Google Scholar] [CrossRef]
- Thomas, R.F.; Kingsford, R.T.; Lu, Y.; Cox, S.J.; Sims, N.C.; Hunter, S.J. Mapping inundation in the heterogeneous floodplain wetlands of the Macquarie Marshes, using Landsat Thematic Mapper. J. Hydrol. 2015, 524, 194–213. [Google Scholar] [CrossRef]
- Congalton, R.G.; Green, K. Assessing the Accuracy of Remotely Sensed Data: Principles and Practices; CRC Press: Boca Raton, FL, USA, 2019. [Google Scholar]
- Fortney, R.H.; Benedict, M.; Gottgens, J.F.; Walters, T.L.; Leady, B.S.; Rentch, J. Aquatic plant community composition and distribution along an inundation gradient at two ecologically-distinct sites in the Pantanal region of Brazil. Wetl. Ecol. Manag. 2004, 12, 575–585. [Google Scholar] [CrossRef]
- Cross, A.T.; Turner, S.R.; Renton, M.; Baskin, J.M.; Dixon, K.W.; Merritt, D.J. Seed dormancy and persistent sediment seed banks of ephemeral freshwater rock pools in the Australian monsoon tropics. Ann. Bot. 2015, 115, 847–859. [Google Scholar] [CrossRef] [Green Version]
- Temesgen, H.; Nyssen, J.; Zenebe, A.; Haregeweyn, N.; Kindu, M.; Lemenih, M.; Haile, M. Ecological succession and land use changes in a lake retreat area (Main Ethiopian Rift Valley). J. Arid Environ. 2013, 91, 53–60. [Google Scholar] [CrossRef] [Green Version]
- Hwang, Y.-H.; Fan, C.-W.; Yin, M.-H. Primary production and chemical composition of emergent aquatic macrophytes, Schoenoplectus mucronatus ssp. robustus and Sparganium fallax, in Lake Yuan-Yang, Taiwan. Bot. Bull. Acad. Sin. 1996, 37, 265–273. [Google Scholar]
- Ward, D.; Hamilton, S.; Jardine, T.; Pettit, N.; Tews, E.; Olley, J.; Bunn, S. Assessing the seasonal dynamics of inundation, turbidity, and aquatic vegetation in the Australian wet–dry tropics using optical remote sensing. Ecohydrology 2013, 6, 312–323. [Google Scholar] [CrossRef] [Green Version]
- Gitelson, A.A. Wide dynamic range vegetation index for remote quantification of biophysical characteristics of vegetation. J. Plant Physiol. 2004, 161, 165–173. [Google Scholar] [CrossRef] [PubMed] [Green Version]
- Teferi, E.; Uhlenbrook, S.; Bewket, W.; Wenninger, J.; Simane, B. The use of remote sensing to quantify wetland loss in the Choke Mountain range, Upper Blue Nile basin, Ethiopia. Hydrol. Earth Syst. Sc. 2010, 14, 2415–2428. [Google Scholar] [CrossRef] [Green Version]
- Zohary, T.; Ostrovsky, I. Ecological impacts of excessive water level fluctuations in stratified freshwater lakes. Inland Waters 2011, 1, 47–59. [Google Scholar] [CrossRef]
- Fan, Z.; Wang, Z.; Li, Y.; Wang, W.; Tang, C.; Zeng, F. Water Level Fluctuation under the Impact of Lake Regulation and Ecological Implication in Huayang Lakes, China. Water 2020, 12, 702. [Google Scholar] [CrossRef] [Green Version]
- Ayenew, T. Recent changes in the level of Lake Abiyata, central main Ethiopian Rift. Hydrol. Sci. J. 2002, 47, 493–503. [Google Scholar] [CrossRef] [Green Version]
- Bewketu, K.; Ayenew, T. Hydrodynamics of Selected Ethiopian Rift Lakes. Civ. Envi. Res. 2015, 7, 46–60. [Google Scholar]
- Belete, M.D.; Diekkrüger, B.; Roehrig, J. Characterization of water level variability of the main ethiopian rift valley lakes. Hydrology 2016, 3, 1. [Google Scholar] [CrossRef] [Green Version]
- Ayenew, T. Environmental implications of changes in the levels of lakes in the Ethiopian Rift since 1970. Reg. Environ. Chang. 2004, 4, 192–204. [Google Scholar] [CrossRef]
- Cheung, W.H.; Senay, G.B.; Singh, A. Trends and spatial distribution of annual and seasonal rainfall in Ethiopia. Int. J. Climatol. J. R. Meteorol. Soc. 2008, 28, 1723–1734. [Google Scholar] [CrossRef]
- Anadolu Agency Website. Ethiopian Flower Industry is Flourishing. Available online: http://aa.com.tr/en/economy/ethiopian-flower-industry-flourishes (accessed on 4 March 2020).
- Oromia Environmental Protection Office (OEPO). A Review of the Current Status and an Outline of a Future Management Plan for Lakes Abiyata and Ziway; Technical Report; Oromia Environmental Protection Office: Addis Ababa, Ethiopia, 2005. [Google Scholar]
- PAN, U. Flower farming: Ethiopian NGOS work to improve conditions for flower producers. Pestic. News 2008, 82, 4–5. [Google Scholar]
- Deribessa, A. Groundwater and Surface Water Interaction and Geo Environmental Changes in the Ziway Catchment. Master’s Thesis, Addis Ababa University, Addis Ababa, Ethiopia, 2006. [Google Scholar]
- Scheffer, M.; Carpenter, S.; Foley, J.A.; Folke, C.; Walker, B. Catastrophic shifts in ecosystems. Nature 2001, 413, 591–596. [Google Scholar] [CrossRef] [PubMed]
- Lake, P.S. Drought and Aquatic Ecosystems: Effects and Responses; John Wiley & Sons: Hoboken, NJ, USA, 2011. [Google Scholar]
- Johnson, K.G.; Allen, M.S.; Havens, K.E. A review of littoral vegetation, fisheries, and wildlife responses to hydrologic variation at Lake Okeechobee. Wetlands 2007, 27, 110–126. [Google Scholar] [CrossRef]
- Ongore, C.O.; Aura, C.M.; Ogari, Z.; Njiru, J.M.; Nyamweya, C.S. Spatial-temporal dynamics of water hyacinth, Eichhornia crassipes (Mart.) and other macrophytes and their impact on fisheries in Lake Victoria, Kenya. J. Great Lakes Res. 2018, 44, 1273–1280. [Google Scholar] [CrossRef]
Figure 1.
Map of Lake Ziway and the surroundings.

Figure 2.
Target classes separability values (Mean ± SD) obtained from three different vegetation indices over selected Region of Interest for each class.
Figure 2.
Target classes separability values (Mean ± SD) obtained from three different vegetation indices over selected Region of Interest for each class.

Figure 3.
Final classification map using Landsat 8 OLI image from October 2016 based on (a) NDAVI and (b) NDVI.
Figure 3.
Final classification map using Landsat 8 OLI image from October 2016 based on (a) NDAVI and (b) NDVI.

Figure 4.
The producer’s accuracy difference between NDAVI based and NDVI based supervised classification for each target class.
Figure 4.
The producer’s accuracy difference between NDAVI based and NDVI based supervised classification for each target class.

Figure 5.
(a) Long term water level trend and regime shift. The red line represents mean water level before the regime shift and the green line shows mean water level after the regime shift; (b) long term mean annual rainfall in lake Ziway catchment area. The black line shows no monotonic trend in mean annual rainfall.

Figure 6.
Change in area distribution of (a) surface water area (b) macrophytes (c) semi-terrestrial vegetation and mudflat in different periods in and around Lake Ziway.
Figure 6.
Change in area distribution of (a) surface water area (b) macrophytes (c) semi-terrestrial vegetation and mudflat in different periods in and around Lake Ziway.

Figure 7.
Overall change in area distribution of four major target classes between 1986 and 2016 in and around Lake Ziway based on NDAVI and Modified Normalized Difference Water Index (MNDWI) classification.
Figure 7.
Overall change in area distribution of four major target classes between 1986 and 2016 in and around Lake Ziway based on NDAVI and Modified Normalized Difference Water Index (MNDWI) classification.

Figure 8.
Distribution of four major target classes (NDAVI based classification) generated using Landsat 8 OLI image from October 2016.
Figure 8.
Distribution of four major target classes (NDAVI based classification) generated using Landsat 8 OLI image from October 2016.


Table 1.
Vegetation and water indices used for water and vegetation features extraction.
| Index | Equation | Source |
|---|---|---|
| Normalized Difference Vegetation Index | [65] | |
| Normalized Difference Aquatic Vegetation Index | [46] | |
| Water Adjusted Vegetation Index | [51] | |
| Modified Normalized Difference Water Index | [66] |
*ρ presents the reflectance value from each band. L = Correction factor to adjust background influence for vegetation density. A single value L= 0.5 was adopted as no a priori data about vegetation density is available (Bands used: Green = Band 2, Red = Band 3, NIR (near-infrared) = Band 4, MIR (middle-infrared) = Band 5).
Table 2.
Distribution of dominant emergent macrophytes and other target classes from Lake Ziway and the surrounding based on Normalized Difference Aquatic Vegetation Index (NDAVI) and NDVI classification inputs.
Table 2.
Distribution of dominant emergent macrophytes and other target classes from Lake Ziway and the surrounding based on Normalized Difference Aquatic Vegetation Index (NDAVI) and NDVI classification inputs.
| Target Classes | NDAVI Based Classification | NDVI Based Classification | ||||
|---|---|---|---|---|---|---|
| Pixel Sum | Area (%) | Area (Km2) | Pixel Sum | Area (%) | Area (Km2) | |
| Mudflat | 8075 | 1.5 | 7.3 | 9689 | 1.8 | 8.7 |
| Mixed Macrophytes | 12,920 | 2.4 | 11.6 | 15,612 | 2.9 | 14 |
| Phragmites | 9152 | 1.7 | 8.2 | 7537 | 1.4 | 6.8 |
| Echinochloa | 19,380 | 3.6 | 17.4 | 18,842 | 3.5 | 17 |
| Cyperus | 10,228 | 1.9 | 9.2 | 9690 | 1.8 | 8.7 |
| Typha | 18,303 | 3.4 | 16.5 | 15,073 | 2.8 | 13.6 |
| Water | 452,733 | 84.1 | 407.4 | 453,810 | 84.3 | 408.3 |
| Semi-terrestrial Vegetation | 7537 | 1.4 | 6.8 | 8075 | 1.5 | 7.3 |
| Total | 538,328 | 100 | 484.4 | 538,328 | 100 | 484.4 |
Publisher’s Note: MDPI stays neutral with regard to jurisdictional claims in published maps and institutional affiliations. |
© 2021 by the authors. Licensee MDPI, Basel, Switzerland. This article is an open access article distributed under the terms and conditions of the Creative Commons Attribution (CC BY) license (http://creativecommons.org/licenses/by/4.0/).
Share and Cite
MDPI and ACS Style
Damtew, Y.T.; Verbeiren, B.; Awoke, A.; Triest, L. Satellite Imageries and Field Data of Macrophytes Reveal a Regime Shift of a Tropical Lake (Lake Ziway, Ethiopia). Water 2021, 13, 396. https://doi.org/10.3390/w13040396
AMA Style
Damtew YT, Verbeiren B, Awoke A, Triest L. Satellite Imageries and Field Data of Macrophytes Reveal a Regime Shift of a Tropical Lake (Lake Ziway, Ethiopia). Water. 2021; 13(4):396. https://doi.org/10.3390/w13040396
Chicago/Turabian StyleDamtew, Yohannes Tefera, Boud Verbeiren, Aymere Awoke, and Ludwig Triest. 2021. "Satellite Imageries and Field Data of Macrophytes Reveal a Regime Shift of a Tropical Lake (Lake Ziway, Ethiopia)" Water 13, no. 4: 396. https://doi.org/10.3390/w13040396
Note that from the first issue of 2016, this journal uses article numbers instead of page numbers. See further details here.