
The Impact of Methane Seepage on the Pore-Water Geochemistry across the East Siberian Arctic Shelf
by
 , , and
Natalia Guseva
1,*, 
Yulia Moiseeva
1,
Darya Purgina
1,
Elena Gershelis
1,
Evgeniy Yakushev
2,3 and
and
Igor Semiletov
1,4 1
School of Earth Sciences and Engineering, Tomsk Polytechnic University, 634050 Tomsk, Russia
2
Norwegian Institute of Water Research, 0345 Oslo, Norway
3
Shirshov Institute of Oceanology, Russian Academy of Sciences, 117218 Moscow, Russia
4
Pacific Oceanological Institute, Far East Branch of Russian Academy of Sciences, 690041 Vladivostok, Russia
*
Author to whom correspondence should be addressed.
Water 2021, 13(4), 397; https://doi.org/10.3390/w13040397
Submission received: 31 December 2020
/
Revised: 23 January 2021
/
Accepted: 25 January 2021
/
Published: 4 February 2021
(This article belongs to the Section Water Quality and Contamination)
Abstract
:East Siberian Arctic Shelf, the widest and the shallowest shelf of the World Ocean, covering greater than two million square kilometers, has recently been shown to be a significant modern source of atmospheric methane (CH4). The CH4 emitted to the water column could result from modern methanogenesis processes and/or could originate from seabed deposits (pre-formed CH4 preserved as free gas and/or gas hydrates). This paper focuses primarily on understanding the source and transformation of geofluid in the methane seepage areas using ions/trace elements and element ratios in the sediment pore-water. Six piston cores and totally 42 pore-water samples were collected in the East Siberian Sea and the Laptev Sea at water depths ranging from 22 to 68 m. In the active zones of methane release, concentrations of vanadium, thorium, phosphorus, aluminum are increased, while concentrations of cobalt, iron, manganese, uranium, molybdenum, copper are generally low. The behavior of these elements is determined by biogeochemical processes occurring in the pore-waters at the methane seeps sites (sulfate reduction, anaerobic oxidation of methane, secondary precipitation of carbonates and sulfides). These processes affect the geochemical environment and, consequently, the species of these elements within the pore-waters and the processes of their redistribution in the corresponding water–rock system.
1. Introduction
The most significant warming (the so-called “Arctic amplification”) is manifested in the high latitudes of the northern hemisphere. Arctic warming drastically accelerates the thaw-release of permafrost carbon, and this process could produce strong positive feedback to the ongoing climate warming. The Arctic Seabed is thought to store significant amounts of permafrost organic carbon and methane (CH4) including permafrost-associated and continental slope CH4 hydrates [1,2,3].
East Siberian Arctic Shelf (ESAS), the widest and the shallowest shelf of the World Ocean, covering greater than two million square kilometers, has recently been shown to be a significant modern source of atmospheric CH4 [3,4]. The CH4 emitted from the seafloor to the water column could result from modern methanogenesis processes and/or could originate from seabed deposits (pre-formed CH4 preserved as free gas and/or gas hydrates) [5].
The CH4 entering the surface sediments activates many sediment–water exchange processes, and accordingly affects the biogeochemical responses of the pore-water (seawater trapped in the pores of the sediments). Typically δ18O, δ13C, sulfide- and sulfate-sulfur isotopes are the direct indicators of methane seepage [6,7,8,9,10]. Additionally, major and trace elements, as well as rare earth elements (REEs), are often employed as geochemistry indicators for these processes. Redox-sensitive elements (e.g., Molybdenum and Uranium) [11,12,13], Ba content [14,15], Sr/Ca and Mg/Ca ratios [16,17], and REE anomalies [18] can be used to recognize variations of the redox conditions and mineral precipitation, reconstructing the history of the methane seepage and deposition.
The relationship between sedimentary geochemical anomalies (e.g., redox-sensitive elements, element ratios, and REE anomalies) and methane seepage has the potential to be seen in the geological records, serving as a valuable tool for the characterization of methane seepage. Meanwhile, the origin of sedimentary geochemical anomalies occurs through water solution during sedimentation and diagenesis. The main purpose of this study is the identification of the pore-water geochemical indicators in the methane seepage areas. This paper focuses primarily on the recognition of methane seepage using ions/trace elements and element ratios in the sediment pore-water.
2. Materials and Methods
Sampling and Analytical Methods
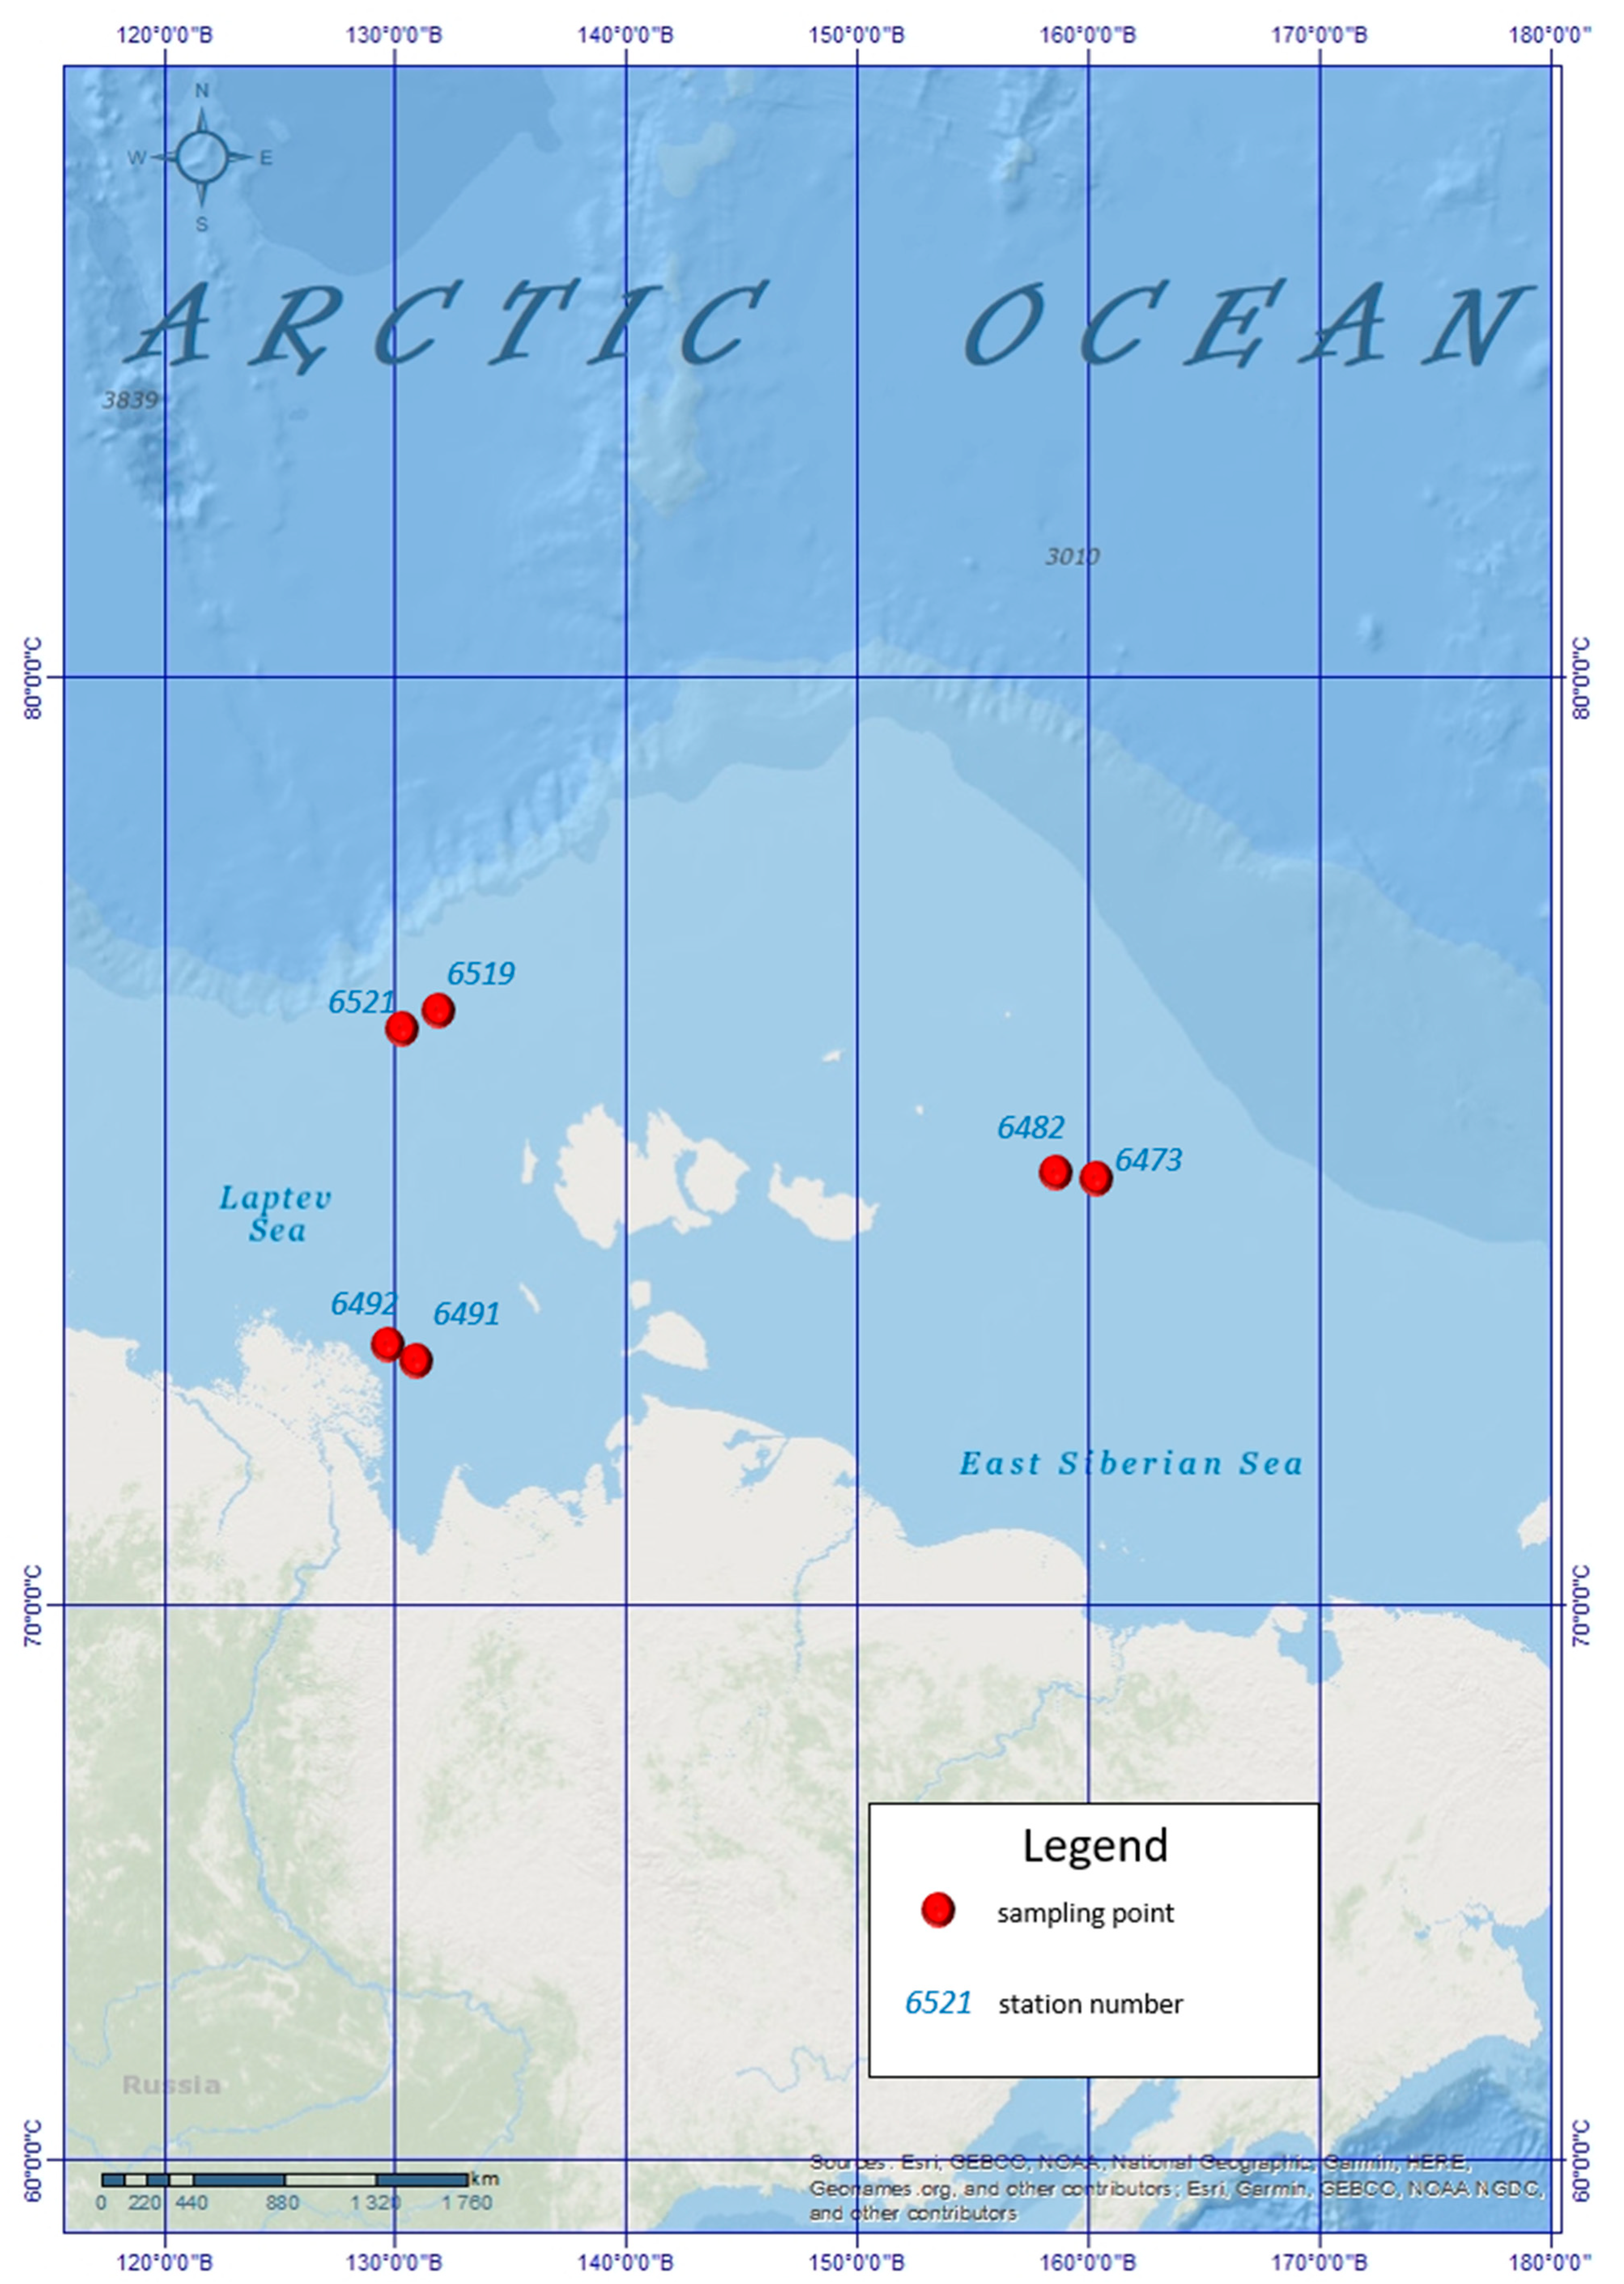
Six piston cores (6373, 6482, 6491, 6492, 6519, 6521) were collected in the East Siberian Sea and the Laptev Sea at water depths ranging from 22 to 68 m during the 78th cruise of the research vessel “Akademik Mstislav Keldysh” in October 2019 (Figure 1, Table 1). The samples were taken at 6 stations with a box-corer. The sediments in the cores mainly consist of greyish-green silty clay. Rarely, the sediments yielded a strong odour of hydrogen sulfide. Methane seep was detected at stations 6492, 6519, 6521 during the 78th cruise of the research vessel “Akademik Mstislav Keldysh” in October 2019.
After extraction from the box corer, the surface of each core sample was carefully cleaned. Pore-water samples were then collected using Rhizon samplers with pore sizes of the porous part of approximately 0.2 µm at intervals of 5 cm. The porous polymer tube of the Rhizon samplers was inserted into the sediments, and the opposite end of the tube was connected to a 5 mL vial. All the pore-water samples were preserved at ∼4 °C before further analyses. Totally, 42 pore-water samples were taken from the study area. Alkalinity was measured by direct titration (accuracy ±0.1 mmol/L), phosphate was determined by the Morphy–Riley method [19,20].
All the offshore analyses were performed at Tomsk Polytechnic University. The SO42−, Cl−, Br−, Ca2+, Mg2+, Na+, K+ concentrations were determined on a Dionex ICS-2000 ion chromatograph after a 100-fold dilution using ultra-pure water. Dissolved trace elements were determined by inductively coupled mass spectrometry (ICP-MS, NexIon 300D, Perkin Elmer, Waltham, MA, USA). All the standard solutions for it were prepared with ultra-pure deionized water and Perkin Elmer Multi-Element Standard Solutions.
3. Results and Discussion
3.1. Major Element Geochemistry
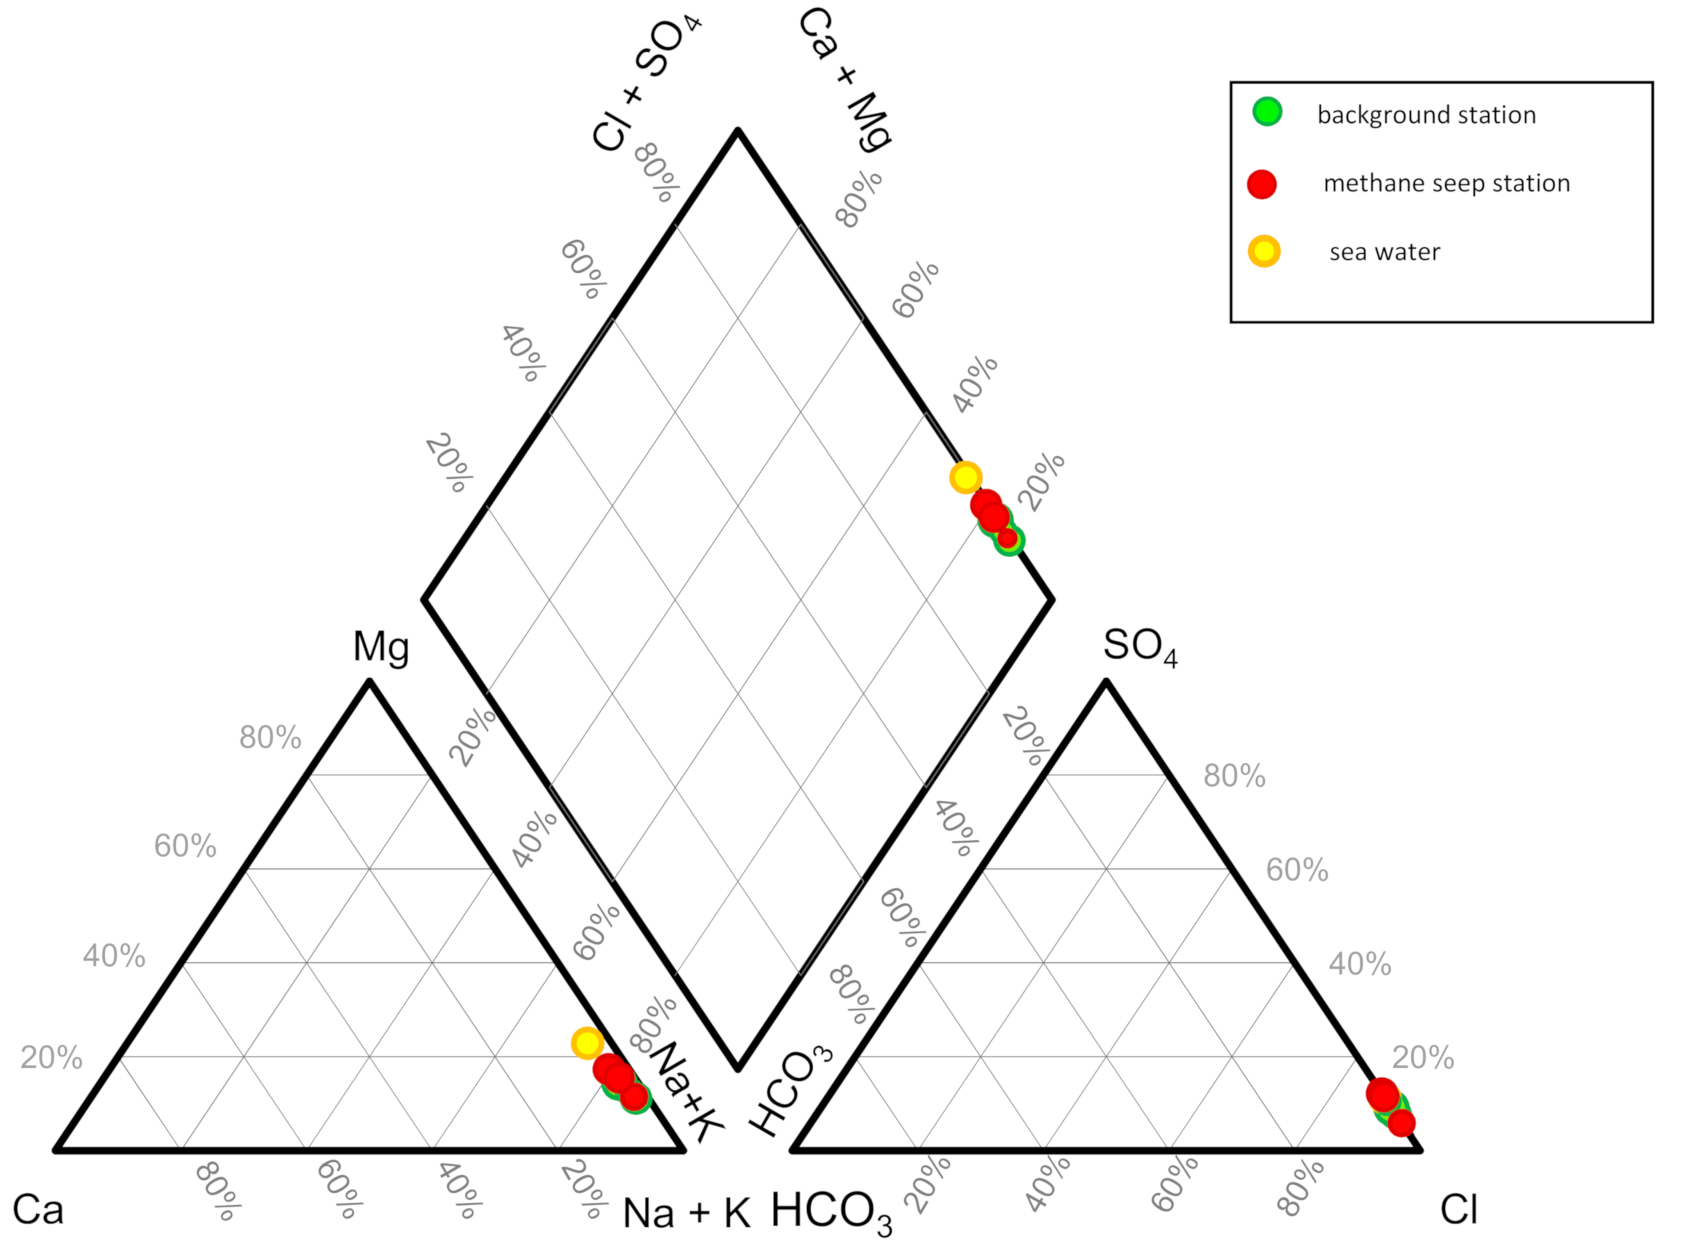
Average concentrations of the main ions in the pore-waters are presented in Table 2. The salinity values vary from 29,401.9 to 38,338.4 ppm. The main ionic composition of the pore-waters does not differ significantly from the composition of sea waters. The predominant ions in pore-waters are Cl− and Na+ (Figure 2).
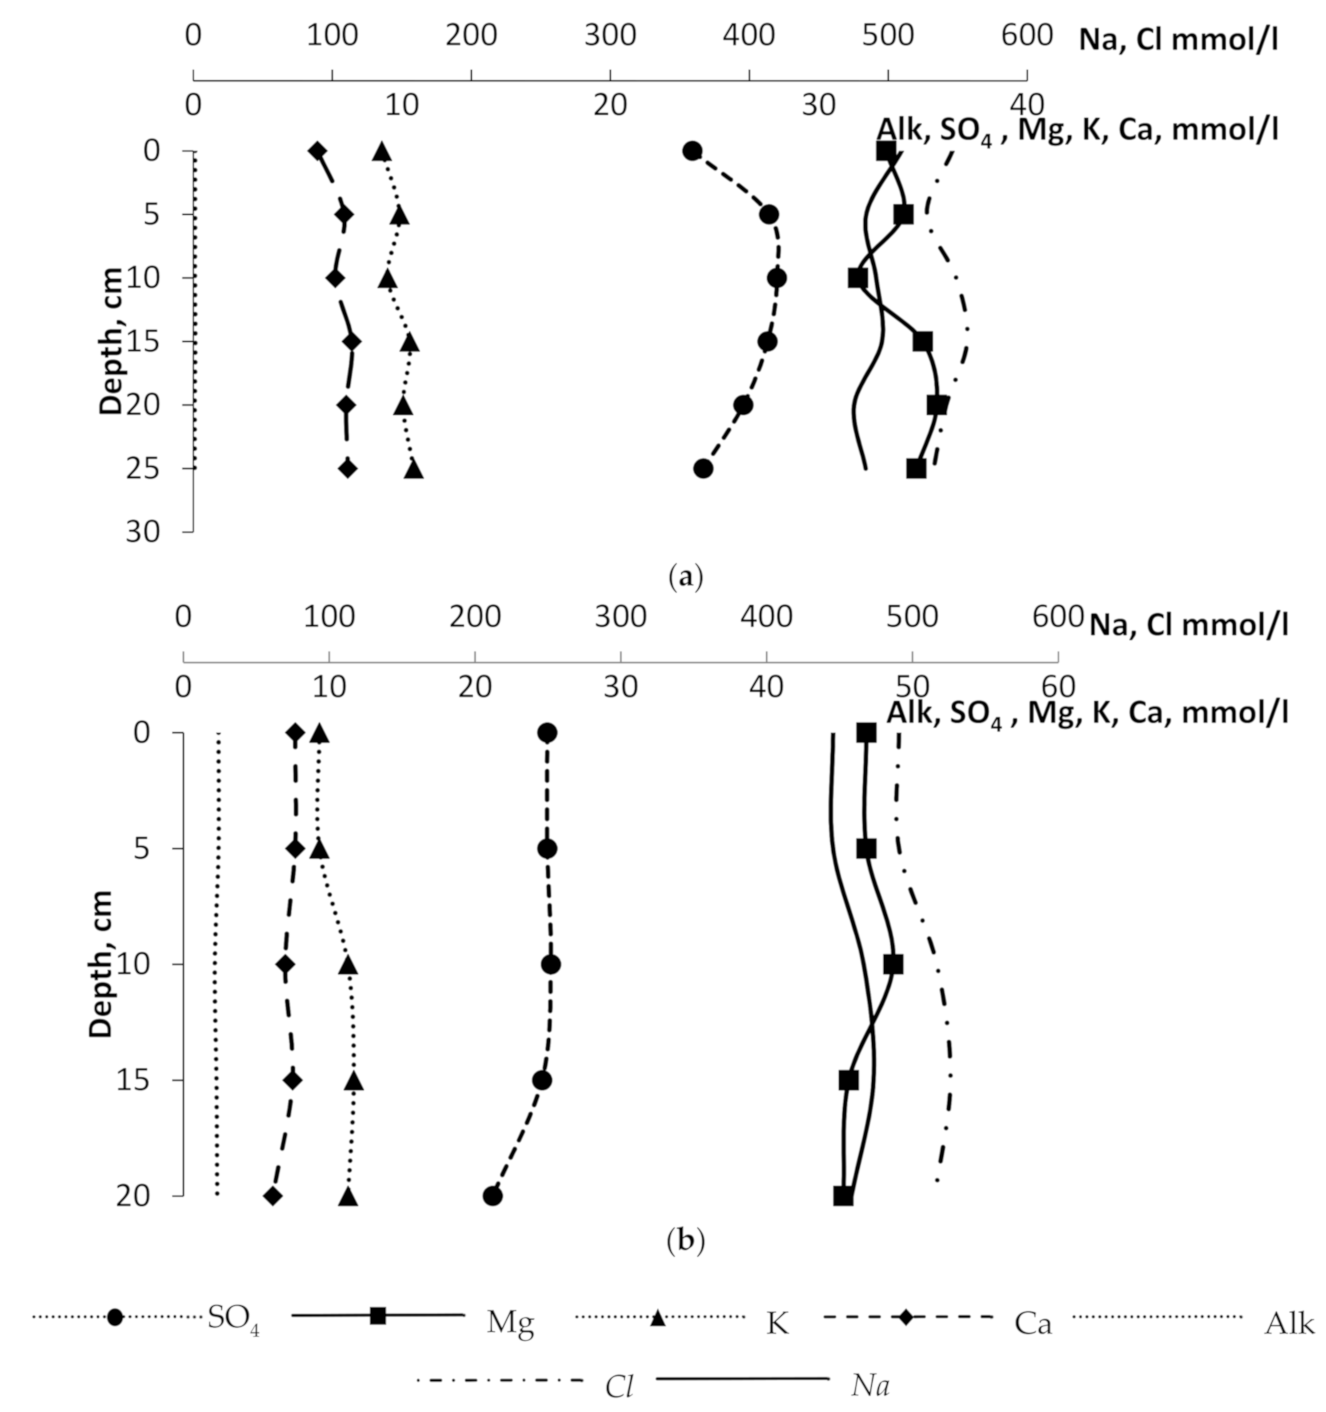
The concentrations of Cl− and Na+ in pore-waters vary slightly within the range of 478–589 mmol/L and 413–558 mmol/L, respectively. More significant concentration variations are observed for Mg2+ and Ca2+ in the range of 24.6–77.4 and 5.0–10.2 mmol/L. The concentrations of SO42− and alkalinity range from 4.4 to 38.6 mmol/L and 0.05 to 2.6, respectively. The alkalinity is very low in pore-water. The ionic composition of pore-waters in background stations and in areas of methane release differs insignificantly. Exclusion of pore-water at point 6492: pore-water has the lowest salinity if compared to other samples. The average salinity is 30,160.4 ppm. The concentration of SO42− is minimal in pore-waters at point 6492 and averages 8.8 mmol/L. This is three times lower than in all considered pore-waters. However, the alkalinity value in pore-waters at point 6492 is significantly higher than in the considered pore-waters, and averages 2.3 mmol/L.
For all the studied ions, linear trends of the main ionic concentration changes with depth are observed. At the background stations, concentrations of calcium, potassium, magnesium, sodium, and chlorine are slightly increasing with increasing depth. The values of alkalinity and potassium concentration are almost the same for all sampling horizons. The sulfate ion concentration slightly decreases with increasing depth (Figure 3). In the areas of active methane release, there are linear trends of the decreasing concentrations of sulfate ion, calcium, magnesium with increasing depth. The content of chloride ion and sodium in the pore-waters increases with depth. The revealed features of the sodium, chlorine, potassium behavior are consistent with the previously established patterns in other Arctic seas (White, Baltic and Barents) at depths of 0–5–10–15–35 cm [8,9]. The specific behavior of the sulfate ion, calcium and magnesium, the alkalinity variation in the studied pore-waters is presumably determined by the massive methane escaping detected across the study area.
3.2. Trace Elemants Geochemistry
Table 3 shows the average concentrations of trace elements in pore-waters in the background areas and in the zones of active methane release within the various morphological elements of the seabed (shelf, continental slope). In general, the abundance of elements in pore-waters is consistent with the behavior of chemical elements in natural environments. The average concentrations of most trace elements in the background areas practically do not differ from those in the zones of methane release. The exception is Mn, Fe, Co, Cu, W. In the methane seepage areas, the concentration of Mn and Fe sharply decreases. The average concentration of Mn, Fe in the background areas ranges from 180.1 to 553.1 µmol/L and from 28.5 to 369.9 µmol/L, respectively. The average concentrations of these elements in pore-waters across the “methane seeps” range from 28.8 to 65.9 µmol/L for Mn and from 4.4 to 6.2 µmol/L for Fe. The concentration of Co and Cu in pore-waters in the methane seepage areas is reduced by almost 10 times in comparison with the background areas. At the background sites, the average concentration of Co is from 0.06 to 0.11 µmol/L, in the active zones of methane release, the concentration decreases to 0.002–0.01 µmol/L. The average concentration of Co in the pore-waters of the background areas is 0.1 µmol/L and decreases to 0.01 µmol/L in methane release zones.
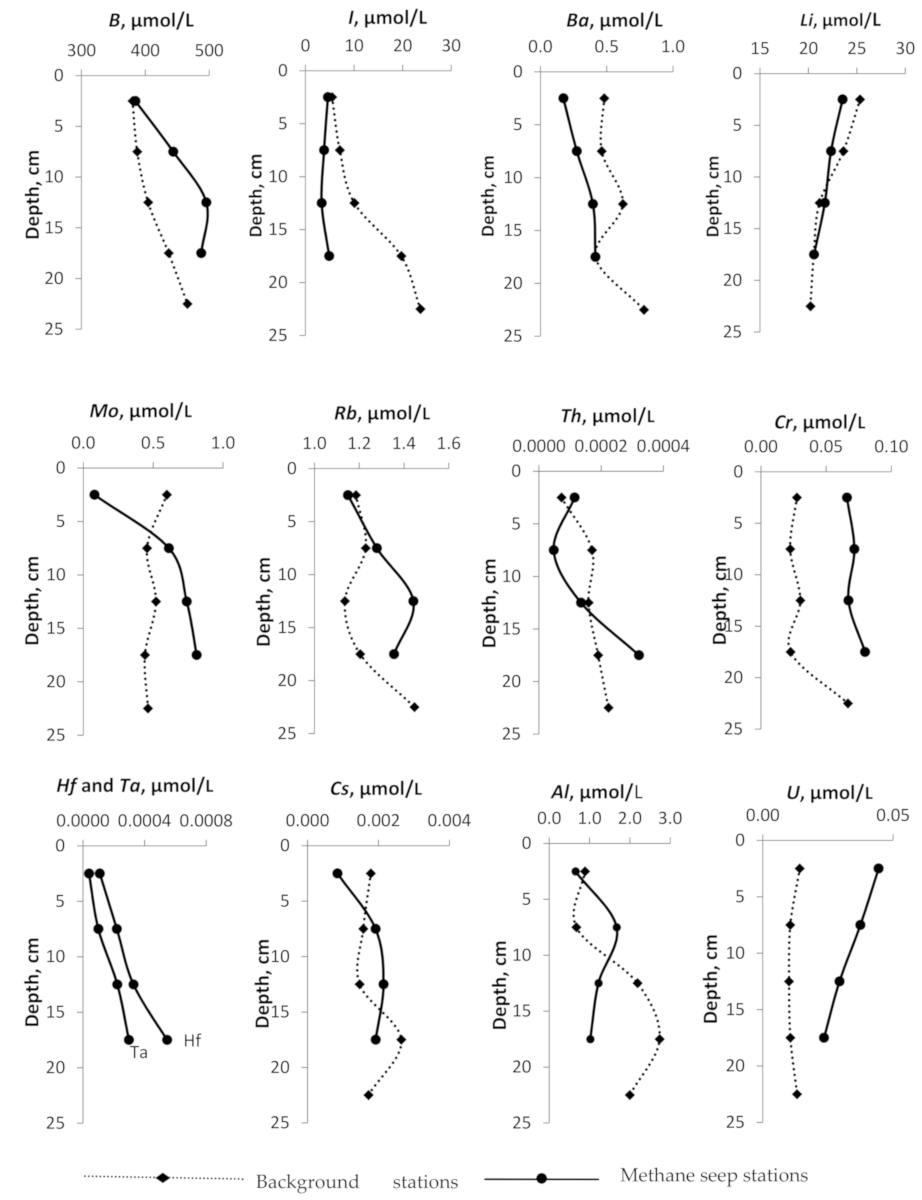
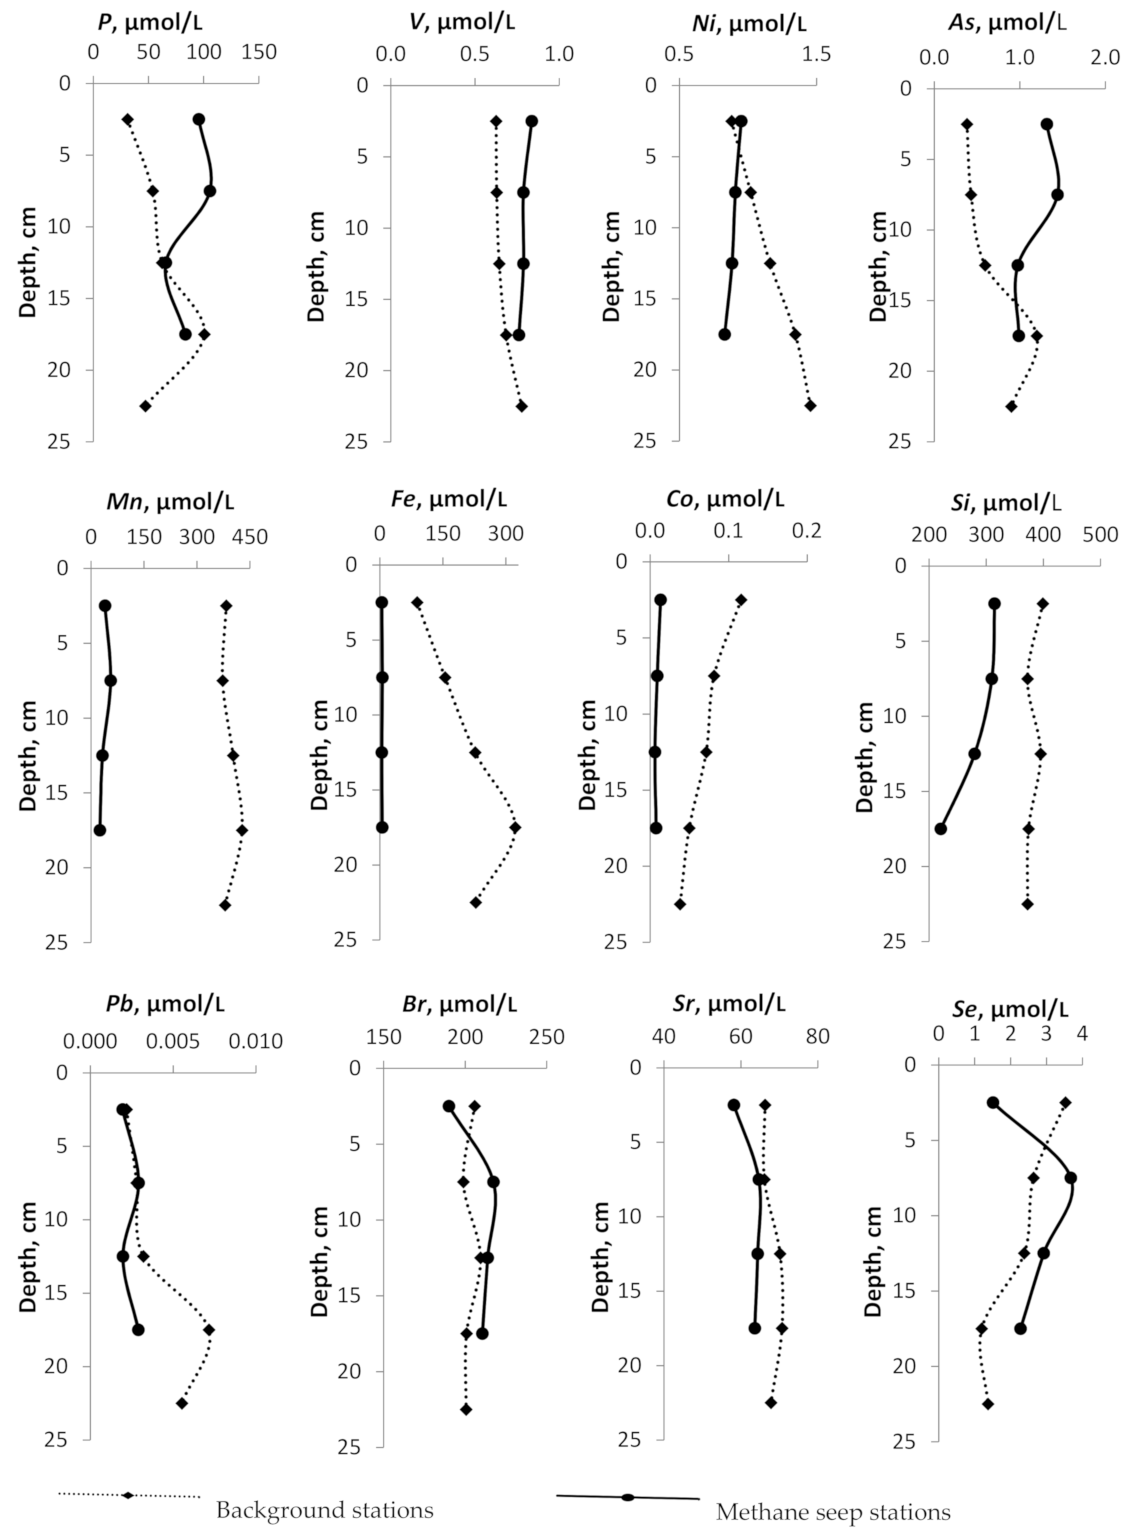
All elements can be divided into several groups according to the nature of concentration changes with depth. The behavior of B, I, and Ba with depth is identical both at background stations and across the methane release zones. They are characterized by a weak linear trend of decreasing concentration with increasing depth. The B content both at the background station and at the active methane emission site does not vary significantly from 384.5 µmol/L to 495.5 µmol/L. The concentration of I in background stations increases with depth from 5.5 μmol/L to 23.6 μmol/L. At active stations, no significant changes are observed. The concentration of Li decreases with increasing depth both at the background stations and in the zones of methane release from 25 to 20 µmol/L. The concentrations of Pb, Cr, Br, Sr in pore-waters practically do not change with changing depth, at nor the background neither active methane seeps. The concentrations of Mo, Rb, Th, Hf, Ta, Cs at anomalous stations increase with increasing depth. The concentrations of U, P, V, Ni, As, Si decrease with increasing depth at seep stations only; at the background stations, the concentrations of these elements generally increase.
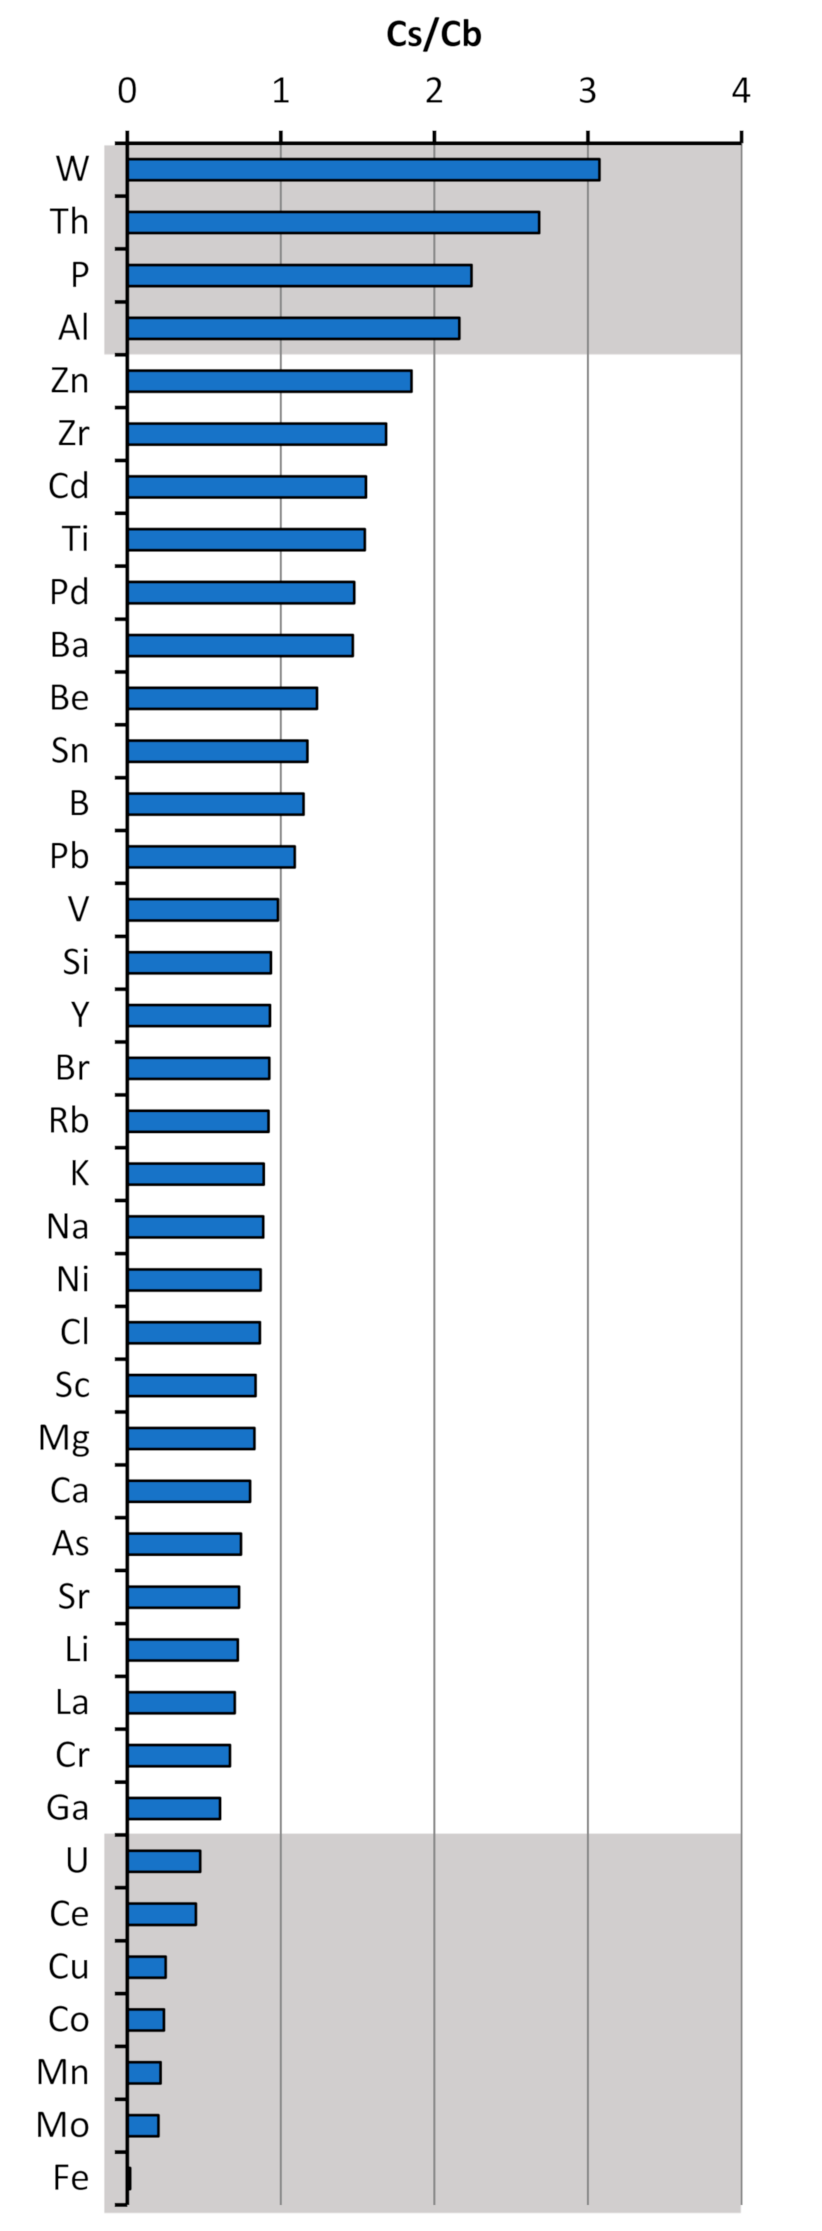
Trace elements that are sensitive to changes in diagenetic environments can potentially be used to determine depositional conditions and reconstruct processes. Trace elements, including Fe, Mo, Mn, Co, Cu, Ni, Zn, V, Ce, U and Th, W, P exhibit anomalies in response to the intense methane seepages (Table 2 and Table 3, Figure 4). The Th, W, P enrichments in the pore-water occurred at the methane seep station (6492). In contrast, Fe, Mo, Mn, Co, Cu, Ni, Zn, V, Ce precipitate from the pore-water at the methane seep station. This fact illustrates the ratio of these elements in pore-waters at a depth of 15–20 cm at the anomalous station itself (6492) in relation to the background station (Figure 5).
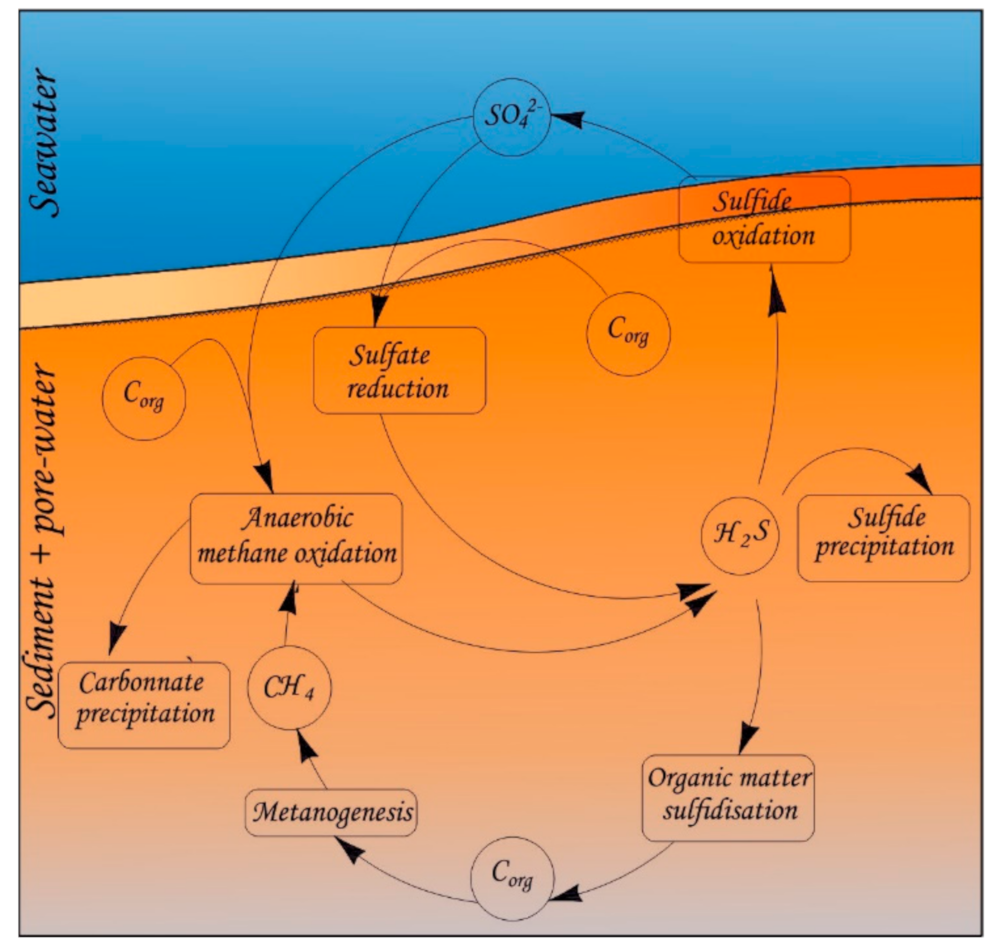
The behavior of the chemical elements in the pore-water within the zones of an active methane release is determined by the following main biogeochemical processes (Figure 6): the anaerobic oxidation of methane (AOM) coupled sulfate reduction (SR) (CH4 + SO42− → HCO3− + HS− + H2O) mediated by a syntrophic consortium of methanotrophic archaea and sulfate-reducing bacteria [21,22]. The sulfate reduction also consumes dissolved sulfate and plays a critical role in the early diagenesis of marine sediments [23,24]. The AOM is always the predominant reaction in seep environments. In low-methane flux seep environments, all the methane can be consumed by AOM, while in high methane flux seep environments, a proportion of the methane may pass through the SMTZ and escape to the bottom water [25,26]. Both AOM and OSR processes strengthen the alkalinity of pore-water, which facilitates the precipitation of authigenic carbonate (Ca2+ + HCO3− → CaCO3 + H+), and decrease the calcium concentration in pore-water. Mg-rich authigenic carbonates are formed in the seep-impacted sediments.
In fact, AOM coupled with sulfate reduction can produce abundant H2S at cold seeps and generate sulfidic environments that favor the precipitation of authigenic sulfides [27,28,29] which leads to the decrease in Fe, Mn, Co, Cu concentrations. The redox-sensitive elements Mo and U to intense methane seepages provides a good opportunity to explore the conditions for their behavior and the implications for tracing methane seepages.
In oxic seawater, Mo exists primarily as molybdate (MoO42−) and is adsorbed onto Mn-oxyhydroxides. Under a sulfidic environment, MoO42− is converted to thiomolybdates (MoS4 − xOx 2−) at a critical concentration of hydrogen sulfide (H2S; ~10–100 μM) and is rapidly sequestered into the organic fraction and/or precipitated as sulfide minerals [30,31,32].
In oxic seawater and oxidation state, U exists primarily as UO2(CO3)34− and is converted to insoluble UO2, U3O7 or U3O8 in reducing conditions [33].
During early organic matter diagenesis, sulfate reduction (SR) and AOM consume sulfate, generating both alkalinity, dissolved inorganic carbon and phosphate which leads to an increase in their concentrations in pore-waters at the methane seep station:
2(CH2O)x(NH3)y(H3PO4)z + xSO42− → xH2S +2xHCO3− + 2yNH3 + 2zH3PO4
4. Conclusions
Methane release observed across the East Siberian Arctic Seas affects the chemical composition of pore-waters within the sediments at the active seep sites. When seawater is getting trapped in the bottom surface sediments, its chemical composition is being drastically transformed, and methane (geofluid) emitting from the seabed could significantly accelerate this biogeochemical process. The anionic and cationic composition of pore-waters corresponds to the composition of the sea waters.
Methane emission affects the ionic composition of the pore-water. A lower concentration of the sulphate ion is accompanied by a lower salinity and increased alkalinity. At the same time, the concentration of the dominant Na and Cl ions in the pore-waters both at background and methane seep stations change insignificantly.
The regional differentiation was also observed. Stations located in the East Siberian Sea are characterized by an increased content of manganese, aluminum, silicon, phosphorus, iron, copper and barium relative to other elements and a lower content of uranium and thorium. The continental slope is characterized by an increased content of lithium, boron, vanadium, bromine, as well as uranium and low content of iodine and manganese.
In the active zones of methane release, concentrations of vanadium, thorium, phosphorus, aluminum are increased, while concentrations of cobalt, iron, manganese, uranium, molybdenum, copper are generally low. The behavior of these elements is determined by biogeochemical processes occurring in the pore-waters at the methane seeps sites (sulfate reduction, anaerobic oxidation of methane, secondary precipitation of carbonates and sulfides). These processes affect the geochemical environment, and, consequently, the species of these elements within the pore-waters and the processes of their redistribution in the corresponding water–rock system. Further studies are required to understand better the role of in situ biogeochemical processes vs. upward transport of geofluid and its chemical composition.
Author Contributions
Y.M. and D.P. contributed to the sample preparation and measurements; N.G., E.Y. and I.S. were involved in planning and supervised the work; Y.M., D.P., N.G., E.G. processed the experimental data, performed the analysis, drafted the manuscript and designed the figures. Y.M., D.P., E.Y. performed the fieldwork. All authors discussed the results and commented on the manuscript. All authors have read and agreed to the published version of the manuscript.
Funding
This research was performed in the frame of Tomsk Polytechnic University Competitiveness Enhancement Program (VIU-OG-215/2020).
Acknowledgments
Authors thank anonymous reviewers for their constructive comments, which led to significant improvement of the manuscript.
Conflicts of Interest
The authors declare no conflict of interest.
References
- Shakhova, N.; Semiletov, I.; Leifer, I.; Salyuk, A.; Rekant, P.; Kosmach, D. Geochemical and geophysical evidence of methane release over the East Siberian Arctic Shelf. J. Geophys. Res. Ocean. 2010, 115. [Google Scholar] [CrossRef]
- Shakhova, N.; Nicolsky, D.; Semiletov, I.P. Current state of subsea permafrost on the East Siberian Shelf: Tests of modeling results based on field observations. Dokl. Earth Sci. 2009, 429, 1518–1521. [Google Scholar] [CrossRef]
- Shakhova, N.; Semiletov, I.; Salyuk, A.; Yusupov, V.; Kosmach, D.; Gustafsson, Ö. Extensive methane venting to the atmosphere from sediments of the East Siberian Arctic Shelf. Science 2010, 327, 1246–1250. [Google Scholar] [CrossRef]
- Shakhova, N.; Semiletov, I.; Leifer, I.; Sergienko, V.; Salyuk, A.; Kosmach, D.; Chernykh, D.; Stubbs, C.; Nicolsky, D.; Tumskoy, V.; et al. Ebullition and storm-induced methane release from the East Siberian Arctic Shelf. Nat. Geosci. 2014, 7, 64–70. [Google Scholar] [CrossRef]
- Shakhova, N.; Semiletov, I.; Sergienko, V.; Lobkovsky, L.; Yusupov, V.; Salyuk, A.; Salomatin, A.; Chernykh, D.; Kosmach, D.; Panteleev, G.; et al. The East Siberian Arctic Shelf: Towards further assessment of permafrost-related methane fluxes and role of sea ice. Philos. Trans. R. Soc. A Math. Phys. Eng. Sci. 2015, 373, 20140451. [Google Scholar] [CrossRef]
- Campbell, K.A.; Francis, D.A.; Collins, M.; Gregory, M.R.; Nelson, C.S.; Greinert, J.; Aharon, P. Hydrocarbon seep-carbonates of a Miocene forearc (East Coast Basin), North Island, New Zealand. Sediment. Geol. 2008, 204, 83–105. [Google Scholar] [CrossRef]
- Li, N.; Yang, X.; Peng, J.; Zhou, Q.; Chen, D. Paleo-cold seep activity in the southern South China Sea: Evidence from the geochemical and geophysical records of sediments. J. Asian Earth Sci. 2018, 168, 106–111. [Google Scholar] [CrossRef]
- Aharon, P.; Fu, B. Microbial sulfate reduction rates and sulfur and oxygen isotope fractionations at oil and gas seeps in deepwater Gulf of Mexico. Geochim. Cosmochim. Acta 2000, 64, 233–246. [Google Scholar] [CrossRef]
- Aharon, P.; Fu, B. Sulfur and oxygen isotopes of coeval sulfate-sulfide in pore fluids of cold seep sediments with sharp redox gradients. Chem. Geol. 2003, 195, 201–218. [Google Scholar] [CrossRef]
- Peckmann, J.; Thiel, V. Carbon cycling at ancient methane-seeps. Chem. Geol. 2004, 205, 443–467. [Google Scholar] [CrossRef]
- Algeo, T.J.; Tribovillard, N. Environmental analysis of paleoceanographic systems based on molybdenum-uranium covariation. Chem. Geol. 2009, 268, 211–225. [Google Scholar] [CrossRef]
- Tribovillard, N.; Algeo, T.J.; Baudin, F.; Riboulleau, A. Analysis of marine environmental conditions based onmolybdenum-uranium covariation-Applications to Mesozoic paleoceanography. Chem. Geol. 2012, 324–325, 46–58. [Google Scholar] [CrossRef]
- Hu, Y.; Feng, D.; Liang, Q.; Xia, Z.; Chen, L.; Chen, D. Impact of anaerobic oxidation of methane on the geochemical cycle of redox-sensitive elements at cold-seep sites of the northern South China Sea. Deep. Res. Part II Top. Stud. Oceanogr. 2015, 122, 84–94. [Google Scholar] [CrossRef]
- Feng, D.; Chen, D. Authigenic carbonates from an active cold seep of the northern South China Sea: New insights into fluid sources and past seepage activity. Deep. Res. Part II Top. Stud. Oceanogr. 2015, 122, 74–83. [Google Scholar] [CrossRef]
- Vanneste, H.; James, R.H.; Kelly-Gerreyn, B.A.; Mills, R.A. Authigenic barite records of methane seepage at the carlos ribeiro mud volcano (gulf of cadiz). Chem. Geol. 2013, 354, 42–54. [Google Scholar] [CrossRef]
- Nöthen, K.; Kasten, S. Reconstructing changes in seep activity by means of pore water and solid phase Sr/Ca and Mg/Ca ratios in pockmark sediments of the Northern Congo Fan. Mar. Geol. 2011, 287, 1–13. [Google Scholar] [CrossRef]
- Bayon, G.; Pierre, C.; Etoubleau, J.; Voisset, M.; Cauquil, E.; Marsset, T.; Sultan, N.; Le Drezen, E.; Fouquet, Y. Sr/Ca and Mg/Ca ratios in Niger Delta sediments: Implications for authigenic carbonate genesis in cold seep environments. Mar. Geol. 2007, 241, 93–109. [Google Scholar] [CrossRef] [Green Version]
- Haley, B.A.; Klinkhammer, G.P.; McManus, J. Rare earth elements in pore waters of marine sediments. Geochim. Cosmochim. Acta 2004, 68, 1265–1279. [Google Scholar] [CrossRef]
- Hansen, H.P.; Koroleff, F. Determination of nutrients. In Methods of Seawater Analysis: Third, Completely Revised and Extended Edition; Wiley Blackwell: Hoboken, NJ, USA, 2007; pp. 159–228. ISBN 9783527613984. [Google Scholar]
- Murphy, J.; Riley, J.P. A modified single solution method for the determination of phosphate in natural waters. Anal. Chim. Acta 1962, 27, 31–36. [Google Scholar] [CrossRef]
- Reeburgh, W.S. Oceanic Methane Biogeochemistry. Chem. Rev. 2007, 107, 486–513. [Google Scholar] [CrossRef] [Green Version]
- Boetius, A.; Ravenschlag, K.; Schubert, C.J.; Rickert, D.; Widdel, F.; Gleseke, A.; Amann, R.; Jørgensen, B.B.; Witte, U.; Pfannkuche, O. A marine microbial consortium apparently mediating anaerobic oxidation methane. Nature 2000, 407, 623–626. [Google Scholar] [CrossRef]
- Berner, R.A. Early Diagenesis: A Theoretical Approach; Princeton University Press: Princeton, NJ, USA, 1980. [Google Scholar]
- Schulz, H.D.; Dahmke, A.; Schinzel, U.; Wallmann, K.; Zabel, M. Early diagenetic processes, fluxes, and reaction rates in sediments of the South Atlantic. Geochim. Cosmochim. Acta 1994, 58, 2041–2060. [Google Scholar] [CrossRef]
- Regnier, P.; Dale, A.W.; Arndt, S.; LaRowe, D.E.; Mogollón, J.; Van Cappellen, P. Quantitative analysis of anaerobic oxidation of methane (AOM) in marine sediments: A modeling perspective. Earth-Sci. Rev. 2011, 106, 105–130. [Google Scholar] [CrossRef]
- Steeb, P.; Krause, S.; Linke, P.; Hensen, C.; Dale, A.W.; Nuzzo, M.; Treude, T. Efficiency and adaptability of the benthic methane filter at Quepos Slide cold seeps, offshore of Costa Rica. Biogeosciences 2015, 12, 6687–6706. [Google Scholar] [CrossRef] [Green Version]
- Martens, C.S.; Berner, R.A. Methane production in the interstitial waters of sulfate-depleted marine sediments. Science 1974, 185, 1167–1169. [Google Scholar] [CrossRef]
- Pierre, C. Origin of the authigenic gypsum and pyrite from active methane seeps of the southwest African Margin. Chem. Geol. 2017, 449, 158–164. [Google Scholar] [CrossRef]
- Lein, A.Y.; Ivanov, M.V. Biogeochemical Methane Cycle in the Ocean; Nauka: Moscow, Russia, 2009; p. 464. [Google Scholar]
- Helz, G.R.; Miller, C.V.; Charnock, J.M.; Mosselmans, J.F.W.; Pattrick, R.A.D.; Garner, C.D.; Vaughan, D.J. Mechanism of molybdenum removal from the sea and its concentration in black shales: EXAFS evidence. Geochim. Cosmochim. Acta 1996, 60, 3631–3642. [Google Scholar] [CrossRef]
- Helz, G.R.; Bura-Nakić, E.; Mikac, N.; Ciglenečki, I. New model for molybdenum behavior in euxinic waters. Chem. Geol. 2011, 284, 323–332. [Google Scholar] [CrossRef]
- Zheng, Y.; Anderson, R.F.; Van Geen, A.; Kuwabara, J. Authigenic molybdenum formation in marine sediments: A link to pore water sulfide in the Santa Barbara Basin. Geochim. Cosmochim. Acta 2000, 64, 4165–4178. [Google Scholar] [CrossRef]
- Tribovillard, N.; Algeo, T.J.; Lyons, T.; Riboulleau, A. Trace metals as paleoredox and paleoproductivity proxies: An update. Chem. Geol. 2006, 232, 12–32. [Google Scholar] [CrossRef]
- Scholz, F.; Hensen, C.; Noffke, A.; Rohde, A.; Liebetrau, V.; Wallmann, K. Early diagenesis of redox-sensitive trace metals in the Peru upwelling area-response to ENSO-related oxygen fluctuations in the water column. Geochim. Cosmochim. Acta 2011, 75, 7257–7276. [Google Scholar] [CrossRef]
Figure 1.
Study area in the Laptev Sea. Pink filled circles mark the sediment sampling sites.

Figure 2.
Piper-diagram of the studied pore-water. Green filled circles mark the pore-water sampling from background stations, red filled circles mark the pore-water sampling from methane seep stations.
Figure 2.
Piper-diagram of the studied pore-water. Green filled circles mark the pore-water sampling from background stations, red filled circles mark the pore-water sampling from methane seep stations.

Figure 3.
Concentrations profiles: (a) background sites; (b) “methane seep” sites.

Figure 4.
Depth profiles of the pore-water geochemical parameters (content of B, I, Li, Ba, Mo, Rb, Th, Cr, Hf and Ta, Cs, Al, U, P, V, Ni, As, Mn, Fe, Co,Si, Pb, Br, Sr, Se) at the methane seep stations and at the background stations.
Figure 4.
Depth profiles of the pore-water geochemical parameters (content of B, I, Li, Ba, Mo, Rb, Th, Cr, Hf and Ta, Cs, Al, U, P, V, Ni, As, Mn, Fe, Co,Si, Pb, Br, Sr, Se) at the methane seep stations and at the background stations.


Figure 5.
Ratio trace element concentration in pore-water at methane seep station (6492) (Cs) and background station (6491) (Cb) at the depth 15–20 cm.
Figure 5.
Ratio trace element concentration in pore-water at methane seep station (6492) (Cs) and background station (6491) (Cb) at the depth 15–20 cm.

Figure 6.
The schematic presentation of main biogeochemical processes in studied pore-water.


Table 1.
Sampling details.
| No | Longitude (E) | Latitude (N) | Water Depth (m) | Seafloor Temperature (Last Sampler) | Core Length (m) | Amount of Pore-Water Samples | Specific Conditions |
|---|---|---|---|---|---|---|---|
| 6491 | 73.11 | 130.34 | 26 | −0.3 | 0.25 | 8 | Background |
| 6473 | 74.90 | 160.94 | 45 | −1.5 | 0.13 | 7 | Background |
| 6482 | 74.94 | 160.53 | 44 | 1.5 | 0.23 | 8 | Background |
| 6492 | 73.09 | 130.28 | 22 | 0.23 | 0.19 | 9 | Methane Seep |
| 6519 | 76.89 | 129.13 | 65 | −1.1 | 0.17 | 4 | Methane Seep |
| 6521 | 76.89 | 127.81 | 68 | −1.1 | 0.19 | 7 | Methane Seep |
Table 2.
Content of major ions in pore-water, mmol/L (min–max/mean).
| Background Station | Methane Seep Station | |||||
|---|---|---|---|---|---|---|
| Shelf (Laptev Sea) | Shelf (East Siberian Sea) | Shelf (Laptev Sea) | Continental Slope (Laptev Sea) | |||
| 6491 | 6473 | 6482 | 6492 | 6519 | 6521 | |
| Alkalinity | 0.08–0.13 0.01 | - | 0.05–0.07 0.06 | 2.1–2.6 2.3 | - | - |
| SO42− | 24.0–31.6 29.3 | 23.9–28.0 25.8 | 23.2–28.0 26.0 | 4.4–14.9 8.8 | 31.8–38.6 36.4 | 23.0–36.7 32.2 |
| Cl− | 504.0–588.9 557.6 | 518.0–577.4 548.2 | 499.0–556.4 523.0 | 478.1–519.0 499.1 | 541.0–554.0 547.4 | 487.3–533.5 507.9 |
| Ca2+ | 6.3–7.3 6.8 | 6.0–8.7 7.5 | 7.5–8.7 7.9 | 5.0–5.4 5.2 | 7.1–10.2 8.6 | 7.2–7.7 7.2 |
| Mg2+ | 32.1–39.3 36.9 | 32.0–44.5 38.9 | 39.4–77.4 53.6 | 24.6–29.4 26.7 | 46.1–55.4 51.4 | 40.8–46.1 43.5 |
| Na+ | 468.0–558.0 523.0 | 466.0–514.0 499.1 | 413.0–472.3 443.4 | 433.0–469.0 447.1 | 482.9–493.6 489.3 | 442.0–485.0 460.9 |
| K+ | 8.7–9.0 8.8 | 8.9–12.4 10.7 | 10.3–11.6 11.1 | 7.7–9.1 8.2 | 13.6–14.5 14.0 | 11.7–14.3 12.8 |
| Salinity * | 33,449.5–38338.4 36,314.0 | 33,448.6–36945.8 35,245.5 | 32,377.4–35142.6 33,455.4 | 29,401.9–31523.3 30,160.4 | 35,907.3–37105.0 36,456.6 | 31,921.6–35569.5 33,701.6 |
Underline, 0.08–0.13: Min–Max; 0.01: Average.; *—SalinityTDS.
Table 3.
Concentrations of the trace elements in the pore-waters, µmol/L (min–max/mean).
| Background | Seep | |||||
|---|---|---|---|---|---|---|
| Shelf (Laptev Sea) | Shelf (East Siberian Sea) | Shelf (Laptev Sea) | Continental Slope (Laptev Sea) | |||
| 6491 | 6473 | 6482 | 6492 | 6519 | 6521 | |
| Li | 15.8–33.3 19.9 | 18.0–49.5 25.6 | 20.2–27.0 23.1 | 12.4–15.5 13.8 | 25.9–33.1 29.1 | 20.8–42.1 27 |
| Be | 0.1–0.1 0.1 | n.d. | 0.1–0.1 0.1 | n.d. | 0.1–0.1 0.1 | 0.1–0.1 0.1 |
| B | 315.3–408.9 348.2 | 313.1–453.1 391.9 | 424.7–518.4 474.7 | 346.8–519.4 421.5 | 462.1–647.6 564 | 368–501.9 450.8 |
| Al | 0–2.8 0.9 | 0.5–2.7 1.5 | 0.7–5.9 2.1 | 0.6–2.4 1.1 | 0.6–1.4 1.0 | 0.4–4.1 1.4 |
| Si | 222.6–328.1 257.4 | 397.2–552.0 487.1 | 373.7–463.4 424.9 | 267.9–327.0 291.5 | 232.9–331.9 277.7 | 100.5–406.3 261.4 |
| P | 12.5–99.9 40.1 | 38.3–113.4 63.2 | 14.7–112.5 59.8 | 96.5–175.1 138.4 | 17.4–18.6 17.9 | 28.7–96.8 51.5 |
| Sc | 0.002–0.03 0.01 | 0.002–0.03 0.01 | 0.002–0.015 0.01 | 0.01–0.03 0.01 | 0.001–0.001 0.001 | 0.003–0.01 0.02 |
| Ti | 0.04–0.1 0.09 | 0.04–0.1 0.07 | 0.05–0.1 0.1 | 0.01–0.03 0.01 | 0.03–0.1 0.1 | 0.02–0.1 0.1 |
| V | 0.65–0.8 0.7 | 0.55–0.7 0.6 | 0.6–0.8 0.6 | 0.7–0.9 0.8 | 0.7–0.9 0.8 | 0.7–0.8 0.8 |
| Cr | 0.01–0.7 0.04 | 0.02–0.04 0.03 | 0–0.04 0.02 | 0.08–0.15 0.1 | 0.04–0.08 0.05 | 0.02–0.07 0.04 |
| Mn | 143.7–261.9 180.1 | 531.1–638.8 553.1 | 344.9–533.8 458.3 | 22.8–33.2 28.8 | 43.9–121.3 65.9 | 6.8–59.5 31.5 |
| Fe | 228.1–705.7 369.9 | 9.1–79.1 28.5 | 7.3–143.5 94.5 | 3.2–6.0 4.4 | 4.9–7.3 6.2 | 3.8–8.4 5.8 |
| Co | 0.04–0.14 0.11 | 0.04–0.11 0.07 | 0.02–0.15 0.06 | 0.007–0.02 0.01 | 0.004–0.02 0.01 | 0.0004–0.006 0.002 |
| Ni | 0.08–1.7 1.2 | 0.5–1.4 0.9 | 0.4–1.9 1.1 | 0.3–0.9 0.7 | 0.9–1.4 1.2 | 0.7–1.3 0.9 |
| Cu | 0–0.2 0.1 | 0.02–0.2 0.1 | 0.01–0.4 0.1 | 0.001–0.03 0.01 | 0.01–0.13 0.06 | 0.01–0.09 0.04 |
| Zn | 0–0.1 0.04 | 0.1–1.2 0.4 | 0.1–0.7 0.3 | 0.01–0.1 0.06 | 0.07–0.6 0.3 | 0.06–0.3 0.2 |
| Ga | 0.003–0.004 0.007 | 0.009–0.01 0.01 | 0.005–0.01 0.01 | 0.001–0.008 0.004 | 0.0004–0.007 0.004 | 0.001–0.003 0.002 |
| As | 0.4–0.6 0.5 | 0.4–0.6 0.5 | 0.3–1.2 0.8 | 1.1–3.1 2.1 | 0.2–0.9 0.4 | 0.2–0.9 0.5 |
| Se | 0.7–4.6 2.8 | 0.2–3.9 2.7 | 0.5–2.3 1.5 | 1.1–2.7 2.2 | 2.1–4.7 3.3 | 1.4–4.9 3.0 |
| Br | 173.9–186.5 181.1 | 191.1–239.0 217.0 | 205.7–219.7 214.9 | 157.5–178.6 166.6 | 244.9–285.3 265.9 | 217.3–237.4 228.0 |
| Rb | 0.9–1.0 1.0 | 0.4–1.7 1.2 | 1.1–1.7 1.2 | 0.9–1.0 1.0 | 1.7–1.8 1.7 | 1.2–2.0 1.5 |
| Sr | 62.1–70.0 65.8 | 55.7–78.7 67.0 | 66.8–73.7 70.6 | 44.2–50.2 46.9 | 75.6–87.1 80.1 | 69.4–76.4 72.3 |
| Y | 0.0008–0.004 0.002 | 0.0004–0.0008 0.0005 | 0.0002–0.001 0.0008 | 0.0002–0.002 0.0008 | 0.0006–0.001 0.0009 | 0.0002–0.001 0.0007 |
| Zr | 0.004–0.02 0.01 | 0.0003–0.02 0.0009 | 0.0008–0.02 0.001 | 0.02–0.04 0.03 | 0.001–0.006 0.003 | 0.001–0.01 0.004 |
| Nb | 0.0004–0.0009 0.0006 | 0.0003–0.001 0.0008 | 0.0002–0.001 0.0006 | 0.0001–0.004 0.002 | 0.001–0.001 0.001 | 0.0002–0.002 0.001 |
| Mo | 0.4–0.8 0.6 | 0.4–0.9 0.6 | 0.2–0.7 0.4 | 0.06–0.56 0.25 | 0.15–1.8 0.7 | 0.09–12.5 2.6 |
| Ru | 0.001–0.0014 0.0012 | 0.0008–0.001 0.0009 | 0.001–0.003 0.002 | 0.0007–0.002 0.001 | 0.0008–0.002 0.001 | 0.0007–0.001 0.001 |
| Rh | 0.005–0.0014 0.001 | 0–0.001 0.0006 | 0.0006–0.0007 0.006 | 0.001–0.002 0.001 | 0.0008 −0.002 0.001 | 0.0004–0.002 0.001 |
| Pd | 0.0003–0.002 0.001 | 0–0.001 0.0006 | 0.0006–0.0007 0.0006 | 0.0005–0.003 0.002 | 0.0005–0.0015 0.0001 | 0.00005–0.0009 0.0006 |
| Ag | 0.0005–0.009 0.0006 | 0.0009–0.002 0.001 | 0.0005–0.0005 0.0005 | n.d. | 0.0005–0.0005 0.0005 | 0.003–0.003 0.003 |
| Cd | 0.0003–0.015 0.004 | 0.0006–0.009 0.0025 | 0.003–0.003 0.003 | 0.001–0.03 0.006 | 0.002–0.007 0.004 | 0.002–0.009 0.005 |
| In | 0.0001–0.0002 0.0002 | 0.0001–0.0002 0.0002 | 0.0001–0.0002 0.0002 | 0.0001–0.0002 0.0001 | 0.0003–0.0003 0.0003 | n.d. |
| Sn | 0.0006–0.003 0.001 | 0.002–0.006 0.004 | 0.001–0.003 0.002 | 0.001–0.006 0.002 | 0.0002–0.004 0.002 | 0.0005–0.004 0.001 |
| Sb | 0.001–0.004 0.003 | 0.0004–0.013 0.008 | 0.002–0.016 0.005 | 0.005–0.004 0.003 | 0.005–0.01 0.008 | 0.003–0.02 0.0008 |
| I | 8.9–37.8 16.3 | 1.9–5.5 4.4 | 3.9–18.5 11.6 | 4.4–7.7 5.9 | 0.4–3.3 1.9 | 0.6–8.3 3.2 |
| Cs | 0.001–0.005 0.001 | 0.001–0.003 0.002 | 0.001–0.003 0.002 | 0.000–0.001 0.0005 | 0.002–0.003 0.0025 | 0.001–0.003 0.002 |
| Ba | 0.2–0.3 0.3 | 0.5–1.3 0.8 | 0.4–1.3 0.6 | 0.1–0.3 0.4 | 0.3–0.6 0.4 | 0.2–0.7 0.4 |
| La | 0.0001–0.0008 0.0004 | 0.00005–0.0004 0.0002 | 0.0001–0.0003 0.0002 | 0.0002–0.0004 0.0003 | 0.0001–0.0004 0.0003 | 0.0002–0.0002 0.0002 |
| Ce | 0.0003–0.0016 0.0008 | 0.0001–0.0005 0.0001 | 0.0001–0.0004 0.0003 | 0.0002–0.0008 0.0004 | n.d. | 0.0001–0.0002 0.0001 |
| Pr | 0.0001–0.0004 0.0002 | 0.0001–0.0002 0.0001 | n.d. | 0.00004–0.0002 0.0001 | n.d. | 0.0001–0.0002 0.0001 |
| Nd | 0.0008–0.003 0.001 | n.d. | n.d. | 0.0005–0.0006 0.0005 | n.d. | n.d. |
| Eu | 0.0001–0.0001 0.0001 | 0.0001–0.0002 0.0002 | n.d. | 0.0001–0.0001 0.0001 | 0.0001–0.0001 0.0001 | 0.0001–0.0001 0.0001 |
| Tb | 0.0001–0.0001 0.0001 | 0.0001–0.0001 0.0001 | n.d. | 0.0001–0.0001 0.0001 | n.d. | 0.0001–0.0001 0.0001 |
| Ho | 0.00002–0.00005 0.00004 | 0.0001–0.0001 0.0001 | 0.0001–0.0001 0.0001 | 0.0001–0.0001 0.0001 | n.d. | 0.0001–0.0002 0.0001 |
| Tm | n.d. | n.d. | 0.0001–0.0001 0.0001 | 0.00003–0.00003 0.00003 | 0.00003–0.00003 0.00003 | 0.00003–0.0001 0.0001 |
| Lu | n.d. | n.d. | n.d. | 0.0001–0.0002 0.0001 | n.d. | 0.0001–0.0001 0.0001 |
| Hf | n.d. | n.d. | n.d. | 0.0001–0.0005 0.0003 | n.d. | n.d. |
| Ta | 0.0002–0.0005 0.0004 | 0.00002–0.0002 0.0002 | 0.0001–0.0001 0.0001 | 0.00004–0.0002 0.0001 | n.d. | 0.0003–0.0004 0.0003 |
| W | 0.0002–0.0025 0.001 | 0.007–0.017 0.012 | 0.002–0.012 0.007 | 0.004–0.011 0.007 | 0.002–0.005 0.003 | 0.003–0.008 0.005 |
| Au | 0.0001–0.0006 0.0003 | 0.0001–0.0004 0.0002 | 0.0001–0.0006 0.0003 | 0.00002–0.0005 0.0002 | 0.0001–0.0003 0.0002 | 0.0003–0.0004 0.0003 |
| Hg | 0.0006–0.004 0.002 | 0.0005–0.0005 0.0005 | 0.0001–0.0001 0.0001 | 0.001–0.006 0.004 | 0.002–0.002 0.002 | 0.0001–0.002 0.001 |
| Tl | 0.0002–0.0002 0.0002 | 0.0003–0.0007 0.0006 | 0.0001–0.0001 0.0001 | 0.0001–0.0006 0.0003 | n.d. | n.d. |
| Pb | 0.0008–0.005 0.003 | 0.0009–0.004 0.003 | 0.002–0.007 0.005 | 0.0002–0.005 0.003 | 0.001–0.003 0.002 | 0.001–0.004 0.003 |
| Bi | n.d. | 0.0001–0.0004 0.0002 | n.d. | n.d. | 0.0001 | 0.0001–0.0002 0.0001 |
| Th | 0.00001–0.0002 0.0001 | 0.00001–0.0002 0.0001 | 0.0001–0.0002 0.0002 | 0.00001–0.0002 0.0001 | 0.0001–0.0006 0.0003 | 0.00005–0.0002 0.0001 |
| U | 0.003–0.018 0.013 | 0.004–0.016 0.01 | 0.0012–0.023 0.009 | 0.01–0.07 0.02 | 0.02–0.04 0.03 | 0.007–0.12 0.04 |
Underline, 0.08–0.13: Min–Max; 0.01: Average; n.d.—no data.
Publisher’s Note: MDPI stays neutral with regard to jurisdictional claims in published maps and institutional affiliations. |
© 2021 by the authors. Licensee MDPI, Basel, Switzerland. This article is an open access article distributed under the terms and conditions of the Creative Commons Attribution (CC BY) license (http://creativecommons.org/licenses/by/4.0/).
Share and Cite
MDPI and ACS Style
Guseva, N.; Moiseeva, Y.; Purgina, D.; Gershelis, E.; Yakushev, E.; Semiletov, I. The Impact of Methane Seepage on the Pore-Water Geochemistry across the East Siberian Arctic Shelf. Water 2021, 13, 397. https://doi.org/10.3390/w13040397
AMA Style
Guseva N, Moiseeva Y, Purgina D, Gershelis E, Yakushev E, Semiletov I. The Impact of Methane Seepage on the Pore-Water Geochemistry across the East Siberian Arctic Shelf. Water. 2021; 13(4):397. https://doi.org/10.3390/w13040397
Chicago/Turabian StyleGuseva, Natalia, Yulia Moiseeva, Darya Purgina, Elena Gershelis, Evgeniy Yakushev, and Igor Semiletov. 2021. "The Impact of Methane Seepage on the Pore-Water Geochemistry across the East Siberian Arctic Shelf" Water 13, no. 4: 397. https://doi.org/10.3390/w13040397
Note that from the first issue of 2016, this journal uses article numbers instead of page numbers. See further details here.