
The Spatiotemporal Patterns and Interrelationships of Snow Cover and Climate Change in Tianshan Mountains


1
College of Water and Architectural Engineering, Shihezi University, Shihezi 832003, China
2
Xinjiang Production and Construction Group Key Laboratory of Modern Water-Saving Irrigation, Shihezi 832003, China
*
Author to whom correspondence should be addressed.
Water 2021, 13(4), 404; https://doi.org/10.3390/w13040404
Submission received: 11 December 2020
/
Revised: 19 January 2021
/
Accepted: 1 February 2021
/
Published: 4 February 2021
(This article belongs to the Special Issue Managing Climate Risks to Water Security)
Abstract
:To reveal the spatiotemporal patterns of the asymmetry in the Tianshan mountains’ climatic warming, in this study, we analyzed climate and MODIS snow cover data (2001–2019). The change trends of asymmetrical warming, snow depth (SD), snow coverage percentage (SCP), snow cover days (SCD) and snow water equivalent (SWE) in the Tianshan mountains were quantitatively determined, and the influence of asymmetrical warming on the snow cover activity of the Tianshan mountains were discussed. The results showed that the nighttime warming rate (0.10 °C per decade) was greater than the daytime, and that the asymmetrical warming trend may accelerate in the future. The SCP of Tianshan mountain has reduced by 0.9%. This means that for each 0.1 °C increase in temperature, the area of snow cover will reduce by 5.9 km2. About 60% of the region’s daytime warming was positively related to SD and SWE, and about 48% of the region’s nighttime warming was negatively related to SD and SWE. Temperature increases were concentrated mainly in the Pamir Plateau southwest of Tianshan at high altitudes and in the Turpan and Hami basins in the east. In the future, the western and eastern mountainous areas of the Tianshan will continue to show a warming trend, while the central mountainous areas of the Tianshan mountains will mainly show a cooling trend.
1. Introduction
Snow cover, as an important part of the meteorological system, is sensitive to changes in the climate and ecology [1,2], and it is an important source of supply for glacier runoff in arid areas [3,4]. The spatiotemporal changes of snow in mountainous areas not only affect global climate and hydrological changes, but also affect agricultural–livestock production in the lower reaches of oases and the safety of the surrounding ecological environment [5,6]. The Tianshan mountains lie in the hinterland of Asia, including 15,953 glaciers with an area of 10,101 km2 [7,8,9], and are located in the widest arid zone of the world’s landmass [10,11]. Since the 1980s, the Tianshan mountains have shown a warming and wetting trend [12,13]. It is noteworthy that the terrestrial ecosystem is undergoing a warming process [14,15]. Snow cover is the most sensitive factor in response to complex climate change in the cryosphere, and it is also the material basis for glacier accumulation [16,17]. The freezing and melting of Tianshan snow due to regional climate change directly affects the stability of water resources and inland ecosystems in arid areas [18]. Therefore, it is of great significance to research the spatiotemporal changes of snow cover and its response to climate factors in the Tianshan mountain area, which is of great significance to understand the regional hydrological response law and water resource management practices against the background of climate change.
At present, the research on snow and climate change mainly focuses on snow cover spatiotemporal sequences and local area meteorological observation analysis [19,20,21,22]. Due to the different data sources or research periods in numerous studies [23,24,25], there are different opinions on the trend of snow cover in the Tianshan mountains in the context of climate change. Li et al. [26] showed that the temperature in the Tianshan mountains has not increased continuously in the past decade but has remained high and volatile. Li et al. [27] found that snow cover days (SCD) in the Tianshan mountains have shown a significant shortening trend, but there is no obvious increasing trend in low- and middle-altitude areas. Wang et al. [28] showed that the snow cover amount of the Tianshan mountains was the largest in the hydrological year 2001–2002 and was smallest in 2005–2006. Some scholars believe that, in the context of global warming, mountain glaciers in the northern hemisphere are generally showing a trend of accelerated retreat [29,30]. Tang et al. [30] analyzed the spatiotemporal changes of snow cover in different sub–regions of the Tianshan mountains from 2001 to 2015 by using a MODIS product after cloud removal and the station meteorological data and pointed out that the snow area of middle and eastern Tianshan mountains showed a decreasing trend, and that temperature was the main factor affecting the snow area. Aizen et al. [31] noted that the snow cover amount in the western Tianshan mountains has been continuously decreasing, with the maximum snow depth (SD) and SCD decreasing by an average of 10 cm and 9 days, respectively. Brodzik et al. [32] similarly argued that the northern hemisphere snow cover is showing a decreasing trend. It can be seen that previous researchers mostly used the station snow cover and meteorological data or spatial MODIS to study the snow cover and its response to climate change in the Tianshan mountains and have made some achievements [29,33]. So far, however, previous studies have failed to consider the climate factors that influence snow cover. There has been little discussion about the effects of asymmetrical warming on snow cover spatiotemporal sequences, especially for the Tianshan glaciers. The weather stations in the Tianshan mountains are mostly distributed below 2500 m above sea level. Influenced by local circulation, the spatiotemporal natures of snow cover and meteorological elements show significant differences. Low-altitude meteorological data cannot interpret the distribution of snow cover in the high-altitude Tianshan mountains; thus, there is a need for research into spatiotemporal correlation based on spatial snow cover information and climate warming.
Most of the moisture in the Tianshan mountains comes from the Atlantic Ocean, which is imported from west to east with the air flow, and the rest comes from the Arctic Ocean, which is imported from the western mountains of the Junggar Basin [30,34]. The difference of moisture input may cause the significant differences in the arid climate in the northern and southern Tianshan mountains, especially the temperature, precipitation, and soil, thus forming a natural ecosystem composed of alpine glaciers, alpine cold meadows, mid montane moist forests, semi-arid grassland and arid desert in plain areas [35,36]. In view of this, the primary aim of this paper is to explore the relationship between asymmetrical warming and snow cover. In the context of global asymmetrical warming, this paper was based on a MODIS snow cover dataset (MOD10A2), minimum (Tmin) and maximum temperature (Tmax) data and precipitation data in Tianshan mountains from 2001 to 2019. A least squares linear regression and second-order partial correlation analysis were used to study the spatiotemporal patterns of daytime and nighttime warming and the response of snow cover to asymmetrical warming. The objective of this study was to provide a basis for a reasonable response to climate change in the Tianshan mountains.
2. Materials and Methods
2.1. Site Description
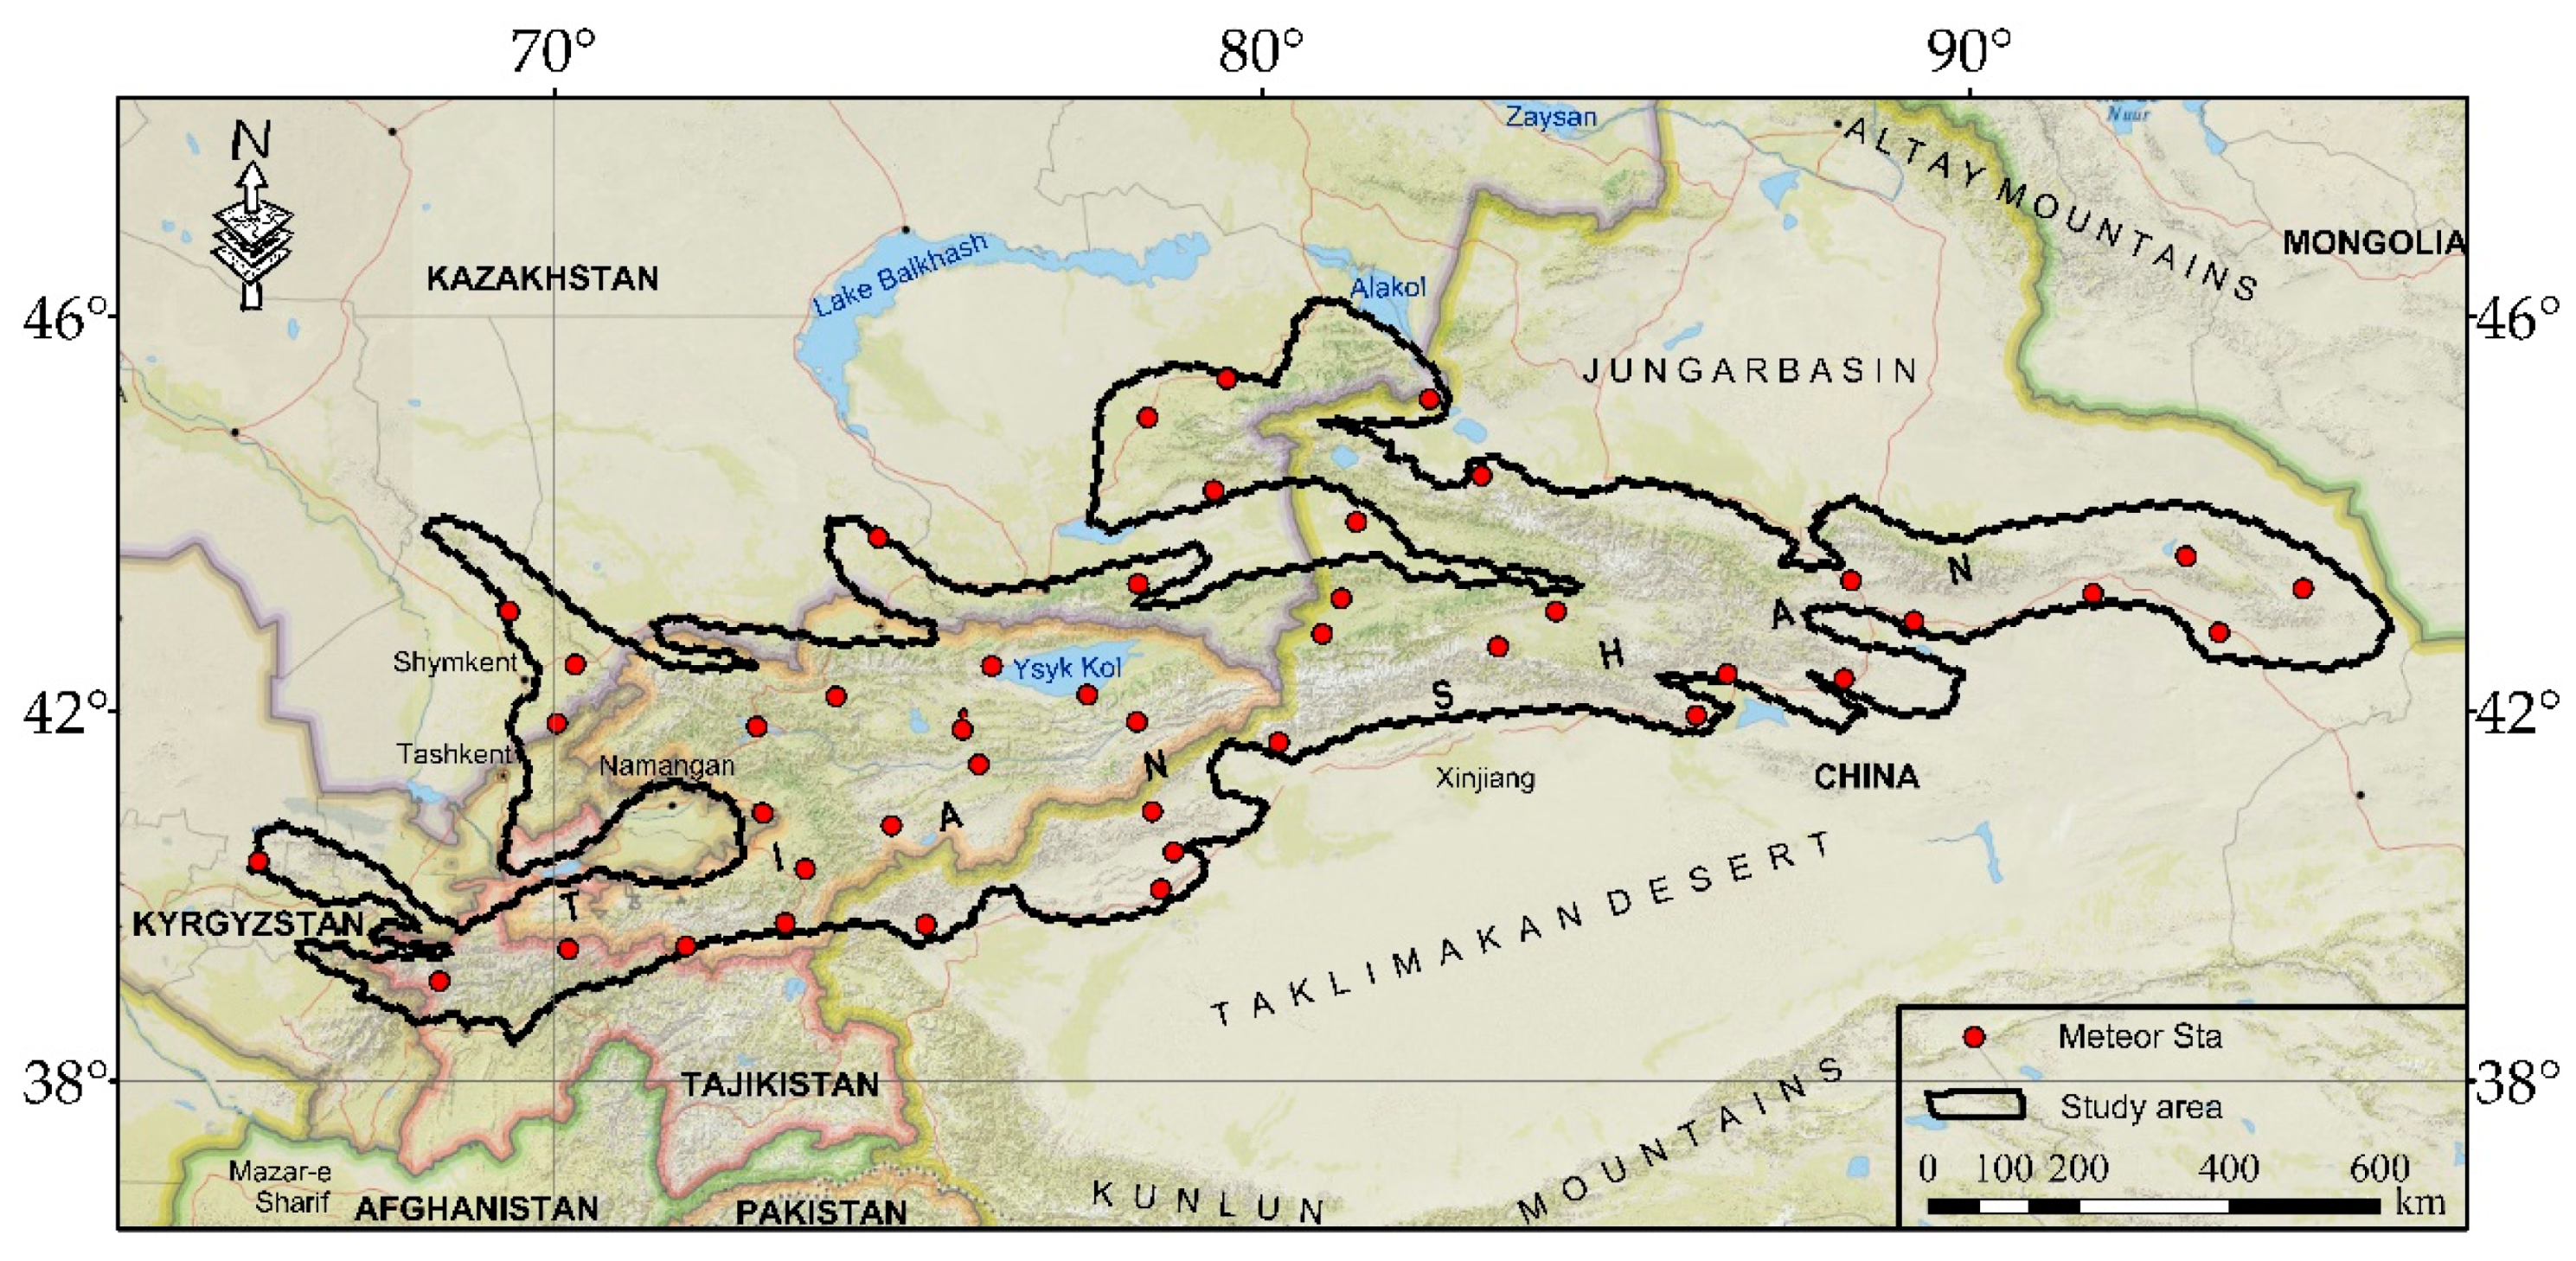
Tianshan (65°83′–96°23′ E and 39°11′–46°10′ N) belongs to the central Asian mountains (Figure 1). From Kyzylkum in Uzbekistan to the west, the area has a temperate, desert steppes climate; in the east to the Turpan–Hami Basin in China, it has a temperate continental climate. The area’s width is about 2500 km east to west [37,38,39,40,41]; the northern end is bordered by the Geer basin and the South Kazakhstan plain, with a temperate desert climate. The southern end intersects the Tarim basin and Gissar-Alay mountains, has a warm temperate desert climate, and the average north to south width is about 500 km. The total area of the Tianshan mountains is approximately 1 million km2 [42,43]. The lowest elevation is at Aiding Lake (–154 m) in the eastern part of the Tianshan mountains, and the highest elevation is at Tuomuer Peak (7443 m), with an average altitude of 4000 m. The temperature extremes are between –50 °C (Aksai Valley) and 27 °C (Fergana Basin). The precipitation extremes are between 9 mm (Toksun County, Xinjiang, China) and 790 mm (Ili Valley, China) [44].
2.2. Data Sources
The meteorological data were obtained from the dataset of monthly surface climate data of the Meteorological Data Sharing Service System (http://cdc.cma.gov.cn). The data sources include the ground observation station data files obtained by the communication system within China and the message data of global ground observation sites collected by the global communication system. It includes the maximum daytime temperature (Tmax), the minimum nighttime temperature (Tmin), precipitation, wind speed, and pressure, etc. Observed data of 44 meteorological stations in Tianshan mountains from 2001 to 2019 were selected, all data were carefully tested for continuity and homogeneity [45,46,47]. The Kriging method in ArcGIS 10.4 was used for the spatial interpolation of meteorological factors to obtain meteorological data and raster images of the whole research area. Surface digital elevation messages (DEM) was derived from Global 30 Arc-Second Elevation data (GTOPO30).
Snow cover data includes snow depth (SD), snow coverage percentage (SCP), snow cover days (SCD) and snow water equivalent (SWE). Of which snow coverage percentage (SCP) and snow cover days (SCD) were derived from MOD10A2 dataset (https://nsidc.org/data/MOD10A2/versions/6). The data set was based on Moderate-Resolution Imaging Spectroradiometer (MODIS) on Terra satellite to collect reflectance of visible light band and near-infrared bands to monitor snow cover. The spatial resolution was 500 m and synthesized by the maximum value synthesis method (MVC) and processed by cloud, aerosol, water vapor, etc.; it was the longest time series currently acquired by the Terra satellite. As well as monthly means and climatologies of snow depth (SD) and snow water equivalent (SWE) dataset was from the Canadian meteorological center (CMC, https://nsidc.org/data/ NSIDC-0447/versions/1). This dataset consists of a Northern Hemisphere subset of the operational global daily snow cover analysis, and the spatial resolution was 1/3° Gaussian, snow depth analysis was performed using real-time, in-situ daily snow depth observations.
2.3. Research Methods
The least square linear regression method was applied to analyze the trend of day and nighttime warming and snow cover [48,49]. The significance of regression coefficients was determined by the t test (a p value of 0.05 indicated significant; a p value of 0.01 indicated extremely significant). The diurnal warming rate was calculated element-by-element, and the spatiotemporal patterns of the day and nighttime warming and snow cover in different seasons were analyzed.
where is the time series, ranging from 2001 to 2019 a; is the specified factor, including SD, SCP, SWE, Tmin, and Tmax; is the change tendency rate of the pixel over 20 years, where > 0 indicates that the factor of pixel has an increasing trend in the past 20 years, 0 indicates a decreasing trend, and 0 indicates no change. The F test was used to judge the significance level of change in the trend. The Pearson correlation analysis was used to analyze the relationship between day and nighttime warming and snow cover. The correlation coefficient and significance of each factor were calculated to reflect the correlation between snow cover and temperature warming (Equation (2)).
where , are correlation coefficients; , are the sample mean values; the linear correlation coefficient R is between [–1,1], and the larger the absolute of R value, the stronger the correlation. An > 0.5 indicates a significant correlation, and 0.3 indicates a weak correlation.
To eliminate the interference of other variables except temperature and precipitation, the second-order partial correlation analysis was used to investigate the influence of day and nighttime warming on snow cover [50,51]. First, the second-order partial correlation between Tmax and snow cover was analyzed by limiting the influence of Tmin and surface elevation; second, the second-order partial correlation between Tmin and snow cover was analyzed by limiting the influence of Tmax and surface elevation. The second-order partial correlation coefficient was calculated based on the first-order partial correlation coefficient, and the first-order correlation coefficient needed to be calculated for the Pearson’s correlation coefficient (zero-order). The partial correlation coefficients were calculated as follows:
where and are the principal variables of the partial correlation coefficients; 1 and 2 are control variables; is the correlation coefficient; is the first-order partial correlation coefficient; is the second-order partial correlation coefficient. A t test is used to test the significance of the calculated second-order partial correlation coefficient. The equation is as follows:
where is the correlation coefficient and and are the number of samples and degrees of freedom.
3. Results
3.1. The Spatiotemporal Evolution Characteristics of Snow Cover
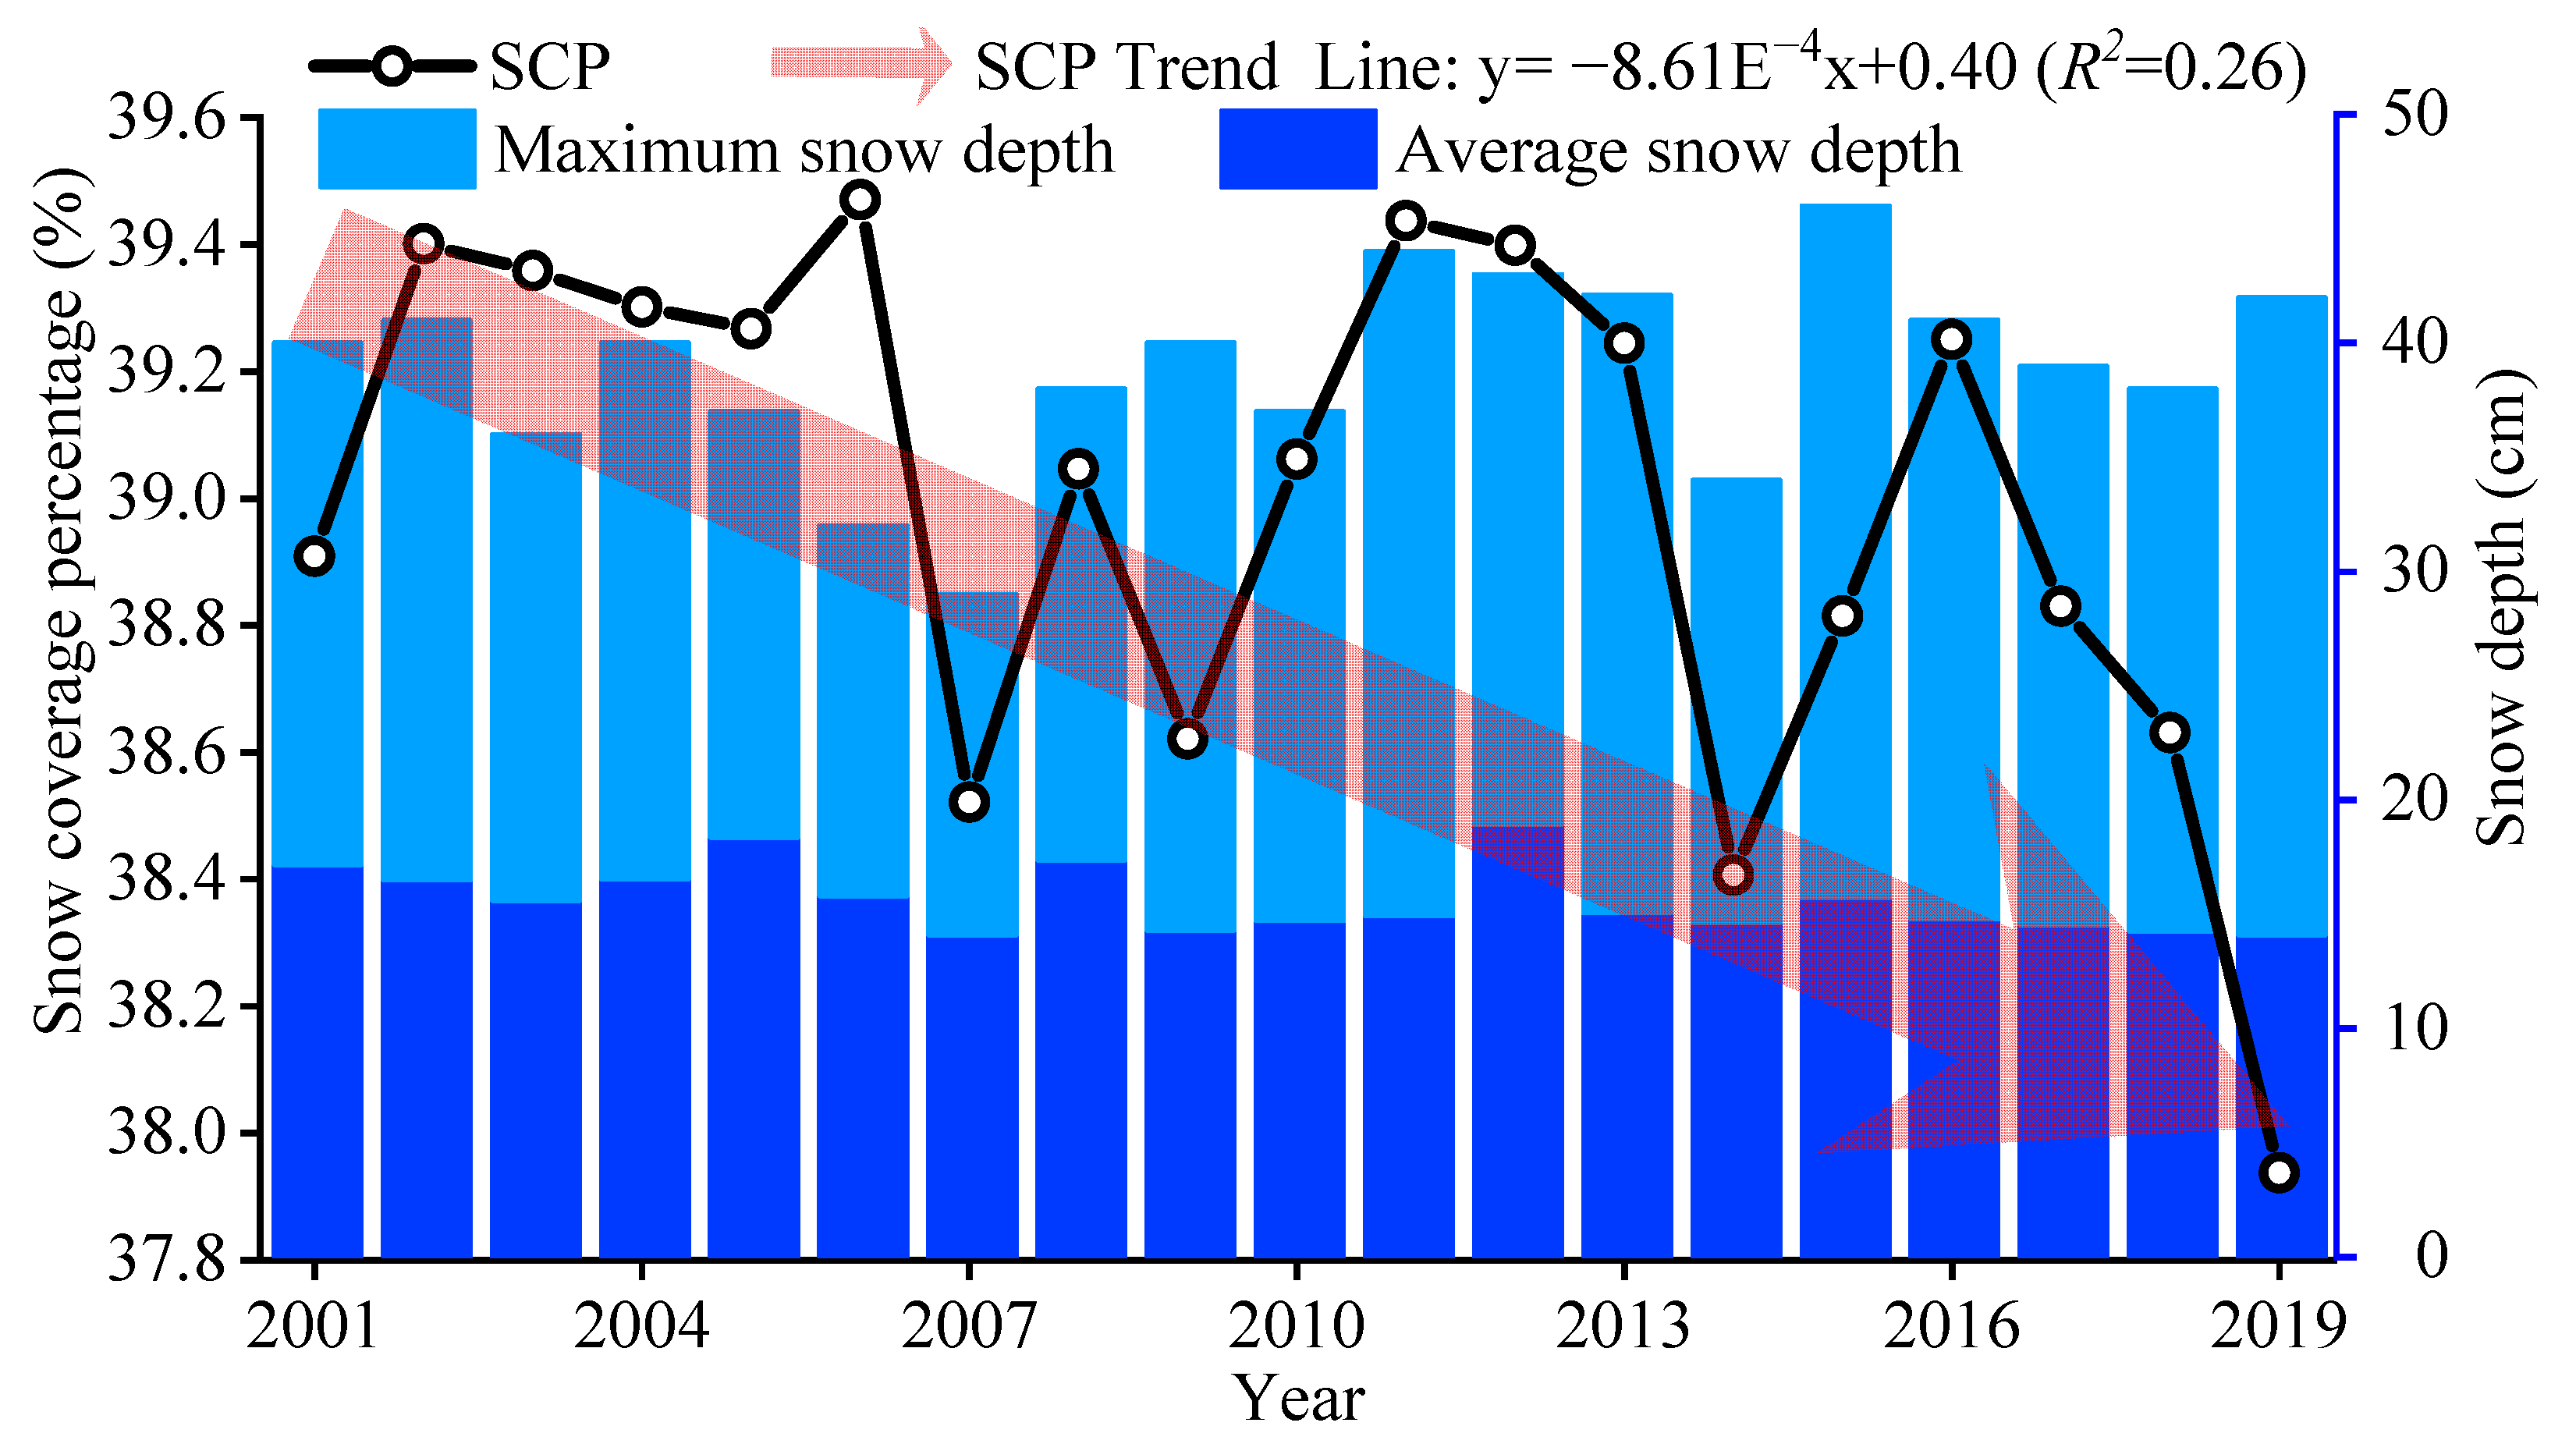
The interannual variation trend of SCP and SD was calculated by a linear regression equation (Figure 2). From 2001 to 2019, the SCP of Tianshan mountains showed a small change over time, with an annual average decrease of 0.047% (4.75 km2). SCP fluctuated greatly between typical years; for instance, from 2006 to 2007, SCP decreased by 1% (101 km2) annually, and from 2007 to 2008, SCP increased by 0.5% (50.5 km2) annually. Except for the SCP decrease of less than 0.1% in 2002, 2003, 2004, 2005 and 2011, the SCP decrease in other years exceeded 1.5%. The overall fluctuation range of the Tianshan mountains’ SD over time was smaller than that of SCP, with SD ranging from 14.1 to 18.9 cm, and the maximum snow depth was between 29.1 to 46.8 cm. Interestingly, the downward trend of the maximum snow depth in 2004, 2011 and 2015 had the same pattern. SD decreased consistently and continuously in these years. The rest of the year show irregular patterns.
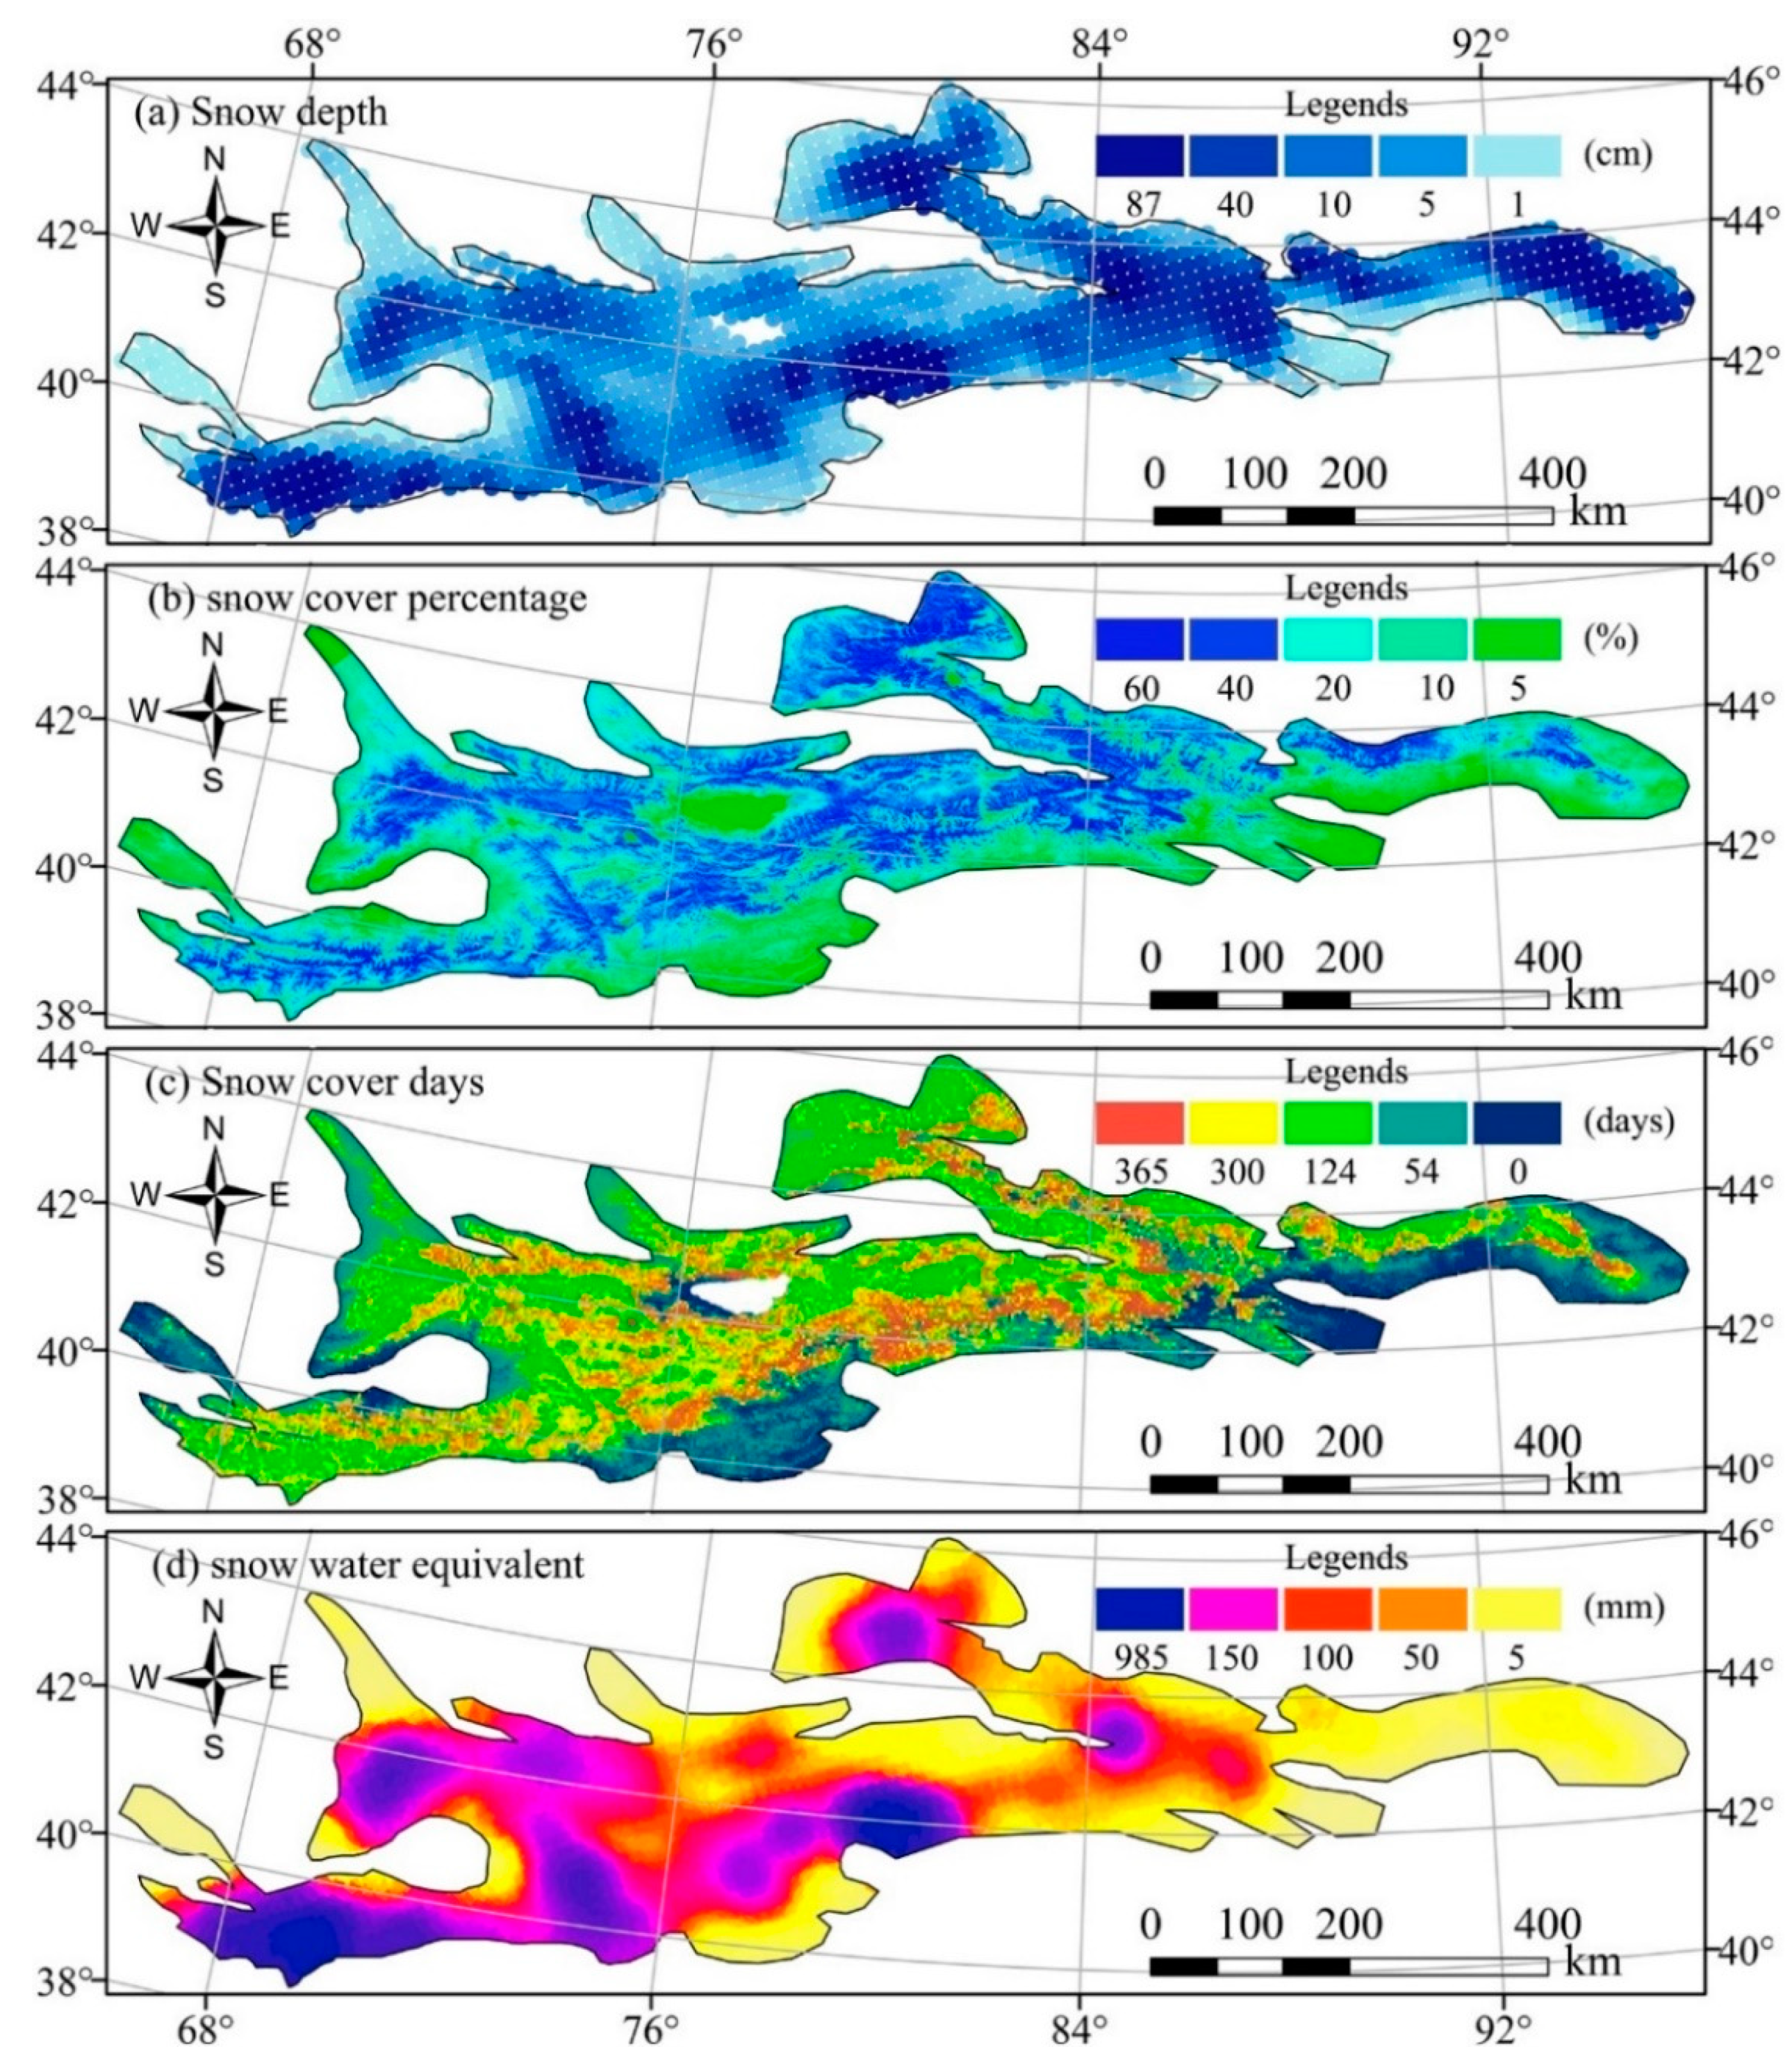
The spatial distributions of SD and SCD in the Tianshan mountains showed similar characteristics (Figure 3). Among them, the high-value areas with an SD 40 cm and SCD 300 days were mainly located in permanent snow and glacier-covered areas in high−altitude mountainous areas, accounting for 31 and 15% of the total area of the Tianshan mountains, respectively. The low−value areas with an SD 10 cm and SCD 54 days were mainly distributed at the edge of the permanent snow area, the Ili Valley and the southern foot of the Tianshan mountains, accounting for 25 and 18% of the total area of Tianshan mountains, respectively. The high-value of SCD fluctuated sharply. The high-value areas with an SCP > 60% occurred not only in the permanent snow areas of the high-altitude mountains, but also in areas with abundant seasonal snow cover in the northern foot of the Tianshan mountains, accounting for 9% of the total area of the Tianshan Mountains. This area is the main runoff-producing region. The SCD of Ili valley and the eastern and southern foot of the middle-low Tianshan mountains was less than 124 days, which was the most widely distributed area, accounting for 52% of the total area. The duration of snow cover in this area was relatively short, and it made a greater contribution to snowmelt runoff. The spatial distribution of snow water equivalent (SWE) was significantly different from that of SD, SCP and SCD. In general, the high-value areas with an SWE 150 mm were mainly concentrated between 67°35′ E to 85°17′ E longitude (western, central Tianshan mountains), The low-value areas for SWE were concentrated in the low-altitude eastern Tianshan mountains, mainly distributed in the Turpan and Hami basin margins [52].
3.2. The Spatiotemporal Evolution Trends in Asymmetric Warming Over Time
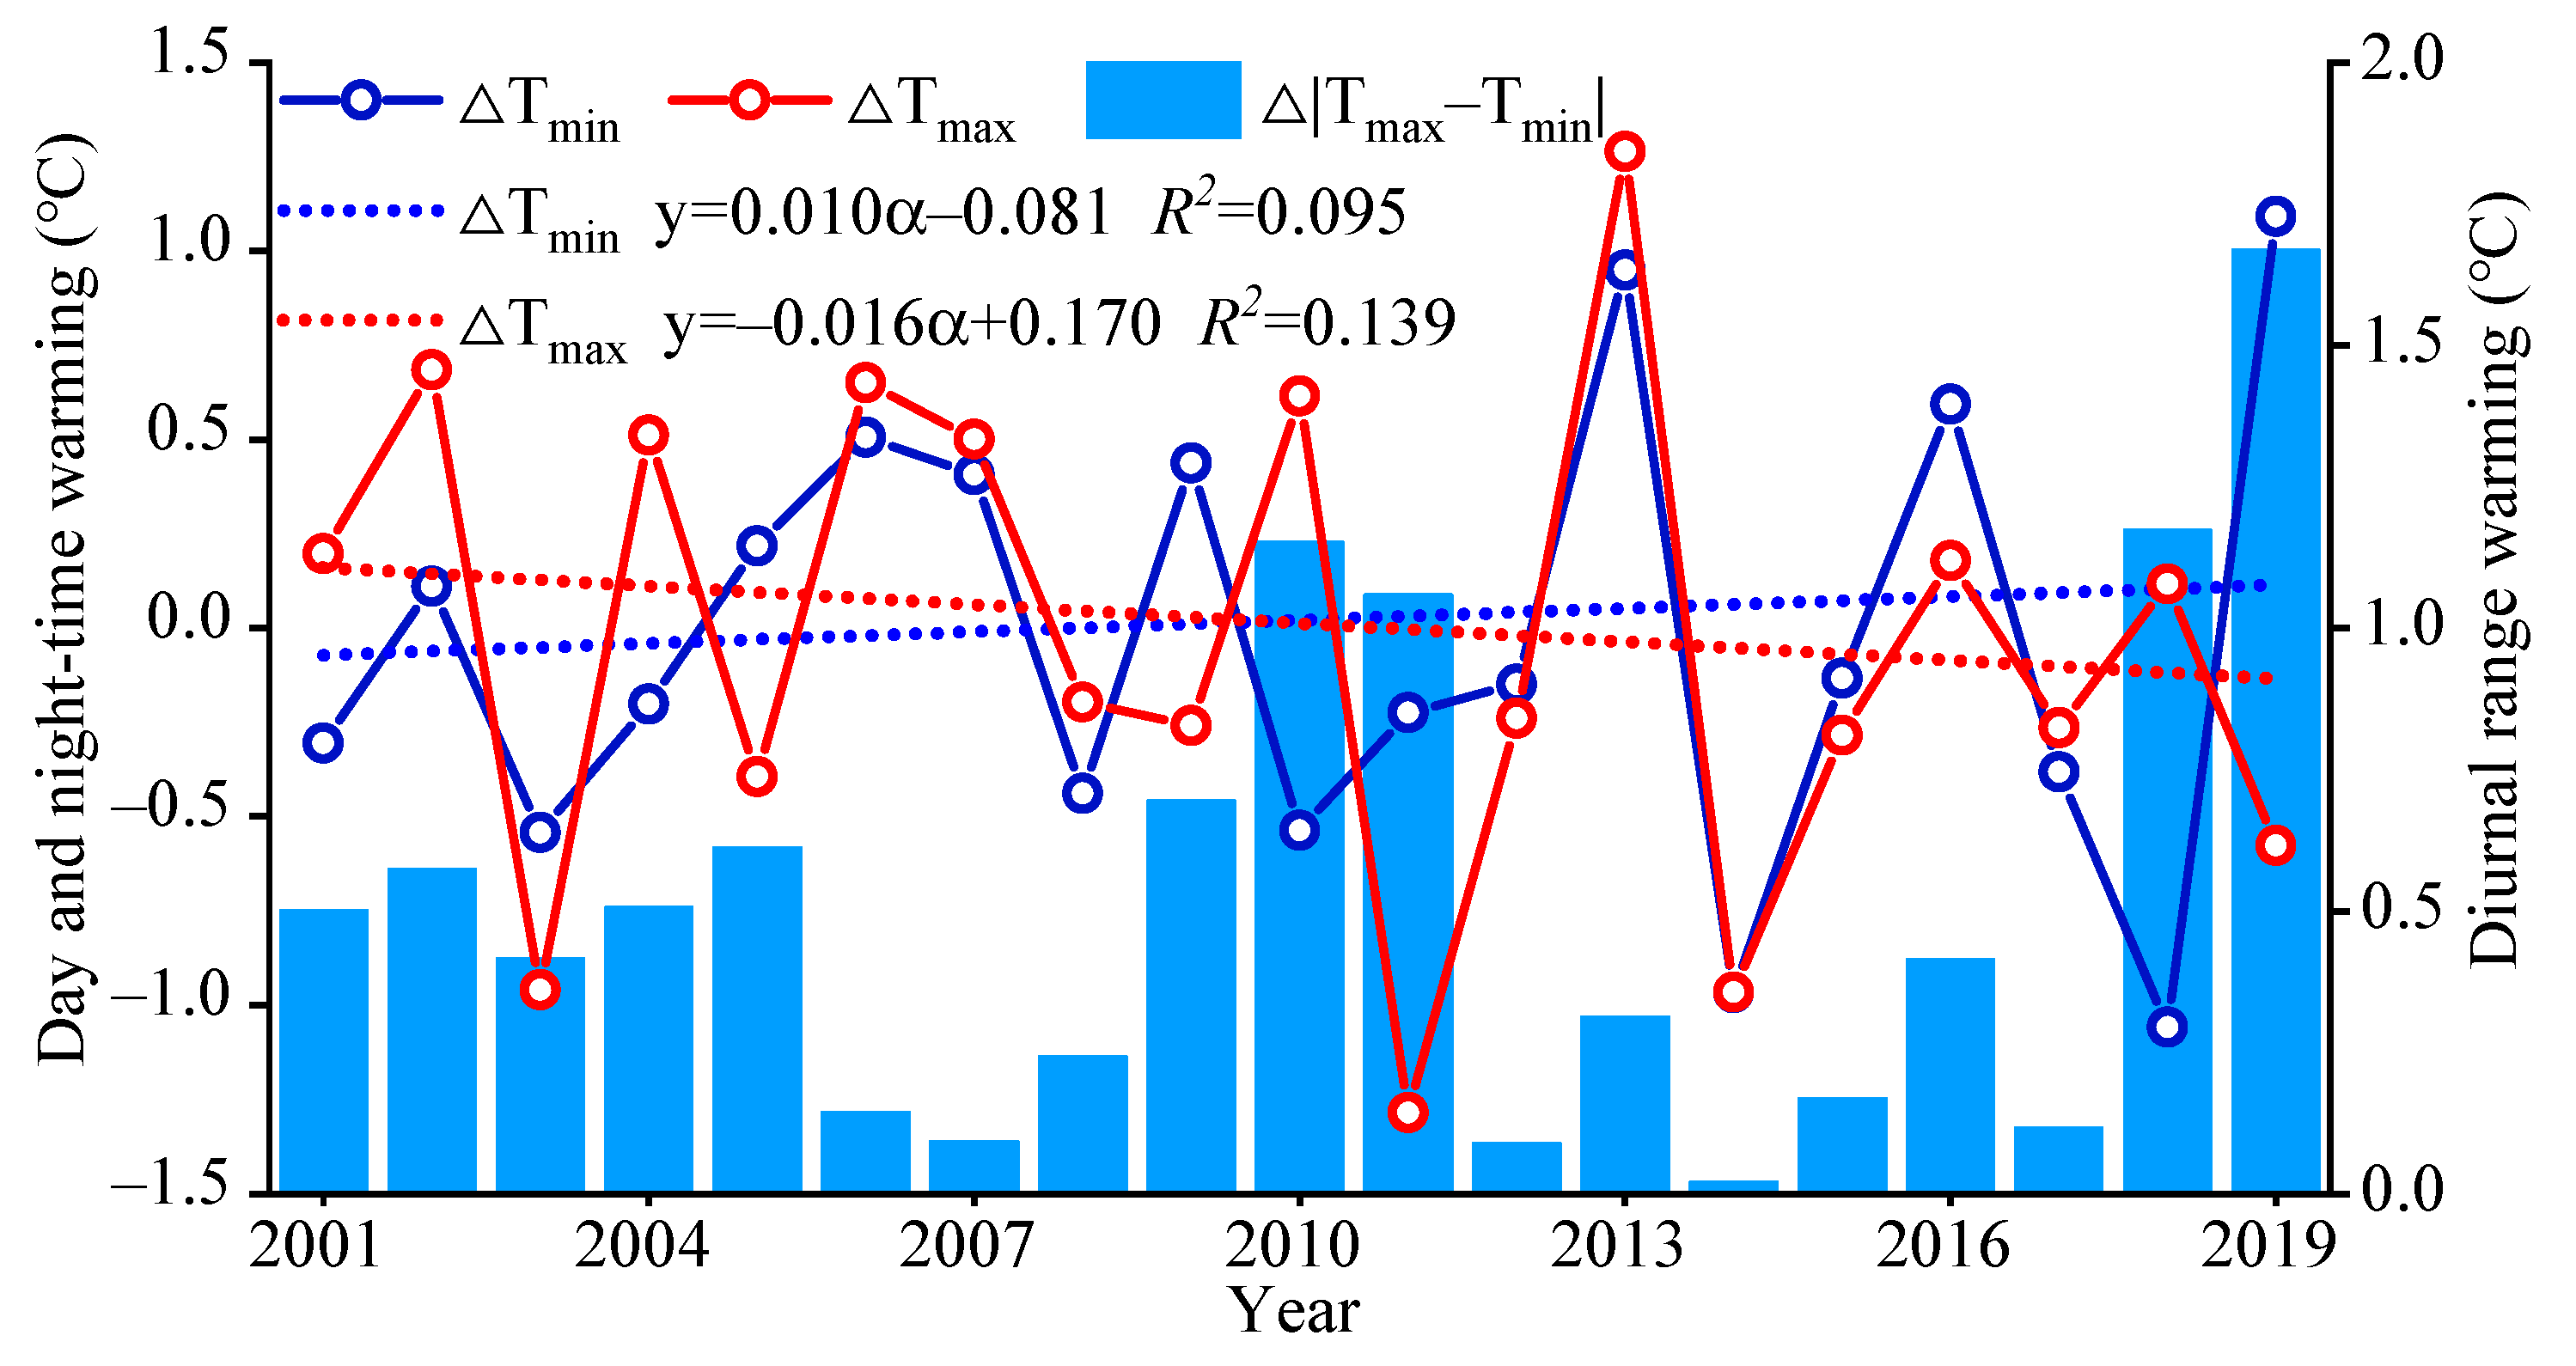
The interannual variation trend of maximum daytime temperature (Tmax) and minimum nighttime temperature (Tmin) was calculated by a linear regression equation (Figure 4). Over the past 20 years, Tmax and Tmin in the Tianshan mountains showed different degrees of warming trends. The warming rates of Tmax and Tmin were −0.16 and 0.10 °C per decade, respectively. The warming trend of Tmax from 2001 to 2010 was higher than the cooling trend of Tmin, and the warming rate of Tmax from 2011 to 2019 showed a negative value, which was specifically manifested in the fact that the cooling trend of Tmax was less than the warming trend of Tmin. In addition, the warming rate of Tmin was faster than Tmax only in the years of 2003, 2005, 2009, 2011, 2012, 2015, 2016 and 2019, and Tmin was less than Tmax in the remaining 11 years. The fluctuation range of the warming rate of Tmax [−1.26, 1.28] was greater than Tmin [−1.06, 1.09]. The minimum absolute value of Tmax and Tmin heating rate was in 2014 (0.06 °C), and the maximum absolute value was in 2019 (1.72 °C). Overall, the interannual Tmax and Tmin presented asymmetrical daytime and nighttime temperature warming. After 2010, Tmax showed a cooling trend, and Tmin showed a warming trend; i.e., the daytime cooling rates were faster than the nighttime warming rates.
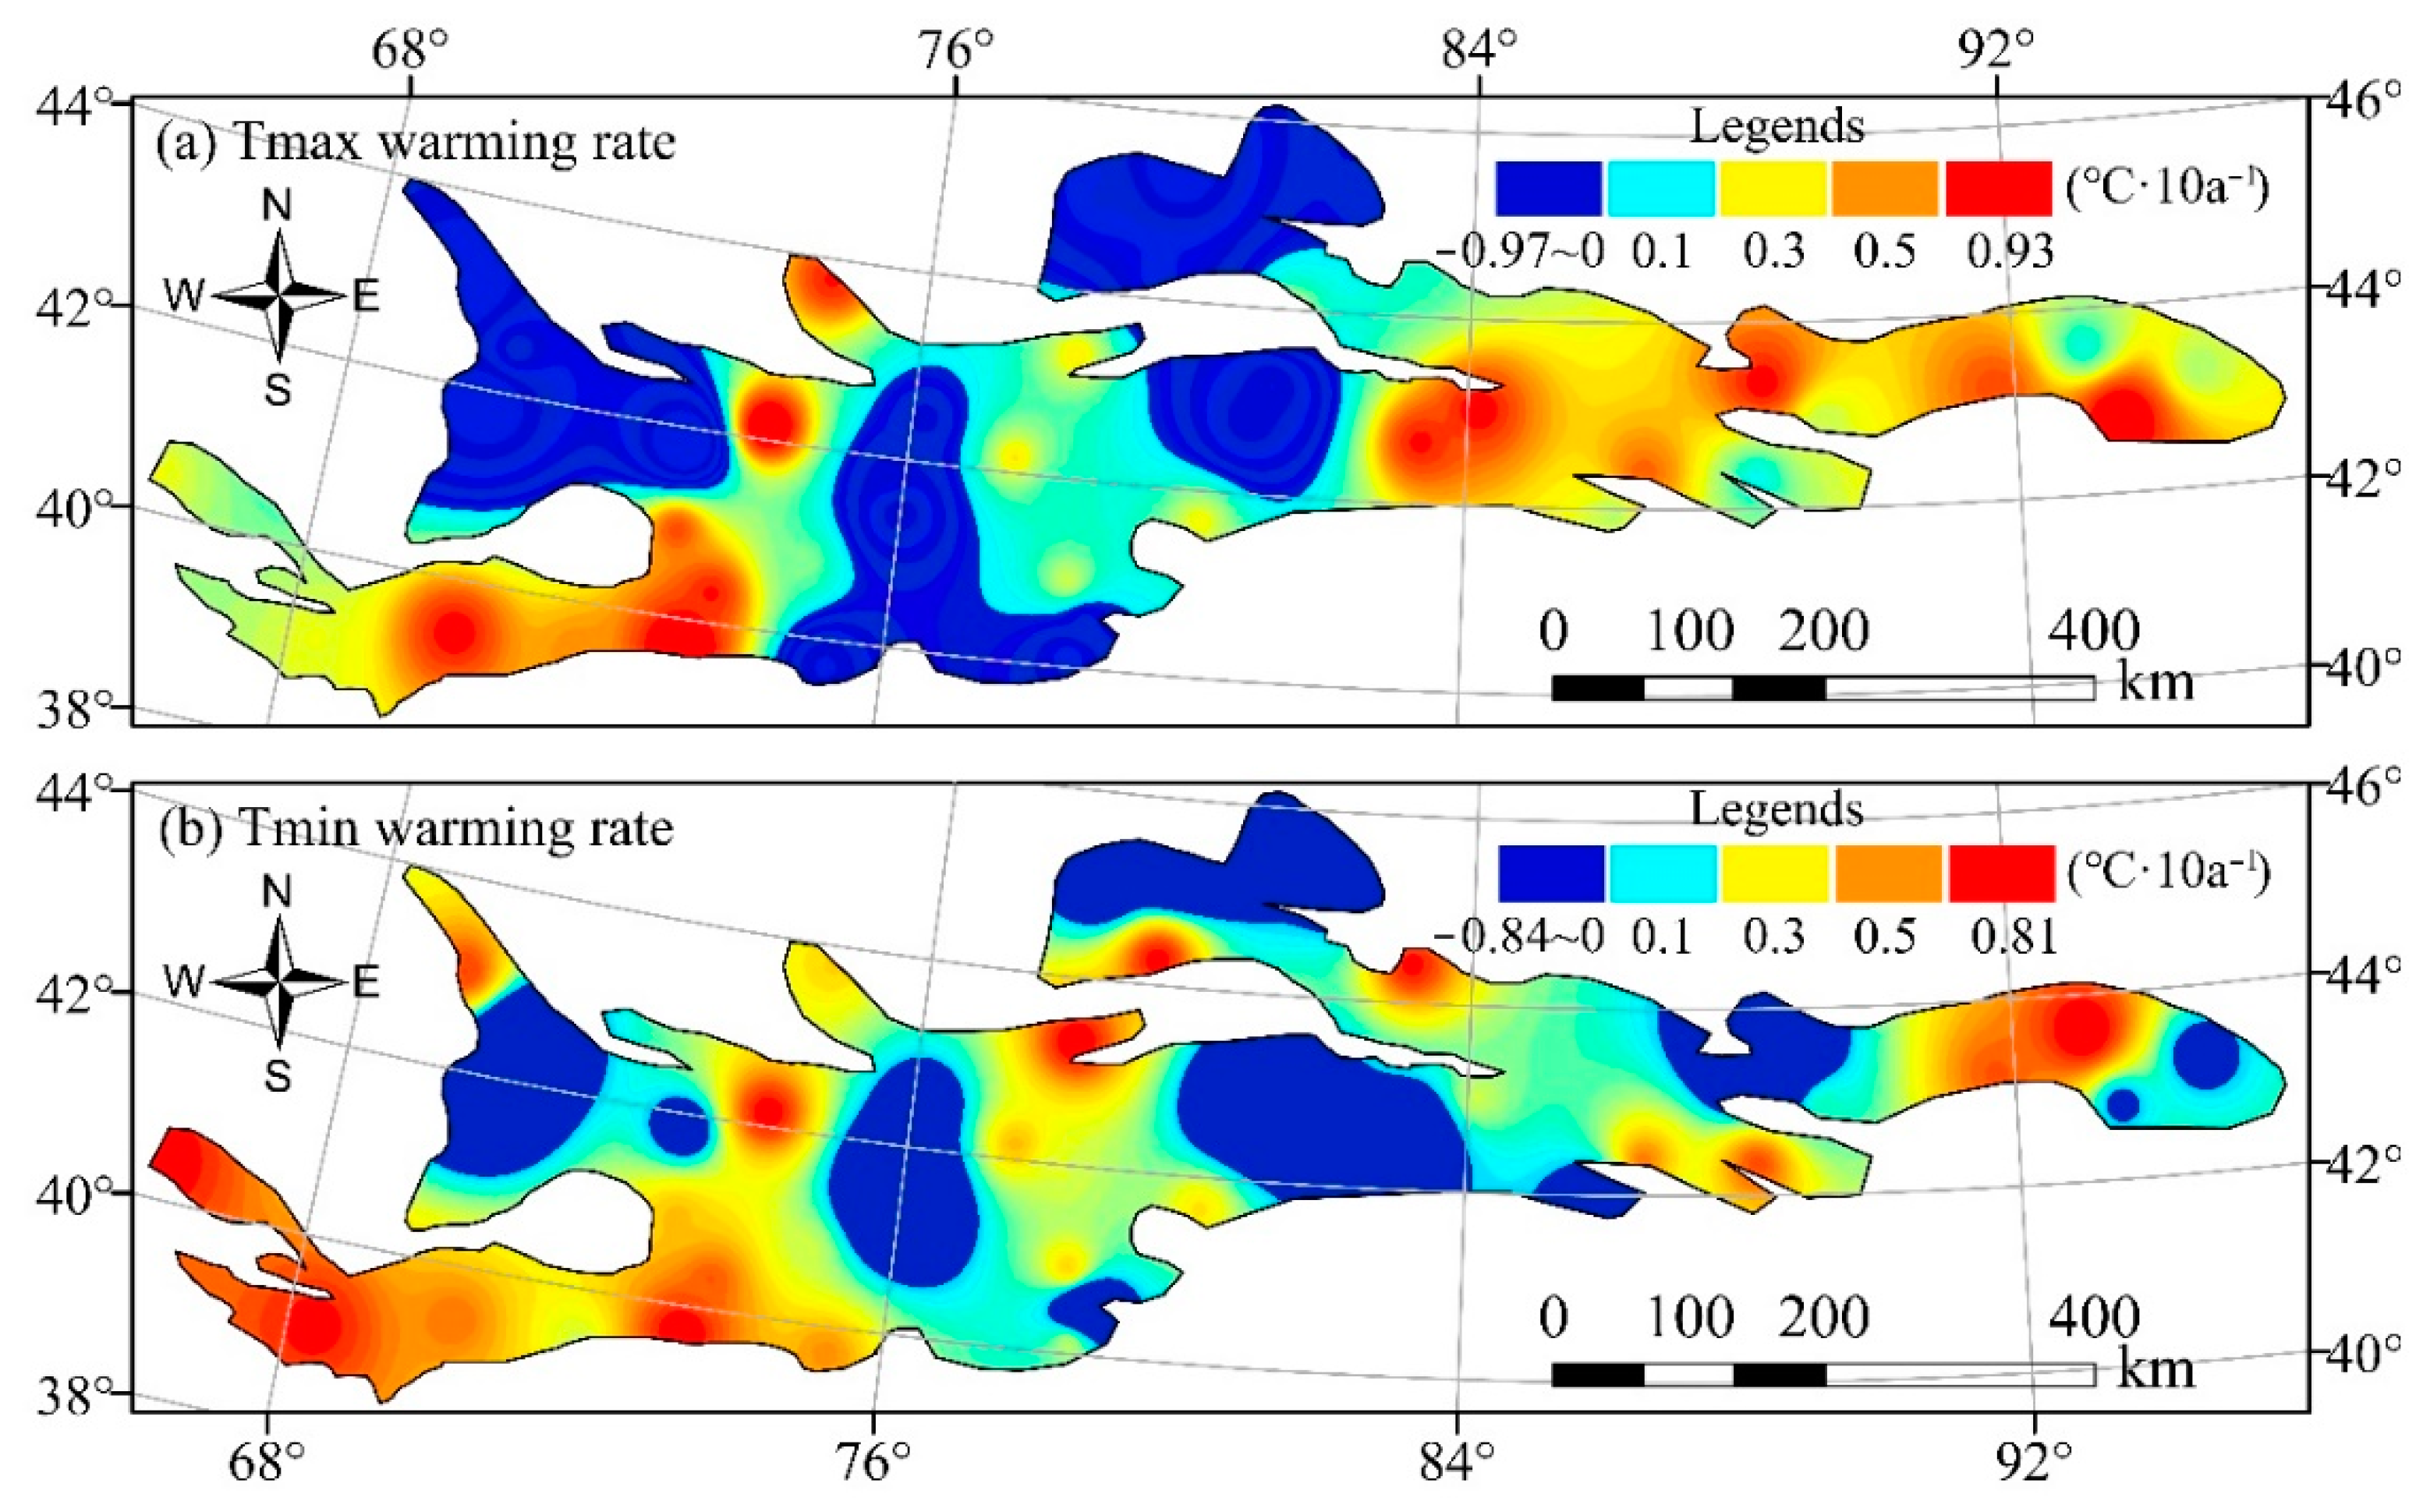
The warming rates of Tmax and Tmin in the Tianshan mountains from 2001 to 2019 were spatially inconsistent (Figure 5a,b). Specifically, the Tmax warming rate was between −0.97 to 0.93 °C per decade, and the Tmin warming rate was between −0.84 to 0.81 °C per decade. The warming rates in Tmax and Tmin both showed asymmetric trends, and areas in which Tmax had a cooling trend were more concentrated than Tmin. Among them, there were three areas of Tmax showing a cooling trend, namely in the Chirchiq River Valley, Pamir Plateau and Ili River Valley, mainly concentrated between 65°83′ E to 83°85′ E longitude; this area accounted for 17.7% of the total. There were 10 areas of Tmin showing a cooling trend; the westernmost side was the Chatkal mountains, and the easternmost side was the Hami Basin, and this area accounted for 13.1% of the total. Furthermore, Tmax and Tmin showed a cooling trend in the Gurbantunggut desert plain.
3.3. Correlation Analysis between Snow Cover and Asymmetric Warming
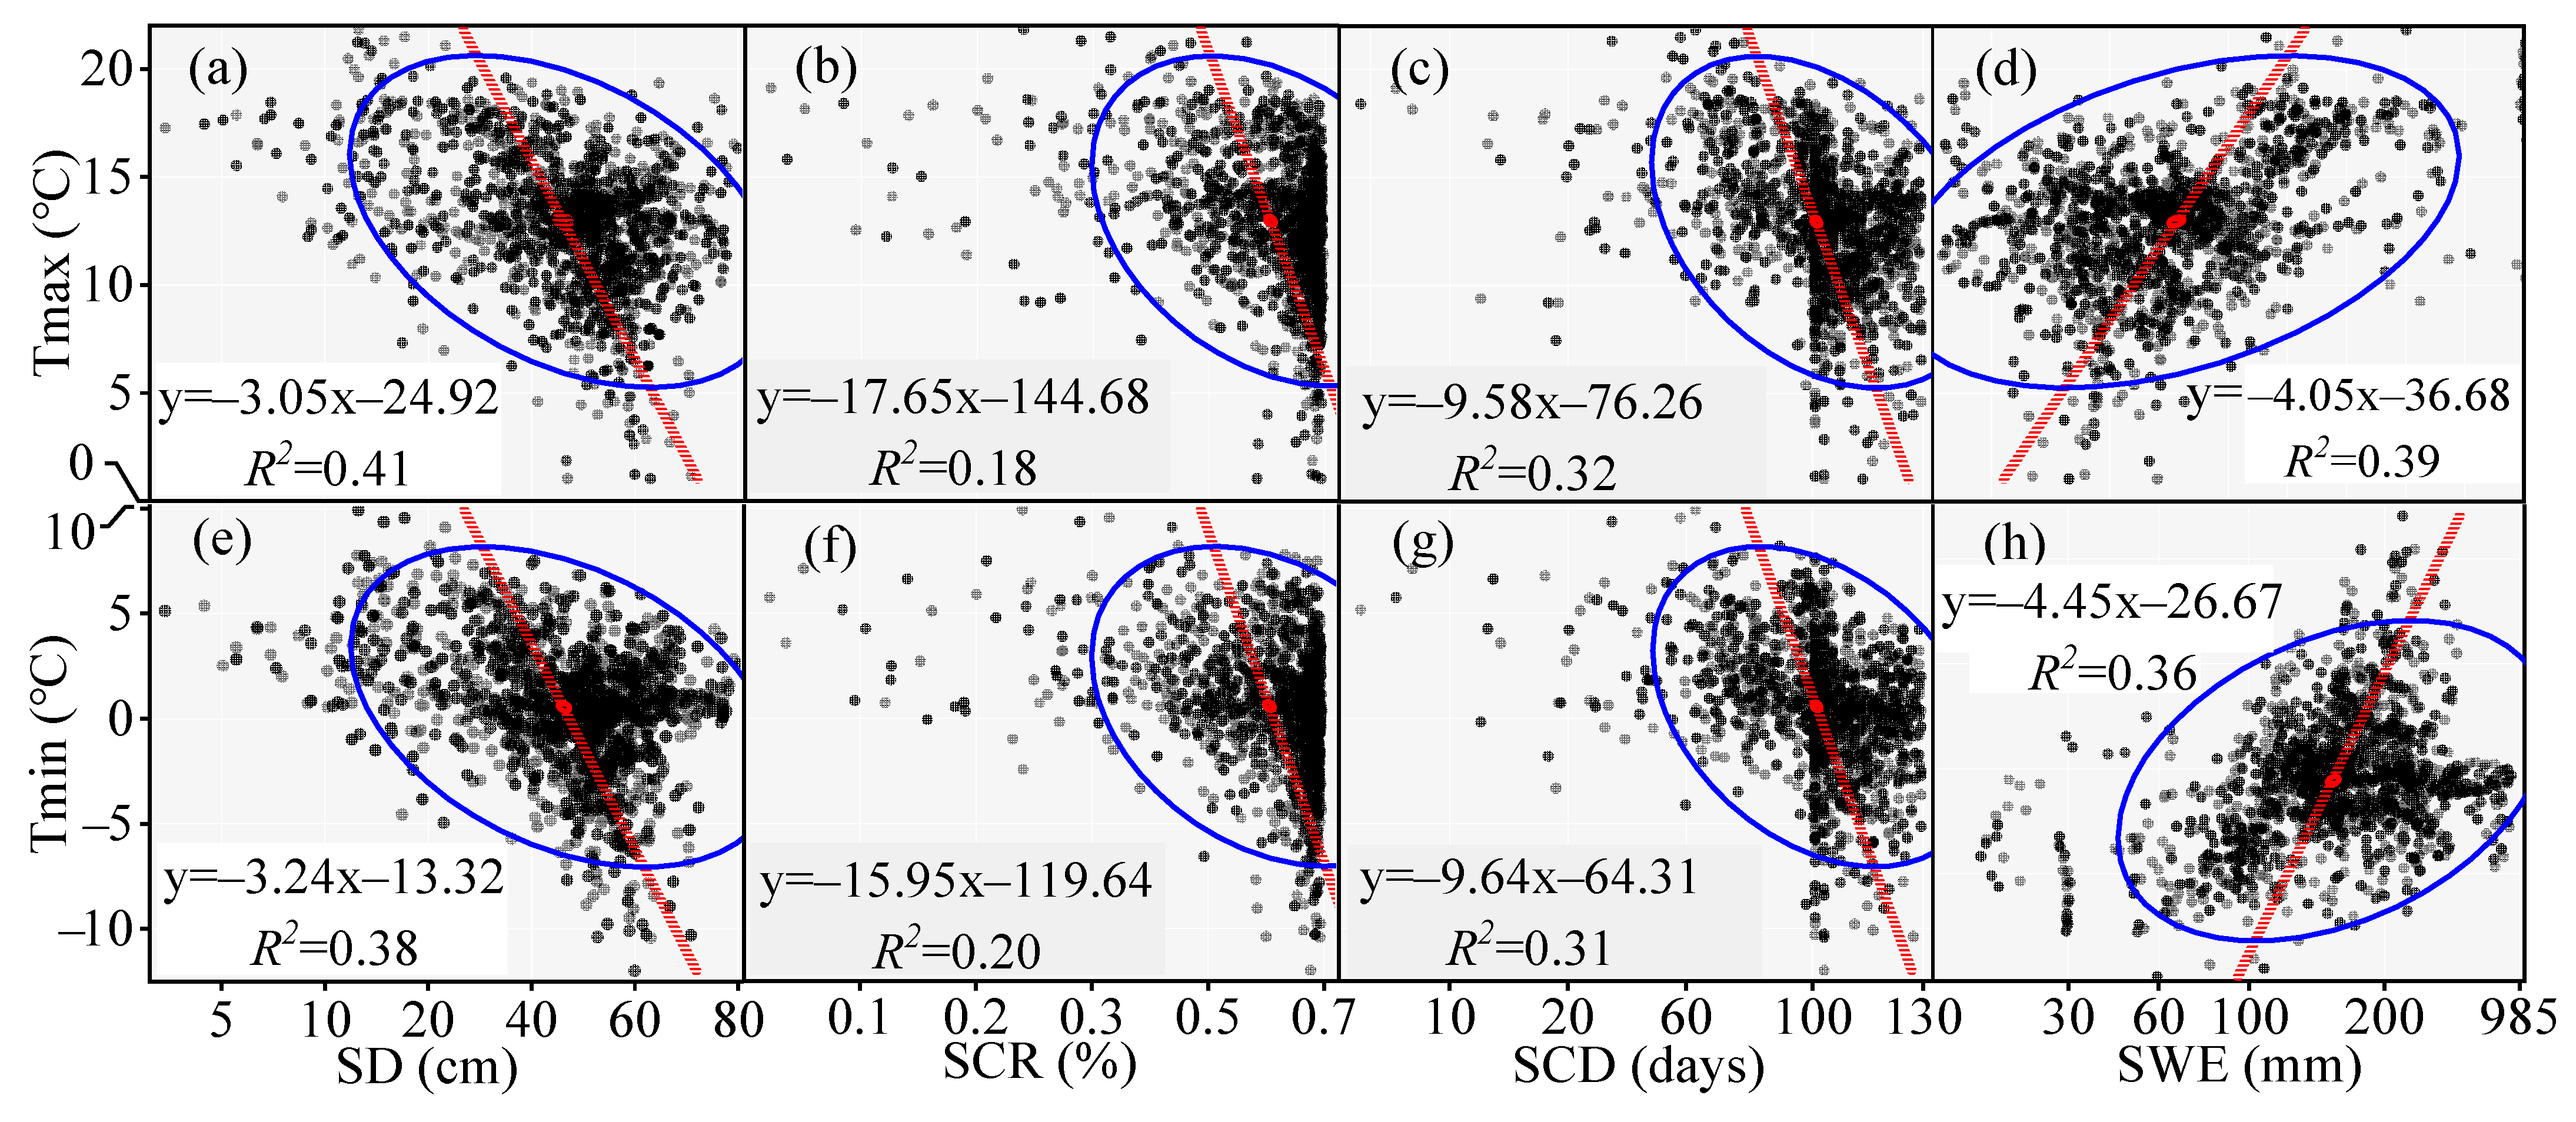
We considered daytime (Tmax) and nighttime temperature (Tmin) as independent variables and snow cover (SD, SCR, SCD and SWE) as dependent variables for correlation analysis (Figure 6). Asymmetrical warming was only positively correlated with SWE, and the confidence intervals of Tmax and Tmin were 5.1–20.5 °C and −10.8 to 4.9 °C, respectively. Correspondingly, the SWE confidence intervals were 29.5–132.6 mm and 105.5–289.5 mm. Asymmetrical warming was negatively correlated with SWE and SCD, of which the correlation coefficient between Tmax and SD was the highest (R2 = 0.41), and the confidence intervals of Tmax and Tmin were 5.0–20.3 °C and −8.1 to 8.5 °C, respectively. Correspondingly, the SD confidence intervals were 29.8–66.7 mm and 30.5–63.2 mm. The correlation coefficients between Tmax and SCD and Tmin and SCD were 0.32 and 0.31, respectively, and the confidence intervals of Tmax and Tmin were 5.2–21.4 °C and −7.9 to 7.7 °C, respectively. Correspondingly, the SCD confidence intervals were 78.3–121.7 mm and 70.1–123.2 mm. There was a weak correlation between asymmetrical warming and SCR; i.e., < 0.3.
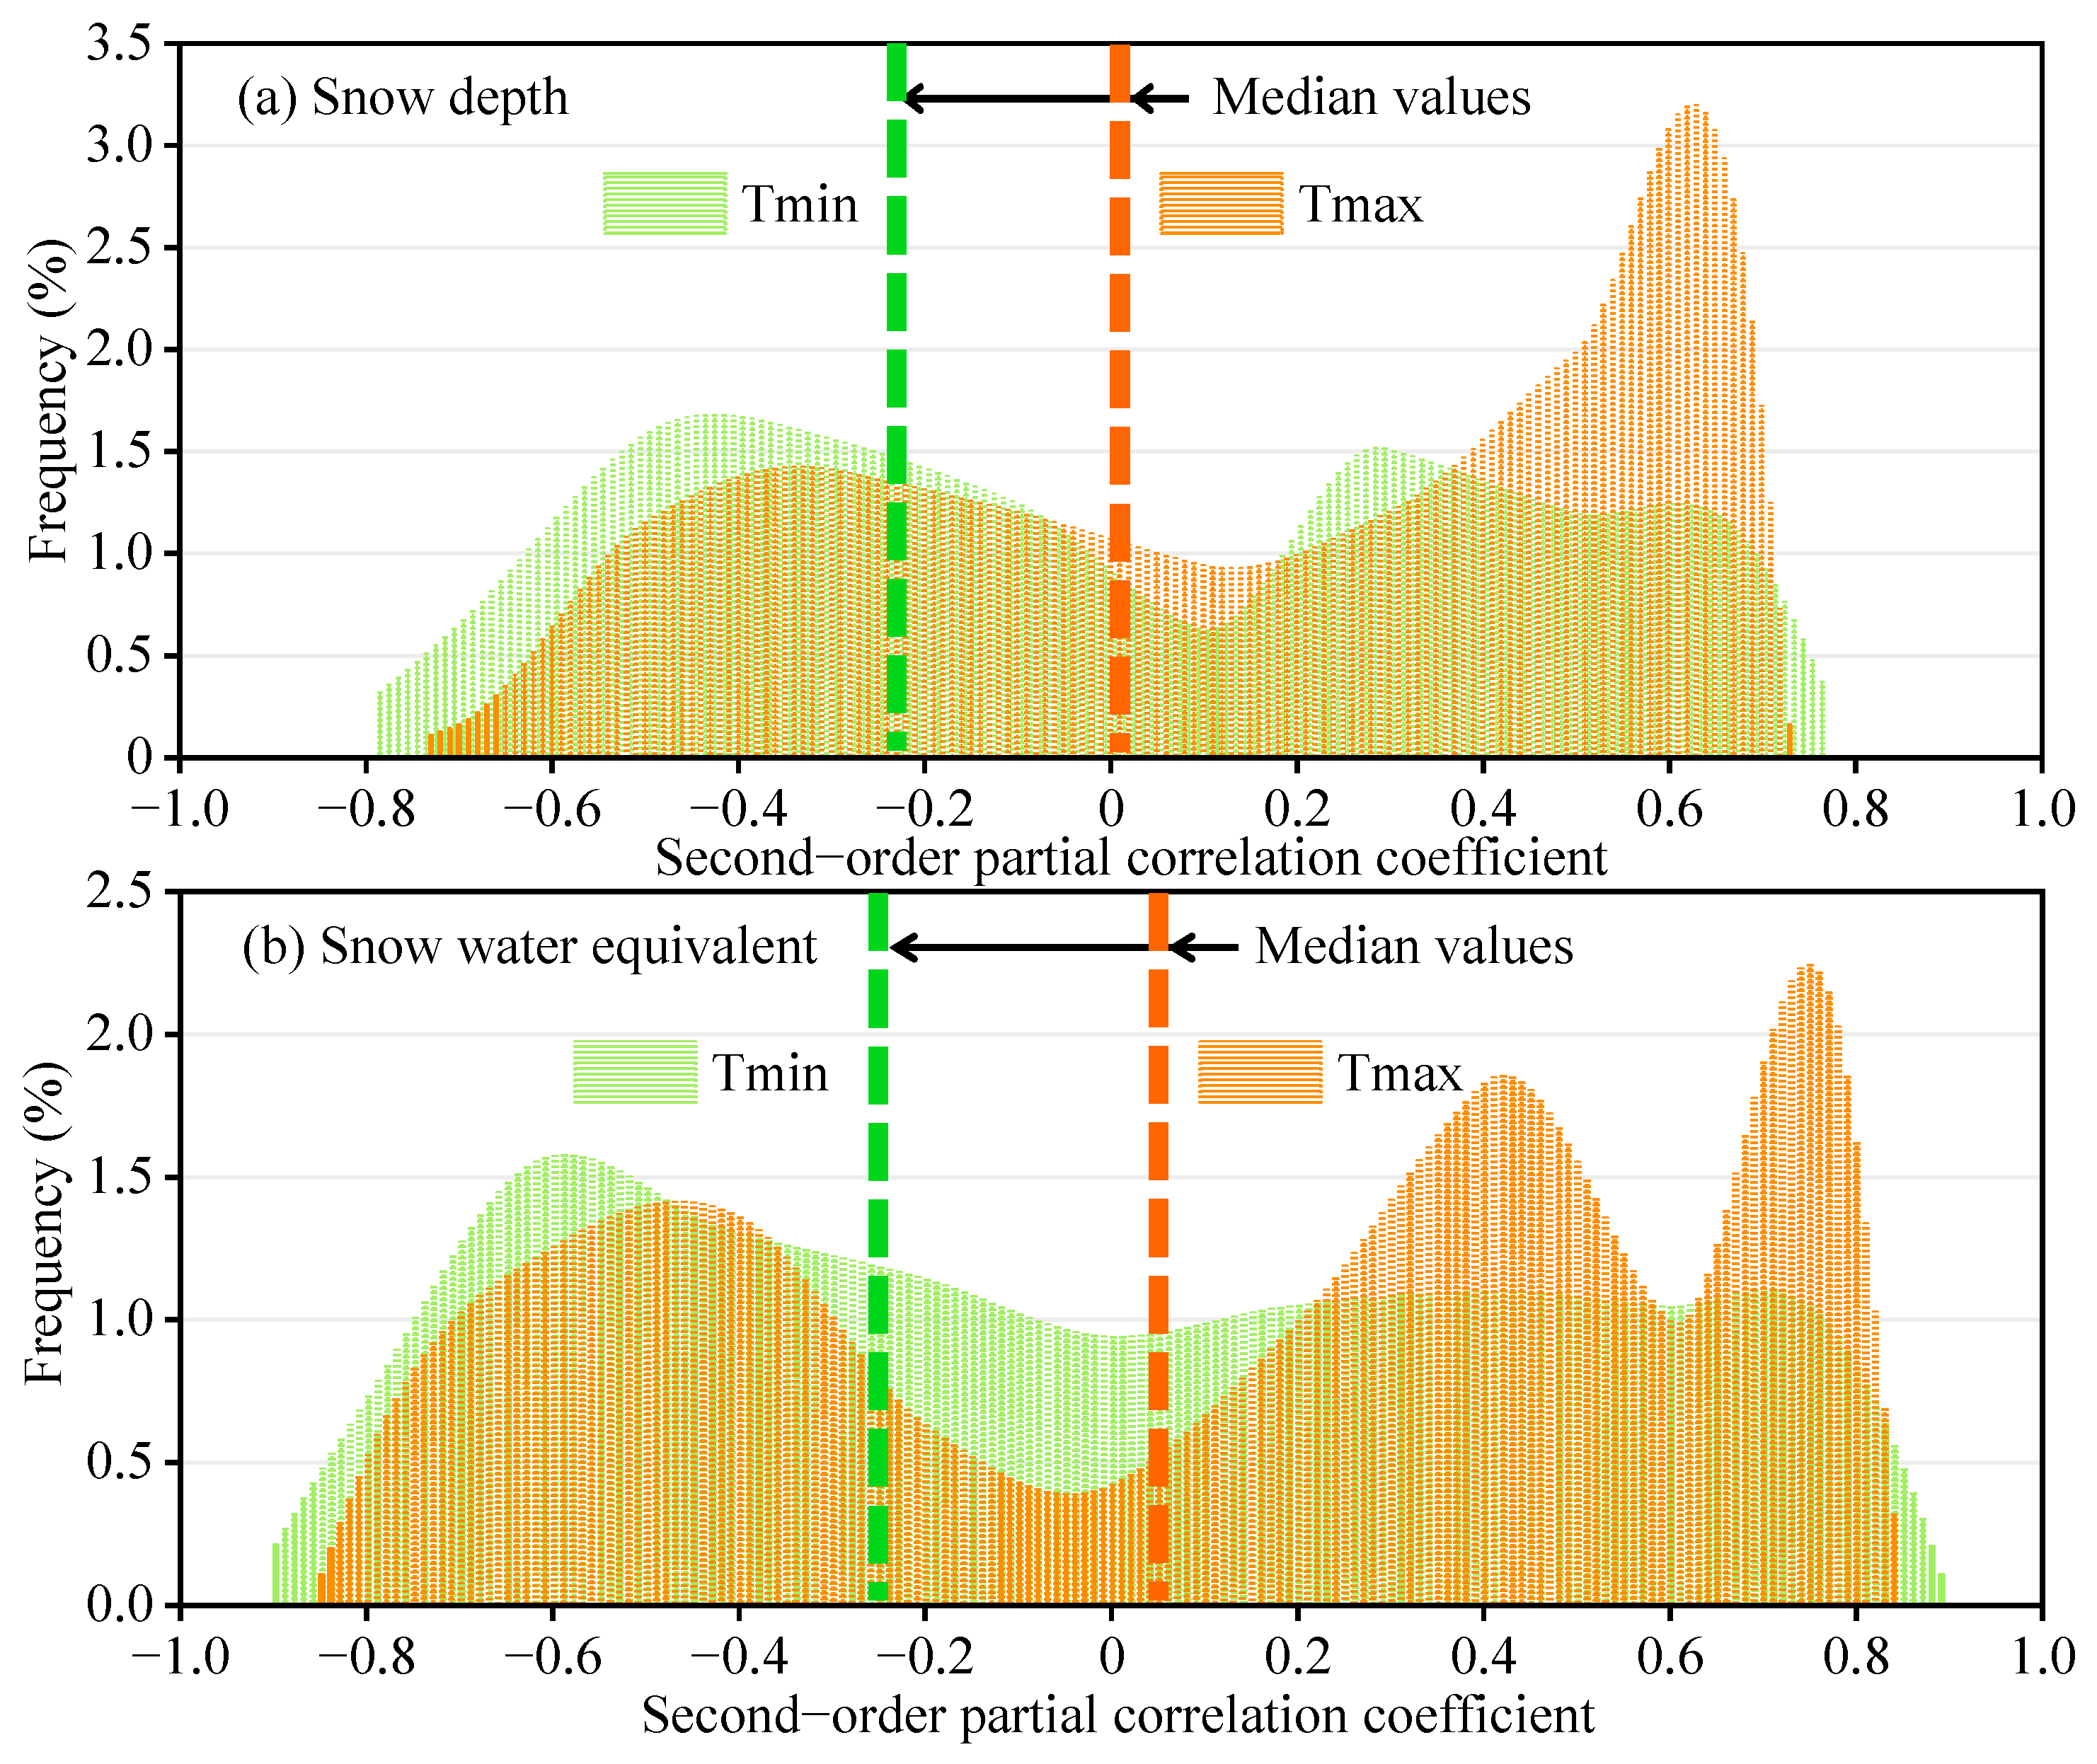
Surface elevation was included as a control variable, and a partial correlation analysis of snow cover (SD, SWE) and asymmetric warming was carried out in Tianshan mountains (Figure 7). The partial correlation coefficients of SD and Tmax and SD and Tmin were -0.78 to 0.77 and −0.73 to 0.7, respectively, and the median values were −0.25 and 0.04. The area of positive correlation between the SD and Tmax accounted for approximately 59.9% of the total pixels, of which 10.3% showed a significant positive correlation (p < 0.05). The frequency of appearance was the highest (3.1%) when the partial correlation coefficient reached 0.63. The area of positive correlation between the SD and Tmin accounted for approximately 46.9% of the total pixels, of which the partial correlation coefficient at the highest frequency was −0.42. The partial correlation coefficients of SWE and Tmax and SWE and Tmin were −0.85 to 0.84 and −0.89 to 0.90, respectively, and the median values were −0.28 and 0.09. The area of positive correlation between the SWE and Tmax accounted for approximately 61.5% of the total pixels, of which 7.2% showed a significant positive correlation (p < 0.05). The frequency of appearance was the highest (2.2%) when the partial correlation coefficient reached 0.75. The area of positive correlation between the SWE and Tmin accounted for approximately 51.0% of the total pixels, of which the partial correlation coefficient at the highest frequency was −0.59. In summary, Tmax was positively correlated with snow cover (SD, SWE) in about 60% of the total area, and Tmin was negatively correlated with snow cover (SD, SWE) in about 48% of the Tianshan mountains.
4. Discussion
The warming rates of Tmin in Tianshan mountains from 2001 to 2019 showed a slowly increasing trend. This is mainly closely related to the background of global warming [53,54]. Pu et al. [55] reported the retreat of the Malan Glacier in the Hoh Xil region and interpreted it as an influence of global warming. Ren et al. [56] reported the glacial retreat of the Rongbuk Glacier on the northern slope of Mt. Everest and also attributed it to climate warming. The climate change in Tianshan mountains has more differences in natural zones, seasons and temperature attributes and is closely related to the complex terrain span [57]. The Tianshan mountains lie in the arid area of inland Central Asia, where asymmetrical warming is collectively influenced by westerly circulation and monsoon and experiences a unique mountain–oasis–desert coupling system [58]. Moreover, the substantial greenhouse gas (GHG) emissions and land-use changes, to some extent, have exacerbated the overall asymmetrical warming in the Tianshan mountains, which is greatly affected by human activities [59]. The different urban distributions, population densities and socio-economic development levels in the natural areas are also important factors for climate change in the Tianshan mountains [60,61,62]. In this study, we found that the temperature change tendencies of Tmax and Tmin were inconsistent in Tianshan mountains over the last 20 years, and Tmax showed a slow cooling trend (−0.16 °C per decade), which is inconsistent with the daily maximum temperature change tendency in the northern foot plain of the Tianshan mountains [63,64]. Tmin showed a slow warming trend (0.10 °C per decade), and the significant increase of daily minimum temperature is the main contributor to the increase of daily average temperature, which supports the fact that the greenhouse effect continues to intensify, resulting in the increase of diurnal temperature range [65,66,67]. For example, the diurnal temperature range of Tmax and Tmin warming rates in 2018 and 2019 were 1.23 and 1.69 °C, respectively, which may have a great impact on the surrounding oasis agriculture [68]. It follows that the Tmax decreased by 0.32 °C, and the areas were mainly concentrated in the western and central Tianshan mountains. The Tmin increased by 0.2 °C, and the areas were mainly in the Pamir Plateau and Turpan and Hami basins. In general, from 2001 to 2019, the western and eastern mountains of Tianshan showed a warming trend and the central mountainous areas of Tianshan mainly showed a cooling trend.
Snow cover is affected by many factors, but it is clear that temperature change is the dominating factor. Numerous studies have revealed that a longer timescale or larger spatial extent of long-term glacial advance and retreat are significantly affected by temperature [69,70]. Tobias [71] presented an analysis of snow cover and temperature trends during the 1879–2000 period in the mountain ridges of the Zailiyskiy and Kungey Alatau. The trend coefficient was about 0.08 °C per decade during the 1900–2000 period and about 0.2 °C per decade on average for the second half of the last century, where the increase was due mainly to temperature rises in autumn and winter. The magnitude of the increase at stations at a lower altitude was higher than those at a higher altitude. In this study, there was no significant change in the snow depth of the Tianshan mountains from 2001 to 2019, but the interannual maximum snow depth showed periodic fluctuations. Specifically, it continued to decrease for 4 years, and the years of fluctuation were 2004, 2011 and 2015, respectively. The values of Tmin warming in these years were negative, which is inconsistent with the overall warming rates of Tmin (0.10 °C per decade). Therefore, these 3 years belong to mutation years, and the mutation period is 4 years. From 2001 to 2019, the SCP of Tianshan mountains was positively correlated with the Tmax warming rate, while it was negatively correlated with the Tmin warming rate in the region. The Tmax in the central mountainous areas of the Tianshan mountains decreased by 1.6 °C, and the annual SCP decreased by 0.94%. This means that for every 0.1 °C decrease in the daily warming in the mid-mountain zone of the Tianshan mountains, the SCP decreases by 0.58%—about 58.6 km2. Likewise, the second-order partial correlation analysis also indicated that the correlations between SWE, SD and surface elevation were stronger than the decrease in SCP caused by the Tmax cooling trend. Therefore, SD and Tmax and SWE and Tmax in high-altitude areas were highly correlated; SWE and SD of Tianshan mountains will continue to show an increasing trend in the future.
5. Conclusions
In this study, we analyzed monthly Tmax, Tmin and snow cover datasets (2001–2019) and determined the spatiotemporal patterns of glacial snow cover and asymmetrical warming in the Tianshan mountains. The conclusions are as follows.
In the previous 20 years, against the background of global temperature rises, the daytime and nighttime warming trends of the Tianshan mountains showed global consistency against the background of global warming. The daytime cooling rate (−0.16 °C per decade) was faster than the nighttime warming rate (0.10 °C per decade), and the asymmetric warming trend in the Tianshan mountains showed an increasing trend. The SCP in the central mountainous areas of the Tianshan mountains decreased by 0.94%; this means that for every 0.1 °C decrease in the daytime temperature, the SCP decreases by 58.6 km2. There was no significant change in the snow depth, but the interannual maximum snow depth showed periodic fluctuations, and the form of fluctuations reduced for 4 consecutive years. The daytime and nighttime warming was positively correlated with SWE, negatively correlated with SD and SCD and weakly correlated with SCR ( < 0.3). About 60% of the region’s daytime warming was positively related to SD and SWE, and about 48% of the region’s nighttime warming was negatively related to SD and SWE.
From 2001 to 2019, the daytime warming decreased by 0.32 °C, and the areas were mainly concentrated in the western and central Tianshan mountains. The nighttime warming increased by 0.2 °C, and the areas were mainly in the Pamir Plateau and Turpan and Hami basins. The western and eastern mountains of Tianshan will continue to show a warming trend in the future, while the central mountainous areas of Tianshan will mainly show a cooling trend.
Author Contributions
Conceptualisation, methodology, software, formal analysis, data curation, writing original draft, visualisation, T.H.; conceptualisation, supervision, project administration, funding acquisition, X.H.; data curation, L.Y.; methodology, validation, data curation, writing original draft, J.Y.; investigation, resources, supervision, Y.Y.; conceptualisation, supervision, project administration, M.L. All authors have read and agreed to the published version of the manuscript.
Funding
This research was funded by the National Natural Science Foundation of China [grant number 51969027, U1803244], Major Scientific and Technological Projects of XPCC in China (2017AA002), and China Scholarship Council (201909505014).
Acknowledgments
The authors are grateful to the anonymous reviewers and the corresponding editor for their helpful and constructive comments and suggestions for improving the manuscript.
Conflicts of Interest
The authors declare no conflict of interest.
References
- Ye, H.; Mather, J.R. Polar Snow Cover Changes and Global Warming. Int. J. Climatol. 2015, 17, 155–162. [Google Scholar] [CrossRef]
- Rohrer, M.; Salzmann, N.; Stoffel, M.; Kulkarni, A.V. Missing (in-situ) snow cover data hampers climate change and runoff studies in the Greater Himalayas. Sci. Total. Environ. 2013, 468, S60–S70. [Google Scholar] [CrossRef] [PubMed]
- She, J.; Zhang, Y.; Li, X.; Chen, Y. Changes in snow and glacier cover in an arid watershed of the western Kunlun Mountains using multisource remote-sensing data. Int. J. Remote Sens. 2013, 35, 234–252. [Google Scholar] [CrossRef]
- Marks, D.; Winstral, A.; Seyfried, M. Simulation of terrain and forest shelter effects on patterns of snow deposition, snowmelt and runoff over a semi-arid mountain catchment. Hydrol. Process. 2002, 16, 3605–3626. [Google Scholar] [CrossRef]
- Day, T.A.; DeLucia, E.H.; Smith, W.K. Influence of cold soil and snowcover on photosynthesis and leaf conductance in two Rocky Mountain conifers. Oecologia 1989, 80, 546–552. [Google Scholar] [CrossRef]
- Dressler, K.A.; Leavesley, G.H.; Bales, R.C.; Fassnacht, S.R. Evaluation of gridded snow water equivalent and satellite snow cover products for mountain basins in a hydrologic model. Hydrol. Process. 2006, 20, 673–688. [Google Scholar] [CrossRef]
- Gao, K.; Zhang, W.X. P–T path of high-pressure low-temperature rocks and tectonic implications in the western Tianshan Mountains, NW China. J. Metamorph. Geol. 2010, 17, 621–636. [Google Scholar] [CrossRef]
- Yu, S.; Yuan, Y.; Wei, W.; Chen, F.; Zhang, T.; Shang, H.; Zhang, R.; Qing, L. A 352-year record of summer temperature reconstruction in the western Tianshan Mountains, China, as deduced from tree-ring density. Quat. Res. 2013, 80, 158–166. [Google Scholar] [CrossRef]
- Luo, Y.; Arnold, J.; Liu, S.; Wang, X.; Chen, X. Inclusion of glacier processes for distributed hydrological modeling at basin scale with application to a watershed in Tianshan Mountains, northwest China. J. Hydrol. 2013, 477. [Google Scholar] [CrossRef]
- Liu, Q.; Liu, S. Response of glacier mass balance to climate change in the Tianshan Mountains during the second half of the twentieth century. Clim. Dyn. 2015, 46, 303–316. [Google Scholar] [CrossRef]
- Xu, M.; Wu, H.; Zhang, Y. Impacts of climate change on the discharge and glacier mass balance of the different glacierized watersheds in the Tianshan Mountains, Central Asia. Hydrol. Process. 2018. [Google Scholar] [CrossRef]
- Shen, Y.; Fink, M.; Kralisch, S.; Brenning, A. Unraveling the Hydrology of the Glacierized Kaidu Basin by Integrating Multisource Data in the Tianshan Mountains, Northwestern China. Water Resour. Res. 2018. [Google Scholar] [CrossRef]
- Savoskul, O.; Solomina, O. Late-Holocene glacier variations in the frontal and inner ranges of the Tian Shan, central Asia. Holocene 1996, 6, 25–35. [Google Scholar] [CrossRef]
- Pritchard, H.D. Asia’s glaciers are a regionally important buffer against drought. Nat. Cell Biol. 2017, 545, 169–174. [Google Scholar] [CrossRef]
- Kong, Y.; Pang, Z. Statistical analysis of stream discharge in response to climate change for Urumqi River catchment, Tianshan Mountains, central Asia. Quat. Int. 2014, 336, 44–51. [Google Scholar] [CrossRef]
- Yang, M.; Yao, T.; Nelson, F.E.; Shiklomanov, N.I.; Guo, D.; Wang, C. Snow Cover and Depth of Freeze-Thaw on the Tibetan Plateau: A Case Study from 1997 to 1998. Phys. Geogr. 2008, 29, 208–221. [Google Scholar] [CrossRef] [Green Version]
- Yi, Y.; Kimball, J.S.; Rawlins, M.A.; Moghaddam, M.; Euskirchen, E.S. The role of snow cover affecting boreal-arctic soil freeze–thaw and carbon dynamics. Biogeosciences 2015, 12, 5811–5829. [Google Scholar] [CrossRef] [Green Version]
- Qi, Z.; Liu, H.; Wu, X.; Hao, Q. Climate-driven speedup of alpine treeline forest growth in the Tianshan Mountains, Northwestern China. Glob. Chang. Biol. 2015. [Google Scholar] [CrossRef] [PubMed]
- Haeberli, W.; Hoelzle, M.; Paul, F.; Zemp, M. Integrated monitoring of mountain glaciers as key indicators of global climate change: The European Alps. Ann. Glaciol. 2007, 46, 150–160. [Google Scholar] [CrossRef] [Green Version]
- Bolch, T.; Menounos, B.; Wheate, R. Landsat-based inventory of glaciers in western Canada, 1985–2005. Remote Sens. Environ. 2010, 114, 127–137. [Google Scholar] [CrossRef]
- Greene, E.M.; Liston, G.E.; Pielke, R.A. Relationships between landscape, snow cover depletion, and regional weather and climate. Hydrol. Process. 2015, 13, 2453–2466. [Google Scholar] [CrossRef]
- Euskirchen, E.S.; McGuire, A.D.; Chapin, F.S. Energy feedbacks of northern high-latitude ecosystems to the climate system due to reduced snow cover during 20th century warming. Glob. Chang. Biol. 2007, 13, 2425–2438. [Google Scholar] [CrossRef]
- Deng, H.; Chen, Y.; Li, Q.; Lin, G. Loss of terrestrial water storage in the Tianshan mountains from 2003 to 2015. Int. J. Remote Sens. 2019. [Google Scholar] [CrossRef]
- Wu, S.; Zhang, X.; Du, J.; Zhou, X.; Tuo, Y.; Li, R.; Duan, Z. The vertical influence of temperature and precipitation on snow cover variability in the Central Tianshan Mountains, Northwest China. Hydrol. Process. 2019, 33, 1686–1697. [Google Scholar] [CrossRef] [Green Version]
- Chen, X.; Wei, W.; Liu, M. Characteristics of temperature variation in seasonal snow in the Western Tianshan Mountains, China. Meteorol. Appl. 2013. [Google Scholar] [CrossRef]
- Li, Z.; Chen, Y.; Li, W.; Deng, H.; Fang, G. Potential impacts of climate change on vegetation dynamics in Central Asia. J. Geophys. Res. Atmos. 2015, 120. [Google Scholar] [CrossRef]
- Li, Q.; Yang, T.; Zhou, H.; Li, L. Patterns in snow depth maximum and snow cover days during 1961–2015 period in the Tianshan Mountains, Central Asia. Atmos. Res. 2019, 228, 14–22. [Google Scholar] [CrossRef]
- Wang, X.; Xie, H. New methods for studying the spatiotemporal variation of snow cover based on combination products of MODIS Terra and Aqua. J. Hydrol. 2009, 371, 192–200. [Google Scholar] [CrossRef]
- Zhang, W.; Zhang, G.; Liu, G.; Li, Z.; Chen, T.; An, L. Diversity of Bacterial Communities in the Snowcover at Tianshan Number 1 Glacier and its Relation to Climate and Environment. Geomicrobiol. J. 2012, 29, 459–469. [Google Scholar] [CrossRef]
- Ke, C.-Q.; Liu, X. MODIS-observed spatial and temporal variation in snow cover in Xinjiang, China. Clim. Res. 2014, 59, 15–26. [Google Scholar] [CrossRef]
- Tang, Z.; Wang, X.; Wang, J.; Wang, X.; Li, H.; Jiang, Z. Spatiotemporal Variation of Snow Cover in Tianshan Mountains, Central Asia, Based on Cloud-Free MODIS Fractional Snow Cover Product, 2001–2015. Remote Sens. 2017, 9, 1045. [Google Scholar] [CrossRef] [Green Version]
- Aizen, V.B.; Aizen, E.M.; Melack, J.M.; Dozier, J. Climatic and Hydrologic Changes in the Tien Shan, Central Asia. J. Clim. 1997, 10, 1393–1404. [Google Scholar] [CrossRef]
- Brodzik, M.J.; Armstrong, R.L.; Weatherhead, E.C.; Savoie, M.; Knowles, K.; Robinson, D.A. Regional Trend Analysis of Satellite-Derived Snow Extent and Global Temperature Anomalies. AGU Fall Meeting Abstracts. 2006. Available online: https://ui.adsabs.harvard.edu/abs/2006AGUFM.U33A0011B/abstract (accessed on 1 December 2020).
- Wang, S.; Zhang, M.; Sun, M.; Wang, B.; Li, X. Changes in precipitation extremes in alpine areas of the Chinese Tianshan Mountains, central Asia, 1961–2011. Quat. Int. 2013, 311, 97–107. [Google Scholar] [CrossRef]
- Dai, L.; Li, Y.; Luo, G.; Xu, W.; Lu, L.; Li, C.; Feng, Y. The spatial variation of alpine timberlines and their biogeographical characteristics in the northern Tianshan Mountains of China. Environ. Earth Sci. 2012, 68, 129–137. [Google Scholar] [CrossRef]
- Wang, T.; Ren, G.; Chen, F.; Yuan, Y. An analysis of precipitation variations in the west-central Tianshan Mountains over the last 300 years. Quat. Int. 2015. [Google Scholar] [CrossRef]
- Zhang, Y.; Kong, Z.; Zhang, H. Multivariate analysis of modern and fossil pollen data from the central Tianshan Mountains, Xinjiang, NW China. Clim. Chang. 2013, 120, 945–957. [Google Scholar] [CrossRef]
- Yang, P.; Yaning, C. An analysis of terrestrial water storage variations from GRACE and GLDAS: The Tianshan Mountains and its adjacent areas, central Asia. Quat. Int. 2015, 358, 106–112. [Google Scholar] [CrossRef]
- Zhao, W.; Chen, Y.; Li, J.; Jia, G. Periodicity of plant yield and its response to precipitation in the steppe desert of the Tianshan Mountains region. J. Arid Environ. 2010, 74, 445–449. [Google Scholar] [CrossRef]
- Yang, D.; Wang, J.; Bai, Y.; Xu, S.; An, L. Diversity and distribution of the prokaryotic community in near-surface permafrost sediments in the Tianshan Mountains, China. Can. J. Microbiol. 2008, 54, 270–280. [Google Scholar] [CrossRef]
- Xu, G.; Liu, X.; Qin, D.; Chen, T.; Wang, W.; Wu, G.; Sun, W.; An, W.; Zeng, X. Tree-ring δ18 O evidence for the drought history of eastern Tianshan Mountains, northwest China since 1700 AD. Int. J. Clim. 2013, 34. [Google Scholar] [CrossRef]
- Huang, L.; Li, Z.; Tian, B.-S.; Zhou, J.-M.; Chen, Q. Recognition of supraglacial debris in the Tianshan Mountains on polarimetric SAR images. Remote Sens. Environ. 2014. [Google Scholar] [CrossRef]
- Hubert, A.; Suppe, J.; Gonzalezmieres, J. Surface effects of active folding, illustrated with examples from the TianShan intracontinental mountain belt (China). ACM Trans. Math. Softw. 2008, 42, 1415–1426. [Google Scholar]
- Xie, W.; Xu, Y.-G.; Chen, Y.-B.; Luo, Z.; Hong, L.-B.; Ma, L.; Liu, H.-Q. High-alumina basalts from the Bogda Mountains suggest an arc setting for Chinese Northern Tianshan during the Late Carboniferous. Lithos 2016, 165–181. [Google Scholar] [CrossRef]
- Sang, W.; Wang, Y.; Su, H.; Lu, Z. Response of tree-ring width to rainfall gradient along the Tianshan Mountains of northwestern China. Chin. Sci. Bull. 2007. [Google Scholar] [CrossRef]
- Xiao, Y.; Lavis, S.; Niu, Y.; Pearce, J.A.; Li, H.; Wang, H.; Davidson, J. Trace-element transport during subduction-zone ultrahigh-pressure metamorphism: Evidence from western Tianshan, China. GSA Bull. 2012, 124, 1113–1129. [Google Scholar] [CrossRef]
- Fang, H.; Wei, S.; Liang, S. Validation of MODIS and CYCLOPES LAI products using global field measurement data. Remote Sens. Environ. 2012. [Google Scholar] [CrossRef]
- Li, S.-P.; Chen, G.; Li, J.W. Analysis of crustal deformation and strain characteristics in the Tianshan Mountains with least-squares collocation. Solid Earth Discuss. 2015, 7, 3179–3197. [Google Scholar] [CrossRef] [Green Version]
- Decundo, J.; Diéguez, S.N.; Martínez, G.; Romanelli, A.; Paggi, M.B.F.; Gaudio, D.S.P.; Amanto, F.A.; Soraci, A.L. Impact of water hardness on oxytetracycline oral bioavailability in fed and fasted piglets. Vet. Med. Sci. 2019, 5. [Google Scholar] [CrossRef]
- Quilty, J.; Adamowski, J.; Boucher, M.-A. A Stochastic Data-Driven Ensemble Forecasting Framework for Water Resources: A Case Study Using Ensemble Members Derived from a Database of Deterministic Wavelet-Based Models. Water Resour. Res. 2019, 55, 175–202. [Google Scholar] [CrossRef] [Green Version]
- Zheng, G.; Wang, J.; Wang, L.; Zhou, M.; Xin, Y.; Song, M. Second-order moments of Schell-model beams with various correlation functions in atmospheric turbulence. Opt. Lett. 2017, 42, 4647–4650. [Google Scholar] [CrossRef] [PubMed]
- Zhang, S.; Wang, J.; Liu, C.; Bai, J.; Peng, H.; Huang, H.; Guan, Y. Detrital zircon U—Pb geochronology of the Permian strata in the Turpan-Hami Basin in North Xinjiang, NW China: Depositional age, provenance, and tectonic implications. Geol. J. 2019, 54. [Google Scholar] [CrossRef]
- Held, I.M.; Soden, B.J. Robust Responses of the Hydrological Cycle to Global Warming. J. Clim. 2006, 19, 5686–5699. [Google Scholar] [CrossRef]
- Chou, C.; Lan, C.-W. Changes in the Annual Range of Precipitation under Global Warming. J. Clim. 2012. [Google Scholar] [CrossRef] [Green Version]
- Pu, J.C.; Yao, T.D.; Wang, N.L.; Zhang, Y.L. Recently variation of Malan glacier in Hoh Xil Region, Center of Tibetan Plateau. J. Glaciol. Geocryol. 2001, 23, 189–192. [Google Scholar]
- Ren, B.H. Recent fluctuation of glaciers in China. In An Introduction to the Glaciers in China; Science Press: Beijing, China, 1988. [Google Scholar]
- Lu, H.; Burbank, D.W.; Li, Y. Alluvial sequence in the north piedmont of the Chinese Tian Shan over the past 550kyr and its relationship to climate change. Palaeogeogr. Palaeoclim. Palaeoecol. 2010, 285, 343–353. [Google Scholar] [CrossRef]
- Ma, L.; Wu, J.; Abuduwaili, J. Climate and environmental changes over the past 150 years inferred from the sediments of Chaiwopu Lake, central Tianshan Mountains, northwest China. Acta Diabetol. 2012, 102, 959–967. [Google Scholar] [CrossRef]
- Liao, C.; Sullivan, P.J.; Barrett, C.B.; Kassam, K.-A.S. Socioenvironmental Threats to Pastoral Livelihoods: Risk Perceptions in the Altay and Tianshan Mountains of Xinjiang, China. Risk Anal. 2014. [Google Scholar] [CrossRef]
- Zhou, K.F.; Chen, X.; Zhang, Q.; Sun, L.; Yang, Y.L.; Zhang, H.B.; Cheng, W.W.; Liu, Z.X. Dynamic change of ecological capital and their response to human activities in the northern slope of Tianshan Mountains. Arid Land Geogr. 2010, 33, 971–978. [Google Scholar]
- Li, K.; Gong, Y.; Song, W.; He, G.; Hu, Y.; Tian, C.; Liu, X. Responses of CH4, CO2 and N2O fluxes to increasing nitrogen deposition in alpine grassland of the Tianshan Mountains. Chemosphere 2012, 88, 140–143. [Google Scholar] [CrossRef]
- Haiao, Z.; Wu, J.; Liu, W. Two-century sedimentary record of heavy metal pollution from Lake Sayram: A deep mountain lake in central Tianshan, China. Quat. Int. 2014, 321, 125–131. [Google Scholar] [CrossRef]
- Lauterbach, S.; Witt, R.; Plessen, B.; Dulski, P.; Prasad, S.; Mingram, J.; Gleixner, G.; Hettler-Riedel, S.; Stebich, M.; Schnetger, B.; et al. Climatic imprint of the mid-latitude Westerlies in the Central Tian Shan of Kyrgyzstan and teleconnections to North Atlantic climate variability during the last 6000 years. Holocene 2014, 24, 970–984. [Google Scholar] [CrossRef] [Green Version]
- Malatesta, L.C.; Avouac, J. Contrasting river incision in north and south Tian Shan piedmonts due to variable glacial imprint in mountain valleys. Geology 2018, 46. [Google Scholar] [CrossRef]
- Baker, J.L.; Lachniet, M.S.; Chervyatsova, O.; Asmerom, Y.; Polyak, Y.A.V.J. Holocene warming in western continental Eurasia driven by glacial retreat and greenhouse forcing. Nat. Geosci. 2017. [Google Scholar] [CrossRef]
- Schmittner, A.; Galbraith, E.D. Glacial greenhouse-gas fluctuations controlled by ocean circulation changes. Nat. Cell Biol. 2008, 456, 373–376. [Google Scholar] [CrossRef] [PubMed]
- Vettoretti, G.; Peltier, W.R. Sensitivity of glacial inception to orbital and greenhouse gas climate forcing. Quat. Sci. Rev. 2004, 23, 499–519. [Google Scholar] [CrossRef]
- Tang, X.-L.; Lv, X.; He, Y. Features of climate change and their effects on glacier snow melting in Xinjiang, China. Comptes Rendus Geosci. 2013, 345, 93–100. [Google Scholar] [CrossRef]
- Dahe, Q.; Shiyin, L.; Peiji, L. Snow Cover Distribution, Variability, and Response to Climate Change in Western China. J. Clim. 2006, 19, 1820–1833. [Google Scholar] [CrossRef]
- Bavay, M.; Grunewald, T.; Lehning, M. Response of snow cover and runoff to climate change in high Alpine catchments of Eastern Switzerland. Adv. Water Resour. 2013, 55, 4–16. [Google Scholar] [CrossRef]
- Bolch, T. Climate change and glacier retreat in northern Tien Shan (Kazakhstan/Kyrgyzstan) using remote sensing data. Glob. Planet. Chang. 2007, 56, 1–12. [Google Scholar] [CrossRef]
Figure 1.
Distribution of meteorological stations in the Tianshan mountains.

Figure 2.
The interannual variation in snow depth (SD) and snow coverage percentage (SCP) trends in the Tianshan region.
Figure 2.
The interannual variation in snow depth (SD) and snow coverage percentage (SCP) trends in the Tianshan region.

Figure 3.
Spatial distribution of snow depth (a), snow cover percentage (b), snow cover days (c), and snow water equivalent (d) in Tianshan regions.
Figure 3.
Spatial distribution of snow depth (a), snow cover percentage (b), snow cover days (c), and snow water equivalent (d) in Tianshan regions.

Figure 4.
Interannual variation trend of Tmax and Tmin in Tianshan regions.

Figure 5.
The spatial distribution of averaged Tmax (a) and Tmin (b) in Tianshan regions.

Figure 6.
The Correlation analysis between snow cover and asymmetric warming, (a), snow depth (SD) and Tmax; (b), snow coverage percentage (SCP) and Tmax; (c), snow cover days (SCD) and Tmax; (d), snow water equivalent (SWE) and Tmax; (e), snow depth (SD) and Tmin; (f), snow coverage percentage (SCP) and Tmin; (g), snow cover days (SCD) and Tmin; (h), snow water equivalent (SWE) and Tmin.

Figure 7.
The partial correlation analysis of asymmetrical warming with snow depth (a) and snow water equivalent (b).
Figure 7.
The partial correlation analysis of asymmetrical warming with snow depth (a) and snow water equivalent (b).

Publisher’s Note: MDPI stays neutral with regard to jurisdictional claims in published maps and institutional affiliations. |
© 2021 by the authors. Licensee MDPI, Basel, Switzerland. This article is an open access article distributed under the terms and conditions of the Creative Commons Attribution (CC BY) license (http://creativecommons.org/licenses/by/4.0/).
Share and Cite
MDPI and ACS Style
Heng, T.; He, X.; Yang, L.; Yu, J.; Yang, Y.; Li, M. The Spatiotemporal Patterns and Interrelationships of Snow Cover and Climate Change in Tianshan Mountains. Water 2021, 13, 404. https://doi.org/10.3390/w13040404
AMA Style
Heng T, He X, Yang L, Yu J, Yang Y, Li M. The Spatiotemporal Patterns and Interrelationships of Snow Cover and Climate Change in Tianshan Mountains. Water. 2021; 13(4):404. https://doi.org/10.3390/w13040404
Chicago/Turabian StyleHeng, Tong, Xinlin He, Lili Yang, Jiawen Yu, Yulin Yang, and Miaoling Li. 2021. "The Spatiotemporal Patterns and Interrelationships of Snow Cover and Climate Change in Tianshan Mountains" Water 13, no. 4: 404. https://doi.org/10.3390/w13040404
Note that from the first issue of 2016, this journal uses article numbers instead of page numbers. See further details here.