Article

An Operational High-Performance Forecasting System for City-Scale Pluvial Flash Floods in the Southwestern Plain Areas of Taiwan

1
National Science and Technology Center for Disaster Reduction, New Taipei City 23143, Taiwan
2
Department of Geosciences, National Taiwan University, Taipei City 10617, Taiwan
*
Author to whom correspondence should be addressed.
Water 2021, 13(4), 405; https://doi.org/10.3390/w13040405
Submission received: 31 December 2020 / Revised: 29 January 2021 / Accepted: 2 February 2021 / Published: 4 February 2021

Abstract

:
A pluvial flash flood is rapid flooding induced by intense rainfall associated with a severe weather system, such as thunderstorms or typhoons. Additionally, topography, ground cover, and soil conditions also account for the occurrence of pluvial flash floods. Pluvial flash floods are among the most devastating natural disasters that occur in Taiwan, and these floods always /occur within a few minutes or hours of excessive rainfall. Pluvial flash floods usually threaten large plain areas with high population densities; therefore, there is a great need to implement an operational high-performance forecasting system for pluvial flash flood mitigation and evacuation decisions. This study developed a high-performance two-dimensional hydrodynamic model based on the finite-element method and unstructured grids. The operational high-performance forecasting system is composed of the Weather Research and Forecasting (WRF) model, the Storm Water Management Model (SWMM), a two-dimensional hydrodynamic model, and a map-oriented visualization tool. The forecasting system employs digital elevation data with a 1-m resolution to simulate city-scale pluvial flash floods. The extent of flooding during historical inundation events derived from the forecasting system agrees well with the surveyed data for plain areas in southwestern Taiwan. The entire process of the operational high-performance forecasting system prediction of pluvial flash floods in the subsequent 24 h is accomplished within 8–10 min, and forecasts are updated every six hours.

1. Introduction

A report from the Global Natural Disaster Risk Hotspots Project issued by the World Bank Group [1] indicated that natural hazards, such as floods, droughts, tsunamis, and earthquakes, continue to cause hundreds to thousands of injuries, tens of thousands of deaths, and billions of dollars in economic losses every year worldwide. Among these hazards, floods are the most common natural disaster that occur on the planet, affecting the lives of hundreds of millions of people around the globe and causing approximately 10 billion US dollars in damage each year.
As the most widespread natural disasters, floods can simply be categorized into three types. The first type is coastal floods (also known as surge floods), which occur in areas that lie on the coast or large water bodies (e.g., large lakes). Coastal floods are commonly caused by strong winds or typhoons that move toward a coastal area during high tide (i.e., high storm tide). In addition to a high storm tide, the low-lying coastal zone is usually flooded when extreme powerful waves breach the dunes or seawalls along the coast. The second type is the fluvial flood (also known as a river flood or riverine flood). Fluvial floods occur when excessive rainfall over an extended period causes a river to exceed its capacity. The damage from a fluvial flood can be widespread as the overflow affects smaller rivers downstream. Although fluvial floods rarely result in loss of lives, they can cause immense economic damage. Pluvial floods (also known as surface floods) are the third type and are formed when heavy rainfall creates a flood event independent of an overflowing water body. Pluvial flooding can occur in any area, including higher elevation areas, that lie above coastal and riverine floodplains.
Pluvial flash floods are rapid floods caused by extremely torrential rain and can be distinguished from regular pluvial floods by a short timescale, which is generally less than six hours [2]. Pluvial flash floods have the characteristics of rapid evolution and occur within minutes or a few hours during excessive rainfall from typhoons, monsoons, or southwesterlies (especially in Taiwan). Pluvial flash floods are a ubiquitous natural hazard worldwide, and flooding disasters will be exacerbated in cities with large low-lying, or flat areas. Cities with high population densities are at higher water-related disaster risks and are expected to experience climate change effects in the form of increased intensities and frequencies of severe pluvial flash floods [3]. Therefore, there is a great need to implement an operational high-performance forecasting system for pluvial flash flood disaster mitigation and evacuation decisions.
Comprehensive flood inundation models have been developed and applied to flood risk assessments and real-time flood forecasting for predicting areas where floods may occur and reducing the resultant damage in advance. The computational burden of flood inundation simulations is a key challenge to realizing these countermeasures [4,5]. Two-dimensional flood inundation modeling has become an important part of flood risk management practice. Studies in the fields of computational hydrodynamics, hydraulics, and numerical methods, combined with advances in computer technology and software design, have brought two-dimensional models into mainstream use. However, the models are computationally demanding and can take a long time to run, especially for large areas (for instance, thousands of km2) with high spatial resolution meshes (for instance, 10 × 10 m or smaller grid cells).
For some specific applications, e.g., the assessment of flooding risk or the estimation of maximum flooding extent, solving two-dimensional shallow water equations is not indispensably required, and a simplified model of the flood propagation process is sufficient for these cases. Thus, many two-dimensional flood inundation models have been developed based on the cellular automaton method [6,7,8]. A cellular automaton flood inundation model distributes the water volume of a particular flooded cell to neighboring cells by combining Manning’s equation with a cellular automaton; hence, the water surface elevation difference could be minimized. This kind of two-dimensional flood inundation model avoids solving shallow water equations and can utilize a digital elevation model (DEM) at a high resolution, e.g., 5 m or 10 m. The simplified flood propagation processes in a cellular automaton flood inundation model are quite effective because detailed information on flood processes is excluded. For example, Wand et al. [8] proposed a new holistic framework for high-resolution two-dimensional urban flood modeling that employed a two-dimensional, cellular–automata-based model, the Cellular Automata Dual-DraInagE Simulation (CADDIES) model [9], and information from multiple sources, and they considered the effects of critical urban features on flood propagation in Wallington, London (UK). Their study gave readers an insight into high-resolution urban flood modeling.
Flood propagation in city-scale areas is undoubtedly a two-dimensional phenomenon, and its characteristics depend strongly on the complex interaction between the flow and the distribution of roads and buildings, such as multiple flow paths at crossroads and flow around buildings. Thus, the use of two-dimensional hydrodynamic models is required to represent the complex, multidirectional flow paths generated by flooding features in a city-scale area. For instance, Costabile et al. [10] evaluated the fully dynamic, diffusive, and porosity approaches to two-dimensional flood modeling with reference not only to water depths and velocities but also to assessments of vulnerability. According to the results shown in their work, fully hydrodynamic modeling is the ideal reference tool when the goal of city-scale flood inundation mapping is not restricted to the evaluation of flood-prone areas but also involves the local estimation of flood vulnerability or hazards. Wing et al. [11] forecasted the flood inundation due to Hurricane Harvey using a continental-scale two-dimensional hydrodynamic model; their results also suggested that the physics of floodplain flow could be better represented by employing a true hydrodynamic model rather than a simplified GIS-based approach.
The utilization of unstructured (flexible) meshes is an emerging technique, which allows the arrangement of meshes with high spatial resolutions in more relevant areas and consequently lowers the computational costs [12,13]. Thanks to the remarkable advances that have been made in computational resources and numerical techniques for solving nonlinear partial differential equations, two-dimensional flood simulations at very high resolutions (~5 m) are now attainable [14,15]. However, the employment of shallow water equations (continuity and momentum equations for the x and y directions) is still important for expressing the details of flooding dynamics and for diminishing the uncertainty of flooding forecasts due to the simplifications of the model and prefixed flood propagation scenarios. Owing to the high computational demand, two-dimensional, fully hydrodynamic models have not been exploited to support flood forecasts across a large catchment at a sufficiently high spatial resolution [16]. Therefore, there is a strong need to develop a physically-based two-dimensional, unstructured-grid, flood inundation model and to accelerate its computing efficiency with enough lead time for emergence response.
Tainan city is located in southwestern Taiwan, which is also one of the six special municipalities in Taiwan (as shown in Figure 1). Tainan city covers an area of 2191.65 km2, the plain area of Tainan city occupies two-thirds of the total area, and the city has the highest proportion of plain area in Taiwan (as shown in Figure 1). Additionally, Tainan city also has the gentlest terrain in Taiwan. Due to its geographical features, Tainan city is considered to be among those most prone to flooding among the six special municipalities. Figure 2 shows a severe pluvial flash flood in Tainan city caused by torrential rainfall on 26 August 2020. Although the development of a large-scale flooding forecasting system requires extensive computing resources [17], the potential for mitigation and prevention of flooding disasters and decision making suggest that it is worthwhile to invest resources to develop such city-scale forecasting systems for pluvial floods.
This work aims to implement a novel forecasting system for city-scale pluvial flash floods in southwestern plain areas (in Tainan city) of Taiwan by exploiting a CPU-based (central processing unit) parallel computing technique that combines the latest well-developed, high-performance numerical weather prediction, two-dimensional dynamic wave, and stormwater management models as well as a high-end visualization program. The input/output format of the numerical models is slightly modified to accelerate the forecasting system, and a map-based two-dimensional visualization for flooding forecasts allows users to effortlessly detect the possible inundation areas in the next 24 h. The details of the data and models adopted to construct the forecasting system are described in Section 2; the results of the model validation for flooding extents and the schemes of multimodel integration, as well as the visualization of flooding forecasts, are presented in Section 3. In Section 4, a discussion of the uncertainties and future works for the present study are given, and finally, the summary and conclusions are presented in Section 5.

2. Materials and Methods

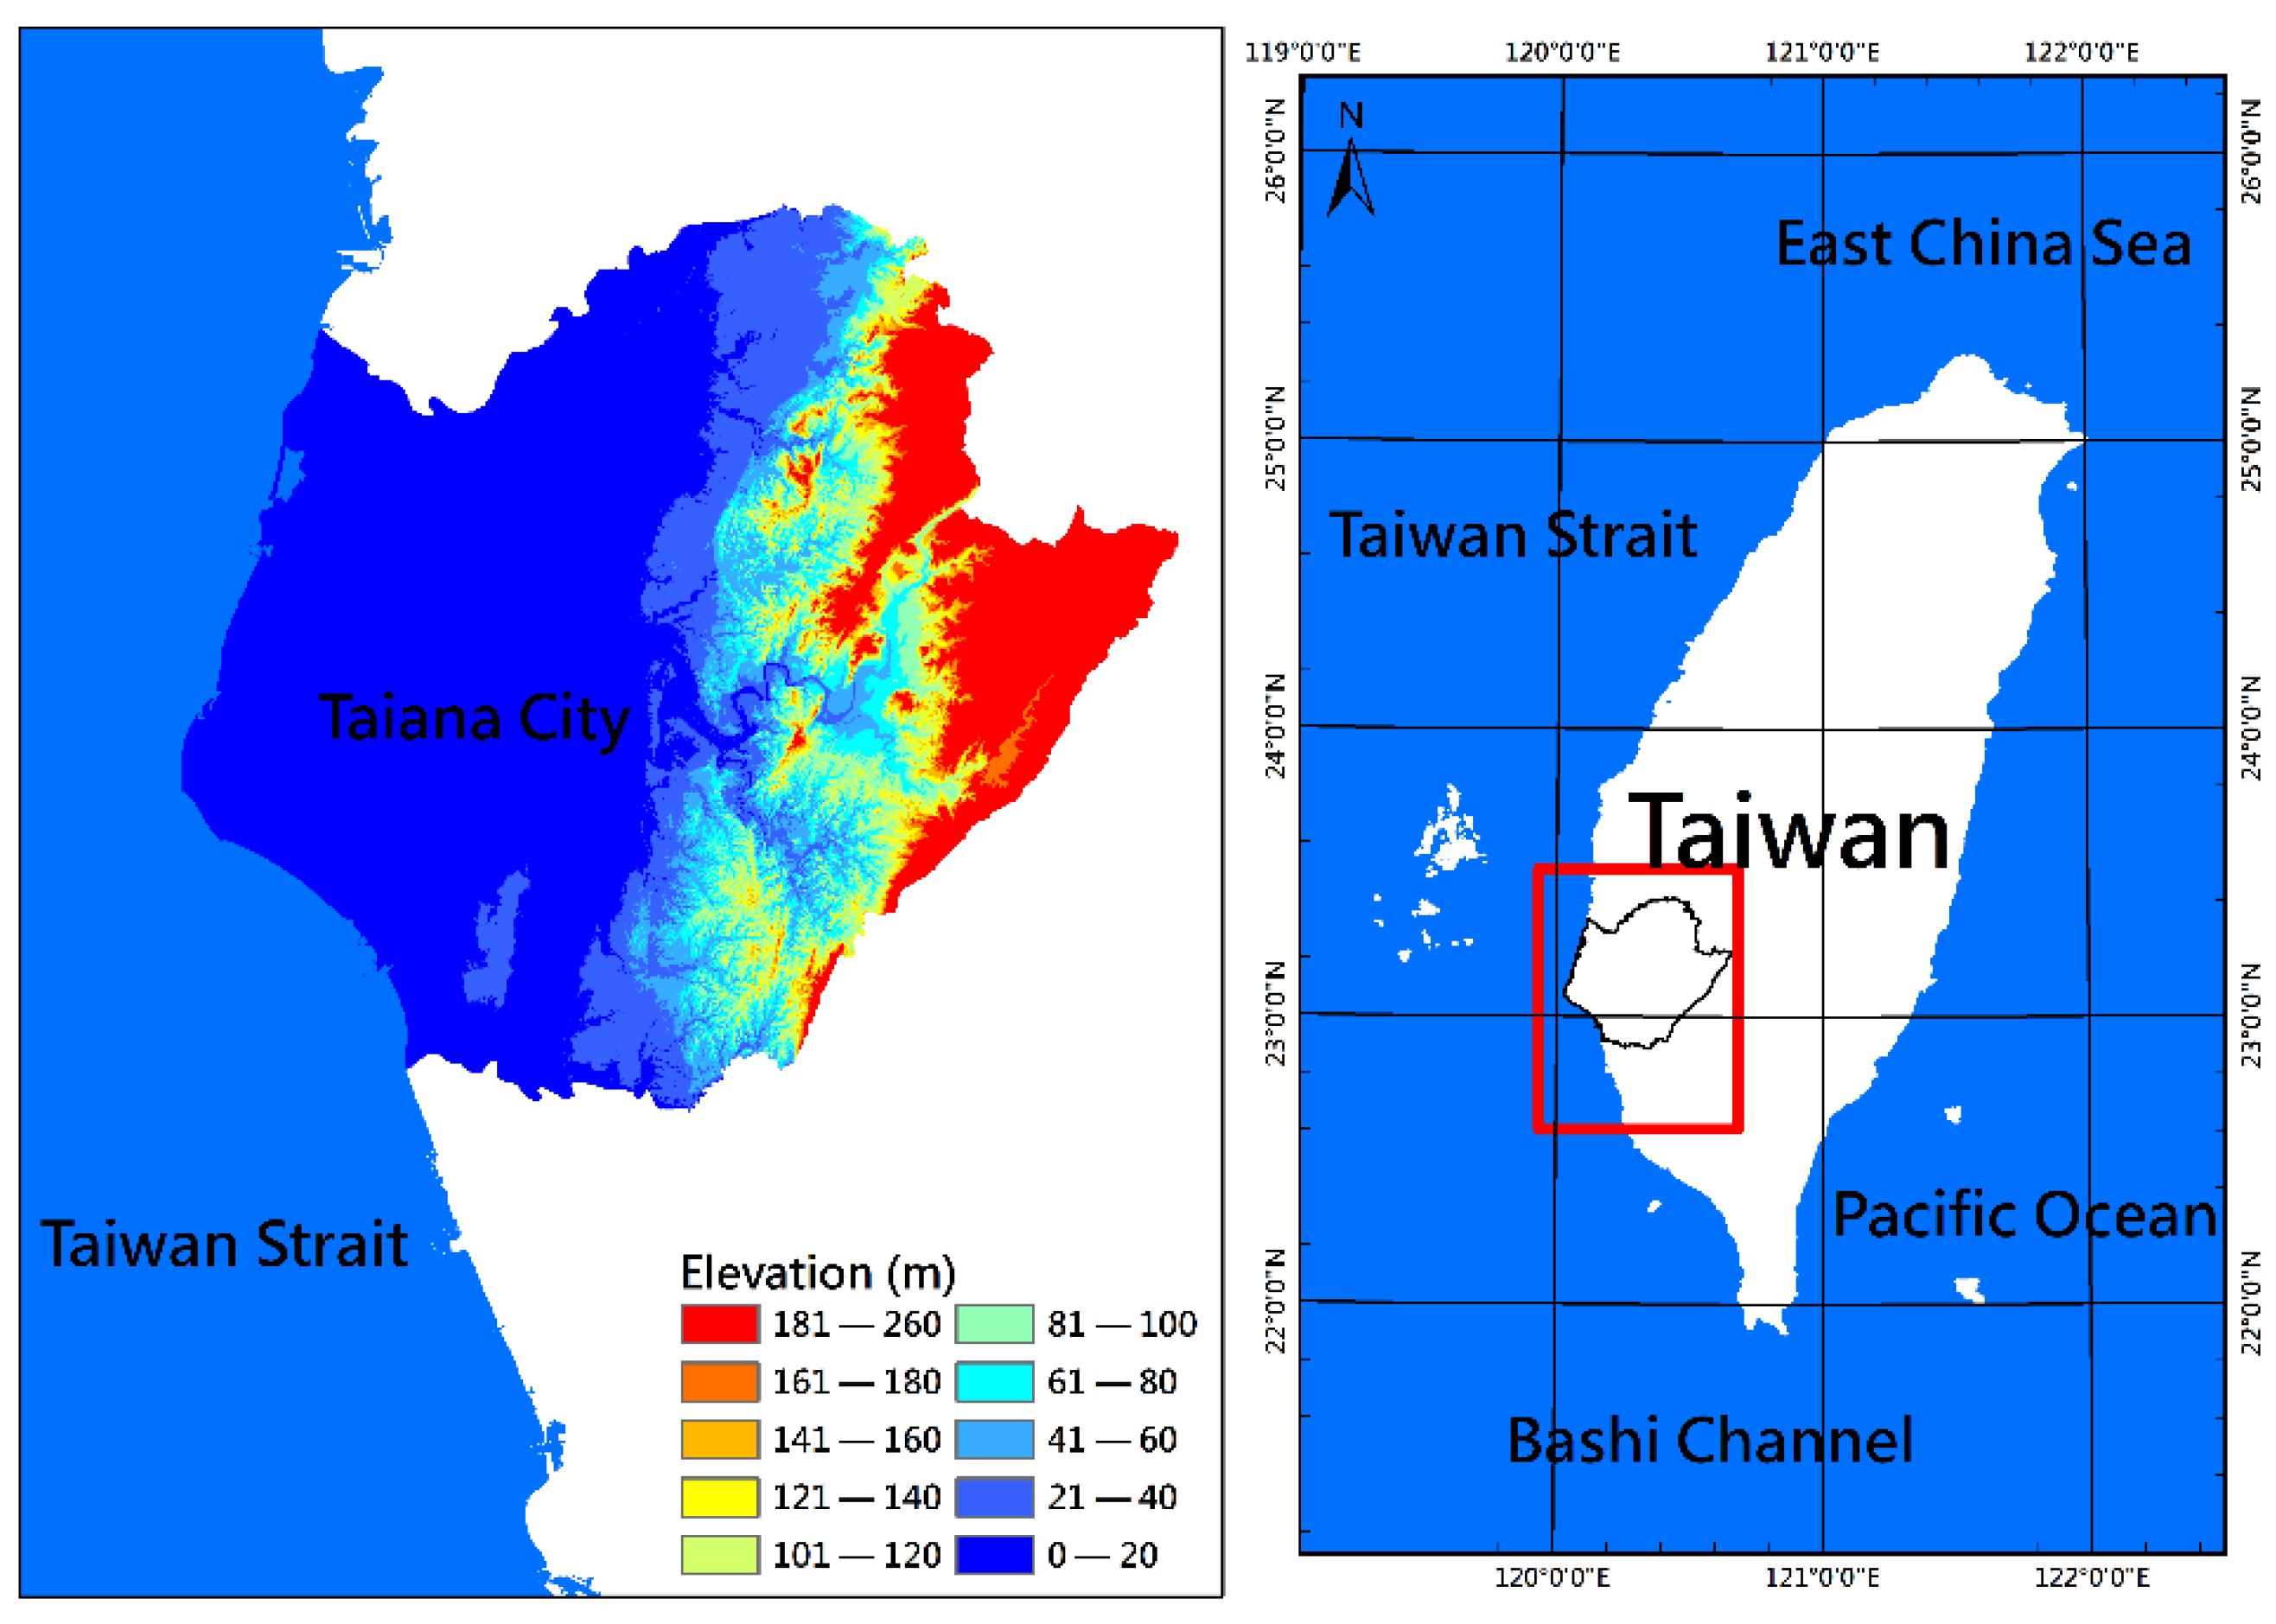
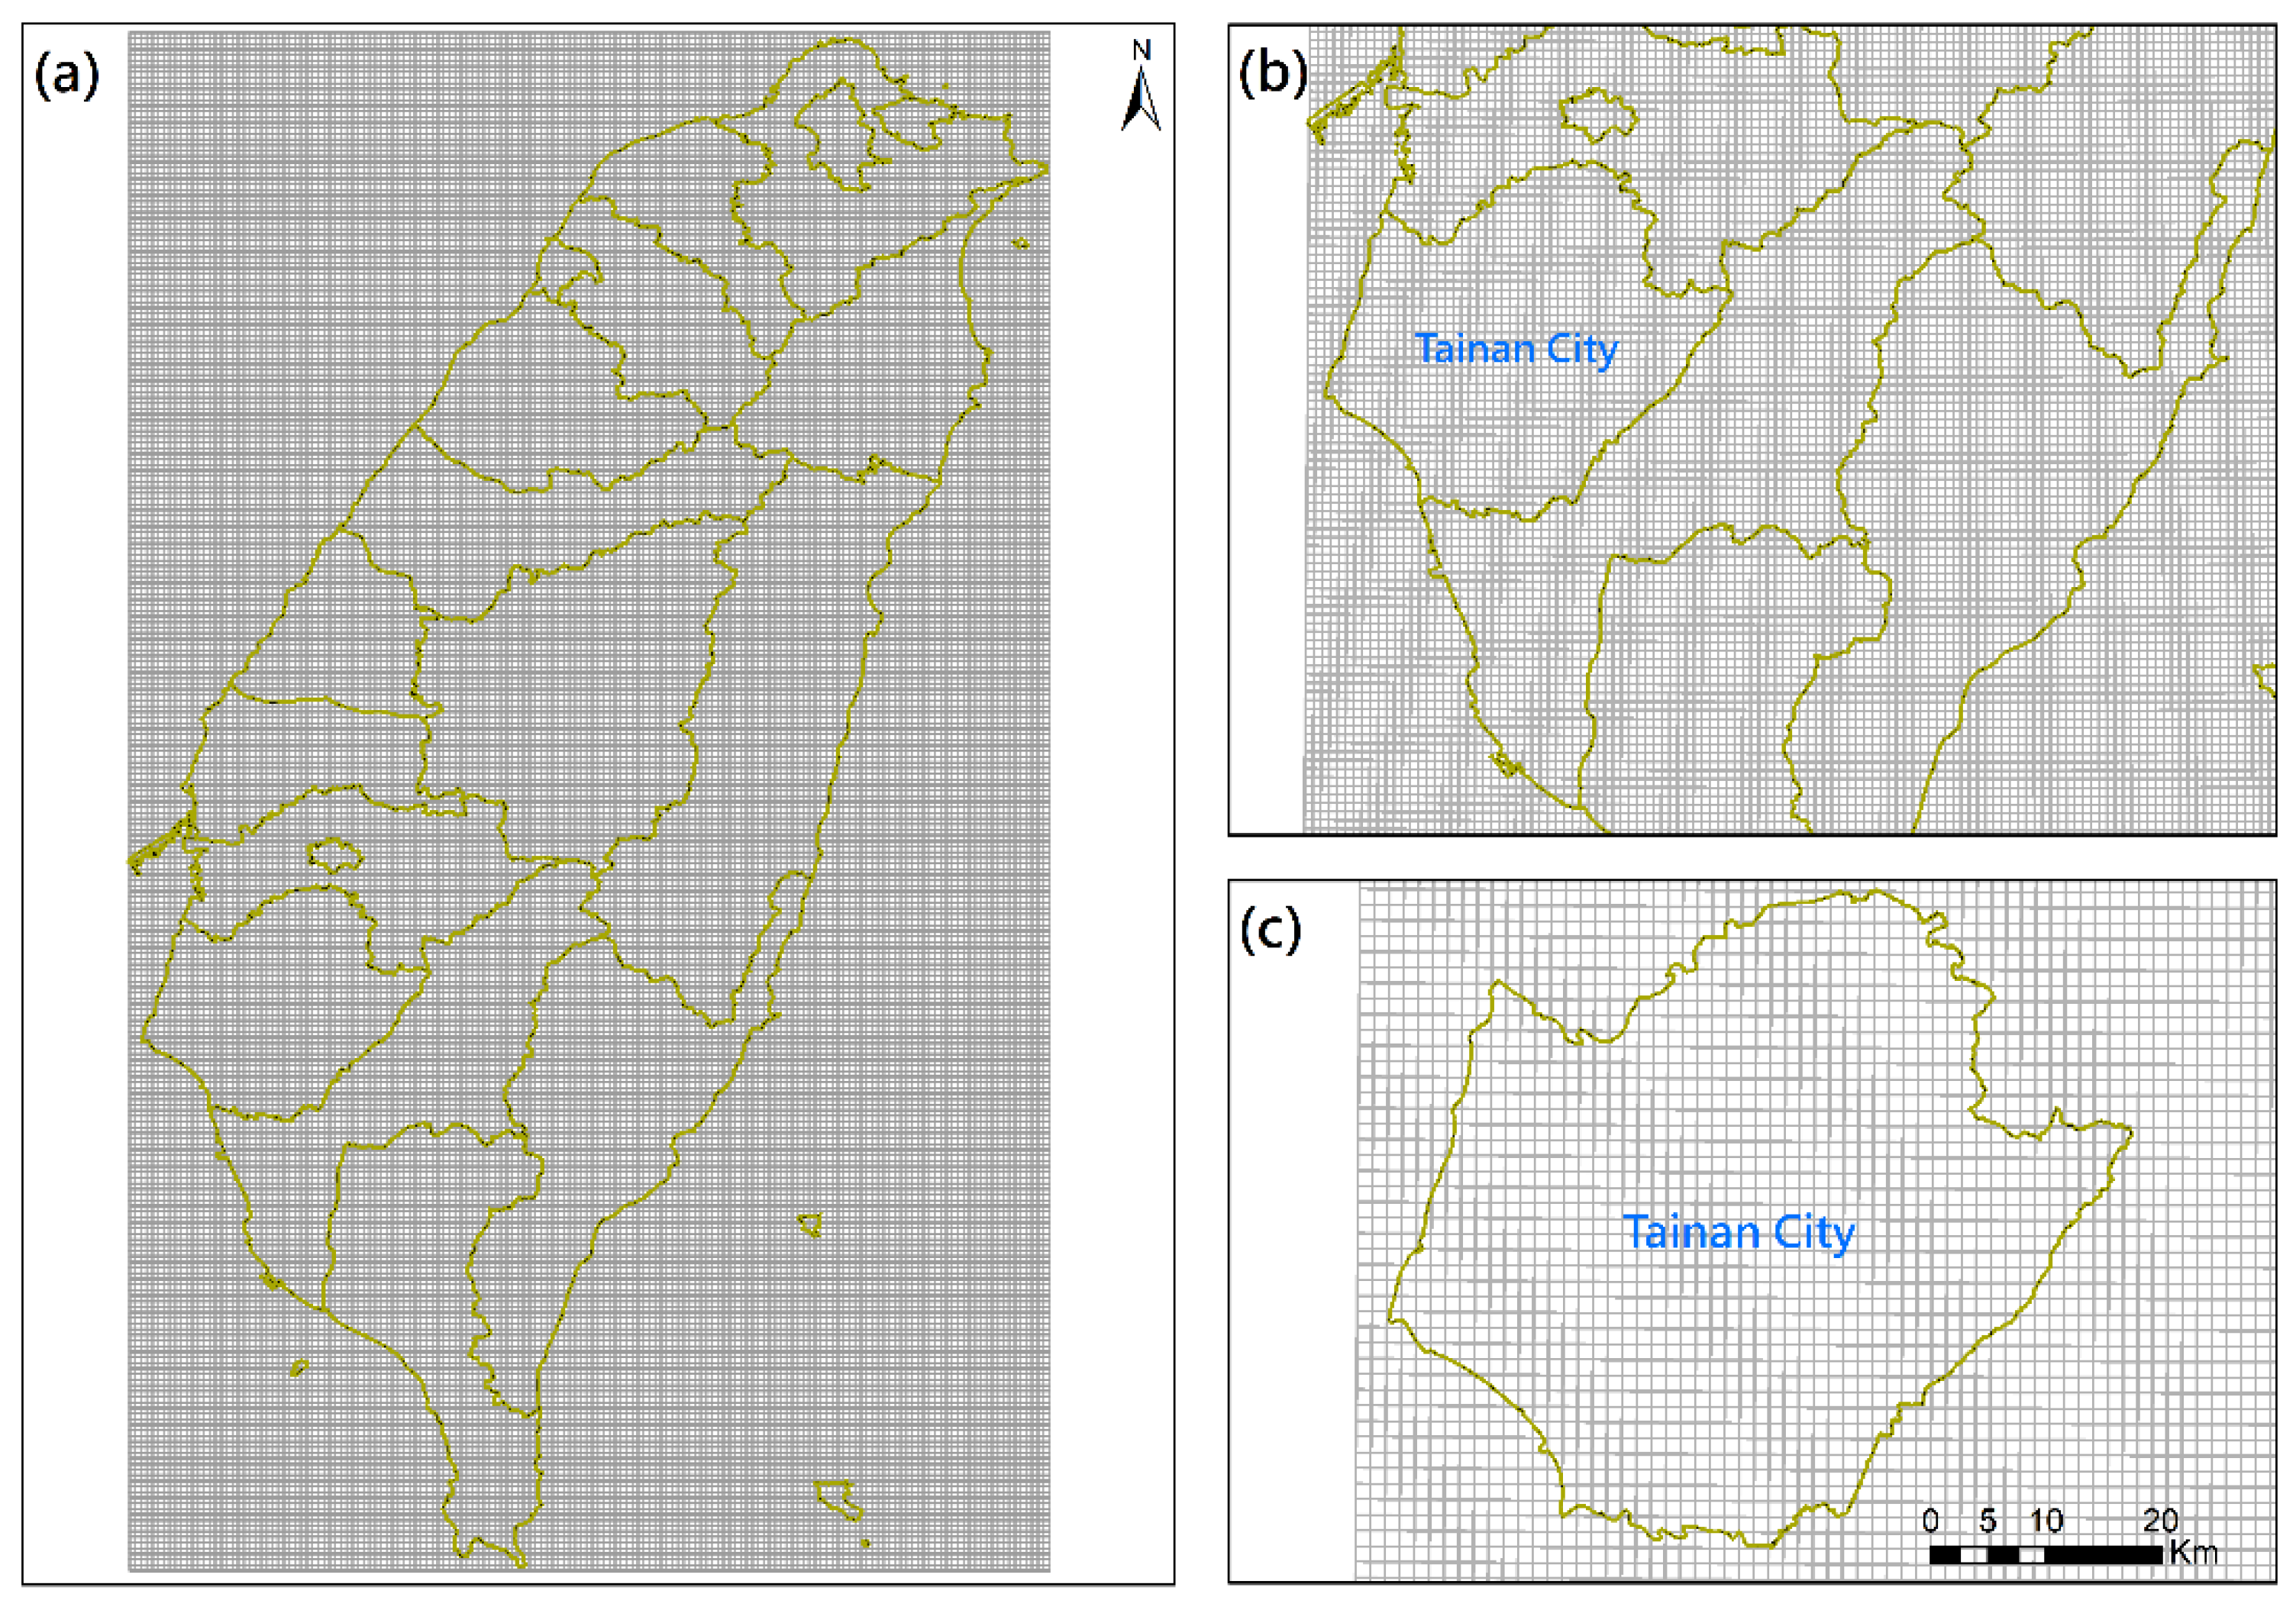
2.1. High-Resolution Digital Elevation Model and Local Geographic Data

The most fundamental requirement for a successful flash flood simulation or prediction is a large amount of high-resolution topographic data [10,11,12,13,14,15,16,17,18,19,20,21,22,23]; hence, the light detection and ranging (LiDAR) technique has been widely applied in creating a three-dimensional set of points for high-resolution DEMs with an accuracy of up to 0.1 m in the vertical direction. LiDAR technology is based on a scanning laser combined with both a global positioning system (GPS) and inertial technology. The LiDAR mounted on aerial vehicles, such as aircraft and helicopters, is called airborne LiDAR. Airborne LiDAR data can be used for landscape change and environmental monitoring, building structure construction, and three-dimensional DEM creation for mountains and plains. Due to the high efficiency of airborne LiDAR in terrain surveys and high-resolution and high-accuracy measurements, it is a useful tool for acquiring a lot of dense topographic data in a short time. In the present study, a DEM dataset derived from airborne LiDAR with a spatial resolution of 1 m for the entire Tainan city was obtained from the Department of Land Administration, Ministry of the Interior (M.O.I.) in Taiwan. Additionally, the geographic data of Tainan city, such as land use and Manning’s coefficient corresponding to land use, were provided by the Department of Land Administration, M.O.I., Taiwan.

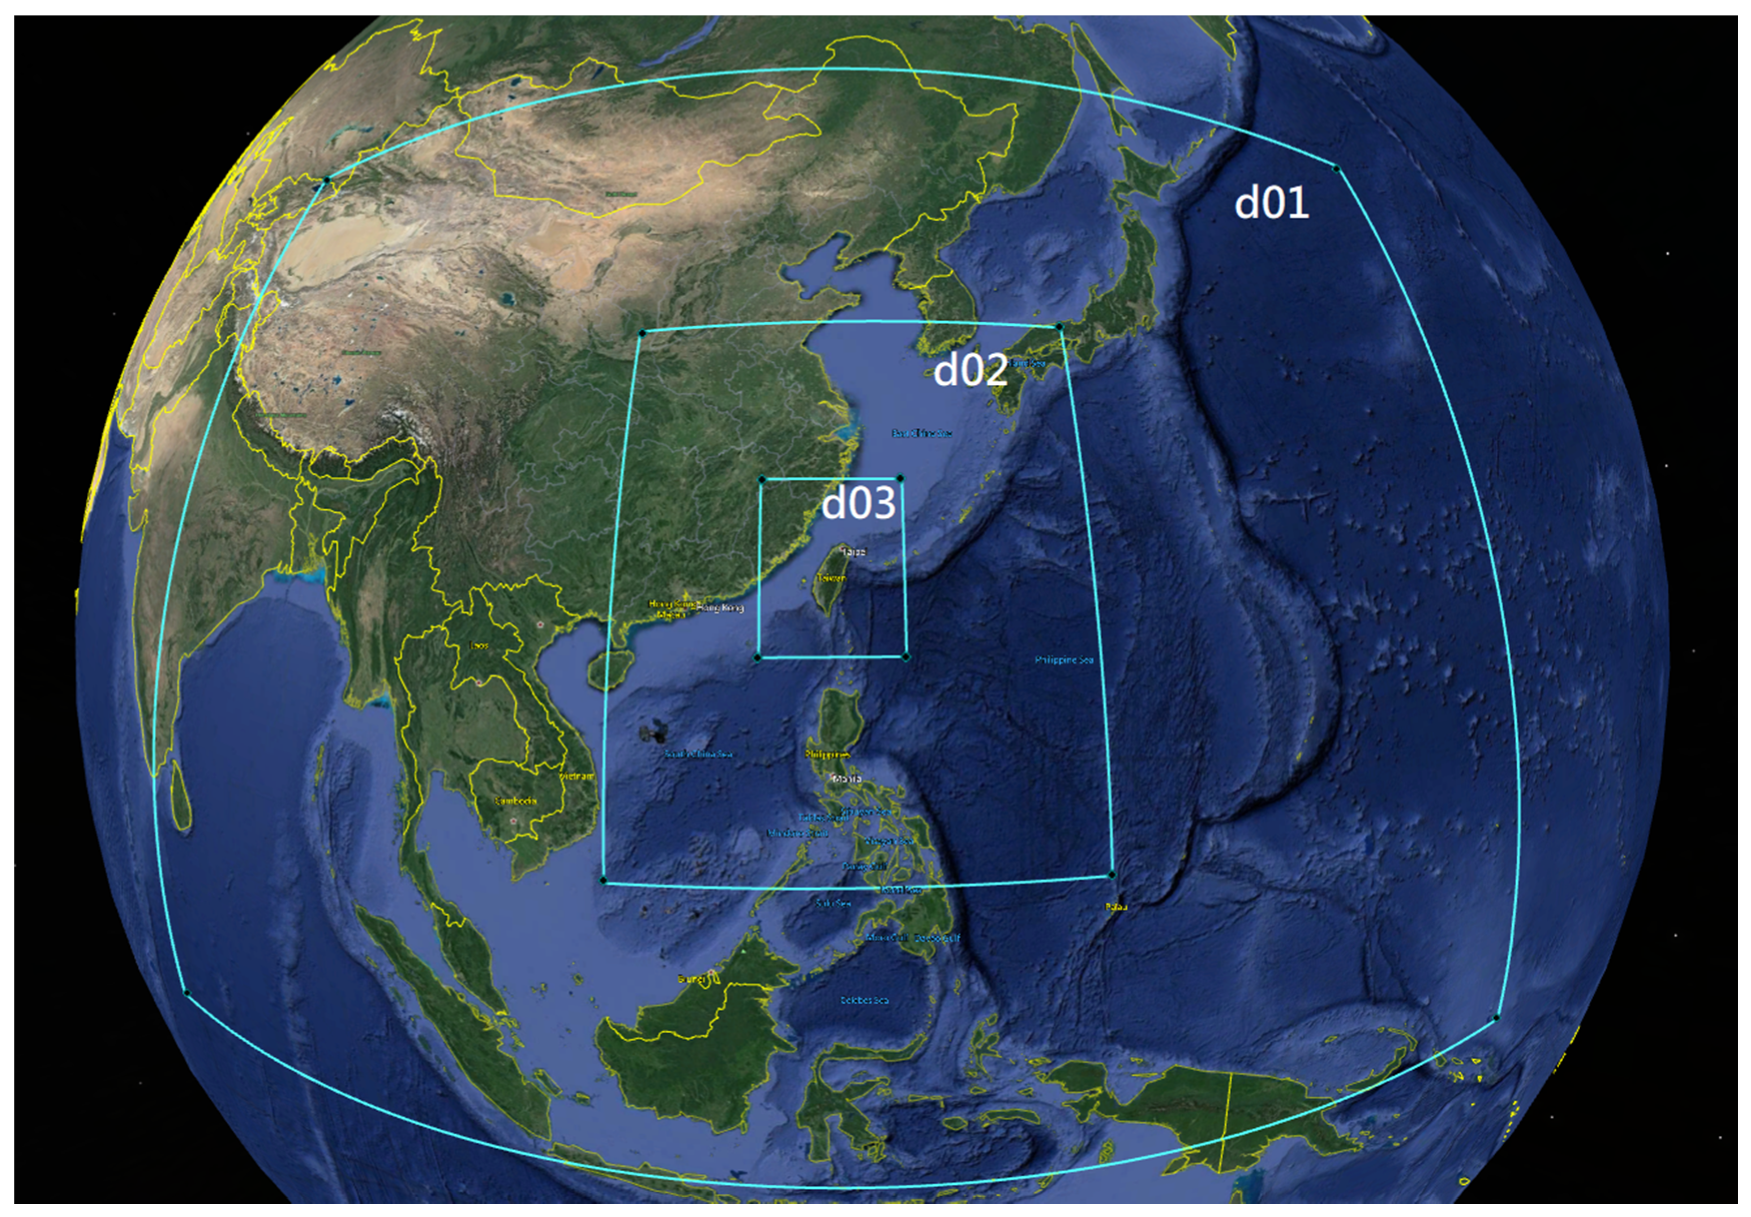
2.2. Atmospheric Model and Gridded Rainfall Data

Estimating the exact values of short timescale precipitation remains a challenge in numerical weather models [24,25,26]; this challenge is particularly apparent for extreme rainfall induced by afternoon thundershower/afternoon thunderstorms in plain areas. However, providing accurate rainfall data for hydrodynamic models is essential for successful and reliable pluvial flash flood forecasting/prediction or simulation. As a result, the Weather Research and Forecasting (WRF) model [27] was implemented to furnish the meteorological boundary conditions for stormwater drainage and hydrodynamic models. The WRF model is a next-generation mesoscale numerical weather prediction system officially supported by the National Center for Atmospheric Research (NCAR), and it is designed to serve as atmospheric research and operational weather forecasts. The WRF model is currently the most frequently used regional-coverage weather forecast model worldwide due to its computational efficiency and system extensibility. A wide range of meteorological applications across scales from tens of meters to thousands of kilometers can be attained through the nesting domain architecture in the WRF model. The WRF model has been used for severe weather forecasting, e.g., extreme precipitation [28,29], hurricanes, tropical cyclones, typhoons [30,31], thunderstorms [32,33], and intense rainfall associated with monsoons [34,35]. The WRF model can concentrate high-resolution meshes on a regional domain, which is unattainable using global models [36]. The present study employed a WRF model with three nested domains to predict future rainfall for pluvial flash flood forecasting. Figure 3 shows the extent of the three domains in the WRF model. The parent domain (d01, the outermost rectangle in Figure 3) lies between −5.35° N–42.93° N and 77.91° E–159.99° E with a horizontal resolution of 45 km; the first nested domain (d02) with a grid spacing of 15 km covers 9.13° N–35.39° N and 109.65° E–134.41° E, and a 5-km spatial resolution was used in the second nested domain (d03) with coverage between 20.02° N–28.29° N and 117.29° E–124.64° E. The data used to drive the parent domain of the WRF model in the present study were acquired from a global weather forecast model, the Global Forecast System (GFS), produced by the National Centers for Environmental Prediction (NCEP). This regional model is currently operating at the National Science and Technology Center for Disaster Reduction (NCDR) of Taiwan and provides rainfall forecasts four times a day for all of Taiwan. The rainfall predictions derived from the WRF model are believed to be reliable for early warnings of river stages and fluvial and pluvial flash floods in the mountainous and plain areas of Taiwan [23,37].
A system of quantitative precipitation estimation and segregation using multiple sensors (QPESUMS) was developed through the international collaboration between the National Oceanic and Atmospheric Administration (NOAA)/National Severe Storms Laboratory (NSSL) of the United States and the Central Weather Bureau (CWB) and the Water Resource Agency (WRA) of Taiwan. The quantitative precipitation estimation (QPE, [38]) and quantitative precipitation forecast (QPF) products are included in the QPESUMS system. The gridded rainfall data (with a spatial resolution of 1.25 km by 1.25 km) of the QPESUMS system comprise the observations acquired from rain gauges, weather radars, satellites, and numerical weather prediction model analyses. Figure 4 depicts the rainfall data grid distribution of the QPESUMS for Taiwan Island (Figure 4a), southern Taiwan (Figure 4b), and Tainan city (Figure 4c).

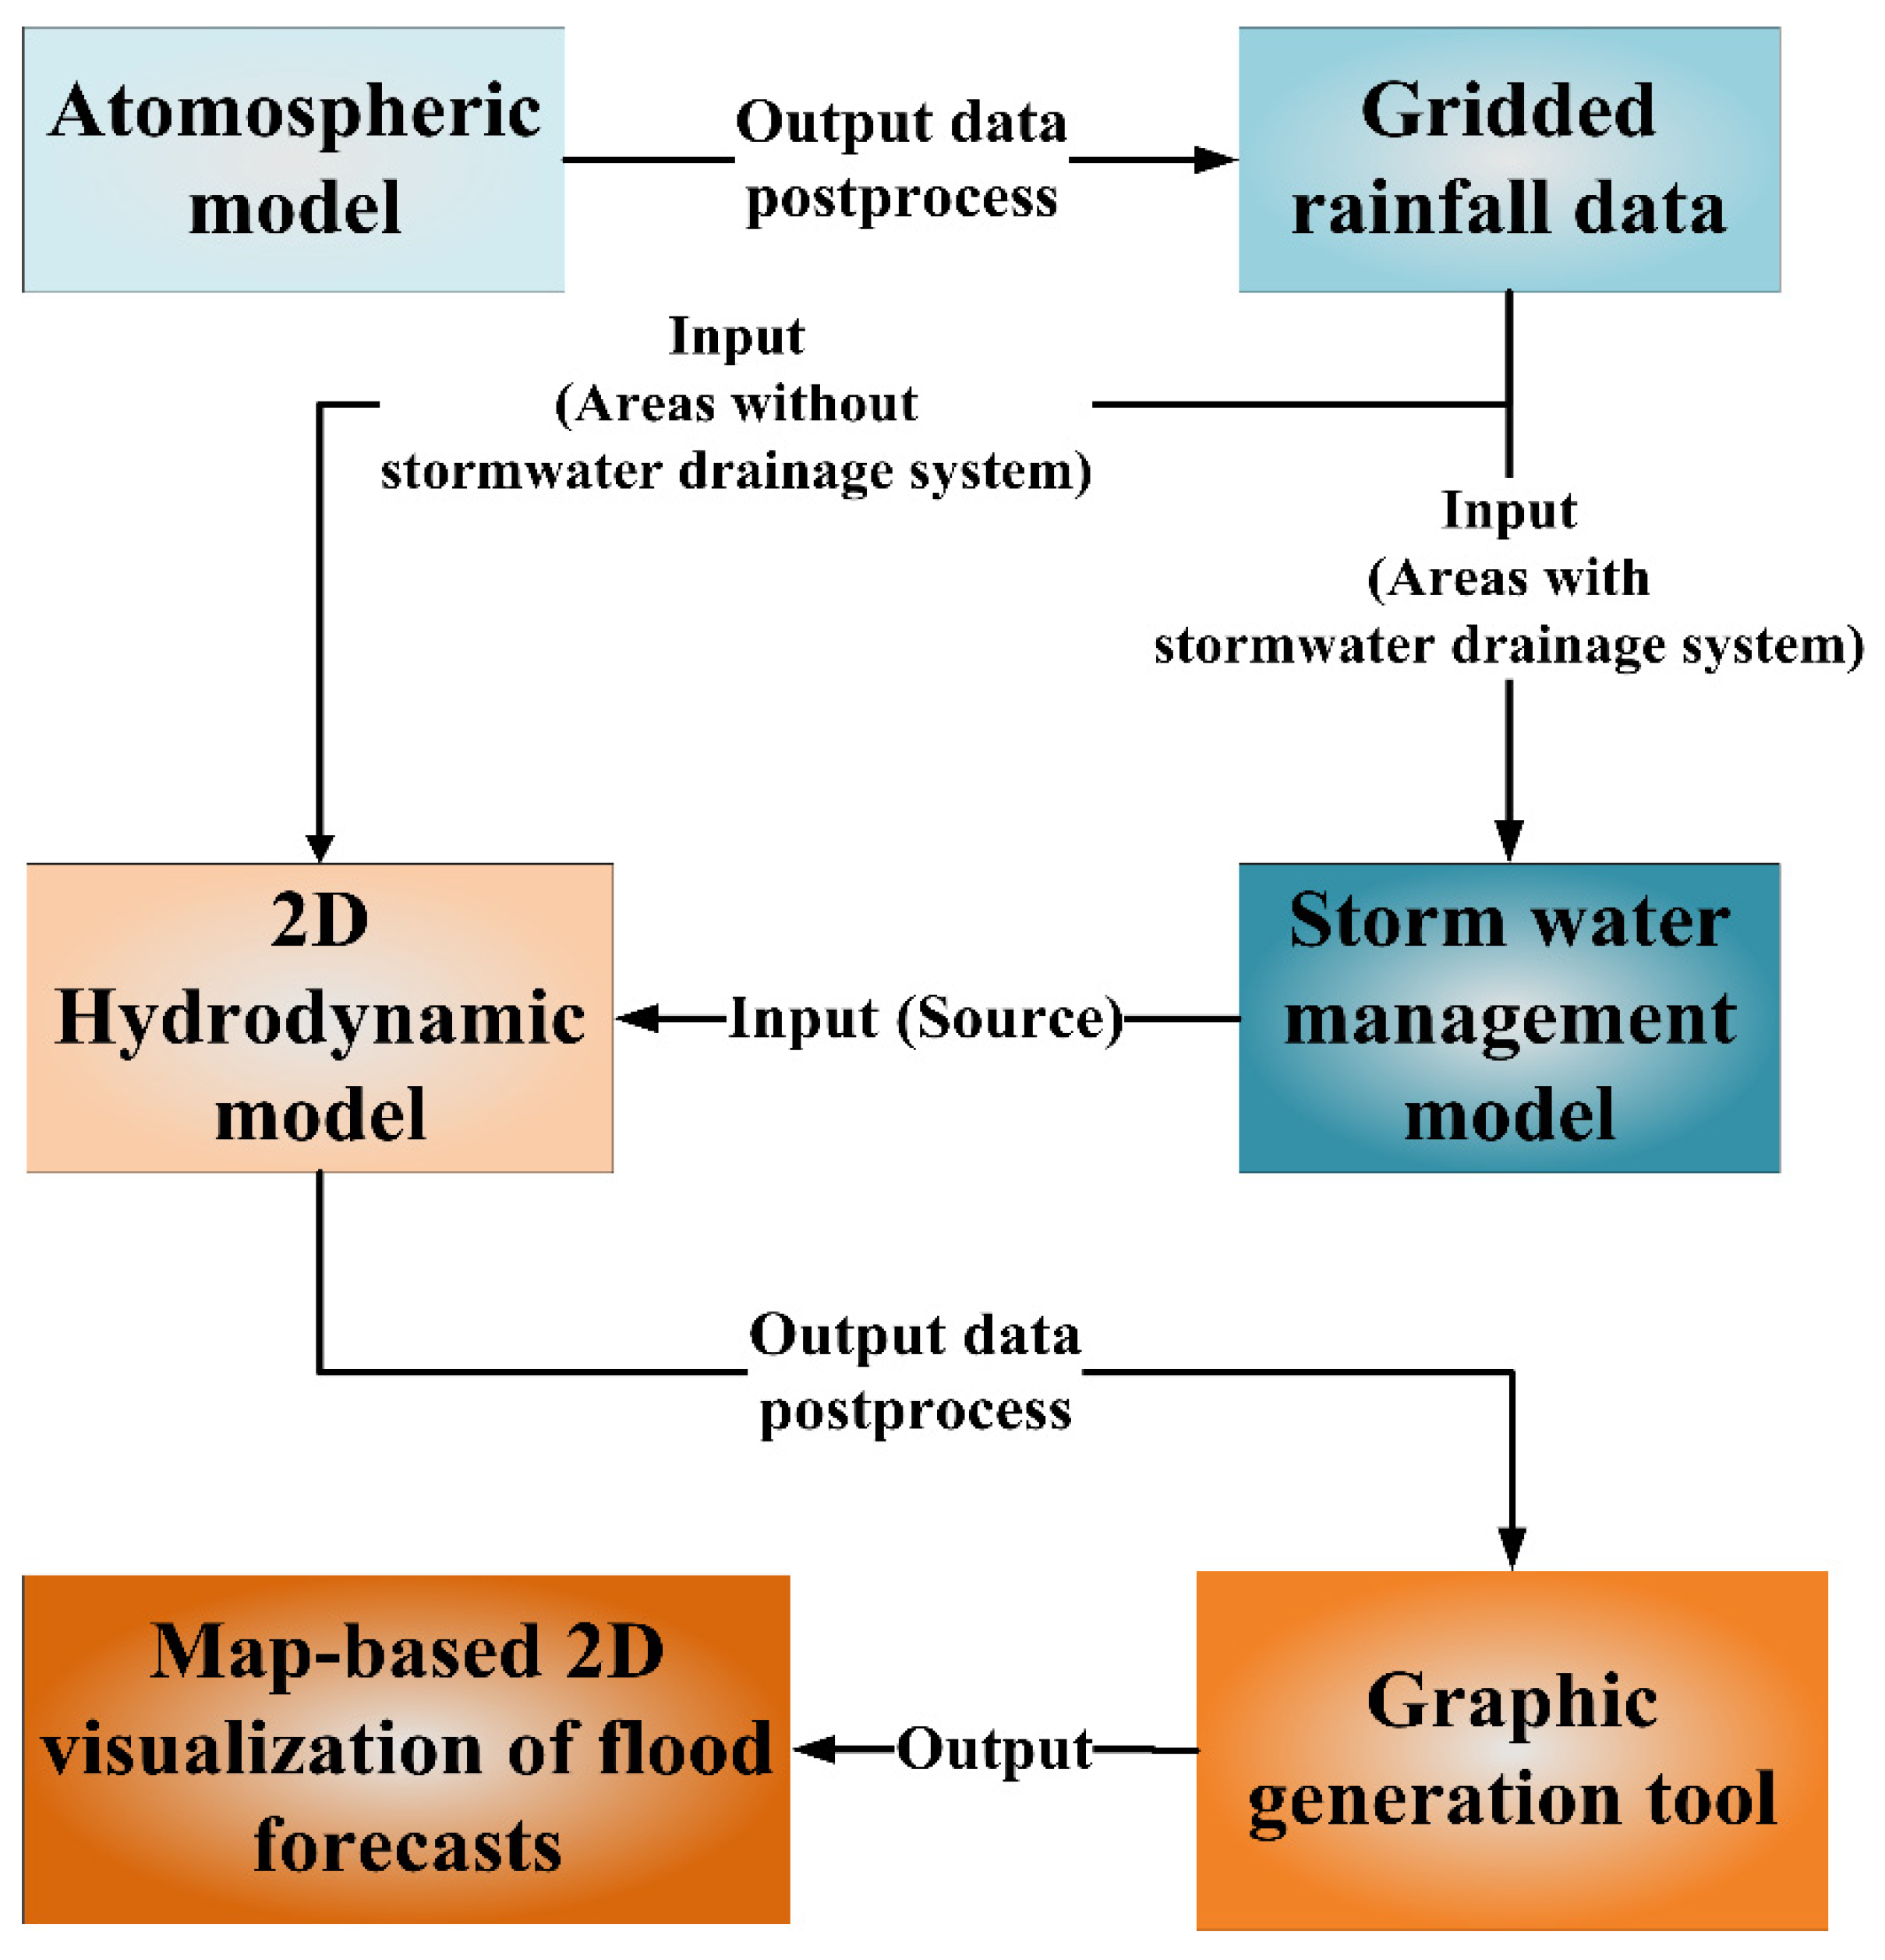
2.3. Two-Dimensional Dynamic Wave Model and Model Configuration

Although one-dimensional and quasi-two-dimensional structured-grid or raster-based hydrodynamic models are widely used for fluvial and pluvial flood inundation mapping [39,40], the application of unstructured-grid models to flooding hydrodynamic and hydraulic processes has made great progress in the past two decades. The unstructured grid enables meshes to be optimally spatially adapted in response to the evolving flow features, thus providing sufficient mesh resolution where it is required. The unstructured-grid model has the advantage of capturing the local flow details and wetting and drying fronts while reducing the computational cost [41]. The SCHISM (semi-implicit cross-scale hydroscience integrated system model) developed by Zhang et al. [42] is a seamless cross-scale hydrodynamic model based on unstructured hybrid triangular–quadrangular grids in the horizontal direction and hybrid localized sigma coordinates with Shaved Cell or LSC2 in the vertical direction [43,44]. Similar to the SELFE model (semi-implicit Eulerian–Lagrangian finite-element model [45]), the SCHISM employs a combination of a highly efficient semi-implicit finite-element/finite-volume method and an Eulerian–Lagrangian method [46] for the advection term to solve the Navier–Stokes equations in its hydrostatic form. As a result, the most stringent Courant–Friedrichsa–Lewy (CFL) stability condition can be bypassed even when using very fine resolution meshes, e.g., a few meters [47]. A single grid in the SCHISM can morph between 3D, 2DH, 2DV, and quasi-1D configurations in different parts of the computational domain because the utilization of a flexible 3D gridding system accomplishes model polymorphism. No bathymetry smoothing is necessary when adopting the SCHISM; hence, the original bathymetry or topography can be accurately preserved [47]. The SCHISM and SELFE are multipurpose models that have been successfully applied to predict the storm surge and sea-level rise-induced inundation depth and extent in coastal and estuarine areas [48,49,50], as well as to simulate river stage [51], assess the tidal current power for a small island [52], and investigate the fate and transport of fecal coliform contamination in a tidal estuarine system [53].
Because the water depth is much smaller than the horizontal dimensions of the water body in flood modeling, two-dimensional shallow water equations (dynamic waves) are sufficient to mimic flood flows in large areas. A SCHISM-based 2DH and quasi-1D configuration model (SCHISM-FLOOD) was developed for city-scale pluvial flash flood simulation and forecasting in the present study. As shown in Figure 5, the computational domain covers one-third of the entire Tainan city with an area of approximately 1425 km2 (within the white line in Figure 5). The simulation domain of the SCHISM-FLOOD consisted of 1,671,830 triangular elements and 841,479 nodes. Coarse meshes with 50-m resolutions were distributed in areas with elevations above 30 m, and fine meshes with 5-m resolutions were arranged in the plain areas that are prone to flooding. The 1-m resolution gridded DEM data of Tainan city derived from airborne LiDAR (as mentioned in Section 2.1) were interpolated to each node of the SCHISM-FLOOD to represent the bottom elevations in the model. Figure 6 illustrates a three-dimensional view of the topography for the computational domain. Since historical large-scale flooding events have usually occurred in the low-lying area of Tainan city, the areas with bottom elevations below 70 m were included in the computational domain. Additionally, fluvial floods (floods induced by overflows of rivers, lakes, or streams) were excluded from the present study. Manning coefficients in the SCHISM-FLOOD were determined according to the land use type (as shown in Figure 7) of Tainan city, and their spatial distribution is demonstrated in Figure 8. A time step of 60 s was set in the SCHISM-FLOOD based on the numerical stability and the model validation of historical inundation events that occurred in Tainan city.

2.4. Storm Water Management Model

The Storm Water Management Model (SWMM) developed by the United States Environmental Protection Agency (EPA) is a comprehensive mathematical model for the simulation of urban runoff quantity and quality in the storm and combined sewer systems. SWMM can be used for simulating all aspects of urban hydrologic and quality cycles, including surface and subsurface runoff, transport through the stormwater drainage network, storage, and treatment. One of the key modules of the SWMM is its unsteady flow equation solver, which is based on the EXTRAN algorithm developed by Roesner et al. [54] and Rossman [55]. The bottom orifice in the EXTRAN module was adopted to simulate the overflows through manholes on streets or roads. The spatial distribution of stormwater drainage networks in Tainan city is shown in Figure 5. The penetration rate of the stormwater drainage system in southern Tainan is higher than that in northern Tainan.

2.5. Tidal Effect

Eight main tidal constituents (M2, S2, N2, K2, K1, O1, P1, and Q1) were extracted from a regional inverse tidal model (China Seas and Indonesia, [56]) and served as the tidal boundary conditions along the coastline in the hydrodynamic model.

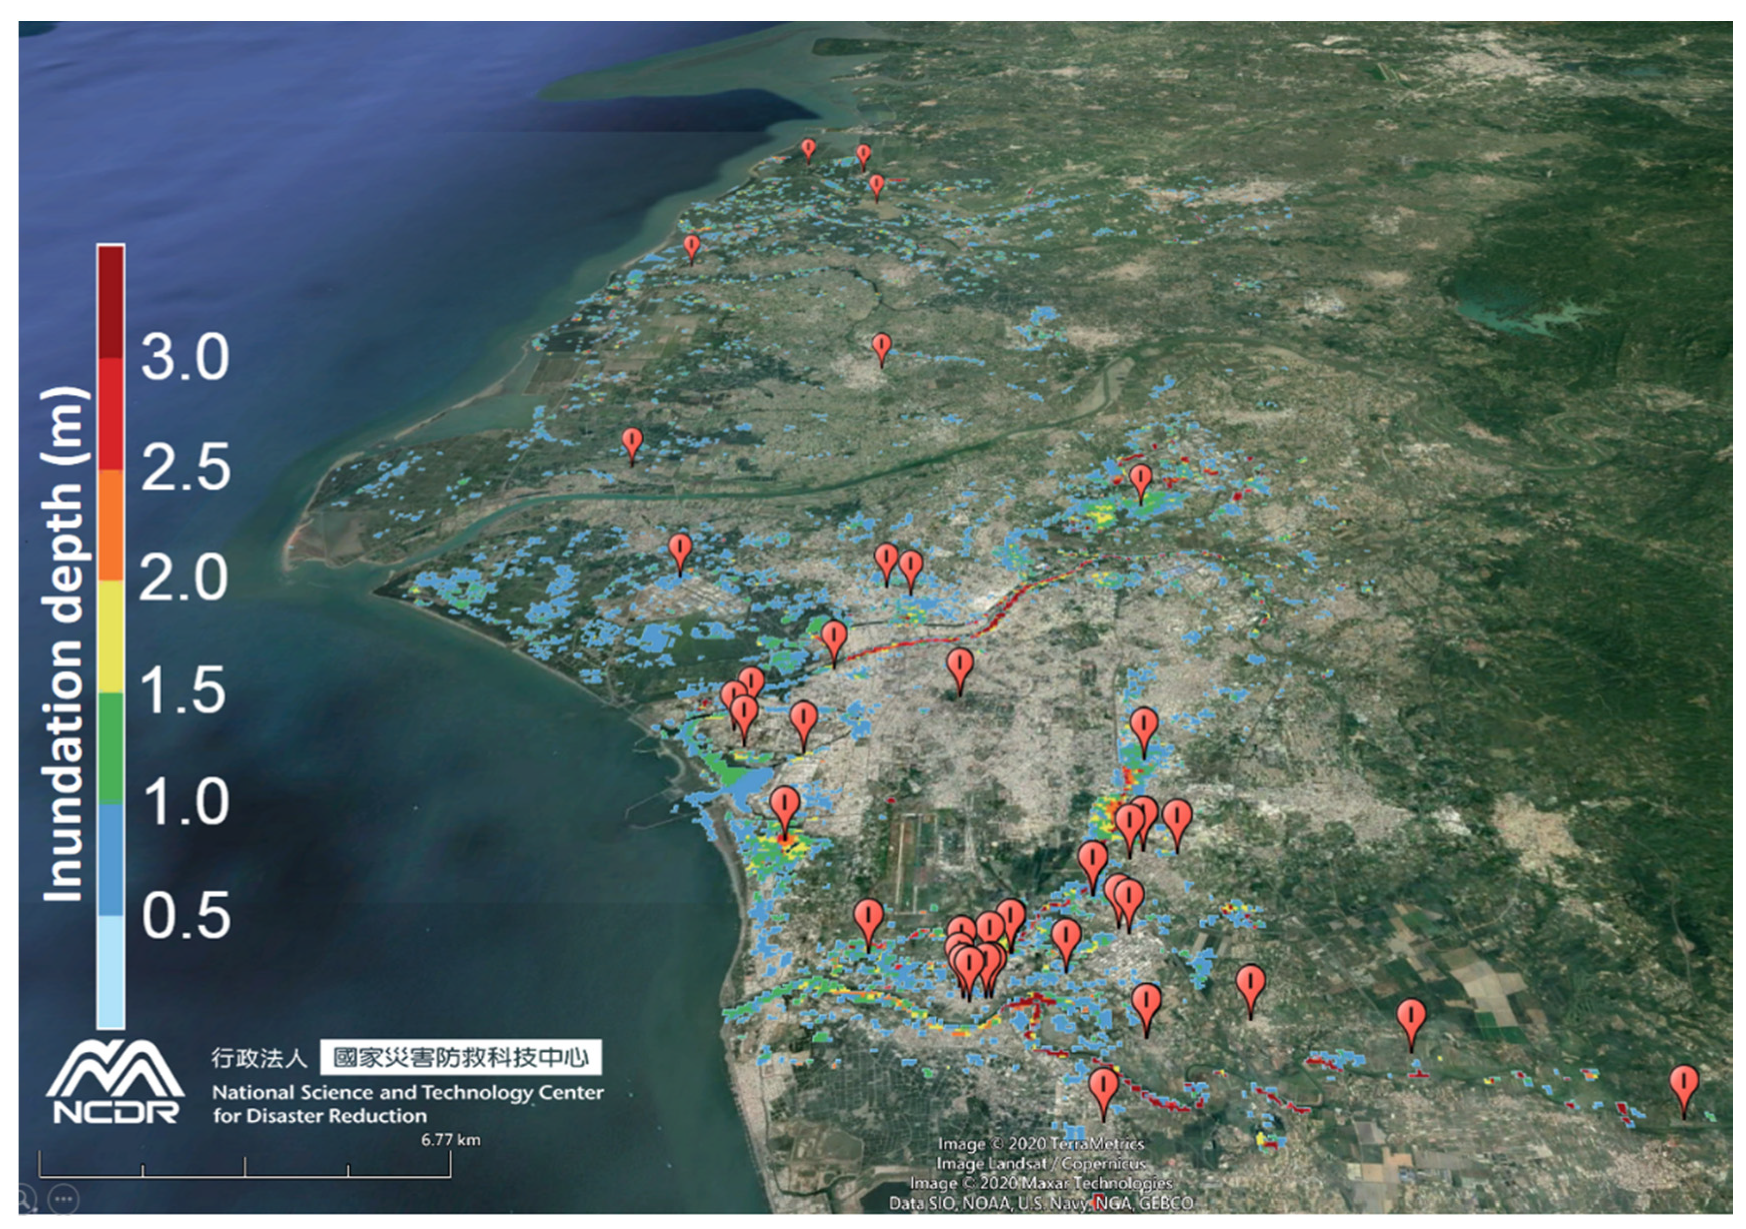
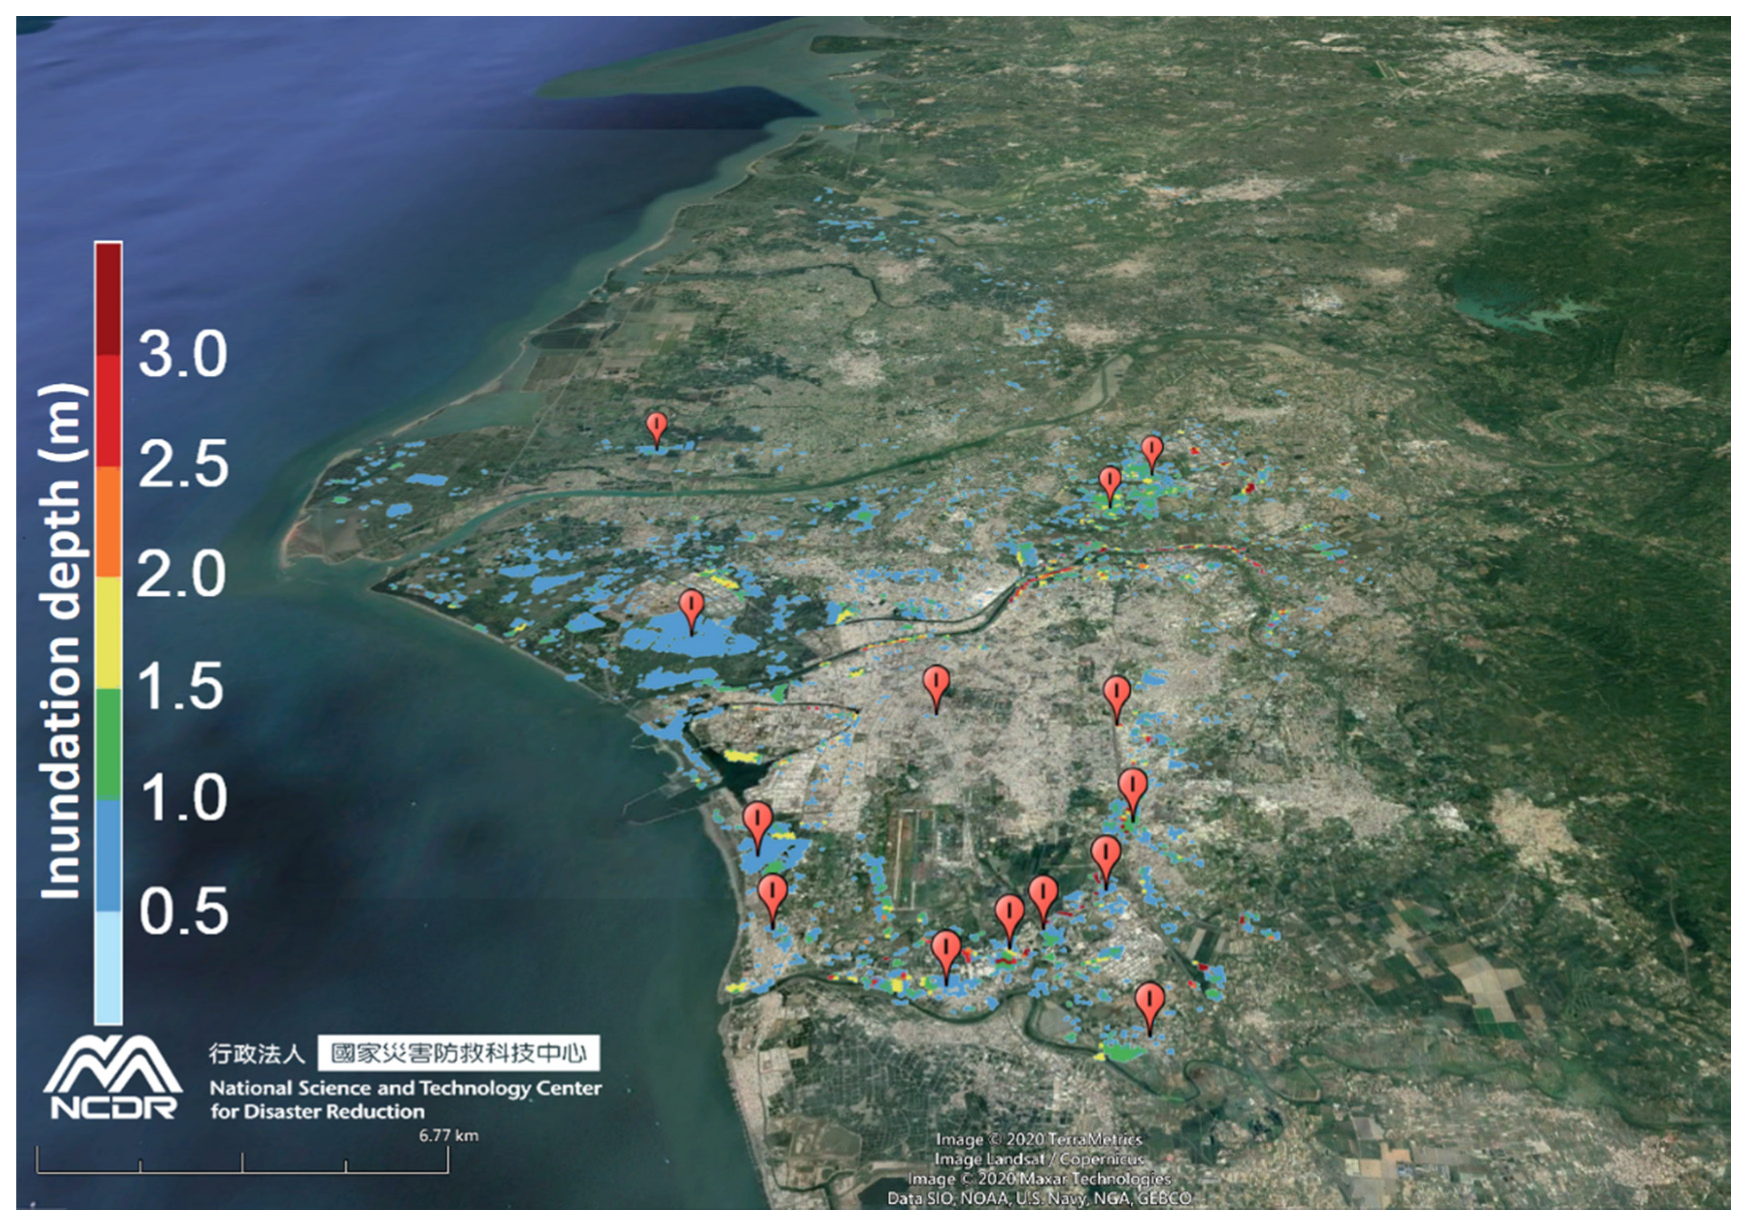
2.6. Visualization of Pluvial Flash Flood Forecast

Visualization is an important and powerful technology for illustrating data and expressing information from numerical models [57]. One of the purposes of the present study is to apply a visualization tool to display large-scale pluvial flash flood forecasts. In the development of operational high-performance forecasting systems for pluvial flash floods, visualization is an indispensable component. The NCAR Command Language (NCL) is a product developed by the Computational & Information Systems Laboratory at NCAR and sponsored by the National Science Foundation. NCL is an open-source, free interpreted language designed specifically for scientific data processing and visualization. Moreover, many examples of NCL scripts and their corresponding graphics are also available on their homepage and can be executed on various platforms. These advantages mentioned above are very beneficial for implementing an operational forecasting system on high-performance computer clusters; hence, NCL was utilized as a visualization component in the present study.

3. Results

3.1. Evaluation of Forecasting Performance

Pluvial floods in city-scale areas often occur rapidly such that obtaining a satisfactory measurement of flooding extent and depth is difficult and is usually carried out after the disasters. The first examinations of the forecasting system were conducted by comparing the hindcasted and surveyed flooding extents in the computational domain, i.e., Tainan city. Two historical events with large-scale inundation that occurred in the plain areas of Tainan city in June 2005 and August 2009 were hindcasted by the SCHISM-FLOOD, in which the former was caused by torrential rain, and the latter was due to Typhoon Morakot. The QPESUMS grids within or partially overlapping Tainan city (as mentioned in Section 2.2 and shown in Figure 4c) were interpolated onto each grid of the SCHISM-FLOOD and served as rainfall data inputs for the SCHISM-FLOOD (as mentioned in Section 2.3) and SWMM (as mentioned in Section 2.4) to calculate the overland flows and orifice flows, respectively. The interpolation of each SCHISM-FLOOD grid was performed using the inverse distance weighted method with the four QPESUMS points nearest the prediction location. The actual flooding areas were surveyed by the WRA of Taiwan and provided to compare pluvial flash flood simulations in the present study. Figure 9 demonstrates the comparison of flood extent between hindcasts and surveys induced by torrential rain in Tainan city on 12 June 2005. The white shaded polygons shown in Figure 9 are surveyed, while areas with colors represent model hindcasts. The surveyed (white shaded polygons) and hindcasted (areas with colors) flood extents caused by intense rain from Typhoon Morakot in 2009 are illustrated in Figure 10. The hindcasted flood extents were underestimated compared with the surveys in these two large-scale inundation events. The surveyed flooding areas in Tainan city were approximately 303.5 and 616.3 km2 for the torrential rain event on 12 June 2005 and the intense rain event resulting from Typhoon Morakot on 8–9 August 2009, respectively. The SCHISM-FLOOD hindcasted flooding extents in Tainan city were approximately 276.2 and 548.5 km2 for the torrential rain event on 12 June 2005 and Typhoon Morakot on 8–9 August 2009, respectively. Thus, the SCHISM-FLOOD underestimated the flooding areas by approximately 9 and 11% for these two large-scale inundation events. This phenomenon is particularly significant in the hindcast-survey comparison of the flood extent caused by Typhoon Morakot in 2009 (as shown in Figure 10), and the reason for this phenomenon is explained in the Discussion section.

3.2. Implementation of an Operational High-Performance Forecasting System for Pluvial Flash Floods

An operational high-performance forecasting system for pluvial flash floods was mainly composed of the atmospheric model (WRF), SWMM, and two-dimensional dynamic wave model (SCHISM-FLOOD). The WRF-derived precipitation forecast is one of the important factors affecting the accuracy of pluvial flash flood prediction; therefore, the original rainfall forecasts for the 5-km spatial resolution second nested domain (d03) of the WRF model were interpolated on the finer meshes with a spatial resolution of 1.25 km, which was the same as that of QPESUMS. The coverage of the 1.25-km spatial resolution rainfall forecast (interpolated from the WRF model) was also identical to that of QPESUMS (as shown in Figure 4a) for comparing the rainfall between the predictions and observations. Similar to the procedure for validating the SCHISM-FLOOD, the rainfall forecast grids with a spatial resolution of 1.25 km within or partially overlapping Tainan city were interpolated onto each grid of the SCHISM-FLOOD and served as rainfall data inputs for the SCHISM-FLOOD to compute the overland flows in the area without a stormwater drainage system and for SWMM to compute the overland flows and orifice flows in the area with a stormwater drainage system. Thus, the extent and depth of pluvial flash flood-generated inundation can be forecasted by an operational high-performance forecasting system developed in the present study. The visualization of predicted inundations (flooding depth and extent) was conducted by the NCL, as described in Section 2.6). The operational high-performance forecasting system predicts whether pluvial flash floods will occur in Tainan city over the subsequent 24 h. Two-dimensional visualization of the forecasting system for flooding extent and depth time series was superimposed on Google Earth software, and then a map-based animated KMZ (Zipped KML (Keyhole Markup Language)) file was created to present the flood forecasts. Figure 11 elucidates a flow chart and the main components of the operational high-performance forecasting system for pluvial flash floods. This forecasting system operated automatically on high-performance computers through a shell script at the National Science and Technology Center for Disaster Reduction (NCDR), Taiwan. Figure 12 compares the forecasted and reported flood locations induced by intense rainfall in Tainan city on 22 May 2020, in which areas with colors indicate the predictions by the operational high-performance forecasting system for pluvial flash floods, while red points are flood locations reported by residents. Another pluvial flash flood event that occurred in Tainan city on 26 August 2020, as shown in Figure 13, was also used to examine the forecasting capabilities of the system. Overall, the forecasting system has the ability to predict the spatial distribution of pluvial flash floods for a city-scale plain area.

4. Discussion and Uncertainty

Although the large-scale flood depth was not recorded during the two inundation events, the maximum flood depths were estimated to be 2.0–2.5 m and 2.5–3.0 m for the inundation events that occurred on 12 June in 2005 and during Typhoon Morakot in 2009, respectively, according to the hindcasts from the SCHISM-FLOOD. As shown in Figure 9 and Figure 10, the hindcasted flood extents were underestimated and compared with the surveys, and the underestimations were particularly significant for Typhoon Morakot-induced flash flood events in Tainan city in 2009 (Figure 10). This result is because, thus far, fluvial floods (known as river floods) were not included in the two-dimensional dynamic wave inundation model. However, this weakness can be immediately improved if accurate river cross-sectional data can be obtained. Additionally, hydraulic structures, such as regional drainage systems and detention ponds, could also be considered in forecasting systems in the future.
Although the underestimations of the forecasting system for flooding areas were approximately 9 and 11% for two large-scale inundation events (as mentioned in Section 3.1), a visual inspection shows that the surveyed flood extents seem larger than hindcasts exceeding 9 or 11%. The discrepancy originated because the hindcasted and surveyed flooded extents did not completely cover each other. This phenomenon is particularly true for the areas which were flooded in hindcasts but did not show any floods in surveys at all and vice versa. It should be emphasized that the forecasting system implemented in the present study was not always running with a small error of 9% to 11%.
Dimitriadis et al. [58] applied three models (HEC-RAS, LISFLOOD-FP, and FLO-2d) to a benchmark test and real-world flood propagation problems. They found that the flood volume uncertainty is generally an increasing function of the floodplain friction, the lateral gradient, and the grid cell size. Hence, the land cover/land use data related to Manning’s coefficient in Tainan city should be surveyed and updated every 3–5 years to minimize the flood volume uncertainty caused by hydrodynamic/hydraulic modeling.
A sufficient lead time for an effective response is the primary task of pluvial flash flood forecasting, and to this end, using a triple-nested WRF model with a high resolution of 5 km is a compromise between limited computing resources and real-time forecasts. However, Hong and Lee [59] indicated that the employment of a triple-nested WRF model with a high resolution of 3 km horizontal grid spacing could reasonably reproduce precipitation in its distribution. Weisman et al. [60] and Clark et al. [61] also suggested that convection-allowing numerical weather prediction models with fine horizontal grid spacing provide value-added predictions for severe convective storms and their associated heavy rainfall. Thus, a WRF model with a spatial resolution of less than 5 km (e.g., 3 or 4 km) should be implemented for predicting flash flood heavy rainfall events in Taiwan.
The ensemble rainfall prediction system could provide useful probability information and minimize the uncertainty in pluvial flash flood forecasting because it provides a more reliable precipitation forecast than a single deterministic prediction [62] and should be included in the operational high-performance forecasting system for pluvial flash floods. Moreover, further assessment of selecting the most appropriate atmospheric model for rainfall prediction could be accomplished by means of an ensemble meteorological modeling system.
Flooding in low-lying coastal areas is sometimes related to variations in tides; for instance, if heavy rainfall coincides with high tide, floods or aggravation of flood disasters are likely to occur. Moreover, coastal floods will be more severe when positive storm surges are created by strong onshore winds from typhoons combined with high tides and wind waves [63]. In addition to tides, the effect of a storm surge on flooding in low-lying coastal areas could be involved in the forecasting system in the future, although storm surges are relatively minor compared with astronomical tides along the southwest coast of Taiwan [64].

5. Summary and Conclusions

A triple-nested WRF model with a high resolution of 5 km horizontal grid spacing forecasted the precipitation time series and then interpolated onto regular grids with a spatial resolution of 1.25 km by 1.25 km for all of Taiwan. The 1.25-km resolution rainfall grids within or partially overlapping Tainan city served as meteorological inputs for the SCHISM-FLOOD (semi-implicit cross-scale hydroscience integrated system model with 2DH and quasi-1D configurations) and SWMM to forecast pluvial flash floods. The NCL has the ability to generate a high-quality graphic output efficiently; therefore, the NCL was utilized as a visualization tool for the forecasting system. The two-dimensional visualization of flood extent and depth time series forecasted by the system was superimposed on Google Earth software, and then a map-based animated KMZ (Keyhole Markup Language) file was created for the flooding forecast presentation. Depending on whether the rainfall inputs were predicted or hindcasted, the forecasting system developed in the present study was qualified for pluvial flash flood hindcasts and forecasts. All components of the forecasting system are open-source software that are available on the website. To verify the capability of the forecasting system for pluvial flash flood simulation, two historical large-scale inundation events caused by violent rain in June 2005 and Typhoon Morakot in August 2009 were hindcasted by the forecasting system. The hindcasted flooding extents were compared with the available surveys obtained from the WRA of Taiwan. The hindcasted distributions of floods were generally identical to the surveys, except for the underestimation of the flood extent in both events because the fluvial flood effect is currently not included in the forecasting system. This examination concludes that the forecasting system developed in the present study is potentially well suited for city-scale pluvial flood predictions.
In this work, a new and novel operational forecasting system for city-scale pluvial flash floods in southwestern plain areas, i.e., Tainan city (with an area of 2191.65 km2), Taiwan, was developed. This forecasting system integrated a CPU-based parallel computing technique that combines the latest well-developed, high-performance numerical weather prediction, two-dimensional dynamic wave, and stormwater management models. The forecasted inundation extents and depths were visualized using a high-end visualization program. The input/output format of the numerical models was modified to accelerate the forecasting system. A map-based, two-dimensional visualization for flooding forecasts allows users to effortlessly detect the possible inundation areas in the next 24 h. The forecasting system proposed in the present study overcomes the greatest weaknesses of time-consuming computation using a two-dimensional, fully hydrodynamic model for large-scale flood inundation modeling. The present study fills the gaps between current research and practical applications in forecasting highly transient flooding processes induced by intense rainfall. The proposed forecasting system can provide high-performance and high-resolution forecasts of city-scale flooding from rainfall to inundation for emergency response more efficiently.
To secure reliable and feasible predictions of the pluvial flash flood for Tainan city, the forecasting system is launched every six hours following the WRF model outputs. The entire process of the operational high-performance forecasting system for predicting pluvial flash floods in the subsequent 24 h can be completed in a very short time; for instance, the forecast for the plain area of Tainan city in the subsequent 24 h is accomplished within 8–10 min. This forecasting system is currently operating for city-scale pluvial flash flood warnings at the National Science and Technology Center for Disaster Reduction (NCDR) of Taiwan. Based on this successful experience, more operational forecasting systems for severe weather-induced, water-related large-scale disasters or hazards will continue to be implemented in the near future. A dense street monitoring closed-circuit television (CCTV) network can be used to verify pluvial flash flood forecasts instead of conducting on-site surveys in the future.

Author Contributions

Conceptualization, T.-Y.C., H.C., H.-S.F., W.-B.C., Y.-C.Y., W.-R.S., and L.-Y.L.; methodology, W.-B.C., H.C., and T.-Y.C.; validation, W.-B.C., T.-Y.C. and H.-S.F.; formal analysis, T.-Y.C. and H.-S.F., Y.-C.Y. and W.-R.S.; writing—original draft preparation, W.-B.C., T.-Y.C., H.C.; and supervision, H.C. and L.-Y.L. All authors have read and agreed to the published version of the manuscript.

Funding

This research was supported by the Ministry of Science and Technology (MOST), Taiwan, grant No. MOST 109-2221-E-865-001.

Institutional Review Board Statement

Not applicable.

Informed Consent Statement

Not applicable.

Data Availability Statement

Publicly available datasets were analyzed in the present study. The data can be found here: http://data.wra.gov.tw/Default.aspx.

Acknowledgments

The authors would like to thank the Water Resource Agency and Department of Land Administration, Ministry of the Interior of Taiwan, for providing the survey data and Joseph Zhang at the Virginia Institute of Marine Science, College of William & Mary, for kindly sharing his experiences using the numerical model.

Conflicts of Interest

The authors declare no conflict of interest.

References

  1. Dilley, M.; Chen, R.S.; Deichmann, U.; Lerner-Lam, A.L.; Arnold, M.; Agwe, J.; Buys, P.; Kjkstad, O.; Lyon, B.; Yetman, G. Natural Disaster Hotspots: A Global Risk Analysis-Synthesis Report; World Bank Group: Washington, DC, USA, 2005. [Google Scholar]
  2. Yin, J.; Yu, D.; Yin, Z.; Liu, M.; He, Q. Evaluating the impact and risk of pluvial flash flood on intra-urban road network: A case study in the city center of Shanghai, China. J. Hydrol. 2016, 537, 138–145. [Google Scholar] [CrossRef] [Green Version]
  3. The University Corporation for Atmospheric Research. Flash Flood Early Warning System Reference Guide; The University Corporation for Atmospheric Research: Boulder, CO, USA, 2010. [Google Scholar]
  4. Tanaka, T.; Tachikawa, Y.; Ichikawa, Y.; Yorozu, K. An automatic domain updating method for fast 2-dimensional flood-inundation modelling. Environ. Model. Softw. 2019, 116, 110–118. [Google Scholar] [CrossRef]
  5. Jang, J.-H.; Chang, T.-H.; Chen, W.-B. Effect of inlet modelling on surface drainage in coupled urban flood simulation. J. Hydrol. 2018, 562, 168–180. [Google Scholar] [CrossRef]
  6. Ghimire, B.; Chen, A.S.; Guidolin, M.; Keedwell, E.C.; Djordjević, S.; Savić, D.A. Formulation of a fast 2D urban pluvial flood model using a cellular automata approach. J. Hydroinf. 2013, 15, 676–686. [Google Scholar] [CrossRef] [Green Version]
  7. Liu, L.; Liu, Y.; Wang, X.; Yu, D.; Liu, K.; Huang, H.; Hu, G. Developing an effective 2-D urban flood inundation model for city emergency management based on cellular automata. Nat. Hazards Earth Syst. Sci. 2015, 15, 381–391. [Google Scholar] [CrossRef] [Green Version]
  8. Wang, Y.; Chen, A.S.; Fu, G.; Djordjević, S.; Zhang, C.; Savić, D.A. An integrated framework for high-resolution urban flood modelling considering multiple information sources and urban features. Environ. Model. Softw. 2018, 107, 85–95. [Google Scholar] [CrossRef]
  9. Guidolin, M.; Chen, A.S.; Ghimire, B.; Keedwell, E.C.; Djordjević, S.; Savić, D.A. A weighted cellular automata 2D inundation model for rapid flood analysis. Environ. Model. Softw. 2016, 84, 378–394. [Google Scholar] [CrossRef] [Green Version]
  10. Costabile, P.; Costanzo, C.; De Lorenzo, G.; Macchione, F. Is local flood hazard assessment in urban areas significantly influenced by the physical complexity of the hydrodynamic inundation model? J. Hydrol. 2020, 580, 124231. [Google Scholar] [CrossRef]
  11. Wing, O.E.J.; Sampson, C.C.; Bates, P.D.; Quinn, N.; Smith, A.M.; Neal, J.C. A flood inundation forecast of Hurricane Harvey using a continental-scale 2D hydrodynamic model. J. Hydrol. X 2019, 4, 100039. [Google Scholar] [CrossRef]
  12. Bomers, A.; Schielen, R.M.J.; Hulscher, S.J.M.H. The influence of grid shape and grid size on hydraulic river modelling performance. Fluid Mech. Environ. 2019, 19, 1273–1294. [Google Scholar] [CrossRef] [Green Version]
  13. Savant, G.; Trahan, C.J.; Pettey, L.; McAlpin, T.O.; Bell, G.L.; McKnight, C.J. Urban and overland flow modeling with dynamic adaptive mesh and implicit diffusive wave equation solver. J. Hydrol. 2019, 573, 13–30. [Google Scholar] [CrossRef]
  14. Dazzi, S.; Vacondio, R.; Dal Palù, A.; Mignosa, P. A local time stepping algorithm for GPU-accelerated 2D shallow water models. Adv. Water Resour. 2018, 111, 274–288. [Google Scholar] [CrossRef]
  15. Sanders, B.F.; Schubert, J.E. PRIMo: Parallel raster inundation model. Adv. Water Resour. 2019, 126, 79–95. [Google Scholar] [CrossRef]
  16. Ming, X.; Liang, Q.; Xia, X.; Li, D.; Fowler, H.J. Real-Time Flood Forecasting Based on a High-Performance 2-D Hydrodynamic Model and Numerical Weather Predictions. Water Resour. Res. 2020, 56, e2019WR025583. [Google Scholar] [CrossRef]
  17. Emerton, R.; Zsoter, E.; Arnal, L.; Cloke, H.L.; Muraro, D.; Prudhomme, C.; Stephens, E.M.; Salamon, P.; Pappenberger, F. Developing a global operational seasonal hydro-meteorological forecasting system: GloFAS-Seasonal v1.0. Geosci. Model Dev. 2018, 11, 3327–3346. [Google Scholar] [CrossRef] [Green Version]
  18. Horritt, M.S.; Bates, P.D. Effects of spatial resolution on a raster based model of flood flow. J. Hydrol. 2001, 253, 239–249. [Google Scholar] [CrossRef]
  19. Casas, A.; Benito, G.; Thorndycraft, V.; Rico, M. The topographic data source of digital terrain models as a key element in the accuracy of hydraulic flood modelling. Earth Surf. Process. Landf. 2006, 31, 444–456. [Google Scholar] [CrossRef]
  20. Horritt, M.S.; Bates, P.D.; Mattinson, M.J. Effects of mesh resolution and topographic representation in 2D finite volume models of shallow water fluvial flow. J. Hydrol. 2006, 329, 306–314. [Google Scholar] [CrossRef]
  21. Cook, A.; Merwade, V. Effect of topographic data, geometric configuration and modeling approach on flood inundation mapping. J. Hydrol. 2009, 377, 131–142. [Google Scholar] [CrossRef]
  22. Caviedes-Voullieme, D.; Morales-Hernandez, M.; Lopez-Marijuan, I.; García-Navarro, P. Reconstruction of 2D river beds by appropriate interpolation of 1D cross-sectional information for flood simulation. Environ. Model. Softw. 2014, 61, 206–228. [Google Scholar] [CrossRef]
  23. Chen, Y.-M.; Liu, C.-H.; Shih, H.-J.; Chang, C.-H.; Chen, W.-B.; Yu, Y.-C.; Su, W.-R.; Lin, L.-Y. An Operational Forecasting System for Flash Floods in Mountainous Areas in Taiwan. Water 2019, 11, 2100. [Google Scholar] [CrossRef] [Green Version]
  24. Das, S.; Ashrit, R.; Iyengar, G.R.; Mohandas, S.; Gupta, M.D.; George, J.P.; Rajagopal, E.; Dutta, S.K. Skills of different mesoscale models over Indian region during monsoon season: Forecast errors. J. Earth Syst. Sci. 2008, 117, 603–620. [Google Scholar] [CrossRef] [Green Version]
  25. Li, L.; Gochis, D.J.; Sobolowski, S.; Mesquita, M.D. Evaluating the present annual water budget of a Himalayan headwater river basin using a high-resolution atmosphere-hydrology model. J. Geophys. Res. Atmos. 2017, 122, 4786–4807. [Google Scholar] [CrossRef]
  26. Chawla, I.; Osuri, K.K.; Mujumdar, P.P.; Niyogi, D. Assessment of the Weather Research and Forecasting (WRF) model for simulation of extreme rainfall events in the upper Ganga Basin. Hydrol. Earth Syst. Sci. 2018, 22, 1095–1117. [Google Scholar] [CrossRef] [Green Version]
  27. Skamarock, W.C.; Klemp, J.B.; Dudhia, J.; Gill, D.O.; Barker, D.M.; Duda, M.G.; Huang, X.Y.; Wang, W.; Powers, J.G. A Description of the Advanced Research WRF Version 3; NCAR Technical Note, NCAR/TN-475+STR; Mesoscale and Microscale Meteorology Division, National Center for Atmospheric Research: Boulder, CO, USA, 2008. [Google Scholar]
  28. Routray, A.; Mohanty, U.; Niyogi, D.; Rizvi, S.; Osuri, K.K. Simulation of heavy rainfall events over Indian monsoon region using WRF-3DVAR data assimilation system. Meteorol. Atmos. Phys. 2010, 106, 107–125. [Google Scholar] [CrossRef]
  29. Mohanty, U.; Routray, A.; Osuri, K.K.; Prasad, S.K. A study on simulation of heavy rainfall events over Indian region with ARW-3DVAR modeling system. Pure Appl. Geophys. 2012, 169, 381–399. [Google Scholar] [CrossRef]
  30. Routray, A.; Mohanty, U.; Osuri, K.K.; Kar, S.; Niyogi, D. Impact of satellite radiance data on simulations of Bay of Bengal tropical cyclones using the WRF-3DVAR modeling system. IEEE Trans. Geosci. Remote Sens. 2016, 54, 2285–2303. [Google Scholar] [CrossRef]
  31. Osuri, K.K.; Nadimpalli, R.; Mohanty, U.C.; Niyogi, D. Prediction of rapid intensification of tropical cyclone Phailin over the Bay of Bengal using the HWRF modelling system. Q. J. R. Meteorol. Soc. 2017, 143, 678–690. [Google Scholar] [CrossRef]
  32. Madala, S.; Satyanarayana, A.; Rao, T.N. Performance evaluation of PBL and cumulus parameterization schemes of WRF ARW model in simulating severe thunderstorm events over Gadanki MST radar facility–case study. Atmos. Res. 2014, 139, 1–17. [Google Scholar] [CrossRef]
  33. Osuri, K.; Nadimpalli, R.; Mohanty, U.; Chen, F.; Rajeevan, M.; Niyogi, D. Improved prediction of severe thunderstorms over the Indian Monsoon region using high-resolution soil moisture and temperature initialization. Sci. Rep. 2017, 7, 41377. [Google Scholar] [CrossRef] [Green Version]
  34. Srinivas, C.V.; Hariprasad, D.; Bhaskar Rao, D.V.; Anjaneyulu, Y.; Baskaran, R.; Venkatraman, B. Simulation of the Indian summer monsoon regional climate using advanced research WRF model. Int. J. Climatol. 2013, 33, 1195–1210. [Google Scholar] [CrossRef]
  35. Swain, M.; Pattanayak, S.; Mohanty, U.C.; Sahu, S.C. Prediction of extreme rainfall associated with monsoon depressions over Odisha: An assessment of coastal zone vulnerability at district level. Nat. Hazards 2020, 102, 607–632. [Google Scholar] [CrossRef]
  36. Powers, J.G.; Klemp, J.B.; Skamarock, W.C.; Davis, C.A.; Dudhia, J.; Gill, D.O.; Coen, J.L.; Gochis, D.J. The Weather Research and Forecasting Model: Overview, system efforts, and future directions. Bull. Am. Meteorol. Soc. 2017, 98, 1717–1737. [Google Scholar] [CrossRef]
  37. Chen, W.-B.; Jang, J.-H.; Chang, C.-H. Predicting River Stages Using an Operational Forecasting System; National Science and Technology Center for Disaster Reduction: New Taipei City, Taiwan, 2017. (In Chinese) [Google Scholar]
  38. Zhang, J.; Howard, K.; Chang, P.L.; Chiu, P.T.K.; Chen, C.R.; Langston, C.; Xia, W.W.; Kaney, B.; Lin, P.F. High-Resolution QPE System for Taiwan, Data Assimilation for Atmospheric, Oceanic, and Hydrologic Applications; Park, S.K., Xu, L., Eds.; Springer: Berlin, Germany, 2009; pp. 147–162. [Google Scholar]
  39. Liu, W.-C.; Chen, W.-B.; Hsu, M.-H.; Fu, J.-C. Dynamic Routing Modeling for Flash Flood Forecast in River System. Nat. Hazards 2010, 52, 519–537. [Google Scholar] [CrossRef]
  40. Shustikova, L.; Domeneghetti, A.; Neal, J.C.; Bates, P.; Castellarin, A. Comparing 2D capabilities of HEC-RAS and LISFLOOD-FP on complex topography. Hydrol. Sci. J. 2019, 64, 1769–1782. [Google Scholar] [CrossRef]
  41. Hu, R.; Fang, F.; Salinas, P.; Pain, C.C. Unstructured mesh adaptivity for urban flooding modelling. J. Hydrol. 2018, 560, 354–363. [Google Scholar] [CrossRef]
  42. Zhang, Y.; Ye, F.; Stanev, E.V.; Grashorn, S. Seamless cross-scale modeling with SCHISM. Ocean Model. 2016, 102, 64–81. [Google Scholar] [CrossRef] [Green Version]
  43. Zhang, Y.; Ateljevich, E.; Yu, H.-C.; Wu, C.H.; Yu, J.C.S. A new vertical coordinate system for a 3D unstructured-grid model. Ocean Model. 2015, 85, 16–31. [Google Scholar] [CrossRef]
  44. Zhang, Y.; Stanev, E.V.; Grashorn, S. Unstructured-grid model for the North Sea and Baltic Sea: Validation against observations. Ocean Model. 2016, 97, 91–108. [Google Scholar] [CrossRef] [Green Version]
  45. Zhang, Y.; Baptisa, A.M. SELFE: A semi-implicit Eulerian-Lagrangian finite-element model for cross-scale ocean circulation. Ocean Model. 2008, 21, 71–96. [Google Scholar] [CrossRef]
  46. Baptista, A.M. Solution of Advection-Dominated Transport by Eulerian–Lgrangian Methods Using the Backwards Method of Characteristics. Ph.D. Thesis, MIT, Cambridge, UK, 1978. [Google Scholar]
  47. Ye, F.; Zhang, Y.; Wang, H.; Friedrichs, M.A.M.; Irby, I.D.; Alteljevich, E.; Valle-Levinson, A.; Wang, Z.; Huang, H.; Shen, J.; et al. A 3D unstructured-grid model for Chesapeake Bay: Importance of bathymetry. Ocean Model. 2018, 127, 16–39. [Google Scholar] [CrossRef] [Green Version]
  48. Wang, H.V.; Loftis, J.D.; Liu, Z.; Forrest, D.; Zhang, J. The storm surge and sub-grid inundation modeling in New York City during hurricane Sandy. J. Mar. Sci. Eng. 2014, 2, 226–246. [Google Scholar] [CrossRef] [Green Version]
  49. Chen, W.B.; Liu, W.C. Modeling Flood Inundation Induced by River Flow and Storm. Water 2014, 6, 3182–3199. [Google Scholar] [CrossRef] [Green Version]
  50. Chen, W.B.; Liu, W.C. Assessment of storm surge inundation and potential hazard maps for the southern coast of Taiwan. Nat. Hazards 2016, 82, 591–616. [Google Scholar] [CrossRef]
  51. Chen, W.B.; Liu, W.C. Modeling the Influence of River Cross-Section Data on a River Stage Using a Two-Dimensional/Three-Dimensional Hydrodynamic Model. Water 2017, 9, 203. [Google Scholar] [CrossRef] [Green Version]
  52. Chen, W.B.; Chen, H.; Lin, L.Y.; Yu, Y.C. Tidal Current Power Resource and Influence of Sea-Level Rise in the Coastal Waters of Kinmen Island, Taiwan. Energies 2017, 10, 652. [Google Scholar] [CrossRef] [Green Version]
  53. Chen, W.-B.; Liu, W.-C. Investigating the fate and transport of fecal coliform contamination in a tidal estuarine system using a three-dimensional model. Mar. Pollut. Bull. 2017, 116, 365–384. [Google Scholar] [CrossRef]
  54. Roesner, L.A.; Aldrich, J.A.; Dickinson, R. Storm Water Management Model User’s Manual, Version 4: Addendum I, EXTRAN; EPA/600/3-88/001b (NTIS PB88236658/AS); U.S. Environmental Protection Agency: Athens, GA, USA, 1988.
  55. Rossman, L.A. Storm Water Management Model Quality Assurance Report: Dynamic Wave Flow Routing; EPA/600/R-06/097; U.S. Environmental Protection Agency: Washington, DC, USA, 2006.
  56. Zu, T.; Gana, J.; Erofeevac, S.Y. Numerical study of the tide and tidal dynamics in the South China Sea. Deep Sea Res. Part I 2008, 55, 137–154. [Google Scholar] [CrossRef]
  57. Brown, J.R.; Earnshaw, R.; Jern, M.; Vince, J. Visualization: Using Computer Graphics to Explore Data and Present Information; John Wiley & Sons: New York, NY, USA, 1995. [Google Scholar]
  58. Dimitriadis, P.; Tegos, A.; Oikonomou, A.; Pagana, V.; Koukouvinos, A.; Mamassis, N.; Koutsoyiannis, D.; Efstratiadis, A. Comparative evaluation of 1D and quasi-2D hydraulic models based on benchmark and real-world applications for uncertainty assessment in flood mapping. J. Hydrol. 2016, 534, 478–492. [Google Scholar] [CrossRef]
  59. Hong, S.Y.; Lee, J.W. Assessment of the WRF model in reproducing a flash flood heavy rainfall event over Korea. Atmos. Res. 2009, 93, 818–831. [Google Scholar] [CrossRef]
  60. Weisman, M.L.; Davis, C.; Wang, W.; Manning, K.W.; Klemp, J.B. Experiences with 0–36-h explicit convective forecasts with the WRF-ARW model. Weather Forecast. 2008, 23, 407–437. [Google Scholar] [CrossRef]
  61. Clark, A.J.; Gallus, W.A.; Xue, M.; Kong, F. Convection-allowing and convection-parameterizing ensemble forecasts of a mesoscale convective vortex and associated severe weather environment. Weather Forecast. 2010, 25, 1052–1081. [Google Scholar] [CrossRef]
  62. Hsiao, L.T.; Yang, M.J.; Lee, C.S.; Kuo, H.C.; Shih, D.S.; Tsai, C.C.; Wang, C.J.; Chang, L.Y.; Chen, Y.C.; Feng, L.; et al. Ensemble forecasting of typhoon rainfall and floods over a mountainous watershed in Taiwan. J. Hydrol. 2013, 506, 55–68. [Google Scholar] [CrossRef] [Green Version]
  63. Hsiao, S.-C.; Chen, H.; Chen, W.-B.; Chang, C.-H.; Lin, L.-Y. Quantifying the contribution of nonlinear interactions to storm tide simulations during a super typhoon event. Ocean Eng. 2019, 194, 106661. [Google Scholar] [CrossRef]
  64. Yu, Y.-C.; Chen, H.; Shih, H.-J.; Chang, C.-H.; Hsiao, S.-C.; Chen, W.-B.; Chen, Y.-M.; Su, W.-R.; Lin, L.-Y. Assessing the Potential Highest Storm Tide Hazard in Taiwan Based on 40-year Historical Typhoon Surge Hindcasting. Atmosphere 2019, 10, 346. [Google Scholar] [CrossRef] [Green Version]
Figure 1. Map of the study area.
Water 13 00405 g001
Figure 2. A severe pluvial flash flood in Tainan caused by torrential rainfall on 26 August 2020. (Photo by the authors of the present study).
Water 13 00405 g002
Figure 3. The Weather Research and Forecasting (WRF) model domain configuration with three nested domains. The parent domain (d01), domain 2 (d02), and domain 3 (d03) have horizontal grid resolutions of 45, 15, and 5 km, respectively.
Water 13 00405 g003
Figure 4. Spatial distribution of gridded rainfall data with a 1.25 km resolution for (a) all of Taiwan, (b) an enlargement of southern Taiwan, and (c) an enlargement of Tainan city.
Water 13 00405 g004
Figure 5. Outline of the computational domain (area inside the white line) and spatial distribution of the stormwater drainage system (red lines) in the computational domain.
Water 13 00405 g005
Figure 6. Three-dimensional view of bottom elevation for the computational domain using a digital elevation model (DEM) with a spatial resolution of 1 m.
Water 13 00405 g006
Figure 7. Spatial distribution of land use for the computational domain.
Water 13 00405 g007
Figure 8. Spatial distribution of Manning’s coefficient corresponding to land use for the computational domain.
Water 13 00405 g008
Figure 9. Comparison of the flooding extent between hindcasts and surveys induced by intense rainfall in Tainan city on 12 June 2005. Areas with colors represent model hindcasts, while white areas are surveys.
Water 13 00405 g009
Figure 10. Comparison of the flooding extent between hindcasts and surveys induced by intense rainfall in Tainan during Typhoon Morakot in 2009. Areas with colors represent model hindcasts, while white areas are surveys.
Water 13 00405 g010
Figure 11. A flow chart and the main components of the operational high-performance forecasting system for pluvial flash floods.
Water 13 00405 g011
Figure 12. Comparison of the flood locations between the forecasts and reports induced by intense rainfall in Tainan city on 22 May 2020. Areas with colors represent the forecasts by the operational high-performance forecast system for pluvial flash floods, while red points are flooding locations reported by residents.
Water 13 00405 g012
Figure 13. Comparison of the flood location between forecasts and reports induced by intense rainfall in Tainan city on 26 August 2020. Areas with colors represent the forecasts by the operational high-performance forecast system for pluvial flash floods, while red points are flooding locations reported by residents.
Water 13 00405 g013
Publisher’s Note: MDPI stays neutral with regard to jurisdictional claims in published maps and institutional affiliations.

