
Determination of Paleocurrent Directions Based on Well Logging Technology Aiming at the Lower Third Member of the Shahejie Formation in the Chezhen Depression and Its Implications

Abstract
:1. Introduction

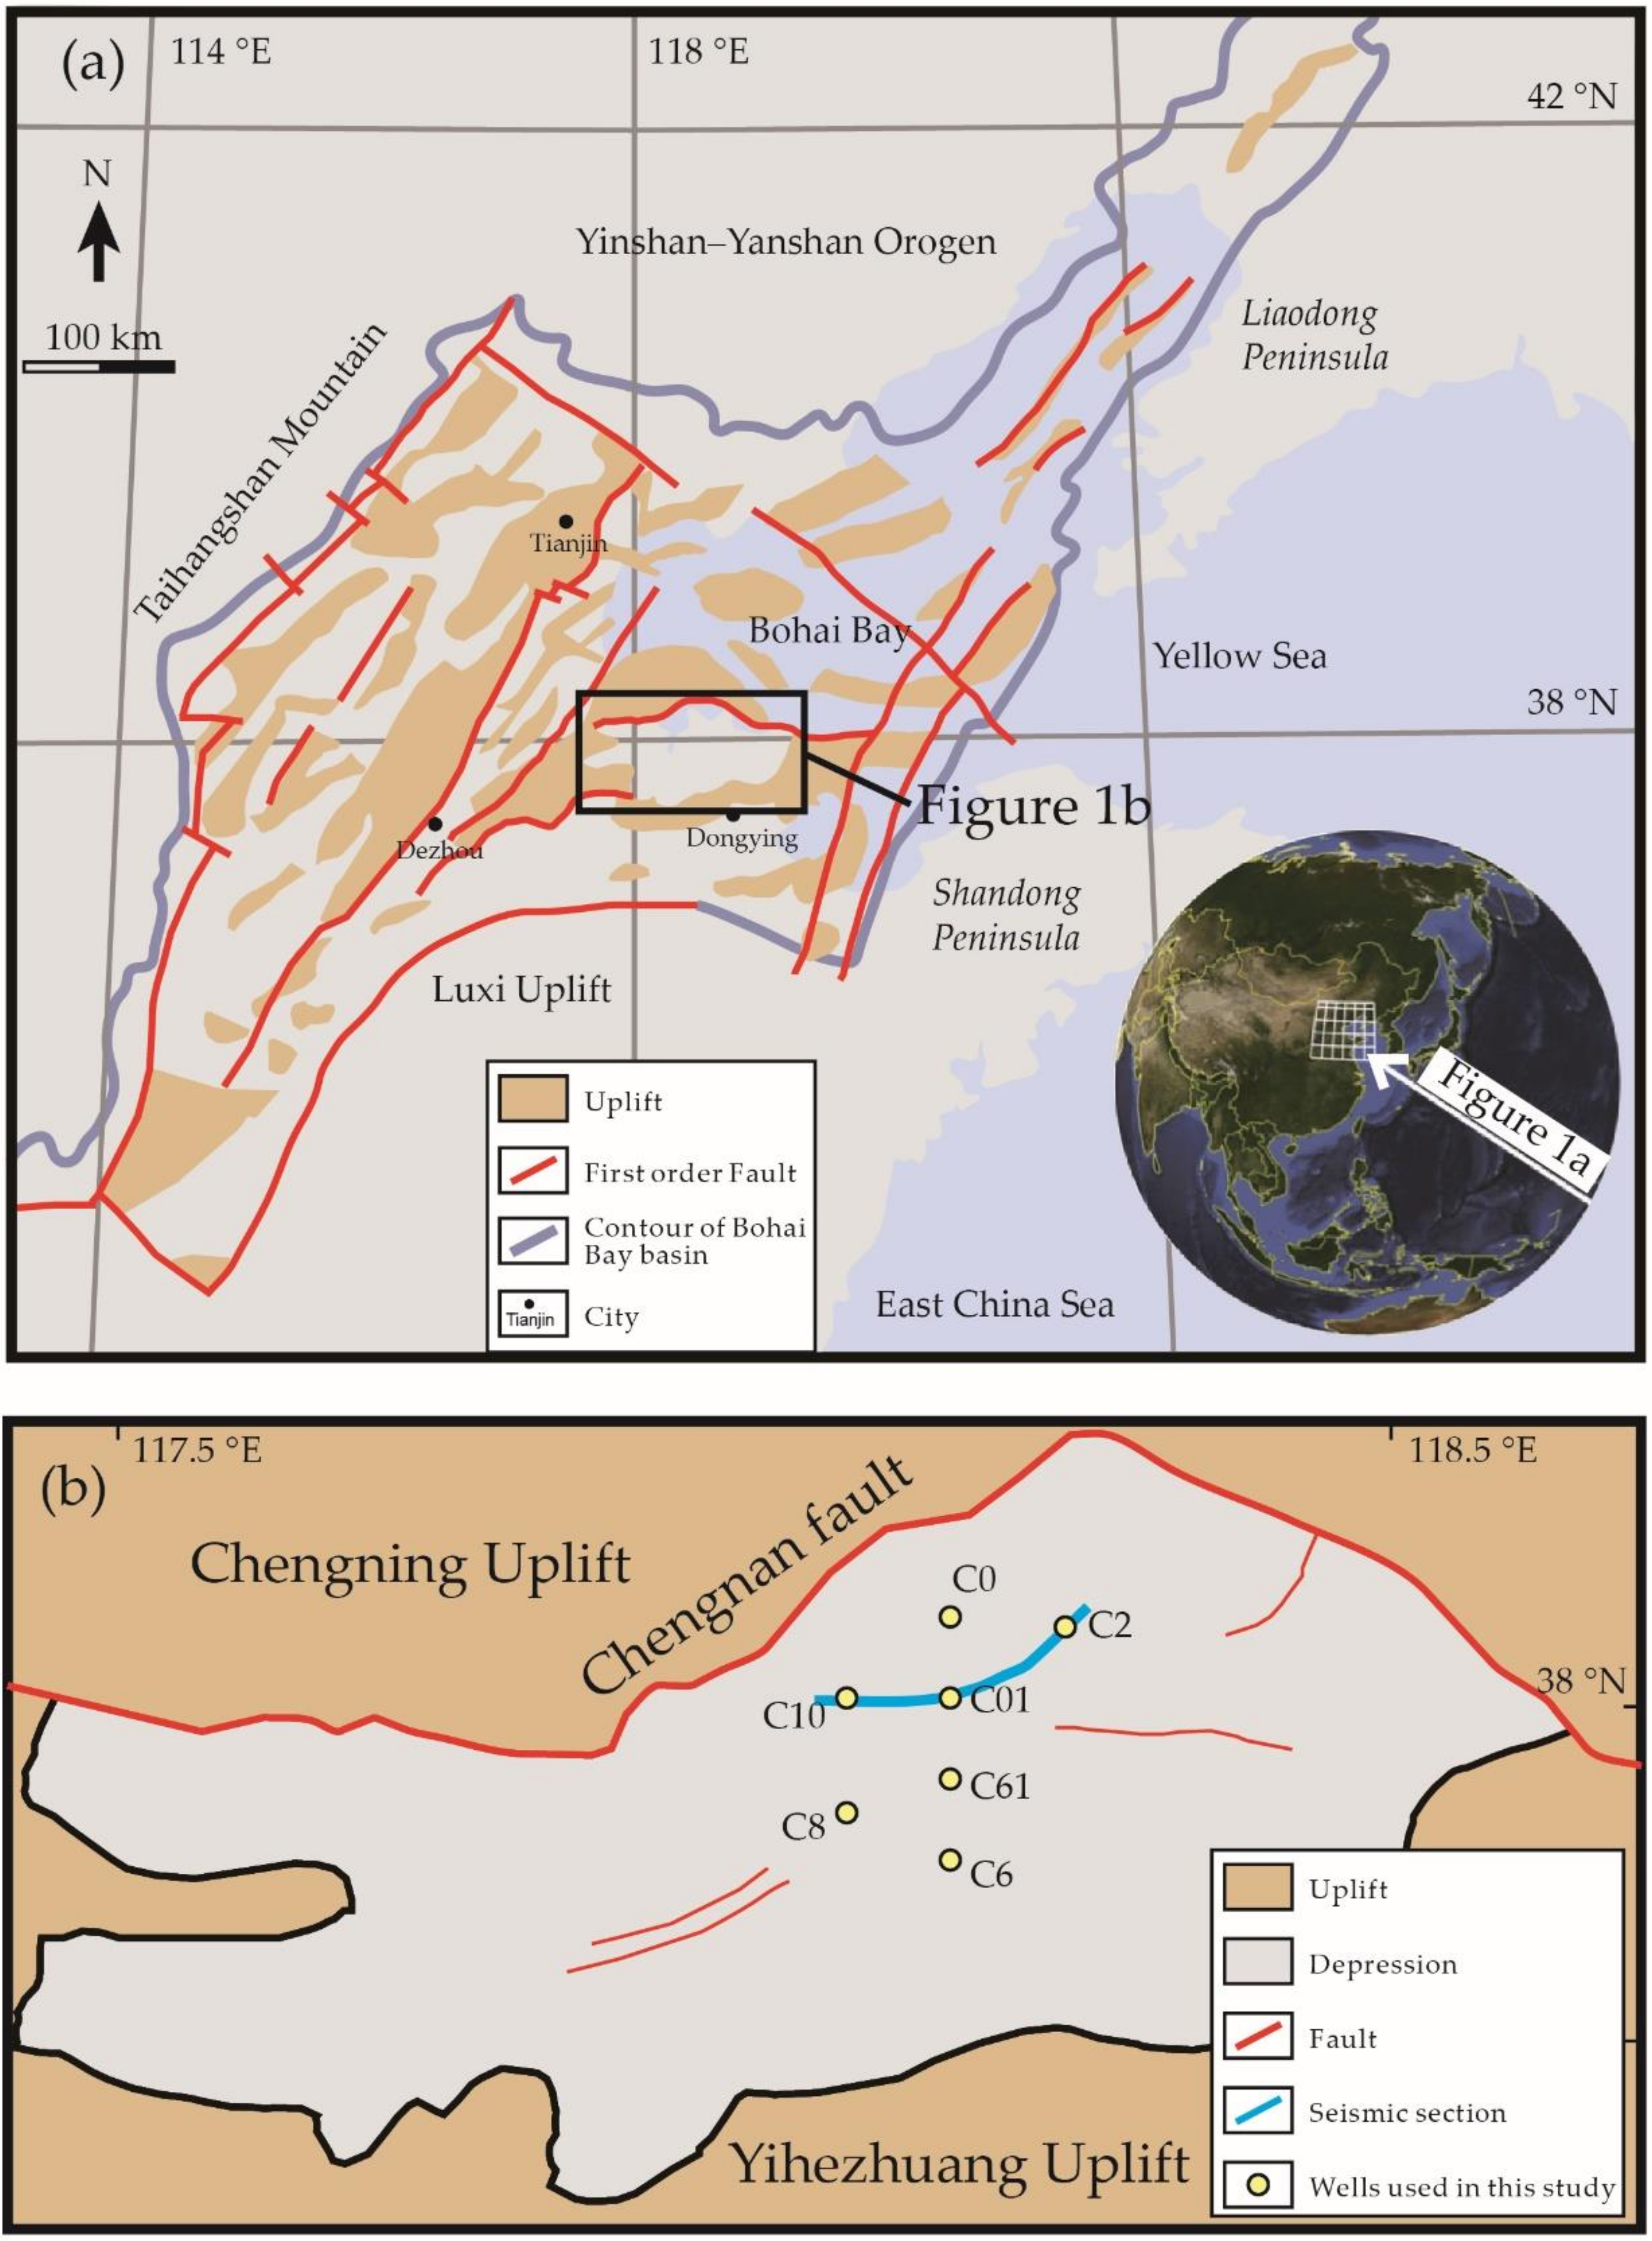
2. Geological Information
3. Methods
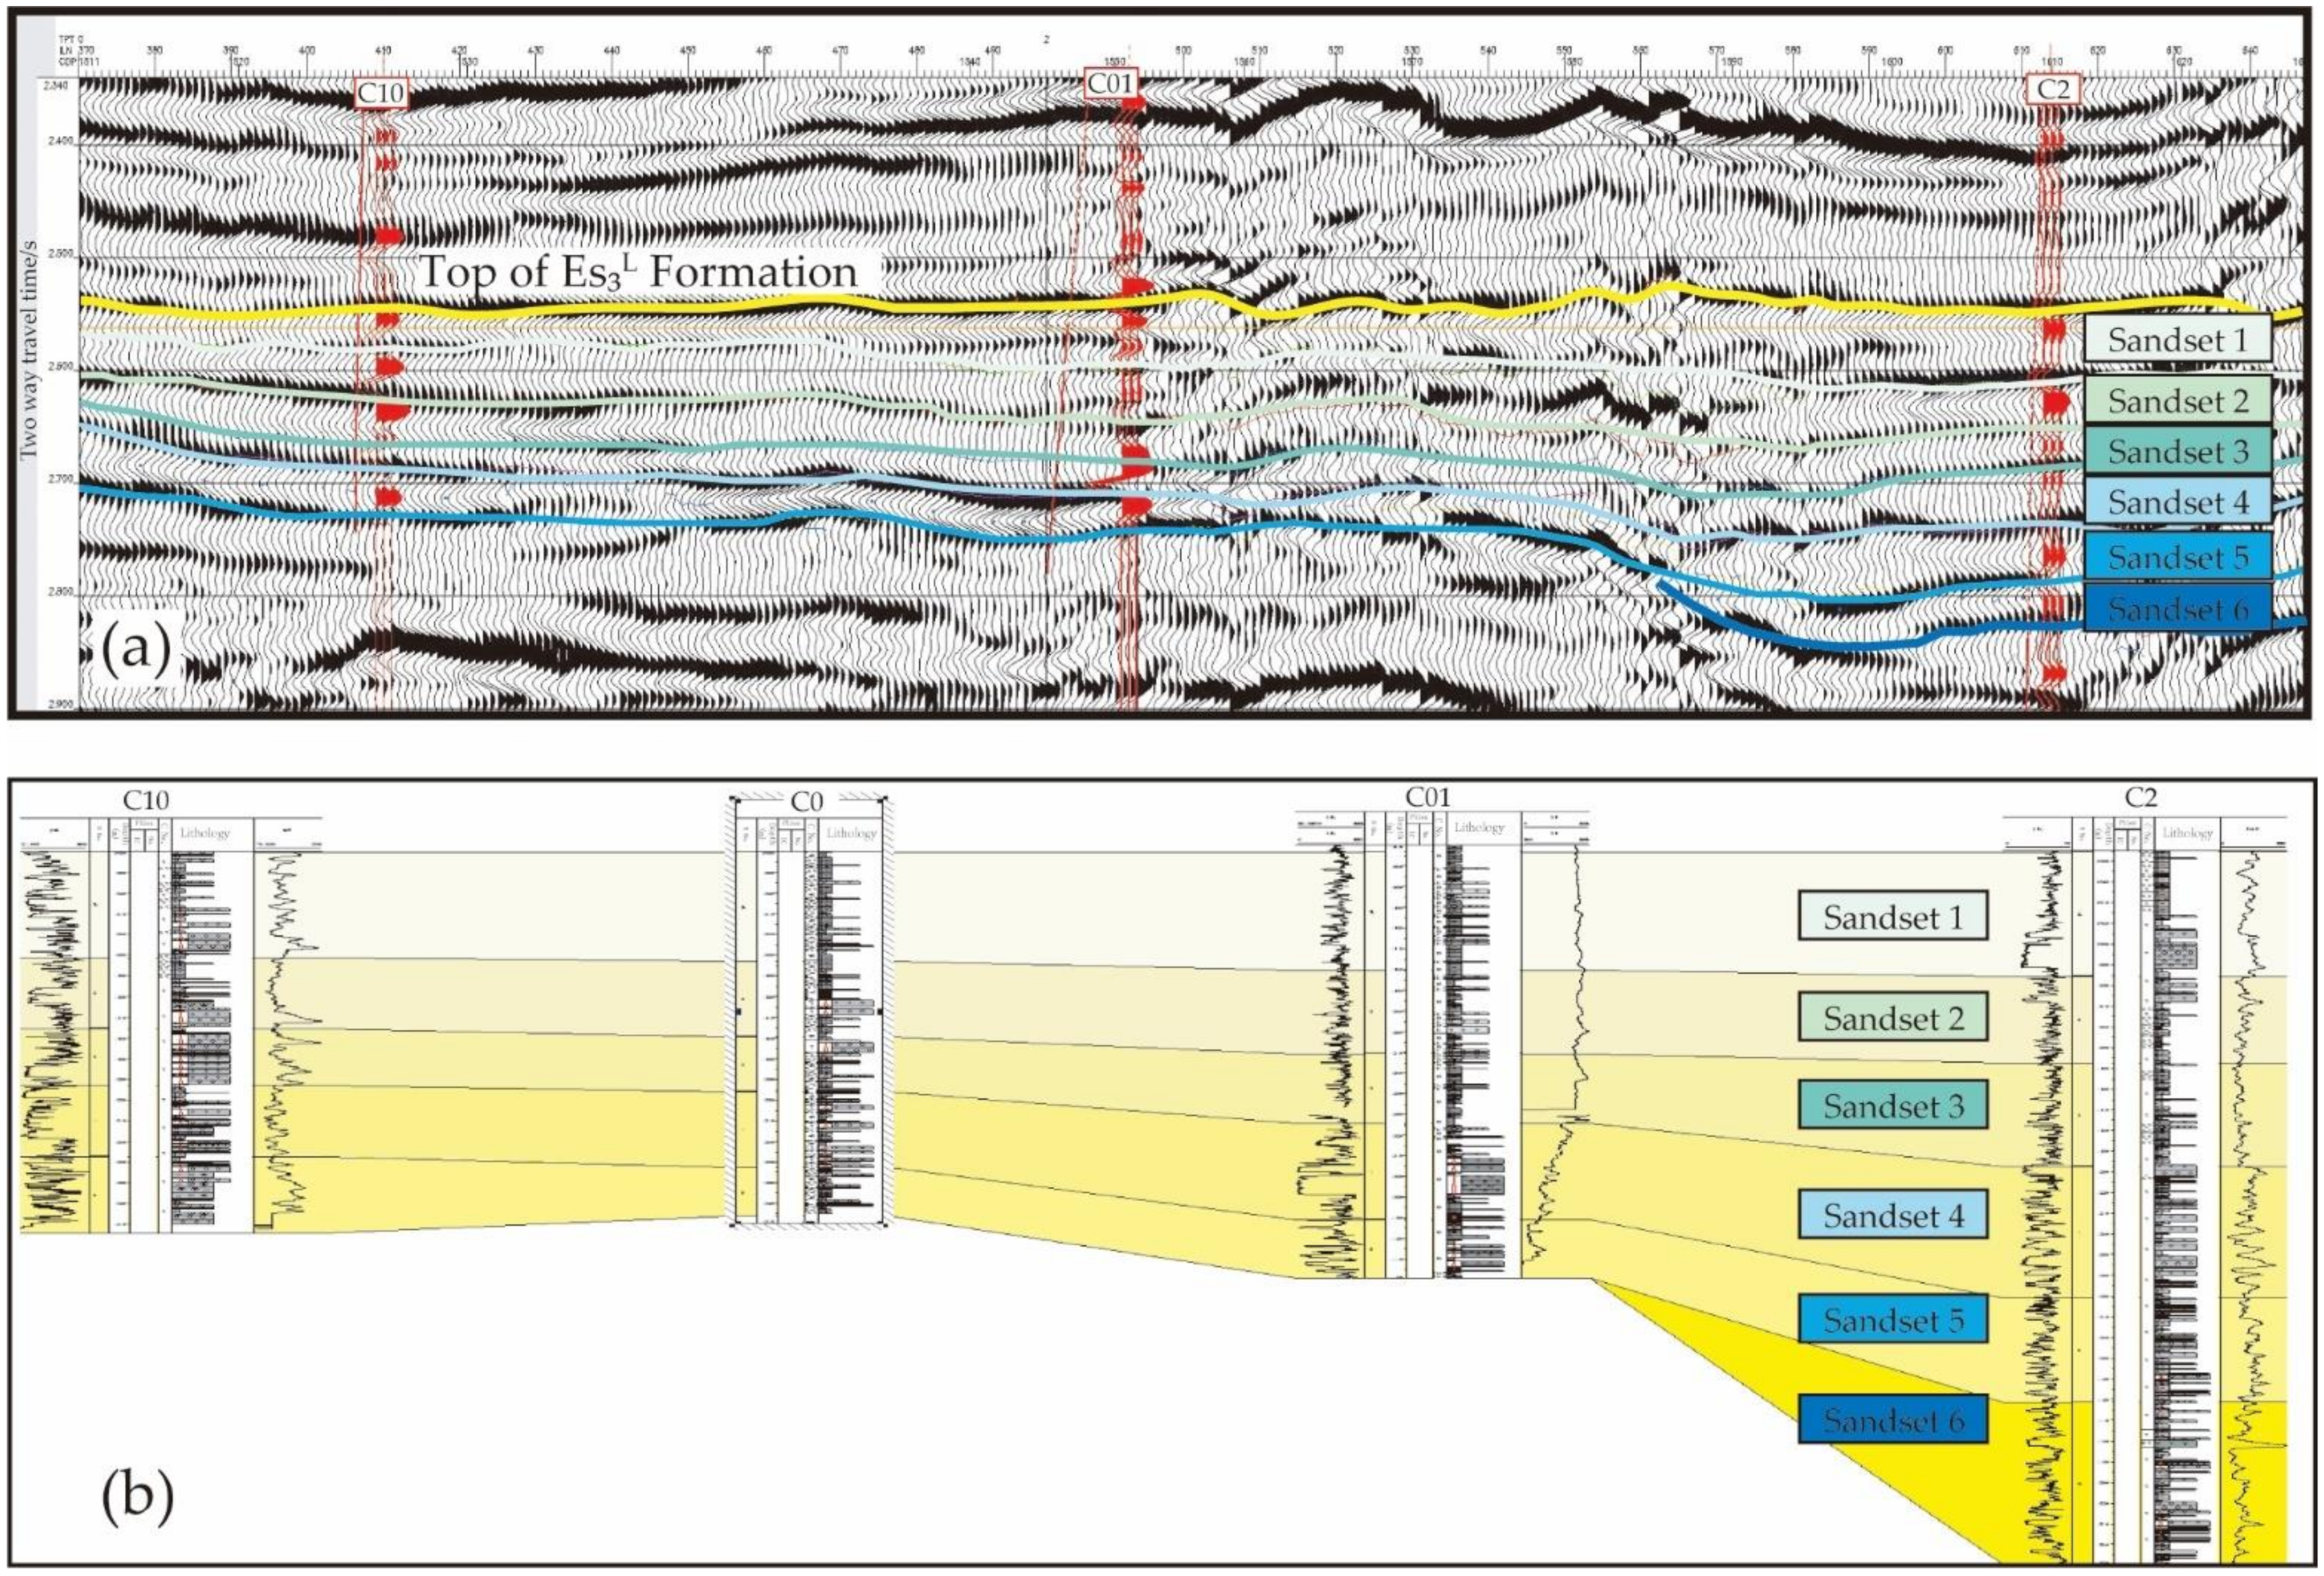
4. Results
5. Discussion
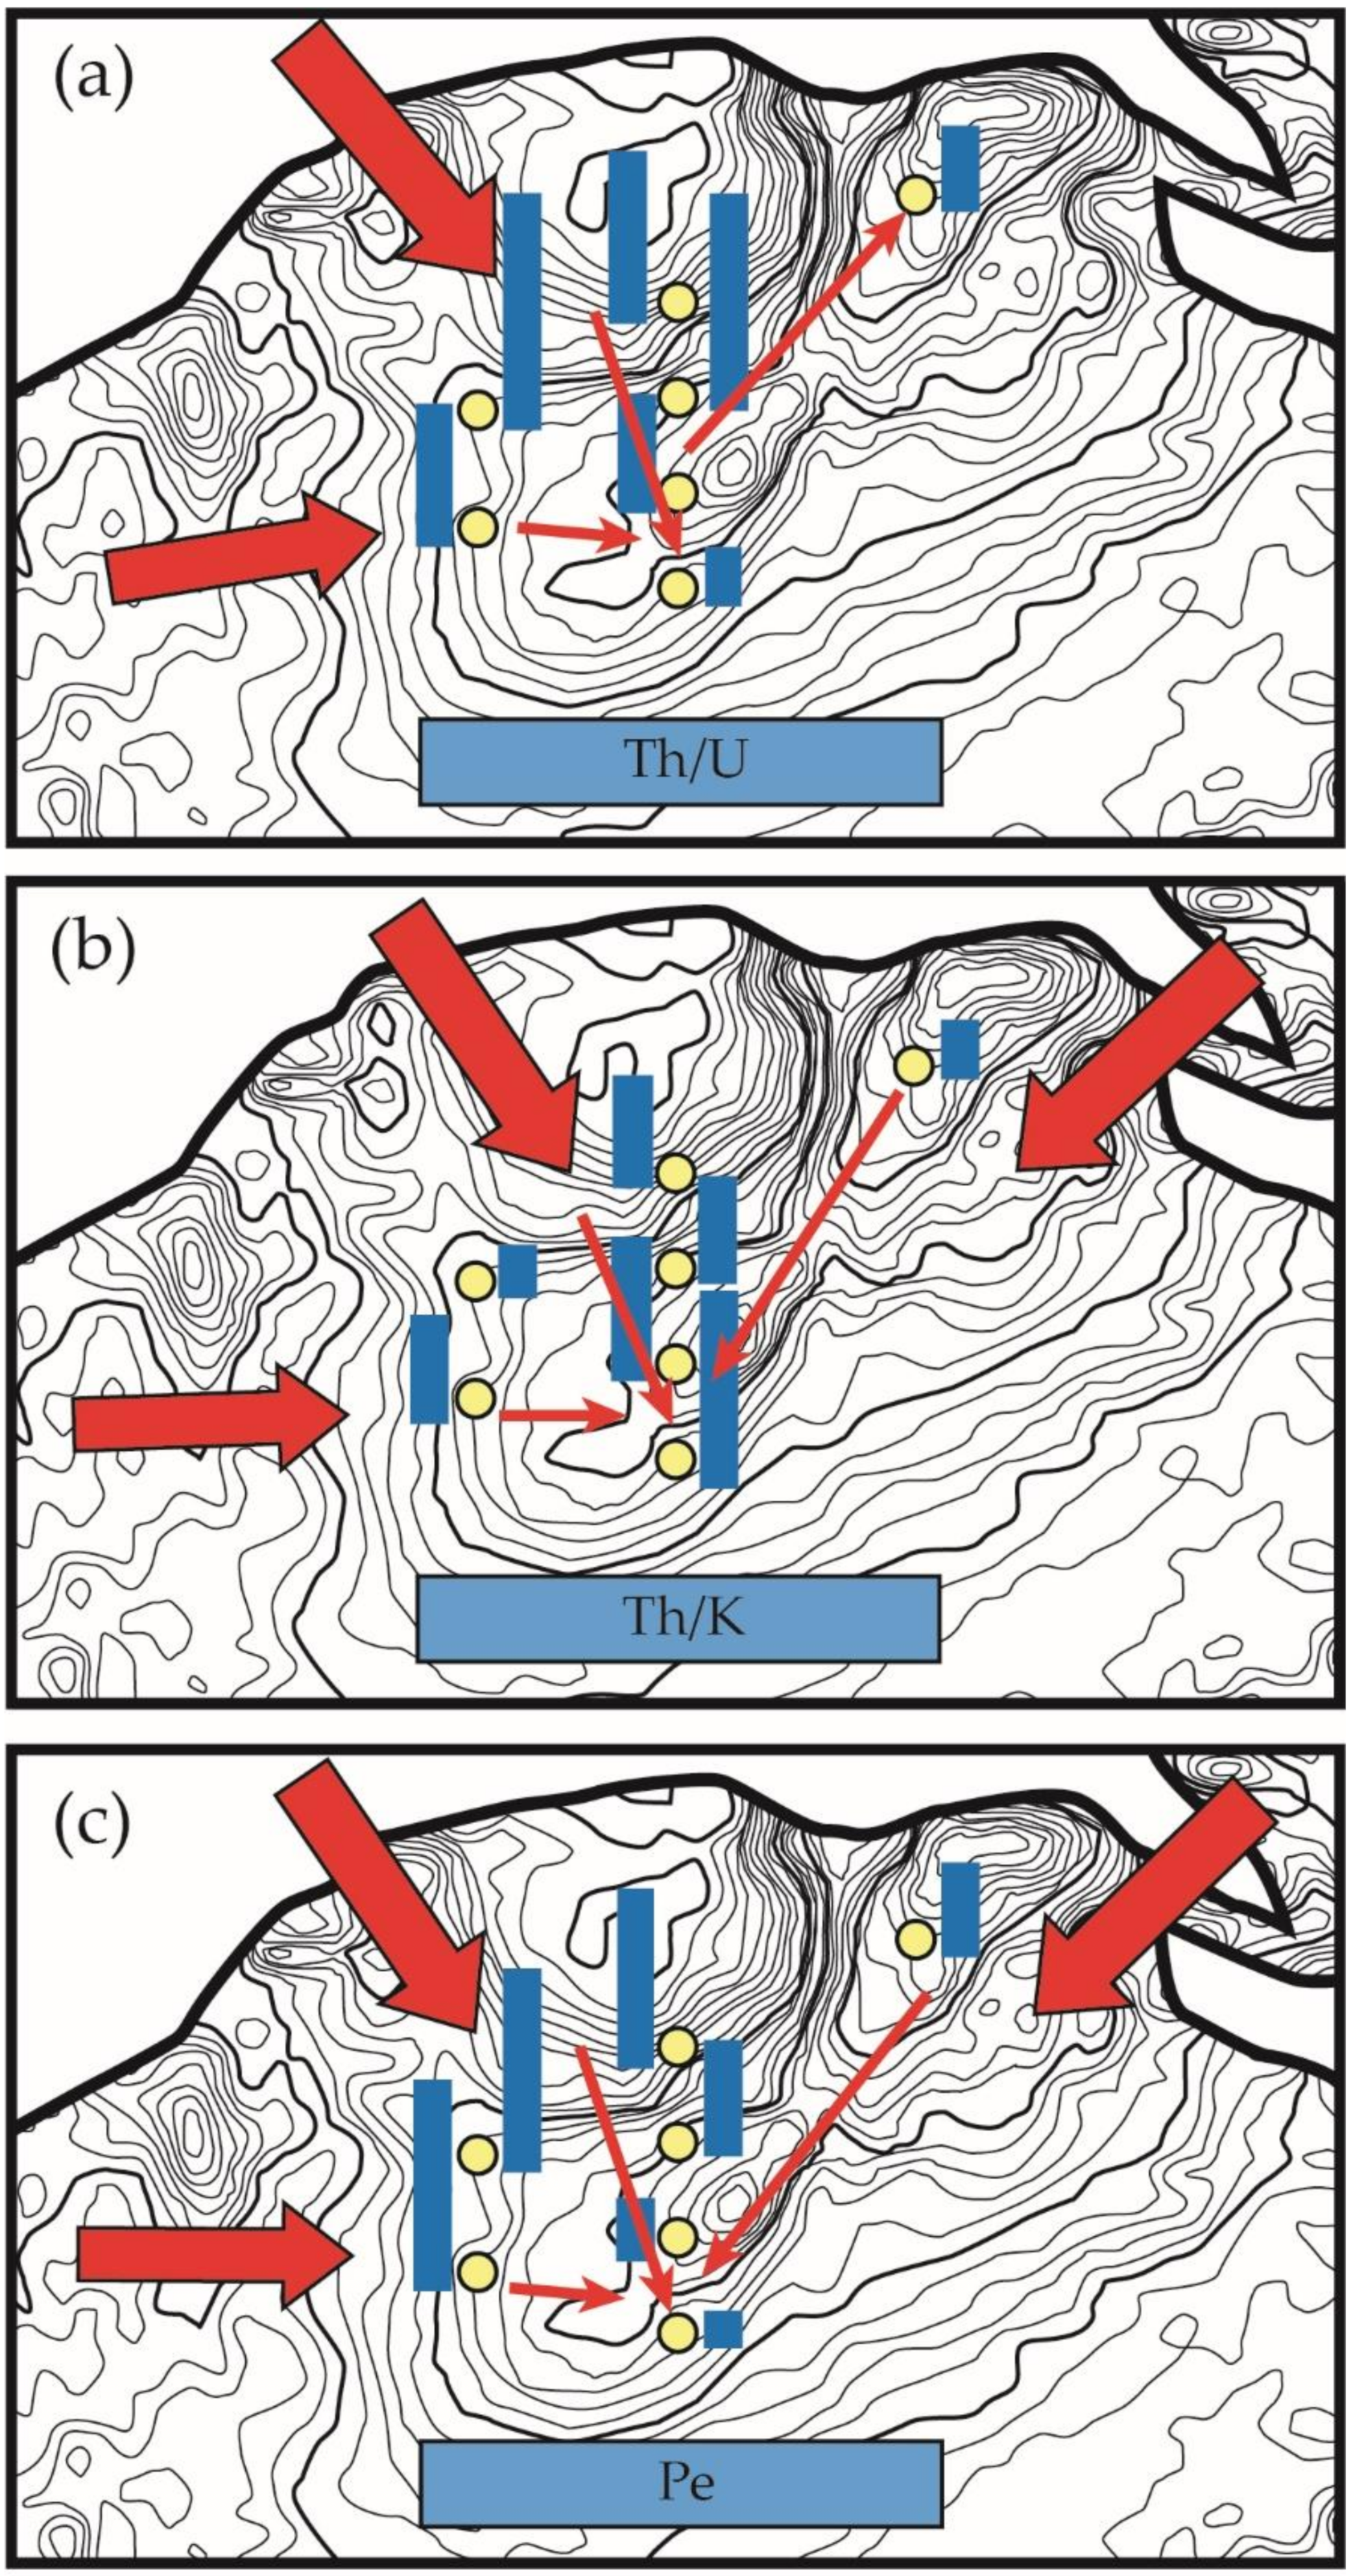
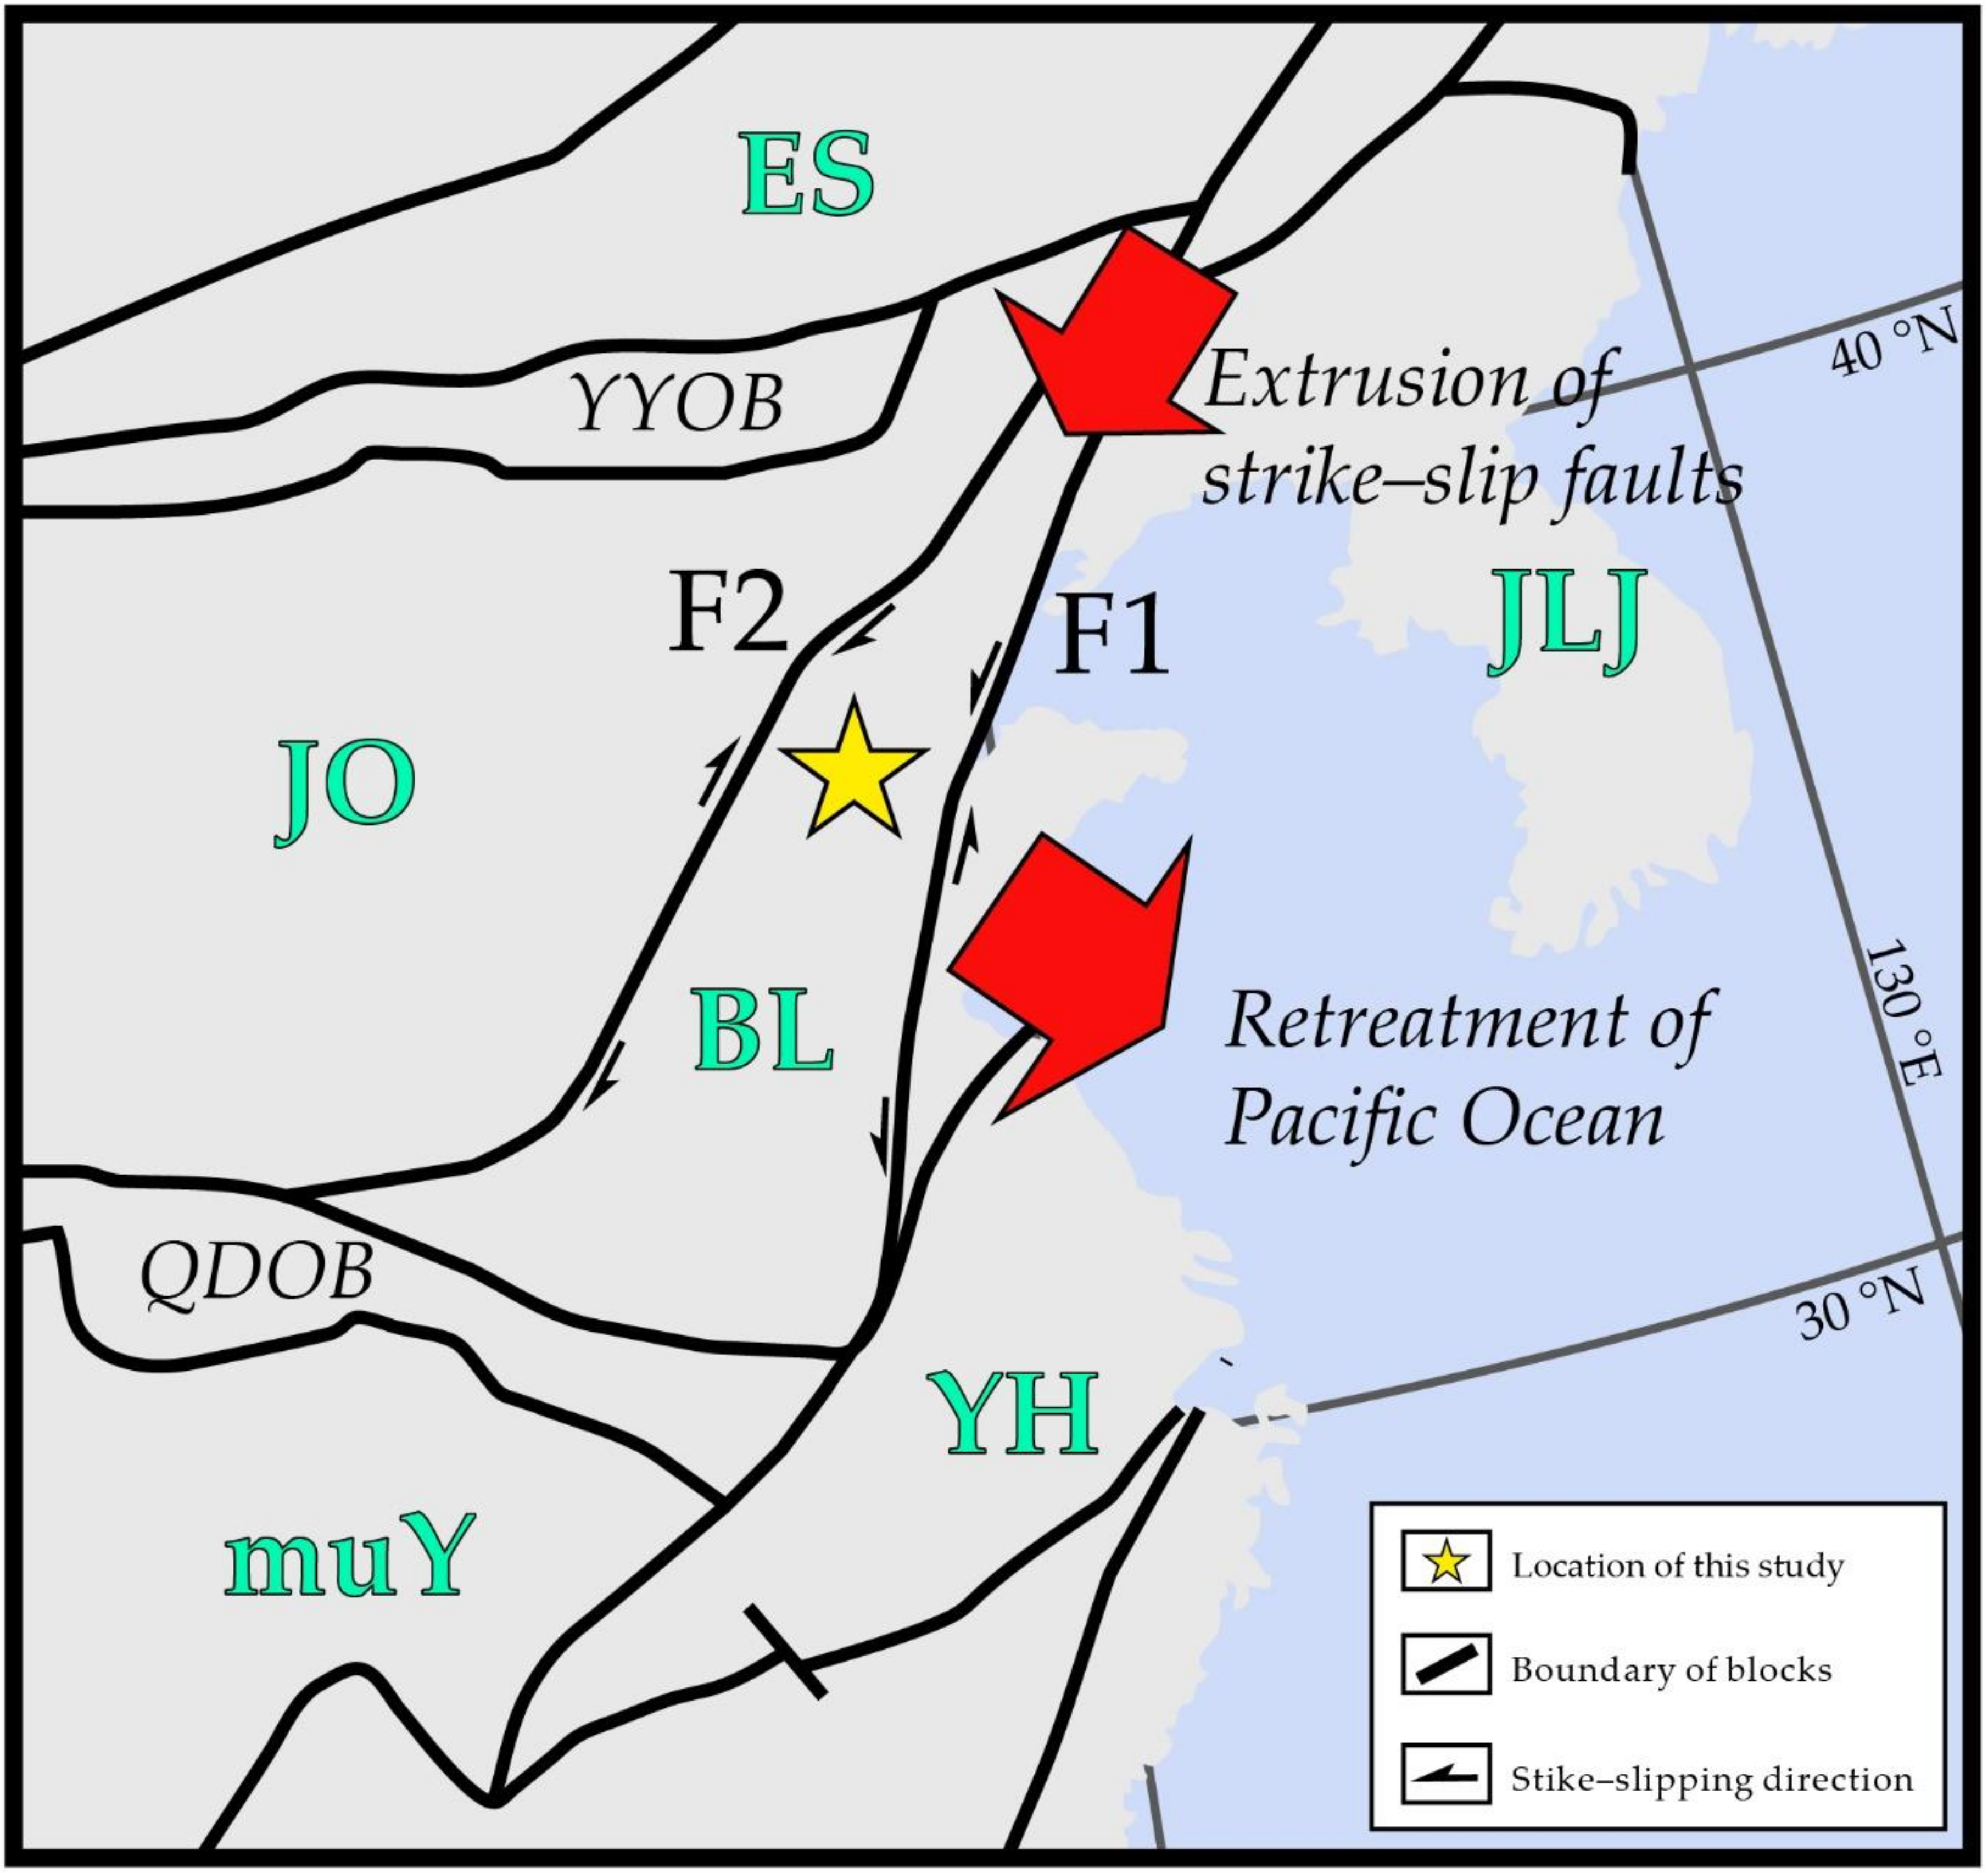
5.1. Analysis of Provenance Directions
5.2. Interpretation of the Tectonic Dynamics
6. Conclusions
Author Contributions
Funding
Institutional Review Board Statement
Informed Consent Statement
Data Availability Statement
Acknowledgments
Conflicts of Interest
References
- Su, J.; Zhu, W.; Wei, J.; Xu, L.; Yang, Y.; Wang, Z.; Zhang, Z. Fault Growth and Linkage: Implications for Tectonosedimentary Evolution in the Chezhen Basin of Bohai Bay, Eastern China. AAPG Bull. 2011, 95, 1–26. [Google Scholar] [CrossRef] [Green Version]
- Zhang, J.; He, S.; Wang, Y.; Wang, Y.; Hao, X.; Luo, S.; Li, P.; Dang, X.; Yang, R. Main Mechanism for Generating Overpressure in the Paleogene Source Rock Series of the Chezhen Depression, Bohai Bay Basin, China. J. Earth Sci. 2019, 30, 775–787. [Google Scholar] [CrossRef]
- Lao, H.; Wang, Y.; Shan, Y.; Hao, X.; Li, Q. Hydrocarbon Downward Accumulation from an Upper Oil Source to the Oil Reservoir Below in an Extensional Basin: A Case Study of Chezhen Depression in the Bohai Bay Basin. Mar. Pet. Geol. 2019, 103, 516–525. [Google Scholar] [CrossRef]
- Hu, S.; O’Sullivan, P.B.; Raza, A.; Kohn, B.P. Thermal History and Tectonic Subsidence of the Bohai Basin, Northern China: A Cenozoic Rifted and Local Pull-Apart Basin. Phys. Earth Planet. Inter. 2001, 126, 221–235. [Google Scholar] [CrossRef]
- Yang, Y.; Xu, T. Hydrocarbon Habitat of the Offshore Bohai Basin, China. Mar. Pet. Geol. 2004, 21, 691–708. [Google Scholar] [CrossRef]
- Hao, F.; Zhou, X.; Zhu, Y.; Bao, X.; Yang, Y. Charging of the Neogene Penglai 19-3 Field, Bohai Bay Basin, China: Oil Accumulation in a Young Trap in an Active Fault Zone. AAPG Bull. 2009, 93, 155–179. [Google Scholar] [CrossRef]
- Zhu, H.; Yang, X.; Liu, K.; Zhou, X. Seismic-Based Sediment Provenance Analysis in Continental Lacustrine Rift Basins: An Example from the Bohai Bay Basin, Chinaseismic-Based Sediment Provenance Analysis. AAPG Bull. 2014, 98, 1995–2018. [Google Scholar] [CrossRef]
- Sun, Z.; Zhu, H.; Xu, C.; Yang, X.; Du, X. Reconstructing Provenance Interaction of Multiple Sediment Sources in Continental Down-Warped Lacustrine Basins: An Example from the Bodong Area, Bohai Bay Basin, China. Mar. Pet. Geol. 2020, 113, 104142. [Google Scholar] [CrossRef]
- Li, S.; Zhu, H.; Xu, C.; Zeng, H.; Liu, Q.; Yang, X. Seismic-Based Identification and Stage Analysis of Overlapped Compound Sedimentary Units in Rifted Lacustrine Basins: An Example from the Bozhong Sag, Bohai Bay Basin, China. AAPG Bull. 2019, 103, 2521–2543. [Google Scholar] [CrossRef]
- Zhao, L.; Zheng, T. Seismic Structure of the Bohai Bay Basin, Northern China: Implications for Basin Evolution. Earth Planet. Sci. Lett. 2005, 231, 9–22. [Google Scholar] [CrossRef]
- Liu, S.; Lin, G.; Liu, Y.; Zhou, Y.; Gong, F.; Yan, Y. Geochemistry of Middle Oligocene-Pliocene Sandstones from the Nanpu Sag, Bohai Bay Basin (Eastern China): Implications for Provenance, Weathering, and Tectonic Setting. Geochem. J. 2007, 41, 359–378. [Google Scholar] [CrossRef] [Green Version]
- Pang, X.; Wang, Q.; Du, X.; Dai, L.; Li, H.; Wang, M. Matter Provenance Evolution and Its Influences on Paleogene Reservoirs in the Northwestern Margin of Bozhong Sag. Pet. Geol. Oilfield Dev. Daqing 2016, 35, 34–41. [Google Scholar]
- Du, X.; Wang, Q.; Zhao, M.; Liu, X. Sedimentary Characteristics and Mechanism Analysis of a Large-Scale Fan Delta System in the Paleocene Kongdian Formation, Southwestern Bohai Sea, China. Interpretation 2020, 8, SF81–SF94. [Google Scholar] [CrossRef]
- Li, H.; Du, X.; Wang, Q.; Yang, X.; Zhu, H.; Wang, F. Formation of Abnormally High Porosity/Permeability in Deltaic Sandstones (Oligocene), Bozhong Depression, Offshore Bohai Bay Basin, China. Mar. Pet. Geol. 2020, 121, 104616. [Google Scholar] [CrossRef]
- Miao, X.; Lu, H.; Li, Z.; Cao, G. Paleocurrent and Fabric Analyses of the Imbricated Fluvial Gravel Deposits in Huangshui Valley, the Northeastern Tibetan Plateau, China. Geomorphology 2008. [Google Scholar] [CrossRef]
- Amajor, L.C. Paleocurrent, Petrography and Provenance Analyses of the Ajali Sandstone (Upper Cretaceous), Southeastern Benue Trough, Nigeria. Sediment. Geol. 1987, 54, 47–60. [Google Scholar] [CrossRef]
- Das, R.; Pandya, K.L. Palaeocurrent Pattern and Provenance of a Part of Gondwana Succession, Talchir Basin, Orissa. J. Geol. Soc. India 1997, 50, 425–433. [Google Scholar]
- Condie, C.K. Chemical Composition and Evolution of the Upper Continental Crust: Contrasting Results from Surface Samples and Shales. Chem. Geol. 1993, 104, 1–37. [Google Scholar] [CrossRef]
- Naqvi, S.M.; Sawkar, R.H.; Rao, D.S.; Govil, P.K.; Rao, T.G. Geology, Geochemistry and Tectonic Setting of Archaean Greywackes from Karnataka Nucleus, India. Precambrian Res. 1988, 39, 193–216. [Google Scholar] [CrossRef]
- Raza, M.; Casshyap, S.M.; Khan, A. Geochemistry of Mesoproterozoic Lower Vindhyan Shales from Chittaurgarh, Southeastern Rajasthan and Its Bearing on Source Rock Composition, Palaeoweathering Conditions and Tectonosedimentary Environments. J. Geol. Soc. India 2002, 60, 505–518. [Google Scholar]
- Morton, C.A. Geochemical Studies of Detrital Heavy Minerals and Their Application to Provenance Research. Geol. Soc. Lond. Spec. Publ. 1991, 57, 31–45. [Google Scholar] [CrossRef]
- Morton, A.C.; Hallsworth, C.R. Processes Controlling the Composition of Heavy Mineral Assemblages in Sandstones. Sediment. Geol. 1999, 124, 3–29. [Google Scholar] [CrossRef]
- Morton, A.C.; Whitham, A.G.; Fanning, C.M. Provenance of Late Cretaceous to Paleocene Submarine Fan Sandstones in the Norwegian Sea: Integration of Heavy Mineral, Mineral Chemical and Zircon Age Data. Sediment. Geol. 2005, 182, 3–28. [Google Scholar] [CrossRef]
- Morton, A.; Hurst, A. Correlation of Sandstones Using Heavy Minerals: An Example from the Statfjord Formation of the Snorre Field, Northern North Sea. Geol. Soc. Lond. Spec. Publ. 1995, 89, 3–22. [Google Scholar] [CrossRef]
- Verma, S.P.; Armstrong-Altrin, J.S. New Multi-Dimensional Diagrams for Tectonic Discrimination of Siliciclastic Sediments and Their Application to Precambrian Basins. Chem. Geol. 2013, 355, 117–133. [Google Scholar] [CrossRef]
- Verma, S.P.; Armstrong-Altrin, J.S. Geochemical Discrimination of Siliciclastic Sediments from Active and Passive Margin Settings. Sediment. Geol. 2016, 332, 1–12. [Google Scholar] [CrossRef]
- Miroslav, K.; Stanislav, M.; Paillet, F. Geophysical Well Logging. In Hydrogeophysics; Springer: Berlin/Heidelberg, Germany, 2005. [Google Scholar]
- Working Group on Nuclear Techniques in, Hydrology. Nuclear Well Logging in Hydrology; International Atomic Energy Agency: Vienna, Austria, 1971. [Google Scholar]
- Hu, C.; Hu, G.; He, Y.; Li, J.; Li, H.; Xu, M. Application of Radioactive Thorium Logging in Provenance Analysis. Geol. Sci. Technol. Inf. 2019, 38, 54–63. [Google Scholar]
- Zhao, R.; Chen, S.; Wang, H.; Yan, D.; Cao, H.; Gong, Y.; He, J.; Wu, Z. Paleogene Sedimentation Changes in Lenghu Area, Qaidam Basin in Response to the India–Eurasia Collision. Int. J. Earth Sci. 2019, 108, 27–48. [Google Scholar] [CrossRef]
- Li, S.; Zhao, G.; Dai, L.; Zhou, L.; Liu, X.; Suo, Y.; Santosh, M. Cenozoic Faulting of the Bohai Bay Basin and Its Bearing on the Destruction of the Eastern North China Craton. J. Asian Earth Sci. 2012, 47, 80–93. [Google Scholar] [CrossRef]
- Tapponnier, P.; Peltzer, G.L.D.A.Y.; Le Dain, A.Y.; Armijo, R.; Cobbold, P. Propagating Extrusion Tectonics in Asia: New Insights from Simple Experiments with Plasticine. Geology 1982, 10, 611–616. [Google Scholar] [CrossRef]
- Liu, Z.; Huang, C.; Algeo, T.J.; Liu, H.; Hao, Y.; Du, X.; Lu, Y.; Chen, P.; Guo, L.; Peng, L. High-Resolution Astrochronological Record for the Paleocene-Oligocene (66–23 Ma) from the Rapidly Subsiding Bohai Bay Basin, Northeastern China. Palaeogeogr. Palaeoclimatol. Palaeoecol. 2018, 510, 78–92. [Google Scholar] [CrossRef]
- Liu, M.; Cui, X.; Liu, F. Cenozoic Rifting and Volcanism in Eastern China: A Mantle Dynamic Link to the Indo–Asian Collision? Tectonophysics 2004, 393, 29–42. [Google Scholar] [CrossRef]
- Chen, S.; Liu, X.; Cui, Y.; Zhao, X.; Zhang, J. Palaeogene Structural Evolution of Dongying Depression, Bohai Bay Basin, Ne China. Int. Geol. Rev. 2017, 59, 259–273. [Google Scholar] [CrossRef]
- Allen, M.B.; Macdonald, D.I.M.; Xun, Z.; Vincent, S.J.; Brouet-Menzies, C. Early Cenozoic Two-Phase Extension and Late Cenozoic Thermal Subsidence and Inversion of the Bohai Basin, Northern China. Mar. Pet. Geol. 1997, 14, 951–972. [Google Scholar] [CrossRef]
- Huang, H.; Pearson, M.J. Source Rock Palaeoenvironments and Controls on the Distribution of Dibenzothiophenes in Lacustrine Crude Oils, Bohai Bay Basin, Eastern China. Org. Geochem. 1999, 30, 1455–1470. [Google Scholar] [CrossRef]
- Huang, L.; Liu, C.; Wang, Y.; Zhao, J.; Mountney, N.P. Neogene–Quaternary Postrift Tectonic Reactivation of the Bohai Bay Basin, Eastern China. AAPG Bull. 2014, 98, 1377–1400. [Google Scholar] [CrossRef]
- Dong, Y.; Xiao, L.; Zhou, H.; Wang, C.; Zheng, J.; Zhang, N.; Xia, W.; Ma, Q.; Du, J.; Zhao, Z. The Tertiary Evolution of the Prolific Nanpu Sag of Bohai Bay Basin, China: Constraints from Volcanic Records and Tectono-Stratigraphic Sequences. Bulletin 2010, 122, 609–626. [Google Scholar] [CrossRef]
- Huang, C.; Wang, H.; Wu, Y.; Wang, J.; Chen, S.; Ren, P.; Liao, Y.; Xia, C. Genetic Types and Sequence Stratigraphy Models of Palaeogene Slope Break Belts in Qikou Sag, Huanghua Depression, Bohai Bay Basin, Eastern China. Sediment. Geol. 2012, 261, 65–75. [Google Scholar] [CrossRef]
- Li, S.; Li, S.; Wang, Y.; Li, X.; Suo, Y.; Wang, P.; Wang, Q.; Zhang, J.; Somerville, I. Cenozoic Faulting Response of Eastern North China to Subduction of the Pacific Plate: A Case of Study of the Luxi Block. Geol. J. 2017, 52, 70–80. [Google Scholar] [CrossRef]
- Li, S.; Suo, Y.; Li, X.; Zhou, J.; Santosh, M.; Wang, P.; Wang, G.; Guo, L.; Yu, S.; Lan, H. Mesozoic Tectono-Magmatic Response in the East Asian Ocean-Continent Connection Zone to Subduction of the Paleo-Pacific Plate. Earth-Sci. Rev. 2019, 192, 91–137. [Google Scholar] [CrossRef]
- Cao, X.; Flament, N.; Müller, D.; Li, S. The Dynamic Topography of Eastern China since the Latest Jurassic Period. Tectonics 2018, 37, 1274–1291. [Google Scholar] [CrossRef]
- Min, H.; Yingchang, C.; Yanzhong, W. Sedimentary Facies of Sha4 to Lower Sha3 Member in Paleogene in Chezhen Depression. Pet. Geol. Recovery Effic. 2009, 16, 16–18. [Google Scholar]
- Hongwen, D.; Yi, X.; Lixiang, M.; Zhenglong, J. Genetic Type, Distribution Patterns and Controlling Factors of Beach and Bars in the Second Member of the Shahejie Formation in the Dawangbei Sag, Bohai Bay, China. Geol. J. 2011, 46, 380–389. [Google Scholar] [CrossRef]
- Su, S.; Jiang, Z.; Gao, Z.; Ning, C.; Wang, Z.; Li, Z.; Zhu, R. A New Method for Continental Shale Oil Enrichment Evaluation. Interpretation 2017, 5, T209–T217. [Google Scholar] [CrossRef]
- Wahl, J.S. Gamma-Ray Logging. Geophysics 1983, 48, 1536–1550. [Google Scholar] [CrossRef]
- Galbraith, J.H.; Saunders, D.F. Rock Classification by Characteristics of Aerial Gamma-Ray Measurements. J. Geochem. Explor. 1983, 18, 49–73. [Google Scholar] [CrossRef]
- Poupon, A.; Gaymard, R. The Evaluation of Clay Content from Logs. In Proceedings of the SPWLA 11th Annual Logging Symposium, Los Angeles, CA, USA, 3–6 May 1970. [Google Scholar]
- Wonik, T. Gamma-Ray Measurements in the Kirchrode I and Ii Boreholes. Palaeogeogr. Palaeoclimatol. Palaeoecol. 2001, 174, 97–105. [Google Scholar] [CrossRef]
- Thibal, J.; Etchecopar, A.; Pozzi, J.P.; Barthès, V.; Pocachard, J. Comparison of Magnetic and Gamma Ray Logging for Correlations in Chronology and Lithology: Example from the Aquitanian Basin (France). Geophys. J. Int. 1999, 137, 839–846. [Google Scholar] [CrossRef]
- Herbert, D.T.; Mayer, L.A. Long Climatic Time Series from Sediment Physical Property Measurements. J. Sediment. Res. 1991, 61, 1089–1108. [Google Scholar]
- Liu, Z.C.; Chen, Y.; Yuan, L.W.; Zhou, C.L.; Wang, Y.J.; Li, J.Q.; Yang, P.; Xi, P. The Application of Natural Gamma Logging Curve to Recovering Palaeoclimatic Changes from 2.85 Ma Bp. Sci. China (Ser. D) 2000, 30, 609–618. [Google Scholar]
- Zhong-Hong, C.; Zha, M.; Jin, Q. Application of Natural Gamma Ray Logging and Natural Gamma Spectrometry Logging to Recovering Paleoenvironment of Sedimentary Basins. Chin. J. Geophys. 2004, 47, 1286–1290. [Google Scholar]
- Song, Z.Q.; Li, W.-f.; Tang, C.-j.; Li, W.-f.; Pang, Z.-y.; Wang, Y. Dividing Sedimentary Facies and Reservoir Distributions by Using Natural Potential and Natural Gamma Ray Logging Curves. Prog. Geophys 2009, 24, 651–656. [Google Scholar]
- Bücker, C.; Rybach, L. A Simple Method to Determine Heat Production from Gamma-Ray Logs. Mar. Pet. Geol. 1996, 13, 373–375. [Google Scholar] [CrossRef]
- Boyle, R.W. Geochemical Prospecting for Thorium and Uranium Deposits; Elsevier: Amsterdam, The Netherlands, 2013. [Google Scholar]
- Taylor, S.R.; McLennan, S.M. The Continental Crust: Its Composition and Evolution; U.S. Department of Energy: Washington, DC, USA, 1985.
- Condie, C.K. Another Look at Rare Earth Elements in Shales. Geochim. Cosmochim. Acta 1991, 55, 2527–2531. [Google Scholar] [CrossRef]
- Bauluz, B.; Mayayo, M.J.; Fernandez-Nieto, C.; Lopez, J.M.G. Geochemistry of Precambrian and Paleozoic Siliciclastic Rocks from the Iberian Range (Ne Spain): Implications for Source-Area Weathering, Sorting, Provenance, and Tectonic Setting. Chem. Geol. 2000, 168, 135–150. [Google Scholar] [CrossRef]
- McLennan, S.M.; Hemming, S.; McDaniel, D.K.; Hanson, G.N. Geochemical Approaches to Sedimentation, Provenance, and Tectonics. Spec. Pap. Geol. Soc. Am. 1993, 21. [Google Scholar] [CrossRef]
- Pettijohn, F.J. Sedimentary Rocks; Harper and Brothers: New York, NY, USA, 1957; 718p. [Google Scholar]
- Basu, H.; Kumar, K.M.; Paneerselvam, S.; Chaki, A. Study of Provenance Characteristics and Depositional History on the Basis of U, Th and K Abundances in the Gulcheru Formation, Cuddapah Basin in Tummalapalle-Somalollapalle Areas, Cuddapah-Anantapur Districts, Andhra Pradesh. J. Geol. Soc. India 2009, 74, 318. [Google Scholar] [CrossRef]
- Pan, H.P.; Niu, Y.X.; Wang, W.X. Ccsd Well Logging Engineering Program. J. China Univ. Geosci. 2002, 13, 91–94. [Google Scholar]
- Niu, Y.X.; Pan, H.P.; Wang, W.X.; Zhu, L.F.; Xu, D.H. Geophysical Well Logging in Main Hole (0~2000 M) of Chinese Continental Scientific Drilling. Acta Petrol. Sin. 2004, 20, 165–178. [Google Scholar]
- He, J.; Ding, W.; Zhang, J.; Li, A.; Zhao, W.; Dai, P. Logging Identification and Characteristic Analysis of Marine–Continental Transitional Organic-Rich Shale in the Carboniferous-Permian Strata, Bohai Bay Basin. Mar. Pet. Geol. 2016, 70, 273–293. [Google Scholar] [CrossRef]
- Wen, J.; He, Y.-b.; Wu, C.-x.; Luo, W. Geologic Application of Diplogging. J. Oil Gas. Technol. 2008, 1, 263–265. [Google Scholar]
- Jin, J.; Guan, D. Anlyse the Characteristic of Diagenesis and Porosity in Dawangbei Sub-Sag, Chezhen Sag. Sichuan Nonferrous Met. 2016, 3, 14–17. [Google Scholar]
- Wang, L. The Characteristics of Reservoirs and Hydrocarbon Accumulation in the Middle Section of the Steep Slope Zone in Chezhen Depression. Master’s Thesis, China University of Petroleum, Beijing, China, 2016. [Google Scholar]
- Wang, Y.; Cao, Y. Lower Property Limit and Controls on Deep Effective Clastic Reservoirs of Paleogene in Chezhen Depression. Acta Sedimentol. Sin. 2010, 28, 752–761. [Google Scholar]
- Ni, J.L.; Zhang, H.; Tang, X.L.; Han, S. Diagenetic and Paleogeothermal Evolution of the Clay Minerals in the Center Uplift Belt and Its Adjacent Region of Huimin Sag, Jiyang Depression. Nat. Gas Geosci. 2016, 27, 1778–1788. [Google Scholar]
- Fu, H.; Hu, X.; Liang, W.; Eduardo, G. Heavy Mineral Assemblages of Jurassic-Paleogene Sandstones in Southern Tibet: Implications for Provenance Interpretations of Magmatic Arc and Continental Block. Geol. J. China Univ. 2020, 26, 530–539. [Google Scholar]
- Mondal, M.E.A.; Wani, H.; Mondal, B. Geochemical Signature of Provenance, Tectonics and Chemical Weathering in the Quaternary Flood Plain Sediments of the Hindon River, Gangetic Plain, India. Tectonophysics 2012, 566, 87–94. [Google Scholar] [CrossRef]
- Davis, W.D. U–Pb Geochronology of Archean Metasedimentary Rocks in the Pontiac and Abitibi Subprovinces, Quebec, Constraints on Timing, Provenance and Regional Tectonics. Precambrian Res. 2002, 115, 97–117. [Google Scholar] [CrossRef]
- LiQing, X.; SanZhong, L.; LingLi, G.; YanHui, S.; XianZhi, C.; LiMing, D.; PengCheng, W.; GeGe, H. Impaction of the Tan-Lu Fault Zone on Uplift of the Luxi Rise: Constraints from Apatite Fission Track Thermochronology. Acta Petrol. Sin. 2016, 32, 1153–1170. [Google Scholar]
- Li, S.Z.; Suo, Y.H.; Zhou, L.H.; Dai, L.M.; Zhou, J.T.; Zhao, F.M. Pull-Apart Basins within the North China Craton: Structural Pattern and Evolution of Huanghua Depression in Bohai Bay Basin. J. Jilin Univ. (Earth Sci. Ed.) 2011, 41, 1362–1379. [Google Scholar]
- Li, S.Z.; Suo, Y.H.; Santosh, M.; Dai, L.M.; Liu, X.; Yu, S.; Zhao, S.J.; Jin, C. Mesozoic to Cenozoic Intracontinental Deformation and Dynamics of the North China Craton. Geol. J. 2013, 48, 543–560. [Google Scholar] [CrossRef]
- Jiang, F.; Pang, X.; Yu, S.; Hu, T.; Bai, J.; Han, G.; Li, B. Charging History of Paleogene Deep Gas in the Qibei Sag, Bohai Bay Basin, China. Mar. Pet. Geol. 2015, 67, 617–634. [Google Scholar] [CrossRef]
- Zhou, J.-B.; Li, L. The Mesozoic Accretionary Complex in Northeast China: Evidence for the Accretion History of Paleo-Pacific Subduction. J. Asian Earth Sci. 2017, 145, 91–100. [Google Scholar] [CrossRef]
- Zhou, J.B.; Cao, J.L.; Wilde, S.A.; Zhao, G.C.; Zhang, J.J.; Wang, B. Paleo-Pacific Subduction-Accretion: Evidence from Geochemical and U-Pb Zircon Dating of the Nadanhada Accretionary Complex, Ne China. Tectonics 2014, 33, 2444–2466. [Google Scholar] [CrossRef] [Green Version]
- Liu, L.; Xu, X.; Zou, H. Episodic Eruptions of the Late Mesozoic Volcanic Sequences in Southeastern Zhejiang, Se China: Petrogenesis and Implications for the Geodynamics of Paleo-Pacific Subduction. Lithos 2012, 154, 166–180. [Google Scholar] [CrossRef]
- Müller, R.D.; Seton, M.; Zahirovic, S.; Williams, S.E.; Matthews, K.J.; Wright, N.M.; Shephard, G.E.; Maloney, K.T.; Barnett-Moore, N.; Hosseinpour, M. Ocean Basin Evolution and Global-Scale Plate Reorganization Events since Pangea Breakup. Annu. Rev. Earth Planet. Sci. 2016, 44, 107–138. [Google Scholar] [CrossRef]
- Zahirovic, S.; Matthews, K.J.; Flament, N.; Müller, R.D.; Hill, K.C.; Seton, M.; Gurnis, M. Tectonic Evolution and Deep Mantle Structure of the Eastern Tethys since the Latest Jurassic. Earth-Sci. Rev. 2016, 162, 293–337. [Google Scholar] [CrossRef] [Green Version]
- Liu, L.; Xu, X.; Xia, Y. Asynchronizing Paleo-Pacific Slab Rollback beneath Se China: Insights from the Episodic Late Mesozoic Volcanism. Gondwana Res. 2016, 37, 397–407. [Google Scholar] [CrossRef]
- Qiu, L.; Yan, D.P.; Xu, H.; Shi, H.; Dong, W.; Sun, S. Late Cretaceous Mud Volcanism in the Southwestern Songliao Basin Records Slab Rollback of the Subducted Paleo-Pacific Plate Underneath Ne China. J. Asian Earth Sci. X 2020, 3, 100028. [Google Scholar] [CrossRef]
- Tang, J.; Xu, W.; Wang, F.; Ge, W. Subduction History of the Paleo-Pacific Slab beneath Eurasian Continent: Mesozoic-Paleogene Magmatic Records in Northeast Asia. Sci. China Earth Sci. 2018, 61, 527–559. [Google Scholar] [CrossRef]
- Tang, Z.Y.; Sun, D.Y.; Mao, A.Q.; Yang, D.G.; Deng, C.Z. Timing and Evolution of Mesozoic Volcanism in the Central Great Xing’an Range, Northeastern China. Geol. J. 2019, 54, 3737–3754. [Google Scholar] [CrossRef]
- Tang, J.; Zhang, Z.; Ji, Z.; Chen, Y.; Li, K.; Jinfu, Y.; Liu, P. Early Cretaceous Volcanic and Sub-Volcanic Rocks in the Erlian Basin and Adjacent Areas, Northeast China: New Geochemistry, Geochronology and Zircon Hf Isotope Constraints on Petrogenesis and Tectonic Setting. Int. Geol. Rev. 2019, 61, 1479–1503. [Google Scholar] [CrossRef]
- Li, S.Z.; Suo, Y.H.; Dai, L.M.; Liu, L.P.; Jiao, Q. Development of the Bohai Bay Basin and Destruction of the North China Craton. Earth Sci. Front. 2010, 17, 64–89. [Google Scholar]


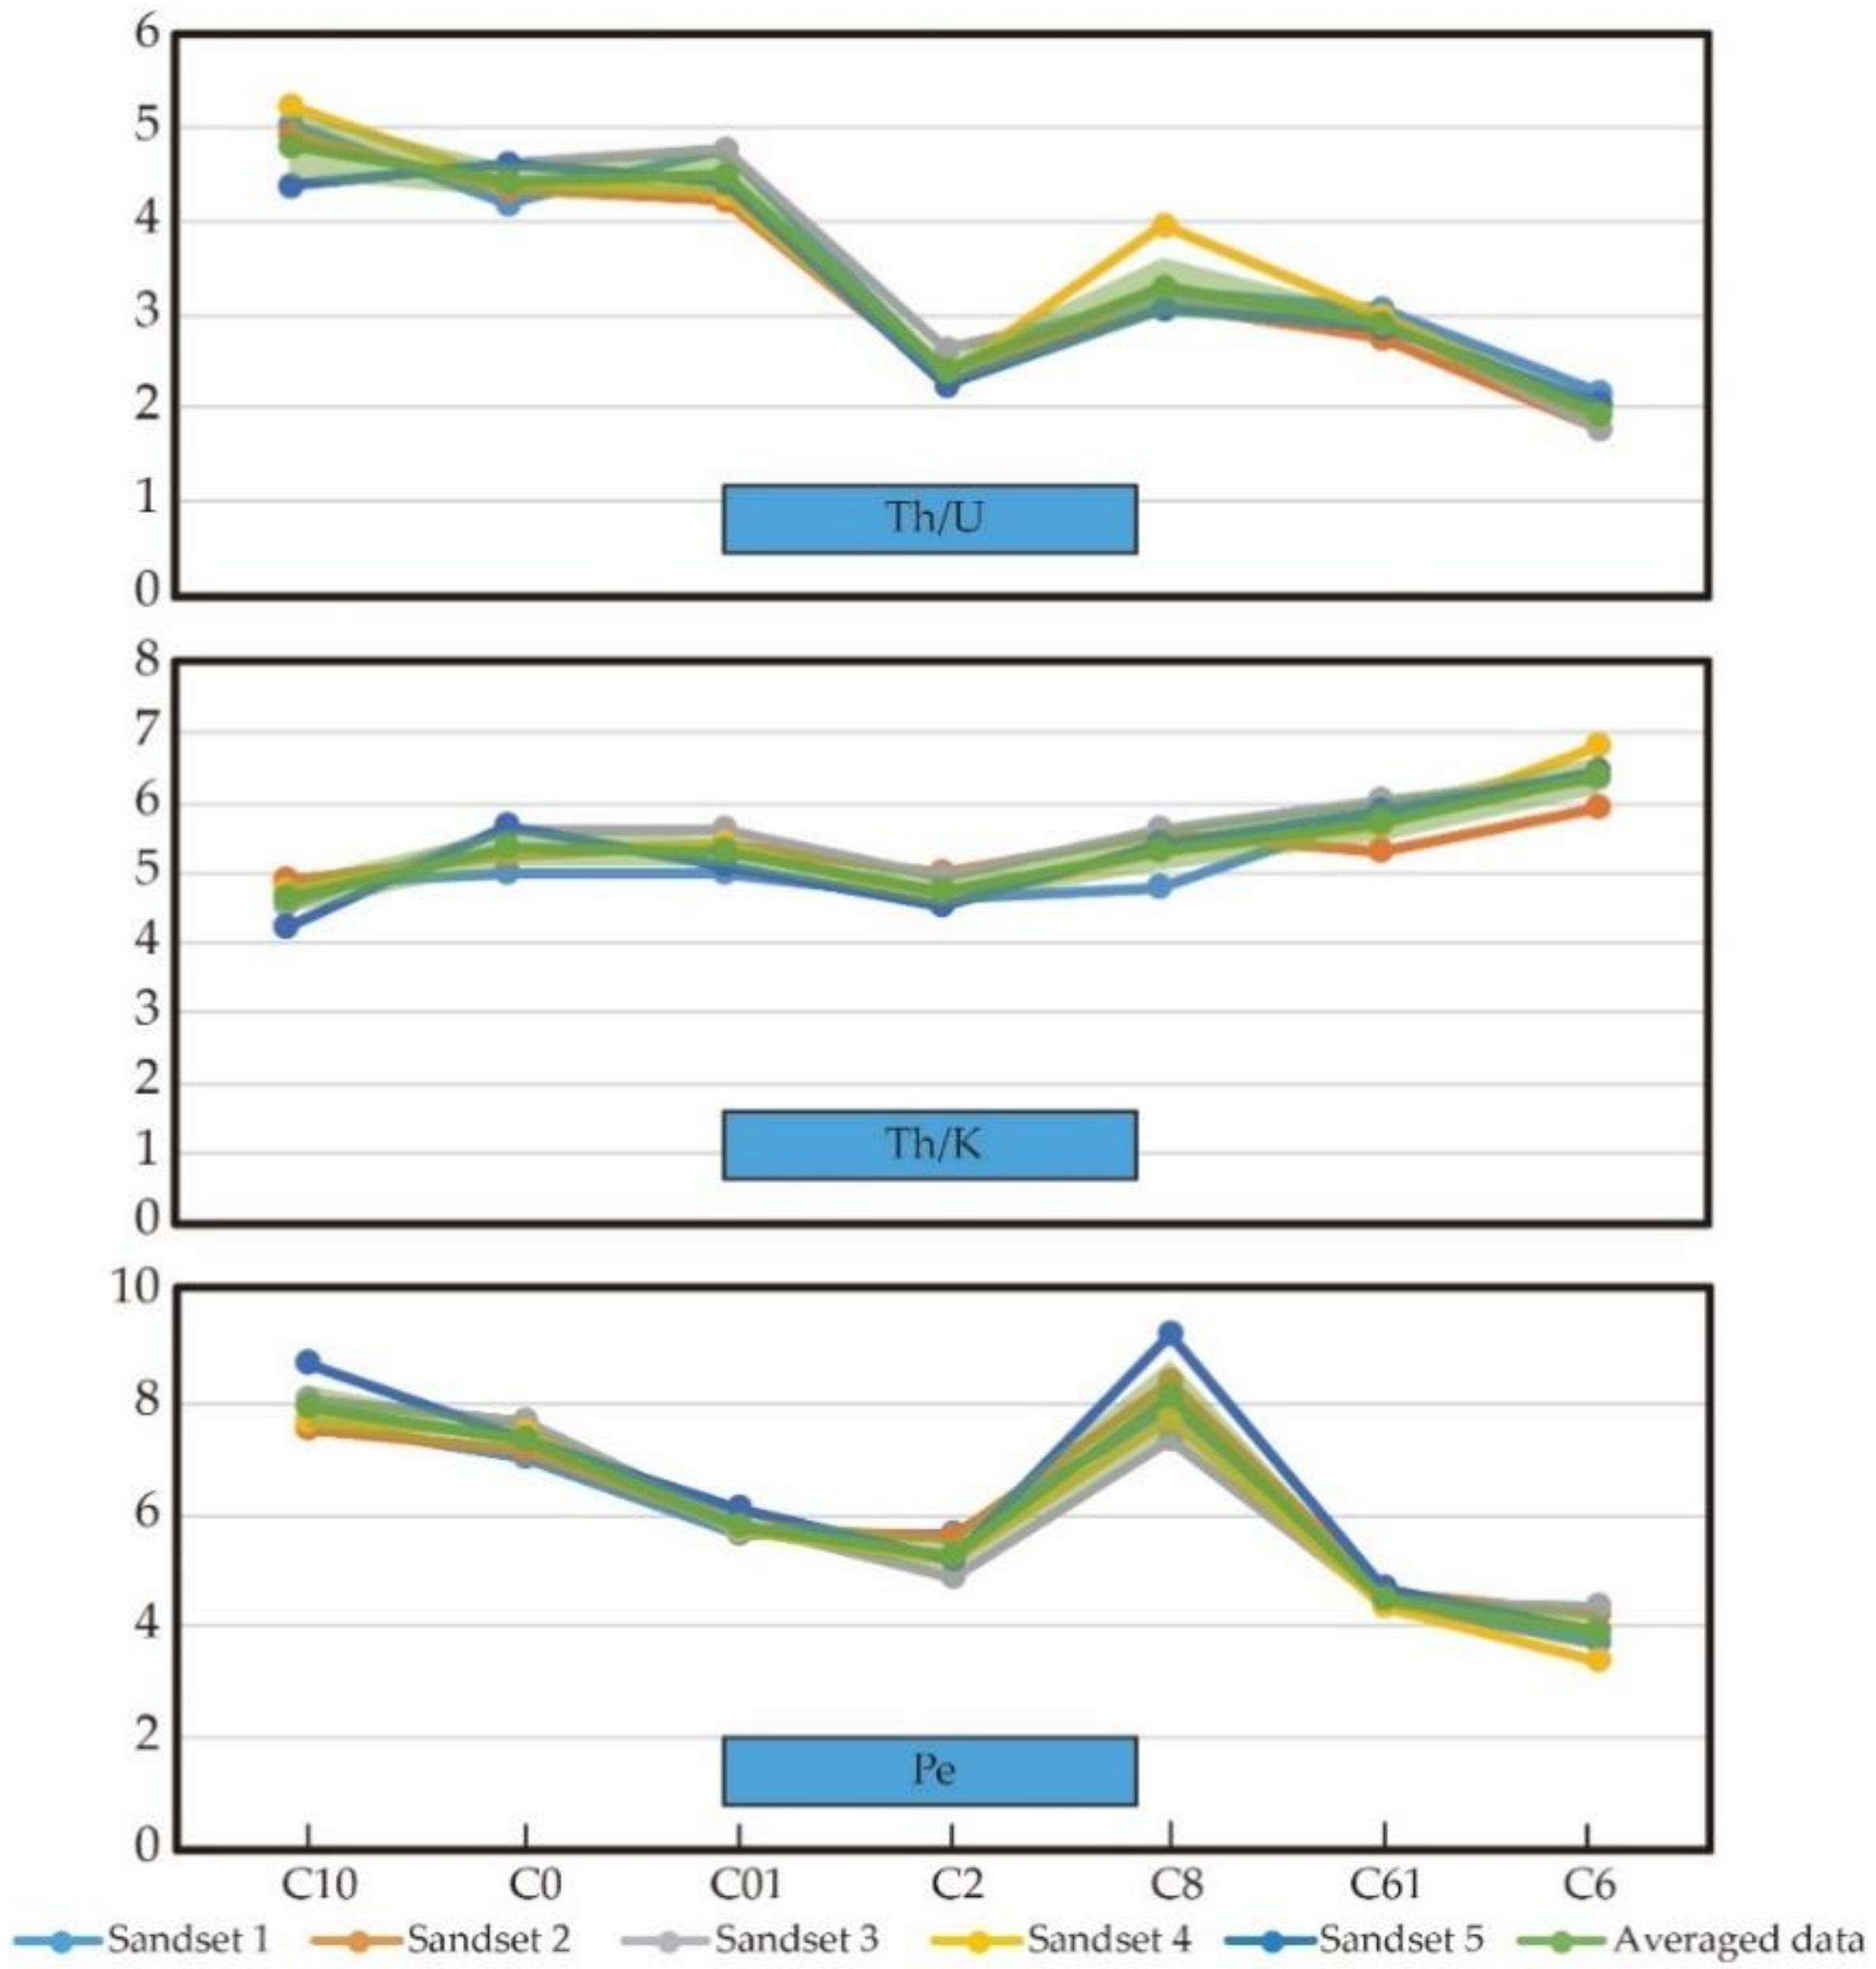
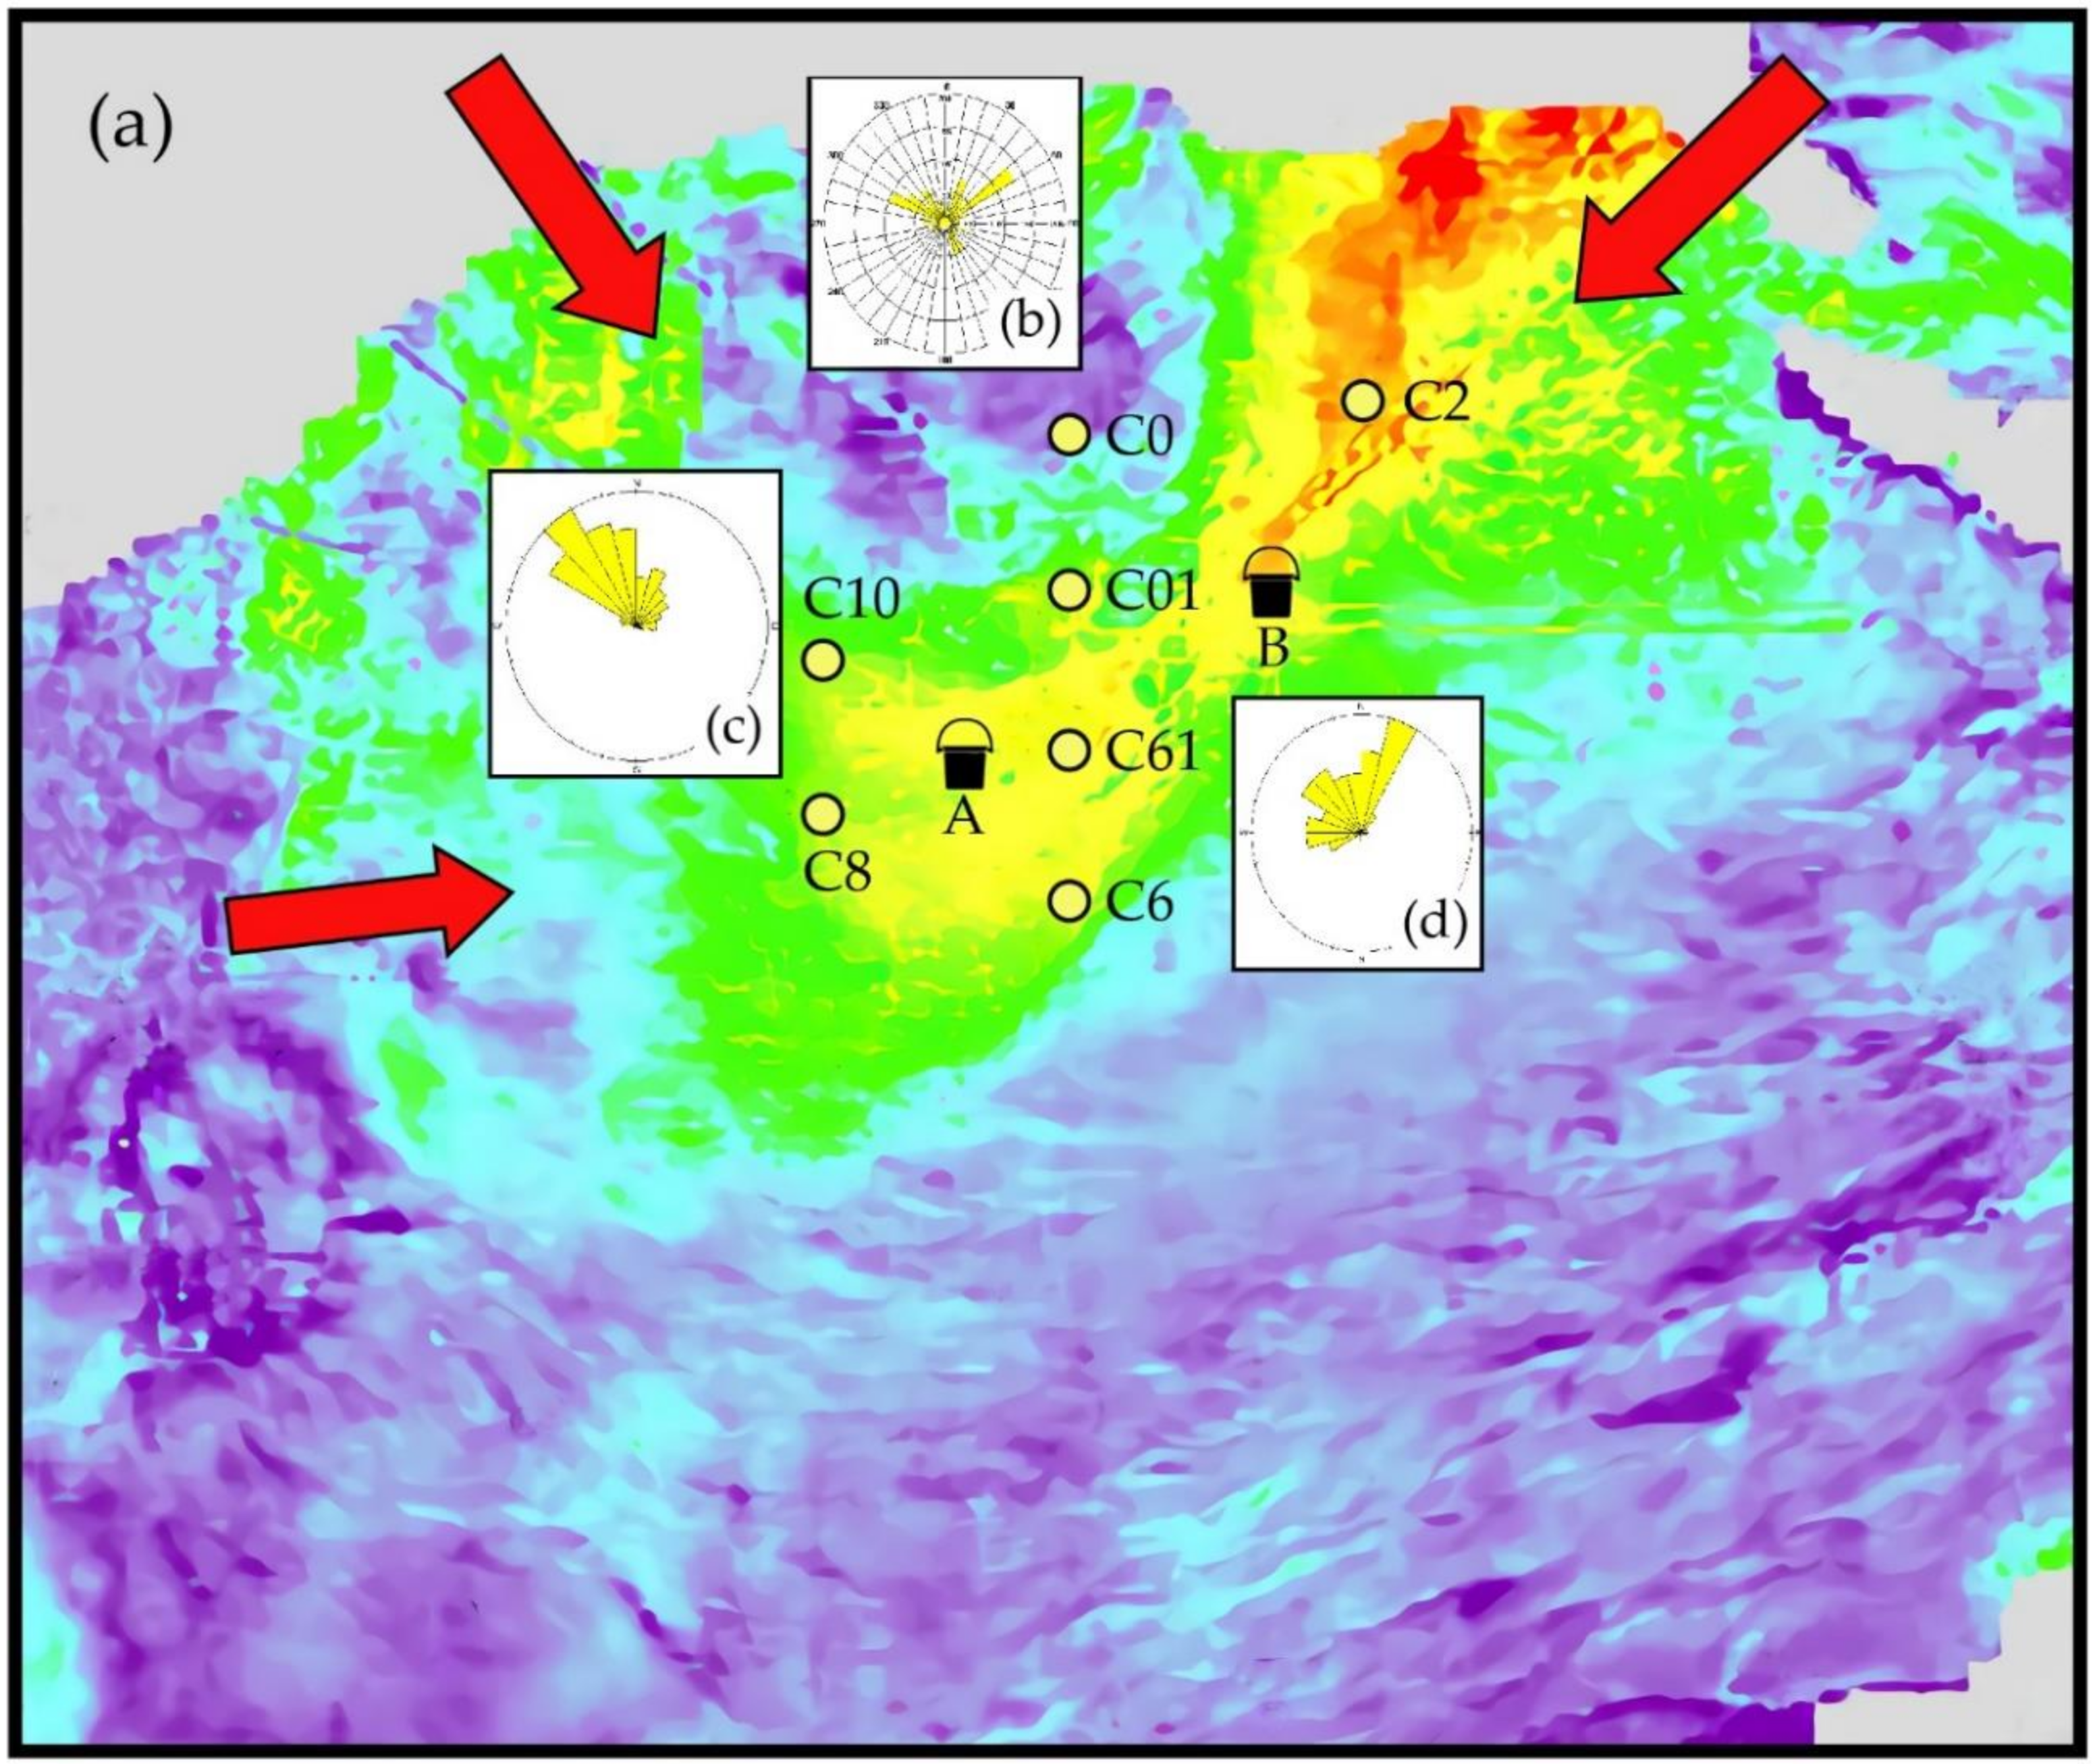
| Type/ Sandset No. | Wells | ||||||
|---|---|---|---|---|---|---|---|
| C01 | C8 | C61 | C0 | C6 | C10 | C2 | |
| Th/U | |||||||
| S1 | 4.77 | 3.25 | 3.06 | 4.18 | 2.16 | 5.05 | 2.38 |
| S2 | 4.22 | 3.11 | 2.76 | 4.34 | 1.78 | 4.93 | 2.31 |
| S3 | 4.79 | 3.15 | 2.94 | 4.64 | 1.79 | 4.40 | 2.64 |
| S4 | 4.32 | 3.94 | 2.97 | 4.43 | 1.98 | 5.25 | 2.33 |
| S5 | 4.42 | 3.05 | 2.88 | 4.62 | 2.04 | 4.38 | 2.26 |
| AVG a | 4.50 | 3.30 | 2.92 | 4.44 | 1.95 | 4.80 | 2.38 |
| SD | 0.23 | 0.33 | 0.10 | 0.17 | 0.15 | 0.35 | 0.13 |
| Th/K | |||||||
| S1 | 4.98 | 4.79 | 5.86 | 4.99 | 6.38 | 4.83 | 4.60 |
| S2 | 5.40 | 5.55 | 5.28 | 5.26 | 5.94 | 4.88 | 5.00 |
| S3 | 5.59 | 5.59 | 6.05 | 5.59 | 6.36 | 4.53 | 4.92 |
| S4 | 5.42 | 5.28 | 5.66 | 5.30 | 6.82 | 4.74 | 4.58 |
| S5 | 5.11 | 5.41 | 5.85 | 5.68 | 6.46 | 4.23 | 4.51 |
| AVG b | 5.30 | 5.32 | 5.74 | 5.36 | 6.39 | 4.64 | 4.72 |
| SD | 0.22 | 0.29 | 0.26 | 0.25 | 0.28 | 0.24 | 0.20 |
| Pe | |||||||
| S1 | 5.62 | 7.83 | 4.41 | 7.00 | 3.72 | 7.68 | 5.66 |
| S2 | 5.75 | 8.38 | 4.62 | 7.13 | 4.21 | 7.53 | 5.57 |
| S3 | 5.85 | 7.31 | 4.45 | 7.68 | 4.37 | 8.04 | 4.84 |
| S4 | 5.72 | 7.75 | 4.38 | 7.49 | 3.38 | 7.69 | 5.22 |
| S5 | 6.11 | 9.23 | 4.71 | 7.37 | 3.90 | 8.69 | 5.18 |
| AVG c | 5.81 | 8.10 | 4.51 | 7.33 | 3.92 | 7.93 | 5.29 |
| SD | 0.17 | 0.66 | 0.13 | 0.24 | 0.35 | 0.42 | 0.29 |
| Well/Sandset No. | Color Patterns | Dip Angle (°) | Azimuth Scope (°) | Main Azimuth (°) |
|---|---|---|---|---|
| C10 | ||||
| S1 | Blue | 17–27 | 91.1–224.1 | 126.3 |
| S2 | Blue, green | 17–29 | 88.2–211.6 | 138.8 |
| S3 | Blue, green | 14–26 | 101.1–243.2 | 146.4 |
| S4 | Blue | 15–26 | 108.2–179.5 | 155.3 |
| S5 | Blue, red | 10–27 | 114.7–273.6 | 160.2 |
| C01 | ||||
| S1 | Blue, green | 20–32 | 98.4–241.4 | 103.9/240.2 |
| S2 | Blue | 15–28 | 95.3–259.1 | 108.1/235.5 |
| S3 | Blue, green | 17–31 | 103.7–246.8 | 110.7/233.9 |
| S4 | Blue, green | 15–29 | 121.3–179.5 | 98.6/179.5 |
| S5 | Blue | 16–29 | 115.7–252.6 | 116.3/236.5 |
| C61 | ||||
| S1 | Blue, green | 11–19 | 68.7–187.6 | 93.6/208.8 |
| S2 | Blue | 11–20 | 82.8–213.2 | 101.2/206.3 |
| S3 | Blue, green | 9–21 | 90.1–196.2 | 118.0/202.6 |
| S4 | Blue | 8–18 | 123.8–179.5 | 126.7/179.5 |
| S5 | Blue | 8–19 | 102.7–210.5 | 123.5/203.4 |
| Well/Sandset No. | Porosity (%) | Averaged Porosity (%) | Permeability (mD) | Reservoir Thickness (m) | Total Thickness (m) |
|---|---|---|---|---|---|
| C10 | |||||
| S1 | 3.41 | 0.35 | 30.4 | ||
| S2 | 3.17 | 0.36 | 20.8 | ||
| S3 | 2.17 | 0.12 | 39.0 | ||
| S4 | 2.95 | 0.19 | 28.0 | ||
| S5 | 2.51 | 2.84 a | 0.12 | 12.0 | 130.2 g |
| C01 | |||||
| S1 | 4.52 | 0.33 | 19.5 | ||
| S2 | 5.74 | 0.58 | 19.0 | ||
| S3 | 5.86 | 0.76 | 8.0 | ||
| S4 | 7.14 | 1.65 | 35.5 | ||
| S5 | 6.05 | 5.86 b | 0.73 | 29.5 | 111.5 h |
| C2 | |||||
| S1 | 2.60 | 0.10 | 27.4 | ||
| S2 | 2.44 | 0.10 | 12.4 | ||
| S3 | 1.46 | 0.10 | 10.2 | ||
| S4 | 3.90 | 0.13 | 64.5 | ||
| S5 | 3.15 | 0.10 | 42.6 | ||
| S6 | 3.20 | 2.80 c | 0.10 | 53.2 | 210.3 i |
| C6 | |||||
| S1 | - | - | 0.0 | ||
| S2 | 5.38 | 0.40 | 6.0 | ||
| S3 | 2.35 | 0.10 | 7.2 | ||
| S4 | - | - | 0.0 | ||
| S5 | 4.70 | 4.14 d | 0.77 | 4.5 | 17.7 j |
| C61 | |||||
| S1 | 4.83 | 0.20 | 1.0 | ||
| S2 | 4.85 | 0.30 | 26.8 | ||
| S3 | 8.01 | 2.37 | 18.8 | ||
| S4 | 6.40 | 1.20 | 28.1 | ||
| S5 | 8.34 | 6.49 e | 2.25 | 29.5 | 104.3 k |
| C0 | |||||
| S1 | 3.52 | 0.10 | 5.7 | ||
| S2 | 3.86 | 0.26 | 36.6 | ||
| S3 | 4.67 | 1.66 | 37.8 | ||
| S4 | 5.29 | 1.95 | 50.9 | ||
| S5 | 4.97 | 4.46 f | 2.35 | 18.3 | 149.3 l |
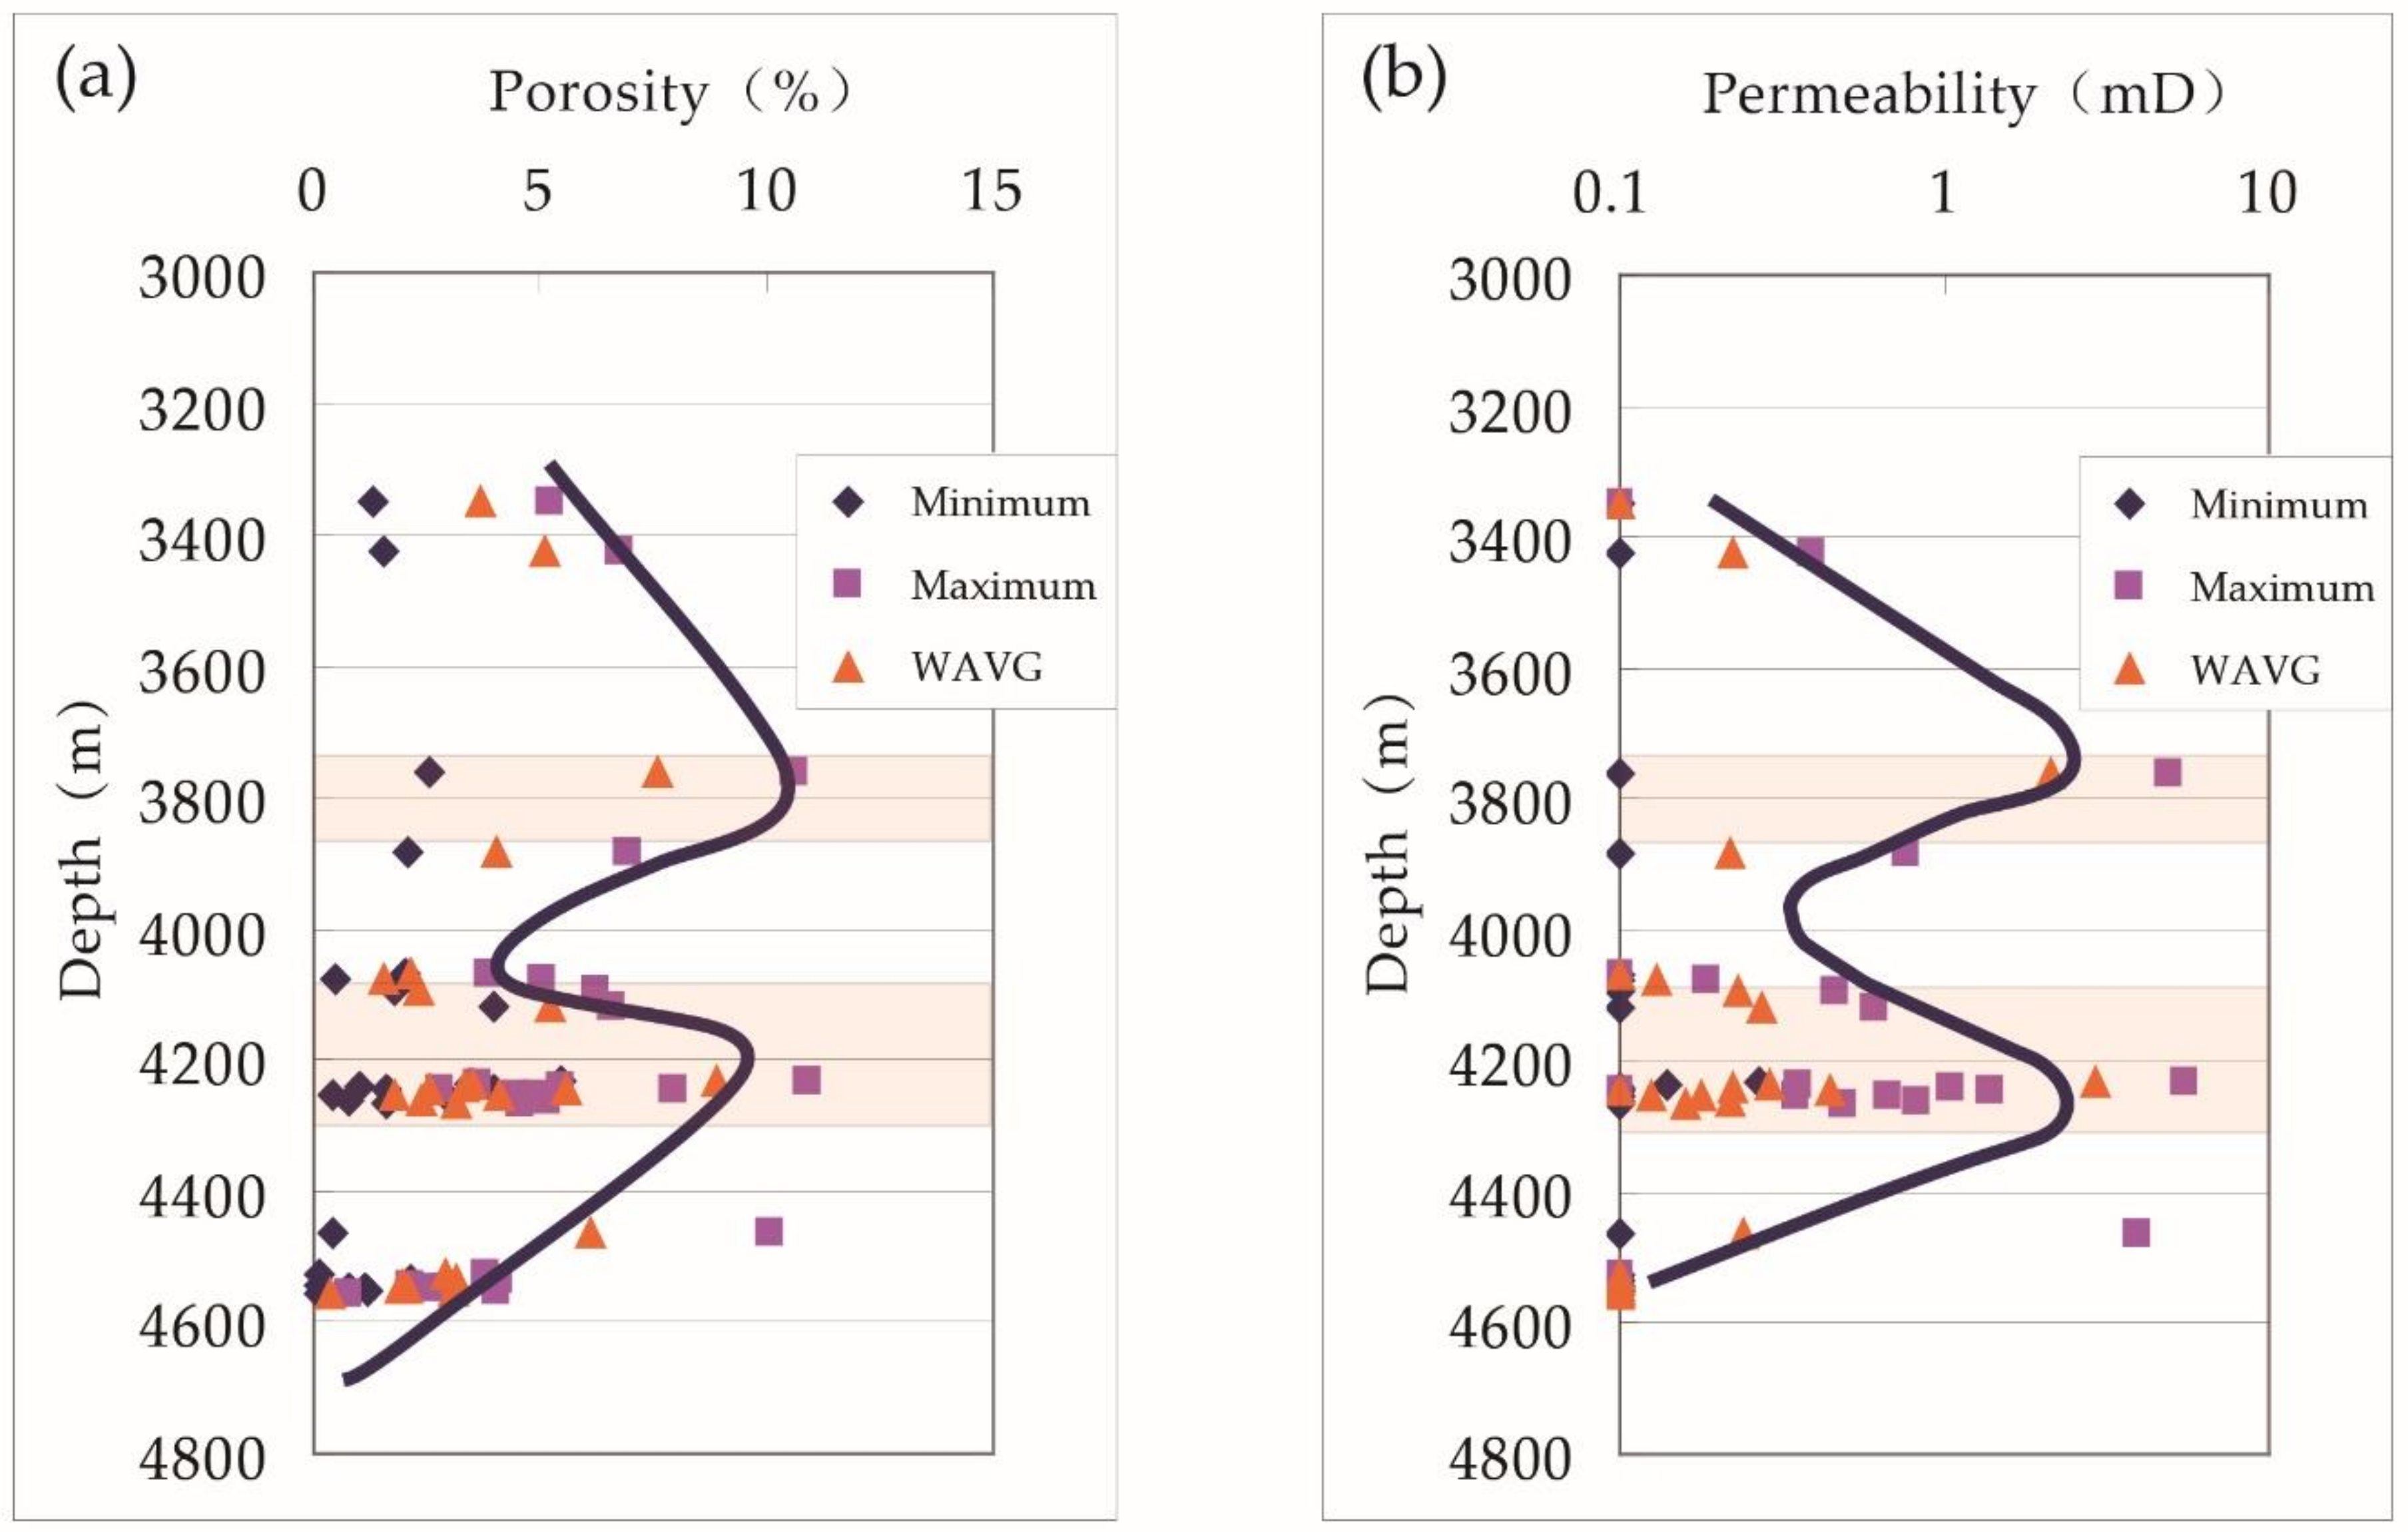
| Thickness/Plies | Ply Thickness (m) | Deep (m) | Porosity (%) | Permeability (mD) | ||||
|---|---|---|---|---|---|---|---|---|
| Min | Max | WAVG | Min | Max | WAVG | |||
| 36.3/1 | 36.3 | 3356.2 | 1.44 | 5.23 | 3.88 | 0.10 | 0.10 | 0.10 |
| 2.0/1 | 2.0 | 3425.4 | 1.55 | 6.79 | 5.12 | 0.10 | 0.39 | 0.22 |
| 161.0/1 | 161.0 | 4462.0 | 0.42 | 10.10 | 6.09 | 0.10 | 3.96 | 0.24 |
| 14.8/3 | 1.9 | 4233.0 | 5.46 | 10.90 | 8.91 | 0.27 | 5.54 | 2.93 |
| 7.6 | 4243.0 | 3.98 | 7.94 | 5.56 | 0.10 | 1.38 | 0.45 | |
| 5.3 | 4253.8 | 2.92 | 4.46 | 4.12 | 0.10 | 0.35 | 0.18 | |
| 4.0/1 | 4.0 | 3759.6 | 2.53 | 10.62 | 7.58 | 0.10 | 4.94 | 2.13 |
| 12.6/5 | 2.0 | 3883.7 | 2.05 | 6.95 | 4.06 | 0.10 | 0.76 | 0.22 |
| 3.0 | 4066.5 | 2.03 | 3.87 | 2.16 | 0.10 | 0.10 | 0.10 | |
| 2.5 | 4077.3 | 0.46 | 5.04 | 1.57 | 0.10 | 0.19 | 0.13 | |
| 2.4 | 4091.6 | 1.75 | 6.20 | 2.30 | 0.10 | 0.46 | 0.23 | |
| 2.7 | 4117.7 | 3.98 | 6.60 | 5.23 | 0.10 | 0.61 | 0.27 | |
| 23.8/6 | 6.0 | 4234.5 | 3.45 | 3.63 | 3.50 | 0.14 | 0.36 | 0.29 |
| 1.7 | 4239.7 | 0.99 | 5.45 | 3.31 | 0.10 | 1.05 | 0.22 | |
| 2.4 | 4243.4 | 1.59 | 2.78 | 2.54 | 0.10 | 0.10 | 0.10 | |
| 10.1 | 4254.9 | 0.42 | 4.92 | 1.80 | 0.10 | 0.67 | 0.13 | |
| 1.9 | 4261.7 | 0.75 | 5.15 | 2.40 | 0.10 | 0.82 | 0.22 | |
| 1.7 | 4264.5 | 1.58 | 4.58 | 3.15 | 0.10 | 0.49 | 0.16 | |
| 16.0/7 | 3.0 | 4527.0 | 0.10 | 3.81 | 2.88 | 0.10 | 0.10 | 0.10 |
| 6.0 | 4536.0 | 2.14 | 4.10 | 3.14 | 0.10 | 0.10 | 0.10 | |
| 1.0 | 4543.0 | 0.11 | 2.12 | 1.98 | 0.10 | 0.10 | 0.10 | |
| 1.0 | 4546.0 | 0.80 | 2.66 | 2.10 | 0.10 | 0.10 | 0.10 | |
| 2.0 | 4549.0 | 1.13 | 2.99 | 1.89 | 0.10 | 0.10 | 0.10 | |
| 2.0 | 4552.0 | 1.19 | 4.02 | 3.08 | 0.10 | 0.10 | 0.10 | |
| 1.0 | 4557.0 | 0.10 | 0.75 | 0.35 | 0.10 | 0.10 | 0.10 | |
Publisher’s Note: MDPI stays neutral with regard to jurisdictional claims in published maps and institutional affiliations. |
© 2021 by the authors. Licensee MDPI, Basel, Switzerland. This article is an open access article distributed under the terms and conditions of the Creative Commons Attribution (CC BY) license (http://creativecommons.org/licenses/by/4.0/).
Share and Cite
Gao, Y.; Li, F.; Shi, S.; Chen, Y. Determination of Paleocurrent Directions Based on Well Logging Technology Aiming at the Lower Third Member of the Shahejie Formation in the Chezhen Depression and Its Implications. Water 2021, 13, 408. https://doi.org/10.3390/w13040408
Gao Y, Li F, Shi S, Chen Y. Determination of Paleocurrent Directions Based on Well Logging Technology Aiming at the Lower Third Member of the Shahejie Formation in the Chezhen Depression and Its Implications. Water. 2021; 13(4):408. https://doi.org/10.3390/w13040408
Chicago/Turabian StyleGao, Yangjun, Furong Li, Shilong Shi, and Ye Chen. 2021. "Determination of Paleocurrent Directions Based on Well Logging Technology Aiming at the Lower Third Member of the Shahejie Formation in the Chezhen Depression and Its Implications" Water 13, no. 4: 408. https://doi.org/10.3390/w13040408