
A Batch Experiment of Cesium Uptake Using Illitic Clays with Different Degrees of Crystallinity


1
Research Center for Geochronology and Isotope Analysis, Korea Basic Science Institute (KBSI), 162 Yeongudanji-ro, Ochang-eup, Cheongju 28119, Korea
2
Department of Earth System Sciences, Yonsei University, Seoul 03722, Korea
3
Geologic Environment Division, Korea Institute of Geoscience and Mineral Resources (KIGAM), Daejeon 34132, Korea
*
Author to whom correspondence should be addressed.
Water 2021, 13(4), 409; https://doi.org/10.3390/w13040409
Submission received: 28 December 2020
/
Revised: 25 January 2021
/
Accepted: 29 January 2021
/
Published: 4 February 2021
(This article belongs to the Section Hydrology)
Abstract
:Radiocesium released by the severe nuclear accident and nuclear weapon test is a hazardous material. Illitic clays play a key role in the spatial distribution of radiocesium in groundwater environments due to selective uptake sites at the illite mineral, such as frayed edge sites. However, the cesium uptake capabilities of illitic clays are diverse, which could be associated with the illite crystallinity. This study was performed to determine the cesium uptake of illitic clays and evaluate the crystallinity effects on cesium uptake using statistical approaches. A total of 10 illitic clays showed various crystallinity, which was parameterized by the full width at half maximum (FWHM) at 10 Å XRD peak ranging from 0.15 to 0.64. The uptake behavior of illitic clays was well fitted with the Freundlich model (i.e., r2 > 0.946). The uptake efficiency of illitic clays increased with the decrease in dissolved cesium concentrations. The cesium uptake was significantly correlated with the FWHM and cation exchange capacity, suggesting that the uptake becomes higher with decreasing crystallinity through expansion of the edge site and/or formation of ion-exchangeable sites.
1. Introduction
The Fukushima nuclear accident that occurred on 11 March 2011 resulted in widespread radionuclide contamination over the Northern Hemisphere. The greatest environmental concern is related to radiocesium (137Cs) due to its high toxicity and gamma-emitting properties with a relatively long half-life (t1/2 = 30.2 years) as well as its large amount of emission [1]. The extremely elevated activity concentration of 137Cs was found in the broad regions, showing 421,000 Bq kg−1 in a location ~200 km away from the nuclear power plants [2]. In addition, 0.01–0.03 Bq L−1 of 137Cs was detected in >20–30 m deep groundwater [3], and a relatively high concentration of 23 Bq L−1 was also found in beach groundwater [4]. These contamination and remediation issues are still a problem [5,6,7].
Once the 137Cs reaches the ground surface through rainfall and fallouts, the spatial distribution of 137Cs is predominantly controlled by geochemical uptake reactions with geological materials, such as clay minerals. In particular, the illitic clays play an important role in 137Cs uptake in the groundwater environment. Although they have a relatively smaller cation exchange capacity than other expandable clay minerals [8,9,10,11,12], high selectivity sorption sites are present for 137Cs [12,13,14]. Additionally, illite is among the ubiquitous minerals in groundwater environments [15].
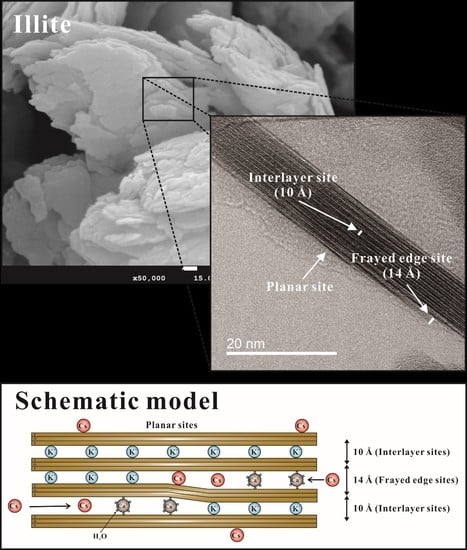
The illite has at least two types of sorption sites, such as frayed edge site (FES) and planar site (PS) for cesium uptake, and their combinations result in complex uptake mechanisms [8,13,16,17,18,19]. The uptake of cesium to the FES is believed to be a cation exchange process at the “wedge zone” in the interlayer space [20]. In contrast, PS uptake is characterized by an adsorption process through electrostatic attractions of positive cesium and negatively charged mineral surface [9]. A few studies have developed cesium uptake models for illite, including cation exchange, surface complexation, and molecular simulations [12,13,16,21,22,23,24], and detected individual sorption sites using X-ray adsorption fine structure spectroscopy and transmission electron microscopy for complex uptake mechanism determination [17,19,25,26].
The illite mineral was significant for cesium uptake due to the contribution of FES, especially at low dissolved concentration. However, the cesium uptake capabilities of illitic clays were diverse, and they might be associated with the illite crystallinity. Although the effects of crystallinity on cation fixation have been studied for various clay minerals with potassium, calcium, and ammonium [27,28], the relationship of illite crystallinity and cesium was rarely studied. Only a few studies observed less cesium uptake capabilities for high-crystalline illite termed “sericite” [29]. This study was conducted to determine the uptake capabilities of illitic clays for cesium and evaluate the relationship of crystallinity on the cesium uptake using statistical approaches. In addition, the illite crystallinity was applied as a relative indicator to predict the cesium uptake performance for the illitic clays.
2. Materials and Methods
2.1. Clay Materials
A total of 8 illitic clays (YC1 to YC8) were collected at the Yeongdong in Korea. The Yeongdong areas are well known as one of the largest illite deposits in the world [30]. The bedrock geology of Yeongdong comprises mica-rich schist, limestone, and granite gneiss. The illite ores were widely distributed in micaceous schist that was metamorphosed from volcaniclastic sediments [31]. The micaceous schist had been affected by the diagenesis with volcanism and/or their associated hydrothermal activities [32].
The other two clays of Montana illite (MI) and Chuzhou illite (CI) were utilized as reference materials to compare the cesium uptake and mineralogical characteristics with the Yeongdong samples. The MI and CI samples were purchased from “The Clay Minerals Society” (Virginia, USA, http://www.clays.org/) and “Bonding Chemical” (Texas, USA, https://www.bondingchemical.com/), respectively. The CI is a cosmetic-purified material and commercially labeled as “sericite”. Both MI and CI consist of high purity (>95%) illite contents [33,34]. All samples were pulverized with an alumina ball (Pulverisette2, FRITSCH, Idar-Oberstein, Germany) and sieved to particle size fractions of 45–53 μm, which are the main dimensions of commercial clay materials in Korea.
2.2. Material Characterization
X-ray diffraction (XRD) analysis was performed to determine the mineralogical properties using a multifunctional X-ray diffractometer (EMPYREAN, PANalytical, Malvern, UK) with CuKα (K-Alpha1 1.54060, K-Alpha2 1.54443) radiation at 40 kV and 25 mA. The radiation patterns were measured from 5° to 65° (2θ) with 0.013° (2θ) steps. The mineral components were determined by analyses of the peak positions and intensity in the patterns relative to the XRD database (HighScore Plus v.3.0c, PANalytical, Malvern, UK). The relative mineral contents in individual samples were semi-quantified through a modified external standard method [35].
Several artificial mineral mixtures of high-purity quartz, albite, and illite were analyzed to identify individual XRD peak position without any interferences between minerals. The CI was a good material for illite peak position due to the large intensity of peaks for XRD analyses. The peak positions were determined at 19.8°, 39.4°, and 22.0° for illite, quartz, and albite, respectively. The XRD analyses were repeated to confirm the measurement consistency. Averaged peak areas of each mineral were plotted with the mineral content to establish their relationship through linear regression. After the individual peak areas were analyzed for the YC samples, the developed empirical equation was utilized to determine the mineral contents of each YC. This approach assumed that all minerals in a sample were quantitatively identified, and total mineral contents were normalized to 100%.
The chemical compositions of clay materials (i.e., Si, Al, Ti, Fe, Mn, Mg, Ca, Na, K, and P) were determined by X-ray fluorescence (XRF) analysis (XRF-1800, SHIMADZU, Kyoto, Japan). The mineralogical morphologies were also observed by field emission scanning electron microscopy (FE-SEM: JEOL-7800F, Tokyo, Japan) after a platinum coating (20 mA, 250 s) to the samples. The accelerating voltage for the electron microbe was 15.0 kV under high vacuum pressure. In addition, the transmission electron microscopy (TEM: Libra 200 HT Mc Cs, Carl Zeiss, Oberkochen, Germany) energy-dispersive X-ray spectroscopy (EDS) was used to measure the basal spacing and chemical compositions for clay materials. The cation exchange capacity (CEC) was measured to estimate the cesium uptake capabilities of clays through the ammonium acetate method [36]. The concentrations of ammonium ion were analyzed using a protein/nitrogen automatic analyzer (Kjeltec auto 2400/8400 System, FOSS Tecator AB, Hoganas, Sweden). In addition, the specific surface area and pore structures of clay materials were observed by multipoint Brunauer–Emmett–Teller (BET) and Barrett–Joyner–Halenda (BJH) methods with the gas sorption analyzer (ASIQM0000-4, Quantachrome, Boynton Beach, FL, USA).
2.3. Cesium Uptake Experiments
Cesium uptake experiments were carried out in a 50 mL polypropylene conical tube to evaluate the cesium uptake properties of clay materials at ambient temperature (23 °C). Approximately 10–300 mg of clays was added with 20 mL of distilled water into the preweighed tubes. The solid and water ratio was determined through prescreening uptake experiments to minimize the experimental error.
The stock solution of 1 × 10⁶ μg L−1 was prepared by dissolving 1.68g of CsCl (ACS grade, Sigma-Aldrich) in 1 L distilled water (Direct-Q ICW-3000, Merck Millipore Corp., Burlington, MA, USA). The stable isotope (133Cs) was used as a surrogate for radiocesium (137Cs) based on the analogous physiochemical properties between stable and radiocesium [37]. The stock solution was diluted to make spiking solutions that are injected into the clay suspended batches to obtain five target initial concentrations (i.e., Ci ≈ 1 × 10, 1 × 10², 1 × 10³, 1 × 10⁴, and 1 × 10⁵ μg L−1). Solid-free batches were also prepared in parallel with individual batches to evaluate the total initial mass (M0 [μg]) and potential mass loss (X [μg]) of cesium during the uptake experiment. All uptake and control tubes were prepared in duplicates and placed in an orbital shaker (SK-600, Lab. Companion, Minneapolis, MN, USA) for continuous mixing at 130 rpm. The equilibrium cesium uptake experiments were performed for 24 h. After the uptake reaction, the aqueous phases were separated through centrifugation at 3500 rpm for 30 min. The inductively coupled plasma mass spectrometer (ICP-MS [X-series], Thermo Fisher, Waltham, MA, USA) was utilized to analyze the dissolved cesium concentration in the aqueous phase at equilibrium condition (Cw [μg L−1]). The final pH of aqueous phases was ~6 for all batches.
The uptake equilibrium concentration (qe [μg kg−1]) was computed by a mass balance approach following qe= (M0 − CwVw) − X/ms. The solid mass (ms [kg]) and solution volume (Vw [L]) were gravimetrically determined, and X was negligible. M0 was controlled below approximately <10% error relative to the theoretical initial masses. Uptake distribution coefficients (Kd [L kg−1]) were defined as the ratio of qe/Cw, and the Freundlich isotherm (qe = KfCwn, where Kf and n denote the Freundlich coefficient [(μg kg−1)/(L μg−1)n] and exponent, respectively) was applied for a statistical fitting. The uptake reaction rate was analyzed by the pseudo-second-order kinetic model (t/qt = 1/k2qe2 + t/qe, where k2 [kg mg h−1] indicates the rate constant, and qt [mg kg−1] is the uptake concentration of cesium at time t [h]) based on the kinetic experiment at low concentration, Ci = 1 × 10 μg L−1 [38]. The kinetic experiment was performed from 10 min to 30 days, and the model parameters were determined by the slope and the intercept of t/qt versus t plot.
2.4. Statistics
The statistical relationship between the cesium uptake and material properties (i.e., illite contents, crystallinity, CEC, and BET) was determined through the bivariate 2-tailed Spearman’s correlation coefficient (IBM-SPSS v23.0). A statistical significance was defined as p values ≤ 0.05. Spearman’s correlation is a rank-based test to evaluate the correlation between two independent variables. If the two independent variables Xi and Yi are entered to evaluate Spearman’s correlation, they are converted to nonparametric ranks xi and yi, respectively. Then, Spearman’s correlation (rs) is written following rs = 1 − (6∑[xi − yi]2/d[d2 − 1]) at specific sample size (d) [39]. Spearman’s coefficient is relatively insensitive to the outliers of the population and useful for even a small-sized population because Spearman’s correlation is a nonparametric technique. Therefore, this statistical approach has been widely used in sorption uptake studies [40,41].
3. Results and Discussion
3.1. Cesium Uptake Properties of Illitic Clays
3.1.1. Material Characterization
A total of 10 illitic clays (YC1 to YC8, CI, and MI) were characterized to determine BET, CEC, illite contents, and crystallinity that are potentially associated with cesium uptake reactions (Table 1a). The major minerals of YCs were illite, quartz, and albite (Figure 1a). The illite was a majorly constituent mineral for YCs, and the contents ranged from approximately 35 to 75%. In particular, the 10 Å XRD peaks (2θ ≈ 8.8°), which indicated the d-spacing of a basal plane for illite, exhibited diverse kurtoses, suggesting the various crystallinity of illite in the illitic clays (Figure 1b). The CI had the sharpest peak, while a more rounded peak was observed for the MI. The sharper peak indicates the greater crystallinity, regardless of the illite contents [42,43]. The SEM images also showed a rigid and sleek surface morphology for CI but a soft and rough surface for MI (Figure S1 in the Supplementary Materials).
The full width at half maximum (FWHM) of 10Å peak was utilized to parameterize the illite crystallinity (Table 1a). Although the FWHM could be affected by the sampling conditions, such as grain-size and/or particle orientation [44], the FWHM and illite crystallinity typically have an inverse relationship [45]. The FWHM values of MI and CI were 0.64 and 0.15, respectively, and most of the YC samples had a narrow range of FWHM ≈ 0.20 to 0.30 except YC1. These results suggest that CI is the highest crystalline illite, and MI is a much less crystalline illite than the other samples.
The FWHM was significantly correlated with the CEC through Spearman’s correlation, but not with the illite contents (Table 1b). Interestingly, the CI showed approximately four times lower CEC than the MI (Table 1a). Although CEC values of YCs were mostly located between CI and MI, the YC1 had greater values of CEC = 0.161 eq kg−1 than MI. However, after ethylene-glycol treatment, the XRD results indicated the presence of other expandable clay minerals in the YC1 (Figure S2). Considering that the CEC is typically an important factor for the uptake reactions of clays, the illite crystallinity seems to be an indicator of the uptake properties of illitic clays for cesium.
3.1.2. Cesium Uptake Isotherms
The cesium uptake behavior of MI and CI that contain low and high crystalline illites, respectively, was compared. The uptake reactions of both clays rapidly reached apparent equilibrium within 24 h (Figure S3). However, the k2 values of the pseudo-second-order kinetic model indicated an order of magnitude faster reaction rate for CI (k2 = 0.034) at a low aqueous concentration relative to MI (k2 = 0.003).
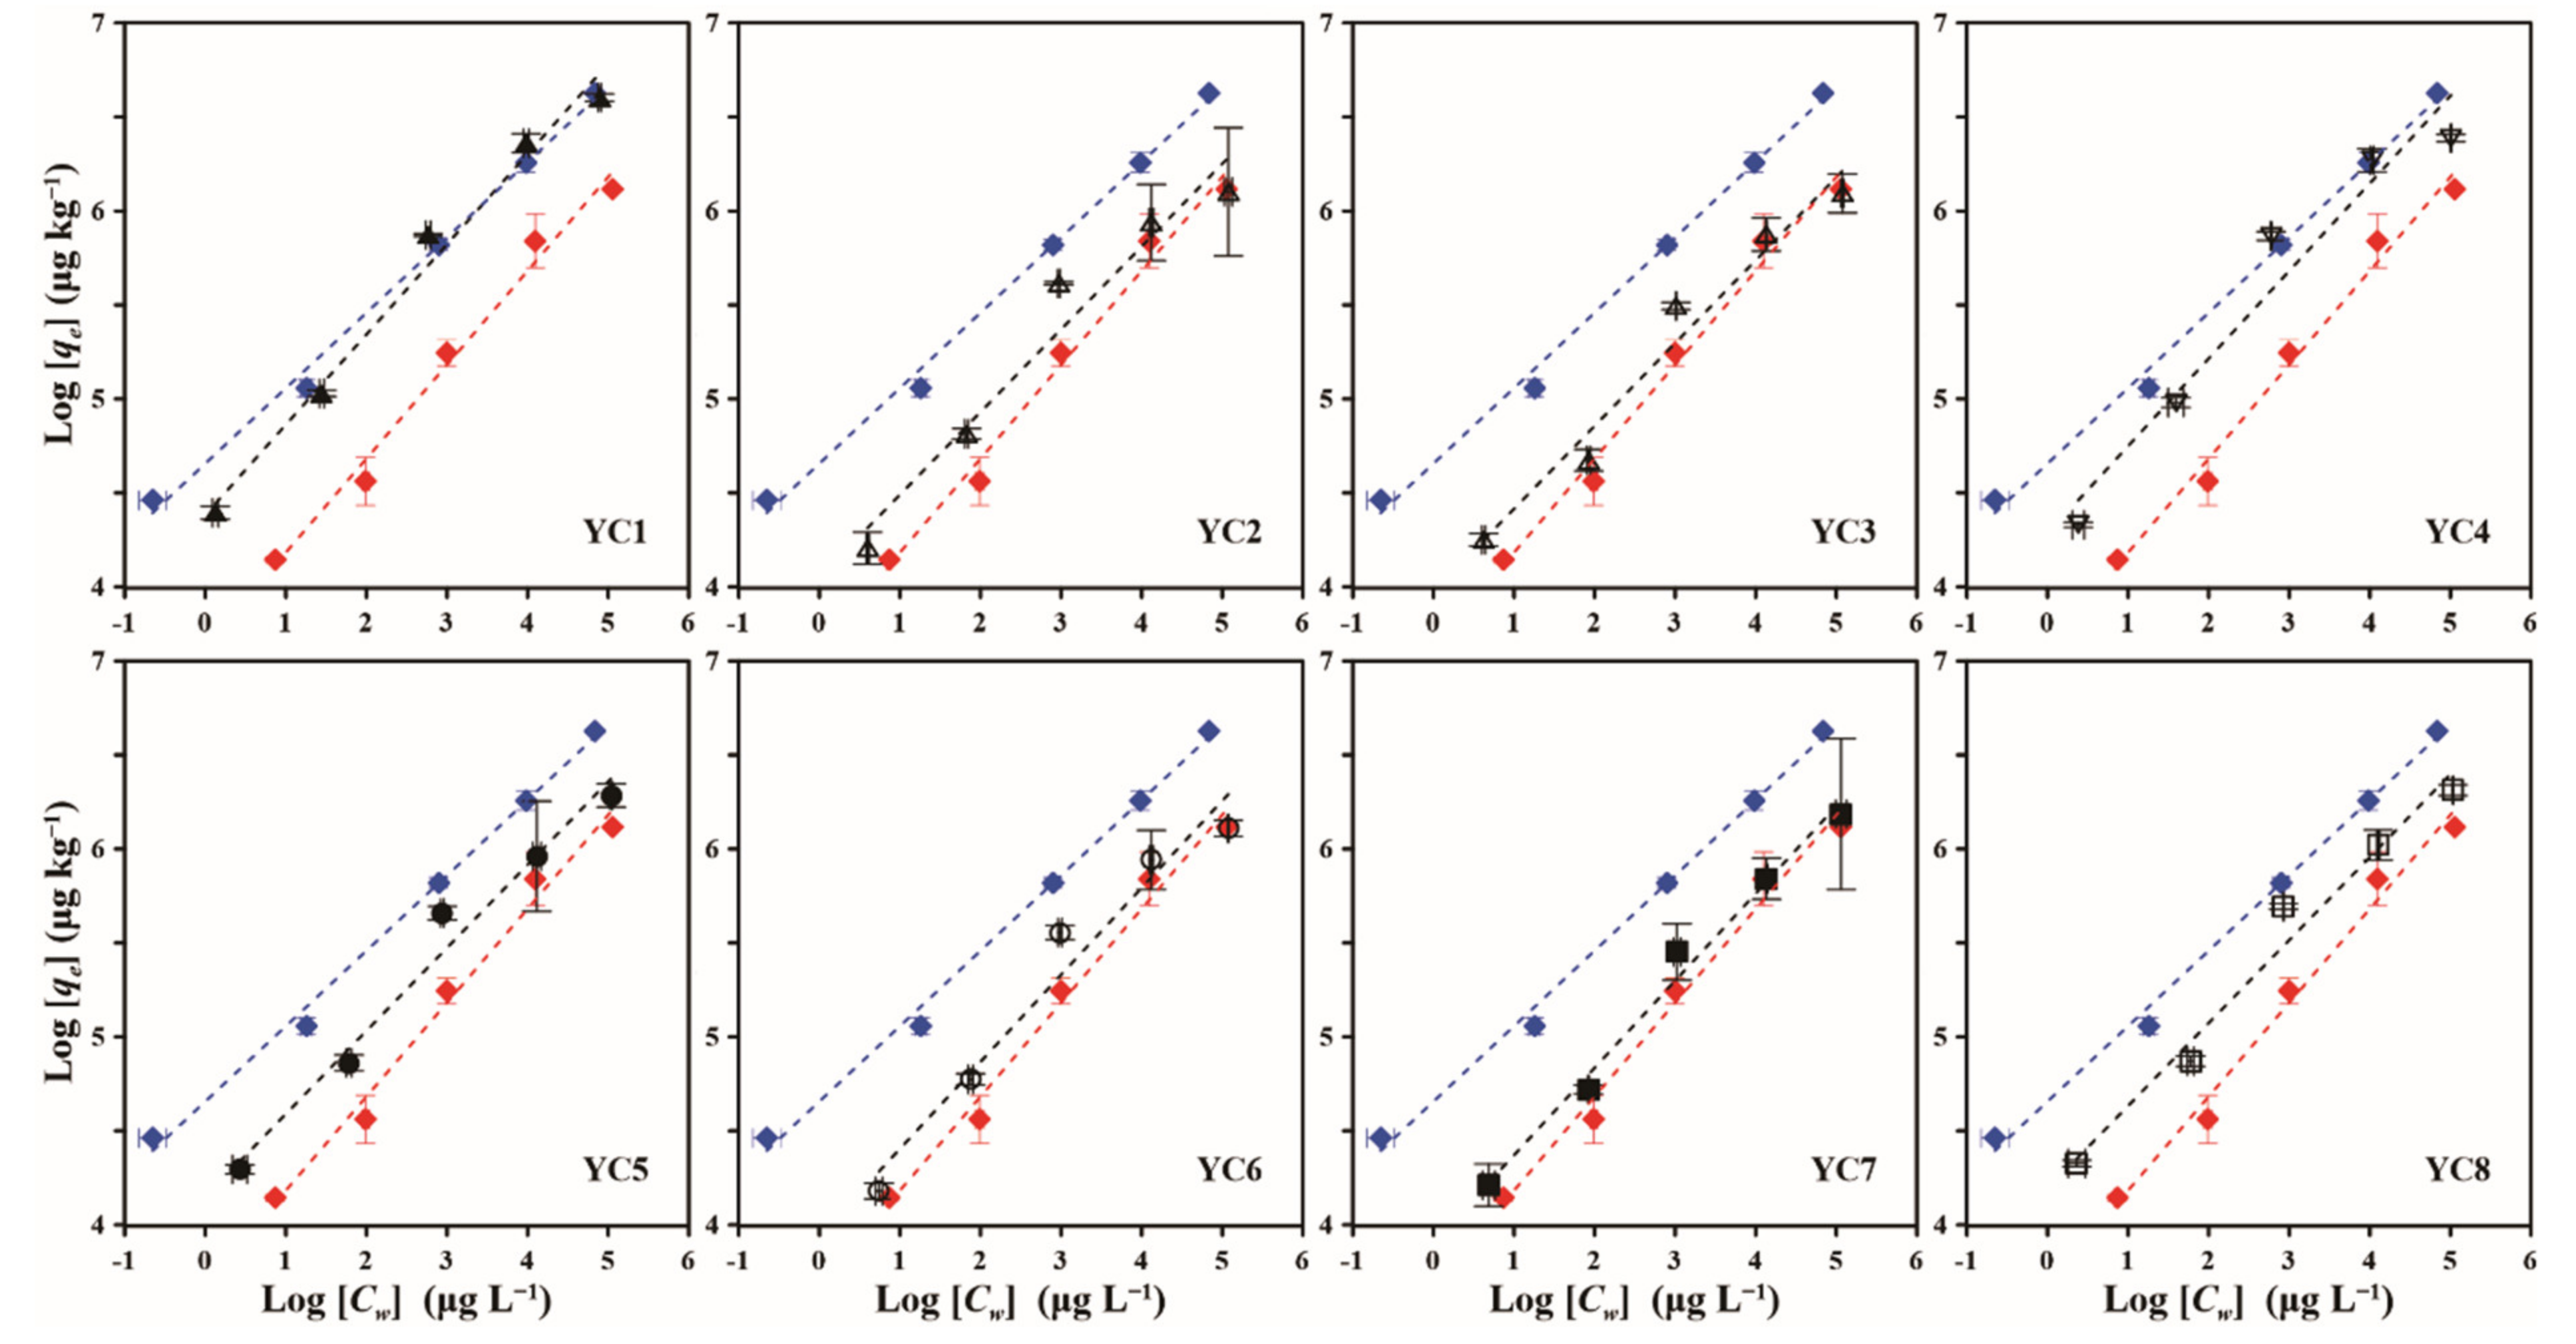
The cesium uptake isotherms of illitic clays were illustrated in the logarithm of qe and Cw (log [qe] vs. log [Cw]), and the Freundlich model was utilized to characterize the uptake properties (Figure 2). All uptake isotherms were statistically fitted well with the Freundlich model (i.e., r2 > 0.946) (Table 2). The highest cesium uptake was observed for MI, but the lowest uptake capabilities for CI over the whole experimental range of dissolved concentrations, Cw ≈ 1 × 10 to 1 × 10⁵ μg L−1. The uptake affinities of YCs were placed between MI and CI, showing the distribution of Kf values from 8 × 10³ to 2.4 × 10⁴ [(μg kg−1)/(L μg−1)n]. Even though YC1 exhibited the greatest cesium uptake capability among the YCs, it is likely to be affected by expandable clay components.
The uptake behaviors of clay samples were nonlinear with the n values in the range of 0.401 to 0.500, indicating that the uptake efficiency increased with decreased dissolved cesium concentrations. The nonlinear Freundlich isotherms implied that the cesium uptake occurs on the multisites, such as the FES and PS, with different sorption mechanisms depending on the cesium concentration conditions [12,13].
3.1.3. Uptake Mechanisms and Frayed Edge Sites
The FES shows much stronger uptake affinities for cesium ions through a relatively slow ion-exchange mechanism compared to the PS representing the adsorption mechanism [12]. Thus, the FES predominantly controls the cesium uptake reactions under low cesium density surroundings, even though FES typically has small amounts for total CEC of illite mineral [16,20,46]. However, the increase in the cesium concentration hinders the uptake of FES due to their limited numbers and distribution, and the PS plays a more important role at high concentrations [9]. The slower, greater, and more nonlinear cesium uptake behavior of MI at low dissolved concentrations, therefore, should reflect the ion exchange mechanism into the FES.
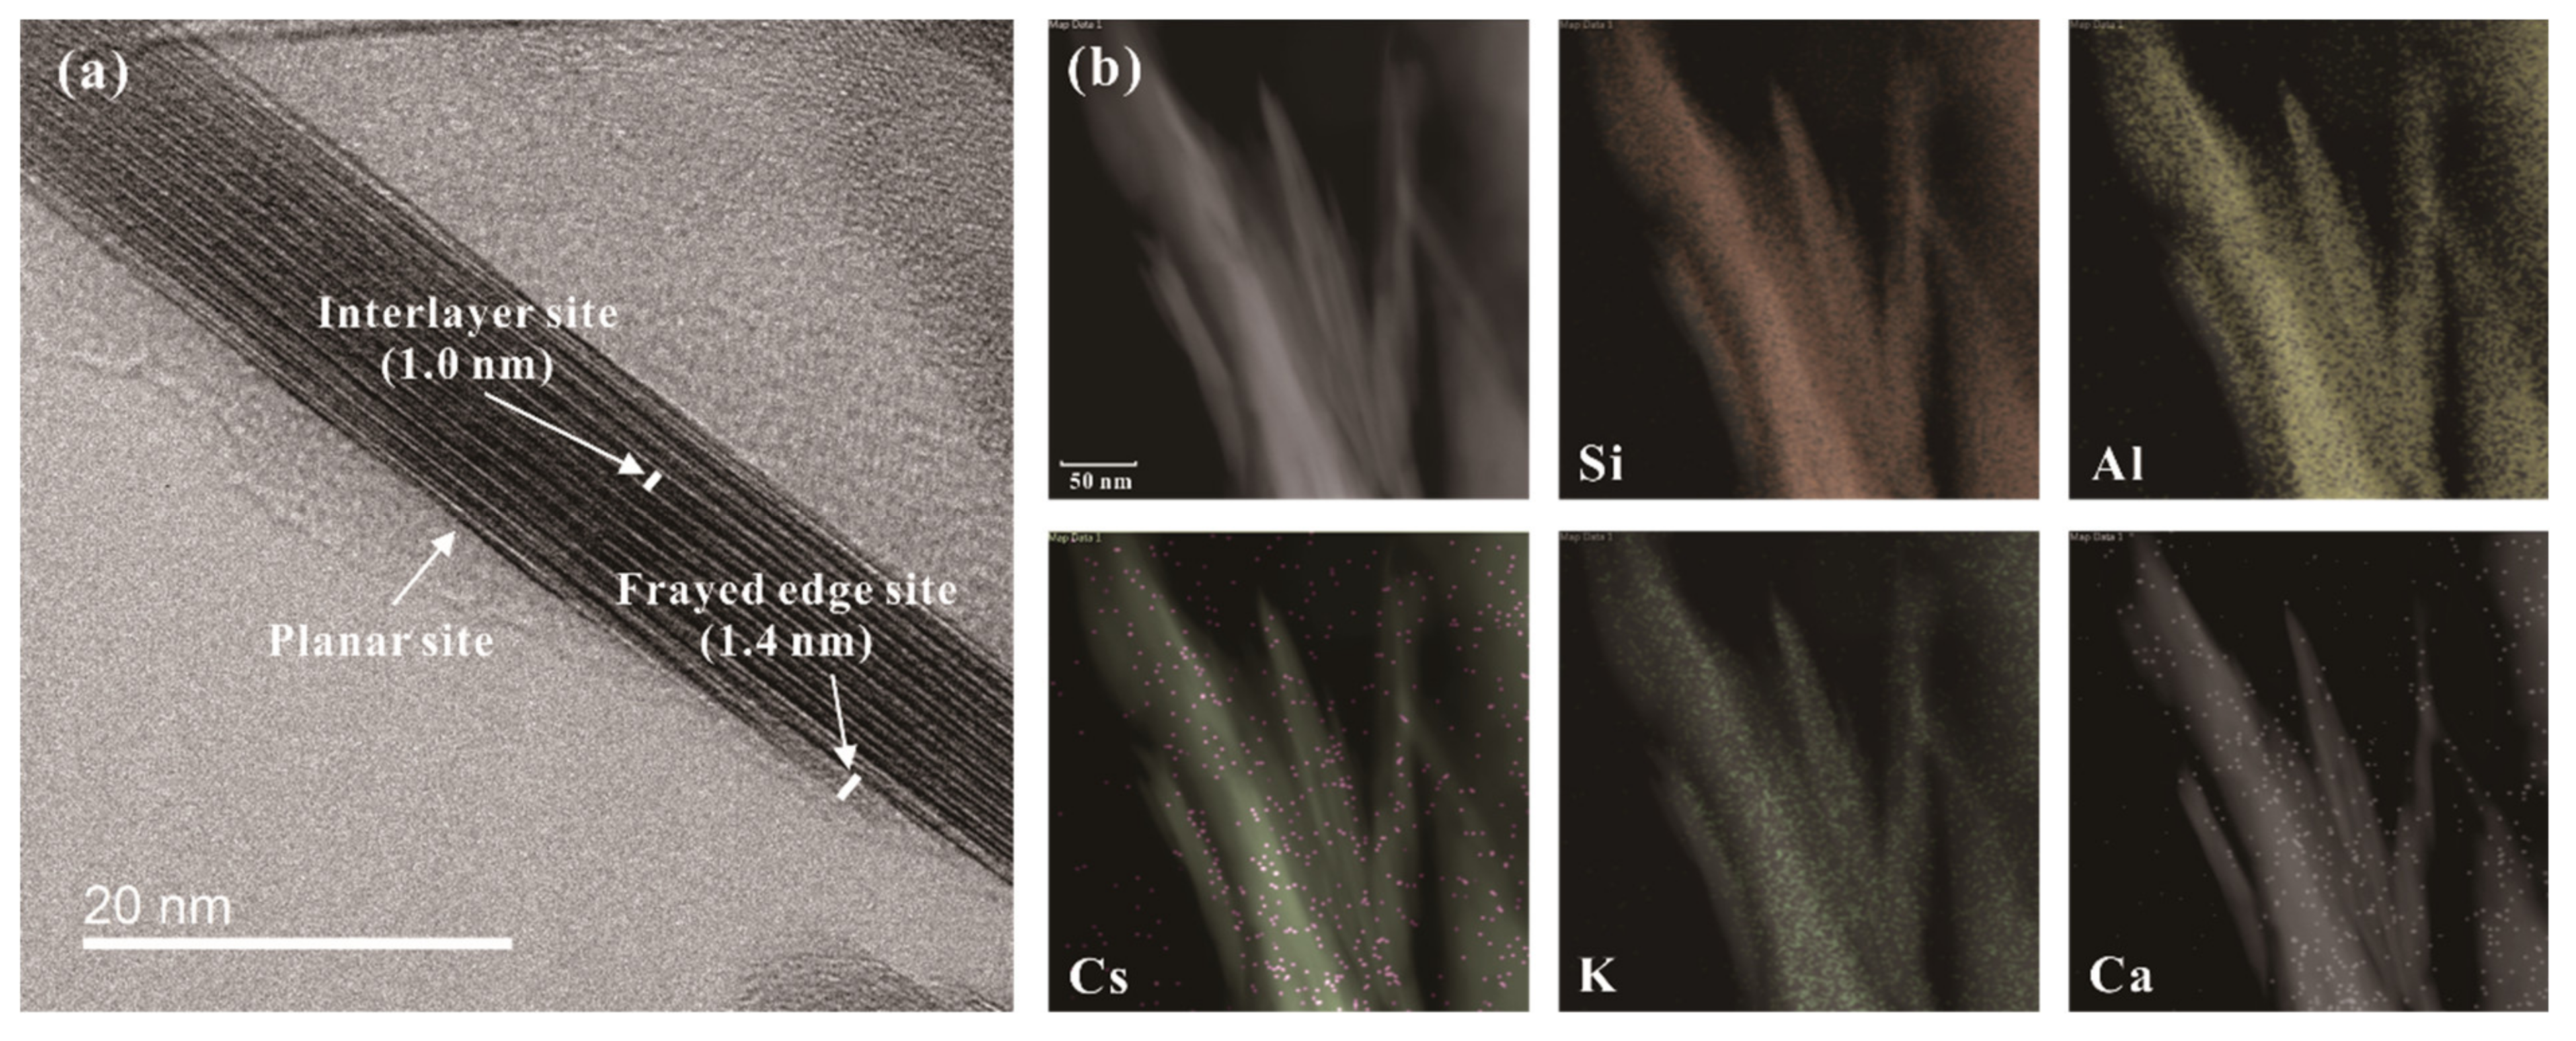
Assuming that the MI and CI represent low and high crystalline illites, respectively, the FES seem to be related to the illite crystallinity. The lower crystallinity facilitates the formation of FES in the illite, because FES is mainly formed by expanding a basal plane at the weathering edge site [19,47,48]. The production of FES could be associated with the weathering processes of illite through the exchange of interlayer K to Ca [20,49,50]. The hydrated Ca retains in the water phase of the interlayer due to the strong, hydrated energy of Ca, and it causes the expansion of basal spacing from 1.0 to 1.4 nm [19,49]. Figure 3a exhibits the TEM images of the illite mineral in the MI before cesium uptake experiments. The basal spacing of MI was constantly 1.0 nm in the layered structure, while it was expanded to 1.4 nm near the edge in the FES-like structure. After uptake experiments, the concentrated cesium elements were observed at the edge site of illite through the TEM-EDS analysis, and their distribution was quite analogous with Ca (Figure 3b). The XRF results of illitic clays also showed approximately 10 times higher Ca contents for MI than CI (Table S1), which suggested more FES distribution in the MI.
3.2. Correlation between Cesium Uptake and Crystallinity
3.2.1. Spearman’s Correlation Coefficients
Spearman’s coefficients were computed to determine the relationship of clay properties and Kd at various dissolved concentrations (Table 3). The cesium uptake was remarkably correlated with the FWHM and CEC, but not with illite contents and BET. In particular, the CEC exhibited excellent correlation coefficients over all experimental concentrations. This suggests that the dominant mechanism of cesium uptake by the illitic clay is the ion exchange processes [16,23].
Although the FWHM showed a strong correlation in the low–moderately high concentrations (i.e., Cw < 1 × 10⁴ μg L−1), it was not correlated with the cesium uptake at high concentration, Cw ~ 1 × 10⁵ μg L−1. In contrast, a significant correlation of BET and Kd was found at the high concentration only. These results imply that the BET becomes a more important uptake property with the increase in cesium concentration because the adsorption onto PS begins to contribute predominantly to the cesium uptake processes. Additionally, the significant relationship between the FWHM and CEC suggests that the FWHM is a potentially useful indicator to estimate the cesium uptake capabilities for the illitic clays.
3.2.2. Illite Classification by Crystallinity
Interestingly, the cesium uptake was not correlated with the illite contents (Table 3), even though the Kd values of illite for cesium are at least 200 and 20 times greater than those of quartz and albite, respectively, at low concentrations [8]. We presumed that illite crystallinity was associated with these results because the low crystalline illite of MI exhibited the greatest uptake capability for cesium. Therefore, the illite is classified as low (LCI) and high crystalline illite (HCI) components using FWHM to evaluate the relationship between individual illite components and cesium uptake capabilities.
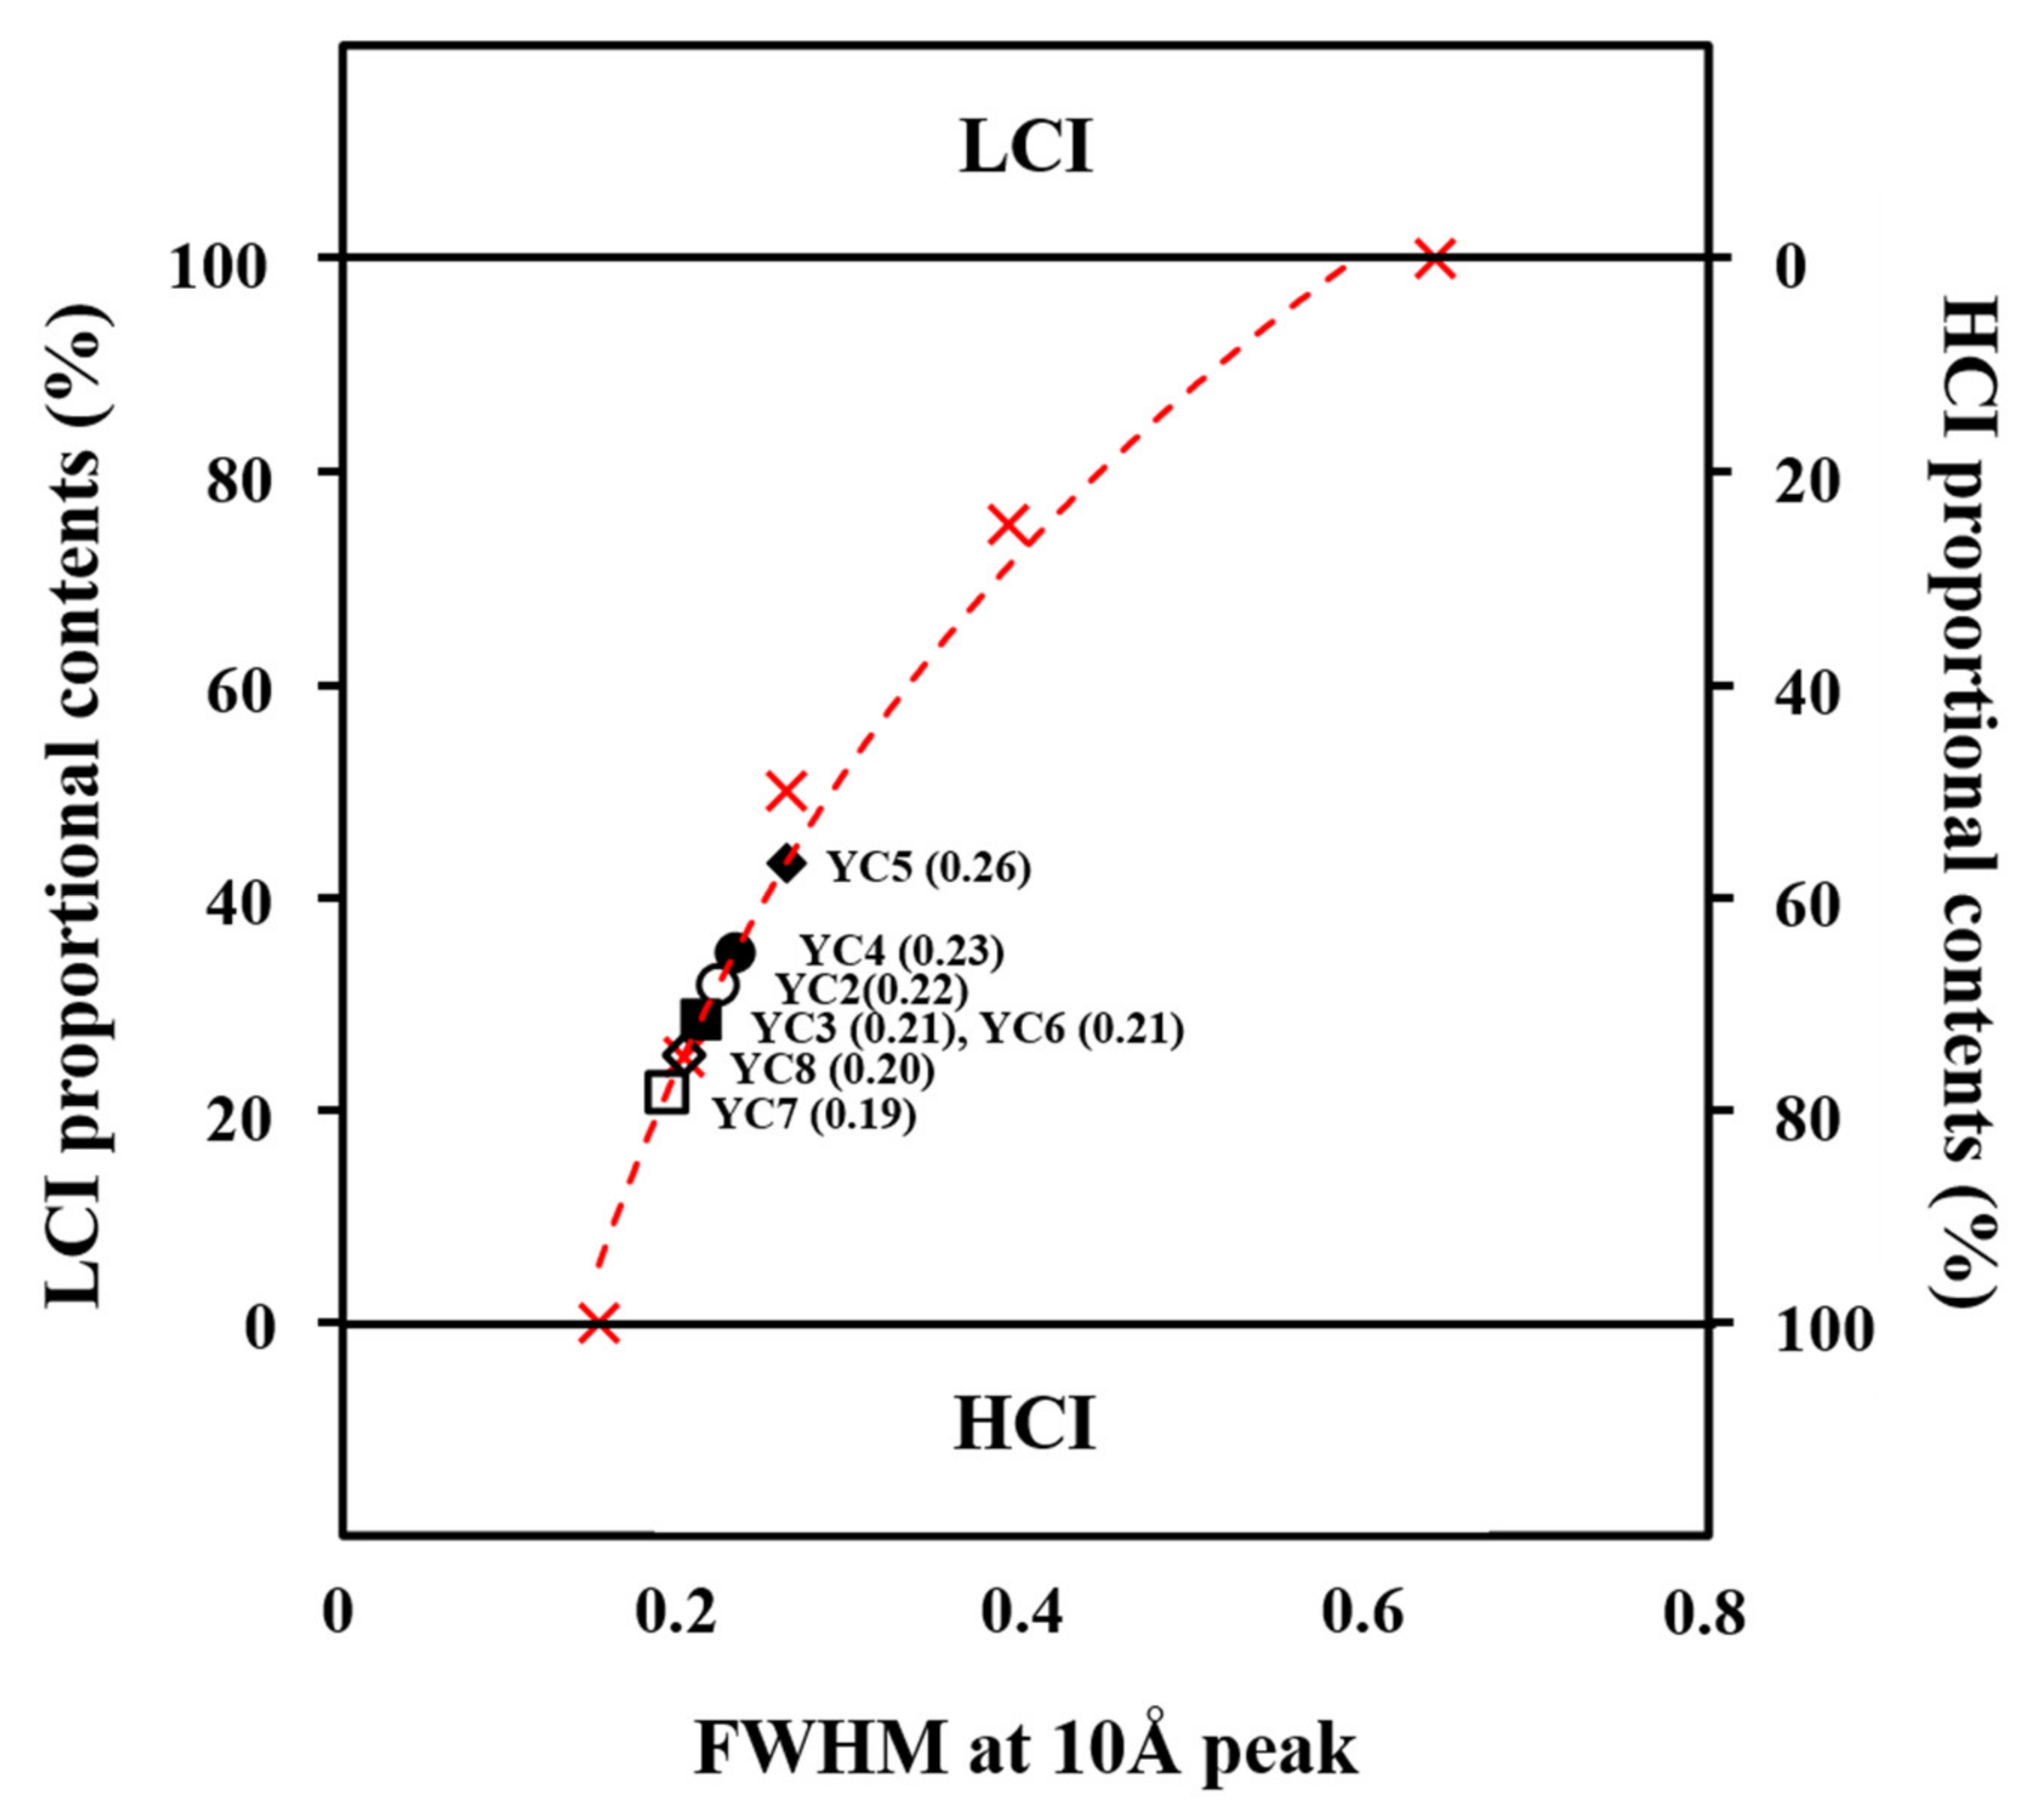
The FWHM was used as a relative indicator to quantify the contents of LCI and HCI in the YCs [43]. Firstly, the MI and CI were blended with various mixing ratios from 0 to 100 wt% to simulate the YCs as mixture clays of LCI and HCI. The MI and CI are regarded as end members representing the LCI and HCI, respectively, in this study. Second, the nonlinear relationship of FWHM and the illite content of the blended materials were developed, and it was utilized to estimate the percentile ratio of LCI and HCI components in the YC samples (Figure 4). Finally, the LCI and HCI components of individual samples were quantified by multiplying each percentile ratio and illite content (Table 1). The YC1 was excluded for this analysis due to the existence of other expandable clay minerals.
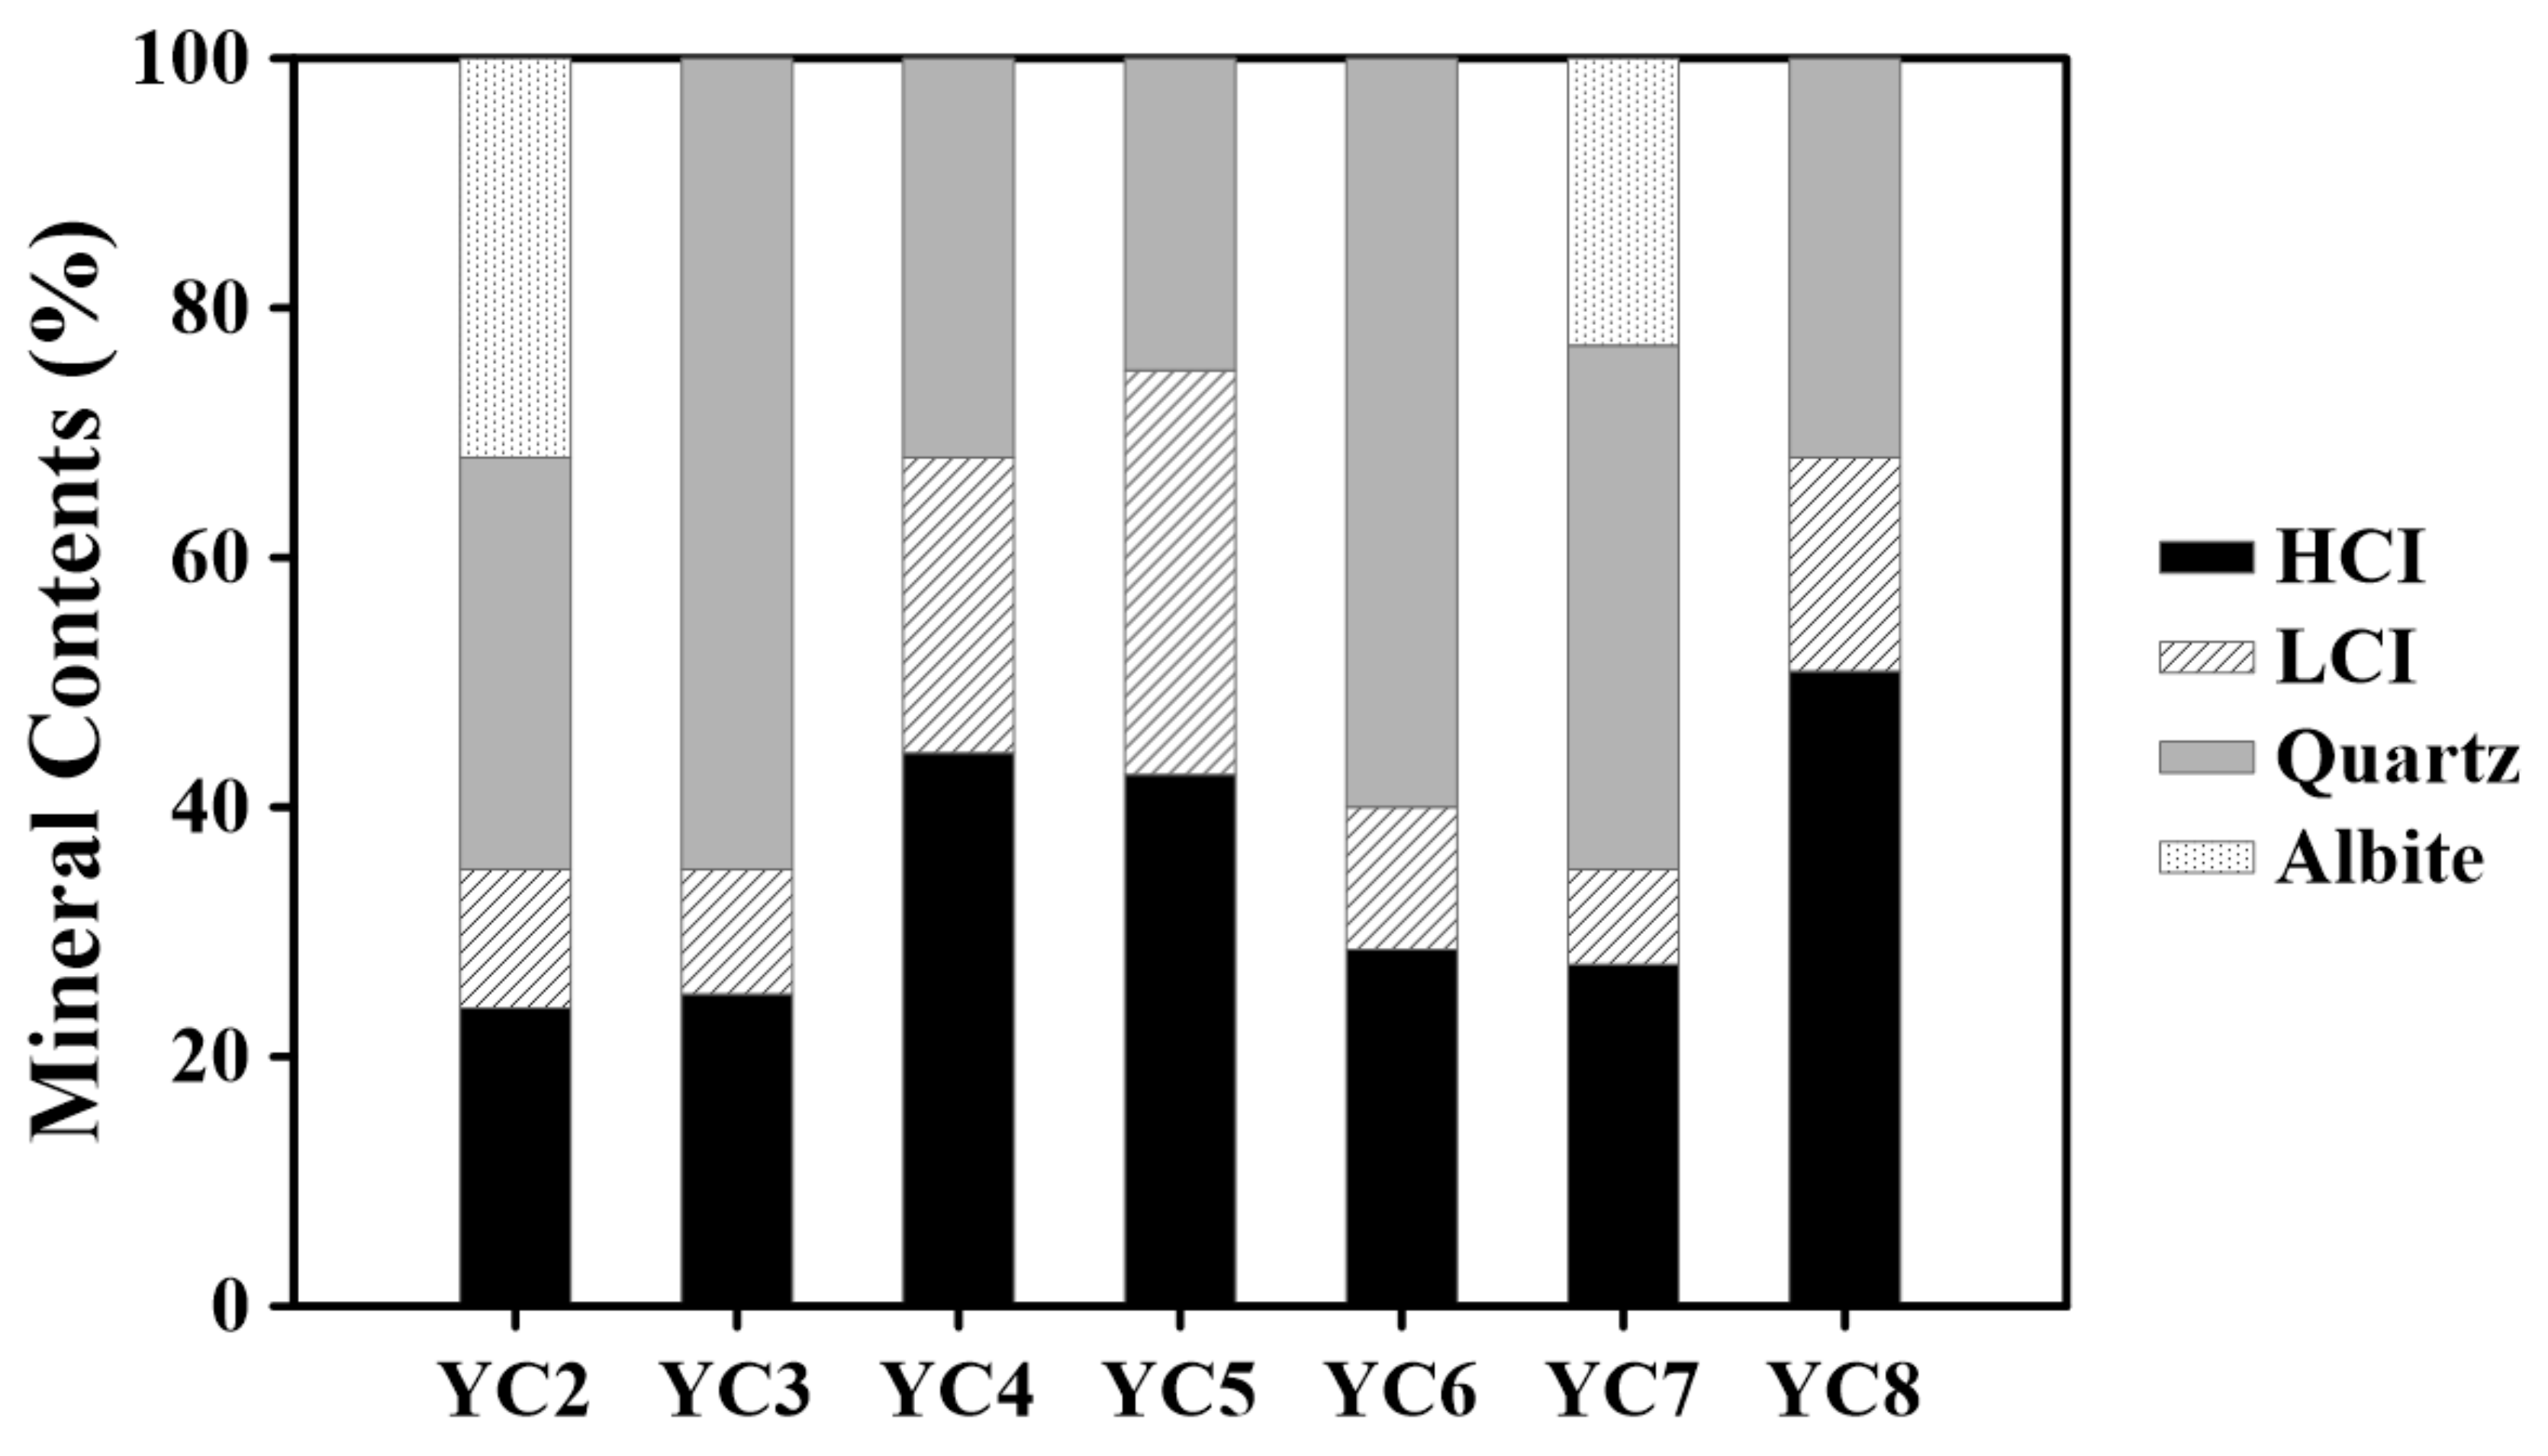
After the illite minerals were separately treated as the LCI and HCI, the estimated illite contents indicated that the HCI was a more dominant component than LCI in the YC materials. The LCI and HCI contents were approximately 10–30% and 25–50%, respectively (Figure 5). In particular, the YC2, YC3, YC6, and YC7 showed only ~10% of LCI contents. Note that they also had relatively lower cesium uptake affinities of Kf = 8 × 10³ to 1.1 × 10⁴ [(μg kg−1)/(μg L−1)n] compared to other samples (Table 2). The correlation result supports the significant effects of the LCI component on the cesium uptake capabilities for the YCs (Table 4). The strong statistical relationship between the CEC and LCI contents indicated the predominant contribution of LCI to overall cesium uptake through cation exchange processes. In contrast, the HCI was not correlated with the Kd values, even though it is one of the illite components in the YCs.
4. Conclusions
Determination of the geochemical properties of clay materials is important for environmental geochemists to understand the migration of radionuclides in groundwater environments. The illitic clays are strongly involved in the retention and retardation processes of radiocesium, because they have selective cesium uptake capabilities (e.g., FES).
This study exhibited that the cesium uptake was significantly correlated with the illite crystallinity and CEC. In particular, the uptake capabilities of low crystalline illite were up to 15 times greater than the high crystalline illite, and their differentials were intensified at relatively low dissolved concentrations. These results suggested that the predominant uptake mechanism of illite and cesium was an ion-exchange process at the FES, related to the crystallinity degree. Therefore, the illite crystallinity can be applied as a relative indicator to predict the cesium uptake performance of illitic clay materials without comparatively long, time-consuming chemical uptake experiments.
Supplementary Materials
The following are available online at https://www.mdpi.com/2073-4441/13/4/409/s1, Figure S1: SEM images of MI, CI and YC1–8 with 10,000 times magnification. Figure S2: X-ray diffraction patterns of YC1 (a) before and (b) after ethylene glycol treatment. Black solid arrow shows that I/S peak migrated to low theta position due to expanding interlayer by ethylene glycol treatment. (I: illite, I/S: illite-smectite, Q: quartz, A: albite). Figure S3: Cesium uptake kinetics of MI and CI at Ci = 1 × 10 μg L−1, and pseudo-second-order (PSO) kinetic curve. Table S1: Results of XRF analysis for clay samples. Table S2. Distribution coefficients (Kd, L kg−1) of samples at various Cw, respectively. Table S3: The mineral contents after quantification of HCI and LCI for YC2–YC8.
Author Contributions
Conceptualization, J.H. and S.C.; methodology, J.H., W.S. and C.-M.C.; writing—original draft preparation, J.H.; writing—review and editing, W.S.H. and S.C.; supervision, S.C.; project administration, S.C.; funding acquisition, S.C. All authors have read and agreed to the published version of the manuscript.
Funding
We gratefully acknowledge that this study was supported by the R&D Convergence Program of the National Research Council of Science & Technology in Korea (CAP-15-07-KICT) and the National Research Foundation (NRF-2019R1A2C1004891). S.C. and W.S. were supported by the Operation of Research Center for Geochronology and Isotope Analysis in the Korea Basic Science Institute (C030120).
Institutional Review Board Statement
Not applicable.
Informed Consent Statement
Not applicable.
Data Availability Statement
Data is contained within the article or Supplementary Materials.
Acknowledgments
Authors appreciate valuable comments from anonymous reviewers.
Conflicts of Interest
The authors declare no conflict of interest.
References
- Kitajima, A.; Ogawa, H.; Kobayashi, T.; Kawasaki, T.; Kawatsu, Y.; Kawamoto, T.; Tanaka, H. Monitoring low-radioactivity caesium in Fukushima waters. Environ. Sci. Process. Impacts 2014, 16, 28–32. [Google Scholar] [CrossRef] [PubMed]
- Steinhauser, G.; Brandl, A.; Johnson, T.E. Comparison of the Chernobyl and Fukushima nuclear accidents: A review of the environmental impacts. Sci. Total. Environ. 2014, 470, 800–817. [Google Scholar] [CrossRef] [PubMed]
- Iwagami, S.; Tsujimura, M.; Onda, Y.; Nishino, M.; Konuma, R.; Abe, Y.; Hada, M.; Pun, I.; Sakaguchi, A.; Kondo, H.; et al. Temporal changes in dissolved 137Cs concentrations in groundwater and stream water in Fukushima after the Fukushima Dai-ichi Nuclear Power Plant accident. J. Environ. Radioact. 2017, 166, 458–465. [Google Scholar] [CrossRef] [PubMed]
- Sanial, V.; Buesseler, K.O.; Charette, M.A.; Nagao, S. Unexpected source of Fukushima-derived radiocesium to the coastal ocean of Japan. Proc. Natl. Acad. Sci. USA 2017, 114, 11092–11096. [Google Scholar] [CrossRef] [Green Version]
- Ding, D.; Zhang, Z.; Lei, Z.; Yang, Y.; Cai, T. Remediation of radiocesium-contaminated liquid waste, soil, and ash: A mini review since the Fukushima Daiichi Nuclear Power Plant accident. Environ. Sci. Pollut. Res. 2016, 23, 2249–2263. [Google Scholar] [CrossRef]
- Qian, J.; Zhou, L.; Yang, X.; Hua, D.; Wu, N. Prussian blue analogue functionalized magnetic microgels with ionized chi-tosan for the cleaning of cesium-contaminated clay. J. Hazard. Mater. 2020, 386, 121965. [Google Scholar] [CrossRef]
- Wang, T.-H.; Li, M.-H.; Yeh, W.-C.; Wei, Y.-Y.; Teng, S.-P. Removal of cesium ions from aqueous solution by adsorption onto local Taiwan laterite. J. Hazard. Mater. 2008, 160, 638–642. [Google Scholar] [CrossRef]
- Cornell, R.M. Adsorption of cesium on minerals: A review. J. Radioanal. Nucl. Chem. 1993, 171, 483–500. [Google Scholar] [CrossRef]
- Fan, Q.; Tanaka, M.; Tanaka, K.; Sakaguchi, A.; Takahashi, Y. An EXAFS study on the effects of natural organic matter and the expandability of clay minerals on cesium adsorption and mobility. Geochim. Cosmochim. Acta 2014, 135, 49–65. [Google Scholar] [CrossRef]
- Mukai, H.; Hirose, A.; Motai, S.; Kikuchi, R.; Tanoi, K.; Nakanishi, T.M.; Yaita, T.; Kogure, T. Cesium adsorption/desorption behavior of clay minerals considering actual contamination conditions in Fukushima. Sci. Rep. 2016, 6, 21543. [Google Scholar] [CrossRef] [Green Version]
- Mukai, H.; Motai, S.; Yaita, T.; Kogure, T. Identification of the actual cesium-adsorbing materials in the contaminated Fukushima soil. Appl. Clay Sci. 2016, 121, 188–193. [Google Scholar] [CrossRef]
- Poinssot, C.; Baeyens, B.; Bradbury, M.H. Experimental and modelling studies of caesium sorption on illite. Geochim. Cosmochim. Acta 1999, 63, 3217–3227. [Google Scholar] [CrossRef]
- Bradbury, M.H.; Baeyens, B. A generalised sorption model for the concentration dependent uptake of caesium by argilla-ceous rocks. J. Contam. Hydrol. 2000, 42, 141–163. [Google Scholar] [CrossRef]
- Rajec, P.; Šucha, V.; Eberl, D.D.; Środoń, J.; Elsass, F. Effect of illite particle shape on cesium sorption. Clays Clay Miner. 1999, 47, 755–760. [Google Scholar] [CrossRef]
- Ito, A.; Wagai, R. Global distribution of clay-size minerals on land surface for biogeochemical and climatological studies. Sci. Data 2017, 4, 170103. [Google Scholar] [CrossRef] [PubMed]
- Benedicto, A.; Missana, T.; Fernández, A.M. Interlayer Collapse Affects on Cesium Adsorption Onto Illite. Environ. Sci. Technol. 2014, 48, 4909–4915. [Google Scholar] [CrossRef] [PubMed]
- Bostick, B.C.; Vairavamurthy, M.A.; Karthikeyan, K.; Chorover, J. Cesium adsorption on clay minerals: An EXAFS spec-troscopic investigation. Environ. Sci. Technol. 2002, 36, 2670–2676. [Google Scholar] [CrossRef]
- Brouwer, E.; Baeyens, B.; Maes, A.; Cremers, A. Cesium and Rubidium Ion Equilibria in Illite Clay. J. Phys. Chem. 1983, 87, 1213–1219. [Google Scholar] [CrossRef]
- Fuller, A.J.; Shaw, S.; Ward, M.B.; Haigh, S.J.; Mosselmans, J.F.W.; Peacock, C.L.; Stackhouse, S.; Dent, A.J.; Trivedi, D.; Burke, I.T. Caesium incorporation and retention in illite interlayers. Appl. Clay Sci. 2015, 108, 128–134. [Google Scholar] [CrossRef]
- Fuller, A.J.; Shaw, S.; Peacock, C.L.; Trivedi, D.; Small, J.S.; Abrahamsen, L.G.; Burke, I.T. Ionic strength and pH dependent multi-site sorption of Cs onto a micaceous aquifer sediment. Appl. Geochem. 2014, 40, 32–42. [Google Scholar] [CrossRef]
- Cherif, M.A.; Martin-Garin, A.; Gérard, F.; Bildstein, O. A robust and parsimonious model for caesium sorption on clay minerals and natural clay materials. Appl. Geochem. 2017, 87, 22–37. [Google Scholar] [CrossRef] [Green Version]
- Lammers, L.N.; Bourg, I.C.; Okumura, M.; Kolluri, K.; Sposito, G.; Machida, M. Molecular dynamics simulations of cesium adsorption on illite nanoparticles. J. Colloid Interface Sci. 2017, 490, 608–620. [Google Scholar] [CrossRef] [Green Version]
- Missana, T.; García-Gutiérrez, M.; Benedicto, A.; Ayora, C.; De-Pourcq, K. Modelling of Cs sorption in natural mixed-clays and the effects of ion competition. Appl. Geochem. 2014, 49, 95–102. [Google Scholar] [CrossRef]
- Kerisit, S.; Okumura, M.; Rosso, K.M.; Machida, M. Molecular Simulation of Cesium Adsorption at the Basal Surface of Phyllosilicate Minerals. Clays Clay Miner. 2016, 64, 389–400. [Google Scholar] [CrossRef]
- Lee, J.; Park, S.-M.; Jeon, E.-K.; Baek, K. Selective and irreversible adsorption mechanism of cesium on illite. Appl. Geochem. 2017, 85, 188–193. [Google Scholar] [CrossRef]
- Bots, P.; Renshaw, J.C.; Payne, T.; Comarmond, M.J.; Schellenger, A.E.P.; Pedrotti, M.; Calì, E.; Lunn, R.J. Geochemical evidence for the application of nanoparticulate colloidal silica gel for in situ containment of legacy nuclear wastes. Environ. Sci. Nano 2020, 7, 1481–1495. [Google Scholar] [CrossRef]
- Rubio, B.; Gil-Sotres, F. Potassium fixation in suspensions of soils of Galicia (N.W. Spain). Commun. Soil Sci. Plant. Anal. 1995, 26, 577–591. [Google Scholar] [CrossRef]
- Sawhney, B.L. Selective Sorption and Fixation of Cations by Clay Minerals: A Review. Clays Clay Miner. 1972, 20, 93–100. [Google Scholar] [CrossRef]
- Ohnuki, T.; Kozai, N. Adsorption behavior of radioactive cesium by non-mica minerals. J. Nucl. Sci. Technol. 2013, 50, 369–375. [Google Scholar] [CrossRef] [Green Version]
- Cho, H.G.; Park, O.H.; Moon, D.H.; Do, J.Y.; Kim, S.O. Phosphate Adsorption of Youngdong Illite, Korea. J. Miner. Soc. Korea 2007, 20, 327–337. [Google Scholar]
- Koh, S.-M. Geological formation environment and mineralization age of the Daehyun sericite deposits in Bonghwa-gun, Gyeongsangbuk-do: Introduction of the new type in South Korea. J. Geol. Soc. Korea 2008, 44, 365–386. [Google Scholar]
- Choi, T.; Lee, Y.I. Thermal histories of the Cretaceous Pungam and Yeongdong basins, Korea based on apatite and zircon fission track analysis. Geosci. J. 2006, 10, 263–273. [Google Scholar] [CrossRef]
- Salisbury, J.W.; Walter, L.S.; Vergo, N. Mid-Infrared (2.1-25 um) Spectra of Minerals; 2331-1258; US Geological Survey: Reston, VA, USA, 1987; p. 184. [Google Scholar]
- Zhang, M.; Jiang, W.H. Experimental Research on Ore Dressing of Sericite in Chuzhou, Anhui Province. Conserv. Util. Miner. Resour. 2002, 3. [Google Scholar]
- Ouhadi, V.; Yong, R. Impact of clay microstructure and mass absorption coefficient on the quantitative mineral identifi-cation by XRD analysis. Appl. Clay Sci. 2003, 23, 141–148. [Google Scholar] [CrossRef]
- Sparks, D.L.; Page, A.L.; Helmke, P.A.; Loeppert, R.H.; Soltanpour, P.N.; Tabatabai, M.A.; Johnston, C.T.; Sumner, M.E. Methods of Soil Analysis: Part 3 Chemical Methods, 5.3; Series No. 5; Soil Science Society of America: Madison, WI, USA, 1996. [Google Scholar]
- Tiwari, D.; Lalhmunsiama; Choi, S.; Lee, S. Activated Sericite: An Efficient and Effective Natural Clay Material for Attenuation of Cesium from Aquatic Environment. Pedosphere 2014, 24, 731–742. [Google Scholar] [CrossRef]
- Lee, K.-Y.; Park, M.; Kim, J.; Oh, M.; Lee, E.-H.; Kim, K.-W.; Chung, D.-Y.; Moon, J.-K. Equilibrium, kinetic and thermo-dynamic study of cesium adsorption onto nanocrystalline mordenite from high-salt solution. Chemosphere 2016, 150, 765–771. [Google Scholar] [CrossRef] [PubMed]
- Lin, J.; Cai, G.; Liu, S.; Puppala, A.J.; Zou, H. Correlations Between Electrical Resistivity and Geotechnical Parameters for Jiangsu Marine Clay Using Spearman’s Coefficient Test. Int. J. Civ. Eng. 2016, 15, 419–429. [Google Scholar] [CrossRef]
- Ishikawa, N.; Uchida, S.; Tagami, K. Effects of Clay Minerals on Radiocesium Sorption Behavior onto Paddy Field Soils. Radioisotopes 2007, 56, 519–528. [Google Scholar] [CrossRef] [Green Version]
- Yasuda, H.; Uchida, S.; Muramatsu, Y.; Yoshida, S. Sorption of manganese, cobalt, zinc, strontium, and cesium onto ag-ricultural soils: Statistical analysis on effects of soil properties. Water Air Soil Pollut. 1995, 83, 85–96. [Google Scholar] [CrossRef]
- Fukuchi, R.; Fujimoto, K.; Kameda, J.; Hamahashi, M.; Yamaguchi, A.; Kimura, G.; Hamada, Y.; Hashimoto, Y.; Kitamura, Y.; Saito, S. Changes in illite crystallinity within an ancient tectonic boundary thrust caused by thermal, mechanical, and hydrothermal effects: An example from the Nobeoka Thrust, southwest Japan. Earth Planets Space 2014, 66, 116. [Google Scholar] [CrossRef] [Green Version]
- Harraden, C.L.; McNulty, B.A.; Gregory, M.J.; Lang, J.R. Shortwave Infrared Spectral Analysis of Hydrothermal Alteration Associated with the Pebble Porphyry Copper-Gold-Molybdenum Deposit, Iliamna, Alaska. Econ. Geol. 2013, 108, 483–494. [Google Scholar] [CrossRef]
- Krumm, S.; Buggisch, W. Sample preparation effects on illite crystallinity measurement: Grain-size gradation and particle orientation. J. Metamorph. Geol. 1991, 9, 671–677. [Google Scholar] [CrossRef]
- Kübler, B.; Jaboyedoff, M. Illite crystallinity. Comptes Rendus de l’Académie des Sciences-Series IIA-Earth Planet. Sci. 2000, 331, 75–89. [Google Scholar] [CrossRef]
- Cremers, A.; Elsen, A.; De Preter, P.; Maes, A. Quantitative analysis of radiocaesium retention in soils. Nat. Cell Biol. 1988, 335, 247–249. [Google Scholar] [CrossRef]
- McKinley, J.P.; Zachara, J.M.; Heald, S.M.; Dohnalkova, A.; Newville, M.G.; Sutton, S.R. Microscale Distribution of Cesium Sorbed to Biotite and Muscovite. Environ. Sci. Technol. 2004, 38, 1017–1023. [Google Scholar] [CrossRef]
- Nakao, A.; Thiry, Y.; Funakawa, S.; Kosaki, T. Characterization of the frayed edge site of micaceous minerals in soil clays influenced by different pedogenetic conditions in Japan and northern Thailand. Soil Sci. Plant. Nutr. 2008, 54, 479–489. [Google Scholar] [CrossRef] [Green Version]
- Jackson, M. Weathering of primary and secondary minerals in soils. Int. Congr. Soil Sci. Trans. 1968, 4, 281–292. [Google Scholar]
- Jackson, M.; Hseung, Y.; Corey, R.; Evans, E.; Heuvel, R.V. Weathering Sequence of Clay-size Minerals in Soils and Sedi-ments: II. Chemical Weathering of Layer Silicates 1. Soil Sci. Soc. Am. J. 1952, 16, 3–6. [Google Scholar] [CrossRef]
Figure 1.
(a) XRD peaks and (b) enlarged 10Å peak of illite for MI, CI, and YC1–8 (I: illite, Q: quartz, A: albite).
Figure 1.
(a) XRD peaks and (b) enlarged 10Å peak of illite for MI, CI, and YC1–8 (I: illite, Q: quartz, A: albite).

Figure 2.
Cesium uptake isotherms for YC1–8. Each symbol represents the experimental results with the error bar (2σ), and the black dotted line shows the Freundlich isotherms. The symbols and dashed lines of blue and red indicate the experimental data and Freundlich isotherms for MI and CI, respectively.

Figure 3.
(a) TEM image of MI before cesium uptake, and (b) the TEM-EDS results of cesium-sorbed MI. The labeled points reveal the classified uptake sites distributed on the illite particle.
Figure 3.
(a) TEM image of MI before cesium uptake, and (b) the TEM-EDS results of cesium-sorbed MI. The labeled points reveal the classified uptake sites distributed on the illite particle.

Figure 4.
Calculated relative contents of low crystalline illite (LCI) and high crystalline illite (HCI) for the YC2–8 using full width at half maximum (FWHM) of 10 Å XRD peak. The YC1 was excluded for this analysis due to the existence of other expandable clay minerals. The dotted red line indicates the LCI and HCI reference line experimentally determined by the mixture of MI and CI samples with 0%, 25%, 50%, 75%, and 100% of mass ratio, respectively (red symbol).

Figure 5.
Individual mineral contents for YC2–8. Illite contents were classified as high crystalline illite (HCI) and low crystalline illite (LCI) by using full width at half maximum of 10 Å XRD peak.
Figure 5.
Individual mineral contents for YC2–8. Illite contents were classified as high crystalline illite (HCI) and low crystalline illite (LCI) by using full width at half maximum of 10 Å XRD peak.


Table 1.
(a) Individual mineral contents, full width at half maximum (FWHM) of 10 Å peak, cation exchange capacity (CEC) and specific area (BET) of clay samples, and (b) Spearman’s coefficients between mineralogical properties of clay samples.
Table 1.
(a) Individual mineral contents, full width at half maximum (FWHM) of 10 Å peak, cation exchange capacity (CEC) and specific area (BET) of clay samples, and (b) Spearman’s coefficients between mineralogical properties of clay samples.
| (a) | Illite | Quartz | Albite | FWHM | BET | CEC |
|---|---|---|---|---|---|---|
| (%) | (%) | (%) | (°) | (m2 g−1) | (eq kg−1) | |
| MI | ~100 | - | - | 0.64 | 29.3 | 0.147 |
| YC1 | <47 | 25 | 28 | 1.22 | 28.5 | 0.161 |
| YC2 | 35 | 33 | 32 | 0.22 | 5.9 | 0.040 |
| YC3 | 35 | 65 | - | 0.21 | 3.7 | 0.023 |
| YC4 | 68 | 32 | - | 0.23 | 7.5 | 0.060 |
| YC5 | 75 | 25 | - | 0.26 | 7.6 | 0.046 |
| YC6 | 40 | 60 | - | 0.21 | 2.6 | 0.031 |
| YC7 | 35 | 42 | 23 | 0.19 | 9.3 | 0.037 |
| YC8 | 68 | 32 | - | 0.20 | 2.1 | 0.087 |
| CI | ~100 | - | - | 0.15 | 7.3 | 0.035 |
| (b) | Illite Contents | FWHM | BET | CEC | ||
| Illite Contents | 1.000 | |||||
| FWHM | 0.180 | 1.000 | ||||
| BET | 0.303 | 0.559 | 1.000 | |||
| CEC | 0.432 | * 0.657 | 0.527 | 1.000 | ||
*: Correlation is significant at the 0.05 level (2-tailed).
Table 2.
Parameters of Freundlich isotherms for the illitic clay samples.
| Freundlich Model | |||
|---|---|---|---|
| Kf [(μg kg−1)/(L μg−1)n] | n (-) | r2 | |
| MI | 4.5 × 10⁴ | 0.401 | 0.995 |
| YC1 | 2.4 × 10⁴ | 0.480 | 0.985 |
| YC2 | 1.1 × 10⁴ | 0.436 | 0.954 |
| YC3 | 9.4 × 10³ | 0.440 | 0.968 |
| YC4 | 1.9 × 10⁴ | 0.466 | 0.946 |
| YC5 | 1.4 × 10⁴ | 0.442 | 0.978 |
| YC6 | 8.7 × 10³ | 0.463 | 0.960 |
| YC7 | 8.0 × 10³ | 0.464 | 0.988 |
| YC8 | 1.6 × 10⁴ | 0.441 | 0.976 |
| CI | 4.8 × 10³ | 0.500 | 0.986 |
Table 3.
Spearman’s correlation coefficients between illite properties and Kd of samples at various Cw, respectively.
Table 3.
Spearman’s correlation coefficients between illite properties and Kd of samples at various Cw, respectively.
| Kd (L kg−1) at Ranged Cw (μg L−1) | |||||
|---|---|---|---|---|---|
| 1 × 10 | 1 × 10² | 1 × 10³ | 1 × 10⁴ | 1 × 10⁵ | |
| Illite Contents | 0.303 | 0.352 | 0.259 | 0.414 | 0.605 |
| FWHM | * 0.742 | ** 0.809 | ** 0.827 | ** 0.821 | 0.565 |
| BET | 0.418 | 0.467 | 0.345 | 0.333 | * 0.636 |
| CEC | ** 0.855 | ** 0.915 | ** 0.867 | ** 0.842 | ** 0.903 |
**: Correlation is significant at the 0.01 level (2-tailed). *: Correlation is significant at the 0.05 level (2-tailed).
Table 4.
Spearman’s correlation coefficients between quantified mineral contents and Kd after classifying illite as low crystalline illite (LCI) and high crystalline illite (HCI).
Table 4.
Spearman’s correlation coefficients between quantified mineral contents and Kd after classifying illite as low crystalline illite (LCI) and high crystalline illite (HCI).
| BET | CEC | Kd (L kg−1) at Ranged Cw (μg L−1) | |||||
|---|---|---|---|---|---|---|---|
| 1 × 10 | 1 × 10² | 1 × 10³ | 1 × 10⁴ | 1 × 10⁵ | |||
| LCI | 0.285 | * 0.778 | ** 0.837 | ** 0.929 | ** 0.912 | ** 0.929 | * 0.695 |
| HCI | −0.333 | −0.017 | −0.217 | −0.183 | −0.100 | −0.067 | 0.167 |
| Quartz | −0.479 | −0.647 | −0.311 | −0.395 | −0.311 | −0.420 | * −0.672 |
| Albite | 0.160 | −0.091 | −0.297 | −0.183 | 0.274 | −0.479 | −0.342 |
**: Correlation is significant at the 0.01 level (2-tailed). *: Correlation is significant at the 0.05 level (2-tailed).
Publisher’s Note: MDPI stays neutral with regard to jurisdictional claims in published maps and institutional affiliations. |
© 2021 by the authors. Licensee MDPI, Basel, Switzerland. This article is an open access article distributed under the terms and conditions of the Creative Commons Attribution (CC BY) license (http://creativecommons.org/licenses/by/4.0/).
Share and Cite
MDPI and ACS Style
Hwang, J.; Choung, S.; Shin, W.; Han, W.S.; Chon, C.-M. A Batch Experiment of Cesium Uptake Using Illitic Clays with Different Degrees of Crystallinity. Water 2021, 13, 409. https://doi.org/10.3390/w13040409
AMA Style
Hwang J, Choung S, Shin W, Han WS, Chon C-M. A Batch Experiment of Cesium Uptake Using Illitic Clays with Different Degrees of Crystallinity. Water. 2021; 13(4):409. https://doi.org/10.3390/w13040409
Chicago/Turabian StyleHwang, Jeonghwan, Sungwook Choung, Woosik Shin, Weon Shik Han, and Chul-Min Chon. 2021. "A Batch Experiment of Cesium Uptake Using Illitic Clays with Different Degrees of Crystallinity" Water 13, no. 4: 409. https://doi.org/10.3390/w13040409
Note that from the first issue of 2016, this journal uses article numbers instead of page numbers. See further details here.