Article

Hydrogeological and Geochemical Characteristics of the Coastal Aquifer of Stromboli Volcanic Island (Italy)

1
Istituto Nazionale di Geofisica e Vulcanologia, Sezione Roma 2, via di Vigna Murata 605, 00143 Roma, Italy
2
Dipartimento di Biologia, Ecologia e Scienze della Terra, Università della Calabria, Via P. Bucci, Cubo 15B, 87036 Arcavacata di Rende, Italy
3
Dipartimento di Science della Terra e del Mare, Università degli Studi di Palermo, via Archirafi 36, 90123 Palermo, Italy
4
Istituto Nazionale di Geofisica e Vulcanologia, Sezione Roma 1, via di Vigna Murata 605, 00143 Roma, Italy
5
Istituto Nazionale di Geofisica e Vulcanologia, Sezione di Palermo, via Ugo La Malfa 153, 90146 Palermo, Italy
*
Author to whom correspondence should be addressed.
Water 2021, 13(4), 417; https://doi.org/10.3390/w13040417
Submission received: 30 December 2020 / Revised: 29 January 2021 / Accepted: 1 February 2021 / Published: 5 February 2021
(This article belongs to the Special Issue Geochemistry of Groundwater)

Abstract

:
Although groundwater is a strategic source in volcanic islands, most hydrogeochemical research on this topic has been focused on volcanic activity monitoring, overlooking general hydrogeological aspects. The same applies to one of the most studied volcanoes in the world, Stromboli Island (Italy). Here, we provide a hydrogeological scheme of its coastal aquifer, retrieving inferences about its potential use as a water supply source and for optimizing monitoring protocols for volcanic surveillance. Starting from the hydrogeochemical literature background, we analyzed new data, acquired both for volcano monitoring purposes and during specific surveys. Among these, there were saturated hydraulic conductivity measurements of selected rock samples and precise determinations of water table elevations based on GNSS surveys of wells. We identified a ubiquitous thin lens of brackish water floating on seawater and composed of a variable mixing of marine and meteoric components; inlets of hydrothermal fluids to the aquifer are basically gases, mainly CO2. Based on its hydrogeochemical character, the coastal aquifer of Stromboli could be used as a water supply source after desalinization by reverse osmosis, while the wells located far from the seashore are the most interesting for volcano monitoring, because they are less disturbed by the shallow geochemical noise.

1. Introduction

Groundwater is a strategic resource in insular environments [1], where the physical isolation makes the use of external, large-scale facility networks difficult. Active volcanic islands pose additional problems in the exploitation of groundwater bodies due to the release of volcanogenic chemicals that are potentially noxious or toxic for humans, animals, and plants. Efficient strategies for the use of groundwater in volcanic islands should be rooted in hydrogeological and geochemical information, giving quantitative (e.g., yearly renewable availability of natural water resources) and qualitative (e.g., water quality and the effects of changes in volcanic activity) constraints to its exploitation.
Several studies on groundwater hydrogeochemistry of volcanic islands have been carried out during the last 30 years, for example, at Azores [2] and the Canary Islands [3]. However, the main focus of this research has been concentrated on volcano monitoring implications. This is the case for Vulcano Island (Aeolian Archipelago, Italy), where tens of geochemical papers have described its shallow hydrothermal aquifer since 1988 [4], but the first hydrogeological model was proposed only in 2015 [5]. An analogous fate concerned the close volcanic island of Stromboli (Figure 1), permanently active during the last 1500 years [6]. Despite several geochemical studies in the last few decades describing its coastal aquifer [7,8,9,10,11,12], most of these were focused on the identification of geochemical precursors of the volcanic activity and its possible evolutive scenarios. Only two papers discussed its general hydrogeochemical character [11,12], but with hydrogeological inferences based on qualitative interpretations, not adequately supported by field data.
We present in this paper new hydrogeological and geochemical data, including previously unreleased chemical analyses of groundwater, laboratory measurements of the hydraulic conductivity of representative rock samples, and the precise estimation of water table elevation. Using these data and information from previous works, the hydrogeological and geochemical characteristics of the coastal aquifer of Stromboli are evaluated and discussed. We retrieved inferences about its possible use as a water supply source and its monitoring in the frame of volcanic surveillance activity.

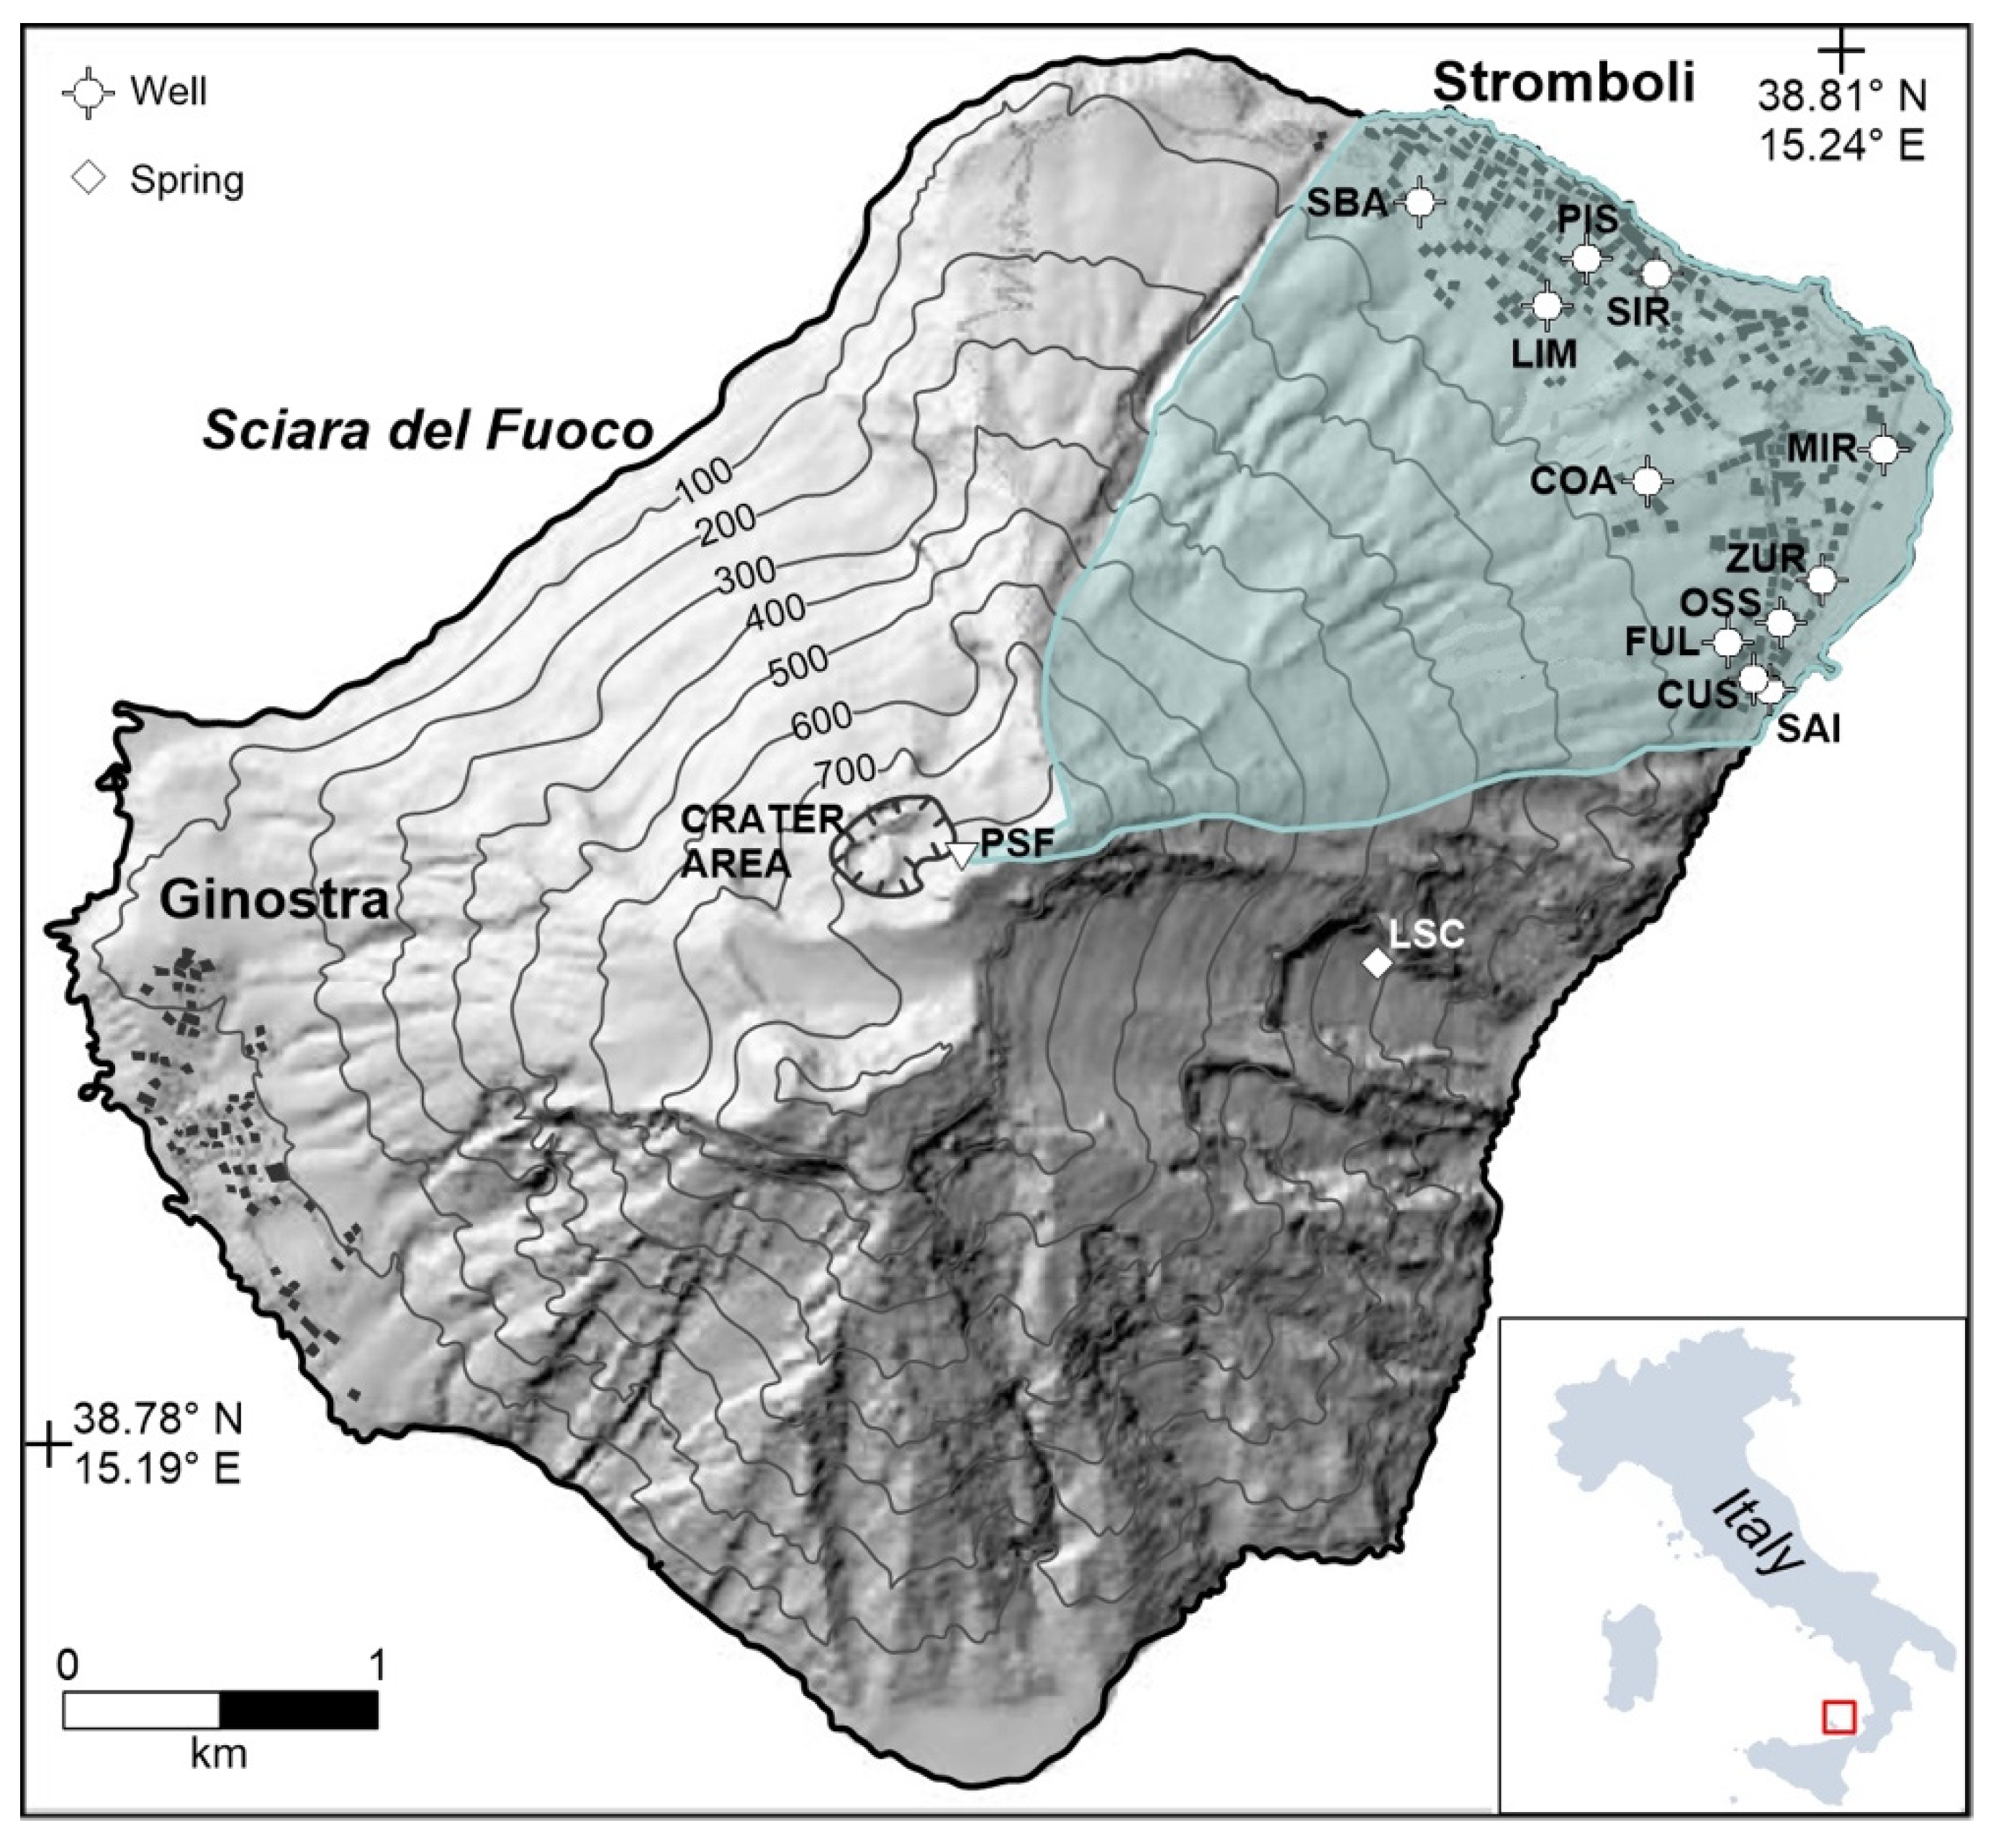
2. Study Area Settings

Stromboli (Figure 1), the north-easternmost island of the Quaternary Aeolian volcanic arc off the northern coast of Sicily (Southern Italy), is an active stratovolcano that rises from a depth of ≈2000 m b.s.l. in the Tyrrhenian sea, with a subaerial portion 924 m high. The resident population consists of ≈550 inhabitants, mostly concentrated in the village of Stromboli on the northeast side; the other settlement, Ginostra, is seated on the southwest side, and is populated by a few tens of persons. During the summer season, the presence of tourists substantially increases up to several thousand per day.
The composition of its alternating lava flows and pyroclastic deposits varies among basaltic andesite, shoshonite, and latite-trachyte [13], ranging in age between >100 ka BP to the present. Stromboli experienced several flank collapses, the youngest of which occurred less than 5 ka ago and formed the Sciara del Fuoco depression on the northwest side of the volcano (Figure 1) [14].
Its peculiar (Strombolian) activity consists of permanent passive magma degassing from the open conduit, alternated to short (a few to few tens of s) 100–200 mhigh scoria-rich jets produced by explosions of variable energy every 10–20 min [15]. The Volcanic Explosivity Index (VEI) of Strombolian activity ranges from −3 to −6 [16]. Occasionally, this activity is interrupted by explosive events with higher intensity, defined as major explosions and paroxysms (VEI = 0–1) [17,18]. In the last four decades, four effusive eruptions occurred in 1985, 2002–2003, 2007, and 2014, and two paroxysmal explosive events occurred in 2019, not associated with effusive eruptions.
A coastal groundwater body is present on the northeast side of Stromboli; previous studies [7,8,9,10,11,12] described these waters as characterized by a quite constant temperature and with a pH ranging from nearly neutral to slightly acidic. Dominant dissolved species are Na and Cl, accordingly, with a water isotopic composition falling along the mixing line between seawater and local rainfalls [19]. Chemical and isotopic compositions of the dissolved gases exhibit strong evidence of interaction with magmatic gases [8,10,11,12]. The high salinity of this aquifer makes it unsuitable for human consumption, and the water supply of the island is ensured through transportation by tankers from the mainland.

3. Materials and Methods

3.1. Hydrology and Hydrogeology

Hydrological data refer to rainfall amounts and air temperatures measured at the available station closest to Stromboli, namely the Leni site of the Sicilian Agrometeorological Information System (SIAS) network on the island of Salina; this island is located about 35 km southwest of Stromboli, and has a very similar maximum elevation (965 m a.s.l.). We used two different data series: the 1965–1994 monthly averages [20] and the daily values acquired in the period of 2003–2019 [21].
Direct measurements of saturated hydraulic conductivity were carried out on eight samples (Figure 2), collected during two field campaigns in July 2018 and September 2020. We applied the variable head method using a UMS K-SAT cell (Table 1). Water table depths were determined in six wells with an error of ±1 cm using a piezometric probe and refer to measures acquired in the years 2004–2020. Wellhead elevations were determined in July 2020, with a Trimble R6 GNSS system operating in RTK mode and an error of ±5 cm.
Water table elevations (m a.s.l.) were calculated as the difference between the two abovementioned parameters (Table 2; well locations in Figure 1).

3.2. Geochemistry

We used both literature data [11] and previous unpublished analyses related to sampling campaigns carried out in the period 2008–2015. Water samples used for the determination of dissolved major ions were first filtered using a 0.45 µm Millipore MF filter and then collected in LD-PE (low-density polyethylene) bottles for major element analyses, acidifying to a pH ≈ 2 with HCl, the aliquot destined to cation determination; untreated aliquots were stored for alkalinity determinations, made via titration with HCl (0.1 N). Electrical conductivity and pH were measured in the field using Orion instruments equipped with Hamilton electrodes (pH). Major ions (Table 2) were determined at the lab facilities of Istituto Nazionale di Geofisica e Vulcanologia, Sezione di Palermo (Italy) by ionic chromatography using Dionex columns AS14 and CS12 for anions and cations, respectively, with a closure error of the charge balance of ±5%.

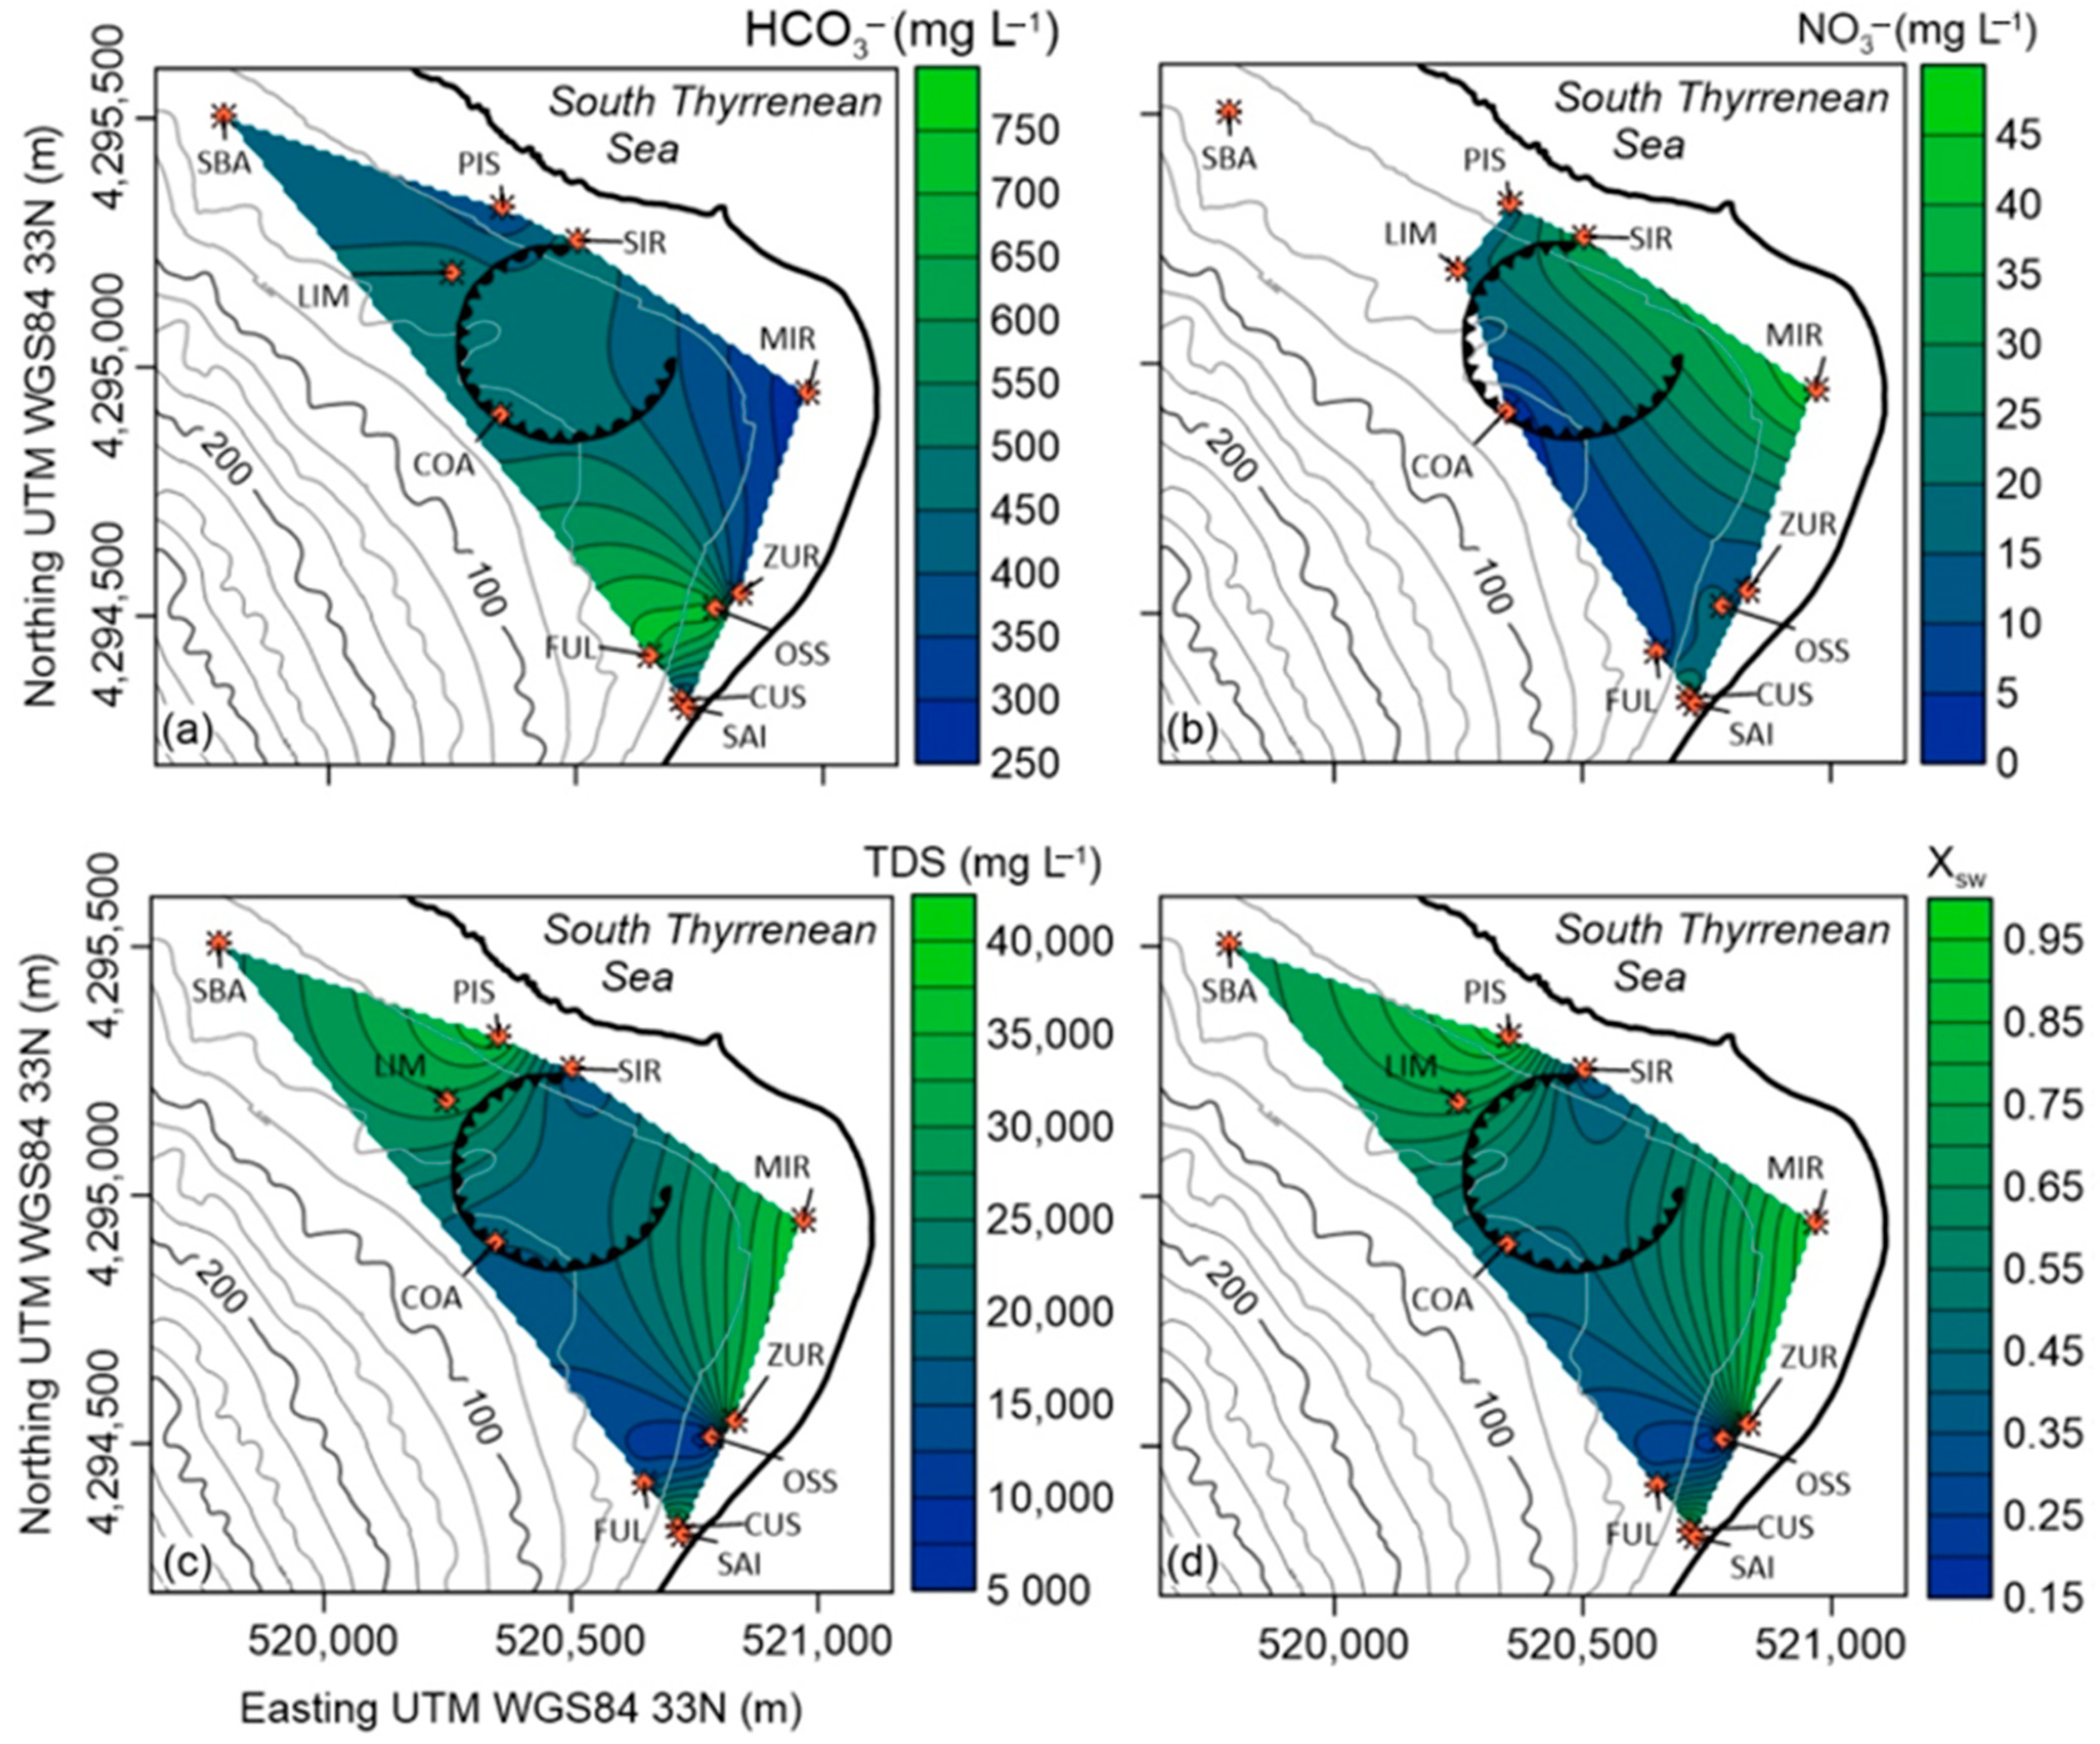
3.3. GIS and Mapping

Digitizing and topological operations were carried out using the free software QGIS, release 3.10. Data gridding and contouring were performed with Golden Software Surfer, release 16.
The hydrogeological map (Figure 2) is derived from the geological map of the island [22], unifying into the same hydrogeological unit volcanic products of different ages, but with similar infiltration properties. We distinguished four groups (i.e., hydrogeological complexes): lavas, pyroclastic products, colluvial deposits, and seashore deposits.
In the first group (lavas), lithologies, such as black aa-type lava, massive and lobate lava flows, sheet-like pahoehoe lava flows, and welded scoriaceous agglomerates, were considered. In the second group (pyroclastic products), lapilli-tuff-breccias, ashes, lapilli and blocks, loose whitish pomiceous lapilli, hydromagmatic pyroclastic successions, and scoriaceous agglomerates were included. In the third group (colluvial deposits), colluvial deposits themselves and recent and ancient landslide debris were considered. Finally, the current marine deposits were included in the last group (seashore deposits).

3.4. Groundwater Temperature Logging

Hourly data of the groundwater temperature were acquired using two different submersible waterproof logger types, both from Gemini Data Loggers: a Tinytalk model (resolution 0.3 °C) at SAI and two Tinytag Aquatic 2 (resolution 0.01 °C) instruments at COA and LIM (Figure 1). These loggers operated in the period 2017–2020.

4. Results and Discussion

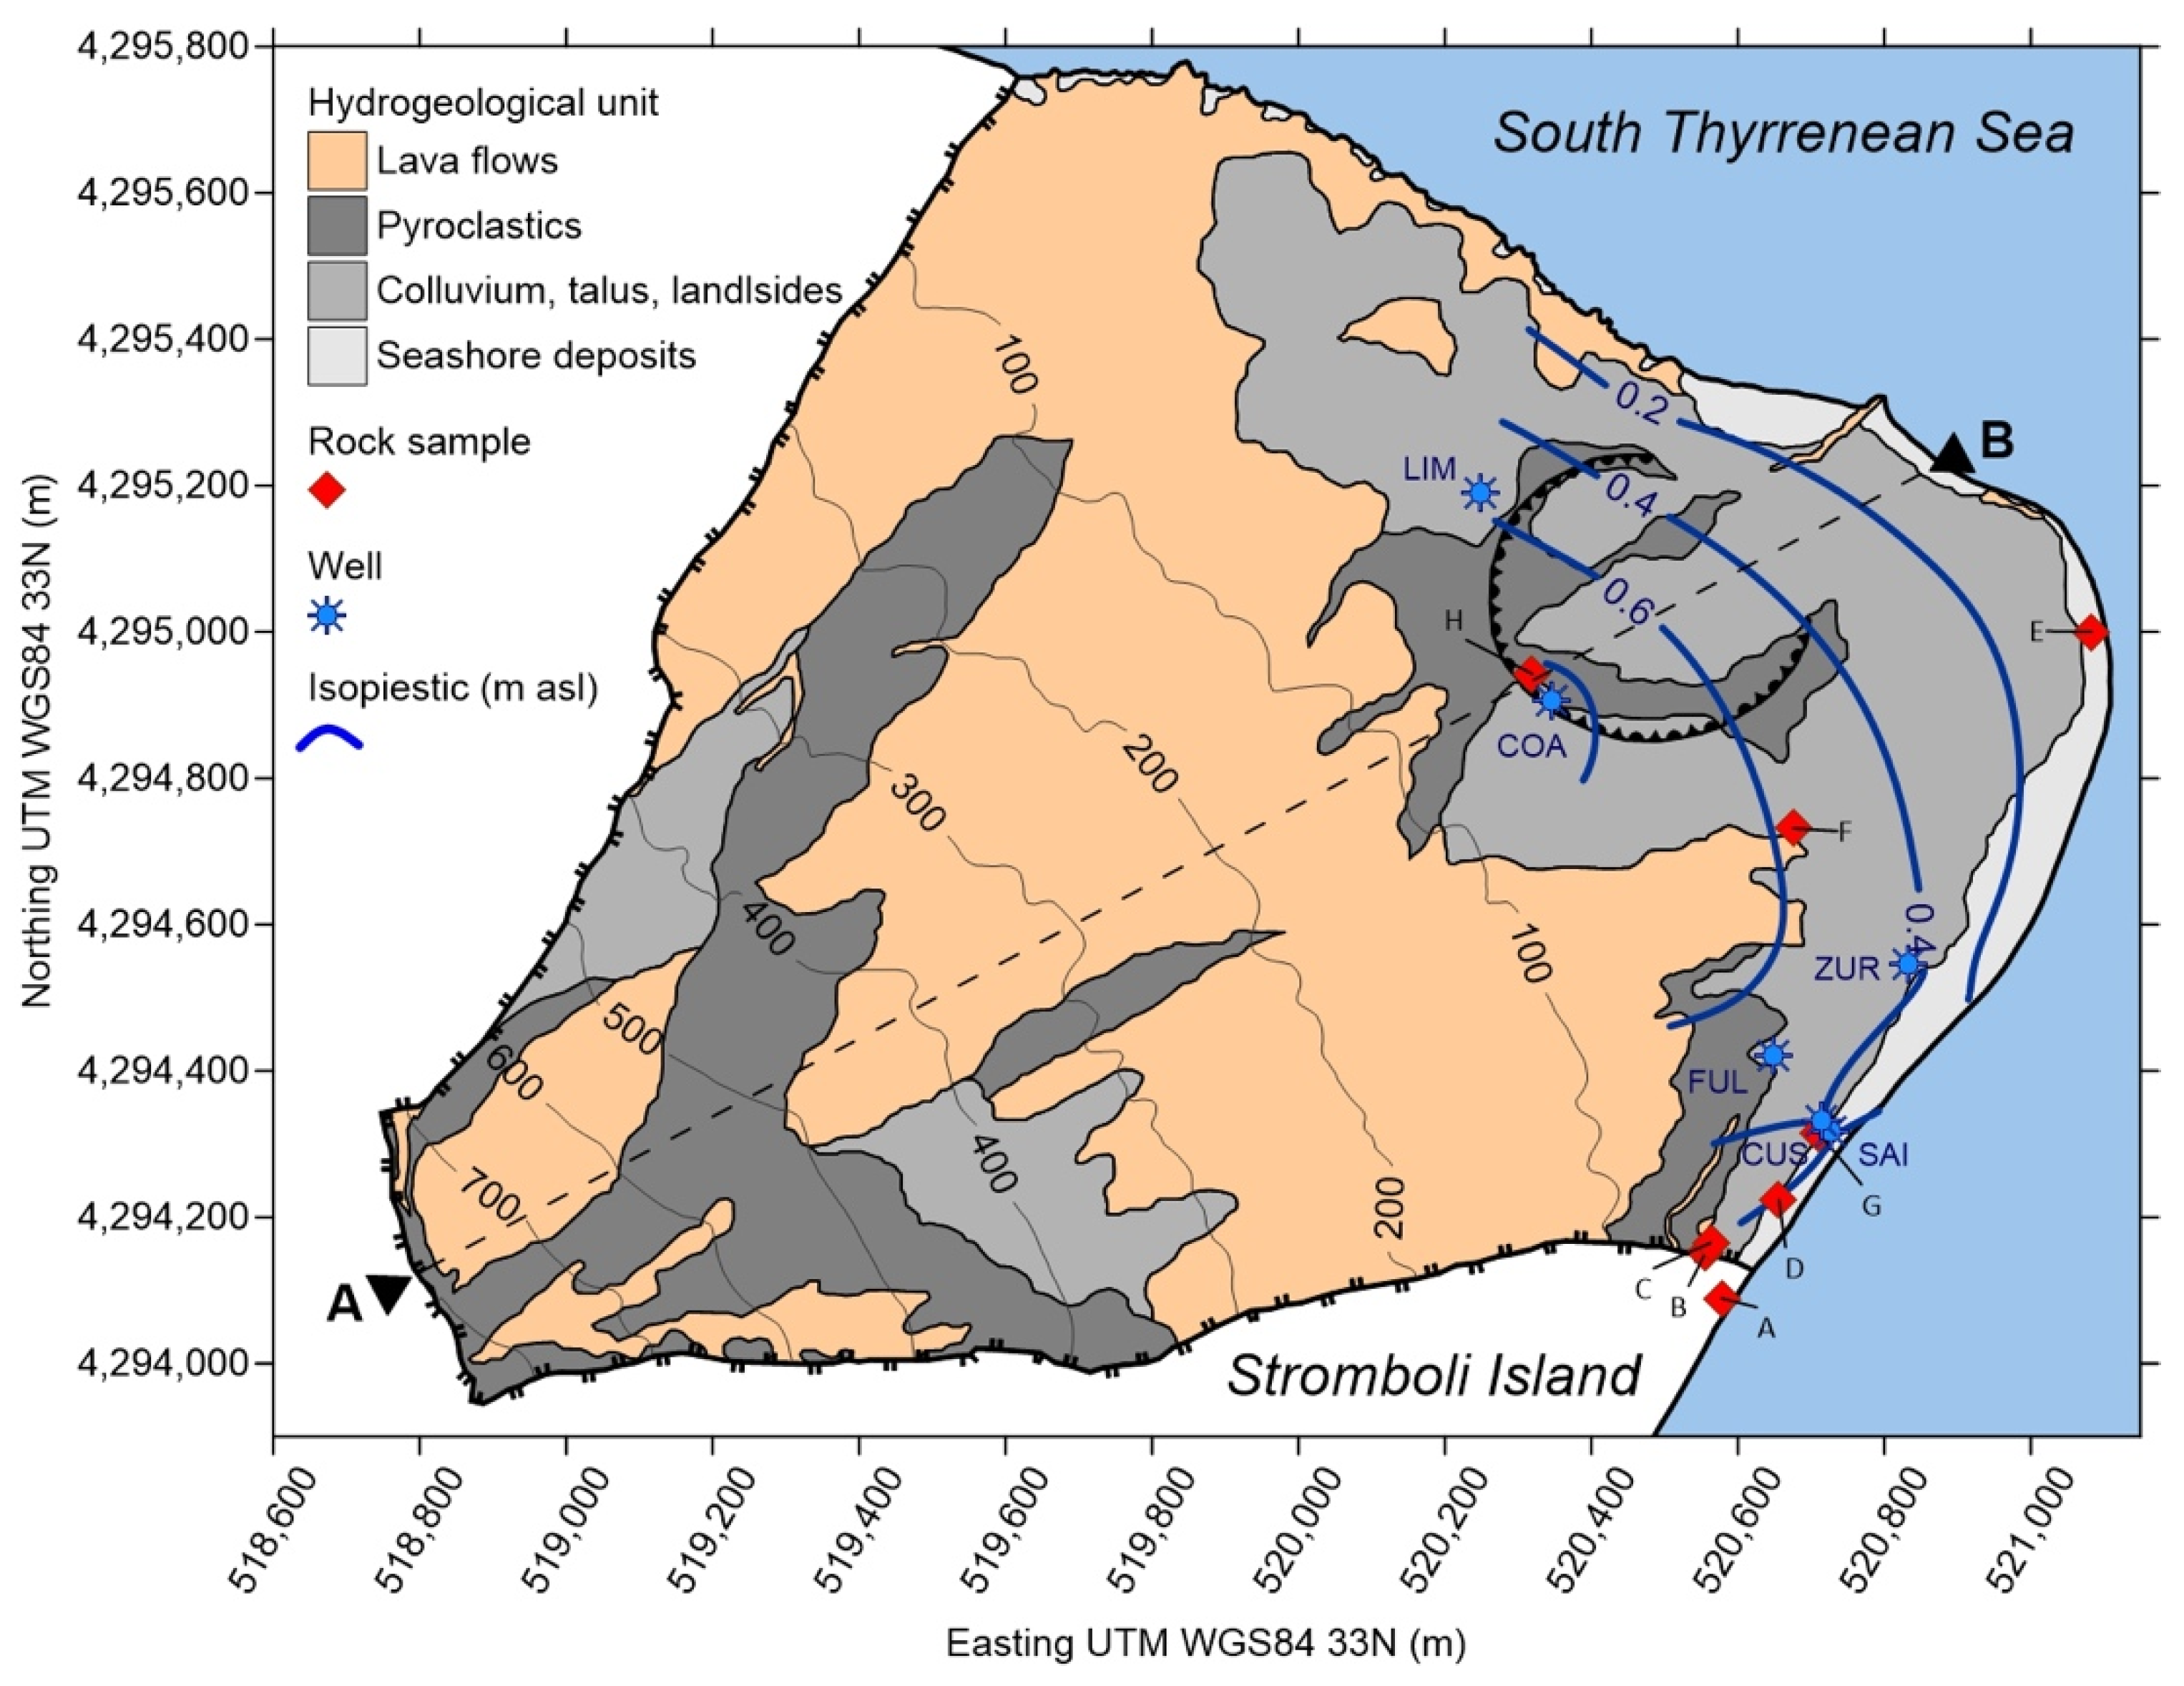
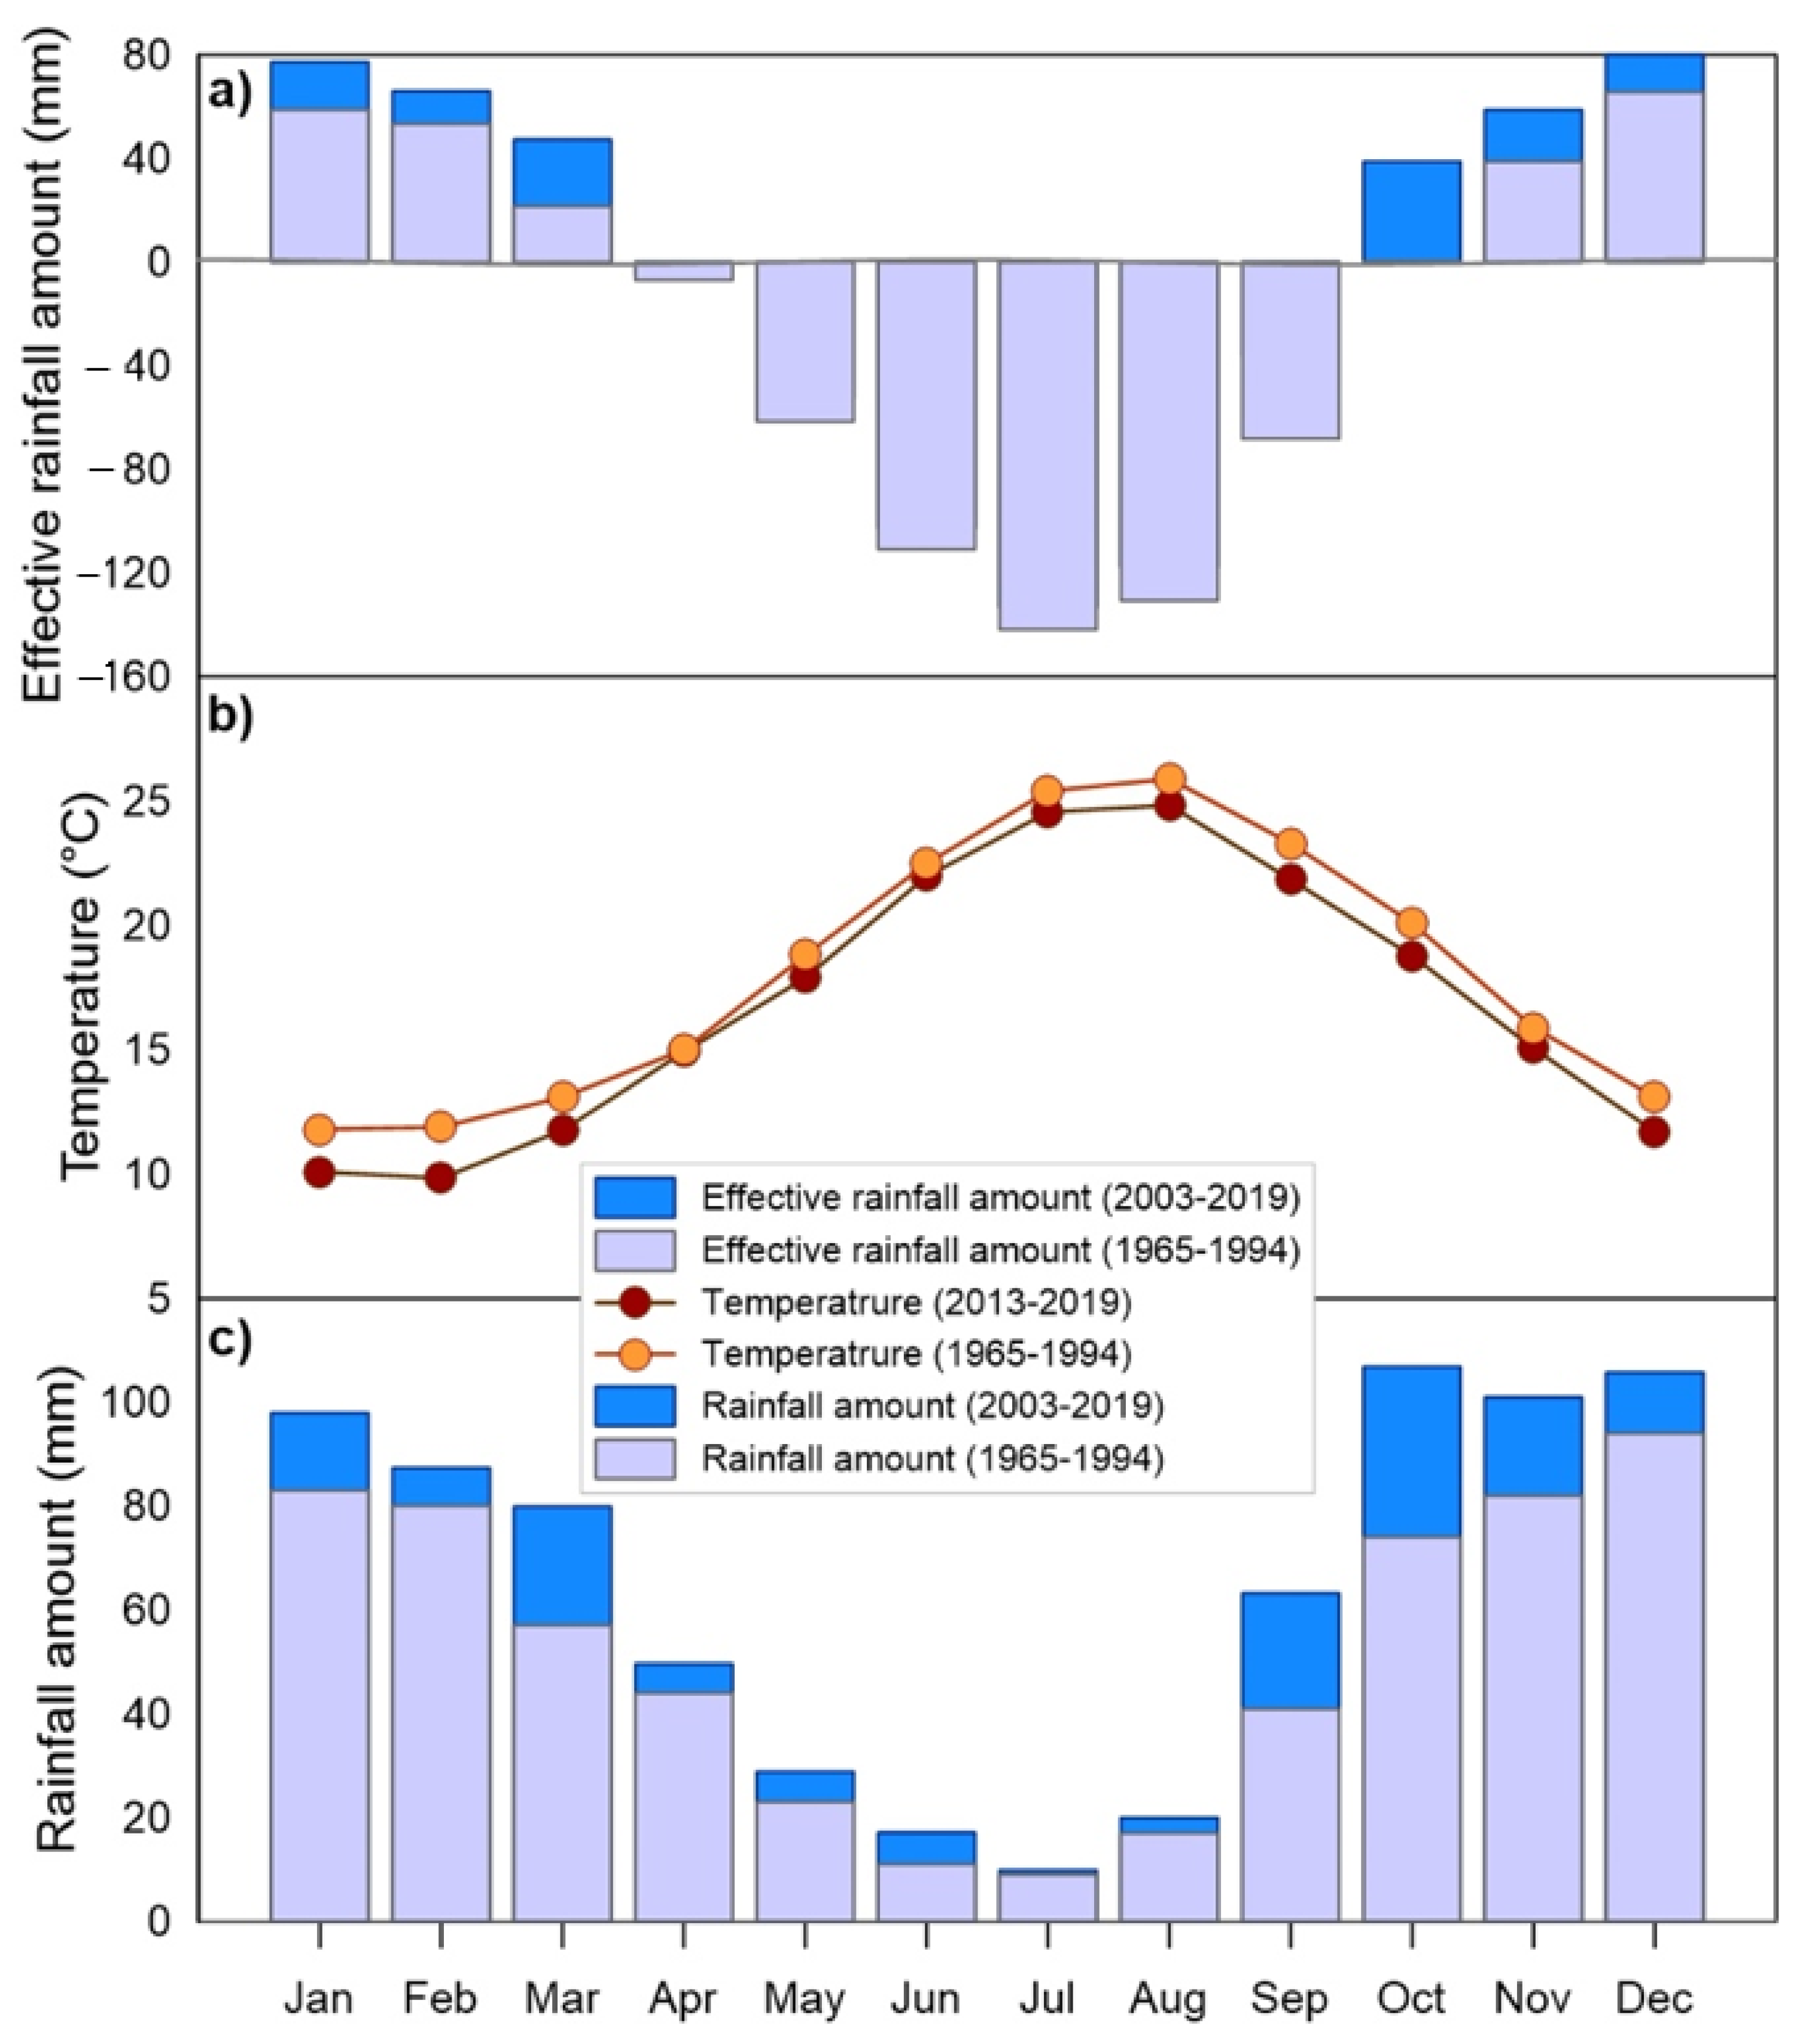
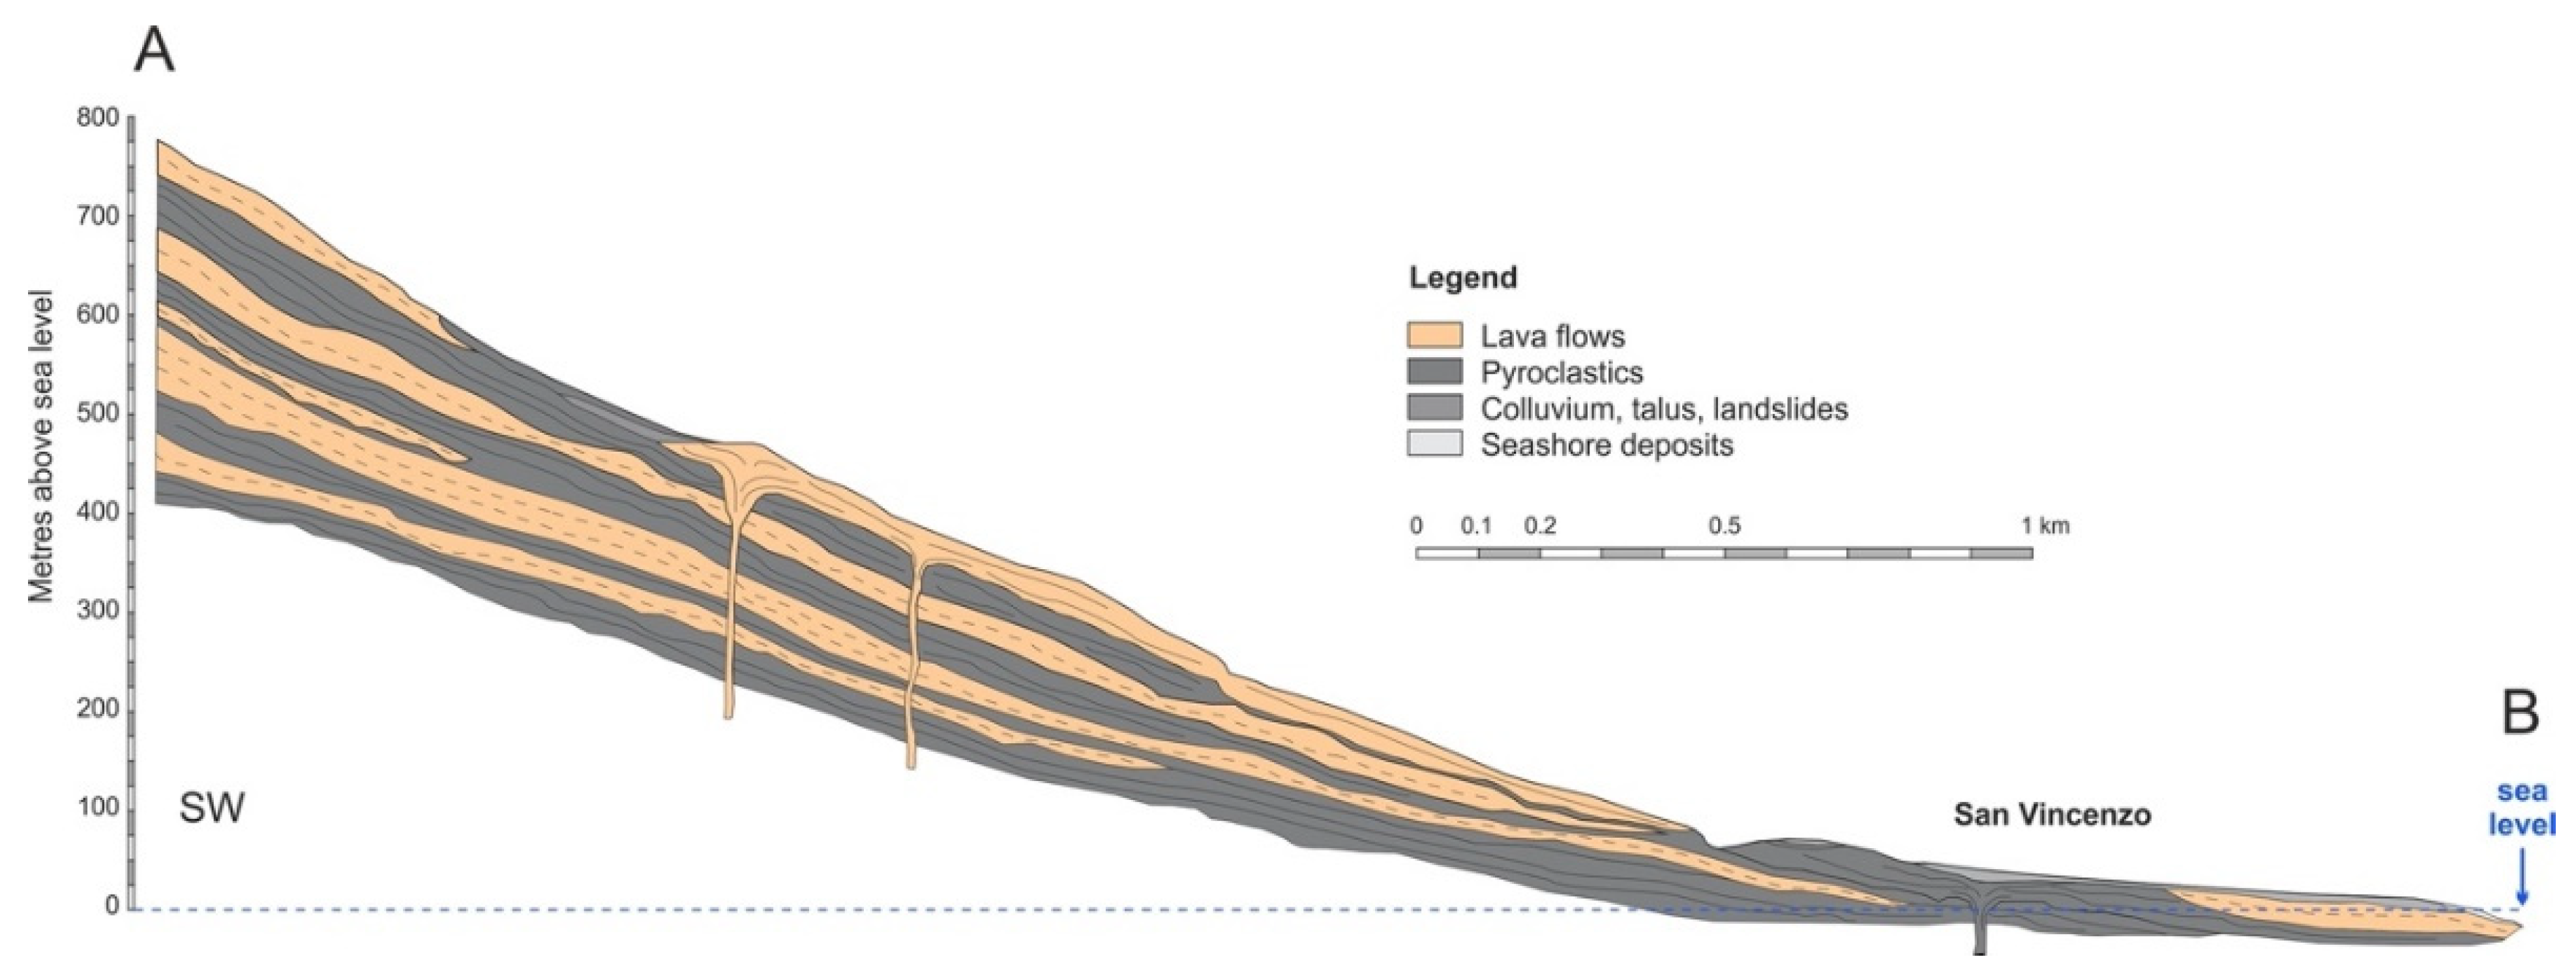
4.1. Hydrogeological Balance, Aquifer Structure, and Groundwater Flow Directions

Figure 3 reports the monthly average values of effective rain, namely the amount of precipitations at the net of evapotranspiration able to generate infiltration (panel a), air temperature (b), and rain height (c); we compared the data of the last years (2003–2019) [21] with reference values [20] calculated for the period 1965–1994. Evapotranspiration was estimated applying the Thornthwaite formula [23].
The seasonal distribution of these parameters is typical of semi-arid climates, as in the south Tyrrhenian area, where Stromboli Island is located: mild, rainy autumns and winters alternate to drier and hotter springs and summers. Evapotranspiration normally exceeds precipitation from April to October, limiting the recharge of groundwater bodies to the period of November–March. Due to the absence of sufficiently developed soil horizons, their retention capacity can be considered negligible; therefore, the hydrological deficit is the simple difference between rain heights and evapotranspiration.
Comparing the more recent (2003–2019) with the reference (1965–1994) hydrological data, we observe air temperatures that are generally slightly lower, and in particular with winters colder than in the past. A more marked difference concerns rain heights, with a general increase of rainfall amounts, especially during the early autumn (September–October) and March. The simultaneous temperature decrease and rainfall amount increase produce an increase of the net recharge of groundwater, with the month of October being the month that turned from negative to positive hydrological deficits. These variations seem to suggest that something is changing in the microclimate of the Aeolian Archipelago, but the observation period is too short for their interpretation in the wider perspective of global climatic changes. The role of the hydrological regime and its evolution in time on groundwater resource management will be discussed in Section 5.
In detail, three of the four complexes (colluvial deposits, pyroclastic products, and seashore deposits) show a similar primary permeability (from 10−5 to 10−3 m s−1) due to their medium–high porosity (Table 1). Differently, lava flows are characterized by a secondary permeability due to fracturing. Assuming that the average permeability of the rocks hosting the hydrogeologic circuit is of the same order as those measured in lapilli tuff samples (Table 1), i.e., 10−5 m s−1, and considering that the major axis of the hydrogeological watershed (Figure 1 and Figure 2) is ≈2300 m with a maximum elevation difference of ≈700 m, the average residence time of the groundwater body can be estimated in the order of several years. Consequently, intra-annual variations in the qualitative and quantitative state of the groundwater body driven by the hydrological cycle should be excluded, with the exception of short-living transients due to the direct infiltration of meteoric water following substantial rainfall events; this inference is confirmed by the modest seasonal variability of geochemical data measured in the Stromboli coastal aquifer (authors’ personal observations).
The regular behavior of the piezometric surface, as deduced by the isopiestic lines (Figure 2), indicates that a unique groundwater body lies below the topographic surface in the northeast sector of the coastal area of Stromboli in the form of a thin lens of freshwater floating above the intruding seawater. It flows following a gentle, quite homogeneous hydraulic gradient, 1.7 m km−1 measured at COA and 2.0 m km−1 at LIM, although the subsoil structure of this area, composed of alternating lavas and pyroclastic deposits (see the hydrogeological cross section of Figure 4), suggests the possible existence of a multi-level aquifer. No disturbances induced by pumping activity are evidenced, because most of the wells are only sporadically used.

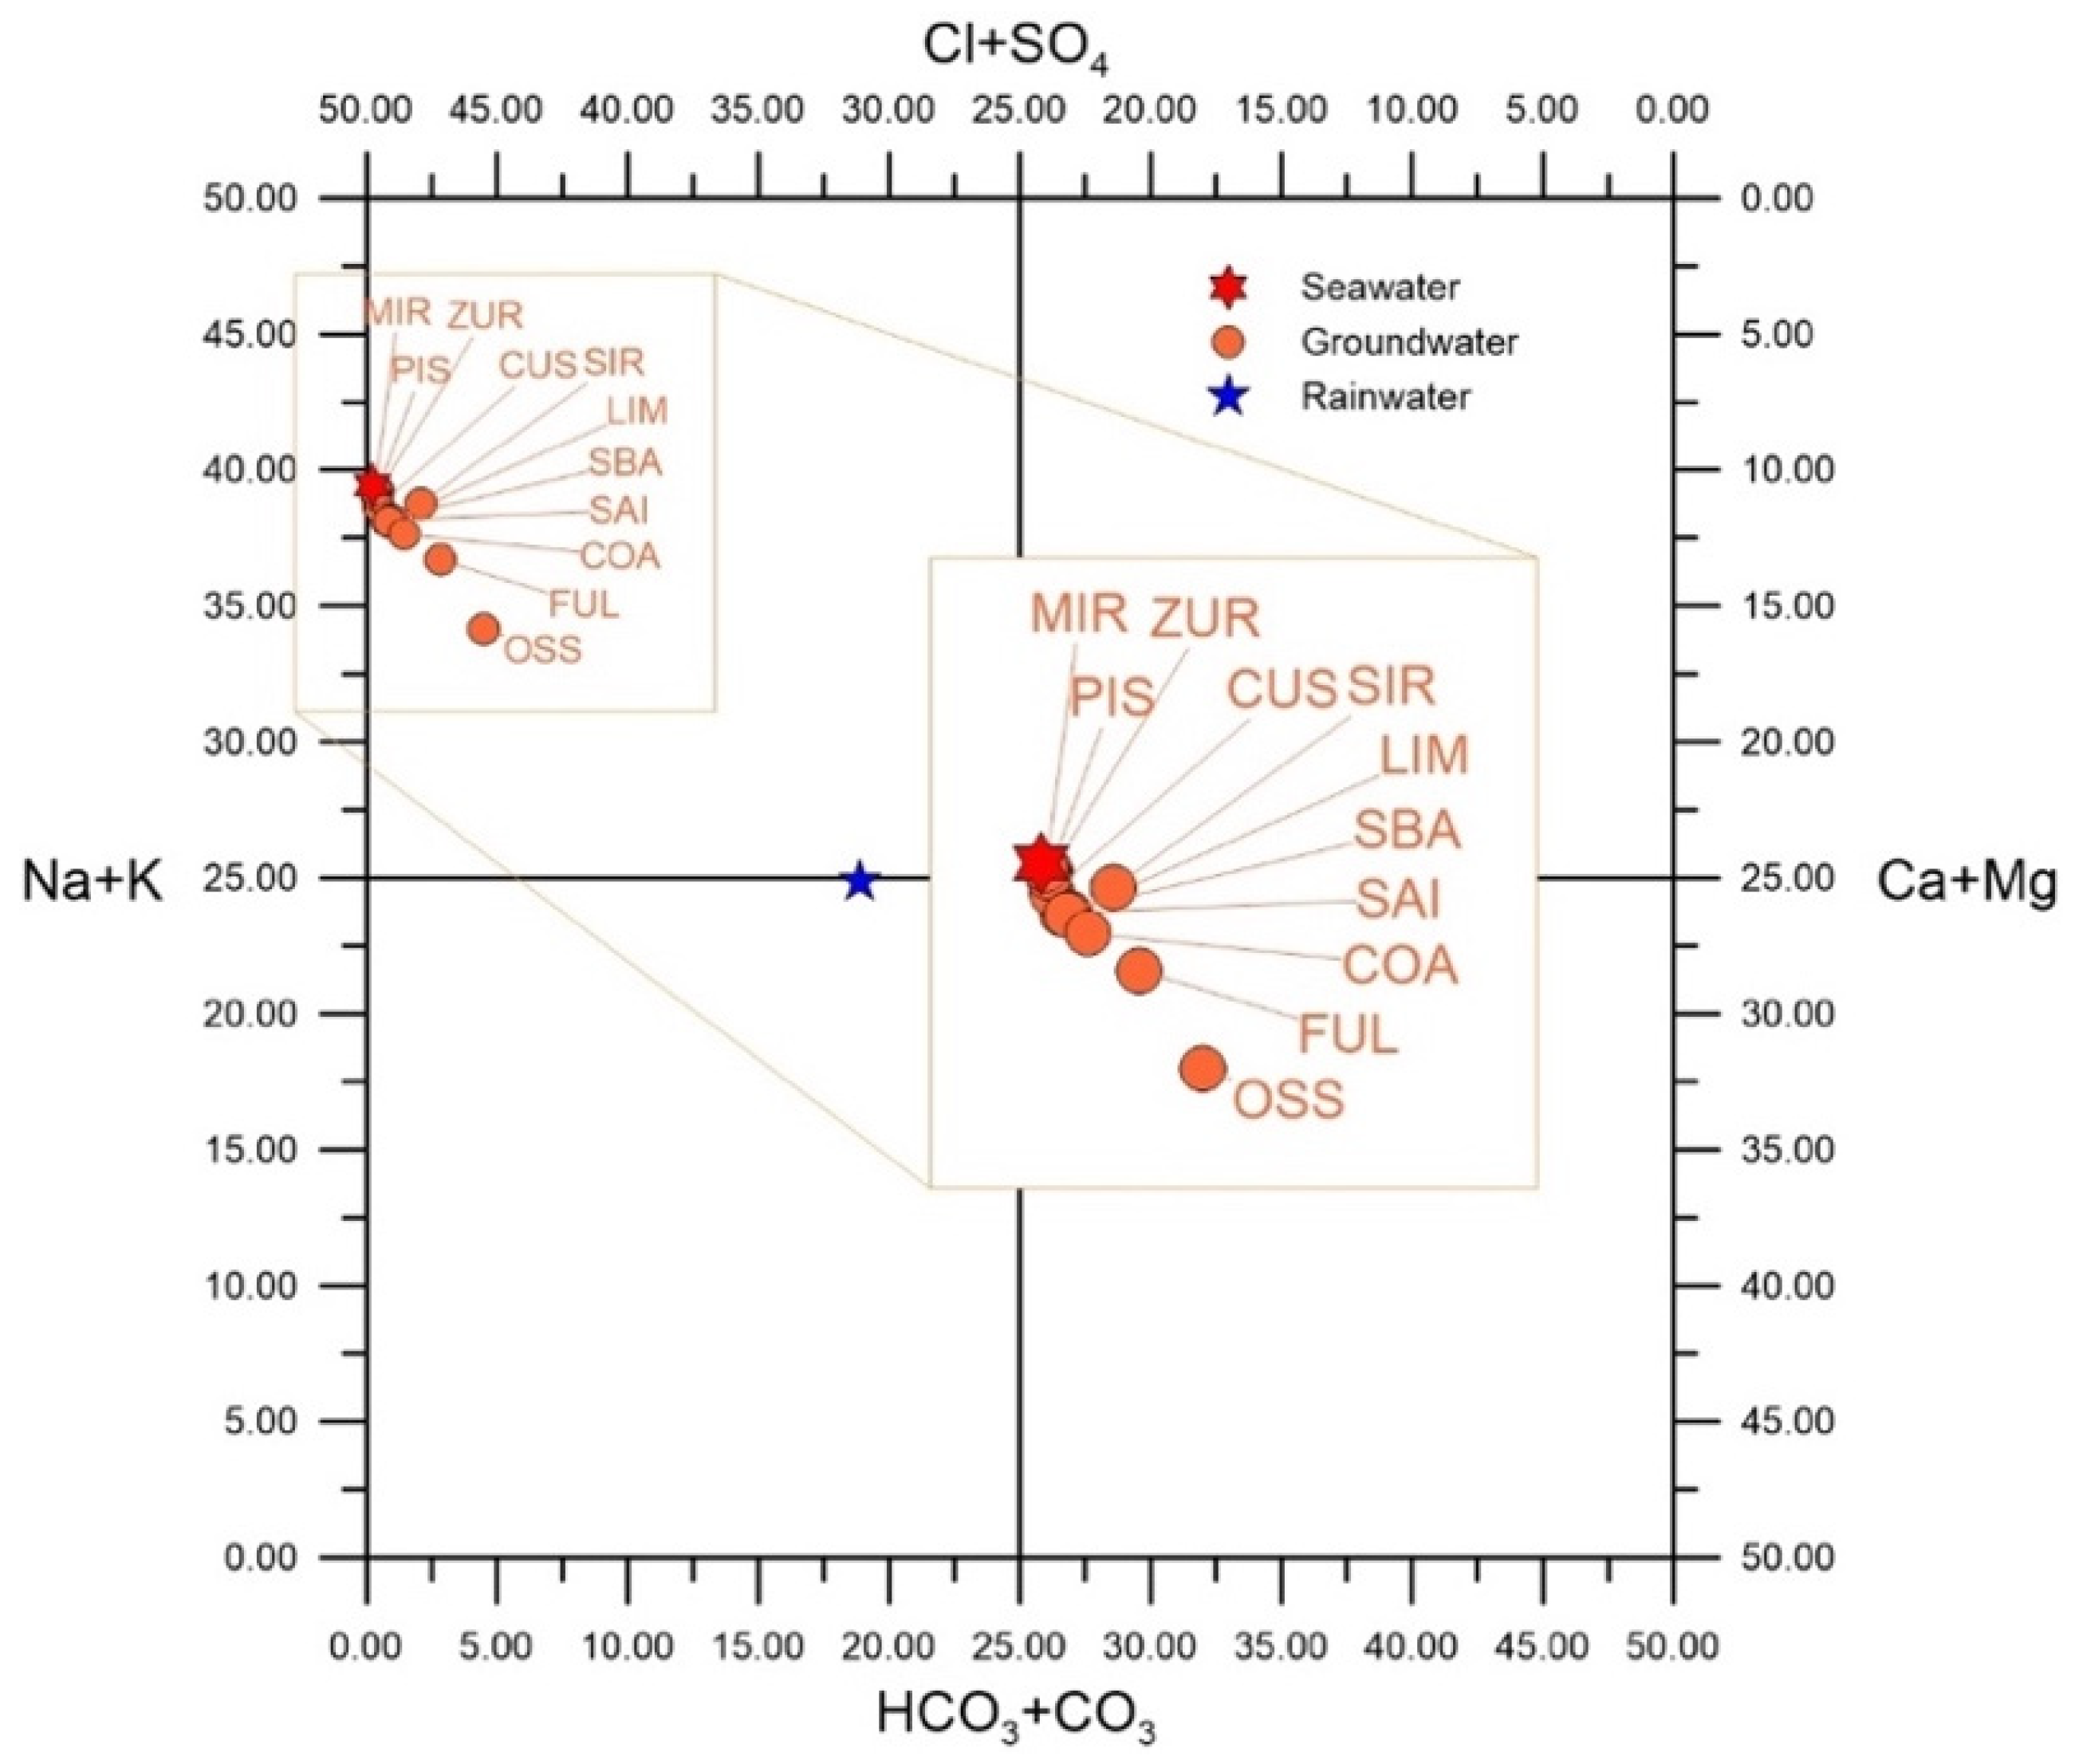
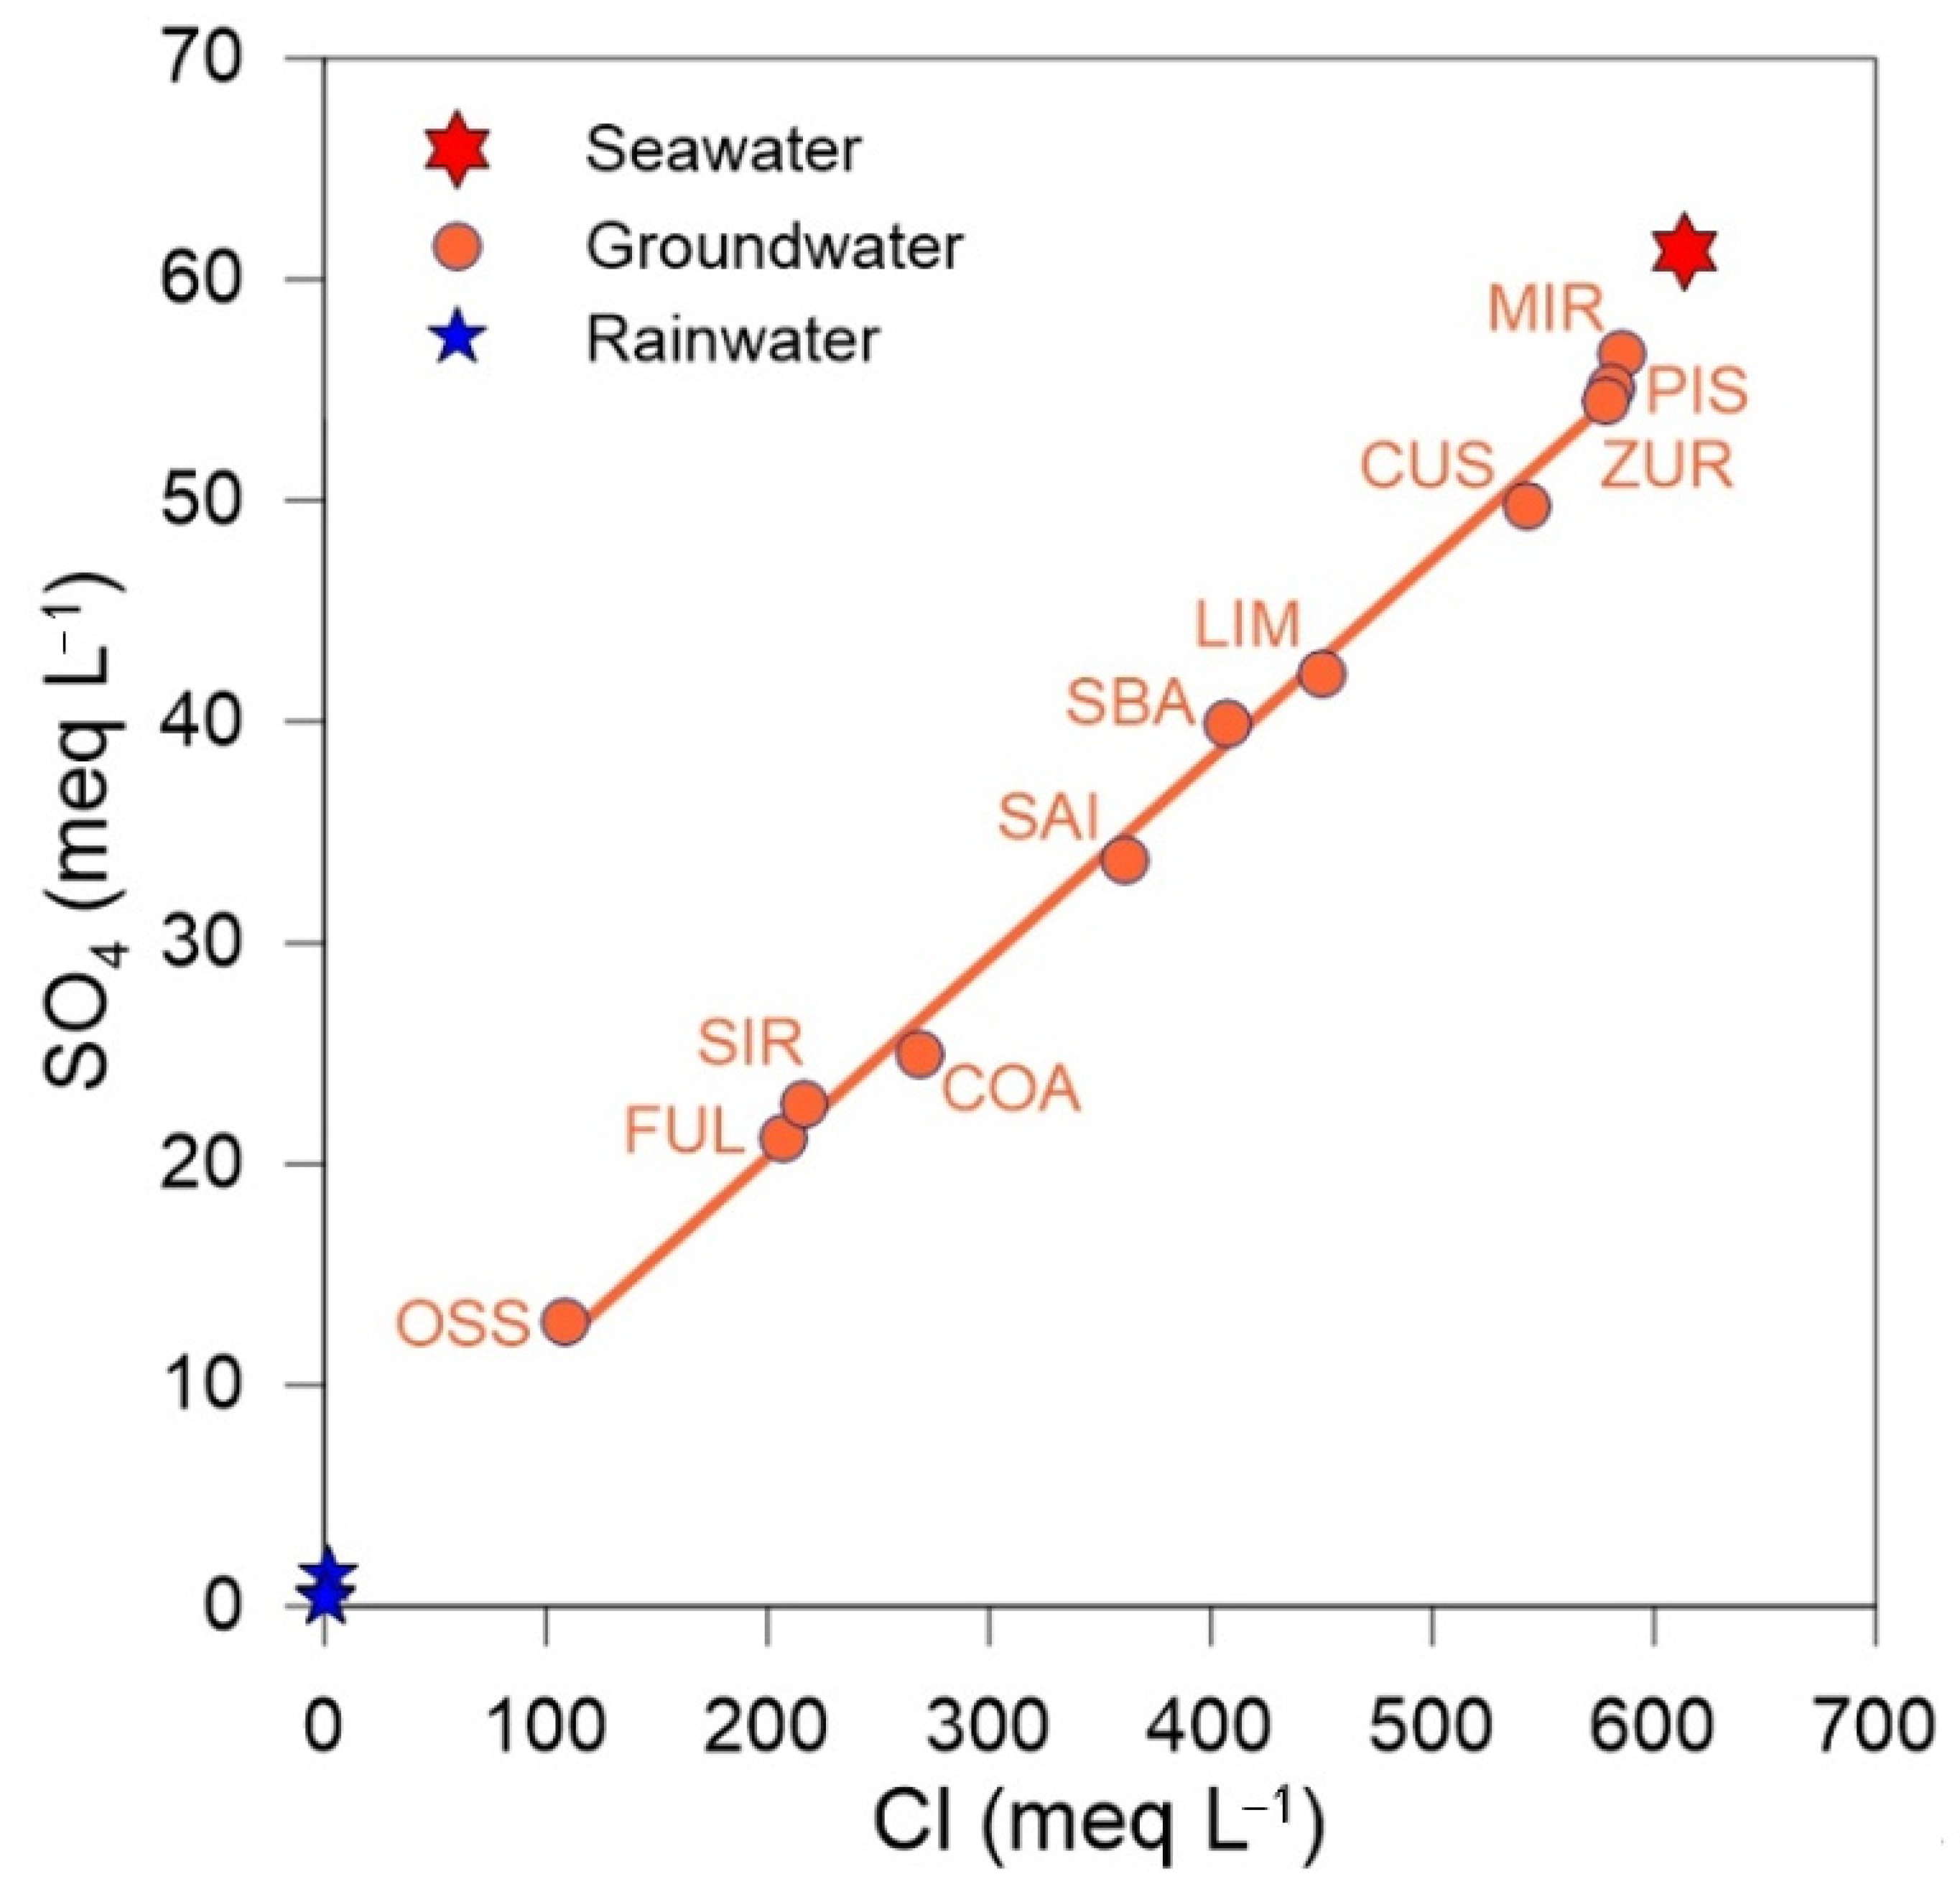
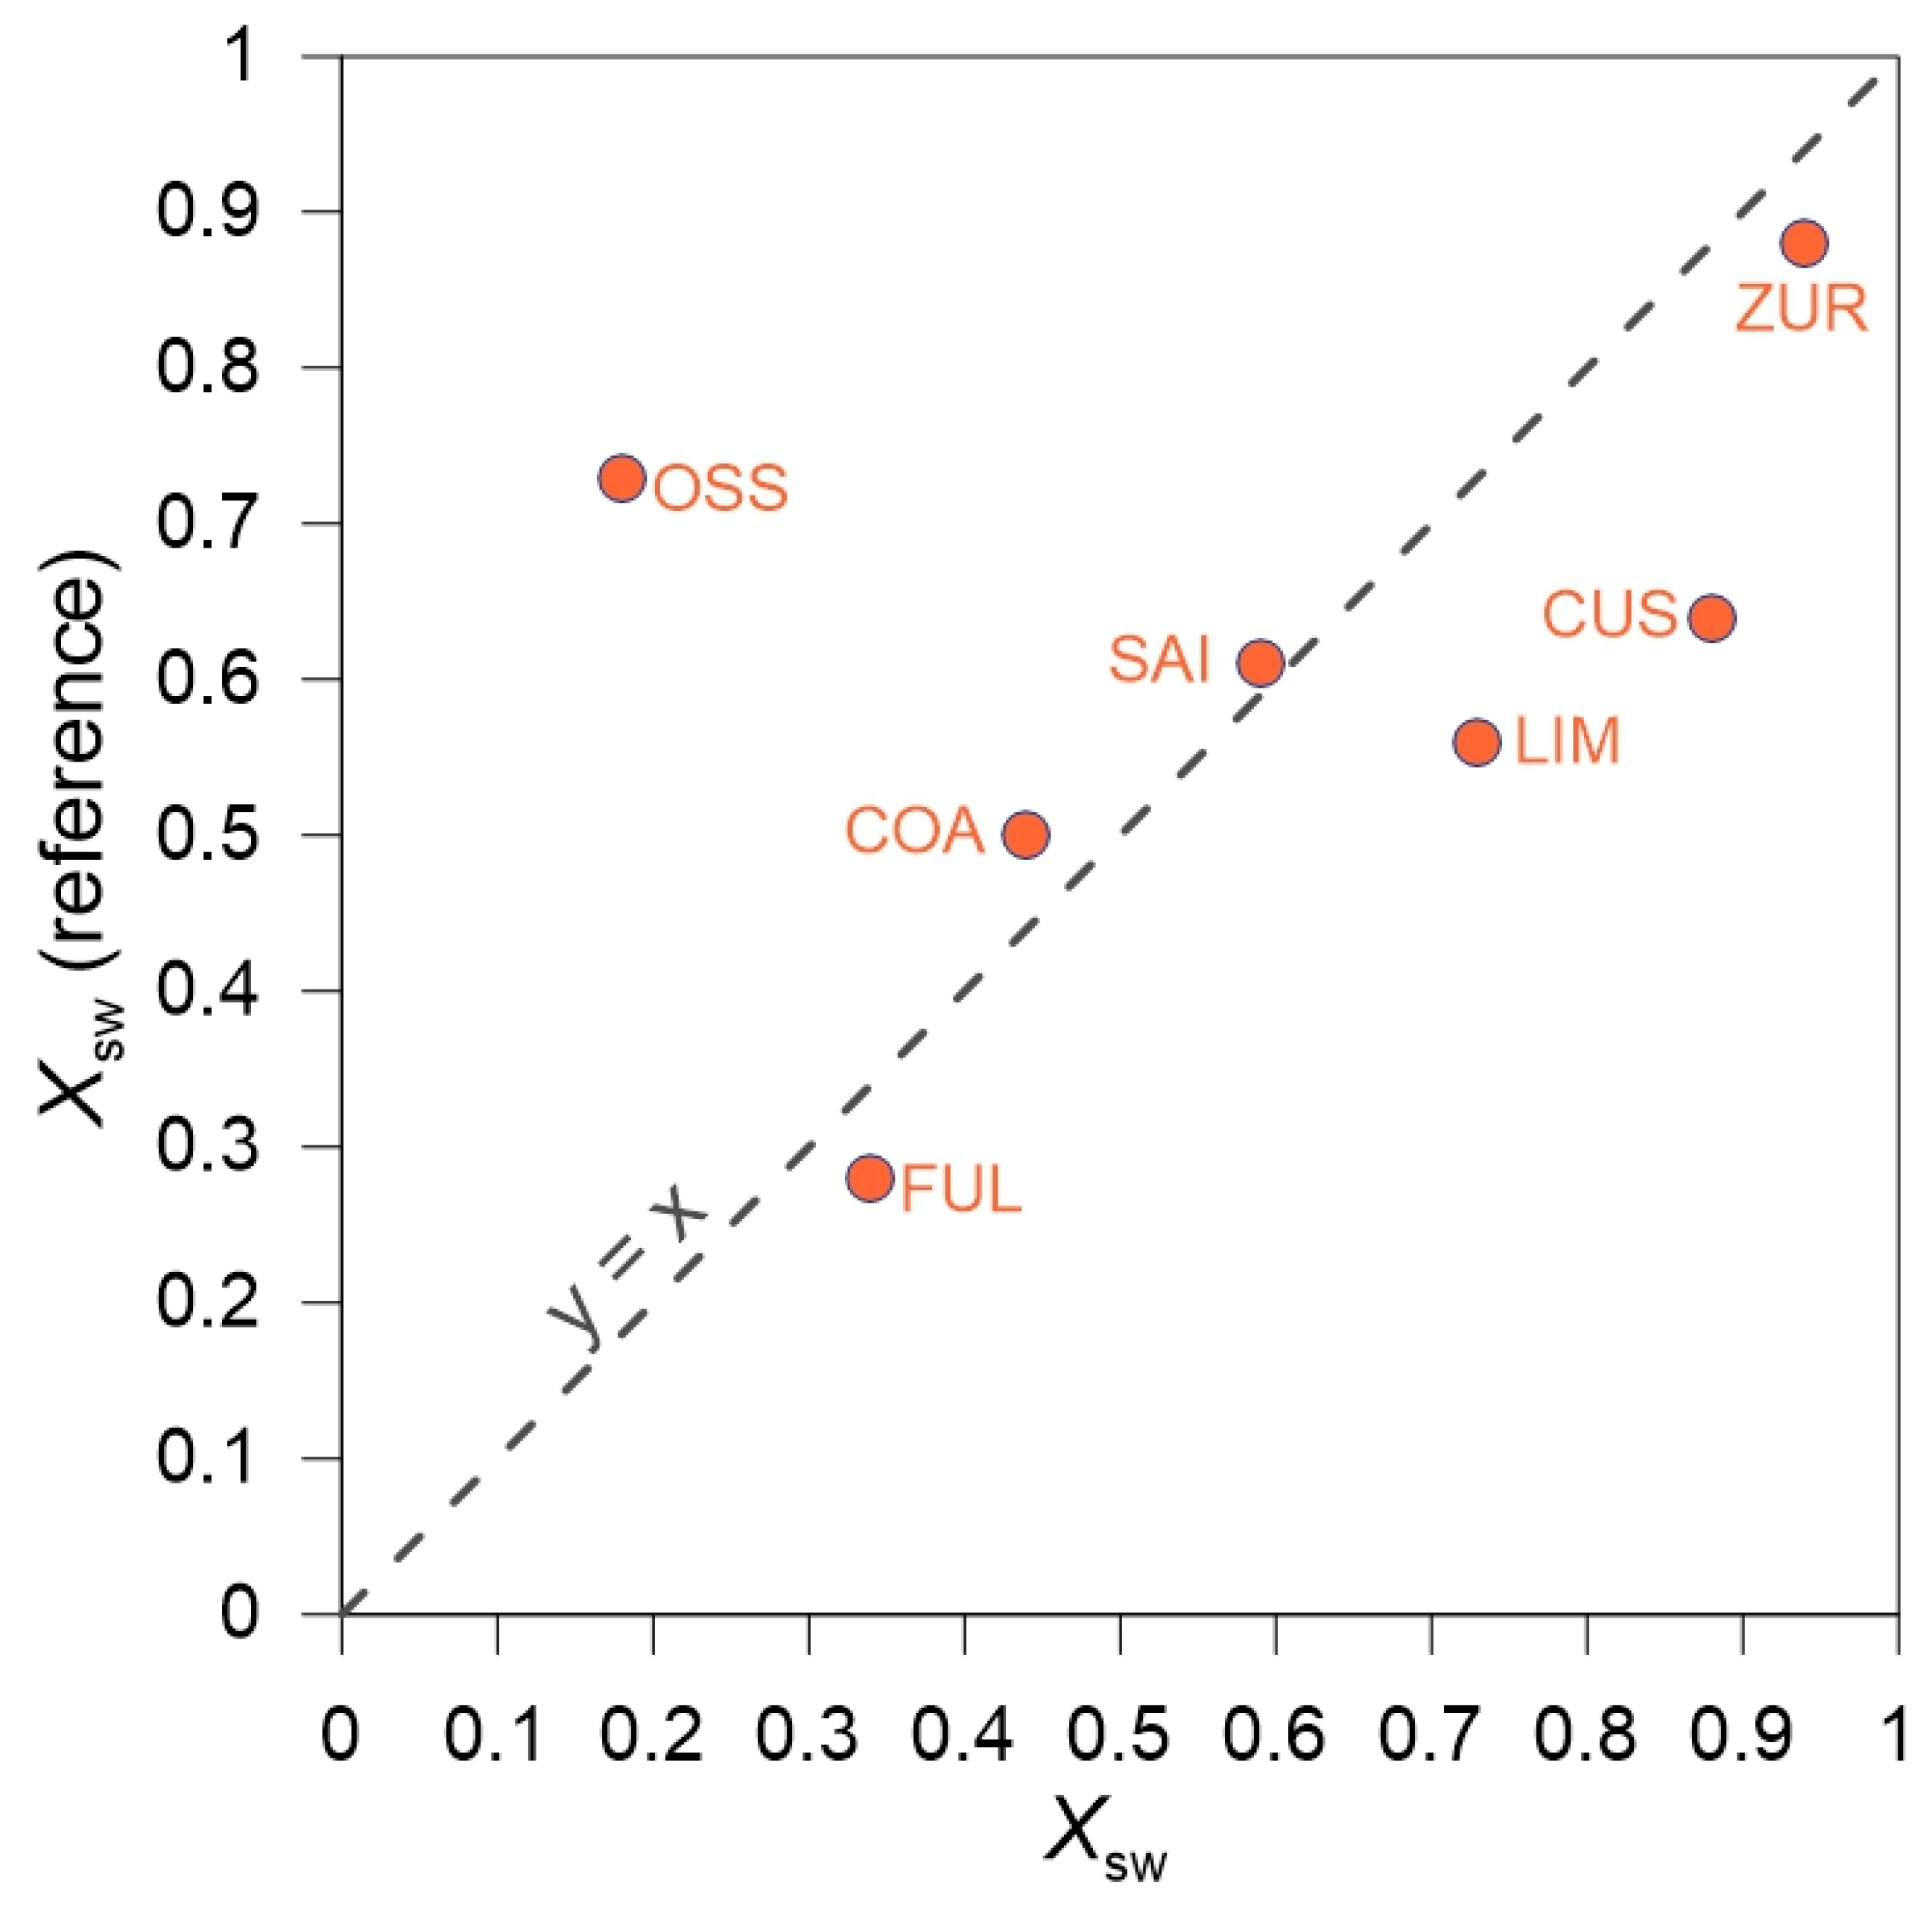
4.2. Geochemical Characterization of Groundwater

Physical and chemical parameters of water collected from 11 thermal wells (Table 2) show that the pH is slightly acidic, in the range between 6.3 (SAI and COA) and 7.2 (MIR). The temperature of the groundwater spans between 22.8 (SIR) and 47 °C (SBA). The total dissolved solids content is comprised from 14,175 (FUL) to 37,535 mg L−1 (MIR).
As evidenced in the Langelier–Ludwig diagram (Figure 5), thermal waters lie in the chloride-sulphate alkaline quadrant, along the mixing curve between the meteoric [24] and local seawater [11] compositions.
Therefore, the groundwater of the coastal aquifer should be the result of a slight dilution of seawater due to the infiltration of meteoric water, as already evidenced in [11].
The mixing between the two components is further supported by the Cl vs. SO4 binary diagram (Figure 6), where the samples are well-aligned along the straight line connecting the meteoric and seawater compositions.
A simple mass balance can be performed in order to quantitatively determine the different contribution of these two components (seawater and infiltrating rain). The equation for the mass balance is:
X SW [ Cl ] SW + ( 1 X SW ) × [ Cl ] RAIN = [ Cl ] SAMPLE
where XSW and XRAIN are the fractions of seawater and the meteoric contribution, and ClSW and ClRAIN are the Cl content of the two endmembers.
Equation (1) is first solved for the calculation of XSW and XRAIN, successively calculated as:
X RAIN = 1 X SW
Results are reported in Table 3; for calculations, we used for references [11,24] and our data.
The fraction of seawater calculated from our data is dominant in most of the wells, showing percentages from 59 to 94%, with the exceptions of OSS (18%), FUL (34%), SIR (35%), and COA (44%). Comparing these data with those from the previous study [11], some differences are evidenced (Figure 7).
New and reference data are linearly correlated (r = 0.88), but a certain dispersion is noted, with calculated fractions of seawater generally higher in our study than in the literature data; exceptions are COA and particularly OSS. It should be remarked that different sampling methods were adopted for the two datasets. Reference samples were collected using a Niskin-type bottle (static conditions), whereas samples of the present study were taken using a submersible pump plunged at the bottom hole (dynamic conditions). Under dynamic conditions, differences in the hydraulic conductivity of the water bearing levels can lead to different mixing proportions between seawater and meteoric water. Since most of the samples lie below the 1:1 line, we can deduce that the horizontal permeability (toward the sea) is higher than the vertical one. The different behavior of COA, which has a high meteoric contribution, confirms that vertical discontinuities related to an ancient eruptive center (San Vincenzo eruptive cycle) cause the fast migration of meteoric waters toward the base level of the aquifer. It is worth noting that the huge difference observed in OSS implies that the dynamic sampling causes relevant changes in the mixing between the meteoric and marine components, in turn driven by a higher hydraulic conductivity of the meteoric water bearing level with respect to that of the rocks intruded by the seawater wedge. This hypothesis cannot be checked due to the unavailability of boreholes with a known stratigraphic column and expressly equipped for sampling water at different depths without mixing a layered aquifer. This represents a frequent, serious limitation of the geochemical networks for volcanic surveillance. These are frequently based on pre-existing boreholes, the basic information of which is often very lacunose.
The spatial distributions of HCO3, NO3, TDS, and Xsw (Figure 8a–d) give useful information for detailing the relationships among meteoric infiltration, seawater intrusion, and wastewater release. The highest bicarbonate concentrations (Figure 8a) are found in the southern sector of the aquifer (wells SAI, CUS, and FUL), characterized by intense volcanic exhalative activity [25]; the tail of this maximum is centered under the COA well, compatibly with a preferential uprising pathway for volcanic gases (CO2) linked to the San Vincenzo eruptive center.
More complicated is the behavior of the TDS and Xsw distribution (Figure 8c,d), because the salinity of the groundwater is driven by both mixing with seawater and interaction with volcanic gas. The minima below the COA well can be ascribed to the two-way functioning of the vertical discontinuities linked to the San Vincenzo eruptive center, which contemporarily foster the uprising of volcanic gases and the infiltration of meteoric water that dilutes the brackish aquifer. Nitrate concentrations (Figure 8b), increasing from the inland to the coastline, are driven by the release of civil wastewaters after the treatment in septic, Imhoff-type tanks (no sewage networks in Stromboli).
Isotopic data qualitatively confirm the inferences from the chemical model (Figure 9). In the δ18O vs. δD diagram, which includes isotopic values measured in a small spring (LSC) [11] (Figure 1), the points representative of the groundwater are well-aligned, following the mixing between the composition of local rainwater [19] and that of seawater. Lighter isotopes are found in LSC, which shows a composition very similar to that of the rain collected close to the coastline (GNV). Conversely, the heavier isotopes are found in the well, with a chemical composition similar to that of seawater (ZUR, with XSW = 0.94).

4.3. Thermal Regime of Groundwater

Continuous (hourly) groundwater temperature data, acquired in the wells COA, LIM, and SAI for volcanic surveillance purposes, provide useful hydrogeological information. Figure 10 presents these data compared to rainfall heights measured in a meteorological station located in the Stromboli harbor; the time window covers the period of July–October, but in different years due to the lack of contemporary data for all of the sites. The average temperature of the aquifer is close to 40 °C, and its hydrothermal characteristic is driven by the heat transfer from the active magmatic system. One piece of important evidence is the anomalous behavior of the COA well. It shows the highest temperature decreases shortly following rainfalls, but, being that this is the site with the highest depth to water table (73 m at COA, 26 m at LIM, 2 m at SAI), we should expect the opposite behavior. A maximum cooling of 20 °C was observed at COA in September 2019, while events with amplitudes no higher than 2 °C characterized SAI, and no significant variations were recorded at LIM (Figure 10). Conversely, no circadian thermal cycles modulate the COA thermal signal, while these are observable both at LIM and SAI, with the latter showing the highest amplitudes due to the minor depth to water table (only 2 m). The high thermal sensitivity to rainfall infiltration of COA suggests the existence of vertical discontinuities that fast drain the incoming precipitations, confirming that the fractures associated with the San Vincenzo eruptive center play an important role in groundwater circulation, as previously evidenced by chemical data.

5. Implications for Groundwater Resource Management and Volcanic Surveillance

The exploitation of a coastal aquifer in a small, scarcely inhabited island is a potentially good solution, from both the logistic and economic points of view, for ensuring a stable water supply for its population. The minor islands surrounding Sicily are presently supplied with water destined for anthropic uses by transportation from the mainland by tankers and/or by desalinization plants [26]. Both solutions are very costly, both in terms of financial and energetic aspects, and have a very negative ecological impact.
Exploiting a local groundwater body could be an effective energy- and money-sparing alternative, especially for small communities, such as the one of Stromboli Island, composed of 550 stable residents. Two main constraints rule the feasibility of exploiting a groundwater body for human consumption purposes: a constant availability of the resource throughout the year and a water quality compatible with sanitary/alimentary uses. The first condition must be respected by extracting only the renewable water resources, e.g., the volume accumulated yearly by the infiltration of natural precipitations, without impairing the reserves, i.e., the extra volumes accumulated thanks to favorable hydro-structural conditions.
The constant availability of the groundwater resource results from the balance between the resident population (output from the system) and the ratio between the accumulated renewable resources and their recharge driven by the hydrogeological cycle (input to the system). Both resource availability and request are extremely variable in the studied site. Due to the semi-arid climate (see Section 4.1) during the six months (April–September) with no effective infiltration, the coastal aquifer does not receive any recharge; moreover, due to the high touristic vocation of Stromboli, these are the months during which the number of residents grows to the thousands in August [27].
Figure 11 resumes the average monthly groundwater resource availability and water request for Stromboli Island, expressed as m3 d−1. Groundwater availability is calculated by multiplying the monthly effective infiltration (Section 4.1) and the planar area of the surface watershed, while water request is real data based on the volume of water transported monthly from the mainland by tankers [27]. Figure 11 clearly demonstrates that the volume of infiltrating rainfalls during the wet months is up to one order of magnitude higher than the water consumption during the dry, touristic months. If we parallelly consider that the estimated residence time of the aquifer is in the order of years (Section 4.1), the monthly recharge of the coastal aquifer of Stromboli should be compatible with its intense exploitation during the summer touristic season. Another constraint must be respected: the geometrical structure of the aquifer should be able to accumulate a water volume high enough to avoid the intrusion of a seawater wedge during its most intense exploitation. Unfortunately, no data from geophysical surveys or exploratory drillings are available for the Stromboli coastal aquifer, thus, this remains an open question whose answer would be given by future studies.
Regarding the other constraint, i.e., the compatibility of the chemical composition of groundwater for human uses, the European Council Directive 98/83/EC of 3 November 1998 concerns the quality of water intended for human consumption, whose objective is “to protect human health from the adverse effects of any contamination of water intended for human consumption by ensuring that it is wholesome and clean” [28]. In particular, “water intended for human consumption” means “all water in its original state or treatment, intended for drinking, cooking, food preparation or other domestic purposes regardless of its origin and whether it is supplied from a distribution network, from a tanker, or in bottles or containers” [28]. Member States set reference values applicable to water intended for human consumption for microbiological and chemical parameters (Annex 1, Part A and B, respectively) directly related to adverse effects for human health and indicator parameters (Annex 1, Part C) and not directly related to a potentially toxic effect for human health, but indicating modification of water quality.
Chemical and indicator parameters to be monitored include Na+, Cl, SO42−, and NO3, whose limits are set at 200, 250, 250, and 50 mg L−1, respectively. We compared the concentrations measured in the Stromboli aquifer (Table 2) to these reference values: the first three components exceeded by orders of magnitude the quality limits for water intended for human consumption. The sole exception was nitrate, which is always below its limit.
Based on these data, the Stromboli coastal aquifer should be considered potentially suitable for sanitary and alimentary human uses after treatments for reducing the concentrations of the unwanted constituents to below the limits fixed in the European Council Directive 98/83/EC. Cost-effective plants for achieving this result could be based on reverse osmosis desalinization processes, including energy recovery, along with water recovery [26].
Some interesting inferences for optimizing groundwater monitoring protocols for volcanic surveillance can be extracted from our results. Among the wells located in the coastal area of Stromboli, the ones more suitable for the monitoring of volcanic activity are those where the hydrothermal aquifer shows minor disturbances due to shallow sources of chemicals and/or water inputs. Following this criterion, preferential monitoring sites should be located as far as possible from the seashore because: (i) the effect of the intrusion of the seawater wedge is minimized; (ii) the increasing depths to water table works as a filter against fast infiltration of meteoric water and as a thermal insulator, helping to maintain a water thermal regime driven by the volcanic heat source; and (iii) the decreasing number of buildings located uphill reduces the total input of wastewaters contaminating the aquifer. Another condition is required: a 3D permeability distribution that fosters the rise of magmatic/hydrothermal fluids that reduces the shallow contributions.
Conversely, the best sites for the exploitation of the aquifer as a water source for domestic uses should be located in areas where the permeability distribution fosters the circulation of the shallow, meteoric contribution. The exploitation of groundwater seems to be the best solution for improving the independence from external water supply sources. Other solutions, like the collection of surface runoff by dams as adopted at St. Helena Island (off the western coast of Africa, personal communication from an anonymous reviewer), are not feasible at Stromboli. Here, due to the continuous deposition of fresh ash emitted by the active volcanic vents, the surface runoff transports huge amounts of suspended solids that will quickly fill water accumulation basins. In the same way, the construction of undersea waterlines from the mainland is not realistic, because Stromboli is far from the closest coastline (more than 50 km), and the sea bottom is affected by volcanic and seismic activity, which could damage such a facility.
Based on the above theoretical considerations, wells FUL, COA, and LIM should be the most suitable for volcanic monitoring purposes, but with some important differences between COA and LIM. As evidenced in the previous discussion, the main difference between these two wells is the fast reactivity of the former to the infiltration of rainfalls, which causes sudden and huge negative thermal anomalies and a dilution of the aquifer volume intercepted by the well. This behavior has been attributed to the vertical discontinuities (fractures) related to the San Vincenzo eruptive center. The other side of the coin is that these fractures are preferential pathways for the escape of volcanic gases, which are the object of volcanic monitoring. Thus, vertical discontinuities are two-way preferential routes that might generate strong volcanic signals, but, at the same time, amplify the ambient noise. The search for an optimum site for volcanic surveillance is thus the search for the best volcanic signal versus the ambient noise ratio.
An additional and final consideration concerns the need for geochemical volcano monitoring of sampling protocols constant in time, based on boreholes with known stratigraphic data, and expressly equipped for extracting water without mixing multilayered aquifers.

Supplementary Materials

The following are available online at https://www.mdpi.com/2073-4441/13/4/417/s1.

Author Contributions

Conceptualization, P.M.; field surveys, P.M., G.C., M.C., S.I., M.R., and F.V.; hydrogeological data analysis and elaboration, P.M. and G.C.; geochemical data analysis and elaboration, M.C., M.L.C., and S.I.; GIS and mapping, P.M. and G.C.; data curation, P.M. and M.C.; writing—original draft preparation, P.M., M.C., M.L.C., and S.I.; figures preparation, P.M., G.C. and M.C.; writing—review and editing, all authors. All authors have read and agreed to the published version of the manuscript.

Funding

This research was partially funded by the INGV-DPCN (Italian National Institute of Geophysics and Volcanology-Italian National Department for Civil Protection) volcanic surveillance program of Stromboli volcano.

Institutional Review Board Statement

Not applicable.

Informed Consent Statement

Not applicable.

Data Availability Statement

All relevant data are contained in the text, with the exception of Figure 10, whose related data are available online as supplementary material associated to this paper.

Acknowledgments

We wish to thank three anonymous reviewers for their suggestions, which have been helpful in improving the manuscript. G.C. acknowledges support from the program “POR Calabria FSE/FESR 2014/2020”.

Conflicts of Interest

The authors declare no conflict of interest.

References

  1. Playford, P.E. Guidebook to the Geology of Rottnest Island; Geological Society of Australia (W.A. Division) and Geological Survey of Western Australia: Perth, Australia, 1988.
  2. Cruz, J.V. Groundwater and volcanoes: Examples from the Azores archipelago. Environ. Geol. 2003, 44, 343–355. [Google Scholar] [CrossRef]
  3. Marrero, R.; Salazar, P.; Hernández, P.A.; Pérez, N.M.; López, D. Hydrogeochemical monitoring for volcanic surveillance at Tenerife, Canary Islands. Geophys. Res. Abs. 2005, 7, 09928. [Google Scholar]
  4. Dongarrá, G.; Favara, R.; Hauser, S.; Capasso, G. Characteristics of the variations in the water chemistry of some wells from Vulcano Island. Rend. Soc. It. Min. Petr. 1988, 43, 1123–1131. [Google Scholar]
  5. Madonia, P.; Capasso, G.; Favara, R.; Francofonte, S.; Tommasi, P. Spatial Distribution of Field Physico-Chemical Parameters in the Vulcano Island (Italy) Coastal Aquifer: Volcanological and Hydrogeological Implications. Water 2015, 7, 3206–3224. [Google Scholar] [CrossRef] [Green Version]
  6. Rosi, M.; Bertagnini, A.; Landi, P. Onset of the persistent activity at Stromboli volcano (Italy). Bull. Volcanol. 2000, 62, 294–300. [Google Scholar] [CrossRef]
  7. Carapezza, M.L.; Federico, C. The contribution of fluid geochemistry to the volcano monitoring of Stromboli. J. Volcanol. Geotherm. Res. 2000, 95, 227–245. [Google Scholar] [CrossRef]
  8. Carapezza, M.L.; Inguaggiato, S. Interaction between thermal waters and CO2-rich fluids at Stromboli. In Proceedings of the Tenth International Symposium on Water-Rock Interaction, Villasimius, Italy, 10–15 July 2001; Cidu, R., Ed.; A. Balkema: Amsterdam, The Netherlands, 2001; Volume 2, pp. 791–794. [Google Scholar]
  9. Capasso, G.; Carapezza, M.L.; Federico, C.; Inguaggiato, S.; Rizzo, A. Geochemical monitoring of the 2002–2003 eruption at Stromboli volcano (Italy): Precursory changes in the carbon and helium isotopic composition of fumarole gases and thermal water. Bull. Volcanol. 2005. [Google Scholar] [CrossRef]
  10. Federico, C.; Brusca, L.; Carapezza, M.L.; Cigolini, C.; Inguaggiato, S.; Rizzo, A.L.; Rouwet, D. Geochemical prediction of the 2002–2003 Stromboli eruption from variations in CO2 and Rn emission and in Helium and Carbon isotopes. In The Stromboli Volcano: An Integrated Study of the 2002–2003 Eruption; Calvari, S., Inguaggiato, S., Puglisi, G., Ripepe, M., Rosi, M., Eds.; American Geophysical Union Geophysical Monograph Series; American Geophysical Union: Washington, DC, USA, 2008; Volume 182, pp. 117–128. [Google Scholar]
  11. Grassa, F.; Inguaggiato, S.; Liotta, M. Fluid geochemistry of Stromboli. In The Stromboli Volcano: An integrated Study of the 2002–2003 Eruption; Calvari, S., Inguaggiato, S., Puglisi, G., Ripepe, M., Rosi, M., Eds.; American Geophysical Union Geophysical Monograph Series; American Geophysical Union: Washington, DC, USA, 2008; Volume 182, pp. 49–63. [Google Scholar]
  12. Rizzo, A.L.; Grassa, F.; Inguaggiato, S.; Liotta, M.; Longo, M.; Madonia, P.; Brusca, L.; Capasso, G.; Morici, S.; Rouwet, D.; et al. Geochemical evaluation of observed changes in volcanic activity during the 2007 eruption at Stromboli (Italy). J. Volcanol. Geotherm. Res. 2009, 182, 246–254. [Google Scholar] [CrossRef]
  13. Hornig-Kjarsgaard, I.; Keller, J.; Koberski, U.; Stadlbauer, E.; Francalanci, L.; Lenhart, R. Geology, stratigraphy and volcanological evolution of the Island of Stromboli, Aeolian Arc, Italy. Acta Volcanol. 1993, 3, 21–68. [Google Scholar]
  14. Tibaldi, A. Multiple sector collapses at Stromboli volcano, Italy: How they work. Bull. Volcanol. 2001, 63, 112–125. [Google Scholar] [CrossRef]
  15. Patrick, M.; Harris, A.J.L.; Ripepe, M.; Dehn, J.; Rothary, D.A.; Calvari, S. Strombolian explosive styles and source conditions: Insights from thermal (FLIR) video. Bull. Volcanol. 2007, 69, 769–784. [Google Scholar] [CrossRef]
  16. Houghton, B.F.; Swanson, D.A.; Rausch, J.; Carey, R.J.; Fagents, S.A.; Orr, T.R. Pushing the Volcanic Explosivity Index to its limit and beyond: Constraints from exceptionally weak explosive eruptions at Kīlauea in 2008. Geology 2013, 41, 627–630. [Google Scholar] [CrossRef] [Green Version]
  17. Barberi, F.; Rosi, M.; Sodi, A. Volcanic hazard assessment at Stromboli based on review of historical data. Acta Vulcanol. 1993, 3, 173–187. [Google Scholar]
  18. Rosi, M.; Pistolesi, M.; Bertagnini, A.; Landi, P.; Pompilio, M.; Di Roberto, A. Stromboli volcano, Aeolian Islands (Italy): Present eruptive activity and hazards. Geol. Soc. Lond. Mem. 2013, 37, 473–490. [Google Scholar] [CrossRef]
  19. Liotta, M.; Brusca, L.; Grassa, F.; Inguaggiato, S.; Longo, M.; Madonia, P. Geochemistry of rainfall at Stromboli volcano (Aeolian Islands): Isotopic composition and plume-rain interaction. Geochem. Geophys. Geosyst. 2006, 7Q07006. [Google Scholar] [CrossRef]
  20. Regione Siciliana. Climatologia Della Sicilia; Regione Siciliana, Ass. Agricoltura e Foreste, Gruppo IV, Unità di Agrometeorologia: Palermo, Italy, 1998; p. 69. (In Italian) [Google Scholar]
  21. Servizio Informativo Agrometeorologico Siciliano. Available online: www.sias.regione.sicilia.it (accessed on 28 December 2020).
  22. Lucchi, F.; Keller, J.; Francalanci, L.; Tranne, C.A. Geological map of Stromboli. In The Aeolian Islands Volcanoes; Lucchi, F., Peccerillo, A., Keller, J., Tranne, C.A., Rossi, P.L., Eds.; Geological Society Memoirs: London, UK, 2013; Volume 37, pp. 181–349. [Google Scholar]
  23. Thornthwaite, C.W. An approach toward a Rational Classification of Climate. Geograph. Rev. 1948, 38, 55–94. [Google Scholar] [CrossRef]
  24. Cangemi, M.; Madonia, M.; Favara, R. Chemical characterisation of rainwater at Stromboli Island (Italy): The effect of post-depositional processe. J. Volcanol. Geotherm. Res. 2017, 335, 82–91. [Google Scholar] [CrossRef]
  25. Inguaggiato, S.; Vita, F.; Cangemi, M.; Mazot, A.; Sollami, A.; Calderone, L.; Morici, S.; Jacome Paz, M.P. Stromboli volcanic activity variations inferred from observations of fluid geochemistry: 16 years of continuous monitoring of soil CO2 fluxes (2000–2015). Chem. Geol. 2017, 469, 69–84. [Google Scholar] [CrossRef]
  26. Gude, V.G. Energy consumption and recovery in reverse osmosis. Desalin. Water Treat. 2011, 36, 239–260. [Google Scholar] [CrossRef]
  27. Regione Siciliana. Le Isole Minori della Sicilia, Report, Analisi e Valutazione dei Flussi Turistici. Available online: https://www.hospitality-news.it/images/Documento_Isole%20Minori.pdf (accessed on 28 December 2020). (In Italian).
  28. European Council Directive 98/83/EC of 3 November 1998 on the Quality Intended for Human Consumption. Available online: https://eur-lex.europa.eu/legal-content/FR/TXT/PDF/?uri=CELEX:31998L0083&from=IT (accessed on 28 December 2020).
Figure 1. Map of Stromboli Island showing the study area (shaded polygon) and the location of water wells (circles), a spring (diamond), and rain collectors (triangles).
Water 13 00417 g001
Figure 2. Detailed map of the studied area reporting the location of water wells and rock samples for the hydraulic conductivity determinations, main hydrogeological divide, limits of the hydrogeological units, and isopiestic lines (contour interval 0.2 m a.s.l.); elevations are in m a.s.l. The dashed line A–B indicates the trace of the hydrogeological section later discussed.
Water 13 00417 g002
Figure 3. Hydrological balance. Monthly variation of effective rainfall amount (a), air temperature (b), and rainfall amount (c) at Stromboli.
Water 13 00417 g003
Figure 4. Schematic hydrogeological section (trace reported in Figure 2) modified after [14].
Water 13 00417 g004
Figure 5. Plot of the average chemical composition of Stromboli groundwater in the Langelier–Ludwig diagram.
Water 13 00417 g005
Figure 6. Cl vs. SO4 diagram reporting the values for groundwater, rainwater (two sampling sites) [24], and seawater [11] of Stromboli Island.
Water 13 00417 g006
Figure 7. The fraction of seawater (Xsw) calculated using the Cl concentration of samples taken under dynamic conditions (this study) plotted versus the fraction calculated from samples taken under static conditions [11].
Water 13 00417 g007
Figure 8. Concentration maps of (a) HCO3, (b) NO3, (c) TDS, and (d) the fraction of seawate r XSW.
Water 13 00417 g008
Figure 9. δ18O vs. δD diagram reporting the isotopic composition of the groundwater [11], rainwater [19], and seawater [11] of Stromboli Island. The blue line is the best fit of the rain compositions, and the orange one is the best fit of the groundwater samples.
Water 13 00417 g009
Figure 10. Hourly measures of the groundwater temperature acquired at wells LIM (2017), COA, and SAI (2019) compared with rainfall (mm d−1). The time window covers the period of July–October of different years due to the lack of simultaneous data for the three wells.
Water 13 00417 g010
Figure 11. Comparison between the monthly average values of groundwater availability and water consumption [24].
Water 13 00417 g011
Table 1. Values of hydraulic conductivity under saturated conditions (Ksat), normalized at 10 °C, measured in Stromboli samples (Figure 2 for locations).
IdKsat (m s−1)Ksat (mm h−1)Lithology
A4.36 × 10−41.57 × 10³Lapilli tuff
B1.00 × 10−53.60 × 101Colluvial deposit
C4.16 × 10−31.50 × 10⁴Colluvial deposit
D2.28 × 10−48.21 × 10²Seashore deposit
E5.23 × 10−51.88 × 10²Seashore deposit
F2.74 × 10−59.86 × 101Colluvial deposit
G5.18 × 10−51.86 × 10²Colluvial deposit
H5.29 × 10−51.90 × 10²Lapilli tuff
Table 2. Water table elevation (WTE, m a.s.l.) and physical and chemical parameters of the groundwater: pH, temperature (°C), TDS (sum of ions, mg L−1), and major ions (mg L−1).
WellCOACUSFULLIMMIROSSPISSAISBASIRZUR
No.369541358237105854
WTE0.860.410.530.57N.D.N.D.N.D.0.23N.D.N.D.0.48
pH6.36.86.46.87.26.97.16.37.07.06.8
T41.941.841.740.131.536.333.740.14722.836.8
TDS17,61334,77814,17529,19737,535804337,04423,50223,91314,62437,042
Na506210,2563920850711,376197910,89968607771436911,083
K317620311547512220682436517215576
Mg65012225401093137033412748439995371303
Ca424699360541525301605531507220638
Cl950519,219732315,97520,732384620,58712,81214,460767720,513
SO423984777202940495439123152853237383021755237
HCO3455341703490257729339466401483303
NO31333204419172N.D.368
Physical and chemical parameters refer to the average values of different field campaigns carried out in the period 2008–2015; (No. = number of samples); N.D. = not determined.
Table 3. Fractions of seawater (XSW) and rainwater (XRAIN) calculated using references [11,24] and new data of Cl concentrations.
WellXSW [11]XRAIN [11]XSWXRAIN
COA0.500.500.440.56
CUS0.640.360.880.12
FUL0.280.720.340.66
LIM0.560.440.730.27
MIR 0.950.05
OSS0.730.270.180.82
PIS 0.940.06
SAI0.610.390.590.41
SBA 0.660.34
SIR 0.350.65
ZUR0.890.110.940.06
Publisher’s Note: MDPI stays neutral with regard to jurisdictional claims in published maps and institutional affiliations.

