
Campus Study of the Impact of Ultra-Low Flush Toilets on Sewerage Networks and Water Usage


1
Centre for Water Systems, College of Engineering, Mathematics and Physical Sciences, University of Exeter, Exeter EX4 4QF, UK
2
School of Civil Engineering, University College Dublin, Belfield, Dublin 4, Ireland
3
Propelair Limited Unit 1, West Point, Durham Rd., Laindon, Basildon SS15 6PH, UK
*
Author to whom correspondence should be addressed.
Water 2021, 13(4), 419; https://doi.org/10.3390/w13040419
Submission received: 31 December 2020
/
Revised: 22 January 2021
/
Accepted: 29 January 2021
/
Published: 5 February 2021
(This article belongs to the Special Issue Water Demand Management)
Abstract
:Water demand management often focuses on quantifying the benefits of water efficiency rather than the potential impact of reduced flows on the sewer network. This study assessed the impact of a high-density deployment of ultra-low flush toilets (ULFT). A pre-installation washroom survey was carried out in July 2018. Water demand and sewer network condition were assessed ahead of the installation of 119 ULFTs and a real-time monitoring system across seven buildings on the University of Exeter campus. ULFTs were flushed 257,925 times in 177 days saving an estimated 2287 m3 per annum (compared to traditional 6 litre WCs). The annual cost saving of this reduction is approximately £12,580/annum, assuming a volumetric cost of £5.50/m3 of water. Mean discharge to the sewer network reduced by 6 m3/day. In the six-month period, 95 maintenance issues were reported, equating to 1 in 2700 flushes (0.037%). However, the frequency of incidents decreased after an initial commissioning period. There is no evidence, from blockage reports or photographs of manhole flow conditions, that the risk of blockage in the sewer network increased as a result of the ULFT installation programme.
1. Introduction
Research into novel water saving technologies has a tendency to explore positive outcomes that might enable beneficial progress in the field [1]. Research that targets the potential barriers to uptake is equally important and less likely to be an attractive point of focus from a commercial perspective [2,3,4]. The body of research into the growing deployment of water demand management technologies has focused on the benefits in terms of water efficiency. The number of published papers on low flow toilets per year has increased almost linearly in past two decades from two papers in 2000 to 32 papers in 2020 [5]. However, few studies have assessed potential impacts associated with reducing flows in sewer networks. Those that are available typically deploy modelling approaches rather than adopting an empirical approach [6,7,8]. Alongside reduced water consumption, the benefits of deploying water demand management technologies on the sewer network have centred around a reduced need to enlarge existing sewers or construct new sewers; and a reduced energy consumption associated with sewage pumping [9]. However, the reported negative consequences of such installations have focused on the possibility of increased blockage rates as a result of reduced sewer flows [7,8] and increased sedimentation followed by the formation and release of malodours [6]. Hence, the impact of reduced wastewater flows on the sewer network is still not fully understood [10]. The relationship between wastewater flows and sewer network blockages is complex and there are a variety of factors (such as poor drain condition or disposal of inappropriate materials into the network) that can compound these problems and blur the distinction between cause and effect [10].
Dual flush toilets have the potential to reduce water demand by ensuring larger flush volumes are used only when necessary. Meanwhile, ULFTs do away with the need to use water as the mechanism to clear the pan altogether. The Propelair® ULFT (Basildon, UK) uses only enough water to rinse the pan and refill the water trap within the U-bend. The contents of the toilet pan are mobilized by a high-pressure release of air, which (with the lid sealed) forces the contents through the U-bend and into the downstream sewer pipework. Recognition that such devices could reduce flows in sewers is beginning to gather the attention of researchers. Work conducted alongside Wessex Water, a UK wastewater service provider, explored the risk of reduced sewer velocities in future scenarios wherein significant water demand reductions are achieved [11]. The potential global application of ULFTs was recognized in research done in 2008, yet the Propelair® product remains the sole provider of ULFT technology at the time of writing [12]. The Propelair® toilet investigated in this study describes its flush cycle as follows [13]:
- Propelair® has a two-section cistern; one for air and one for water.
- Before Flushing, the lid is closed to form a seal.
- When the flush sensor is activated water enters the pan to wash it, followed by air from the unique patented pump. The air cannot escape due to the sealed lid. This pushes out the entire contents of the pan to give a powerful, reliable flush.
- The remaining water fills the water trap.
- The flush is completed in 3 s with the toilet ready to be re-flushed in 20–30 s (subject to water supply pressure).
More than a decade after the first ultra-low flow toilets (ULFTs) were deployed and tested [14,15], Propelair’s® delivery teams reported continued perception amongst facilities managers that the pursuit of lower water demand appliances in washrooms (e.g., taps, urinals and toilets) can have a negative impact on the downstream drainage performance [16]. Increased blockage was cited as a potential disbenefit, wherein external contractors would need to clear any blockage, potentially offsetting the benefits of reduced water bills. Investigating these impacts and seeking evidence pertaining to drainage performance at a large-scale installation was therefore a key part of the study.
At project inception, the strategic project goal was to install and monitor a large number (>100) of ULFTs [17]. A key feature was to integrate these assets within a retrofit environment, in locations where the nature and age of existing drainage assets was unlikely to be of a consistently high standard and was. This was deemed to be representative of future locations where ULFTs could be deployed. The underlying objective was to replace existing toilets in a concentrated zone within the campus and monitor the condition of the drainage systems downstream from the installations. Although previous studies have raised concerns [6,7,8,9] about the impact of water demand management technologies on downstream infrastructure, it has been questioned how substantial this may be, since many sewers are operated at flows that are close to their design capacity [6]. The objective was therefore to explore the hypothesis that large-scale deployments of the ULFT do not reduce the performance in downstream drainage systems. It was recognized in this living laboratory study that the setting and environs could present factors that influence the function of the downstream sewer network. For example, the case study site is located in a region with approximately 800 mm of rainfall per annum [18]; much of the site is on a steep catchment (albeit some pipes were known to be at very shallow gradients below ground); and many drainage assets are over 50 years old. In addition to exploring the nature of the sewer network and instigating surveys and monitoring visits for the drainage system; the water demand of the new toilets and associated potable water demands were monitored at high resolution, to link any observed impacts in the drainage system back to known flows entering the sewer network.
2. Materials and Methods
2.1. Study Location and Drainage Infrastrcuture
In collaboration with the University of Exeter (UoE) Centre for Water Systems and Estates Department, Propelair® were engaged to execute a large-scale deployment of their innovative ULFTs on the UoE’s Streatham Campus. This trial deployment formed part of a Horizon 2020 project (Grant agreement ID: 778742) secured to support the continued development and wider deployment of the Propelair® ULFT technologies [16]. The trial at UoE’s Streatham Campus was designed to provide a means of both qualitatively and quantitatively investigating the extent to which high-density deployments of ULFTs—with a designed flush volume of 1.5 L—can reduce water demand and affect downstream drainage infrastructure.
The study took place across seven buildings on the University of Exeter’s Streatham Campus as part of a Horizon 2020 project [17]. The buildings included were: Amory Building; Harrison Building; Innovation Building 1; Innovation Building 2; Kay Building; Laver Building and Streatham Court. Information on building use, occupancy and number of male/female toilets monitored is provided in [19].
The sewer network within the study area is owned and maintained privately by the UoE. Flows leave each of trial buildings and are ultimately discharged into the South West Water (SWW) maintained sewer at the entrance to the campus near Streatham Farm. All of the buildings are located on a hillside apart from the lowest one, Streatham Court, which is linked into the sewer network by a series of shallow gradient sewers. Wastewater leaving the campus flows under gravity across to the eastern side of Exeter where they are treated at SWW’s Countess Wear wastewater treatment works before discharging into the Exe Estuary.
2.2. Stakeholder Engagement and Pre-Installation Survey
Securing the support of key stakeholders within the UoE was key to ensure operatives and cleaning teams were prepared for the new WCs [17]. This was achieved through a series of detailed washroom surveys and workshops with facilities, estates and building managers. Propelair® and the project team facilitated stakeholder workshops with key affected staff; wrote and facilitated a stakeholder communications strategy; undertook a comprehensive survey of washrooms; and held a risk-assessment workshop with the UoE estates team.
During initial sewer network surveys in March 2018, closed-circuit television (CCTV) survey data was provided by UoE Estates Team and reviewed to identify existing faults and assess the existing condition of the sewers prior to the installation of the ULFTs. Following this, a survey was conducted between 27 June 2018 and 8 July 2018 to establish the total number of toilets within the central zone of Streatham campus. During this scoping phase, 55 buildings and 668 toilets were surveyed, with a shortlist of seven buildings selected for monitoring and ULFT upgrades. With multiple sewers discharging from the campus, the seven buildings were selected based on their connection to a single outlet from the campus. Hence, a shortlist of toilets for replacement was identified, maximizing the scale of the installation in a concentrated zone of the campus, with interlinked drainage networks. Successful implementation of the pilots and ultimate roll out of the project could not have been achieved without a detailed phase of engagement to ensure risks were identified and managed. A roadmap was set out which included a mini-pilot of three ULFTs. These systems were installed in a maintenance block to gather feedback from users and maintenance staff before campus managers recommended a roll-out for the wider installation programme. This step-wise approach enabled on-site training for campus staff who would take on ownership of maintenance tasks when the project commenced. In September 2018 authorisation to implement the project was secured from UoE’s Capital Investment Group and the installation phase was commenced.
2.3. Installation of ULFTs
Installation of ULFTs on Streatham Campus was conducted between November 2018 and March 2019. This was completed by Propelair’s® in-house installation team with stakeholder communications provided regularly to affected building users to ensure smooth project delivery. Almost all (95%) installation work was completed during overnight periods, to prevent daytime closure of toilet blocks and minimize disruption for campus users. In total, 119 toilets were installed in 38 washrooms across 7 buildings. Only standard male and female washrooms were converted and monitored. Disabled washrooms were not altered or monitored.
2.4. Monitoring
2.4.1. Monitoring Strategy
In late 2018, a monitoring strategy was developed for the project. Initially, flow monitoring in sewers was considered, but the scale of this was not achievable within the available budget. A small set of loggers could have been deployed, but relying on a narrow set of installations to assess issues across a drainage system with a wide spatial area could have been unrepresentative of the overall sewer network. As such, periodic CCTV and lift-and-look surveys were used to assess the condition of the drainage network downstream of each building whilst capturing real-time supply-side flow information and toilet usage data. This strategy was proposed to fulfil the goal and objectives of the project in a parsimonious and cost-effective way.
The monitoring phase of the trial, including real-time ULFT flush monitoring, was commenced in March 2019. The ULFTs were electrically connected via a mains power connection. With mains power supplies available behind each ULFT, unlike typical water metering studies, the team were unconstrained by the need to operate monitoring systems using a battery. Each washroom was fitted with a suite of sensors and a datalogging and communications hub providing both real-time data feeds and local backups. The washrooms and data logging systems in the network were issued identification codes to aid in data handling and analysis. The real-time supply-side flow and toilet usage monitoring, often referred to during the project as “flush and flow monitoring” consisted of supply-side water flow metering at the washroom level in addition to flush cycle monitoring of each ULFT. The real-time monitoring network was installed in two formats. Some buildings included a full range of flow sensors and flush counters, while others were limited to flush counters only. The real-time monitoring system was commissioned on 7 March 2019 and the wider project data collection was funded for an initial 12-month duration.
2.4.2. Flush and Flow Monitoring
The Harrison Building, as one of the most highly trafficked buildings in the study, received a more extensive monitoring system than the other 6 buildings (Table 1). Potable water supply in the washroom was monitored using digital and analogue flow meters such that the supplies to different components (toilets, wash basins and where present, urinals) could, as far as practical, be differentiated.
This was achieved using a monitoring scheme with three sensor types: (i) Flush counters, (ii) flow sensors and (iii) volumetric flow meters. All water meters met the UK WRAS approval requirements while the flush counting sensors were added to each cistern using a vertically mounted nylon float switch. Data was passed to a bespoke monitoring platform in each washroom which could accommodate up to 12 channels (e.g., 12 flush counters or flow meters). These were accessed via WiFi, and data was pushed to a server for analysis and processing. Digital flush counters make use of a float switch which is mounted in the cistern of each toilet to record the number of flushes completed. As the flush volume is known, the water consumption can be extrapolated from the flush count. Digital turbine flow sensors were fitted at branches in the water supply plumbing, to isolate flow information for key assets in washrooms (e.g., urinals vs. toilets). These sensors were operated with the standard factory calibration. This calibration was validated using other sensors in the trial and building level water meters. Finally, volumetric flow meters were installed in each washroom in the Harrison Building to measure the total volume of water feeding the ULFTs. This was not connected to the real-time monitoring system and was read manually to benchmark the flush data. This provided validation and calibration for the real-time flow data, extrapolated from flush counts. Volumetric meters provide highly accurate readings, but the need to retrofit these systems means their installation is not always feasible within the intended configuration. For example, a meter may need to be installed near other pipe fittings, without suitable straight runs of pipework upstream. The equipment cost of the monitoring technologies deployed across the campus was in the region of £500–1000/washroom.
2.4.3. Flush-Only Monitoring
In the six other buildings—Amory, Innovation 1 and 2, Laver, Kay and Streatham Court—a simpler monitoring regime was adopted based on a single sensor type. This involved using digital flush counters only, i.e., a float switch mounted in the cistern of each toilet to record the number of flushes completed. The float switch was connected to a sensor management and data logging platform. This solution minimised the plumbing and hardware costs associated while still capturing real-time water demand data at each toilet. The number of flush counters per building is shown in Table 1.
2.4.4. Sewer Network Monitoring
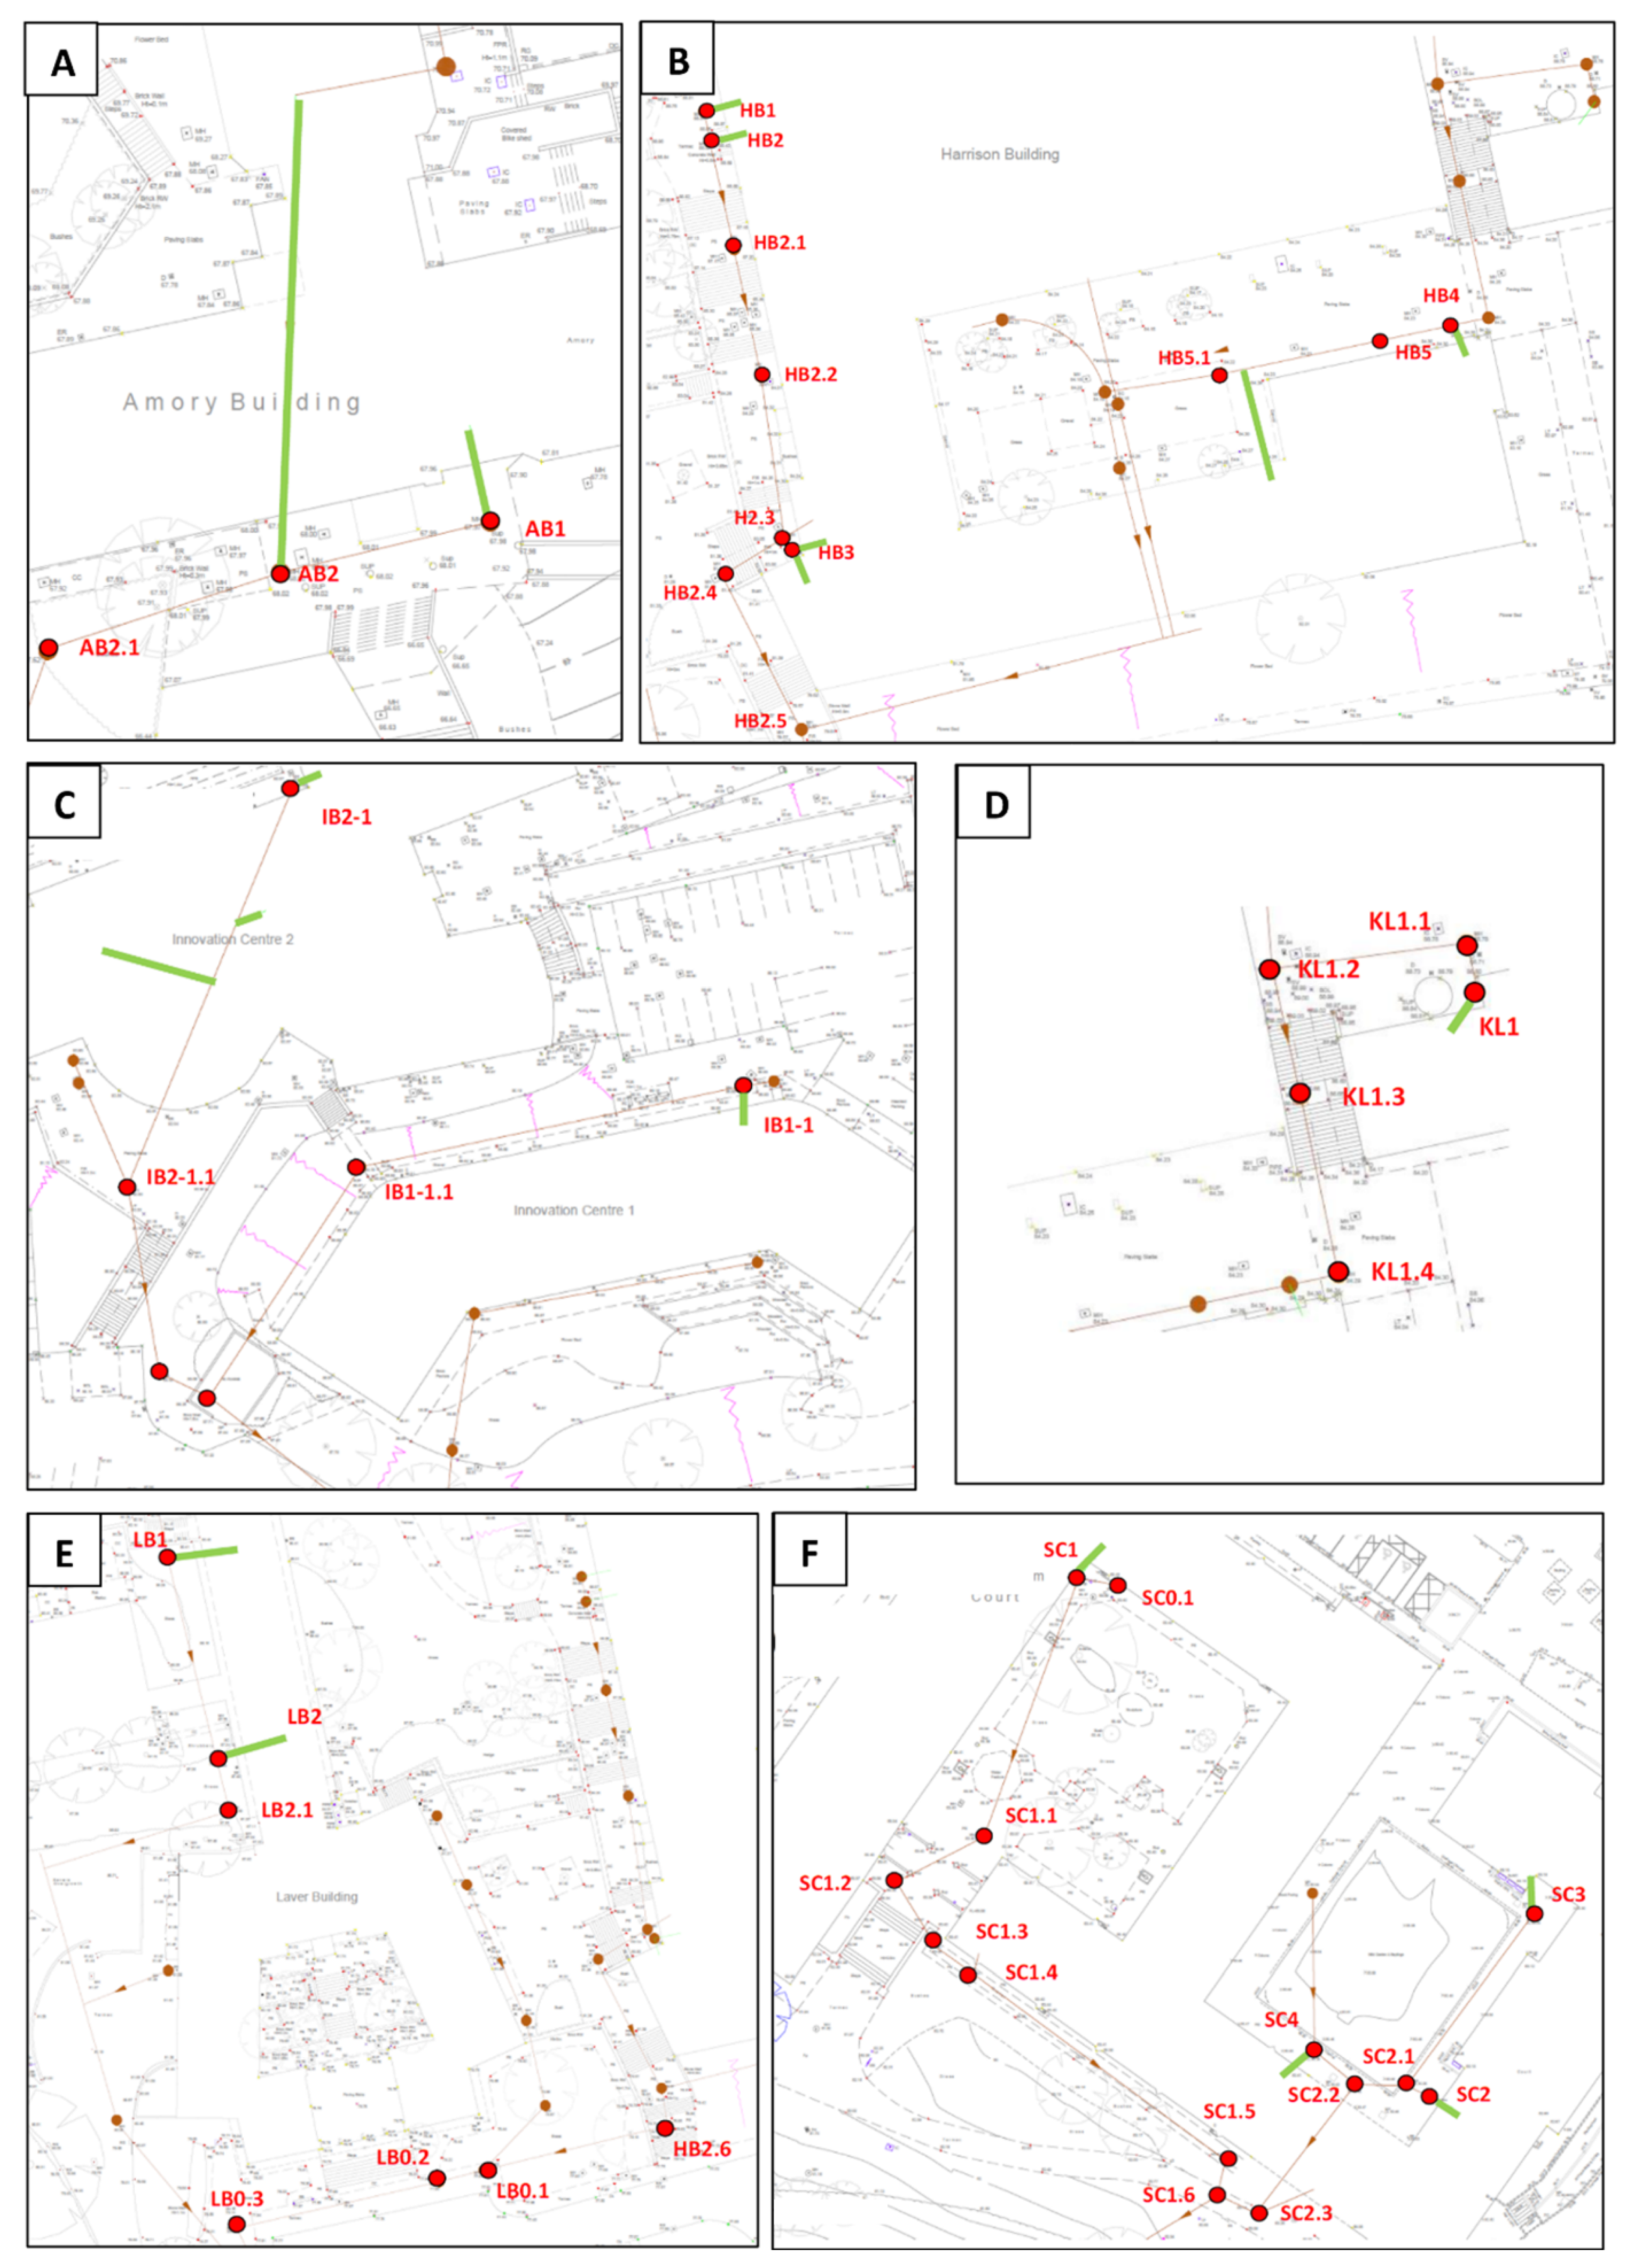
A series of sewer condition monitoring surveys were conducted after campus approvals, risk assessments and method statements were completed. Manhole surveys were conducted on a monthly basis for the first six months of the study. During each survey, 44 manholes evaluated in the drainage condition assessment (Figure 1). Where site constraints permitted, these were executed at all of the manhole chambers downstream from affect washrooms (Figure 1). The purpose of these surveys was to identify any changes in flow regimes and to look for evidence of blockages or sediment build up downstream of the new WCs.
Sewer monitoring involved two types of assessment, each conducted in bi-monthly surveys. Every second month, a drainage engineer assessed the chambers manually using a “lift and look” methodology to assess flow conditions and inspect for signs of blockage, high water marks and rags. In alternate months, between these manual inspections, sewer surveys were also supplemented by undertaking CCTV surveys wherein camera footage was captured throughout the pipe network surrounding each manhole chamber. The CCTV equipment used was a DartEye Mini Pipeline Inspection Camera [20]. This unit was equipped with a 26 mm diameter camera head, integral LED lighting and a 30-m length of cable. Images collected in the survey were recorded to an SD card and reviewed by the drainage engineers.
The spatial resolution of the survey was dictated by the physical arrangements of the drainage system. Initially, it was proposed that CCTV data would be obtained up and downstream of each foul manhole. However, this scope was expanded during the study period to assess for potential issues in chambers further downstream of each building. The survey locations for each building—identifying the manhole ID of each inspected manhole—is provided in Figure 1.
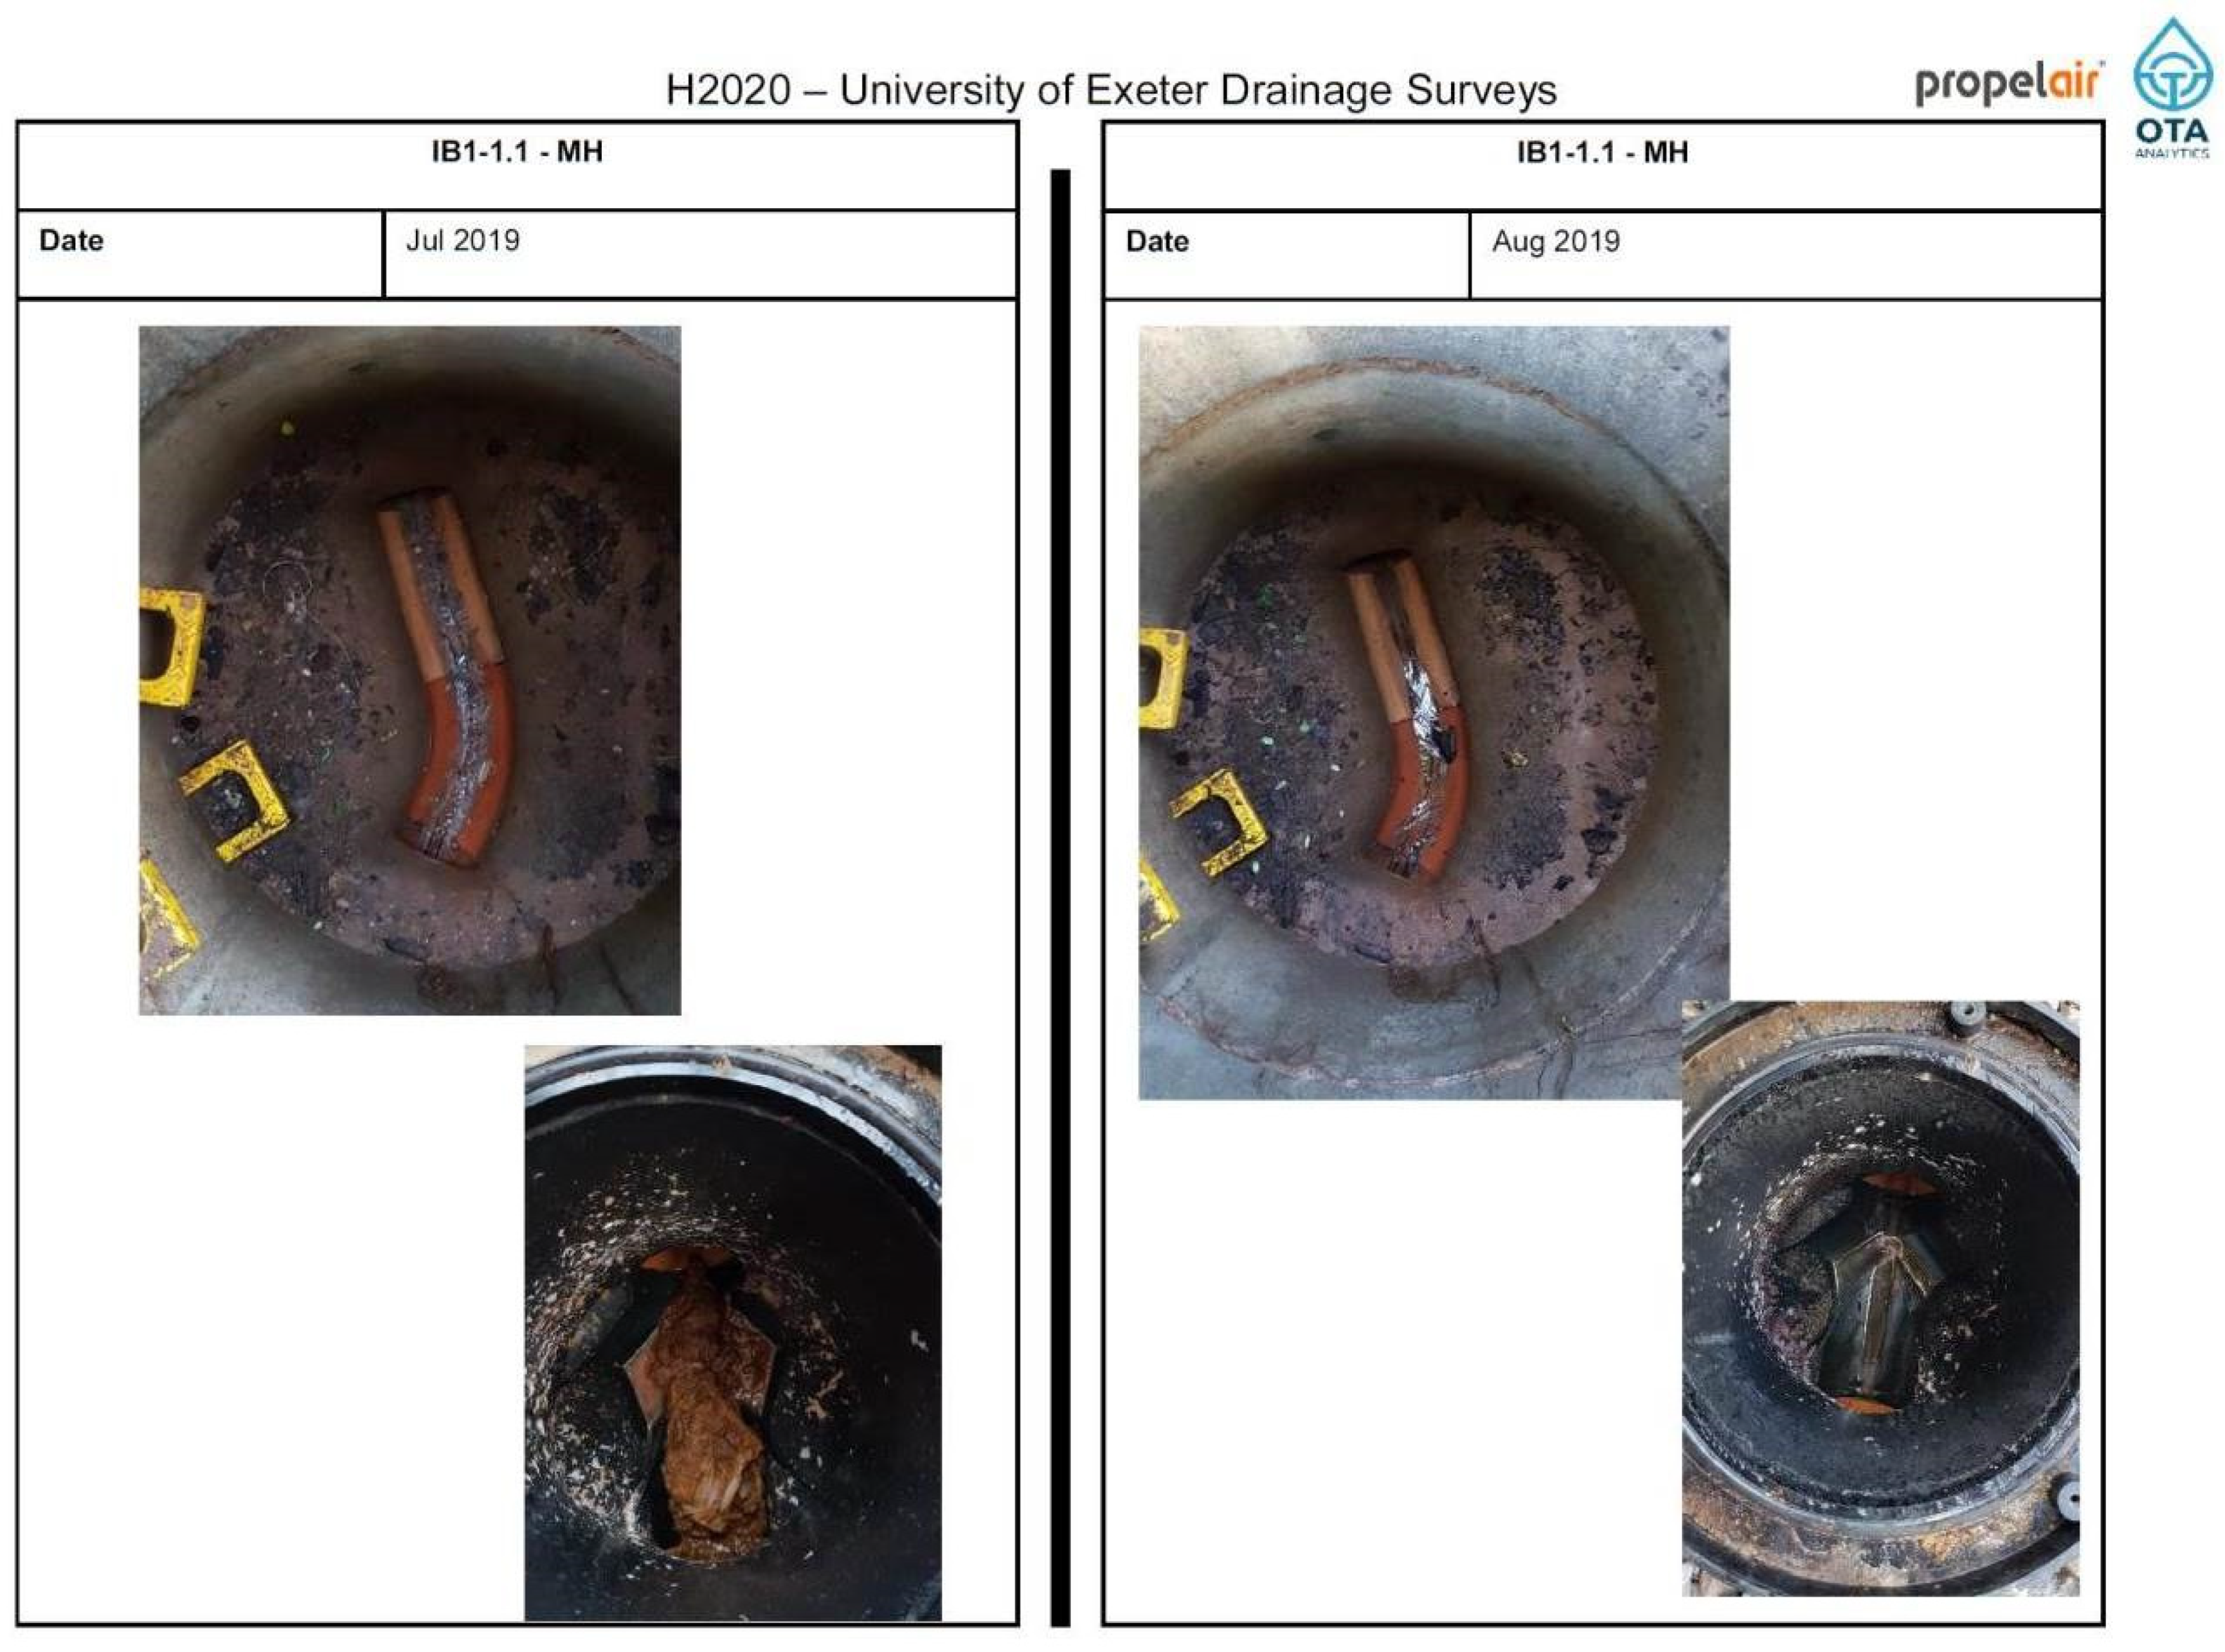
The surveys had a dual role. Firstly they provided monthly reports for the UoE estates team to identify any issues (e.g., root ingress/paper-towel blockages) which may warrant immediate attention. Secondly, they provided an evidence base which can be used to reflect on the flow conditions over a 12-month period downstream from the new WCs. An example of the survey sheets is illustrated in Figure 2.
2.5. Data Quality and Processing
Data collection for the six-month period was completed and analysed for quality issues against a series of metrics including data completeness, integrity and validity. Flush counts within the ULFT units can miss-record data if toilet faults occur. Such faults include continuous flush cycling or partial flush cycling, data logging system failures, inadvertent human intervention, for example maintenance staff adjusting float switches when undertaking maintenance. The flush count data was compared with the digital and volumetric flow meters to explore validity of the flush count data. Data collection in the study relied upon over 130 sensors providing data at one minute time intervals. Reporting to the project team was implemented with a monthly output presented identifying any gaps in monitoring data and issues identified in the reporting period. It was agreed that gaps in the raw flush count data would be filled using a mean value, ensuring any missed readings did not accumulate and thus reduce the best estimate of total water demand. This was calculated as follows:
Total flush count = No. of flushes recorded + (mean flush count per timestep × No. of missing timesteps)
It is observed that this simple data manipulation method presents a risk that additional uncertainty is introduced into the data.
2.6. Statistical Analysis
Statistical tests were carried out using IBM SPSS statistics 26 [21]. Analyses were carried out to determine if there was a statistically significant difference in the manual metered readings obtained at the building level for billing purposes before and after ULFT installation. A paired-samples t-test was run to determine whether the mean difference between paired observations was statistically significantly different from zero. The paired-samples t-test assumes there should be no significant outliers and the distribution of the differences should be approximately normally distributed. The assumption of normality of data is assessed by Shapiro–Wilk’s test. When this assumption is violated, there are two non-parametric alternatives which can be considered: (i) The Wilcoxon signed-rank test, if the distribution of differences is symmetrical; or (ii) the related-samples sign test, if the distribution of differences is asymmetrical.
3. Results
Data reported herein are based on 6 months of data from 8 March–31 August 2019 inclusive.
3.1. Data Validity
Across the 38 washrooms, flush count data was captured with a completeness of 93.7 % for the 38 washrooms during the six-month trial. Total data losses across all the systems amounted to 6.3% of the theoretical maximum amount of data available over 6 months. The actual number of data points collected for each washroom varied between 74.1% and 99.8% of the theoretical maximum. At the building level, this ranged from 90.7% (in the Harrison Building) to 99.8% (in the Laver Building). Data integrity (an assessment of the amount of valid data in the dataset, expressed as a percentage of the available dataset) was 97.95% across the 38 washrooms during the data collection period. In 33 washrooms, data integrity was 100%, indicating that none of the data recorded was “blank” or erroneous at any point during the six-month collection period. Data viability was extremely good: With mean data viability across all 38 washrooms at 92.1%.
3.2. Flush Count Data
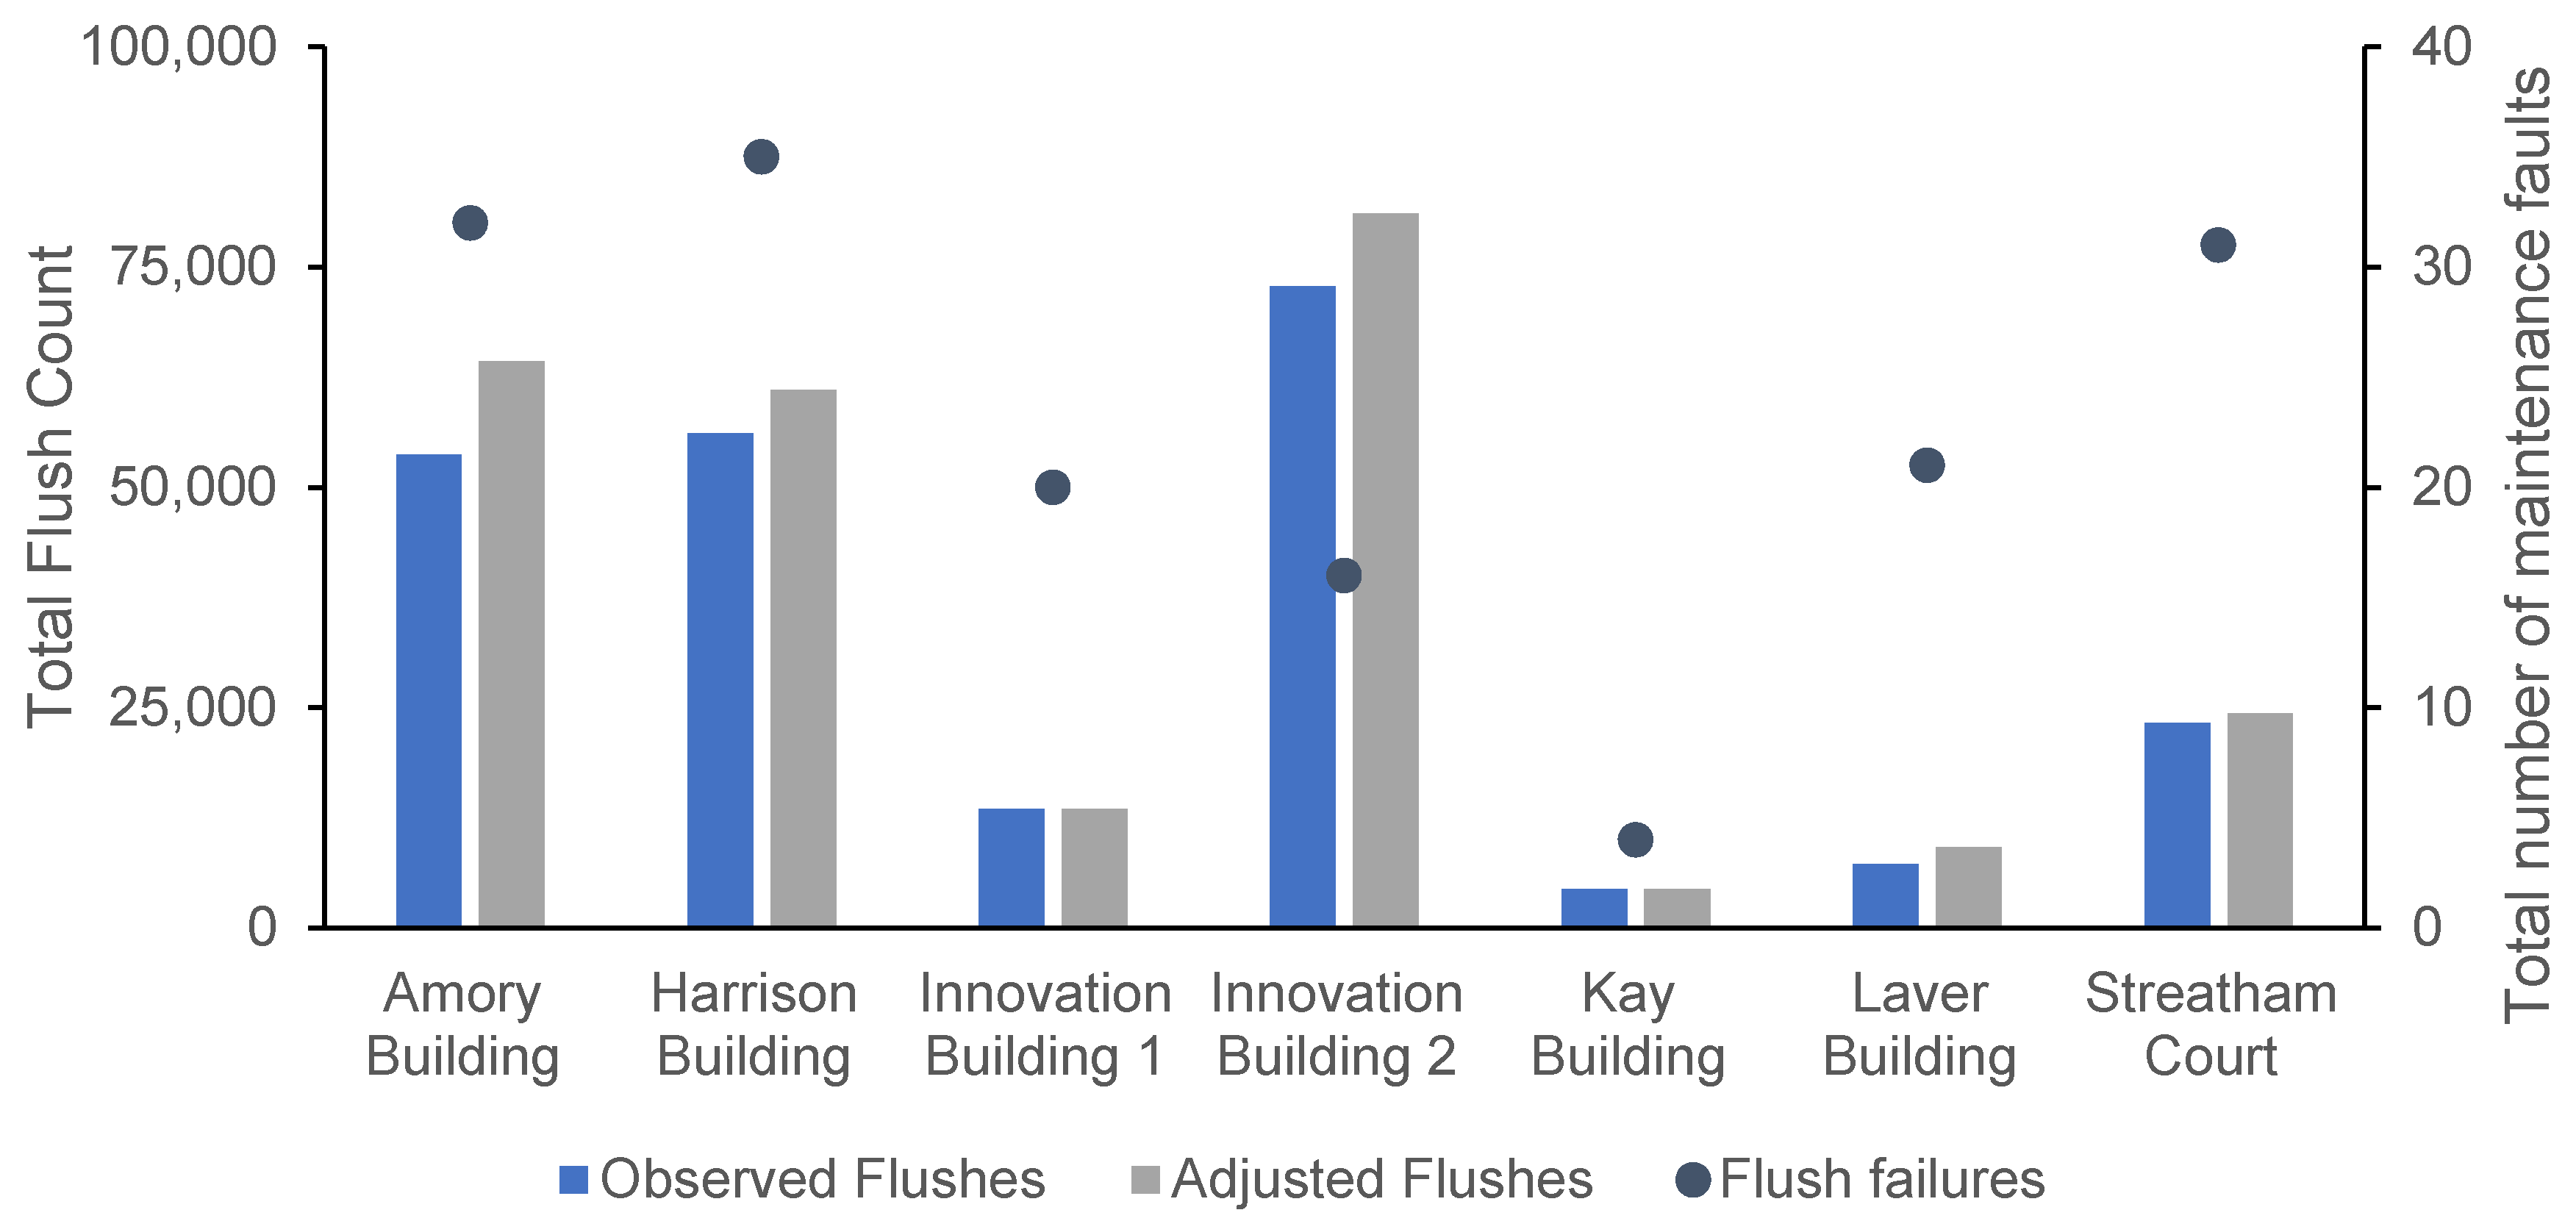
In the 6-month study period 231,114 flushes were recorded. This equates to approximately 6082 flushes per washroom. However, when adjusted to account for missing data (as described in 2.5) the total number of flushes was estimated as 257,925. The average adjusted flush count per washroom was therefore 6788 flushes. However, some larger buildings were used considerably more than others, with some experiencing nearly 25 times greater usage than others (Figure 3).
3.3. Flow Meter Data
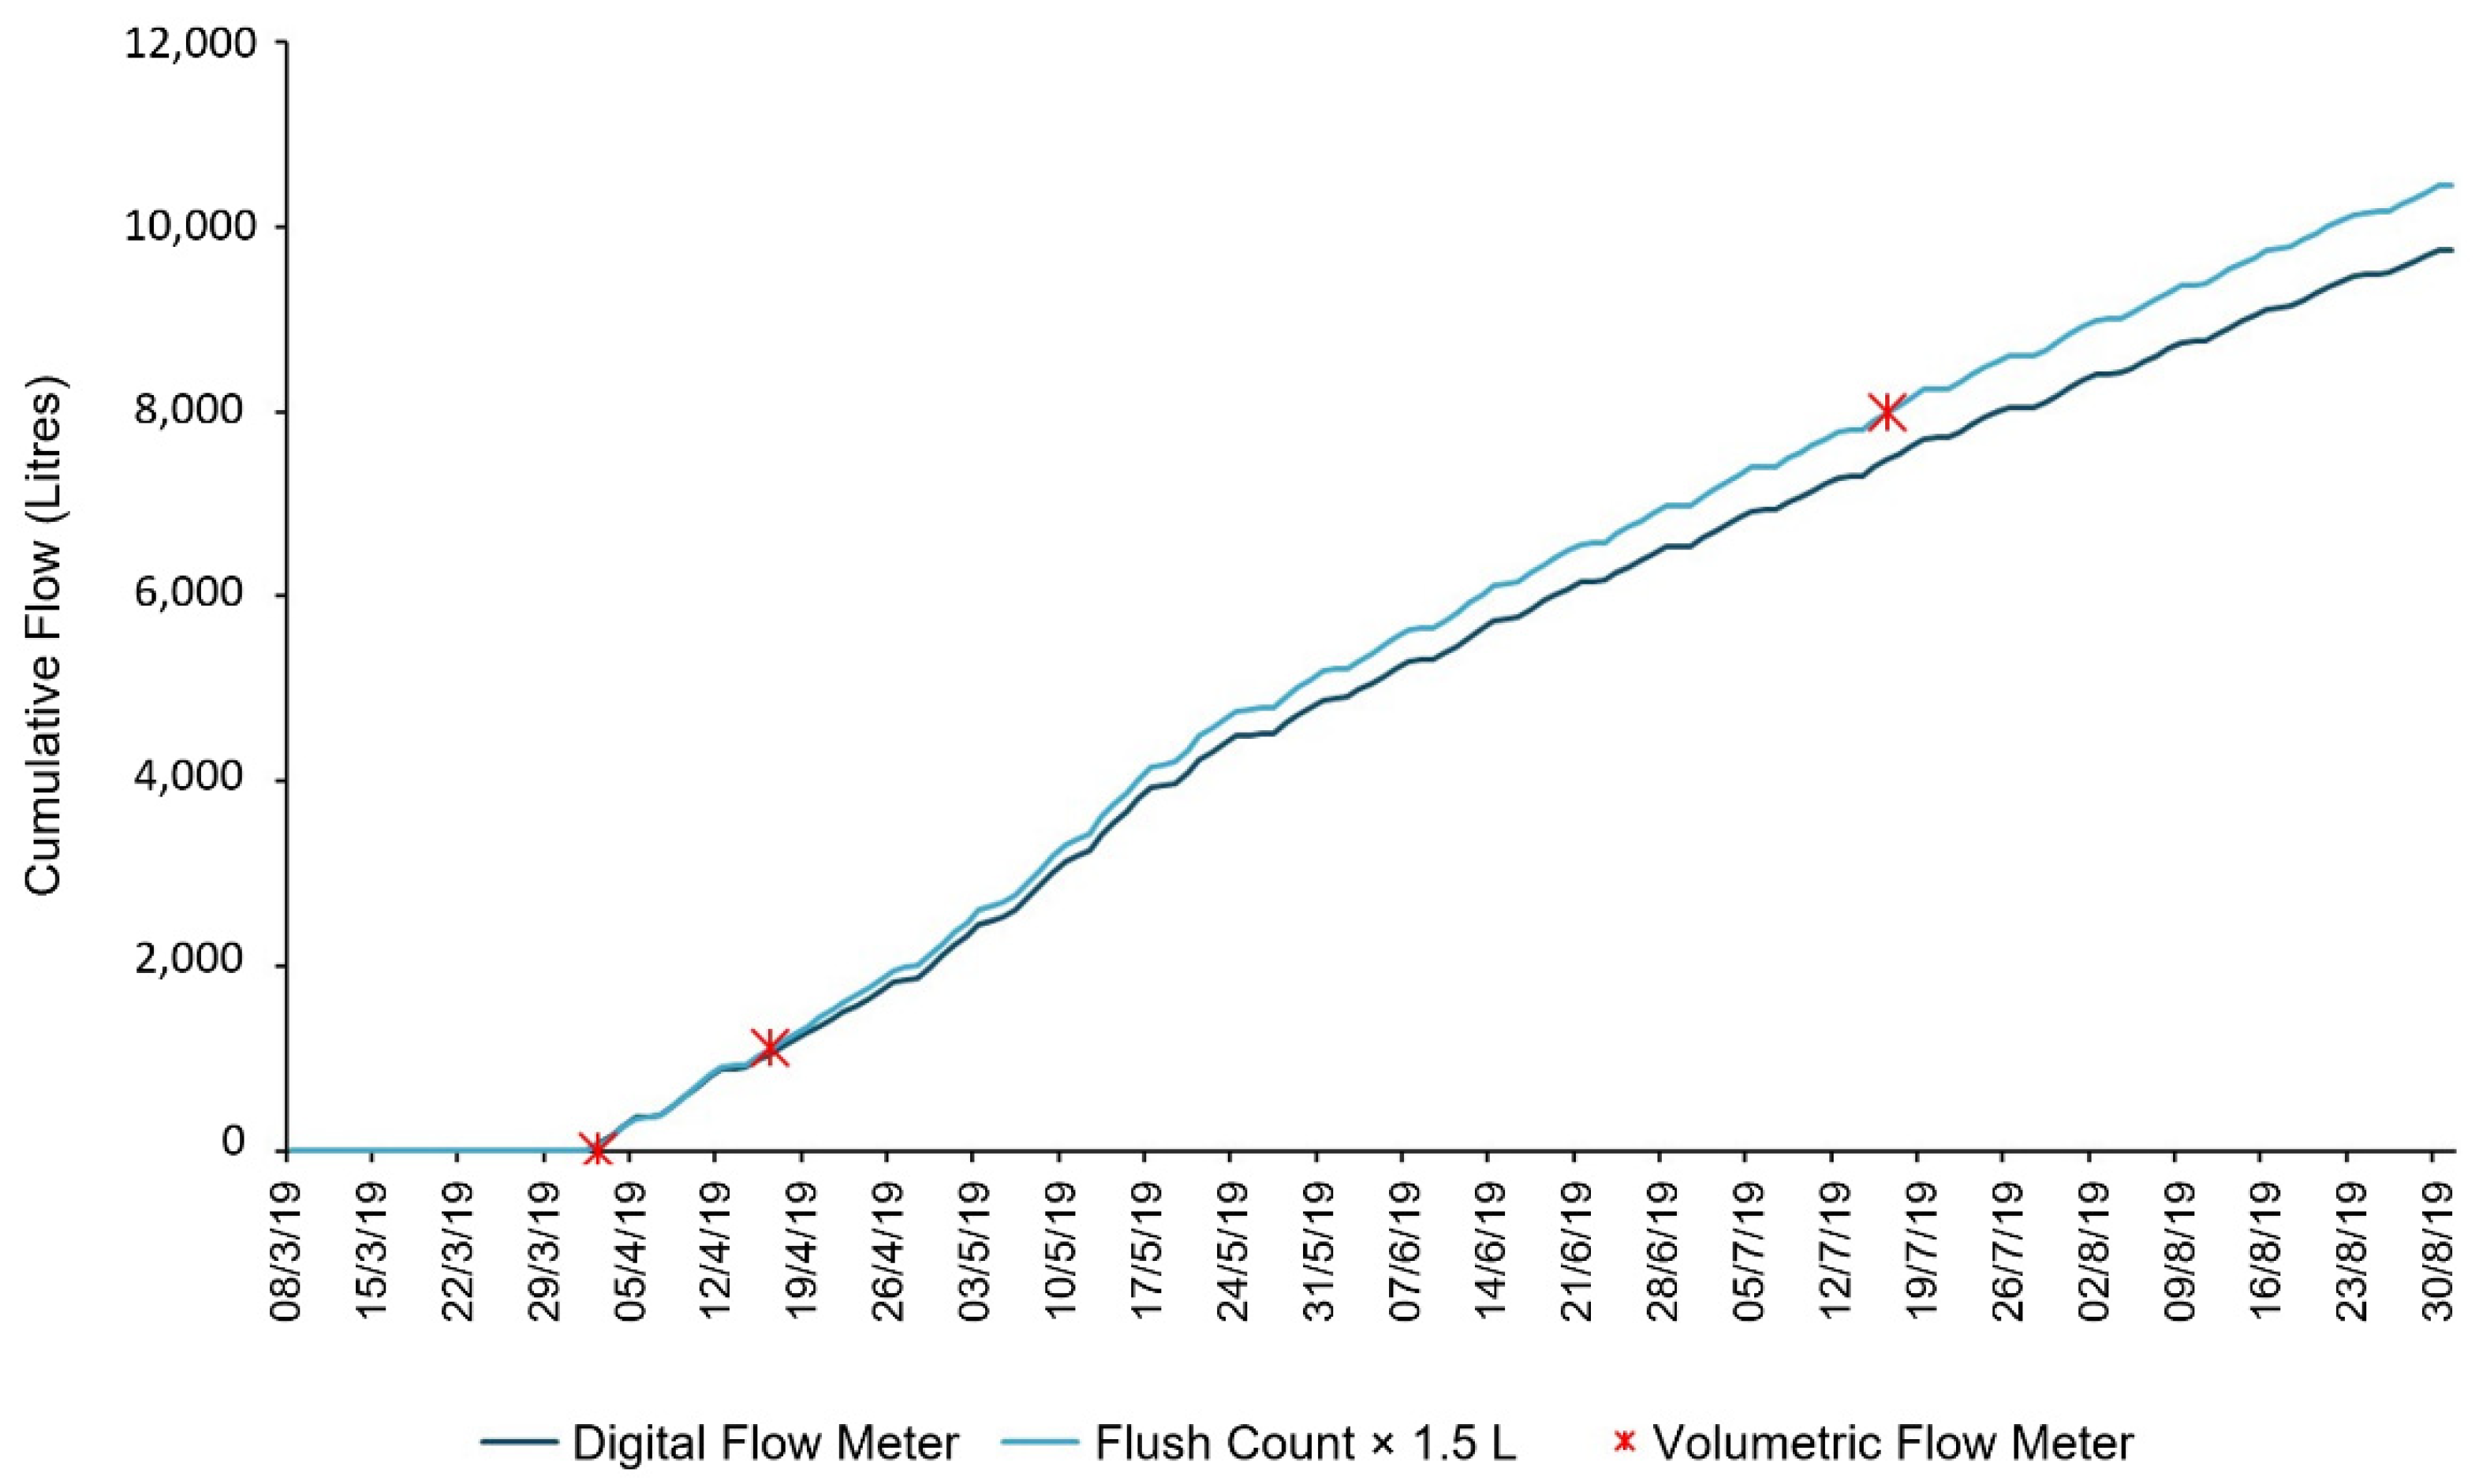
Data from the Harrison Building’s flow meters is presented alongside the flush count data and manual water meter readings for a single washroom in Harrison Building (Figure 4). Although an imperfect fit is observed, this offers validation that the flush-count method is robust in capturing water demand and reinforces its usage as a water demand monitoring method in the remaining buildings. It is observed that the volumetric water meter reading (as illustrated by the red asterisk on Figure 4) shows a discrepancy against the flush counts. Notwithstanding the fact that some volumetric meters could not be fitted with idealized straight-pipe runs entering/leaving them, this meter data is considered a reliable benchmark and confirms the flow meter to be performing accurately. However, the flow meter appears to over report the water demand by 0.2 L/flush (i.e., indicates a mean flush volume of 1.7 L, not 1.5 L) within the Harrison building. Several potential causes of this are considered. These are set out in order of likelihood based on the authors’ observations. Firstly, a discrete event (i.e., a leaky toilet running for a long period of time) could draw flow through the flow meter without being recorded by the flush counter. Secondly, this might occur as a continuous fault, with a given toilet entering this failure mode on more than one occasion (perhaps for a short period of time after each flush). It is also plausible that the flush counting mechanism can miss double-flushes. In certain instances it is also plausible that an unknown appliance is connected downstream of the flow meter installation (that was not identified when the plumber surveyed and installed the systems). Further case by case analysis is necessary to explore such discrepancies; however, for the purpose of establishing the accuracy of the monitoring equipment deployed in the study, it is conservatively estimated that each WC flush is, on average, associated with 1.7 L of water demand (despite the 1.5 L cistern volume of the deployed ULFTs). It is noted that such a phenomenon is described within the leaky loo studies which indicate that standard WCs also exhibit water demand characteristics in excess of their design flush volumes [22].
3.4. Manual Metered Data
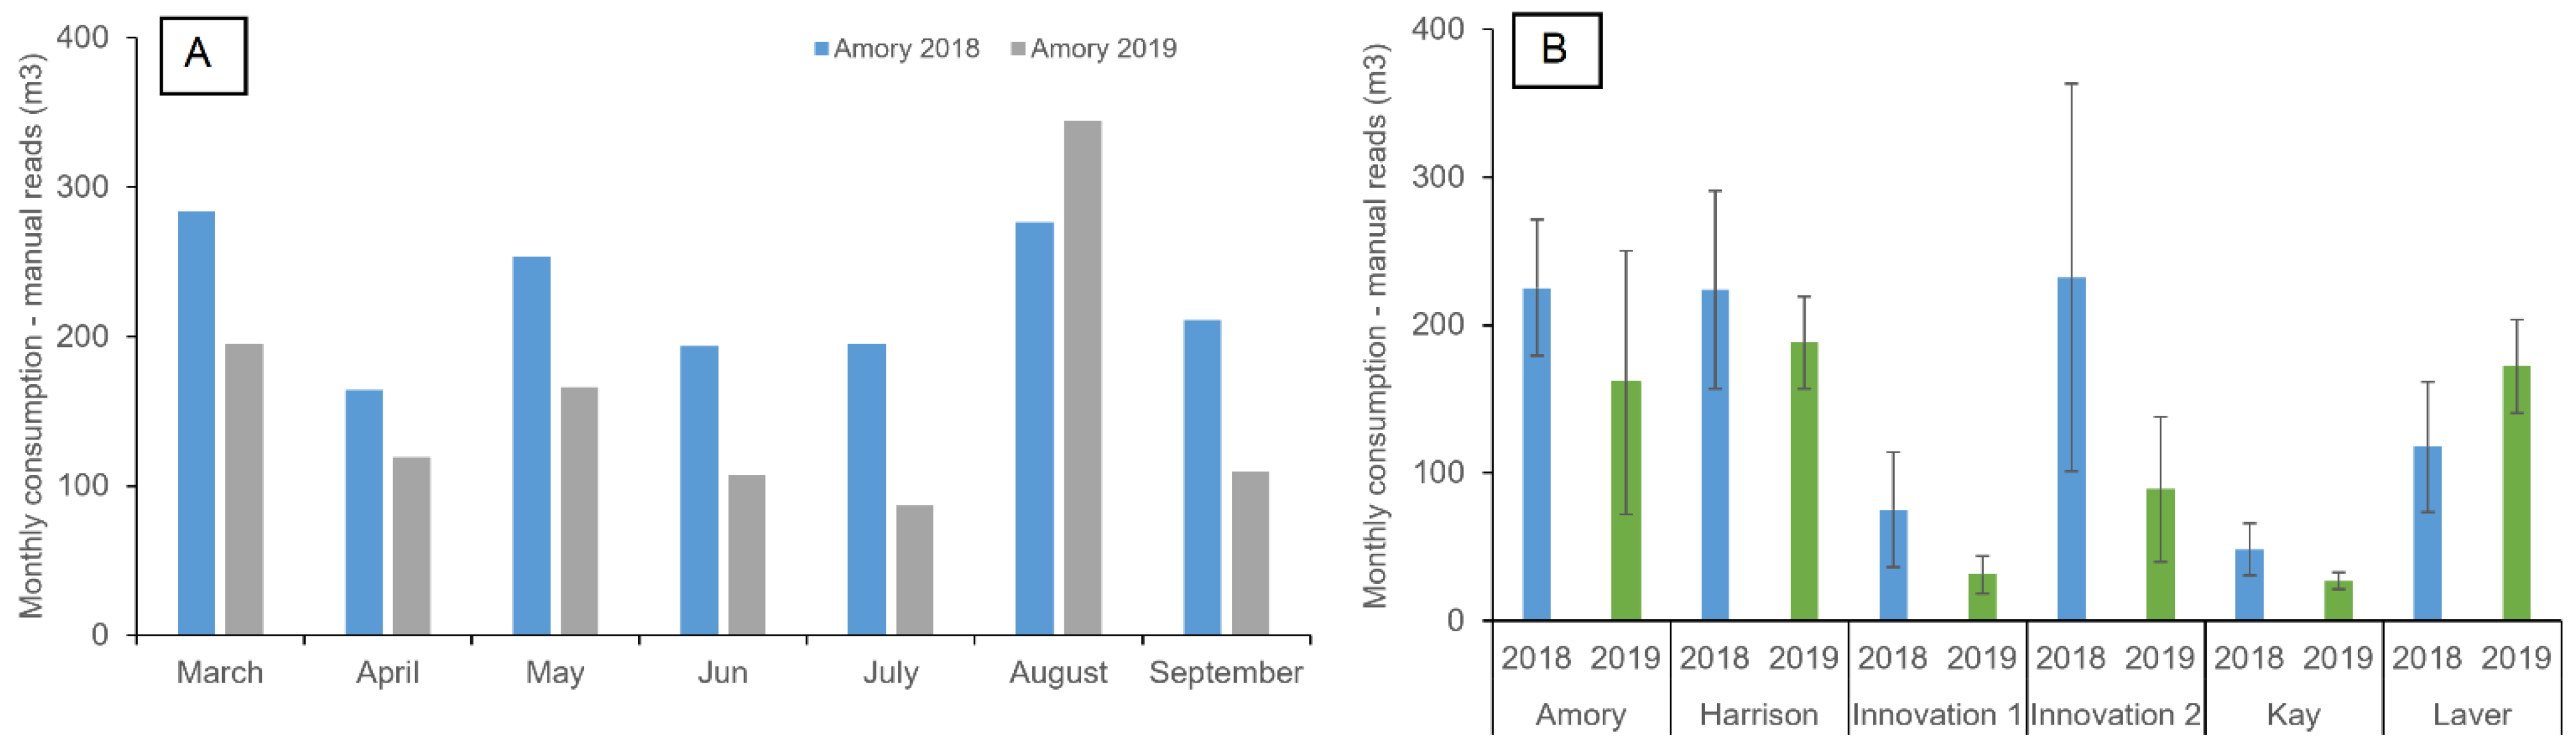
Actual meter readings (used for billing purposes) were obtained at the building level from UoE estates team (A Mitchell, personal communication, 7 Jan 2020). These readings are obtained manually approximately monthly, but there is some variation in the time interval between readings. Therefore, a monthly consumption estimate (in m3) was calculated by subtracting the previous monthly meter reading from the current one, dividing by the time interval between readings, and multiplying by the number of days in that month. Monthly consumption was compared for two comparable time periods; one of which covered the duration of the study described in this paper, and one which covered the same number of months one year prior to the study. This enabled a comparison of the monthly meter readings at the building level, prior to and after ULFT installation (Figure 5A). Monthly consumption was lower in 2019 (after ULFT installation) than 2018 (before ULFT installation) in all buildings except for Laver (Figure 5B).
Estimates of building-level monthly potable water consumption were compared for two comparable seven-month periods in 2018 (prior to ULFT installation) and 2019 (after ULFT installation). The assumption of normality of data was violated, as assessed by Shapiro–Wilk’s test (p = 0.005). The distribution of differences was not symmetrical for any of the buildings and therefore the related-samples sign test was selected as an appropriate non-parametric statistical test. The sign test was used to compare the differences in monthly consumption estimates in each building across the two years. There was a slight decrease in median monthly water consumption, which was not statistically significant in three buildings: Amory, where monthly consumption averaged 119 m3 in 2019 and 211.0 m3 in 2018, z = −1.512, p = 0.125 (Figure 5A); Innovation 1, where median monthly consumption was 24.6 m3 in 2019 and 71.1 m3 in 2018, z = −1.512, p = 0.125; and Harrison, where monthly water use averaged 184 m3 in 2019 and 210.0 m3 in 2018, z = −1.225, p = 0.219. Two buildings saw a statistically significant reduction in mean monthly metered consumption across these time periods. This included Innovation 2, where monthly consumption averaged 184.9 m3 before ULFT installation and 81.2 m3 after ULFT installation, z = −2.268, p = 0.016; and Kay where monthly water use averaged 48.1 m3 in 2018 and 25.9 m3 in 2018, z = −2.268, p = 0.016 (Figure 5B). Finally, there was a slight increase in median monthly water consumption in Laver (2018 = 108.9 m3; 2019 = 182.8 m3), but this was not statistically significant, z = 0.756, p = 0.453.
3.5. Sewer Network Observations
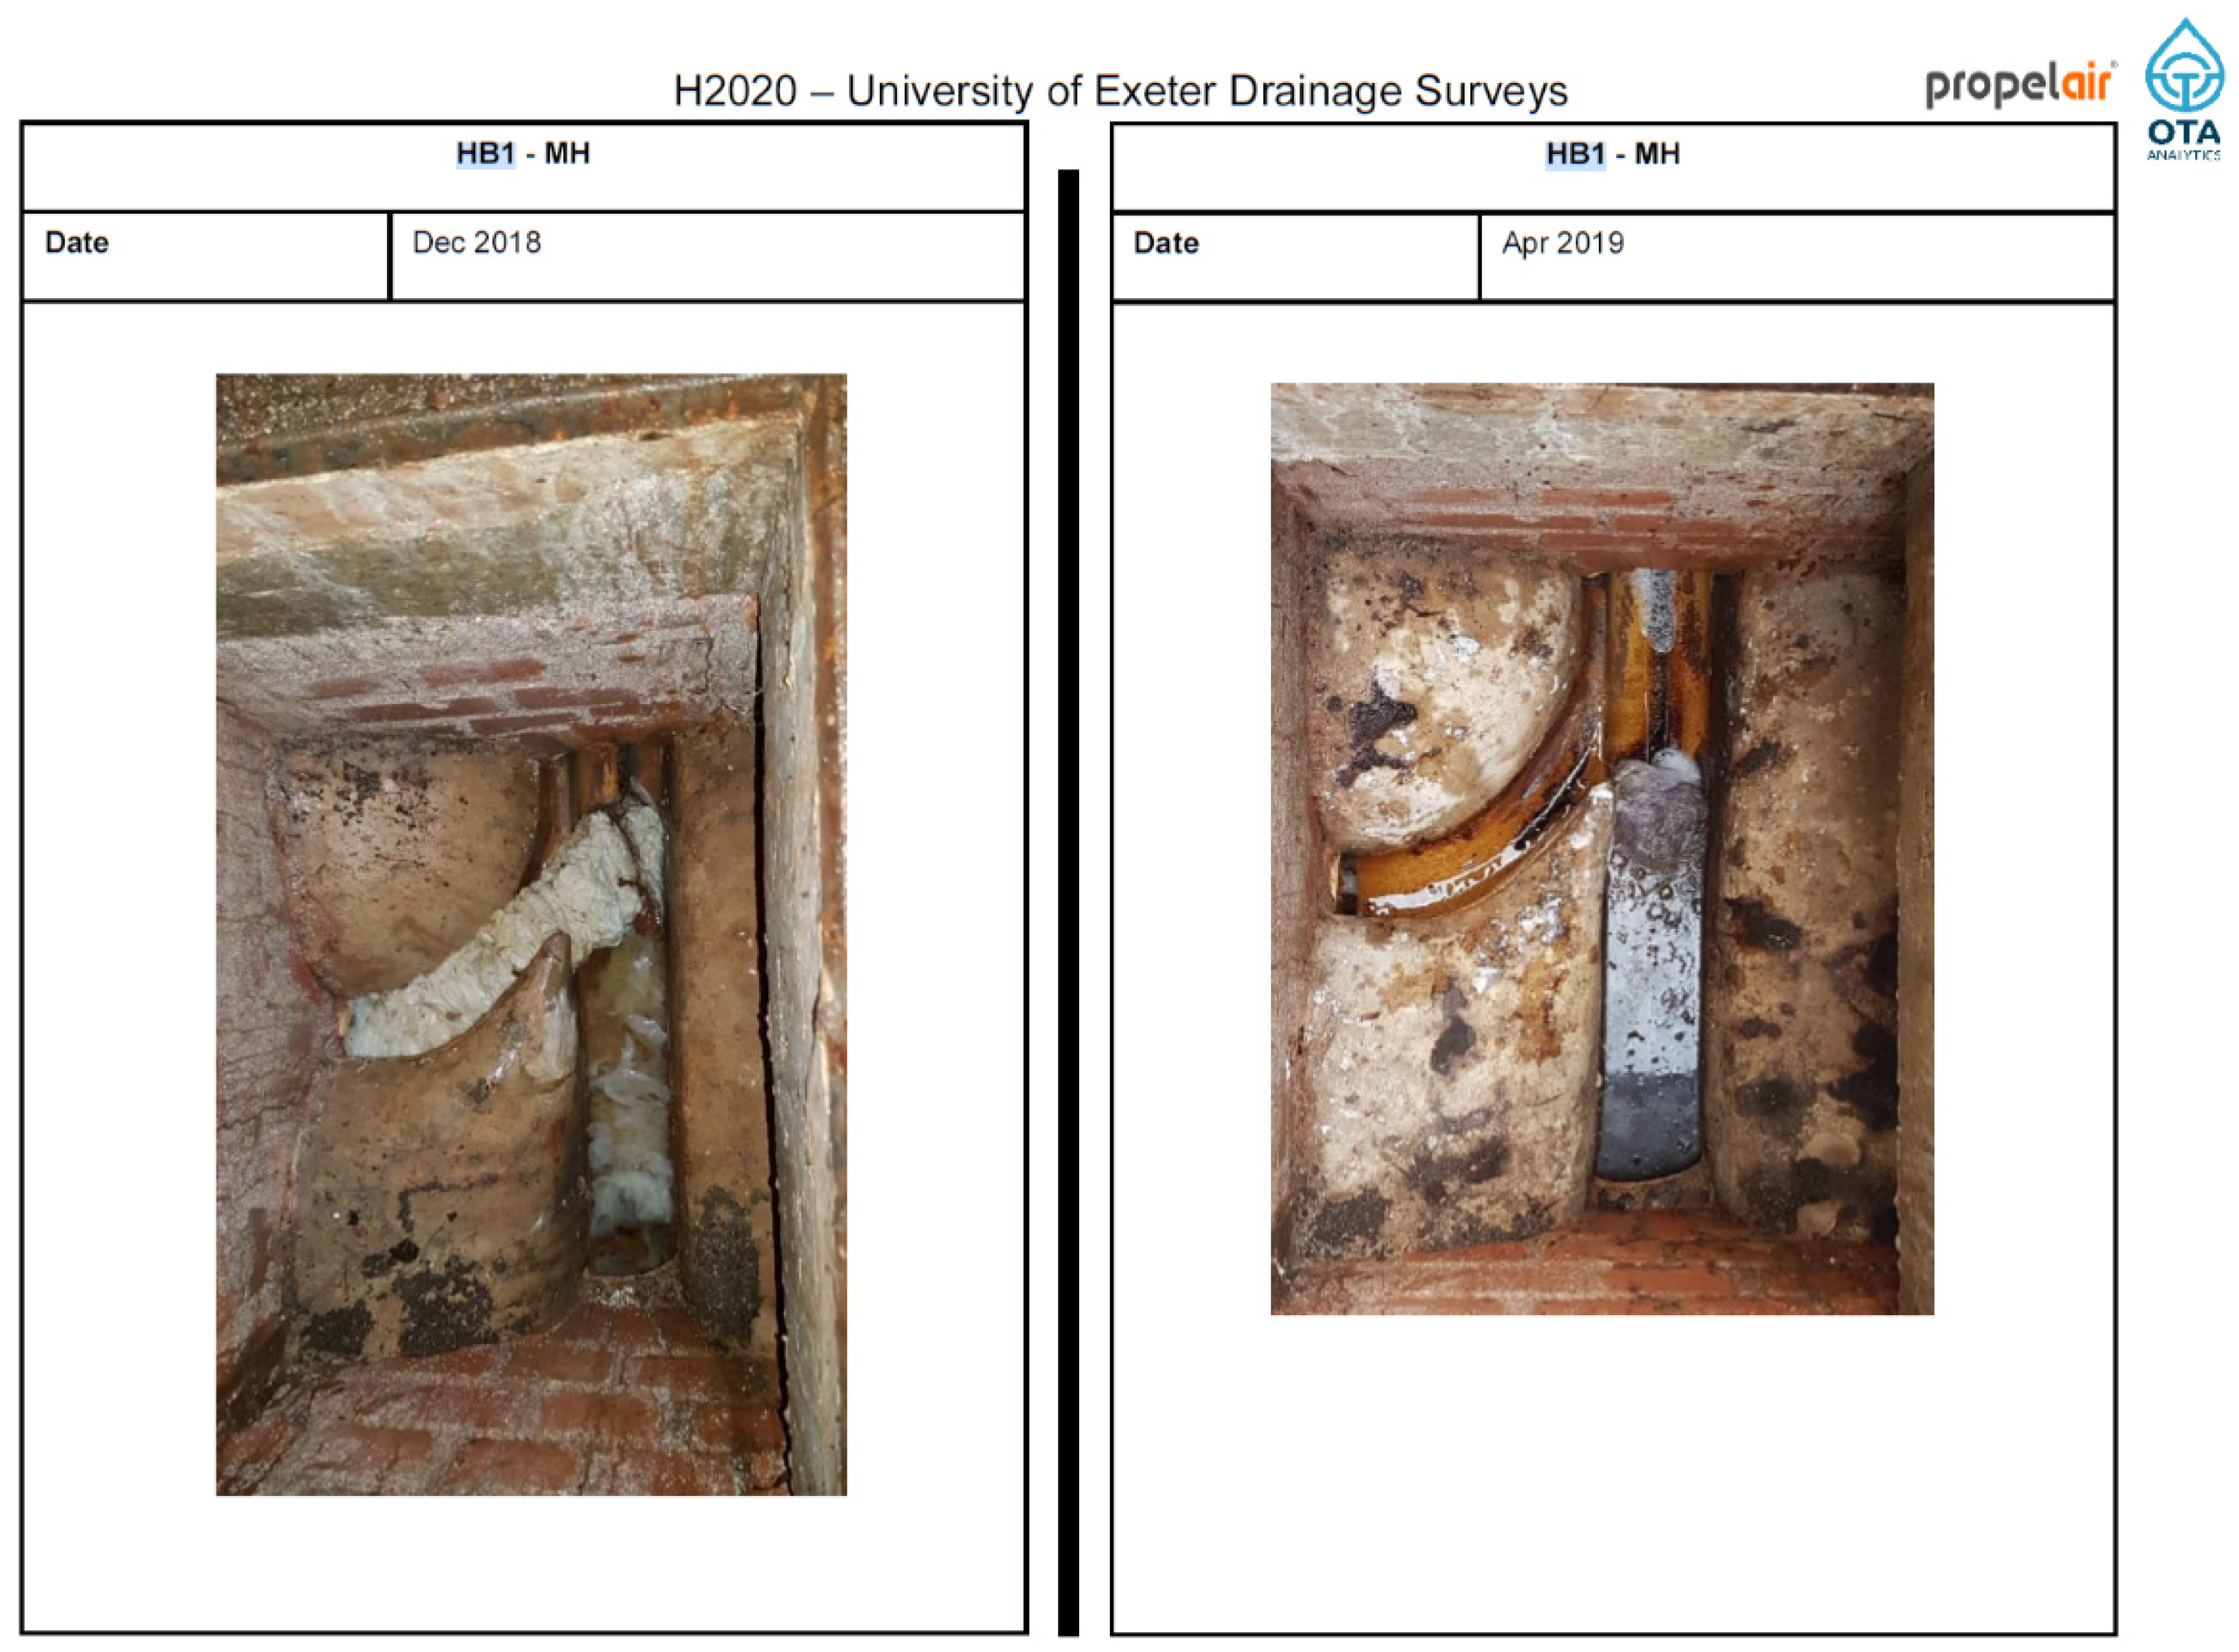
A number of relatively severe issues were observed within the existing drainage system such as cracked pipes, failed joints and root ingress. Through discussions with the UoE maintenance team it became clear that each of these issues were known problems and that they have been managed by their team prior to and throughout the trial period. Shortly after commissioning, two such locations were highlighted as being directly impacted by ULFT installations. Both locations were investigated and found to be suffering from an overload of toilet paper (Figure 6). The blocked chambers were located at the head of drainage runs serving single female washrooms with 8 and 5 toilet cubicles respectively. In one location, the drainage pipework was flat for a significant length (i.e., substandard in specification). Unlike male washrooms, it was observed that such locations do not get regular flow contributions from urinal flushing systems. In both instances, campus maintenance teams installed an automatic flush device (akin to a 25-litre urinal tank releasing once per day) and further instances of blockage have not been reported. Based on drainage engineer observations, supported by monthly manhole surveys and CCTV observations, none of the remaining 44 manhole locations were identified as suffering a significant detrimental impact or notable increase in blockage risk due to the ULFT installation project.
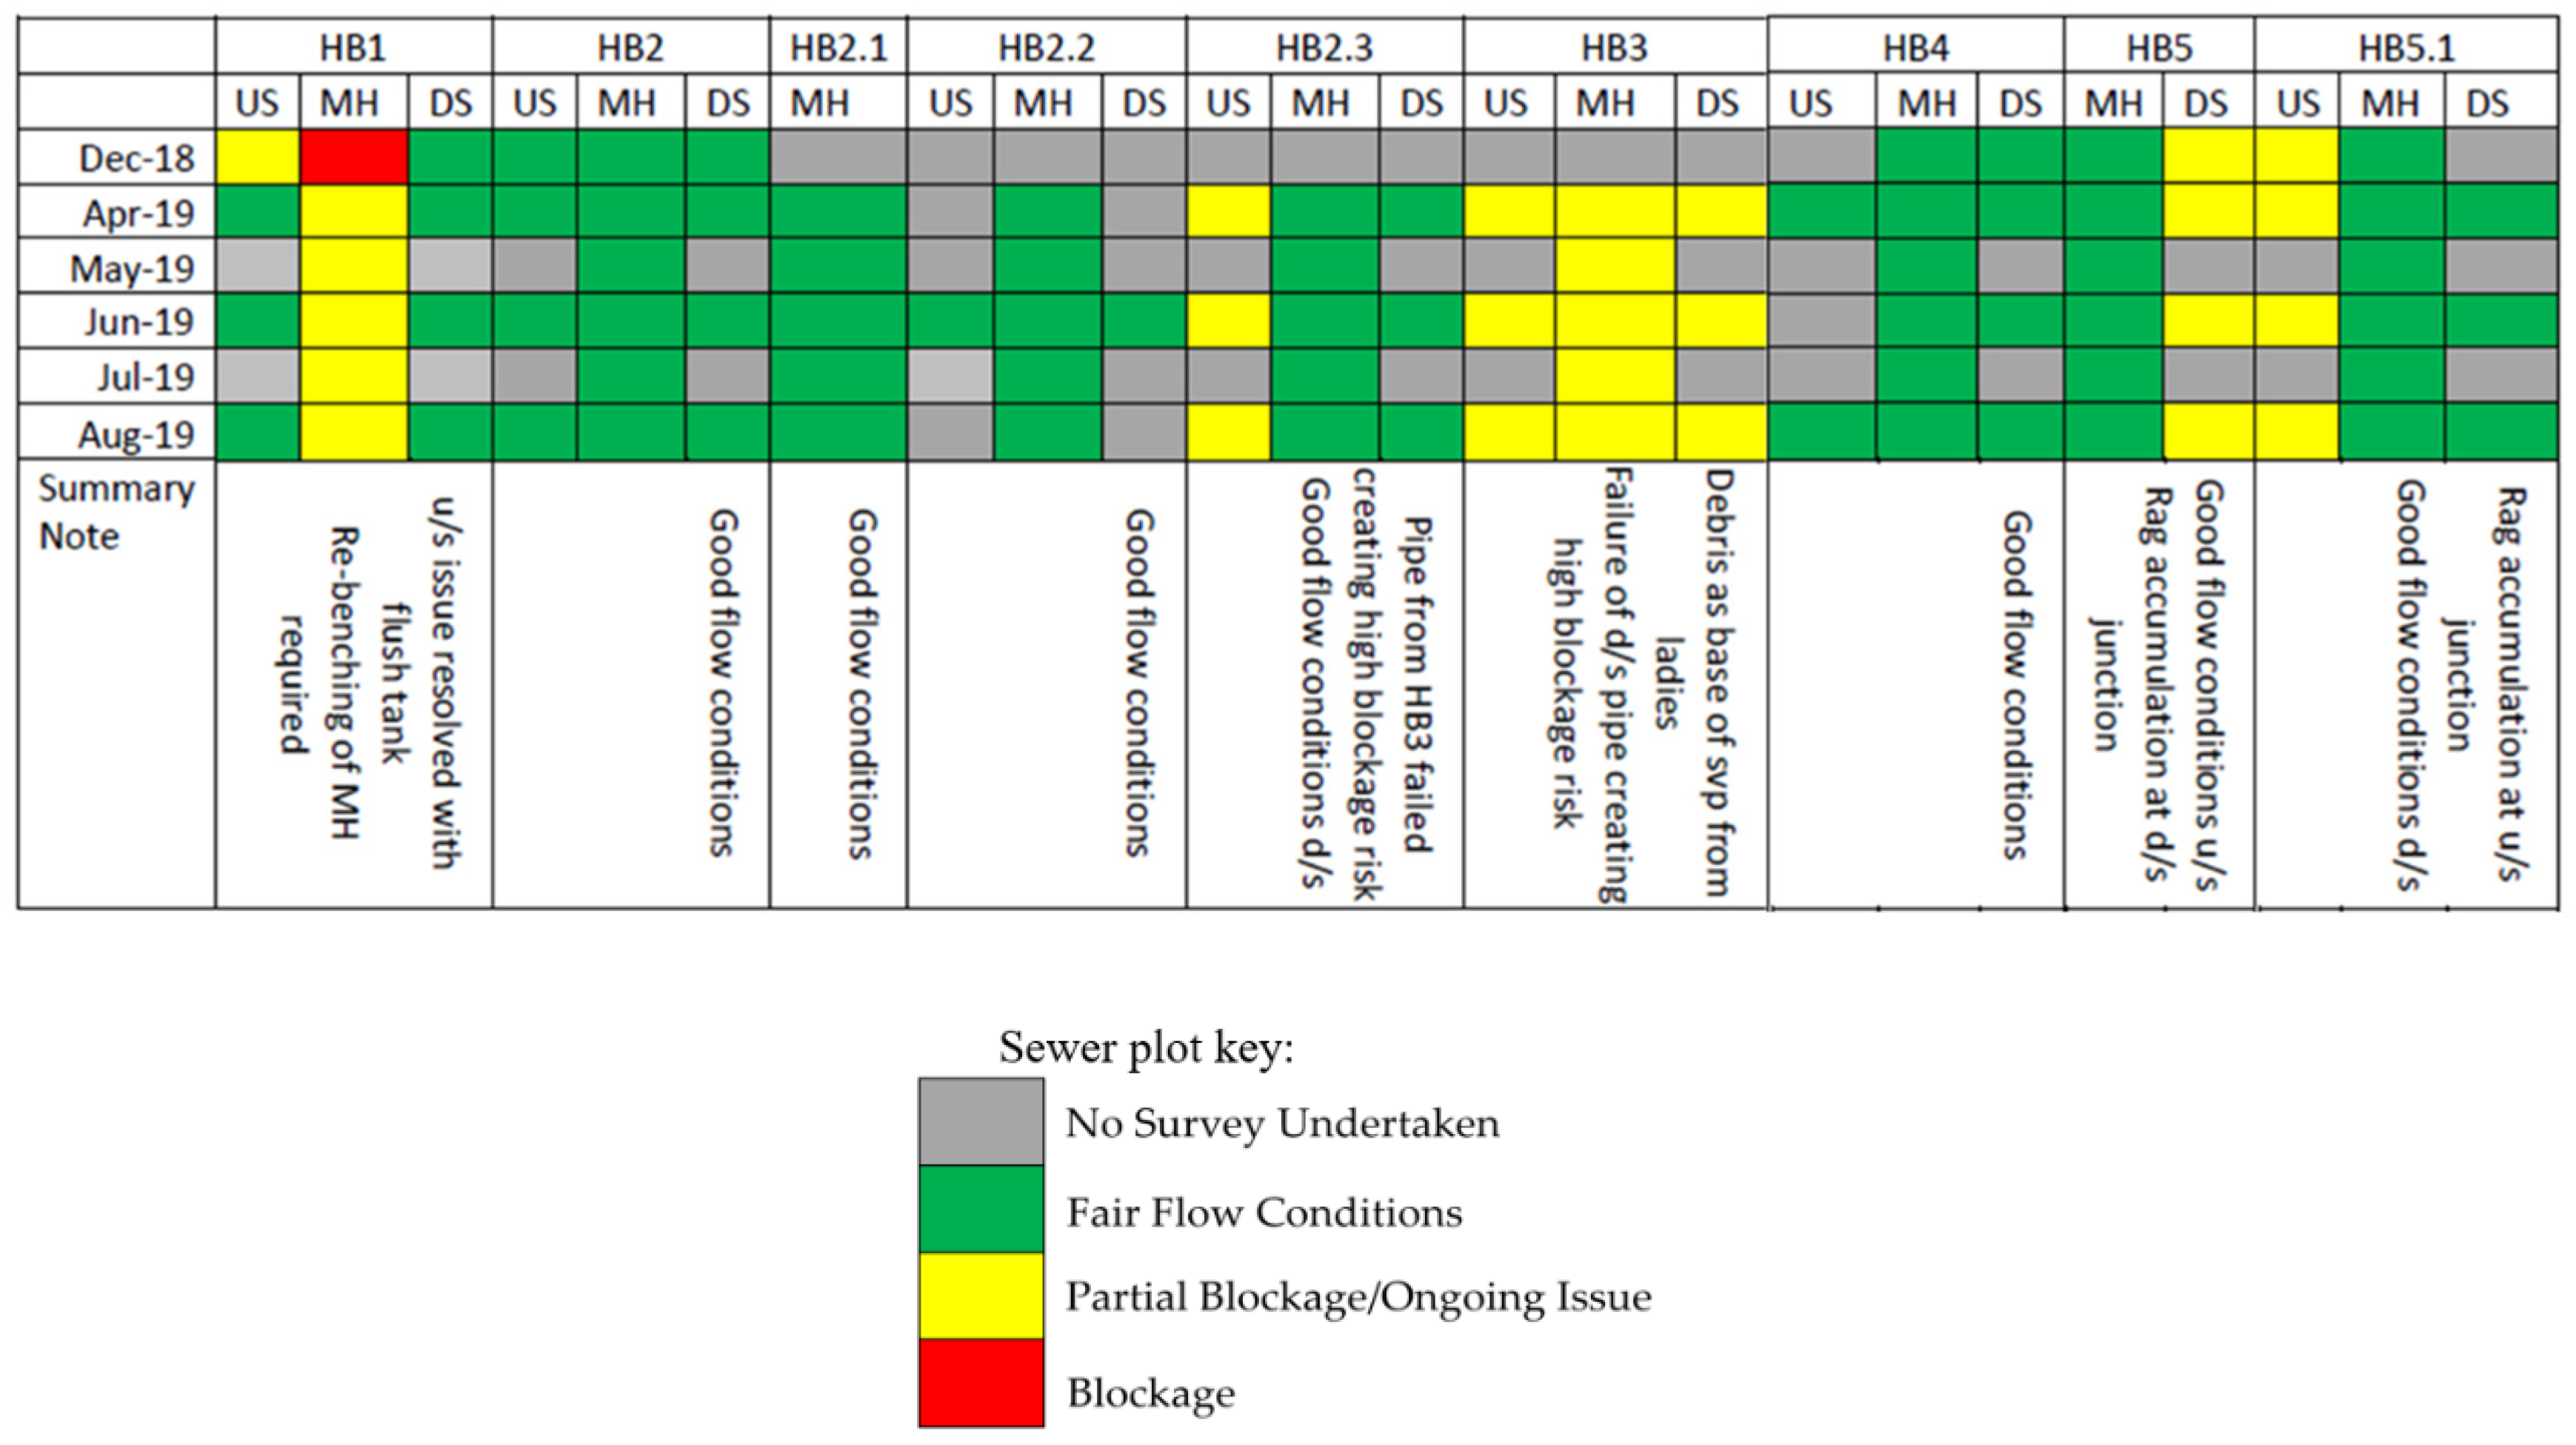
The drainage engineer’s reports were compiled to provide qualitative observations linked to each manhole chamber evaluated in the project. To support consistent observations, every survey was conducted by the same engineering staff and the academic team and Propelair® technicians were able to attend these surveys in an oversight role. In order to visualise the data, a traffic light plot was developed for each chamber (Figure 7).
3.6. Maintenance Observations within Washrooms
During the six-month study, 159 maintenance faults were recorded (Figure 3) of which, 95 were associated with the ULFTs (59.7%). This included 41 blockages, 33 instances where a ULFT did not flush, 8 broken components, 4 instances where the ULFTs were flushing constantly, 2 odour issues and 7 other complaints. Blockages occurred in five out of the seven buildings observed, with no blockages in Innovation Building 1 and Kay Building. The average number of flush failures per toilet across the six-month study at seven buildings was 0.55 ± 0.66, which suggests an average toilet may fail to flush approximately once per year. There was a high variability between building, where the number of flush failures ranged from 0.1 flush failures per toilet in Streatham Court to 2 flush failures per toilet in Kay Building. It could be argued the data from the Kay Building is an outlier, potentially with a single toilet that needed frequent adjustment. If the Kay Building is removed, the average number of flush failures per toilet across the remaining six buildings was 0.31 ± 0.17, implying an incident of this nature would be likely to occur once every 19 months.
It is noted that failed components do not purely reflect on system robustness or ability to function as designed. Broken components primarily related to issues with the flush button or trigger to flush the toilet, but also included a cracked toilet bowl, a broken seat and collateral damage to a toilet resulting from damage to an adjacent wall. Unfortunately, these are unavoidable accidents, but are infrequent and unlikely to cause ongoing maintenance concerns. Four ULFTs were reported to be continuously flushing at some stage during the trial. These were generally dealt with quickly by the UoE maintenance team, and it is noted that the monitoring of demand and monthly reporting presented a novel opportunity for these issues to be audited and proactively addressed.
4. Discussion
4.1. Water Savings
Although the focus of this study was to observe implications associated with significantly reducing water demand on the downstream drainage, it is important to frame the validity of the water demand monitoring data captured alongside the deployment of the ULFTs. To date, this study represents one of the largest WC monitoring projects deployed in the UK, (regardless of WC typology) and thus the reduction in water demand observed can be seen as a useful empirical benchmark for further deployments of ULFTs. As noted in the results section, the three mechanisms used to measure water demand in the fully-metered Harrison Building (flush counts, digital flow meters and volumetric water meters) each have limitations: i.e., flush counters can miss flow from “leaky loos”; digital flow meters may have inaccurate calibration/installation set ups; and volumetric meters may have sub-optimal installation set ups. The results in Figure 4 illustrate how, for a washroom where flow meter and volumetric water meter data are in extremely close agreement, the flush count appears to show an under-recording of water demand by a ratio of 1.7:1.5. In the absence of data from ULFT installations in other settings, it could be argued that flush count systems are reliable tools for monitoring the true water demand of these ULFTs, albeit an error of 0.2 L (11.8%) per flush might be conservatively added to each “count”.
Significant water savings were achieved across the study period. This is supported by theoretical calculations based on ULFT flush count and corresponding flush volume; as well as manual metered readings collected for billing purposes (Figure 5). Firstly, ULFTs were calculated to have been flushed 257,925 times over a six-month period. If we conservatively assume each ULFT flush corresponds to an average of 1.7 L of water consumption then an annual water demand reduction of 2287 m3 can be inferred for this trial location (compared to traditional 6 litre WCs). It is noted that a longer timeseries of water demand data may identify seasonal variations which impact the overall water savings and studies into this element are ongoing.
Secondly, analysis of the manual metered reading collected for billing purposes suggested there was only a statistically significant reduction in two buildings’ after the installation of UFLTs. Significant differences in water consumption may have been masked by other water-consuming components, such as sinks and urinals which remained unchanged in the study. Digital turbine flow sensors were fitted in the Harrison Building only, with the purpose of isolating flow information to enable differentiation between total consumption at the component level. There was a total 342 m3 of potable water consumed in the Harrison Building during the 177 days studied: Arising from toilet use (175 m3, 51.2%); urinal use (148 m3, 43.3%) and lastly, sink use (19 m3, 5.5%). The value for sinks is likely underestimated (and thus the value for toilets and/or urinals may be overestimated), as not all sinks in the Harrison Building washrooms could be monitored due to on-site constraints. Only three of the eight washrooms in the Harrison Building have water-consuming urinals. Despite this, all of the buildings (with the exception of Laver) showed a reduction in median monthly consumption from 2018 to 2019. This reduction was considerable, ranging from 16–62% based on manual meter readings, after the installation of UFLTs.
4.2. Cost Savings
Cost savings have been calculated assuming a volumetric cost of water of £5.50/m3, as confirmed by UoE estates team. On average, the 119 ULFTs installed on Streatham Campus realised savings of over £36.00 per day compared to toilets with 6 litre flush volumes. Hence, annual savings are projected to exceed £12,500.
4.3. Sewer Blockages
The key novelty within this study sits around the wide-scale installation of ULFTs within a retrofit environment. The monthly observations captured by the drainage engineers and project team represent a snapshot into the occurrences of blockages, sediment build up and flow regime downstream of the trial. The key limitation to this approach is the lack of flow monitoring that could bring value to these observations. In an ideal monitoring set up, each manhole might be fitted with an ultrasonic level/flow sensor and this data integrated with the known flush timings for upstream ULFTs. Such a regime was outside the scope of this project but may shed more light on the true flow regime immediately downstream of the ULFTs. With the observations from the drainage engineers set out in the traffic light plots, this project has been able to identify two locations where poor drainage pipework caused buildup of toilet roll (and hand roll) materials within the network. Specifically, these locations were both downstream from ladies WCs where urinal flush flows were not present. In addition, discussion with UoE maintenance teams confirmed that blockages were already occurring in these locations prior to implementation of the ULFT project. It is therefore important to distinguish between correlation and causation—i.e., whether blockages are more likely to be highlighted by a more extensive monitoring scheme or if they are directly caused by a reduction in flow from ULFTs. The absence of blockage or ragging issues downstream of male washrooms could be associated with the frequent flush flows from Passive Infrared urinal (PIR) controlled urinal systems. This in turn points to the possibility that urinal cisterns represent a useful network flushing mechanism. The trend to save water by upgrading traditional PIR urinals to waterless-urinals may present an increased risk to blockages in the immediate environs of buildings. As observed by the drainage engineer’s reports (Figure 6), no further blockages were observed downstream from the ULFT installations after the flush tanks were installed in the two female washrooms.
Wastewater flows leaving the ULFTs in the newest buildings in the trial (Innovation Building 1 and 2) entered a zone of sewer network that was generally of a high standard, with minimal faults. In all but one location downstream from these buildings, good flow conditions were reported at all times before and during the trial. These buildings include other high standard water demand management fittings, such as PIR taps, and waterless urinals. One might hypothesize that reducing the overall flush volume in this location would have the greatest blockage risk. However, this has not been borne out in the observations to date, perhaps implying that drainage systems built within the modern design standards can accommodate the lower discharge rates achieved by the ULFT without blockage issues developing.
Opportunities for further work are set out as follows: (1) This study focussed on the immediate environs of the downstream sewer network and assumes that infiltration, and mixing of flows from other wastewater streams lead to a steady dilution of sewer flows from ULFT discharges. The operation of sewer networks further downstream from ULFT devices could be further explored; (2) estates managers noted that hand-roll (“blue roll”) has been a problem within the sewer network and is frequently associated with blockages (throughout their campuses). There may be opportunities for hand dryer providers to explore the costs and benefits of replacing hand roll dispensers whilst looking at costs associated with blockages. Could installation of hand dryers save significant sewer maintenance (blockage removal) costs by removing the risk that users (inappropriately) flush hand roll into the sewer networks?
4.4. Maintenance Needs
The campus operates an asset reporting system that enables emails, calls or maintenance staff to raise faults to a central database. The campus’ WCs are cleaned daily, and thus any toilet not functioning is highly likely to be identified for maintenance within a 24 h period of a fault occurring. Failure to flush can be an expression of many faults or issues within the ULFT, which perhaps suggests why it was one of the most prevalent maintenance needs in the fault log. Ongoing work to evaluate the maintenance logs associated with washroom faults (across campus) will be completed to enable a full year of maintenance requirements to be established. Once the systems had become established, preliminary analysis of the data to September 2019 indicates that failures and faults associated with the ULFTs were reported to campus services approximately once every 15,000 flushes. Further work is needed to compare the maintenance reports against other traditional WCs on campus.
5. Conclusions
Evidence from the monitoring of water demand and sewer conditions was completed for 6 months following the installation of 119 ultra-low flush toilets (ULFTs). The large-scale trial of ULFTs on the UoE’s Streatham Campus was commissioned and designed principally to investigate the impact on real-world drainage systems of a large-scale deployment. Changes in water demand and efforts to maintain the new ULFTs were also explored.
- During the trial, no observations or reports were made that suggest that the presence of ULFTs have had a detrimental effect on drainage systems in and around the affected buildings.
- Two locations affecting manhole chambers downstream of Streatham Court and Harrison Building were identified by the drainage engineers upon commissioning of the ULFTs. Both locations were downstream of female washrooms without urinal flush systems. The manhole chambers were found to be suffering from an overload of toilet paper and following clearance the issue was solved by the installation of flush tanks, which automatically operated once daily. No further issues have been reported since their introduction.
- The water consumption data gathered alongside the ULFT installations show that the toilets in the trial experienced a broad range of usage levels due to the fluctuating occupancy levels on campus. Hence the trial covers a wide range of settings, with high use WCs and low use WCs being monitored.
- The sewer pipe networks receiving the flows ranged in quality, with some new systems built in accordance with modern design standards and other locations with shallow gradients, root ingress and cracked pipework.
- Between March and September 2019, ULFTs were flushed over 250,000 times. Over a year, when compared against toilets with a 6-litre flush volume we estimate that this equates to monetary savings for the UoE in excess of £105.00 per toilet from reduced water costs.
- Maintenance issues were primarily identified as long-term issues within the sewer networks (e.g., root ingress) or caused from the inappropriate flushing of paper towels (e.g., “blue roll” designed for drying hands adjacent to some hand basins).
6. Outlook
We recommend further investigations to support the projected cost savings outlined in this study. In particular, we are keen to explore the energy usage for the ULFTs in their as deployed state. Further work is underway to investigate costs and benefits more broadly. To support this, a series of ULFTs are now being monitored for their daily power consumption. We also anticipate that the increased prevalence of dual-flush and ULFT WCs (in the UK and further afield) opens new opportunities for the design of water reuse infrastructure. The significant demand reduction at ULFTs could for example be combined with an alternative water resource (e.g., rainwater harvesting) in order to fully displace potable water requirements, without the need for large storage systems for alternative water systems.
Author Contributions
Conceptualization, P.M.-S.; methodology, P.M.-S., A.N., and D.B.; validation, P.M.-S., S.C., and A.N.; formal analysis, P.M.-S., and S.C.; investigation, P.M.-S., and A.N.; resources, P.M.-S., S.C., A.N., and D.B.; data curation, P.M.-S.; writing—original draft preparation, P.M.-S. and S.C.; writing—review and editing, P.M.-S., S.C., and D.B.; visualization, P.M.-S. and S.C.; supervision, D.B.; project administration, P.M.-S.; funding acquisition, P.M.-S. and A.N. All authors have read and agreed to the published version of the manuscript.
Funding
The installation of monitoring was funded by Horizon 2020 Grant agreement ID: 778742 and the analysis conducted through a TWENTY65 leverage grant EPSRC Reference: EP/N010124/1.
Institutional Review Board Statement
Not applicable.
Informed Consent Statement
Not applicable.
Data Availability Statement
The water demand data used in this study has been published as supplementary data within Melville-Shreeve et al 2021. No further supplementary data is included in this study.
Acknowledgments
The authors are grateful for the support of Sam Dickinson (SDS Ltd.), Andy Seaman and Simon Tailford (University of Exeter Estates), and the countless project supporters from facilities, maintenance and cleaning teams at UoE.
Conflicts of Interest
Propelair® provided the ULFTs through funding from a Horizon 2020. Over the air analytics (OTA) limited were commissioned to install and capture data from data logging systems throughout the 12-month study period. The first author was a director of OTA during the initial phase of the monitoring but is no-longer financially linked to the company.
References
- Uelmen, J.A.; Aley, I.; Nehls, B.; Hicks, A. Sustainability Impacts of Installing Low-Flow Toilets in a University Residence Hall. Sustainability 2020, 13, 74–80. [Google Scholar] [CrossRef]
- Pérez-Urdiales, M.; García-Valiñas, M.Á. Efficient water-using technologies and habits: A disaggregated analysis in the water sector. Ecol. Econ. 2016, 128, 117–129. [Google Scholar] [CrossRef]
- Shuaeb, M.A.M.; Han, M. Clogging potential of low-flush toilet branch drain system. Urban Water J. 2017, 15, 68–74. [Google Scholar] [CrossRef]
- Mattsson, J.; Hedström, A.; Ashley, R.M.; Viklander, M. Impacts and managerial implications for sewer systems due to recent changes to inputs in domestic wastewater—A review. J. Environ. Manag. 2015, 161, 188–197. [Google Scholar] [CrossRef] [PubMed]
- Web of Science. Publication Years for TOPIC: (Low Flush Toilet). Available online: http://wcs.webofknowledge.com/RA/analyze.do?product=WOS&SID=C3eUku1CGN7lV412eg1&field=PY_PublicationYear_PublicationYear_en&yearSort=true (accessed on 18 December 2020).
- Penn, R.; Schütze, M.; Friedler, E. Modelling the effects of on-site greywater reuse and low flush toilets on municipal sewer systems. J. Environ. Manag. 2013, 114, 72–83. [Google Scholar] [CrossRef] [PubMed]
- Parkinson, J.; Schütze, M.; Butler, D. Modelling the impacts of domestic water conservation on the sustainability of the urban sewerage system. Water Environ. J. 2015, 19, 49–56. [Google Scholar] [CrossRef]
- Friedler, E.; Hadari, M. Economic feasibility of on-site greywater reuse in multi-storey buildings. Desalination 2006, 190, 221–234. [Google Scholar] [CrossRef]
- Marleni, N.; Gray, S.; Sharma, A.; Burn, S.; Muttil, N. Impact of water management practice scenarios on wastewater flow and contaminant concentration. J. Environ. Manag. 2015, 151, 461–471. [Google Scholar] [CrossRef] [PubMed]
- Drinkwater, A.; Chambers, B.; Waylen, C. Less Water to Waste: Impact of Reductions in Water Demand on Wastewater Collection and Treatment Systems; WRc Report to UK Environment Agency: Bristol, UK, 2008; p. 85.
- Bailey, T.C.O.; Arnot, E.J.M.; Blokker, Z.; Kapelan, J.; Vreeburg, J.; Hofman, J. Developing a stochastic sewer model to support sewer design under water conservation measures. J. Hydrol. 2019, 573, 908–917. [Google Scholar] [CrossRef] [Green Version]
- Fane, S.; Schlunke, A. Opportunities for More Efficient Toilets in Australia—How Low Can We Go? 3rd National Water Efficiency Conference; Institute for Sustainable Futures, University of Technology: Sydney, Australia, 2008; Available online: http://cfsites1.uts.edu.au/find/isf/publications/fane2008efficienttoilets.pdf (accessed on 21 November 2020).
- Propelair 2020. How it Works. Available online: https://propelair.com/propelair-toilet/ (accessed on 17 December 2020).
- Littlewood, K.; Memon, F.A.; Butler, D. Down-stream implications of ultralow flush WCs. In Proceedings of the 2nd IWA International Conference on Sewer Operation and Maintenance SOM, Vienna, Austria, 26–28 October 2006. [Google Scholar]
- Millan, A.M.; Memon, F.A.; Butler, D.; Littlewood, K. User perceptions and basic performance of an innovative WC. Water Management Challenges in Global Change. In Proceedings of the CCWI2007 and SUWM2007 Conference, Leicester, UK, 3–5 September 2007. [Google Scholar]
- European Commission Periodic Reporting for Period 2—Propelair. Available online: https://cordis.europa.eu/project/id/778742/reporting (accessed on 10 April 2020).
- University of Exeter. Ultra Low Water-Use Toilets to Help Meet Ambitious Sustainability Goals. Available online: https://www.exeter.ac.uk/news/staff/title_688094_en.html (accessed on 29 June 2020).
- Met Office, National Meteorological Library and Archive Fact Sheet 7—Climate of South West England. 2013. Available online: https://www.metoffice.gov.uk/binaries/content/assets/metofficegovuk/pdf/research/library-and-archive/library/publications/factsheets/factsheet_7-climate-of-south-west-england.pdf (accessed on 18 December 2020).
- Melville-Shreeve, P.; Cotterill, S.; Butler, D. Capturing High Resolution Water Demand Data in Commercial Buildings. J. Hydroinform. 2021, in press. [Google Scholar]
- DartEye, Mini DartEye DartEye Mini Pipeline Inspection Camera. Available online: https://www.dartsystems.co.uk/images/pdfs/Mini_DartEyeHR.pdf (accessed on 18 December 2020).
- IBM Corp. IBM SPSS Statistics for Windows; Version 26.0; IBM Corp.: Armonk, NY, USA, 2019. [Google Scholar]
- Waterwise. Leaky Loos Phase II, Water Industry Collaborative Fund Project. Available online: https://www.waterwise.org.uk/wp-content/uploads/2018/08/Leaky-Loos-Phase-II_Final-report.pdf (accessed on 17 December 2020).
Figure 1.
Survey locations for sub sections of the Drainage Survey where: (A) Amory Building, (B) Harrison Building, (C) Innovation 1 and 2, (D) Kay Building, (E) Laver Building and (F) Streatham Court. Red dots indicate manholes surveyed (with associated manhole ID), green lines indicate where a washroom with ULFTs enter a manhole chamber.

Figure 2.
Example page from the Drainage Survey Summary Report illustrating changes to flow conditions on two separate survey dates (July–August 2019). (The drainage engineer observed that the upstream chamber (RHS) shows some waste build up in July 2019, which was no longer present in August 2019).

Figure 3.
Total observed and adjusted flushes per building during the six-month study. Total number of maintenance issues resulting in a failure to flush shown on the secondary axis.
Figure 3.
Total observed and adjusted flushes per building during the six-month study. Total number of maintenance issues resulting in a failure to flush shown on the secondary axis.

Figure 4.
Comparison of flush counts, flow meters and water meter at HB-02-289-M-2.

Figure 5.
Comparison of estimated monthly consumption based on (A) manual monthly readings the Amory building between March–September 2018 (prior to ULFT installation; blue) and March–September 2019 (during this study; grey); and (B) mean meter readings for the aforementioned periods in 2018 (blue), 2019 (green) for each building.

Figure 6.
Photograph of Manhole HB 1 from lift and look surveys in December 2018 and April 2019. The image on the left-hand side shows a blockage in the chamber caused by a build-up of rag.
Figure 6.
Photograph of Manhole HB 1 from lift and look surveys in December 2018 and April 2019. The image on the left-hand side shows a blockage in the chamber caused by a build-up of rag.

Figure 7.
Example traffic light plot illustrating changes in sewer conditions at a series of nine manhole chambers outside the Harrison Building.
Figure 7.
Example traffic light plot illustrating changes in sewer conditions at a series of nine manhole chambers outside the Harrison Building.


Table 1.
Summary of water meter data collection installed within the project.
| Amory | Harrison | Innovation 1 and 2 | Kay | Laver | Streatham | |
|---|---|---|---|---|---|---|
| Washrooms | 10 | 8 | 8 | 1 | 3 | 8 |
| Flush Counters | 41 | 28 | 21 | 2 | 9 | 18 |
| Flow Meters | 0 | 20 | 0 | 0 | 0 | 0 |
Publisher’s Note: MDPI stays neutral with regard to jurisdictional claims in published maps and institutional affiliations. |
© 2021 by the authors. Licensee MDPI, Basel, Switzerland. This article is an open access article distributed under the terms and conditions of the Creative Commons Attribution (CC BY) license (http://creativecommons.org/licenses/by/4.0/).
Share and Cite
MDPI and ACS Style
Melville-Shreeve, P.; Cotterill, S.; Newman, A.; Butler, D. Campus Study of the Impact of Ultra-Low Flush Toilets on Sewerage Networks and Water Usage. Water 2021, 13, 419. https://doi.org/10.3390/w13040419
AMA Style
Melville-Shreeve P, Cotterill S, Newman A, Butler D. Campus Study of the Impact of Ultra-Low Flush Toilets on Sewerage Networks and Water Usage. Water. 2021; 13(4):419. https://doi.org/10.3390/w13040419
Chicago/Turabian StyleMelville-Shreeve, Peter, Sarah Cotterill, Alex Newman, and David Butler. 2021. "Campus Study of the Impact of Ultra-Low Flush Toilets on Sewerage Networks and Water Usage" Water 13, no. 4: 419. https://doi.org/10.3390/w13040419
Note that from the first issue of 2016, this journal uses article numbers instead of page numbers. See further details here.