
Spatial Characteristics of Groundwater Chemistry in Unzen, Nagasaki, Japan


1
Institute of Integrated Science and Technology, Nagasaki University, 1-14 Bunkyo-machi, Nagasaki 852-8521, Japan
2
Liberal Arts Education Center, Tokai University, 9-1-1 Toroku, Higashi-ku, Kumamoto 862-8652, Japan
3
Division of Water Resources Engineering & Centre for Advanced Middle Eastern Studies, Lund University, Box 118, SE-221 00 Lund, Sweden
*
Author to whom correspondence should be addressed.
Water 2021, 13(4), 426; https://doi.org/10.3390/w13040426
Submission received: 4 January 2021
/
Revised: 1 February 2021
/
Accepted: 2 February 2021
/
Published: 5 February 2021
(This article belongs to the Section Hydrology)
Abstract
:Nitrate pollution in groundwater is a serious problem in Shimabara Peninsula, Nagasaki, Japan. A better understanding of the hydrogeochemical evolution of groundwater in vulnerable aquifers is important for health and environment. In this study, groundwater samples were collected at 12 residential and 57 municipal water supply wells and springs in July and August 2018. Nitrate (NO3−N) concentration at eight sampling sites (12%) exceeded Japanese drinking water standard for NO3 + NO2−N (10 mg L−1). The highest nitrate concentration was 19.9 mg L−1. Polluted groundwater is distributed in northeastern, northwestern, and southwestern areas, where land is used for intensive agriculture. Correlation analysis suggests that nitrate sources are agricultural fertilizers and livestock waste. Dominant groundwater chemistry is (Ca+Mg)−HCO3 or (Ca+Mg)−(SO4+NO3) type. Groundwater with higher nitrate concentration is of (Ca+Mg)−(SO4+NO3) type, indicating nitrate pollution affecting water chemistry. Principal component analysis extracted two important factors controlling water chemistry. The first principal component explained dissolved ions through water–rock interaction and agricultural activities. The second principal component explained cation exchange and dominant agricultural effects from fertilizers. Hierarchical cluster analysis classified groundwater into four groups. One of these is related to the dissolution of major ions. The other three represent nitrate pollution.
1. Introduction
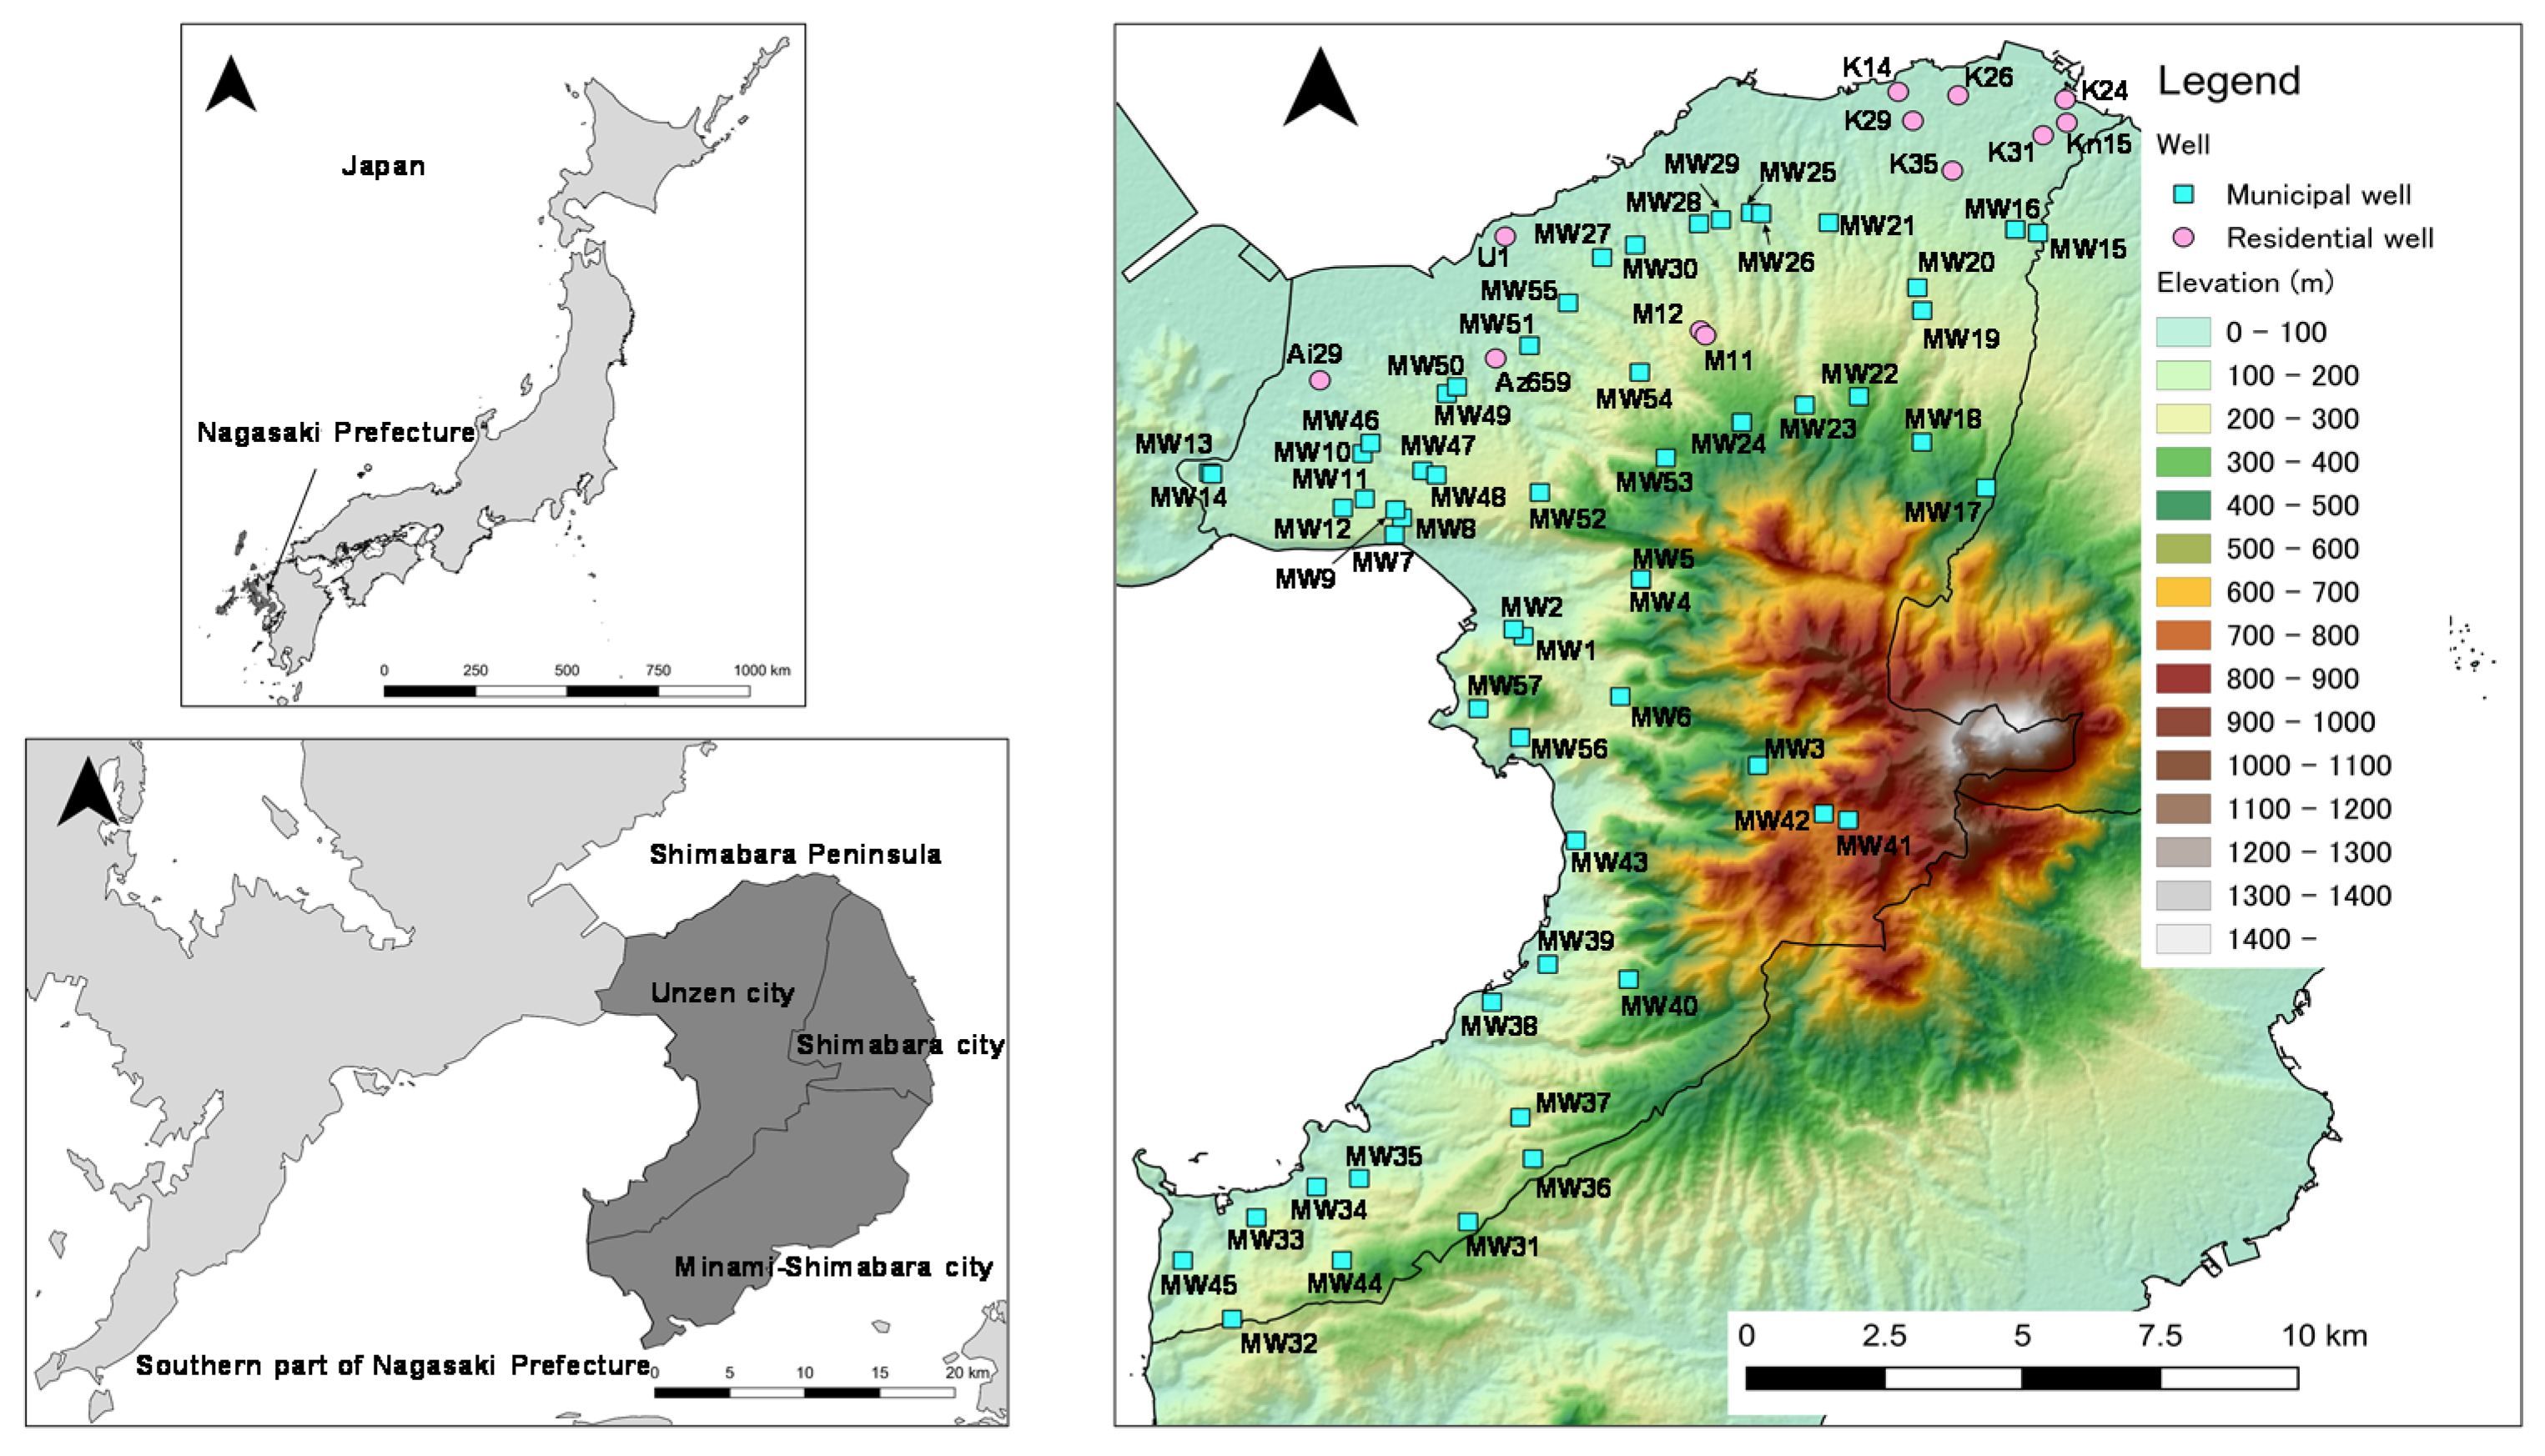
Shimabara Peninsula in Nagasaki Prefecture, Japan is composed of three municipalities: Shimabara City, Unzen City, and Minami-Shimabara City. The peninsula is an important agricultural and livestock region. The cultivated area occupies about 12,100 ha of the total 45,962 ha of the peninsula [1]. Agricultural production areas for potatoes, vegetables, industrial crops, and fruit farms represent about 62.7% of the cultivated area. Crops such as carrots, lettuce and Chinese cabbage are main crops cultivated throughout the year. In terms of livestock, the number of milk cattle and chicken (70% of all livestock) is about 7000 and 1,236,000, respectively [1]. The peninsula includes an important environment. Shimabara Peninsula was recognized as a UNESCO Global Geopark in 2009. The Unzen Volcano, located in the center of the peninsula, has been active during the last half a million years. Thus, the peninsula has been formed by continuous eruptions and mountain collapses. The central part, surrounded by faults, began sinking 300,000 years ago and the subsidence is ongoing. The subsidence zone is called Unzen Volcanic Graben, which has a width of about 20 km in an east-west direction and 10 km in a north–south direction [2]. Its subsidence rate is estimated at 2 mm/year. The graben stores large amounts of groundwater in the thick layers of Unzen pyroclastic rocks and alluvial fan gravel that constitute the aquifer material [3]. Groundwater spring outflow occurs mainly in the western part of the peninsula. Due to the abundance of groundwater, almost all water uses in the Shimabara Peninsula for agriculture, industry, and drinking water are from groundwater supply. The used drinking water reached 17.6 million m3 in 2014 [1].
Groundwater, however, is under stress due to increasing nitrate pollution. In 2014, 12 out of totally 157 tap water sources, displayed higher nitrate nitrogen (NO3−N) levels than the Japanese drinking water standards of 10 mg L−1 [1]. The highest contents were found in Shimabara City, where 6 out of 26 sources did not meet the Japanese standard. Unzen City showed the second highest nitrate rates (4 out of 60 sources). The lowest rates (2 out of 71 sources) were found in Minami-Shimabara City. The maximum NO3−N level was 22.2 mg L−1. In the recent five-year period, nitrate pollution in groundwater has been reported in many countries (e.g., Spain [4], Italy [5], Morocco [6], Tunisia [7], Syria [8], Iran [9], Pakistan [10], Thailand [11], China [12], America [13], Mexico [14], and Brazil [15]). For example, very high NO3−N concentrations were found in Italy (133 mg L−1) [5]. These studies indicate that potential pollution sources are often domestic and industrial wastewater, seepage water from cesspits and septic tanks, fertilizers, and manure. According to Nakagawa et al. [16], in Shimabara City, nitrate pollution in groundwater is related to intensive agriculture. Nitrate pollution is spreading not only in groundwater but also in surface water [17]. These studies demonstrated that the pristine water chemistry of type Ca−HCO3 is gradually changing to Ca−(SO4+NO3) due to the nitrate pollution. However, detailed research on nitrate pollution, water chemistry, and hydrogeochemical processes of groundwater is still mainly limited to Shimabara City [16,18,19,20,21]. For other locations as well, a better understanding of the hydrogeochemical evolution of groundwater in vulnerable aquifers is important for the protection of water resources, which is significantly related to the health of citizens. Therefore, the aim of this study was to investigate and improve the understanding of nitrate pollution and water chemistry of groundwater in Unzen City. A further objective was to arrive at possibilities for improving the regional groundwater situation.
2. Materials and Methods
2.1. Study Area
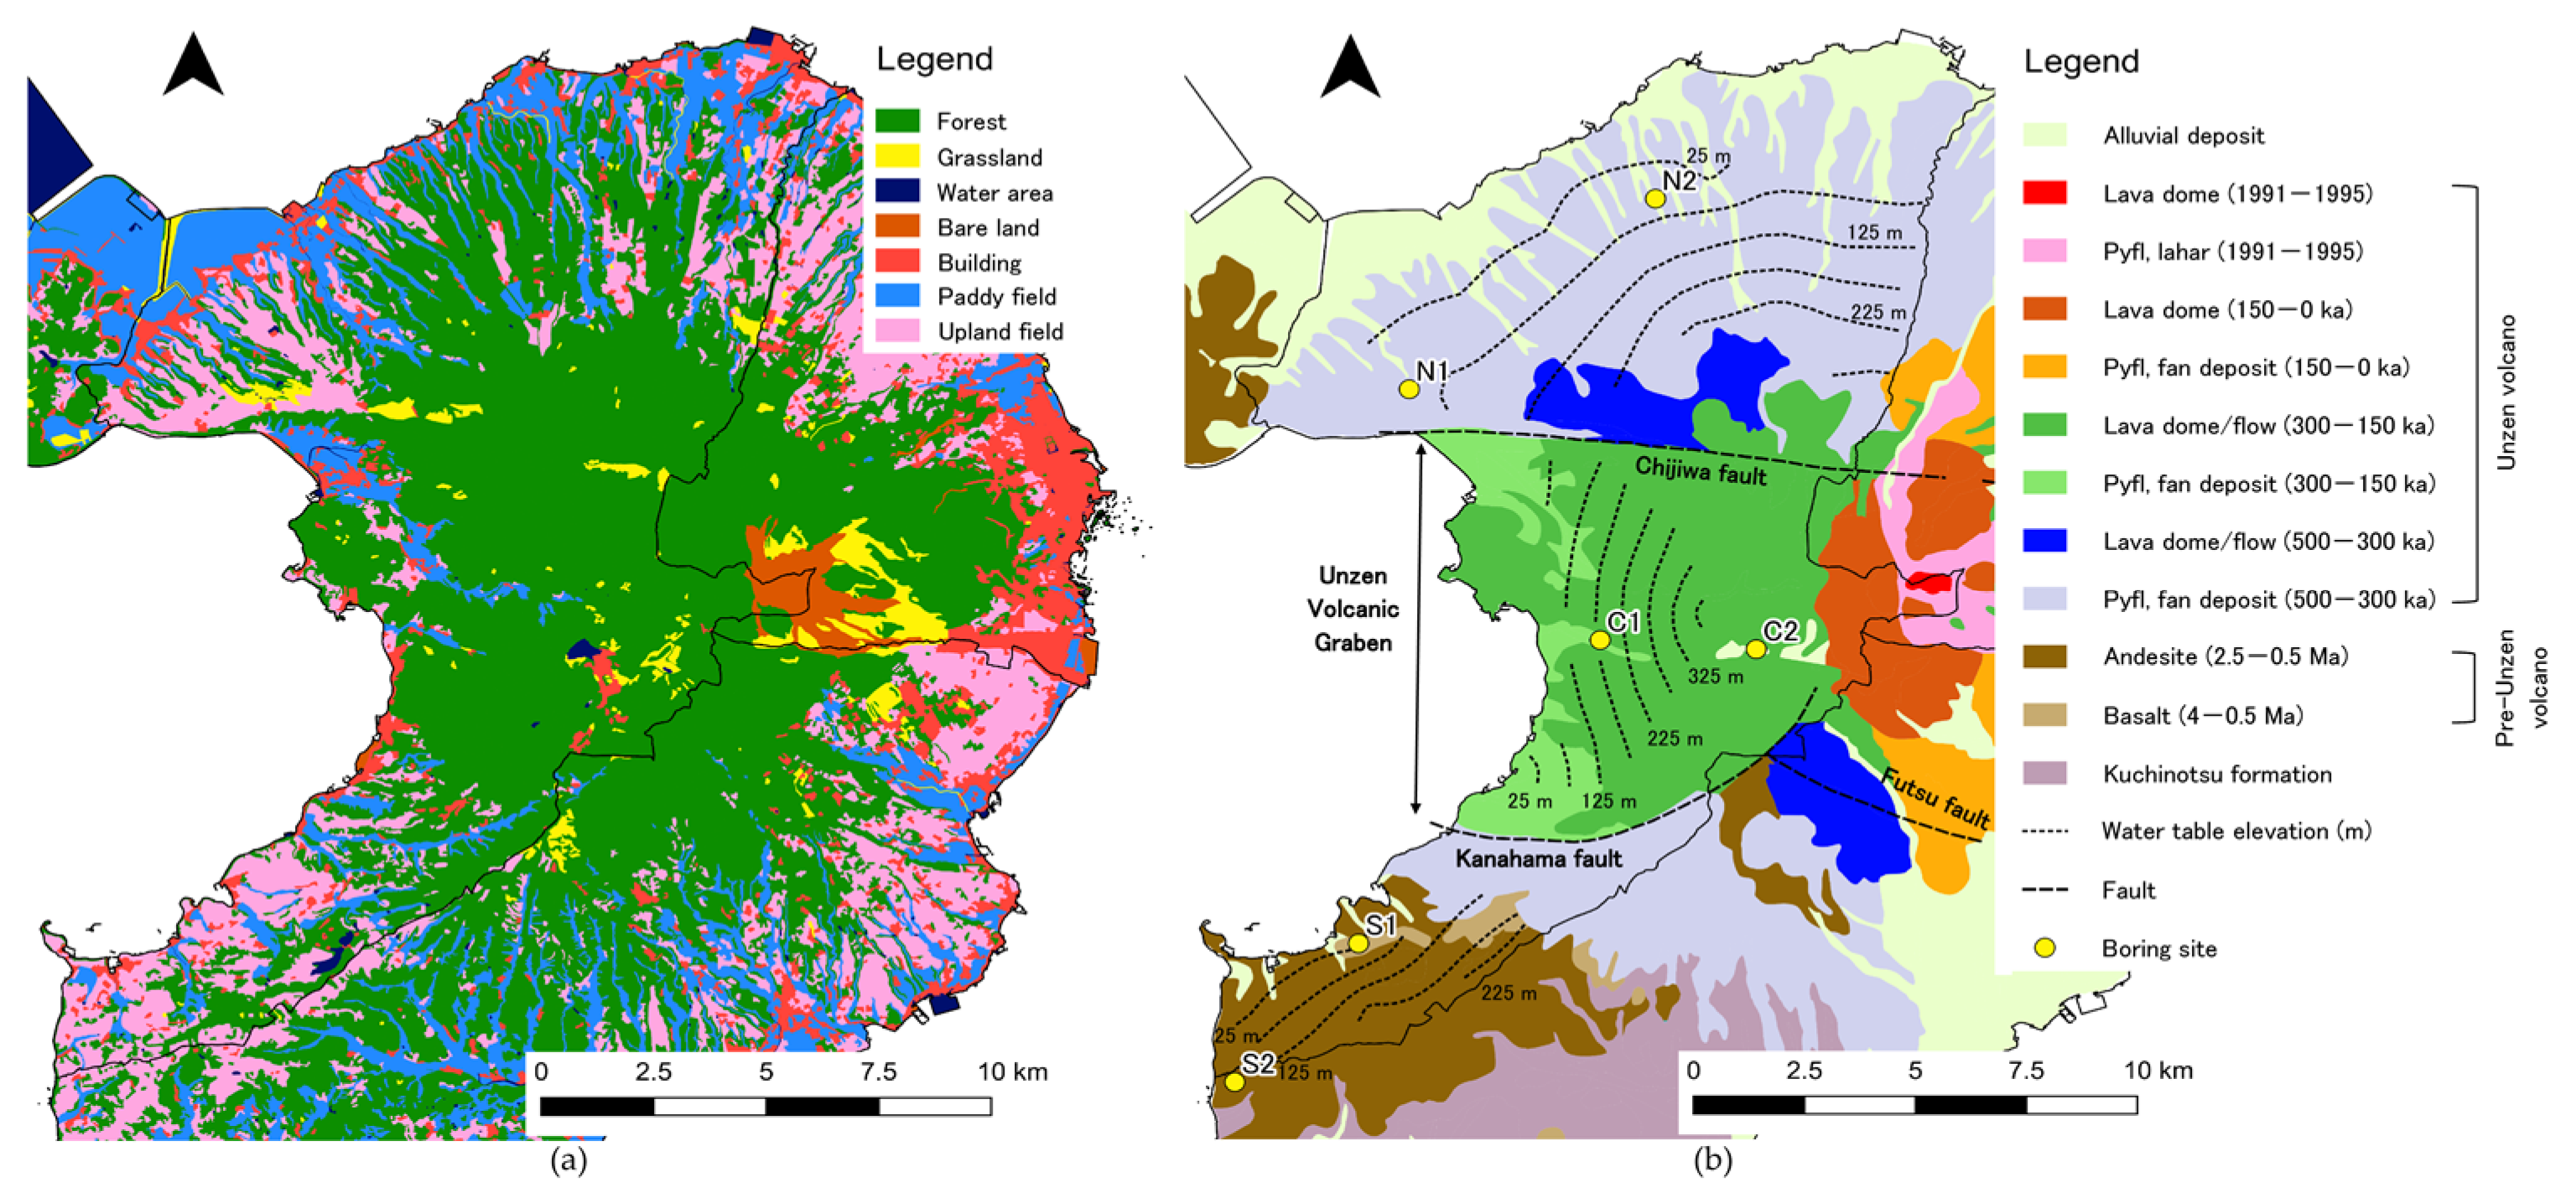
Unzen City is located in the western part of Shimabara Peninsula (Figure 1). Unzen City is the largest city among 3 municipalities in the peninsula, with an area of 21,472 ha. Forest occupies the largest parts of the area (Figure 2a). Cultivated agricultural areas represent 5150 ha [1], which is the second largest land cover. Of these, 2170 ha correspond to paddy fields. The remaining area of 2980 ha is agricultural fields for potatoes, vegetables, industrial crops, and fruit farms. As seen from the figure, cultivated areas are located to the north and south of the city. Urban areas are situated along the coastal line. The area belongs to humid subtropical climate with an average temperature of 12.9 °C and annual precipitation of 2939 mm (1988–2017; data from Unzen-dake observatory, 32°44.2′ N, 130°15.7′ E) [22]. The seasonal precipitation tends to be concentrated from June to August, accounting for one third of the annual total.
The geological structure of Shimabara Peninsula was reported by Murakami [3]. The city mainly lies on volcanic rock. An alluvial fan constituted of pyroclastic rocks with a gentle slope spreads from the northern parts of the city (Figure 2b and Figure 3). The rock, which cover Kuchinotsu Layer of basement rock, is called Pre-Unzen volcanic rocks. Above an elevation of 300 m, Unzen volcanic rocks are predominant. The volcanic rocks are andesite with large phenocryst of amphibole. Joints and fissures are well developed. As mentioned above, the central part is a depression zone formed by the Unzen Volcanic Graben. The graben is partitioned by the Chijiwa and Kanahama faults. The old (300–150 ka) and new volcanos are overlapping and form the steep mountainous area. Pre-Unzen volcanic rocks are distributed on a limited area. As a result, most of the central part are covered with Unzen volcanic rocks (Figure 2b and Figure 3). In the south, the Kuchinotsu Formation forms hills and plateaus. Tuff breccia/tuffaceous sand layer and pyroxene andesite lava (Pre-Unzen volcanic rocks) cover the Kuchinotsu Layer over a large area (Figure 2b and Figure 3). The mineralogical data of volcanic rocks were summarized by Sugimoto [23] as follows. The Pre-Unzen volcanic rocks are composed of olivine basalt and two-pyroxene andesite lava flows and pyroclastic. The Unzen volcanic rocks are composed of hornblende andesite to dacite lava domes, lava flows, and pyroclastic. The rocks also include plagioclase, hornblende, and biotite.
Since the groundwater flow is considered interrupted by the faults, the city, and experimental area, was divided into three regions. The unconfined groundwater level contours were drawn using kriging with Surfer 13 (Golden Software) based on the natural water level of municipal waterwork wells (Figure 2b). Following the alluvial fan formation, the groundwater flows from the center to the coastline in the northern region. In the central region, the groundwater flow direction is from east to west. The groundwater level contours are parallel to the coastline and the administrative boundary in the southern region, indicating that the groundwater flows from south-east to north-west. Oxygen and hydrogen stable isotope ratios indicate that groundwater-derived spring and river water are recharged from 300 to 850, 450 to 900, and 300 to 850 m above mean sea level in the northern, central, and southern region, respectively [24]. The isotope studies further show that the groundwater flow systems in the central region, which is inside the rift valley, and the north-south region, which is outside the rift valley, are independent and that the shallow groundwater in the central region is well mixed during flow.
2.2. Sampling and Analysis
Groundwater samples were collected from 12 residential wells and 57 municipal water supply wells and springs (Figure 1) in July and August 2018. In Japan, wells are generally divided into deep and shallow depending on if the depth is smaller or larger than 30 m. Except for MW39 and MW41, all municipal wells have a depth of 50–150 m. Spring water was sampled with a collection pipe or cut off wall at MW39 and MW41. Of the residential wells, three wells (K14, K24, and K29) are shallow. Other wells are deep. All samples were collected in pre-washed bottles and water from taps connected to the wells. Before sampling, stagnant water in the pipes was removed. Major dissolved ions (Cl−, NO3−, SO42−, Na+, K+, Mg2+, and Ca2+) were measured by using ion chromatography (Metrohm 861 Advanced Compact IC and Eco IC). Titration using 0.1N HCl determined HCO3−. Charge balance errors (CBE) were established for all groundwater samples according to [27]:
where all ion concentrations are expressed in mmolc L−1. All CBEs were confirmed to be less than about 10% (0.2–8.3%). Hydrochemical parameters such as dissolved oxygen (DO), oxidant redox potential (ORP), electrical conductivity (EC), and pH were measured in-situ by using a handy measure instrument (HORIBA D-51, and D-54).
Multivariate statistical techniques were used to analyze the hydrogeochemical status of the groundwater in the study area [28]. Principal component analysis (PCA) identified factors affecting groundwater chemistry such as anthropogenic and natural processes (e.g., discharge of domestic sewage, application of chemical fertilizer, water–rock interaction, and evaporation). Hierarchical cluster analysis (HCA) can classify water types in addition to traditional analysis methods such as Piper and Stiff diagrams. These methods were applied to the groundwater samples in Unzen City to improve the understanding of nitrate pollution and joint hydrogeochemical processes. The concentrations of eight major dissolved ion concentrations (HCO3−, Cl−, NO3−, SO42−, Na+, K+, Mg2+, and Ca2+) were selected as input data. The principal components were extracted based on the Kaiser criterion to only retain components with eigenvalues greater than 1. The HCA was performed based on Ward’s method. The statistical software JMP Pro 13 (SAS Institute Inc., Cary, NC, USA) was used for these multivariate analyses.
3. Results and Discussion
3.1. Water Chemistry
To improve the understanding how the Chijiwa and Kanahama faults affect the water chemistry in the experimental area, Hydrochemical components are summarized for the three fault separated regions as follows. In general, mean DO of about 8.0 mg L−1 indicates that groundwater is aerobic (Table 1). The lowest DO is 3.2 mg L−1; however, this is still above 2.0 mg L−1 which is the limit for denitrification [29]. Thus, low nitrate levels are not caused by denitrification. In general, there is a small difference regarding pH. Mean pH represents moderate alkalinity (Table 1). A pH from weak acid to weak alkaline is noted in the north and central regions. Unzen City is famous for volcanic hot spring water. One of the hot springs (Obama Hot Spring) located close to MW39 displays weak alkalinity (pH 7.9) [30]. Other hot spring water (Unzen Hot Spring) close to MW41 and MW42 has a pH of less than 2.0 [31]. Two sampling sites (MW41 and MW42) display weak acidity (pH 6.9 and 6.6, respectively).
Minimum EC is about the same in all regions (Table 1). On the other hand, the highest EC is significantly lower in the central region than in the other two regions. This is probably a consequence of differences in water–rock interaction time [32]. All ORP values are positive, indicating that groundwater is in oxic conditions (Table 1). Groundwater age is often related to redox conditions [33]. In general, young groundwater is likely to be oxic, and older groundwater (e.g., >100–1,000,000 years) is more likely to be anoxic [33]. Thus, groundwater in the study area is relatively young. Minimum ORP of 46 mV was found at MW46. In addition, compared to the two other regions, mean ORP is relatively small in the northern region. According to groundwater levels, the groundwater flow is slower in the northern region. Therefore, groundwater residence time is expected to be longer in this region compared to the other two and as a result, the ORP is smaller.
The trilinear Piper diagram was applied to classify water types (Figure 4). With respect to cations, groundwater samples are located close to the center in the cation triangle, indicating that cations have no specific characteristics. For anions, there is a low content of Cl, but HCO3 and SO4+NO3 contents vary. As a result, water samples are classified into Group I or Group III in the central key diagram, suggesting that the dominant water types are (Ca+Mg)−HCO3 or (Ca+Mg)−(SO4+NO3). Polluted water samples characteristically move from Group I to Group III. In general, groundwater chemistry in Unzen City is affected by nitrate pollution similar to Shimabara City [16].
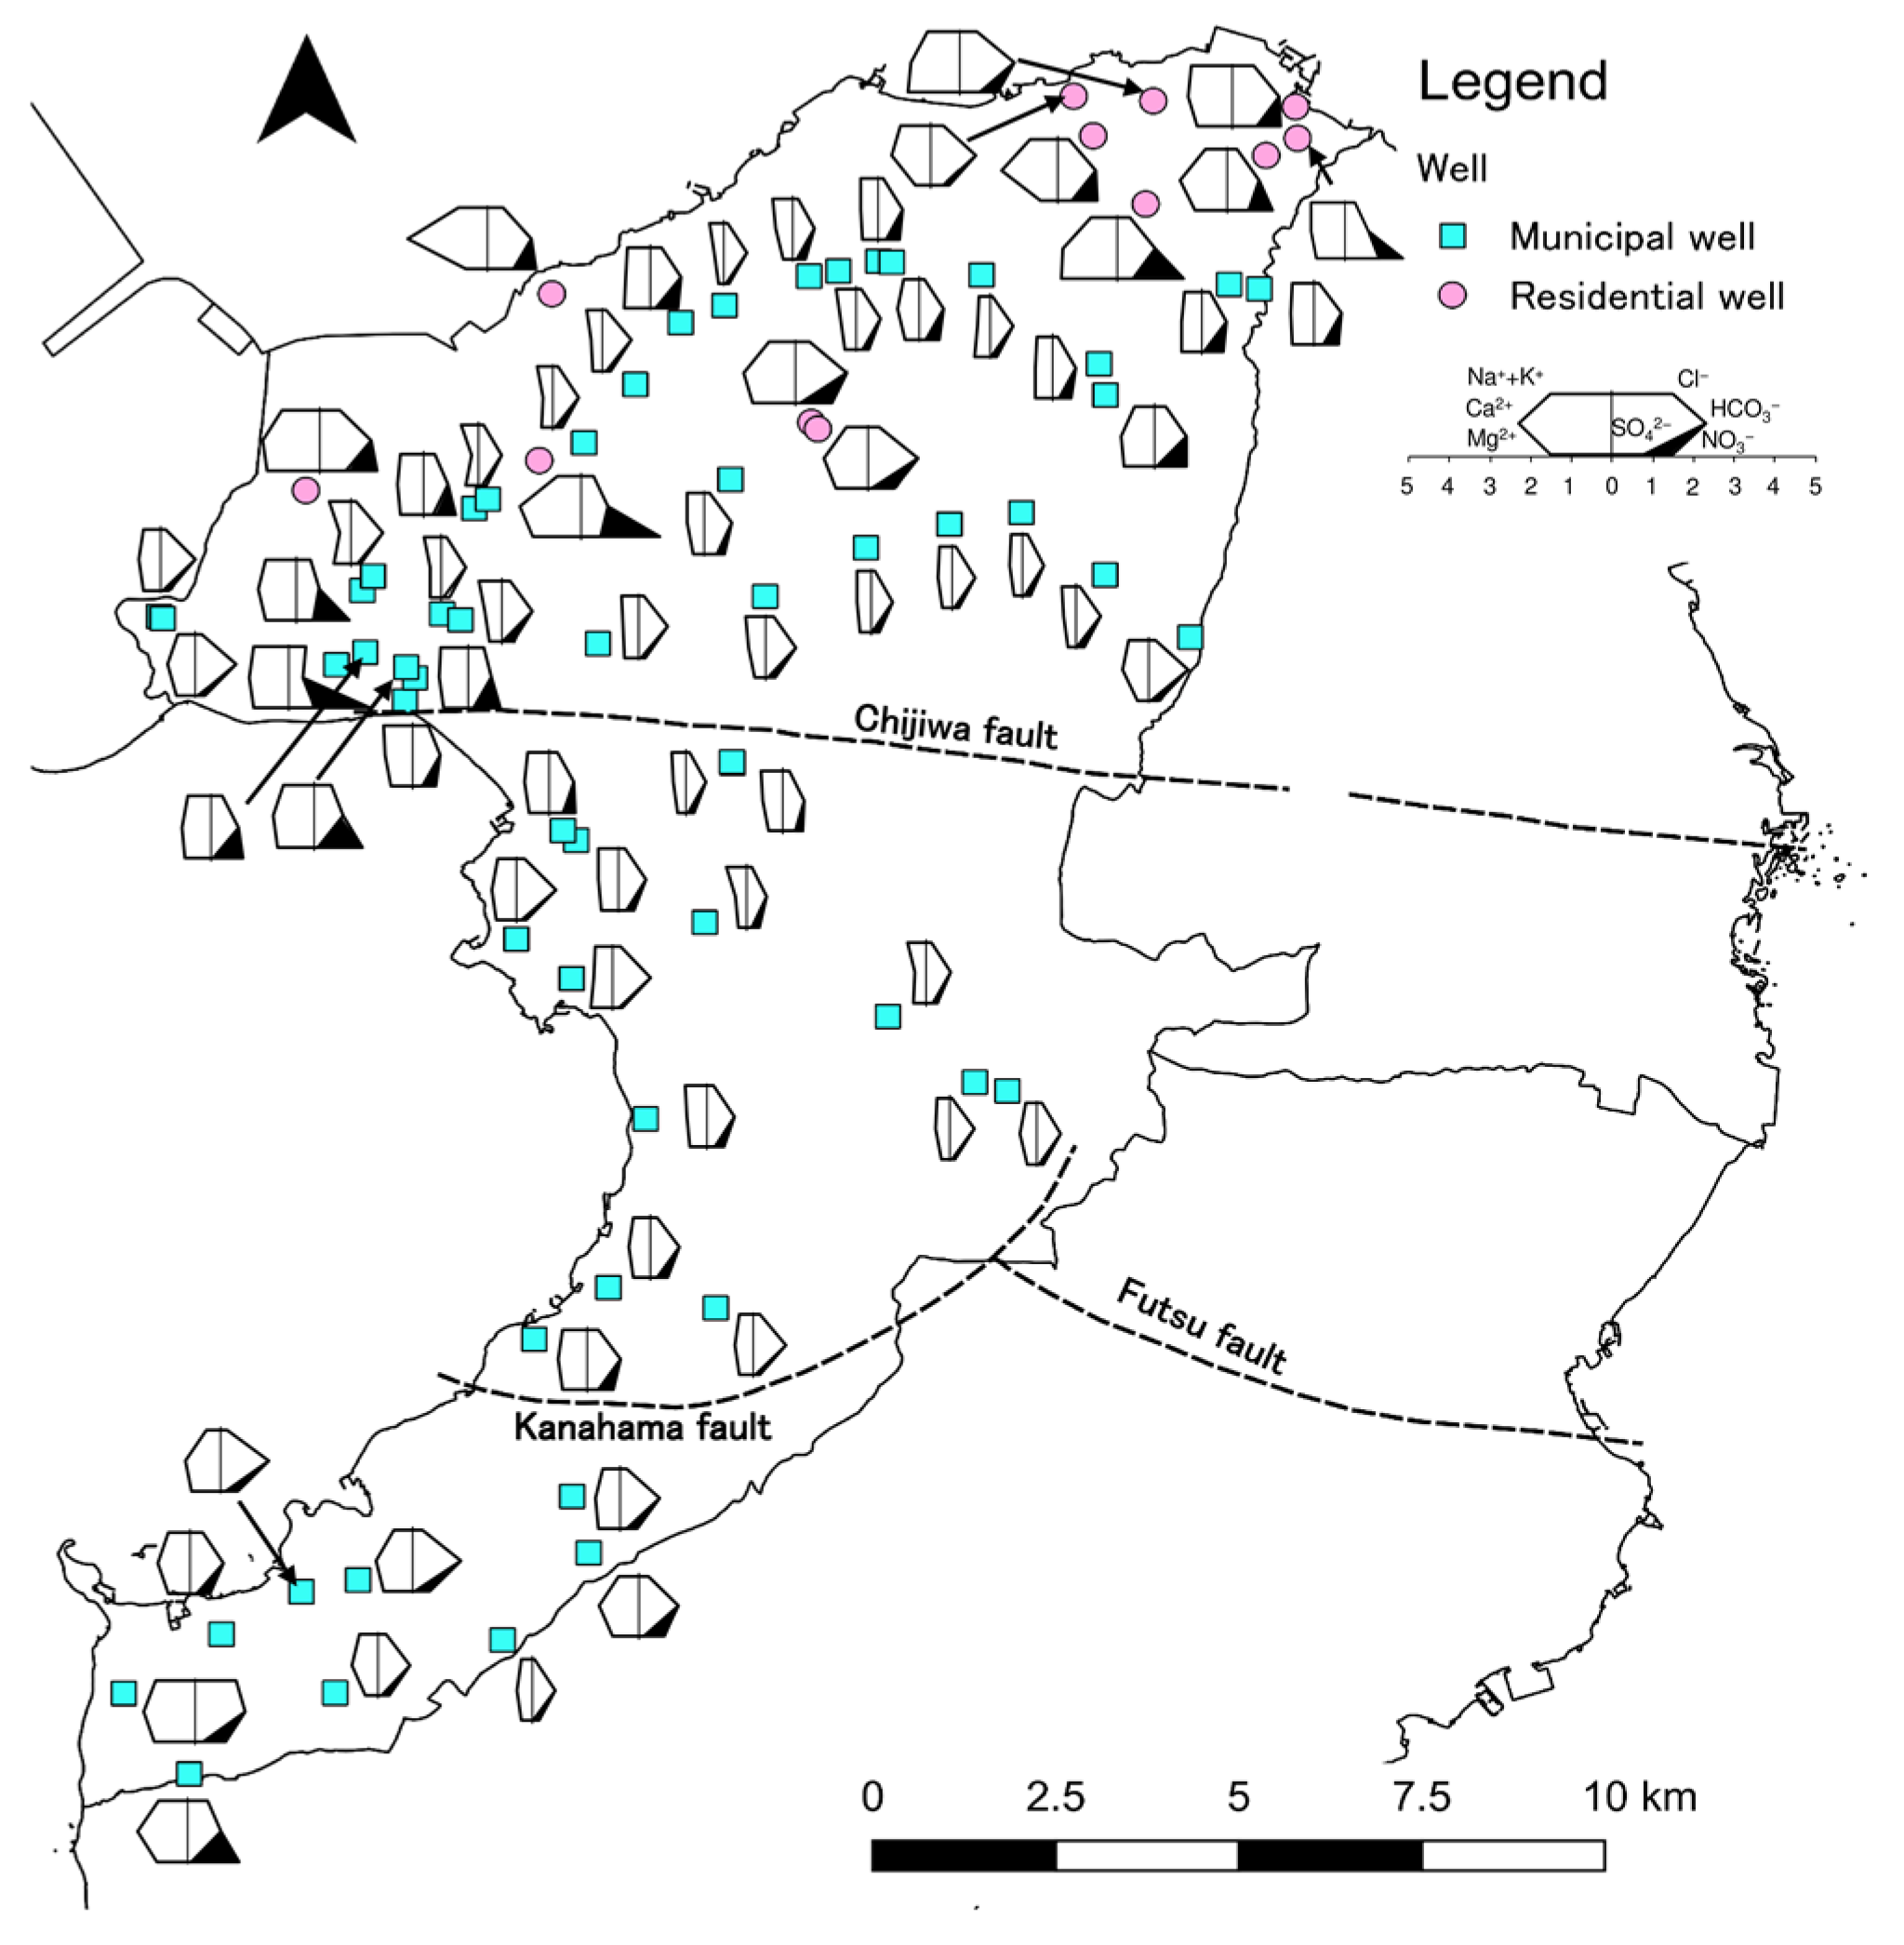
Evolution of groundwater chemistry is characterized by Stiff diagrams (Figure 5). Along the groundwater flow from upstream to downstream in the northern region, all ion concentrations show an increasing trend, i.e., Na+K and HCO3 tend to increase. A typical evolution pattern with maximum concentrations of all ions is controlled by ion dissolution from soil and rock during groundwater flow [16]. Another pattern is with Na+K and HCO3 when groundwater recharge occurs from paddy fields. Recharge, however, probably affected water chemistry because sampling was performed during the period when paddy fields are flooded. In addition, cation exchange between Ca and Na+K and/or other kinds of mineral dissolution are considered to adjust water chemistry [16]. In the central and southern regions, the characteristics of water chemistry are similar to that in the northern region, suggesting that the same factors as mentioned above control water chemistry. Near the coast, however, the ion concentrations in the central region tend to be small compared to that of the other regions. Since the EC is relatively low in the central region (Table 1), the water–rock interaction time is short. Although, the nitrate ion sector of the diagrams is noticeable only in the north and south regions, nitrate concentration in the north region tends to be higher than that in the north region. Thus, the characteristics of the three regions can be seen from nitrate and overall ion concentration.
3.2. Nitrate Pollution
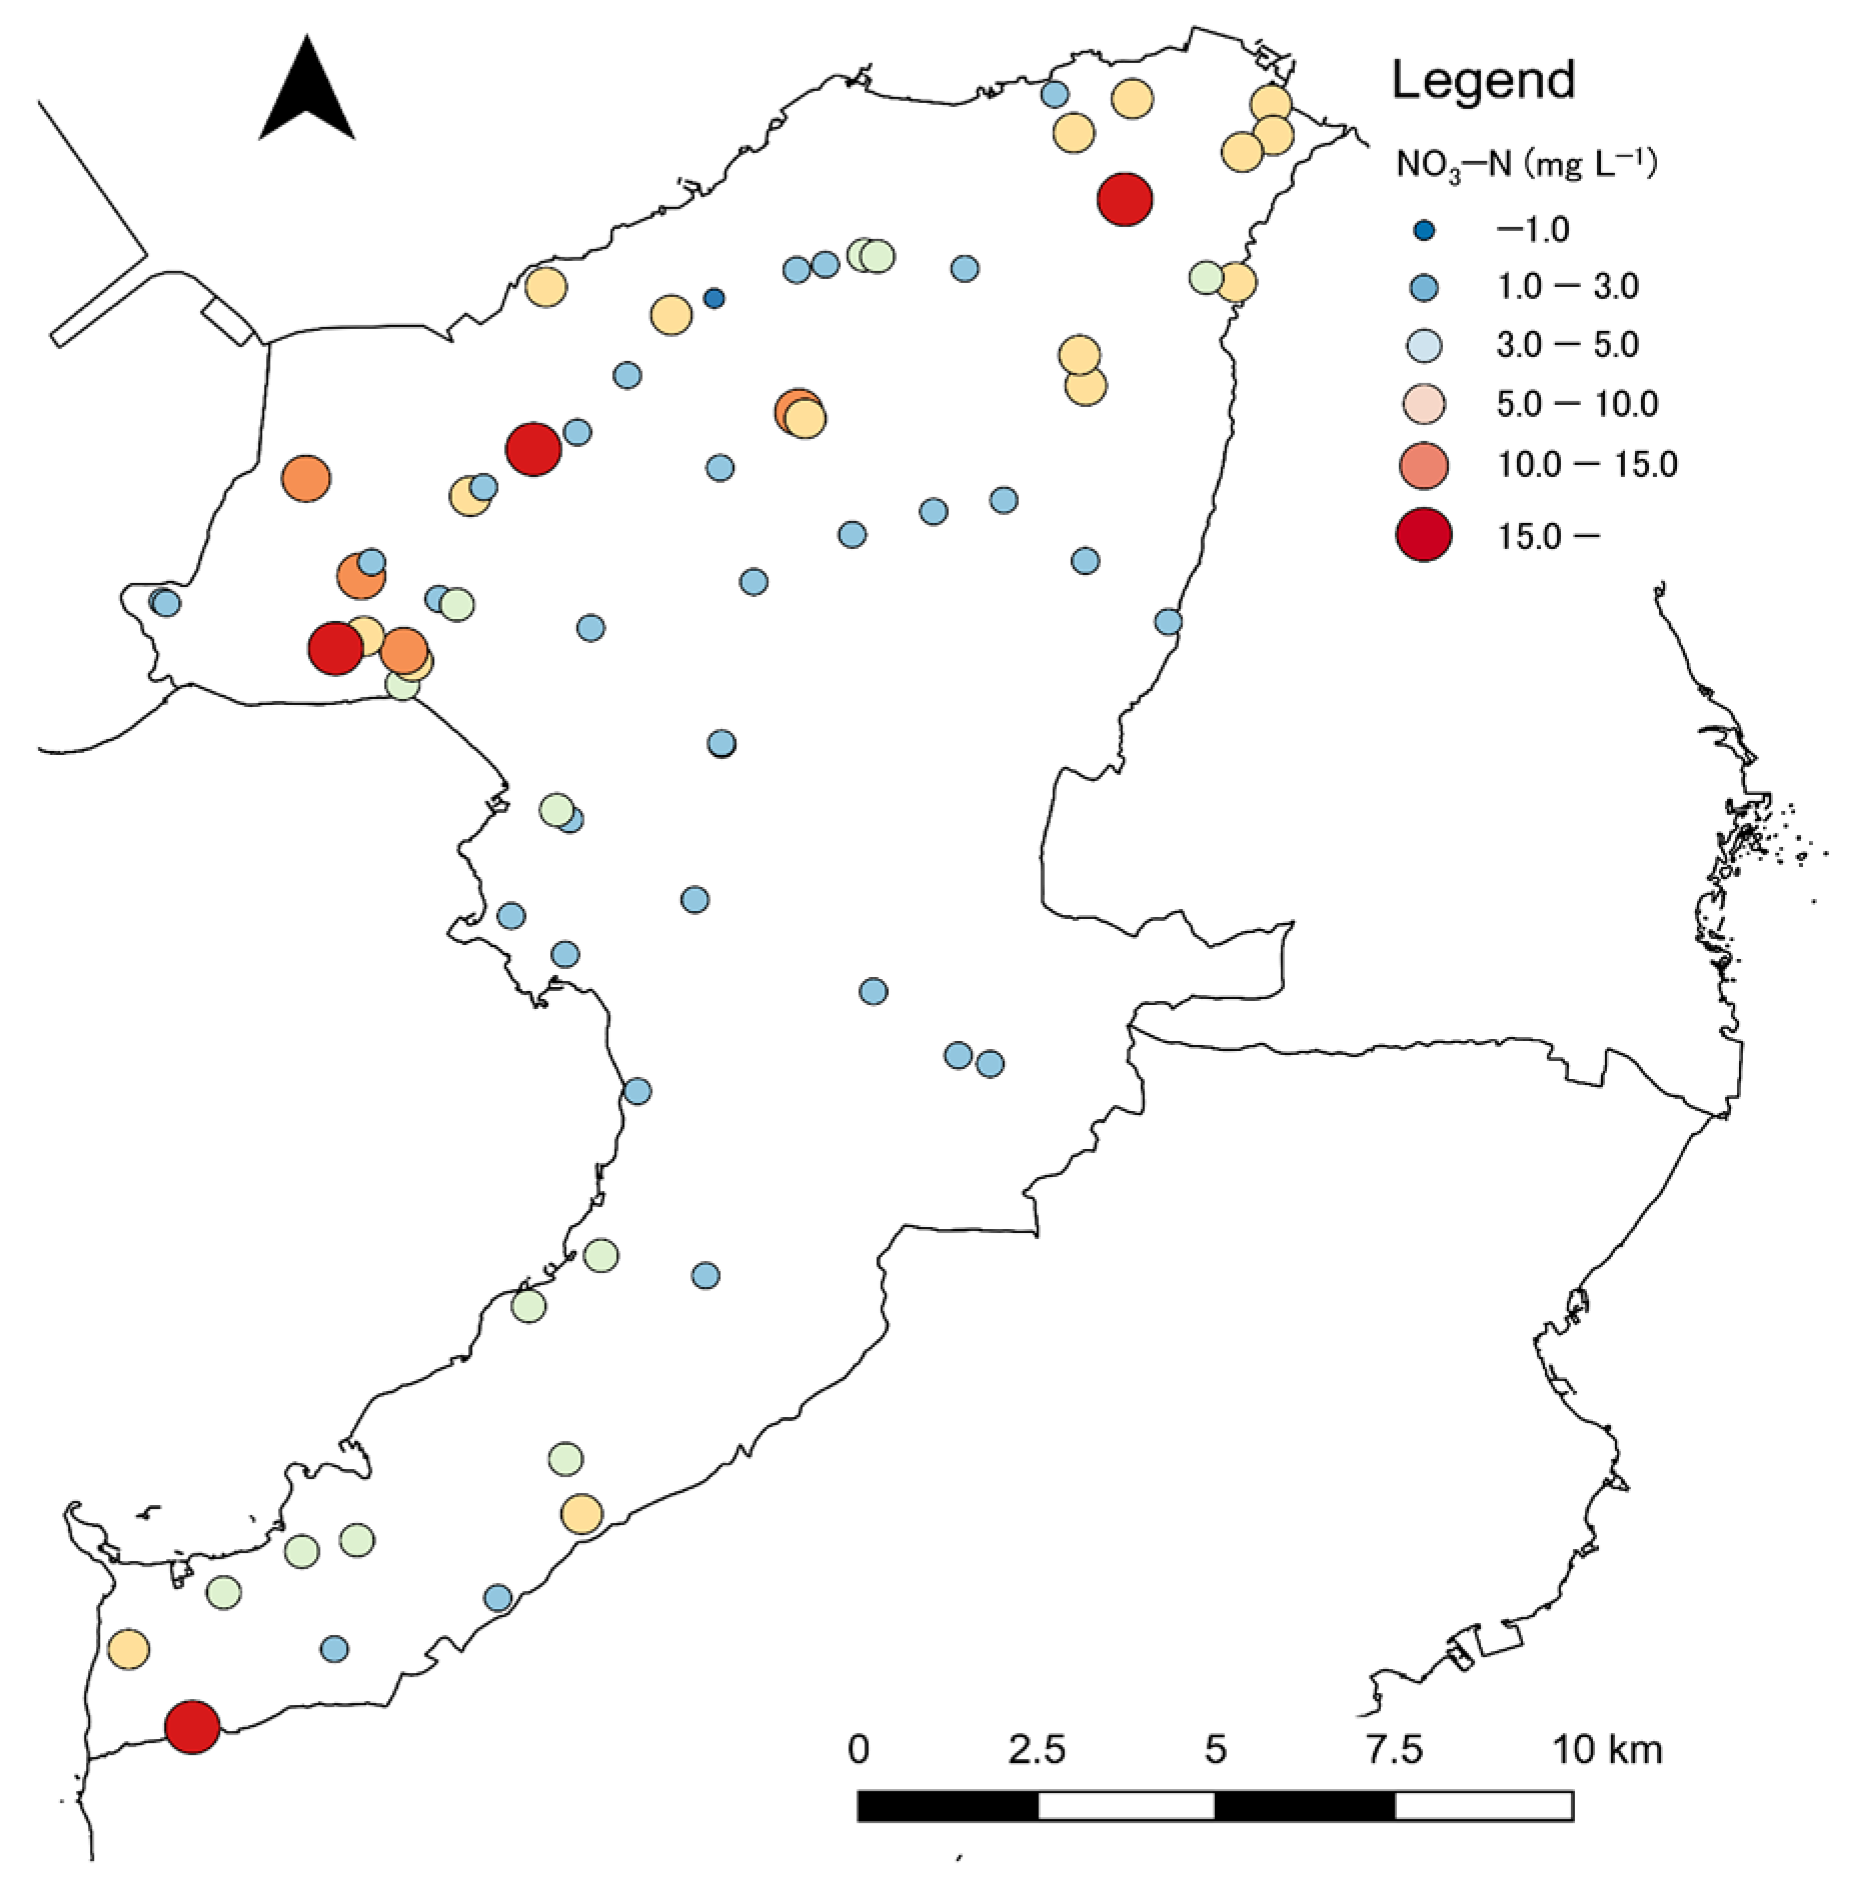
Nitrate levels (NO3−N) in Unzen City range from 0.6 to 19.9 mg L−1, with a mean of 5.2 mg L−1. The highest concentration appeared in a residential well (Az659). Compared to Japanese drinking standard for NO3+NO2−N (10 mg L−1) 4 of 57 (7%) for municipal wells and 4 of 12 (33%) for residential wells, respectively, do not meet this standard. A threshold of 3 mg L−1 is generally considered to be polluted by human activities [34], and 25 of 57 (44%) for municipal wells and 11 of 12 (92%) for residential wells exceeded this criterion. This means that most of the groundwater in the study area can be considered as polluted by nitrate. Nitrate levels in groundwater decrease with increasing sampling depth [35]. Since the depth of the most residential wells are shallower than that of municipal wells, the residential wells showed higher concentrations. The nitrate polluted wells are concentrated to the northern and southern regions (Figure 6). These locations coincide with the upland fields of Unzen City (Figure 2). This indicates that nitrate pollution in this area is associated with agricultural activities, especially crop production.
The correlation matrix of eight dissolved ion concentrations are summarized as follows (Table 2). NO3− shows relatively high correlation with Cl−, SO42−, Mg2+, and Ca2+. Similar correlation pattern was reported for Shimabara City [16]. Positive correlation between NO3− and Cl− (r = 0.62) indicates use of manure and livestock waste. Positive correlation (r = 0.51) between NO3− and SO42− reflects application of chemical fertilizers such as (NH4)2SO4. Chemical fertilizers MgCO3 and CaCO3 are applied with (NH4)2SO4 [16]. Thus, NO3− is positively correlated with Mg2+ (r = 0.80) and Ca2+ (r = 0.75), respectively. Applied calcareous material to modify soil acidification probably results in correlation between NO3− and Ca2+. Nitrogen load from livestock waste in Unzen City was estimated to be 4452 kg day−1 in 2014 [1]. Total fertilizer application of nitrogen was estimated to 3740 kg day−1 in 2013 [1]. Nitrogen load from domestic wastewater was estimated to 258 kg day−1 in 2014 [1]. Compared to livestock waste and fertilizers, domestic wastewater load contains much less nitrogen. The relative difference in pollution load from livestock waste and fertilizer can be seen in the observed SO42− concentration. For water samples with NO3−N concentrations exceeding the Japanese drinking water standard, SO42− concentrations are relatively small at MW9, MW32, and M12. SO42− concentrations ranged from 3.2 to 5.4 mg L−1 at these locations. On the other hand, SO42− concentrations at other locations (MW10, MW12, K35, Az659, and Ai29) are in the range between 18.6 and 30.6 mg L−1. At locations with high NO3−N and SO42− concentrations, chemical fertilizers such as (NH4)2SO4 are supposed to be a dominant pollution source.
3.3. Multivariate Analysis
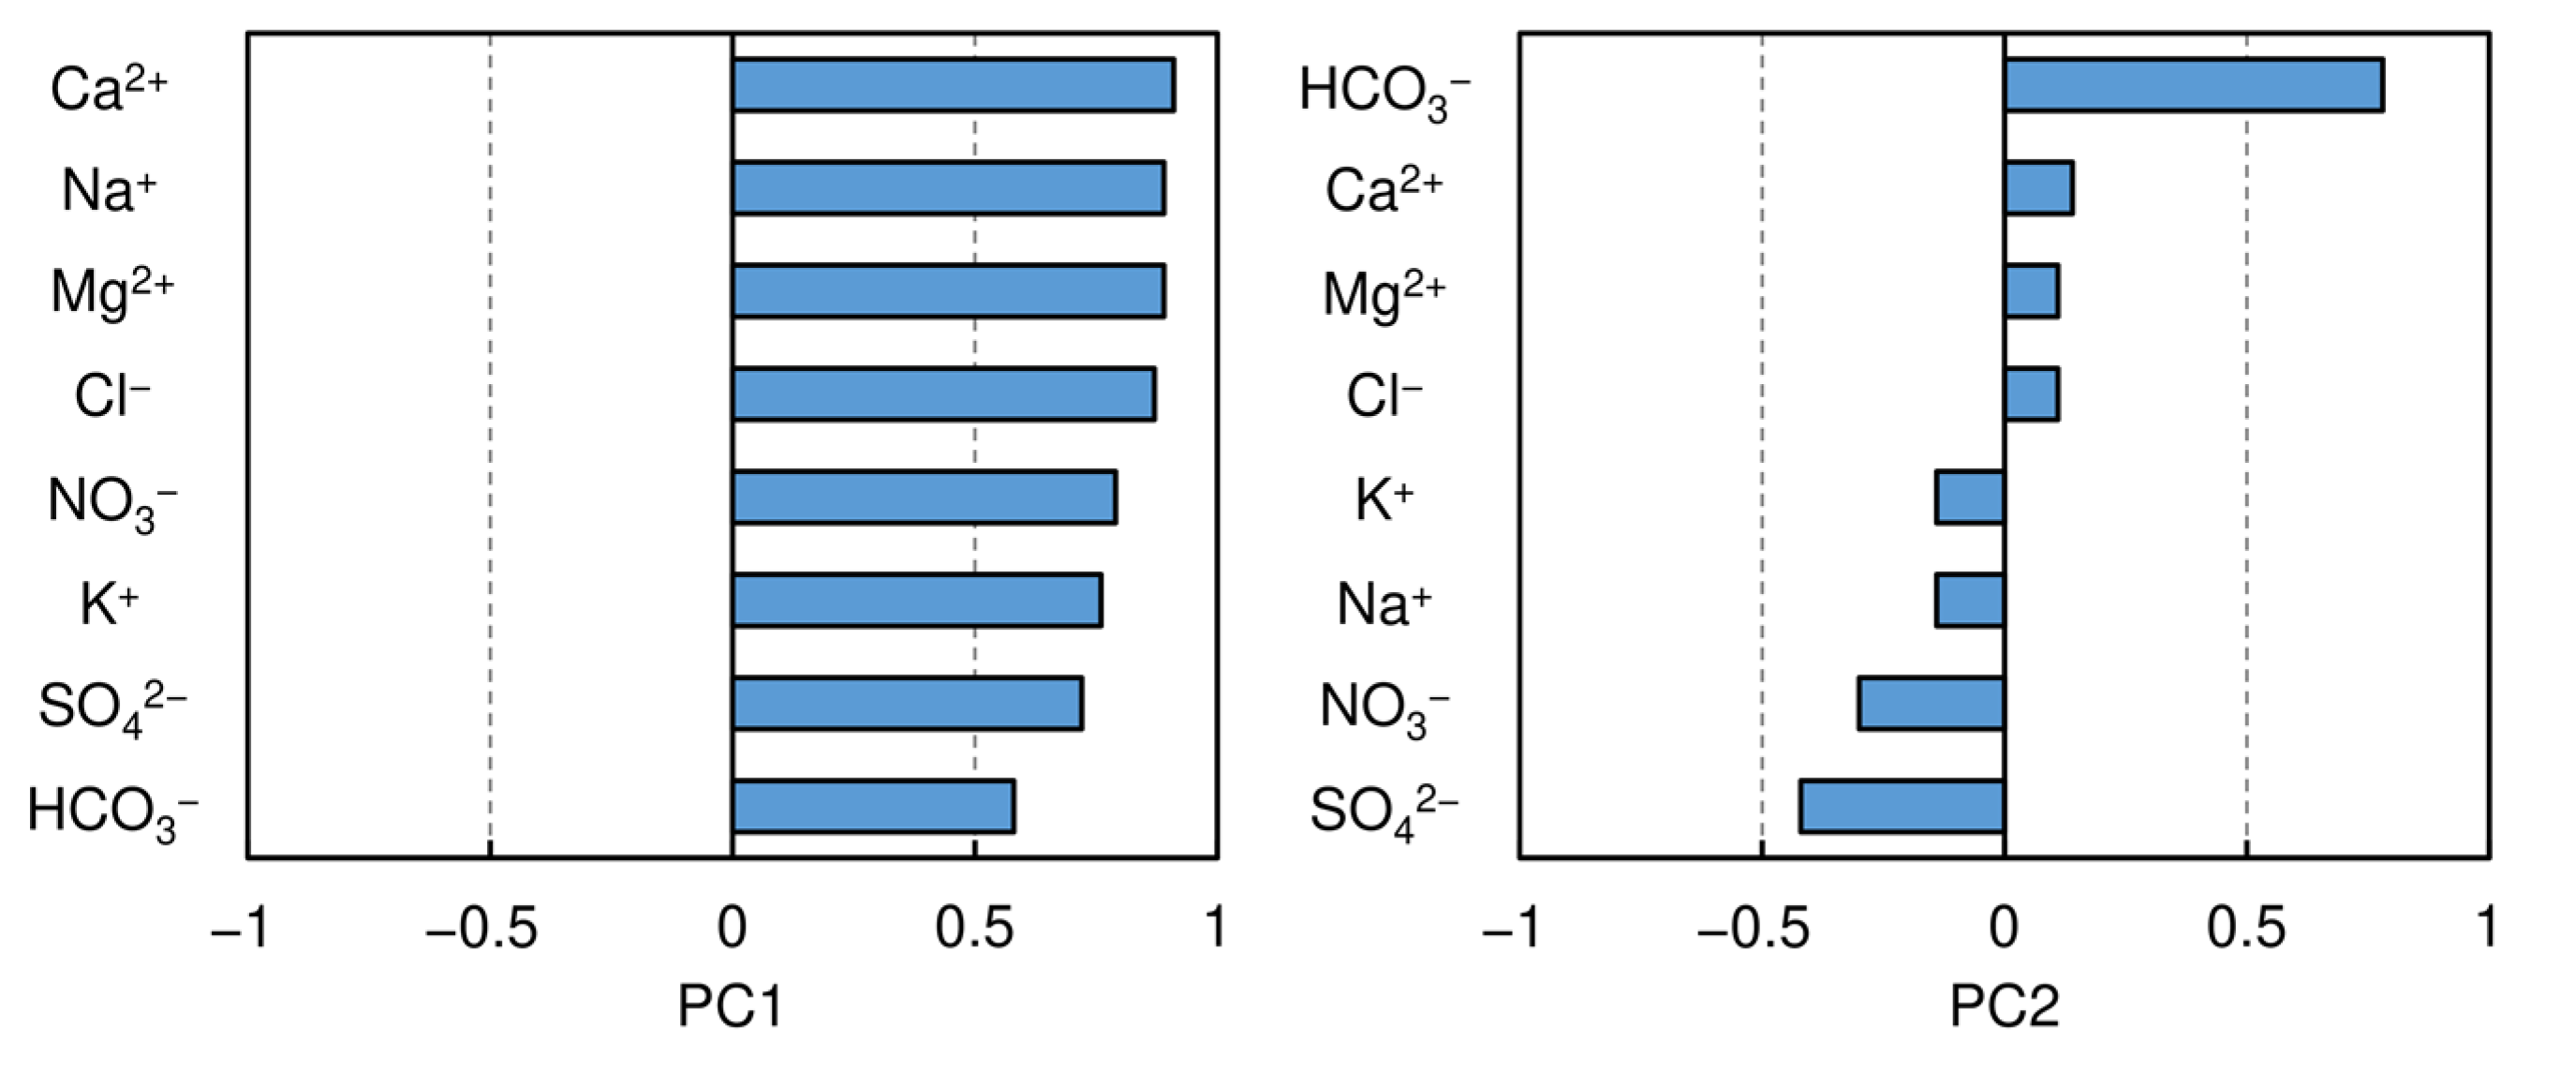
According to the PCA results (Figure 7), eight chemical variables were reduced to the significant two principal components based on the Kaiser criterion. Principal component 1 (PC1) with the eigenvalue of 5.23 explained 65.4% of the total variance. PC1 is clearly related to the effect of all ions. The dissolution of minerals contained in Pre-Unzen and Unzen volcanic rocks increase cations and HCO3− concentrations [17,36]. Thus, the positive loadings for cations and HCO3− indicate mineral dissolution through water–rock interaction. Influence from fertilizer, manure and livestock waste loading as noticed in the correlation analysis, is displayed in Cl−, NO3−, SO42−, Mg2+, and Ca2+ positive loadings. PC 2 has an eigenvalue of 0.96, accounting for 12.0% of the total variance. PC2 has a positive loading for HCO3− and negative loading for NO3− implying denitrification. However, according to the DO content in groundwater, denitrification does not occur. Since HCO3− concentration decreases due to nitrification of NH4+ [37], HCO3− shows higher concentration without nitrate pollution. PC2 has a negative loading for SO42− too. Thus, PC2 is related to the effects of chemical fertilizer (NH4)2SO4. In addition, positive loading for Ca2+ and negative loading for Na+ represent cation exchange [38].
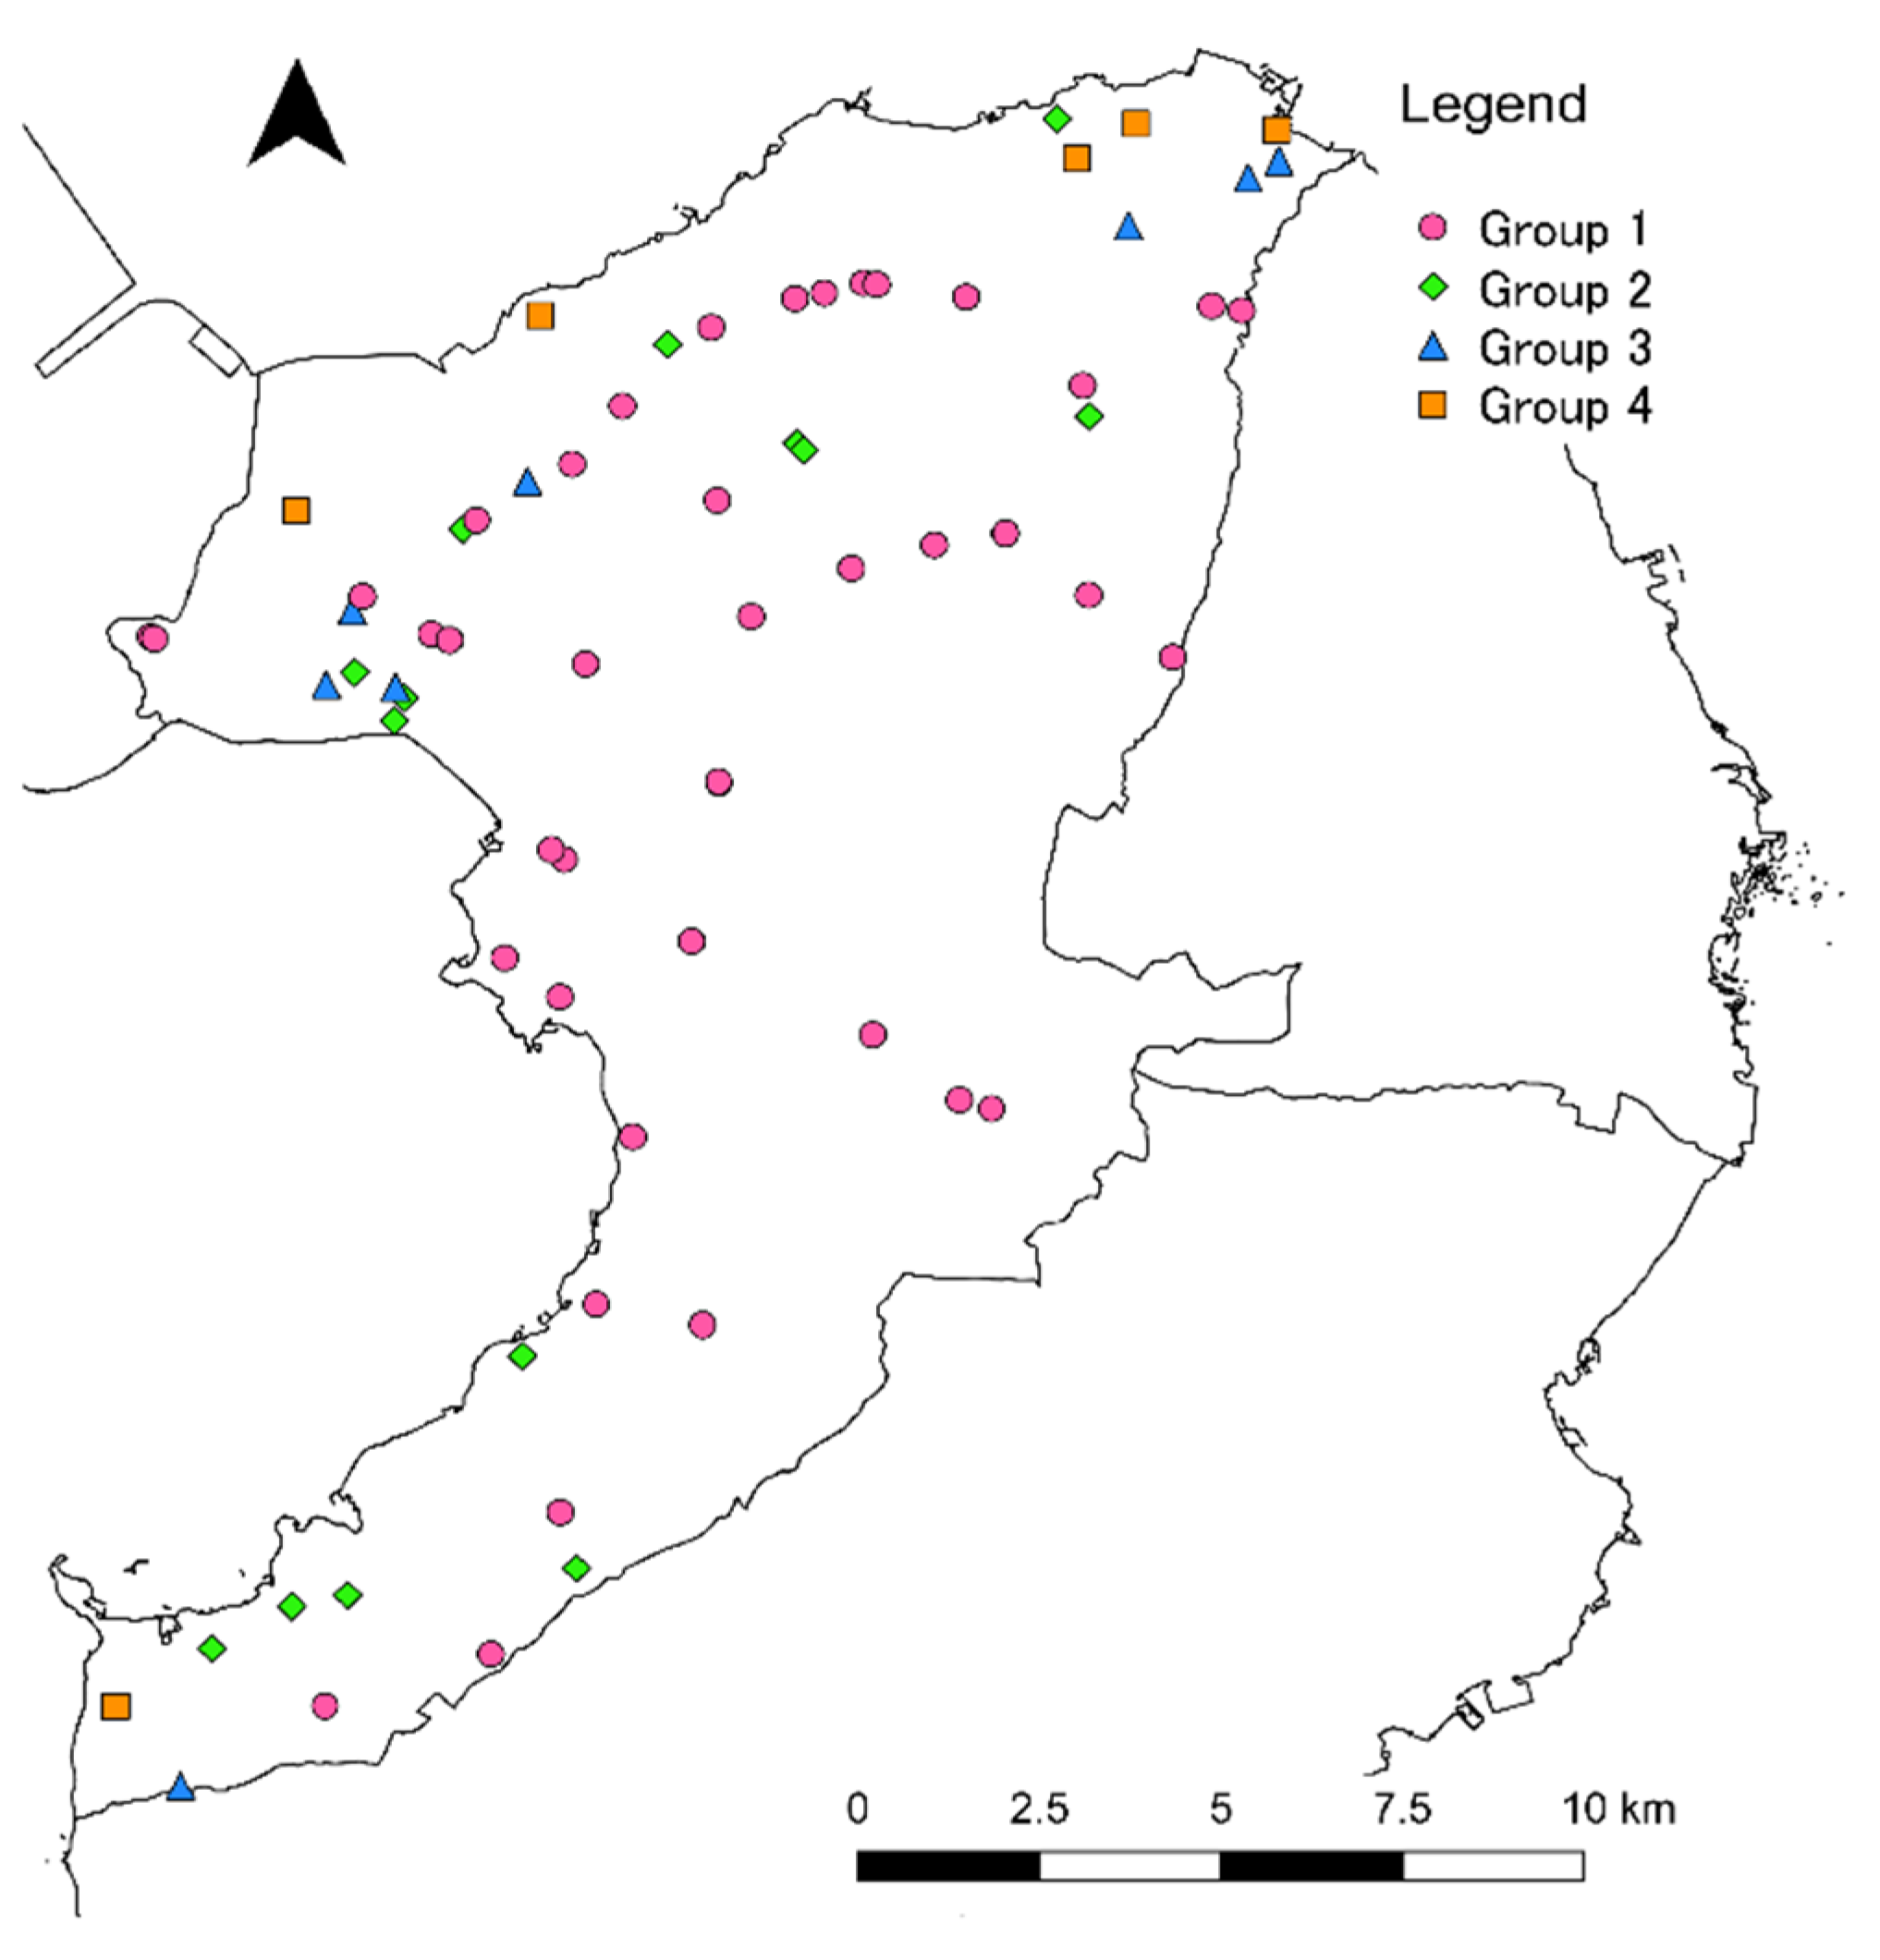
Applying HCA, 69 water chemistry samples were classified into four different groups (Table 3). Depending on nitrate content, the four groups can be condensed into two groups: non-polluted group (Group 1) and nitrate polluted group (Group 2–4). Furthermore, based on the Japanese drinking water standard and the threshold of 3 mg L−1 indicating effects of anthropogenic activities, nitrate affected samples can be classified into two main groups: severely polluted by nitrate (Group 3) and moderately polluted by nitrate (Group 2 and 4). Most samples (59%) belong to Group 1. Samples from this group are found at higher altitudes in the central region (Figure 8), corresponding to the forested area (Figure 2). Group 2–4 mainly cover the upland agricultural fields. A scatter plot of PC1 against PC2 depends on pollution group (Figure 9). According to Figure 8 and Figure 9, there are two chemical evolution paths. One path is explained by evolution from Group 1 to Group 2, and then to Group 4 with increase of PC1. The second path is from Group 1 to Group 2, and then to Group 3. The difference between Group 3 and Group 4 is characterized by PC2. PC2 for Group 3 tends to be negative, indicating that chemical fertilizers have a more pronounced effect on nitrate pollution as compared to livestock waste. According to the positive correlation, ion concentration (Cl−, SO42−, Mg2+, and Ca2+) increases as NO3− content increases. In spite that NO3− concentration does not increase from Group 2 to Group 4, the increase in cation concentration in Group 4 is higher than that of Group 3. This indicates that water–rock interaction (mineral dissolution and cation exchange) is the predominant factor controlling water chemistry in Group 4.
4. Conclusions
To improve the understanding of hydrogeochemical evolution of groundwater in vulnerable aquifers and spatial characteristics of nitrate pollution and water chemistry in Unzen City, groundwater samples were collected from 12 residential and 57 municipal water supply wells and springs, and major dissolved ions and hydrogeochemical variables were analyzed. The general groundwater types are (Ca+Mg)−HCO3 or (Ca+Mg)−(SO4+NO3). Dominant anions are transformed due to nitrate pollution. In total eight wells (four municipal water supply wells and four residential wells), NO3−N levels were exceeding Japanese drinking water standards. Land use and correlation analysis indicate that excessive NO3−N is related to application of chemical fertilizers and discharge of livestock waste. Among water samples displaying high NO3−N concentrations exceeding Japanese drinking water standard, relatively high SO42− concentrations of 18.6–30.6 mg L−1 were observed at 5 out of 8 locations (MW10, MW12, K35, Az659, and Ai29) compared to the others (MW9, MW32, and M12). Since NO3−N and SO42− concentrations increase simultaneously, the groundwater is significantly polluted by chemical fertilizers such as (NH4)2SO4. PCA results show that factors controlling water chemistry in Unzen City can be explained by two main PCs. PC1 accounts for mineral dissolution (water–rock interaction) and agricultural effects. PC2 explains the effects of chemical fertilizers and cation-exchange. HCA classified water samples into four groups. Further, these groups can be separated into a non-polluted group (Group 1), a moderately nitrate affected group (Group 2 and 4), and severely polluted group (Group 3). Combination of PCA and HCA reveals that Group 1 is evolving into Group 2 and eventually into Group 4 with the dominant effect of water–rock interaction. Group 2 is evolving into Group 3 by the dominant impacts of chemical fertilizers.
We confirmed that only specific wells in Unzen City are unsuitable for drinking purposes. A similar situation has been found in Shimabara City. However, since sampling was done during the rainy season in July and August, sampled groundwater may have been affected by recharge and thus dilution. In any case, since most of the samples exceed 3 mg/L, the groundwater in this area is clearly affected by anthropogenic activities. To certify that no negative health effects occur in the area, it is important to continuously monitor the nitrate concentrations in the groundwater.
Author Contributions
Conceptualization, methodology, supervision: K.N.; data curation, formal analysis: H.A.; investigation, writing-original draft preparation: K.N. and H.A.; writing-review and editing: R.B.; funding acquisition: K.N.; All authors have read and agreed to the published version of the manuscript.
Funding
This study was supported by Grants-in-aid for Scientific Research, KAKENHI JSPS (Grant No. JP20K12209).
Institutional Review Board Statement
Not applicable.
Informed Consent Statement
Not applicable.
Data Availability Statement
The data presented in this study are available on request from the corresponding author.
Acknowledgments
The authors thank the Water Works Bureau of Unzen City for support of the water sampling.
Conflicts of Interest
The authors declare no conflict of interest.
References
- Committee on Nitrate Reduction in Shimabara Peninsula. The Second Term of Shimabara Peninsula Nitrate Load Reduction Project; revised edition; Environmental Policy Division of Nagasaki Prefectural Government: Nagasaki, Japan, 2016; 92p. (In Japanese)
- Tsutsumi, H. 1:25,000 Active Fault Map in Urban Area, Commentary of Unzen; Geospatial Information Authority of Japan: Ibaraki, Japan, 2015; 13p, D1-No.739. (In Japanese) [Google Scholar]
- Murakami, T. 1:50,000 Hydrogeological Maps of Japan Shimabara Peninsula, No.25; Geological Survey of Japan: Kawasaki, Japan, 1975. (In Japanese). Available online: https://www.gsj.jp/Map/EN/environment.html (accessed on 3 December 2020).
- Menció, A.; Mas-Pla, J.; Otero, N.; Regàs, O.; Boy-Roura, M.; Puig, R.; Bach, J.; Domènech, C.; Zamorano, M.; Brusi, D.; et al. Nitrate pollution of groundwater; all right…, but nothing else? Sci. Total Environ. 2016, 539, 241–251. [Google Scholar] [CrossRef] [PubMed] [Green Version]
- Lasagna, M.; De Luca, D.A. Evaluation of sources and fate of nitrates in the western Po plain groundwater (Italy) using nitrogen and boron isotopes. Environ. Sci. Pollut. Res. 2019, 26, 2089–2104. [Google Scholar] [CrossRef]
- Marouane, B.; Dahchour, A.; Dousset, S.; El Hajjaji, S. Monitoring of Nitrate and Pesticide Pollution in Mnasra, Morocco Soil and Groundwater. Water. Environ. Res. 2015, 87, 567–575. [Google Scholar] [CrossRef] [PubMed]
- Troudi, N.; Hamzaoui-Azaza, F.; Tzoraki, O.; Melki, F.; Zammouri, M. Assessment of groundwater quality for drinking purpose with special emphasis on salinity and nitrate contamination in the shallow aquifer of Guenniche (Northern Tunisia). Environ. Monit. Assess. 2020, 192, 641. [Google Scholar] [CrossRef] [PubMed]
- Abou Zakhem, B.; Hafez, R. Hydrochemical, isotopic and statistical characteristics of groundwater nitrate pollution in Damascus Oasis (Syria). Environ. Earth Sci. 2015, 74, 2781–2797. [Google Scholar] [CrossRef]
- Chitsazan, M.; Mohammad Rezapour Tabari, M.; Eilbeigi, M. Analysis of temporal and spatial variations in groundwater nitrate and development of its pollution plume: a case study in Karaj aquifer. Environ. Earth Sci. 2017, 76, 391. [Google Scholar] [CrossRef]
- Khan, S.N.; Yasmeen, T.; Riaz, M.; Arif, M.S.; Rizwan, M.; Ali, S.; Tariq, A.; Jessen, S. Spatio-temporal variations of shallow and deep well groundwater nitrate concentrations along the Indus River floodplain aquifer in Pakistan. Environ. Poll. 2019, 253, 384–392. [Google Scholar] [CrossRef] [PubMed]
- Chotpantarat, S.; Parkchai, T.; Wisitthammasri, W. Multivariate Statistical Analysis of Hydrochemical Data and Stable Isotopes of Groundwater Contaminated with Nitrate at Huay Sai Royal Development Study Center and Adjacent Areas in Phetchaburi Province, Thailand. Water 2020, 12, 1127. [Google Scholar] [CrossRef] [Green Version]
- Wegahita, N.K.; Ma, L.; Liu, J.; Huang, T.; Luo, Q.; Qian, J. Spatial Assessment of Groundwater Quality and Health Risk of Nitrogen Pollution for Shallow Groundwater Aquifer around Fuyang City, China. Water 2020, 12, 3341. [Google Scholar] [CrossRef]
- Juntakut, P.; Snow, D.D.; Haacker, E.M.K.; Ray, C. The long term effect of agricultural, vadose zone and climatic factors on nitrate contamination in Nebraska’s groundwater system. J. Contam. Hydrol. 2019, 220, 33–48. [Google Scholar] [CrossRef]
- Rojas Fabro, A.Y.; Pacheco Ávila, J.G.; Esteller Alberich, M.V.; Cabrera Sansores, S.A.; Camargo-Valero, M.A. Spatial distribution of nitrate health risk associated with groundwater use as drinking water in Merida, Mexico. Appl. Geogr. 2015, 65, 49–57. [Google Scholar] [CrossRef]
- Hirata, R.; Cagnon, F.; Bernice, A.; Maldaner, C.H.; Galvão, P.; Marques, C.; Terada, R.; Varnier, C.; Ryan, M.C.; Bertolo, R. Nitrate Contamination in Brazilian Urban Aquifers: A Tenacious Problem. Water 2020, 12, 2709. [Google Scholar] [CrossRef]
- Nakagawa, K.; Amano, H.; Asakura, H.; Berndtsson, R. Spatial trends of nitrate pollution and groundwater chemistry in Shimabara, Nagasaki, Japan. Environ. Earth Sci. 2016, 75, 234. [Google Scholar] [CrossRef] [Green Version]
- Amano, H.; Nakagawa, K.; Berndtsson, R. Surface water chemistry and nitrate pollution in Shimabara, Nagasaki, Japan. Environ. Earth Sci. 2018, 77, 354. [Google Scholar] [CrossRef] [Green Version]
- Amano, H.; Nakagawa, K.; Berndtsson, R. Groundwater geochemistry of nitrate-contaminated agricultural site. Environ. Earth Sci. 2016, 75, 1145. [Google Scholar] [CrossRef] [Green Version]
- Takamura, H.; Kono, T.; Shimano, Y. Visit to Valuable Water Springs (44) Shimabara Springs in Nagasaki Prefecture (in Japanese). J. Groundwater Hydrol. 1999, 41, 35–44. [Google Scholar] [CrossRef] [Green Version]
- Kagabu, M. Visit to valuable water springs (126) Valuable water springs in Shimabara Peninsula (Revisit) (in Japanese). J. Groundwater Hydrol. 2019, 61, 227–240. [Google Scholar] [CrossRef] [Green Version]
- Amano, H.; Nakagawa, K. Hydrogeochemical Assessment of Groundwater Quality in Shimabara, Nagasaki, Japan. J. Jpn. Soc. Civ. Eng. Ser. B1 (Hydraul. Eng.) 2017, 73, I_73–I_78. [Google Scholar] [CrossRef]
- Japan Meteorological Agency. Weather Observation Data. Available online: https://www.data.jma.go.jp/obd/stats/etrn/view/annually_s.php?prec_no=84&block_no=47818&year=&month=&day=&view= (accessed on 2 December 2020).
- Sugimoto, T. Geology and Petrology at Shimabara Peninsula, Kyushu, SW Japan-From recent results- (in Japanese with English abstract). J. Geotherm. Res. Soc. Jpn. 2006, 28, 347–360. [Google Scholar] [CrossRef]
- Yasuhara, M.; Kazahaya, K.; Inamura, A.; Kouno, T.; Ohsawa, S.; Yusa, Y.; Kitaoka, K.; Hoshimizu, H.; Sumii, T.; Uto, K. Hydraulic structure of Unzen volcano (in Japanese). Chikyu Mon. 2002, 24, 849–857. [Google Scholar]
- Biodiversity Center of Japan. 6th and 7th the Results of National Surveys on the Natural Environment. Available online: http://gis.biodic.go.jp/webgis/sc-023.html (accessed on 3 December 2020).
- Geological Survey of Japan. 1/200,000 Seamless Digital Geological Map of Japan V2. Available online: https://gbank.gsj.jp/seamless/ (accessed on 3 December 2020).
- Yu, Z.-Q.; Amano, H.; Nakagawa, K.; Berndtsson, R. Hydrogeochemical evolution of groundwater in a Quaternary sediment and Cretaceous sandstone unconfined aquifer in Northwestern China. Environ. Earth. Sci. 2018, 77, 629. [Google Scholar] [CrossRef]
- Thivya, C.; Chidambaram, S.; Thilagavathi, R.; Prasanna, M.V.; Singaraja, C.; Adithya, V.S.; Nepolian, M. A multivariate statistical approach to identify the spatio-temporal variation of geochemical process in a hard rock aquifer. Environ. Monit. Assess. 2015, 187, 552. [Google Scholar] [CrossRef]
- Gillham, R.W.; Cherry, J.A. Field Evidence of Denitrification in Shallow Groundwater Flow Systems. Water Qual. Res. J. 1978, 13, 53–72. [Google Scholar] [CrossRef]
- Ikehata, K.; Ohta, K. Characteristics of Hot Spring Water and Travertine from Obama Hot Springs, Nagasaki Prefecture (in Japanese). J. Nagasaki. Earth Sci. Assoc. 2011, 75, 44–50. Available online: http://nesa.chu.jp/nesa-kaishi75/nesa-kaishi75-7.pdf (accessed on 4 December 2020).
- Kawakami, H.; Koga, A.; Nozaki, H. Chemical Studies on the Hot Springs of Unzen. I-III. I. General View and Chemical Composition of the Unzen Hot Springs. Nippon. Kagaku Zassi 1956, 77, 1773–1776. [Google Scholar] [CrossRef]
- Sappa, G.; Ergul, S.; Ferranti, F. Water quality assessment of carbonate aquifers in southern Latium region, Central Italy: a case study for irrigation and drinking purposes. Appl. Water Sci. 2014, 4, 115–128. [Google Scholar] [CrossRef] [Green Version]
- United States Geological Survey. Oxidation/Reduction (Redox). Available online: https://www.usgs.gov/mission-areas/water-resources/science/oxidationreduction-redox?qt-science_center_objects=0#qt-science_center_objects (accessed on 5 December 2020).
- Eckhardt, D.A.V.; Stackelberg, P.E. Relation of Ground-Water Quality to Land Use on Long Island, New York. Ground Water 1995, 33, 1019–1033. [Google Scholar] [CrossRef]
- Esmaeili, A.; Moore, F.; Keshavarzi, B. Nitrate contamination in irrigation groundwater, Isfahan, Iran. Environ. Earth Sci. 2014, 72, 2511–2522. [Google Scholar] [CrossRef]
- Sun, X.; Mörth, C.M.; Humborg, C.; Gustafsson, B. Temporal and spatial variations of rock weathering and CO2 consumption in the Baltic Sea catchment. Chem. Geol. 2017, 466, 57–69. [Google Scholar] [CrossRef]
- Tase, N. Present situation and trend of groundwater pollution by nitrate and nitrite nitrogen (in Japanese). Environ. Manag. 2004, 40, 47–55. [Google Scholar]
- Rajmohan, N.; Elango, L. Identification and evolution of hydrogeochemical processes in the groundwater environment in an area of the Palar and Cheyyar River Basins, Southern India. Environ. Geol. 2004, 46, 47–61. [Google Scholar] [CrossRef]
Figure 1.
Study area and sampling locations.

Figure 2.
Land use and geology, (a) vegetation map, (b) geological map with groundwater levels and boring site; (Pyfl) Pyroclastic flow. The vegetation map is based on data collected by Biodiversity Center of Japan [25]. The geological map at 1:200,000 scale is based on data collected by Geological Survey of Japan [26].

Figure 3.
Geologic strata of the three regions. The data were reported by Murakami [3].
Figure 3.
Geologic strata of the three regions. The data were reported by Murakami [3].

Figure 4.
Trilinear Piper diagram of groundwater in the three regions.

Figure 5.
Major ion variation using stiff diagrams.

Figure 6.
Distribution of nitrate concentration in groundwater.

Figure 7.
Relationship between extracted principal components (PCs) and ions.

Figure 8.
Distribution of each pollution group.

Figure 9.
Scatter plot of PC1 against PC2.


Table 1.
Descriptive statistics of hydrochemical components in the three regions.
| Cl− | NO3− | SO42− | HCO3− | Na+ | K+ | Mg2+ | Ca2+ | NO3−N | DO | pH | EC | ORP | ||
|---|---|---|---|---|---|---|---|---|---|---|---|---|---|---|
| mg L−1 | mg L−1 | mg L−1 | mg L−1 | mg L−1 | mg L−1 | mg L−1 | mg L−1 | mg L−1 | mg L−1 | mS m−1 | mV | |||
| North region | Min | 2.8 | 2.8 | 1.4 | 20.0 | 5.1 | 1.3 | 1.8 | 3.6 | 0.6 | 3.2 | 6.31 | 7.7 | 46 |
| Max | 18.6 | 88.0 | 44.0 | 80.2 | 19.1 | 6.2 | 15.9 | 37.4 | 19.9 | 9.9 | 9.13 | 34.0 | 522 | |
| Mean | 7.8 | 26.2 | 10.1 | 44.4 | 10.3 | 3.1 | 6.4 | 13.6 | 5.9 | 8.3 | 7.37 | 17.5 | 304 | |
| S.D.1 | 4.3 | 21.2 | 10.2 | 13.9 | 3.3 | 1.5 | 3.8 | 8.0 | 4.8 | 1.3 | 0.59 | 8.1 | 71 | |
| Central region | Min | 2.8 | 5.2 | 1.5 | 28.9 | 4.9 | 1.3 | 2.2 | 5.5 | 1.2 | 5.3 | 6.44 | 7.4 | 264 |
| Max | 9.2 | 21.3 | 15.6 | 56.4 | 11.1 | 4.4 | 7.0 | 14.1 | 4.8 | 9.7 | 8.34 | 18.3 | 365 | |
| Mean | 5.4 | 10.9 | 7.3 | 40.1 | 8.4 | 2.5 | 4.5 | 9.1 | 2.5 | 8.6 | 7.47 | 11.9 | 321 | |
| S.D.1 | 1.6 | 4.8 | 4.5 | 9.0 | 1.9 | 0.9 | 1.6 | 2.6 | 1.1 | 1.1 | 0.68 | 3.0 | 28 | |
| South region | Min | 2.5 | 9.4 | 1.5 | 34.6 | 4.7 | 1.4 | 3.0 | 7.7 | 2.1 | 7.3 | 7.02 | 8.4 | 288 |
| Max | 34.2 | 71.2 | 8.4 | 72.9 | 19.8 | 3.9 | 12.0 | 24.8 | 16.1 | 9.3 | 8.41 | 32.5 | 354 | |
| mean | 11.0 | 25.6 | 5.0 | 56.2 | 10.0 | 2.9 | 7.2 | 16.5 | 5.8 | 8.1 | 7.70 | 19.5 | 318 | |
| S.D.1 | 9.6 | 18.8 | 2.4 | 12.8 | 4.4 | 0.7 | 2.8 | 5.6 | 4.3 | 0.6 | 0.59 | 7.4 | 23 |
1 S.D. = standard deviation.
Table 2.
Correlation matrix for eight dissolved ions.
| Cl− | NO3− | SO42− | HCO3− | Na+ | K+ | Mg2+ | Ca2+ | |
|---|---|---|---|---|---|---|---|---|
| Cl− | 1.00 | 0.62 | 0.45 | 0.52 | 0.87 | 0.63 | 0.74 | 0.74 |
| NO3− | - | 1.00 | 0.51 | 0.16 | 0.64 | 0.48 | 0.80 | 0.75 |
| SO42− | - | - | 1.00 | 0.20 | 0.68 | 0.61 | 0.57 | 0.62 |
| HCO3− | - | - | - | 1.00 | 0.40 | 0.38 | 0.58 | 0.64 |
| Na+ | - | - | - | - | 1.00 | 0.70 | 0.72 | 0.68 |
| K+ | - | - | - | - | - | 1.00 | 0.47 | 0.64 |
| Mg2+ | - | - | - | - | - | - | 1.00 | 0.80 |
| Ca2+ | - | - | - | - | - | - | - | 1.00 |
Table 3.
Dissolved ion concentration depending on pollution group.
| Samples | Cl− | NO3− | SO42− | HCO3− | Na+ | K+ | Mg2+ | Ca2+ | NO3−N | ||
|---|---|---|---|---|---|---|---|---|---|---|---|
| mg L−1 | mg L−1 | mg L−1 | mg L−1 | mg L−1 | mg L−1 | mg L−1 | mg L−1 | mg L−1 | |||
| Group 1 | 41 | Min | 2.5 | 2.8 | 1.4 | 28.9 | 4.7 | 1.3 | 1.8 | 3.6 | 0.6 |
| Max | 7.4 | 27.1 | 15.6 | 58.0 | 10.7 | 4.4 | 6.5 | 13.1 | 6.1 | ||
| Mean | 4.7 | 11.0 | 5.2 | 39.6 | 8.0 | 2.3 | 4.0 | 8.2 | 2.5 | ||
| S.D. | 1.3 | 5.1 | 3.8 | 8.2 | 1.6 | 0.8 | 1.3 | 2.5 | 1.2 | ||
| Group 2 | 14 | Min | 5.7 | 9.1 | 2.8 | 32.4 | 7.0 | 2.6 | 4.6 | 12.0 | 2.1 |
| Max | 13.4 | 47.3 | 13.7 | 74.9 | 14.3 | 4.3 | 12.3 | 24.2 | 10.7 | ||
| Mean | 9.9 | 29.6 | 6.9 | 53.4 | 10.7 | 3.4 | 7.7 | 16.2 | 6.7 | ||
| S.D. | 2.0 | 11.2 | 3.7 | 14.7 | 2.0 | 0.6 | 1.8 | 3.5 | 2.5 | ||
| Group 3 | 8 | Min | 8.3 | 34.5 | 3.2 | 20.0 | 11.5 | 1.3 | 9.0 | 17.5 | 7.8 |
| Max | 16.3 | 88.0 | 44.0 | 56.4 | 17.4 | 5.4 | 15.9 | 29.8 | 19.9 | ||
| Mean | 12.2 | 63.4 | 20.8 | 40.6 | 13.9 | 3.8 | 11.0 | 22.1 | 14.3 | ||
| S.D. | 2.6 | 19.2 | 13.3 | 10.9 | 2.0 | 1.5 | 2.6 | 4.3 | 4.3 | ||
| Group 4 | 6 | Min | 9.5 | 26.9 | 8.4 | 56.1 | 11.2 | 3.7 | 5.0 | 21.0 | 6.1 |
| Max | 34.2 | 45.1 | 30.6 | 80.2 | 19.8 | 6.2 | 15.3 | 37.4 | 10.2 | ||
| Mean | 18.0 | 35.5 | 22.5 | 69.2 | 15.4 | 5.5 | 10.6 | 26.6 | 8.0 | ||
| S.D. | 8.6 | 6.1 | 8.9 | 8.5 | 3.7 | 0.9 | 4.4 | 5.8 | 1.4 |
Publisher’s Note: MDPI stays neutral with regard to jurisdictional claims in published maps and institutional affiliations. |
© 2021 by the authors. Licensee MDPI, Basel, Switzerland. This article is an open access article distributed under the terms and conditions of the Creative Commons Attribution (CC BY) license (http://creativecommons.org/licenses/by/4.0/).
Share and Cite
MDPI and ACS Style
Nakagawa, K.; Amano, H.; Berndtsson, R. Spatial Characteristics of Groundwater Chemistry in Unzen, Nagasaki, Japan. Water 2021, 13, 426. https://doi.org/10.3390/w13040426
AMA Style
Nakagawa K, Amano H, Berndtsson R. Spatial Characteristics of Groundwater Chemistry in Unzen, Nagasaki, Japan. Water. 2021; 13(4):426. https://doi.org/10.3390/w13040426
Chicago/Turabian StyleNakagawa, Kei, Hiroki Amano, and Ronny Berndtsson. 2021. "Spatial Characteristics of Groundwater Chemistry in Unzen, Nagasaki, Japan" Water 13, no. 4: 426. https://doi.org/10.3390/w13040426
Note that from the first issue of 2016, this journal uses article numbers instead of page numbers. See further details here.