Article

Regional-Scale Model Analysis of Climate Changes Impact on the Water Budget of the Critical Zone and Groundwater Recharge in the European Part of Russia

by
Sergey O. Grinevskiy
*,
Sergey P. Pozdniakov
and
Ekaterina A. Dedulina
Hydrogeology Department, Moscow State University, 119234 Moscow, Russia
*
Author to whom correspondence should be addressed.
Water 2021, 13(4), 428; https://doi.org/10.3390/w13040428
Submission received: 2 December 2020 / Revised: 27 January 2021 / Accepted: 2 February 2021 / Published: 6 February 2021
(This article belongs to the Section Hydrology)

Abstract

:
Groundwater recharge by precipitation is the main source of groundwater resources, which are widely used in the European part of Russia (ER). The main goal of the presented studies is to analyze the effect of observed climate changes on the processes of groundwater recharge. For this purpose analysis of long-term meteorological data as well as water budget and groundwater recharge simulation were used. First, meteorological data of 22 weather stations, located from south (Lat 46°) to north (Lat 66°) of ER for historical (1965–1988) and modern (1989–2018) periods were compared to investigate the observed latitudinal changes in annual and seasonal averages of precipitation, wind speed, air temperature, and humidity. Second, water budget in critical zone was simulated, using codes SURFBAL and HYDRUS-1D. SURFBAL generates upper boundary conditions for unsaturated flow modelling with HYDRUS-1D, taking into account snow accumulation and melting as well as topsoil freezing, which are important processes that affect runoff generation and the infiltration of meltwater. Water budget and groundwater recharge simulations based on long-term meteorological data and soil and vegetation parameters, typical for the investigated region. The simulation results for the historical and modern periods were compared to find out the impact of climate change on the average annual and seasonal averages of surface runoff, evapotranspiration, and groundwater recharge, as well as to assess latitudinal differences in water budget changes. The results of the simulation showed, that despite a significant increase in air temperature, groundwater recharge in the southern regions did not change, but even increased up to 50–60 mm/year in the central and northern regions of ER. There are two main reasons for this. First, the observed increase in air temperature is compensated by a decrease in wind speed, so there was no significant increase in evapotranspiration in the modern period. Also, the observed increase in air temperature and precipitation in winter is the main reason for the increase in groundwater recharge, since these climate changes lead to an increase in water infiltration into the soil in the cold period, when there is no evapotranspiration.

1. Introduction

Current climate change largely determines the observed variability of surface and groundwater resources and defines the problems and prospects for their sustainable use in the 21st century [1,2]. Studies on a regional scale in various natural conditions reveal nonlinear relationships between water and energy balances and indicate the trace of climate change in the formation of runoff from watersheds [3].
The climatic transformations observed in recent decades are reflected to varying degrees both in the general structure of the land’s water balance and in its components, including the river [4] and subsurface runoff [5]. That is why the impact of global climate change on water resources is one of the most discussed fundamental problems across fields of climatology, land hydrology, and hydrogeology. Examples of continental and subcontinental analysis of the impact of climate change on river runoff and groundwater can be found in [2,6,7] and others.
One of the important tasks of climate impact studies on groundwater and surface water is to analyze regional patterns and assess the regional scale of these changes. For example, in the work of a large international team of hydrologists [8] describing 23 unsolved problems of modern hydrology, problem number 1 formulates as “Is the hydrological cycle regionally accelerating/decelerating under climate and environmental change, and are there tipping points (irreversible changes)?” That is, the fundamental scientific task is to assess the scale of climate change at the regional level in specific catchments [9], located in different natural conditions.
At present, integrated models of surface water and groundwater at different scales are widely used for analysis and prediction of water balance and total runoff from the watershed [4,10]. The development and calibration of such models is a time-consuming task that requires extensive input information. At the same time, one of the key problems in the study and simulation of water exchange on a watershed scale is the processes of water and energy exchange in the so-called “critical zone” from the ground surface to groundwater [7]. The main integral parameter characterizing water exchange in the critical zone seem to be groundwater diffusive recharge due to infiltration from the earth surface [11]. Therefore, the analysis of trends in changes in recharge and elements of water balance that form it can provide an integrated assessment of the impact of observed and expected climatic changes on runoff without the time-consuming development of a full-scale integrated model of the drainage basin.
Currently, the approach based on simulation of the unsaturated flow from the earth’s surface to the groundwater level is widely used to assess the diffuse groundwater recharge and the HYDRUS-1D model [12] is commonly used for this purpose. The methodology of the application of HYDRUS-1D for recharge estimation is summarized in Šimůnek [13]. Examples of evaluations of the near-surface water balance and estimations of groundwater recharge for a specific soil, vegetation, and climatic conditions with HYDRUS-1D can be found in [11,14,15,16,17,18] and others.
The results of modeling the effect of expected climatic changes on the water budget for runoff basins located in different climatic conditions are analyzed in a review of 40 publications [1]. Generalization of these results by climate types (humid moderate and arid) showed that in all considered arid conditions climate change leads to recharge reduction. At the same time in moderate climate the simulated recharge has not changed approximately in 15% of cases, increased in 30% and decreased in the rest of cases. In other words, the impact of climate change on processes in critical zone and groundwater in humid conditions is ambiguous.
Thus, the motivation for this study is to assess the impact of the observed climatic changes on groundwater resources on a sub-continental scale. For this purpose, diffuse groundwater recharge was chosen as the main indicator of changes in groundwater resources, and the European part of Russia considered as the study region. Diffuse groundwater recharge formed by precipitation transformation in a critical zone is the main source of groundwater natural resources, which are widely used for human needs in the European part of Russia. The climate conditions there vary from semi-arid in the south to moderate humid and boreal in the north of the investigated region. The main goal of the presented studies is to analyze the effect of observed climate changes on the groundwater recharge formation over the European part of Russia. For this purpose, 22 weather stations, located from south to north of the investigated region with representative long-term data were selected. These long-term meteorological observations were analyzed using a single methodological approach. Then, using a physically based water balance model, groundwater recharge was simulated to reveal subcontinental patterns of its transformation under climatic changes.

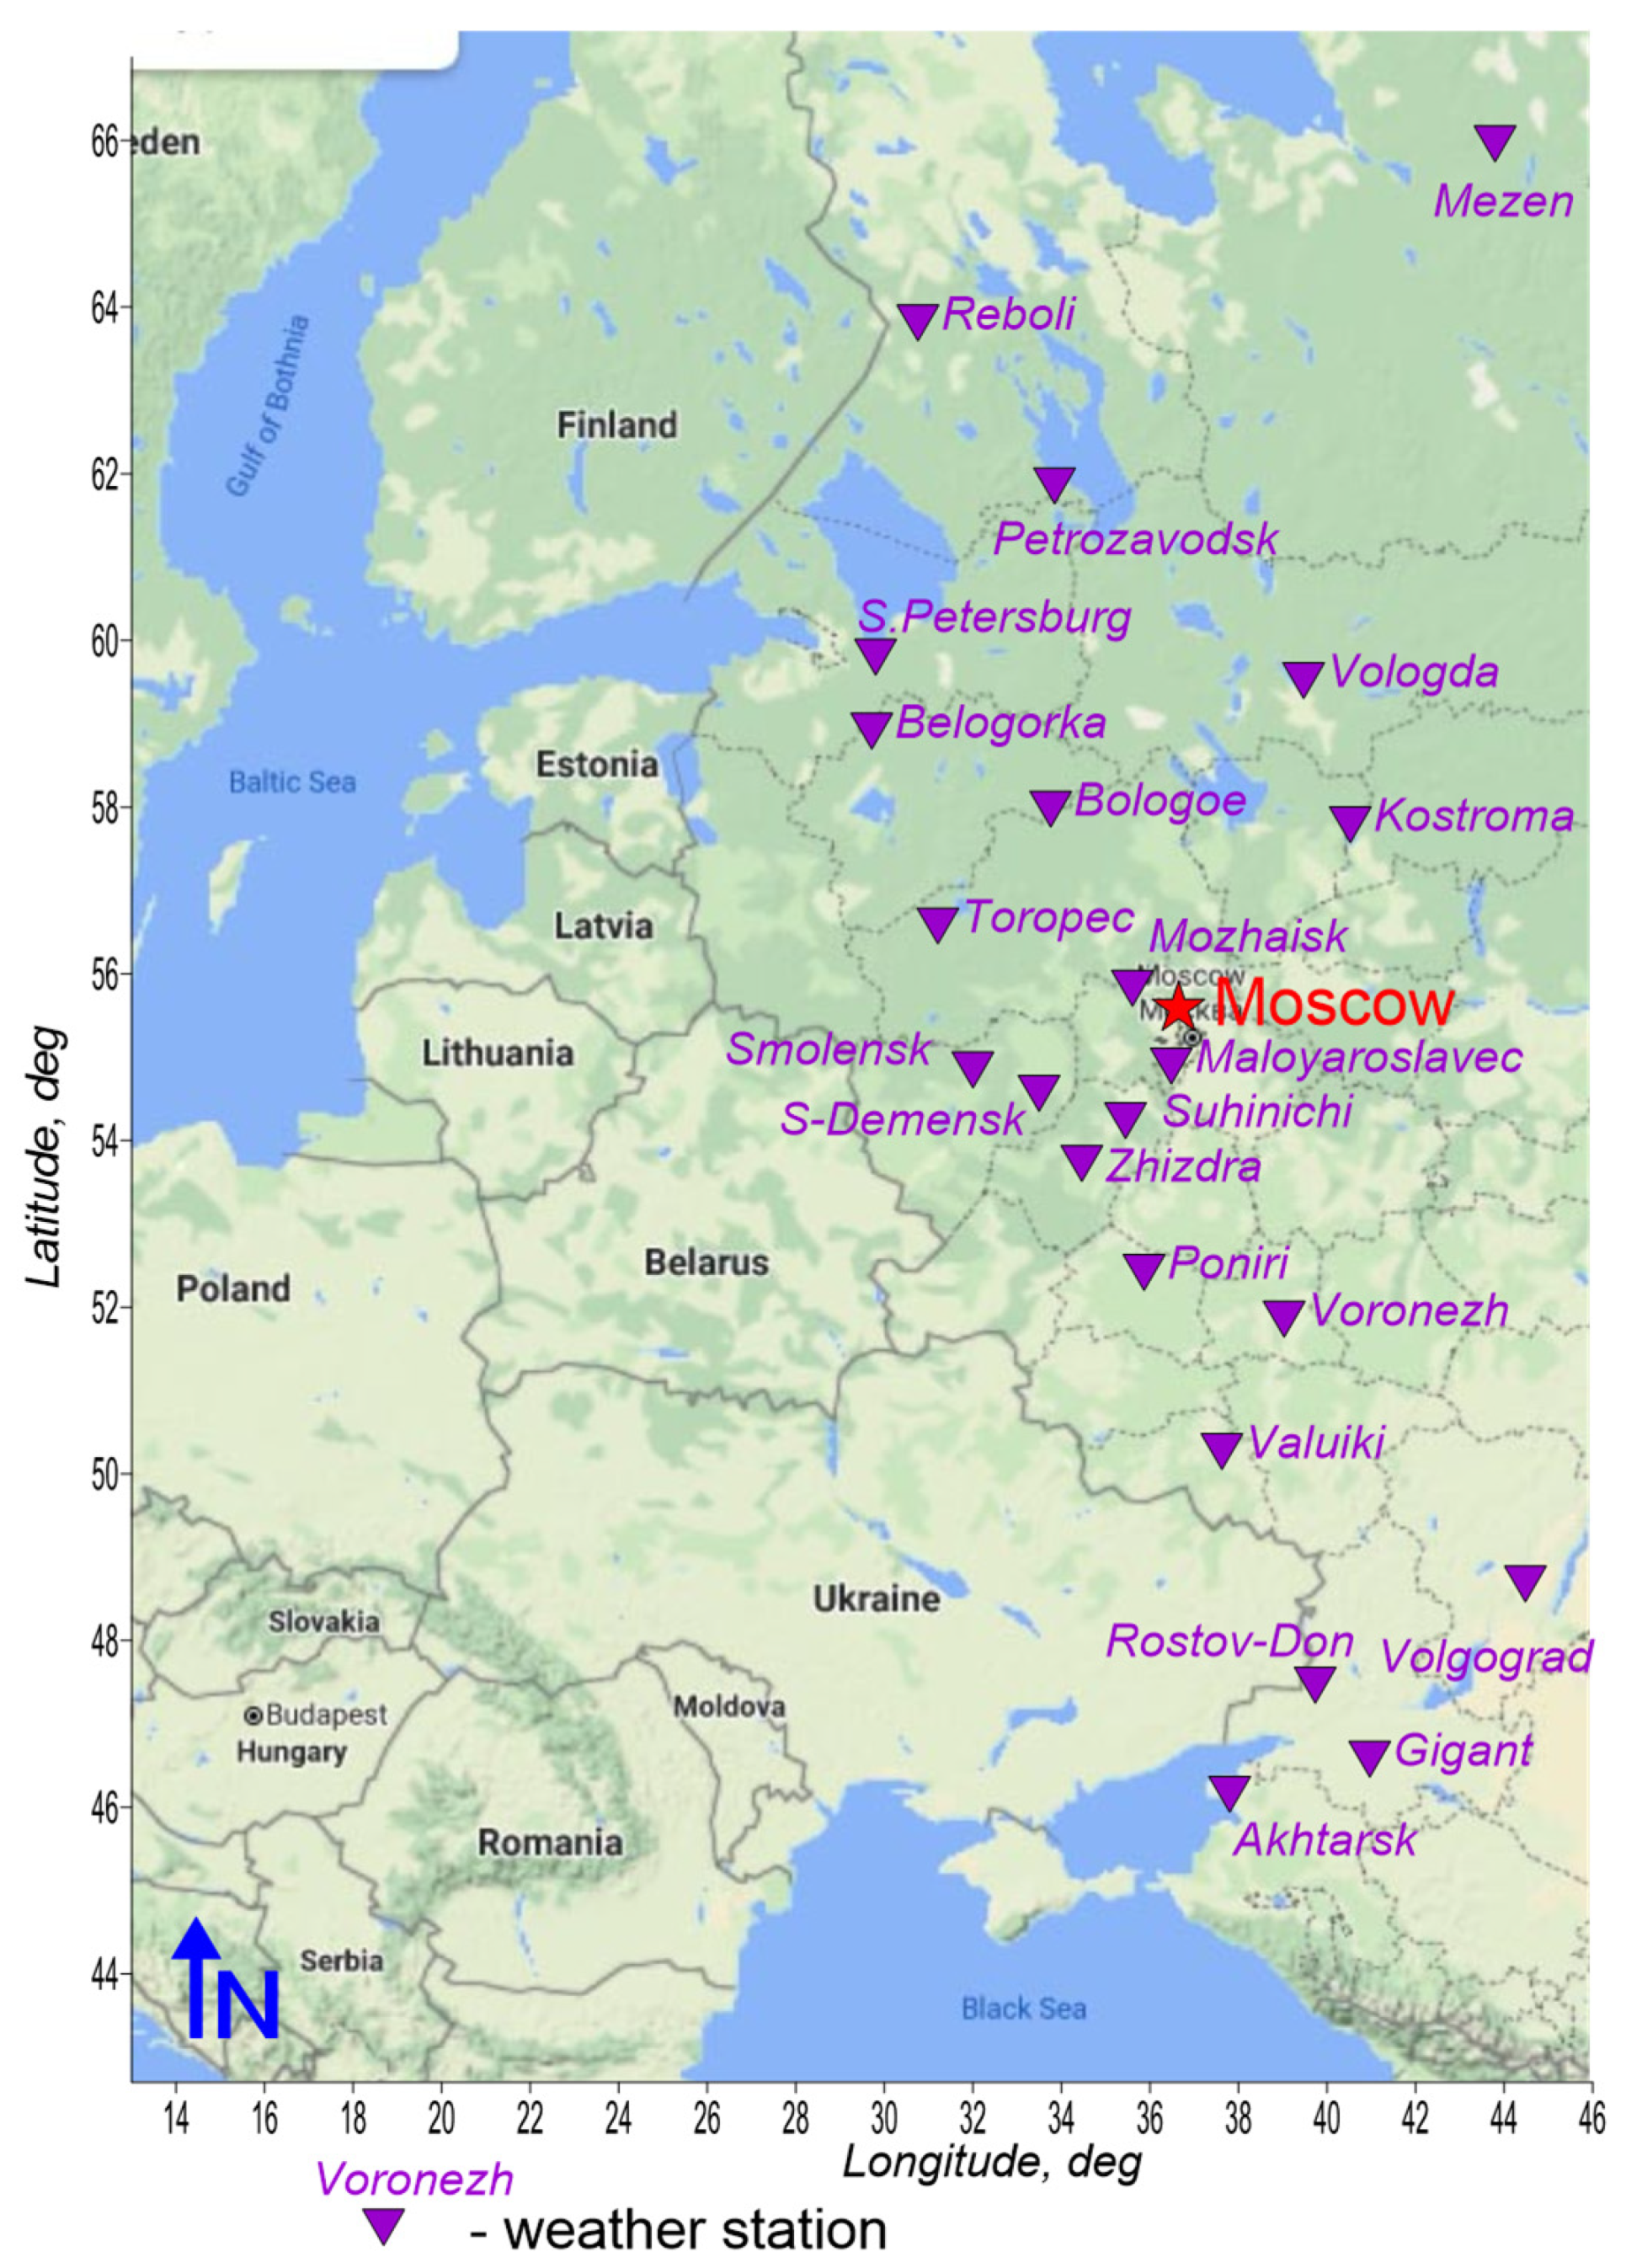
2. Study Area and Input Climate Data

The study region, European part of Russia (ER), is located from the south (latitude 46°) to the north (latitude 66°) of the western part of the Russian Federation - from the Black Sea in the south to the White Sea in the north. (Figure 1). Most of the region is characterized by a temperate continental climate with pronounced latitudinal variability of annual precipitation and air temperature. Mean annual precipitation (P) varies from 400 mm/year in the south to 600 mm/year in the north with maximum values up to 750 mm/year in the central part of ER. Mean annual air temperature increases southward from −0.5–0 °C to 10–11 °C (Table 1). According to the climate classification based on the aridity index AI = P/ET0, where ET0 is the potential evapotranspiration, [19], most of the region belongs to the humid climate, but the AI values noticeably decrease southward from 2 to 0.6 and the most southern areas have a dry subhumid climate.
For the analysis, the long-term meteorological data from 22 weather stations, located from south to north of the study region (Figure 1, Table 1) were used from the open site of the Russian Institute of Hydrological and Meteorological Information – World Data Center (RIHMI-WDC) meteo.ru. Daily meteorological data includes minimum, maximum and average air temperature, precipitation, average wind speed and air humidity for 1965–2018, since the data for this period is the most complete and continuous.

3. Methods

3.1. Analysis of Climate Changes

A detailed analysis of modern changes in climatic characteristics and their latitudinal patterns is based on a comparison of long-term average annual values for two periods. The first historical period 1965–1988 is considered to be relatively climatically stable, while the second modern period 1989–2018 is characterized by directional changes in meteorological characteristics (as shown in Section 4). The duration of the historical and modern periods under consideration are comparable (24 and 30 years, respectively), which makes it correct to compare the average long-term values for them. Thus, the differences between the long-term average meteorological parameters for the modern (1989–2018) and historical (1965–1988) periods, which are further denoted as Δ, characterize the observed climatic changes.
The direction of latitudinal changes in mean long-term meteorological characteristics was analyzed on the basis of linear trends, the statistical significance of which was assessed by Student’s t-criteria. When t-criteria are greater than the critical value of 95% probability, linear trends were considered significant and plotted on the shown on the graphs.

3.2. Groundwater Recharge Model

Groundwater recharge was estimated by point-scale simulation of the surface and subsurface water balance. Point scale recharge in this approach is the flow from the unsaturated zone to the groundwater level, averaged throughout interest (decade, month, year, etc). The methodology of using the world-wide known unsaturated water flow simulator HYDRUS-1D for recharge estimation was described in [13,16,17] and others. To simulate recharge with the HYDRUS 1-D in the mentioned publications, the atmospheric boundary condition on the surface of topsoil is used [12]. This condition reflects the water balance, which comes with precipitation and is spent on surface infiltration, soil evaporation from the soil surface, and the possible surface runoff formation. For recharge simulation in a boreal climate, the essential effects of snow accumulation and melting, soil freezing and refreezing on the surface and near-surface water balance should be taken into account. The code SURFBAL has been developed as a supplement to HYDRUS 1-D for this purpose [20,21,22]. This code allows to generate atmospheric boundary conditions on the top of soil for HYDRUS-1D, calculating ET0 by different methods [23] and considering the physical processes of surface precipitation transformation, including snow accumulation and melting, surface and canopy evaporation as well as the generation of surface runoff taking into account soil freezing [24,25].
SURFBAL integrates the next surface water budget equation with daily time step dt:
d V d t = P E L S R v p ;   V = V s + V l ;   E l s = E l + E s  
where V is total volume of water accumulated, VL and VS are volumes of water accumulated on vegetation and in snowpack respectively, P is precipitation rate, ELS is total surface evaporation including evaporation from leafs (EL) and snow cover (ES), R is surface runoff, vp is potential infiltration into the soil.
The Soil Conservation Service Curve Number (CSC-CN) method is used to calculate surface runoff R during the warm period, when the soil is not frozen. During snowmelt, but when the soil is still frozen, the hydraulic conductivity of frozen soil is used as the upper limit of vp to separate the melt water into surface runoff R and potential infiltration vp. To diagnose the thawed or frozen state of the soil, SURFBAL simulates vertical heat transfer in the soil, taking into account the phase transition of soil moisture as well as the warming effect of the snow cover.
The HYDRUS 1D code solves equation of vertical variably saturated flow [25]:
θ t = z ( K ( z , h p ) H z ) S ( h p ) ;   H = z + h p
where hp is the water pressure head, which is positive in the saturated zone and negative in the unsaturated zone, θ is the volumetric water content, S is the sink term reflected root water uptakes, K is the unsaturated hydraulic conductivity, z is the vertical coordinate. Groundwater recharge is a time-dependent flux through the lower boundary of the simulated soil profile.
As a result, the use of the two codes together allows the consideration of important processes of cold regions hydrology that affect runoff generation and the infiltration of meltwater.
Thus, the point scale water budget and recharge simulation process consists of two stages. In the first stage daily values of precipitation, solar radiation, wind speed, air temperature and humidity for the whole period of the simulation (1965–2018) are used by the SURFBAL code as input data. The code SURFBAL calculates the surface water balance including an interception by a canopy, surface (leaf and snow) evaporation, snow accumulation, consolidation of snowpack and its melting, surface runoff, as well as initial potential values of evaporation, transpiration and water inflow to the soil. These results are the input values for the next stage of the simulation the unsaturated flow with root water uptake using HYDRUS-1D package with lower boundary conditions of two types. Given pressure height is used at the lower boundary, when the depth to the groundwater level is less than 5-10 meters. In case the groundwater level is located deep from the ground surface, the free drainage condition [12] is used. This condition allows to estimate the maximum possible recharge, which does not depend on the depth of the groundwater level.
To analyze regional scale differences in climate change influence on water balance in critical zone and groundwater recharge soil and vegetation averaged parameters typical for the region [26,27], were used the same for the whole simulation period 1965–2018.
The long-term annual and seasonal averages of surface runoff (S), actual evapotranspiration (ET) and groundwater recharge (W), calculated by daily simulated values were compared over historical (1965–1988) and modern (1989–2018) periods. This allows to estimate how climatic changes in annual precipitation (P) and other meteorological characteristics were transformed into changes in annual water balance and soil water storage (V):
ΔP = ΔS + ΔET + ΔW + ΔV,
where Δ is the difference between long term annual values of the two periods.

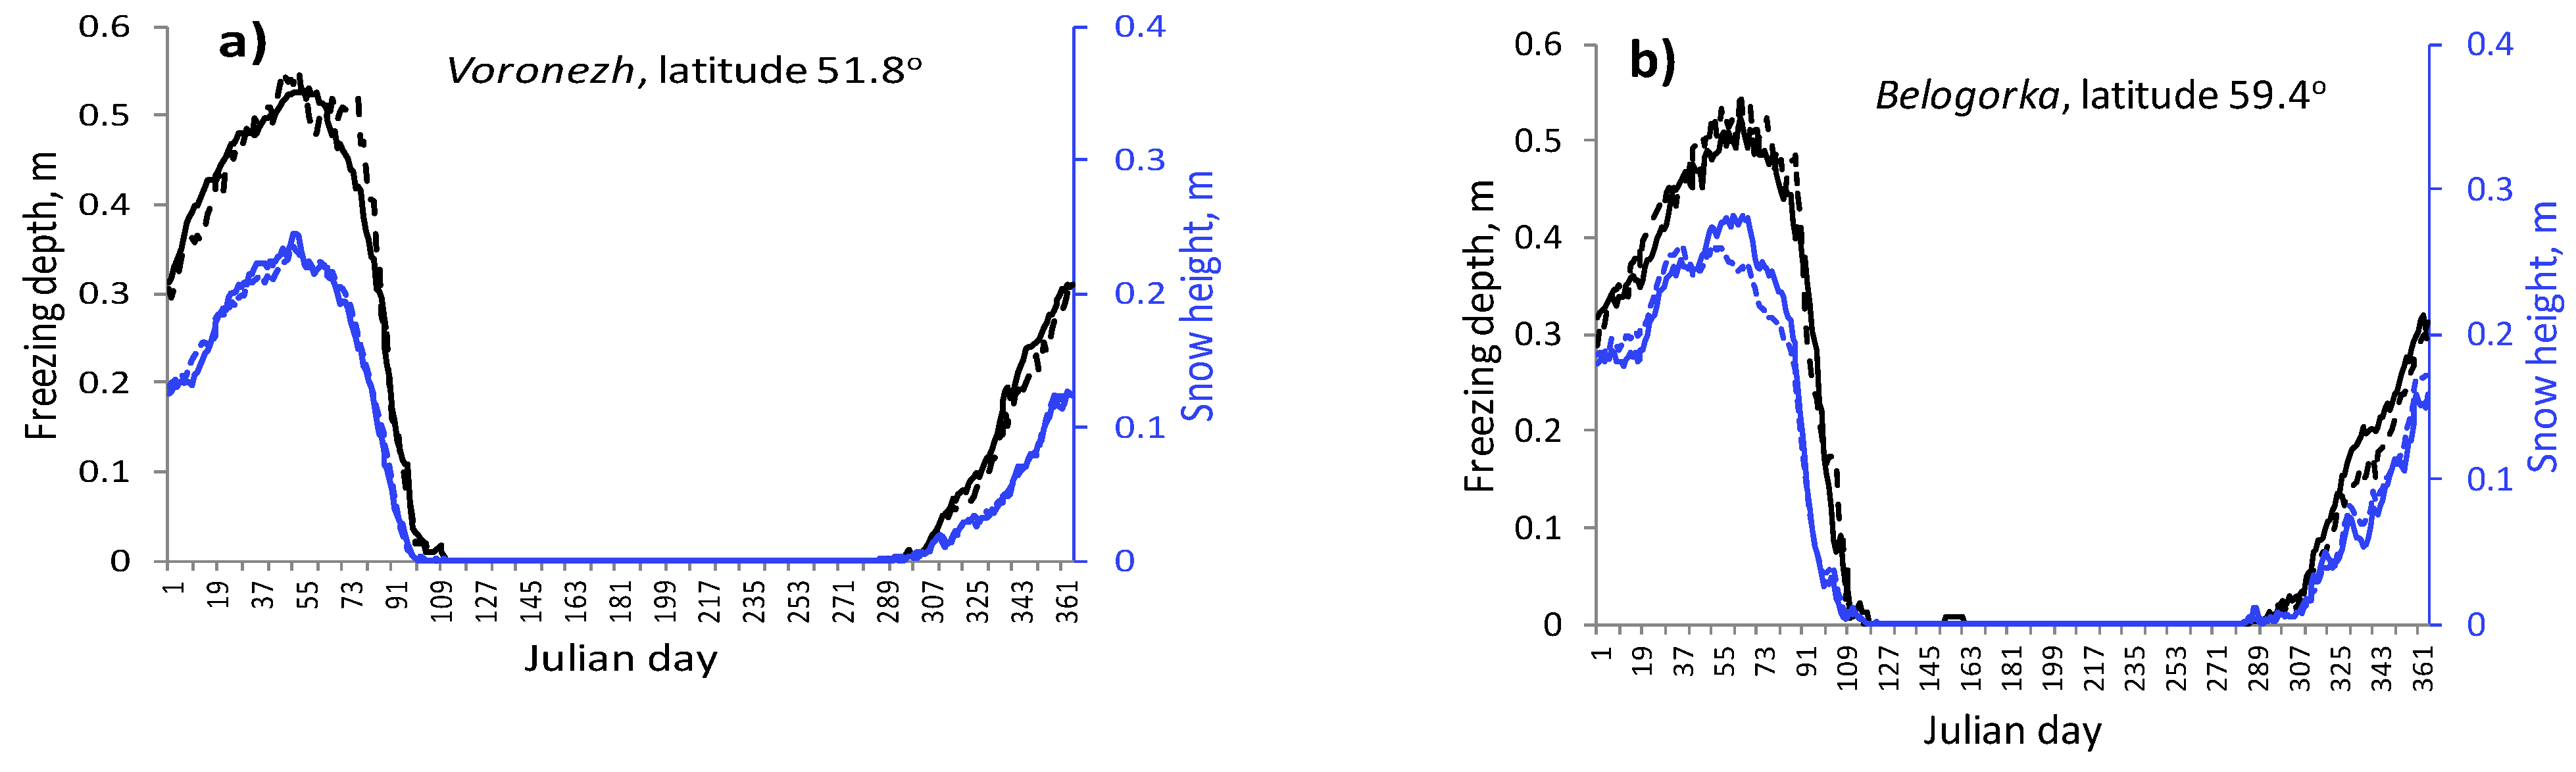
3.3. Groundwater Recharge Model Calibration and Verification

The model was calibrated based on a comparison of the observed and simulated long-term intra-annual and winter averages of snow height and freezing depth for each weather station. There are two main reasons to use winter season for model calibration. First, there are long-term daily observations of snow height and soil temperature at 11 points from the surface to a depth of 3.2 m, which were used to calculate the freezing depth for each weather station. Secondly, it is winter that is the most important season in humid and sub-humid boreal climates, when the bulk of surface water infiltrates into the soil. This is due to the significant accumulation of water in the snow cover, and the close relationship between the infiltration of melt water and the rate of snow melting and soil thawing [21].
When calibrating, snow melting and compaction coefficients as well as soil thermal conductivity parameters were fitted. The example of comparing simulated and observed data for two weather stations located in the south (Voronezh, latitude 51.8°) and in the north (Belogorka, latitude 59.4°) of ER, is shown in Figure 2.
Long-term average water balance simulation results were verified based on the Fu’s equation, which is widely used to describe the Budyko curve – the dependence of actual evapotranspiration ET on energy and water availability, represented by the potential evapotranspiration ET0 to precipitation P ratio:
E T P = 1 + E T 0 P [ 1 + ( E T 0 P ) n ] 1 n  
where n is landscape parameter [28].
Figure 3a shows that the simulated average annual ET and ET0, calculated by FAO Penman-Monteith method [23], fit reasonably well (R2 = 0.9–0.97) to curves based on equation (4) with parameter n, that differs for the four simulated landscapes. In this case, the fitted n values for forest landscapes and sandy soils are higher, than for meadows and loamy soils, which is consistent with [28,29,30]. Such model results verification confirms a physically correct simulated interplay between climate conditions, vegetation, and the water balance. The boundary between the energy limited (ET0/P < 1) and water limited (ET0/P > 1) regions on Figure 3b corresponds to a latitude of about 53–54 degrees.

4. Analysis of Latitudinal Patterns of Climatic Changes in the ER
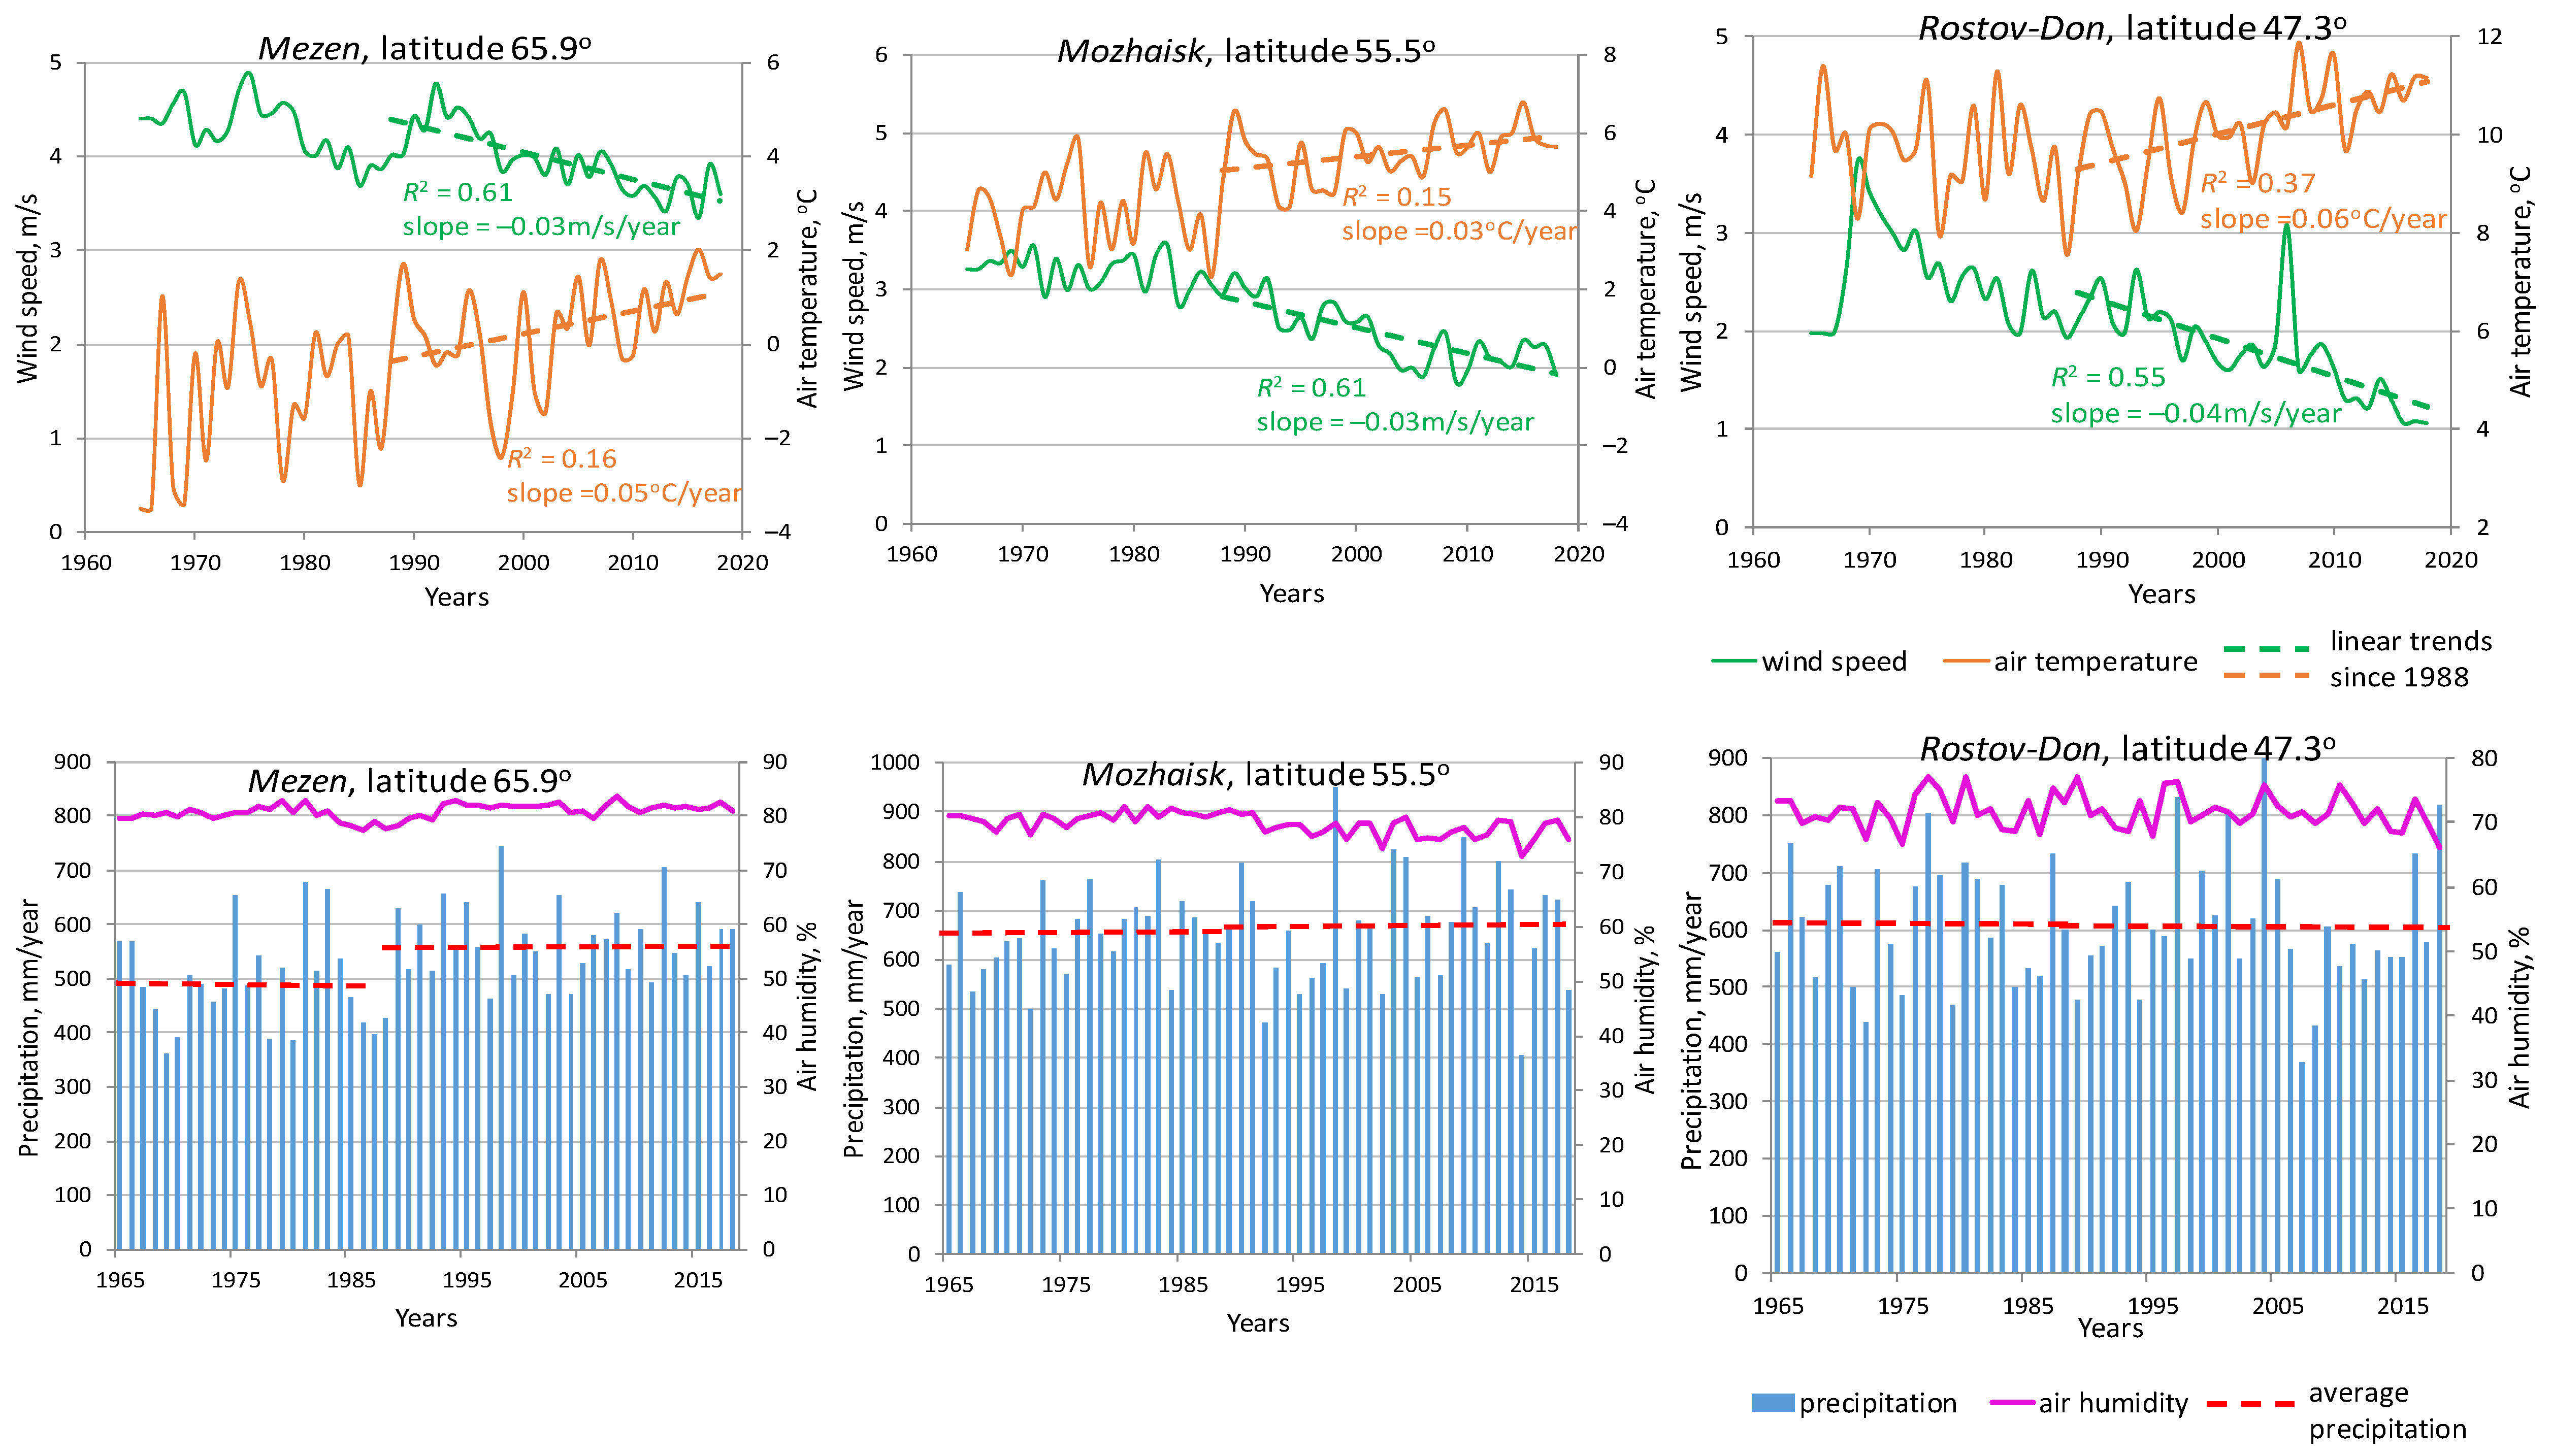
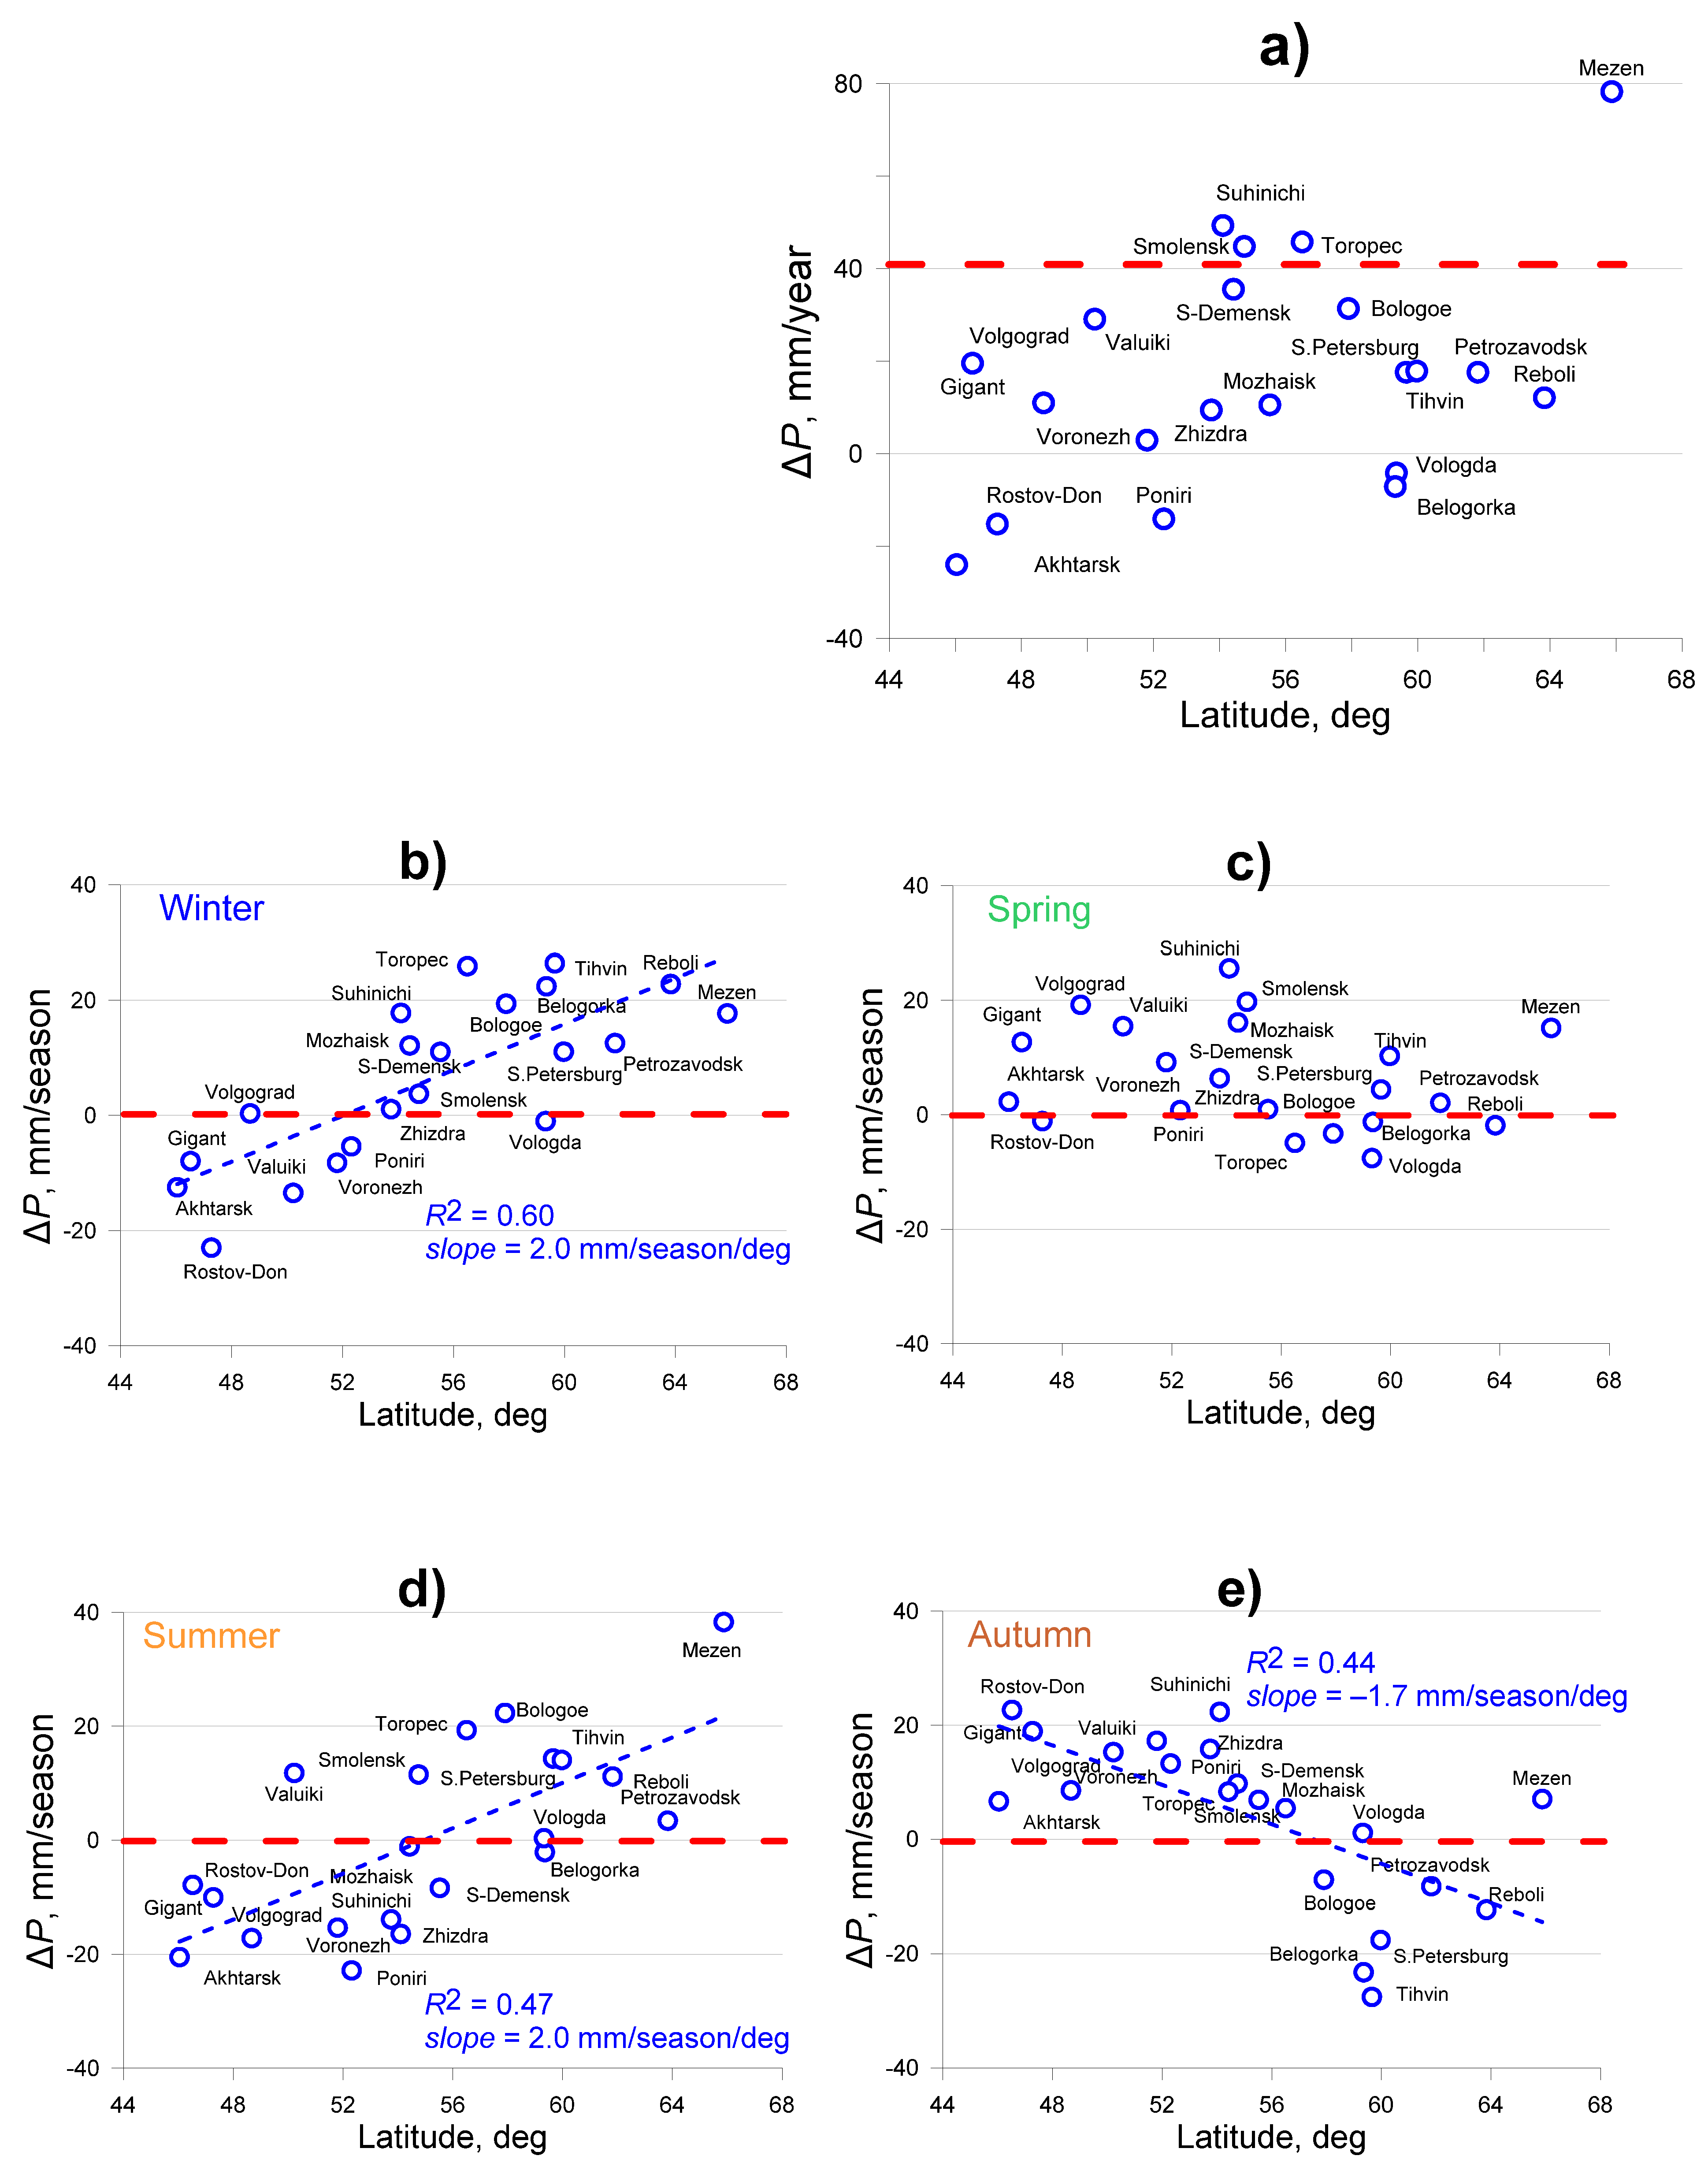
Preliminary data analysis shows obvious rising trends in annual air temperature and declining trends in average wind speed for the entire region since the middle of 1980s (Figure 4). At the same time, there are no obvious trends in the change of annual precipitation and air humidity, however, the long-term average precipitation in most cases slightly increases (Figure 4). Given the large area of the studied region, it is necessary to analyze the latitudinal differences in the observed changes in meteorological characteristics.

4.1. Precipitation

The differences of long-term average annual precipitation ΔP for the historical and modern periods as well as their latitudinal distribution are shown in Figure 5. Despite the absence of obvious long-term trends in annual values (Figure 4), an increase in long-term average annual precipitation up to 80 mm/year prevails in the studied region of ER (Figure 5a). However, there is no clear latitudinal regularity of ΔP, and the relative changes in long-term average annual precipitation compared to historical period do not exceed ±5-10%, except for the northernmost weather station Mezen (Figure 5a).
Latitudinal differences in precipitation changes are clearly visible in their mean long-term seasonal values for all seasons except spring (Figure 5b). The average long-term amount of winter and summer precipitation in the modern period decreased in the south (ΔP < 0) and increased in the north (ΔP > 0) of the ER. The average amount of autumn precipitation in the modern period, on the contrary, increased in the south and decreased in the north, while the amount of spring precipitation mainly enlarged in the entire region. It should be noted that the scale of the seasonal increase and decrease in precipitation is approximately the same and does not exceed ± 20–30 mm/year (Figure 5b).

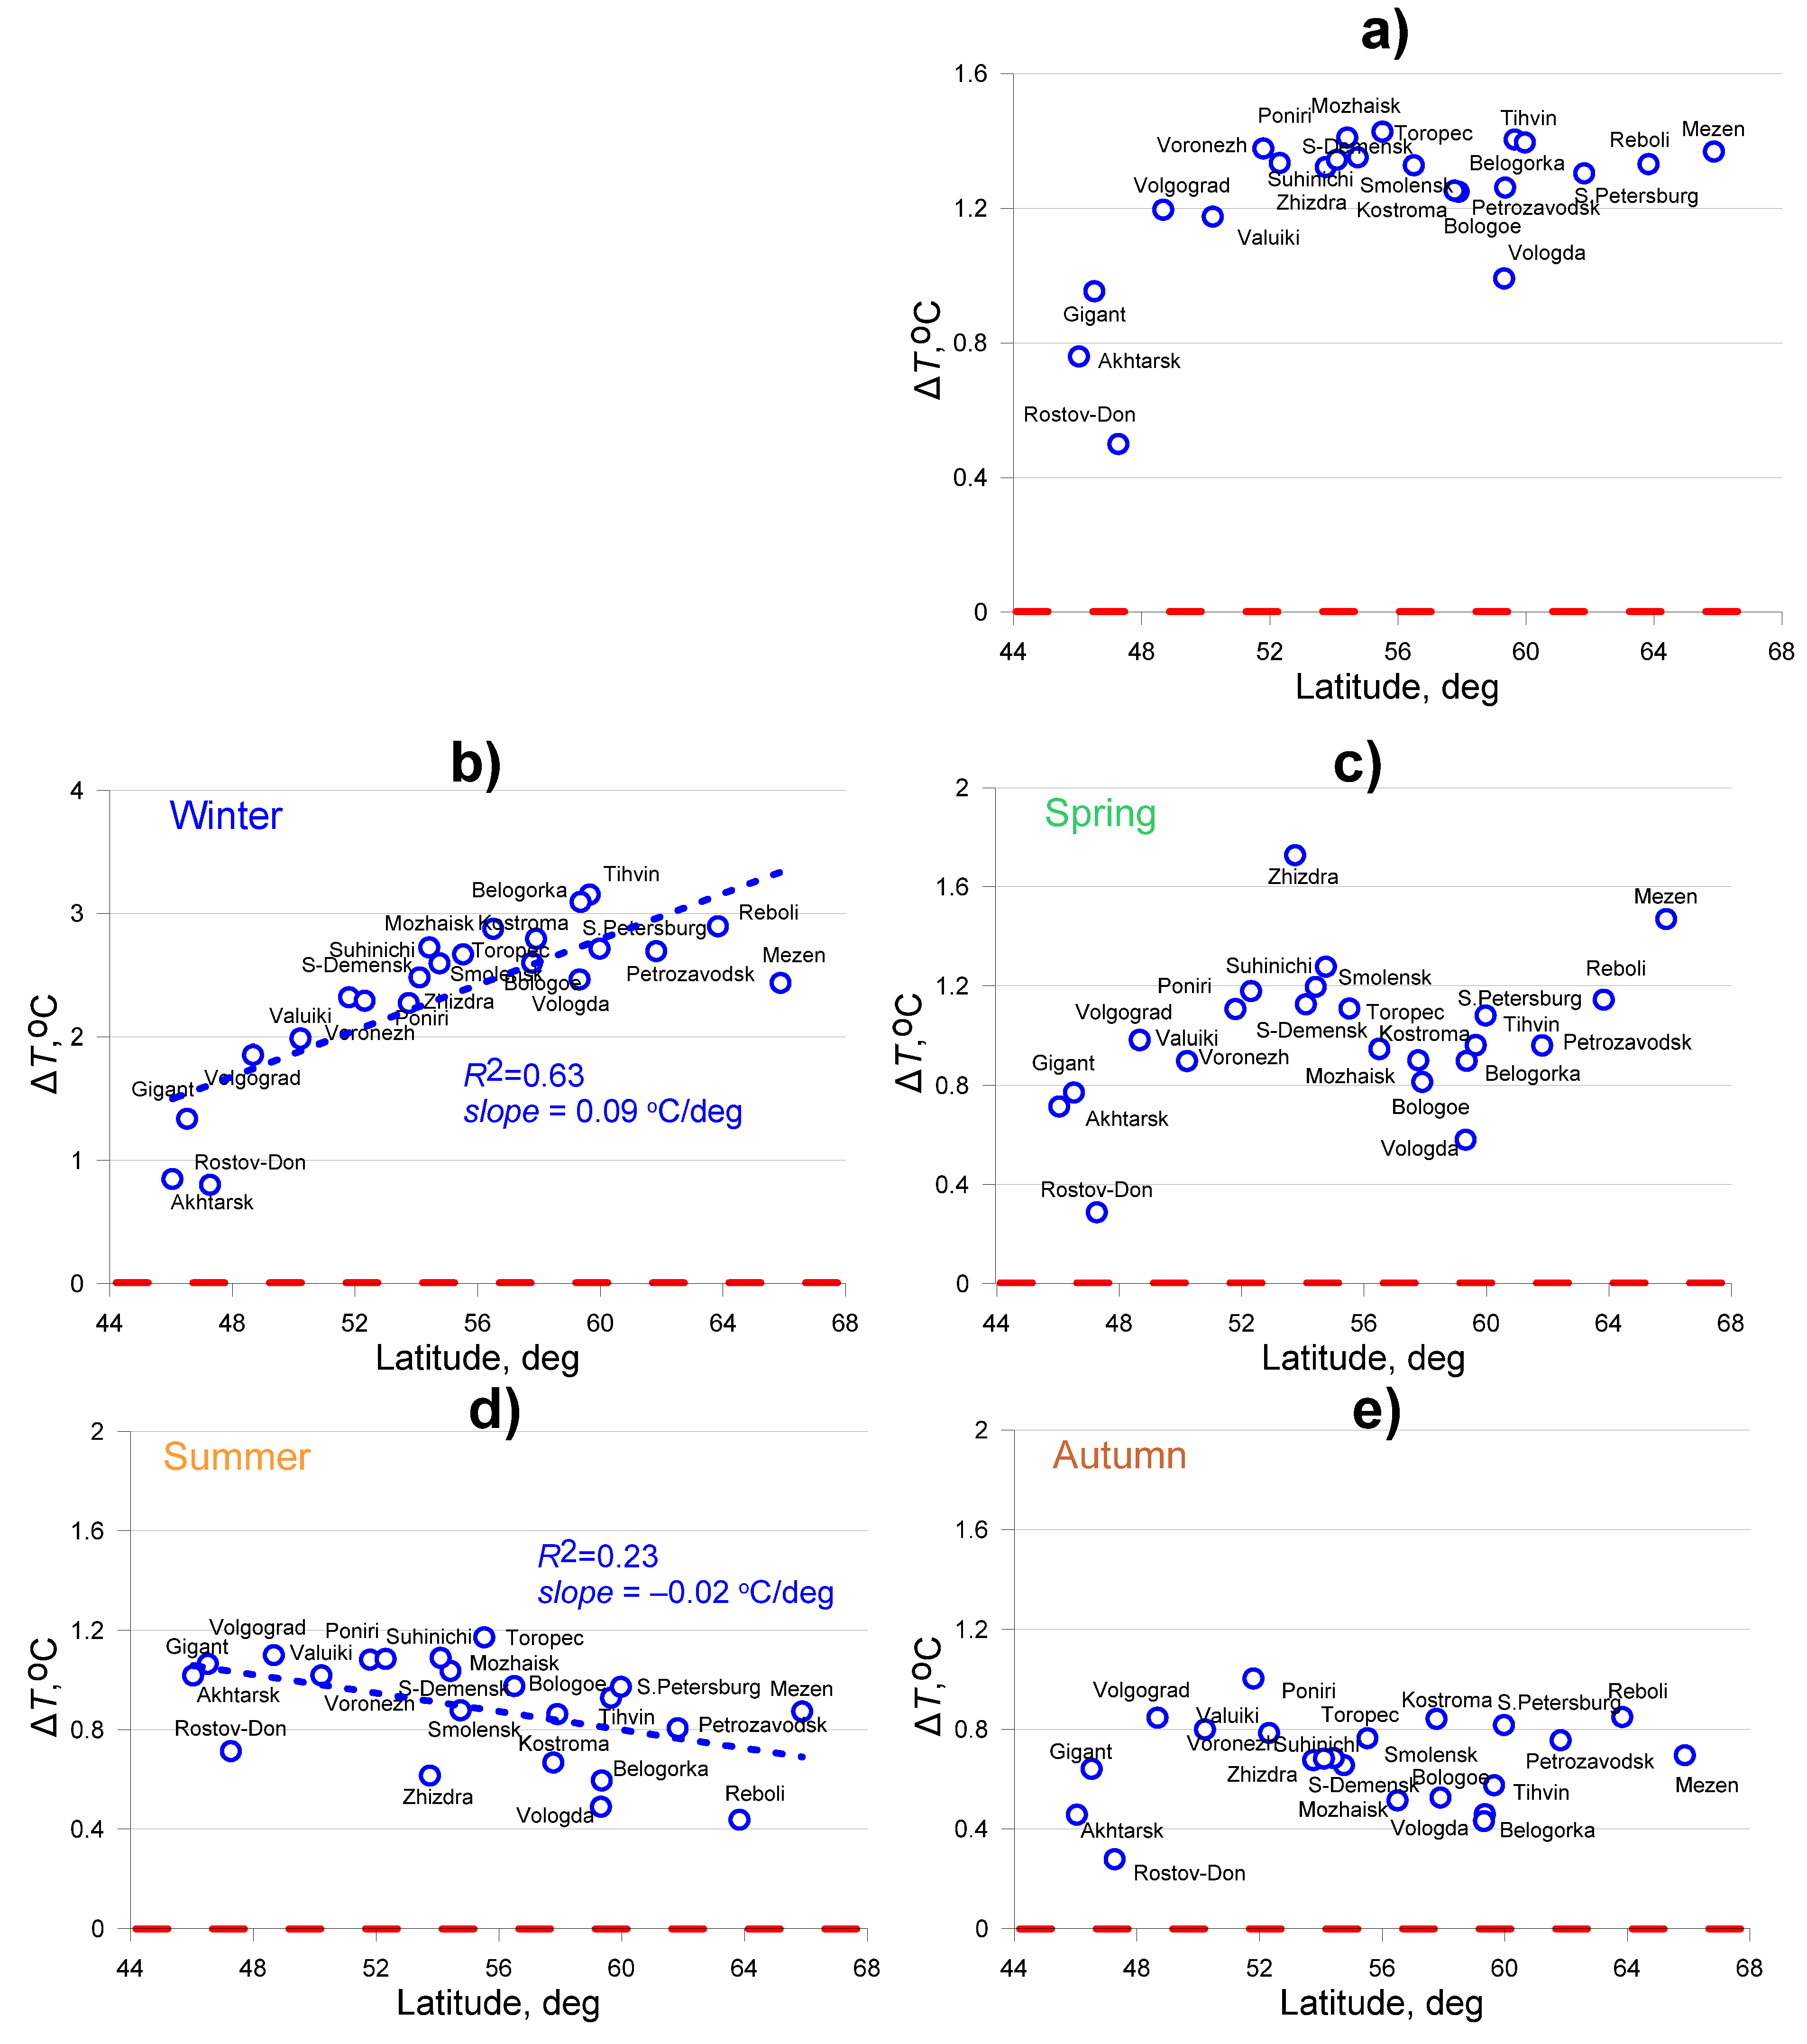
4.2. Air Temperature

Comparison of the average annual air temperature for the historical and modern periods shows that it increased approximately the same by 1.2–1.4 °C in the entire region, except for its southernmost part. (Figure 6a). Long-term mean temperatures also increased in all seasons, but it is important to note that the maximum rise occurred in winter – up to 3.0 °C in the north of ER. Moreover, there is a clear upward trend of winter air temperature from south to north (Figure 6b). In contrast, summer temperatures in the modern period have increased more in the south, by 1.1 °C, and tend to decrease slightly from south to north. In other seasons, average temperatures increased more evenly across the region, averaging from 0.4 °C to 1.2 °C, with the lowest average temperature rise in autumn (Figure 6b).

4.3. Wind Speed and Air Humidity

Figure 7a shows a decrease in the average annual wind speed in the modern period in comparison with historical in the entire region to 1.2 m/s, except for data from several weather stations. This decrease in wind speed with almost the same values occurred evenly in all seasons and is consistent with the official hydrometeorological report on climate change in the Russian Federation, where the same decreasing trends in surface wind speed were noted [31].
Modern changes in the average annual and seasonal air humidity ΔH compared to the historical period are relatively small and amount to ± 1–2% (Figure 7b). It can only be noted that annual air humidity slightly decreased in the southern part of ER (ΔH < 0) and slightly increased (ΔH > 0) in the north.
Since significant changes in most meteorological characteristics are observed in the ER during the modern period, the next stage of the presented study is to analyze the impact of modern climatic changes on the water balance of the critical zone and groundwater recharge, as well as latitudinal differences of such impact.

5. Simulation Results and Discussion
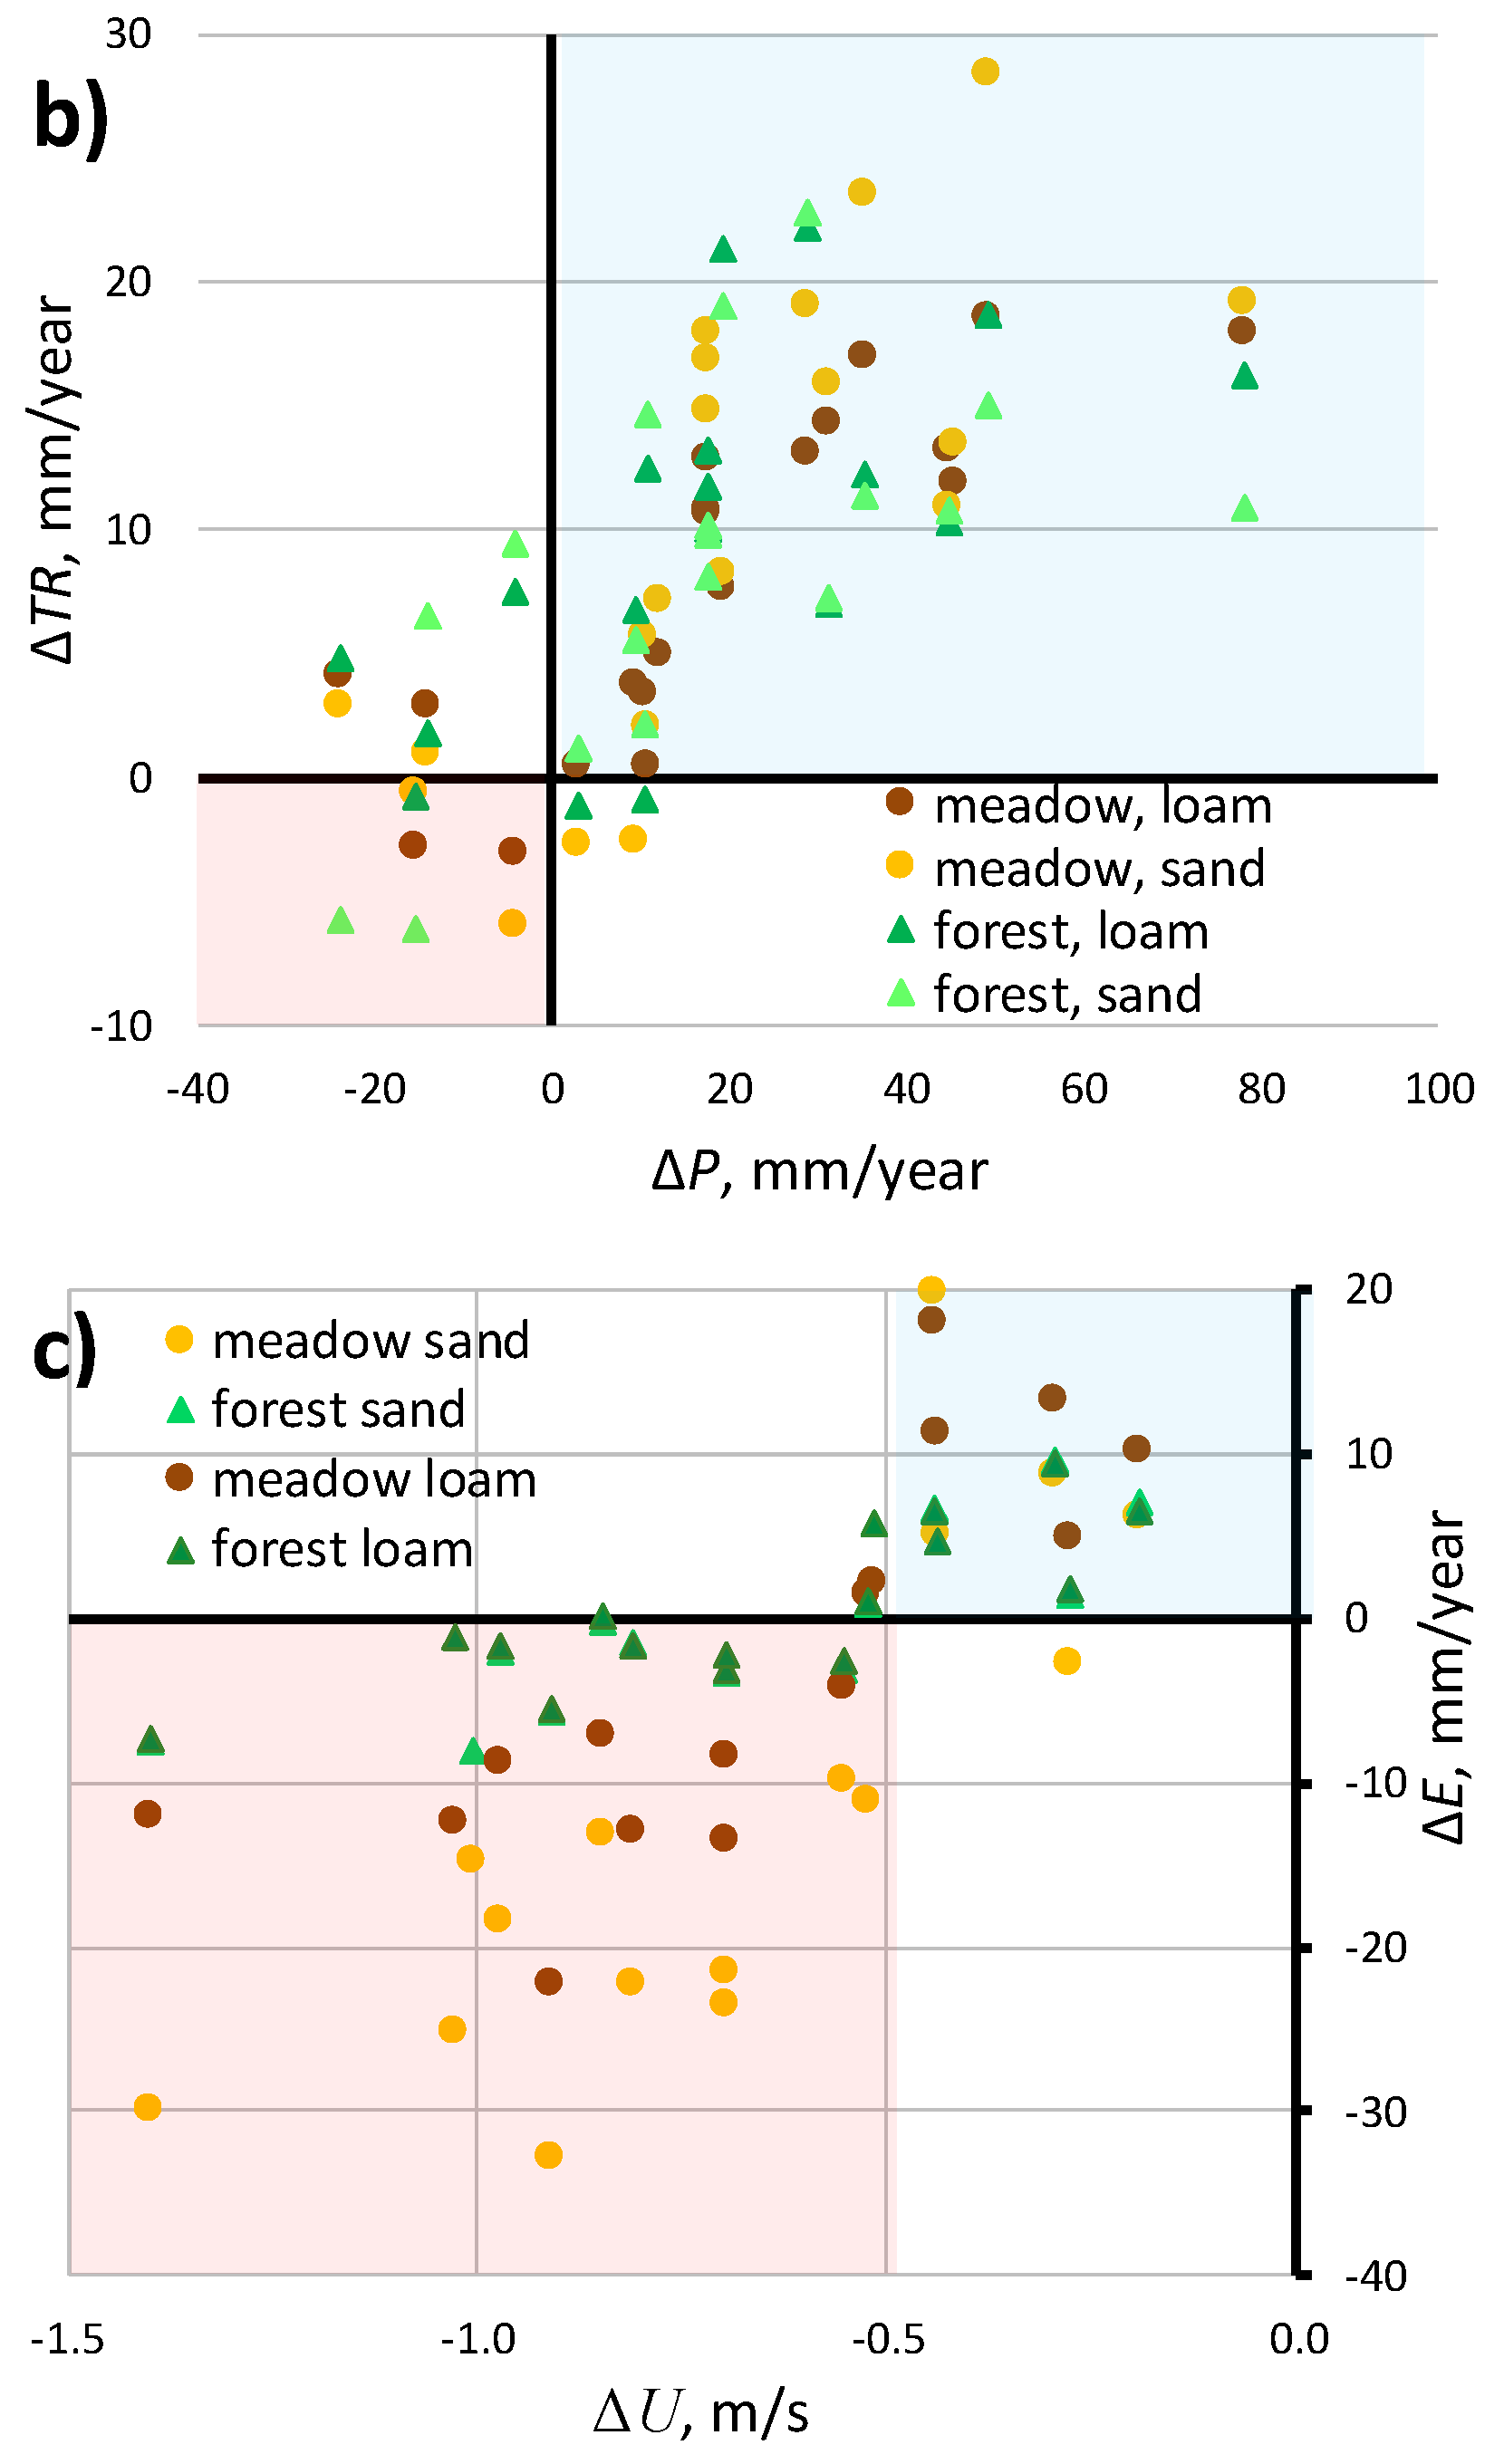
5.1. Surface Runoff

Simulated modern latitudinal changes in the mean annual surface runoff (ΔS) show its predominant decrease in the south of ER and an increase in the north in the range ±20 mm/year (Figure 8a). The best correlation was found between changes in surface runoff and changes in winter precipitation (Figure 8b). This tendency is confirmed by the results of global analysis, which showed that the change of water flux is significantly correlated to the change of precipitation in 71% of the world’s large rivers [30].
At the same time, both in the north and in the south of ER, simulation results show a significant transformation of the average intra-annual runoff in winter and spring (Figure 9a,b). In the modern period the peak of spring flood runoff essentially degrades while winter runoff, mainly in the northern regions, increases due to thaws caused by winter air temperature rising. An increase in winter air temperature, which is stronger in the north (Figure 6b), is also the main reason for the degradation of spring floods (Figure 9c), as it leads to decrease in soil freezing depth and an increase in the seepage of meltwater into the soil, which is confirmed by Figure 9d. Also, in the south of the ER, the summer runoff decreases slightly, while in the north it remains almost the same (Figure 9a,b).
Such modeling results are in good agreement with the observed ‘levelling’ of annual hydrographs and decreasing of river runoff during the spring months for most river basins of ER, which is due to the interception of melt water during occasional thaw floods [32]. Also, a decrease in the average long-term spring runoff for the period 1981-2015 compared to the previous 1951–1980 is noted in the Vistula river basin in Poland with similar climatic conditions [33].
Thus the results of simulation show that modern changes of surface runoff mainly caused by changes in precipitation and air temperature in winter, which are most significant (Figure 5b and Figure 6b).

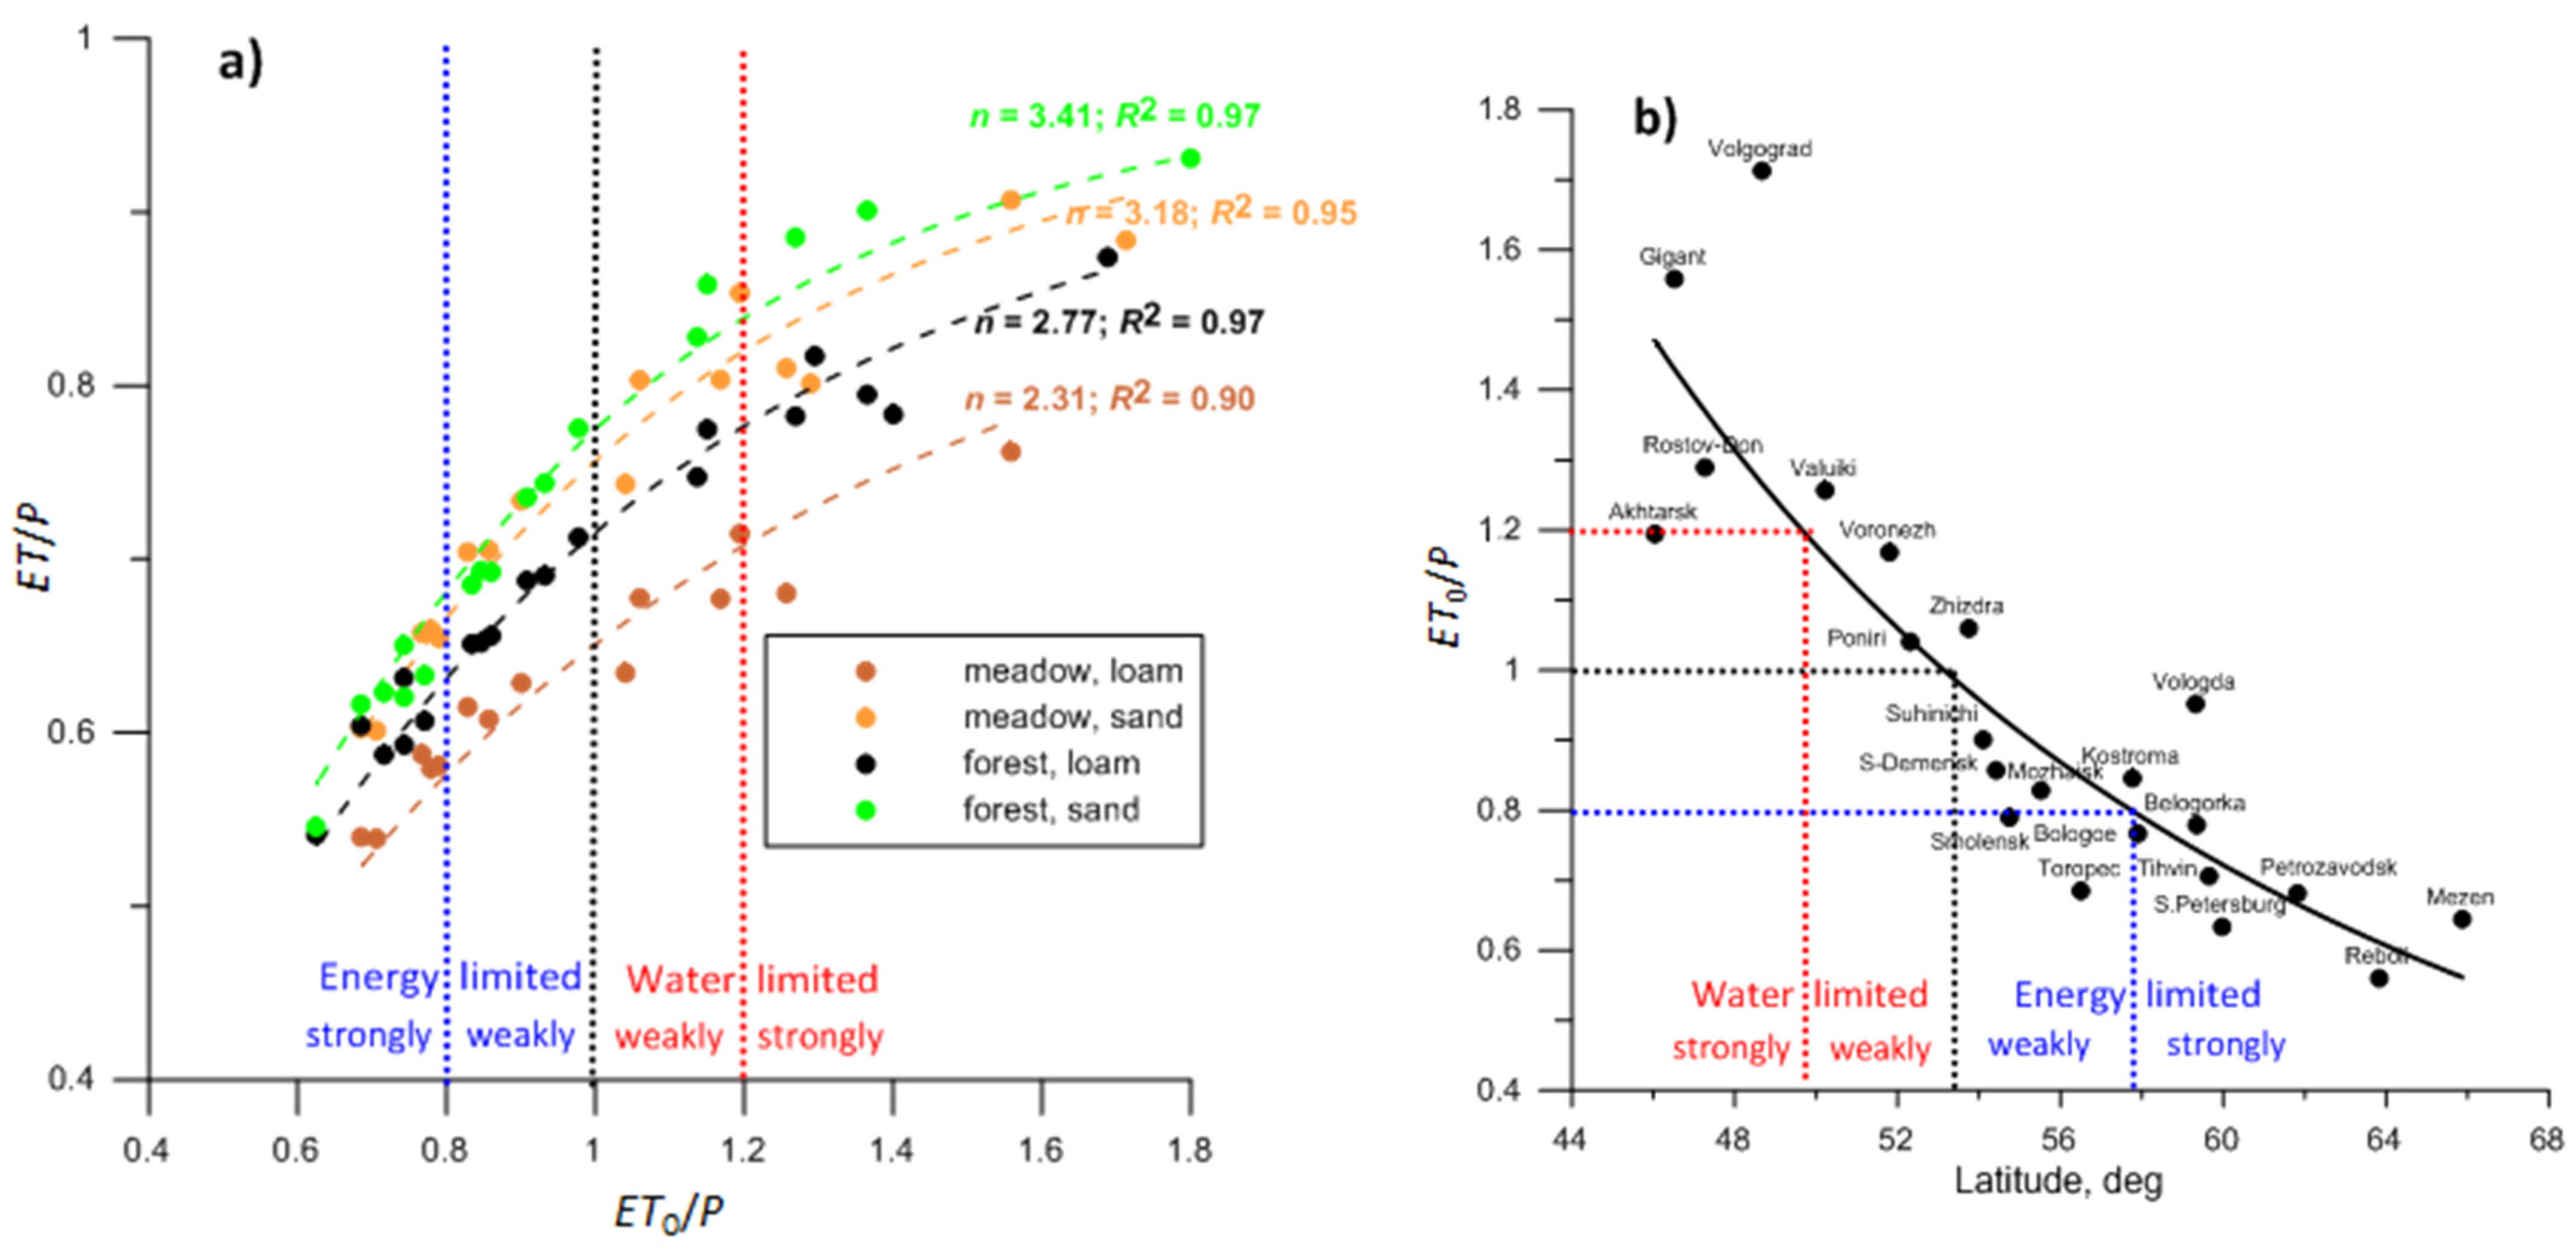
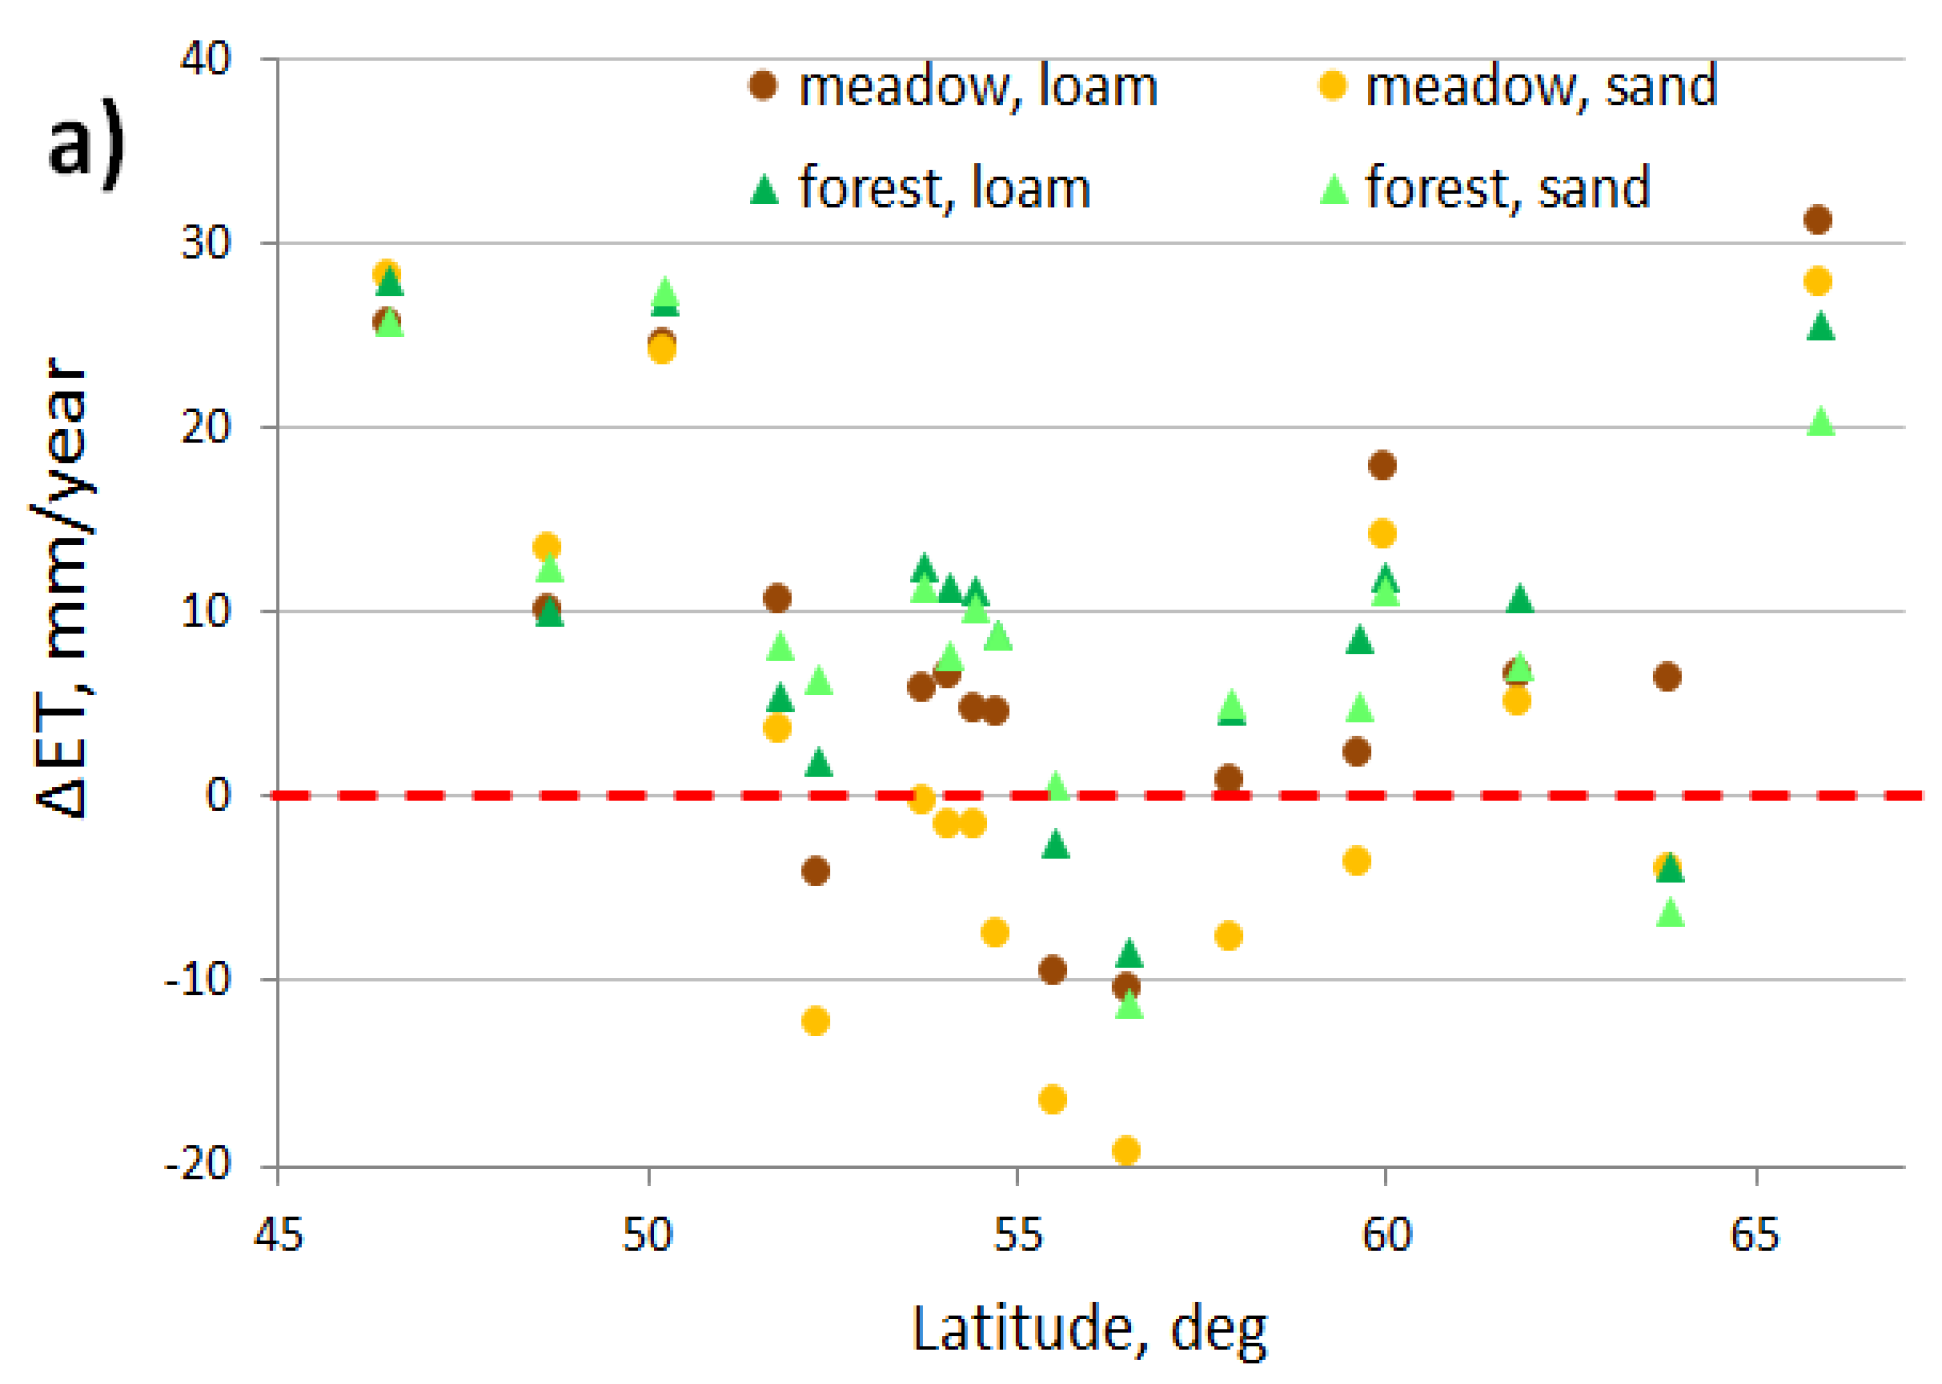
5.2. Evapotranspiration

According to model studies on a continental scale [6], an increase in actual evapotranspiration under conditions of limited energy occurs, as a rule, due to an increase in potential evapotranspiration caused by an increase in annual temperature. The obtained model results showed a somewhat different pattern. Despite the general increase in air temperature in modern period, the model results show irregular changes of mean annual evapotranspiration ΔET: its increasing in the north and in the south of ER up to 30 mm/year and its decreasing in the central part - up to 20 mm/year (Figure 10a).
Such an irregular dependence of changes in actual evapotranspiration on latitude can be explained by the nature of the observed variability of meteorological characteristics. The increase in actual evapotranspiration in the southern part of the region (Figure 10a) is apparently associated with the highest increase in summer air temperatures observed here (Figure 6d). In the north, a pronounced increase in evapotranspiration was obtained for the northernmost station Mezen (Figure 10a), where the maximum increase in summer precipitation is observed by almost 40 mm (Figure 5c).
Moreover, simulated changes of ET are caused by the opposite influence of two different reasons, because total evapotranspiration includes evaporation E and root water uptake for transpiration TR.
On the one hand results of simulation show a predominant increasing of mean annual plant transpiration in the ER. The best correlation was found between the modeled ΔTR and observed changes in precipitation ΔP (Figure 10b), while there is no correlation between ΔTR and changes in annual air temperature and wind speed. This is because plant transpiration is more sensitive to the amount of available moisture, which is directly depends on precipitation, than to other meteorological characteristics [27].
On the other hand, the observed decrease in wind speed (Figure 7a) leads to a significant decrease in surface and soil evaporation, despite of annual air temperature rising (Figure 6a). Figure 10c shows a clear correlation between decreased evaporation ΔE and decreased wind speed ΔU, while there is almost no correlation between ΔE and changes in precipitation and temperature. As shown on Figure 10c, reduction of evaporation (ΔE < 0) corresponds to a decrease of wind speed more than 0.5 m/s, which means that such a decrease of the wind speed has a greater effect on E, than the air temperature rising.
Thus, the modeled irregular modern changes in total evapotranspiration are explained by the multidirectional effect of the observed variations in meteorological characteristics on plant transpiration and physical evaporation. The different ratio of climatic changes in wind speed, air temperature and precipitation in each local site (weather station) determines the different local signs and scales of ΔE and ΔTR, so ΔET has irregular dependence on latitude.

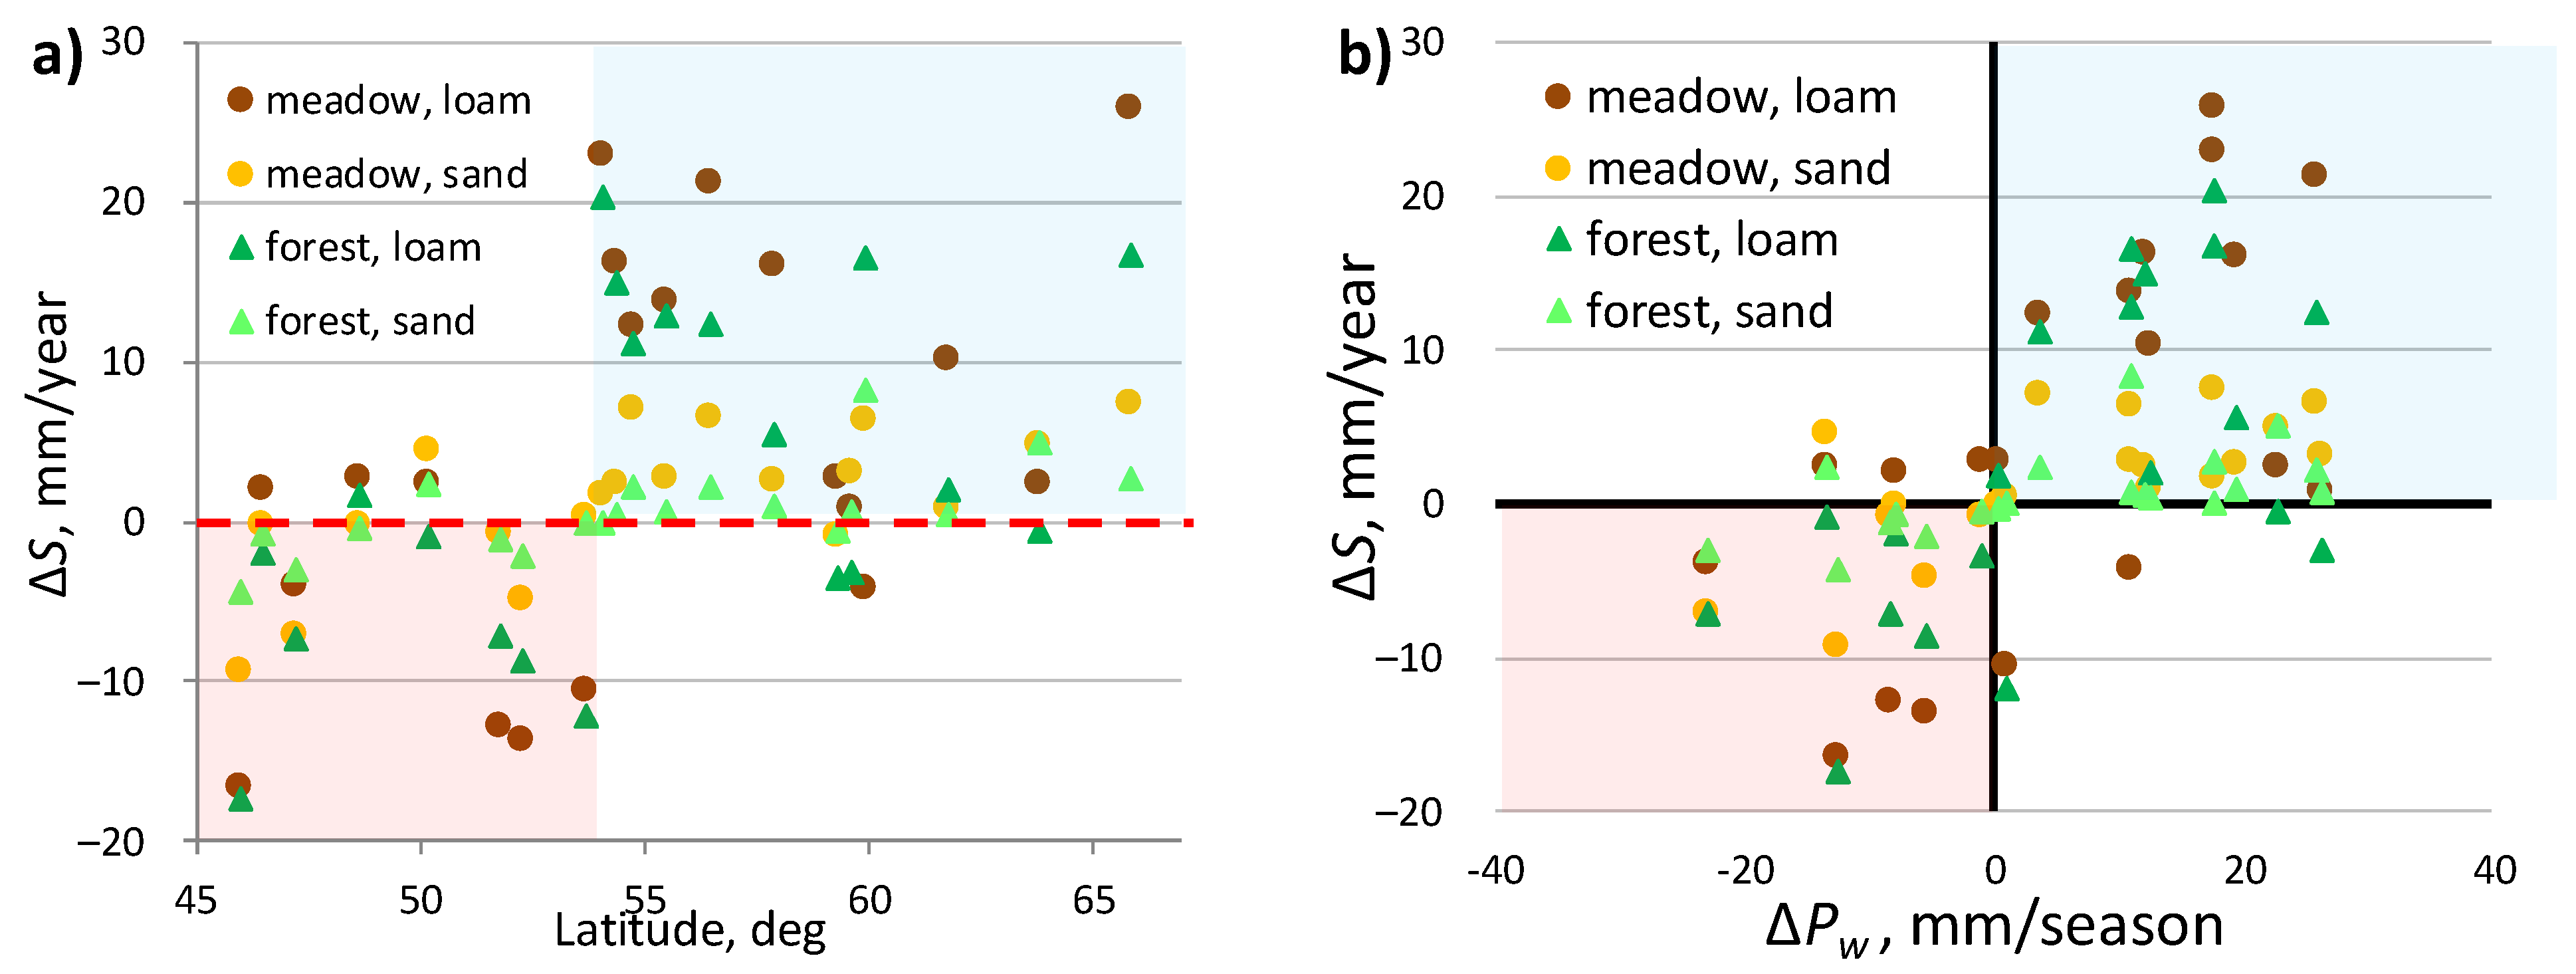
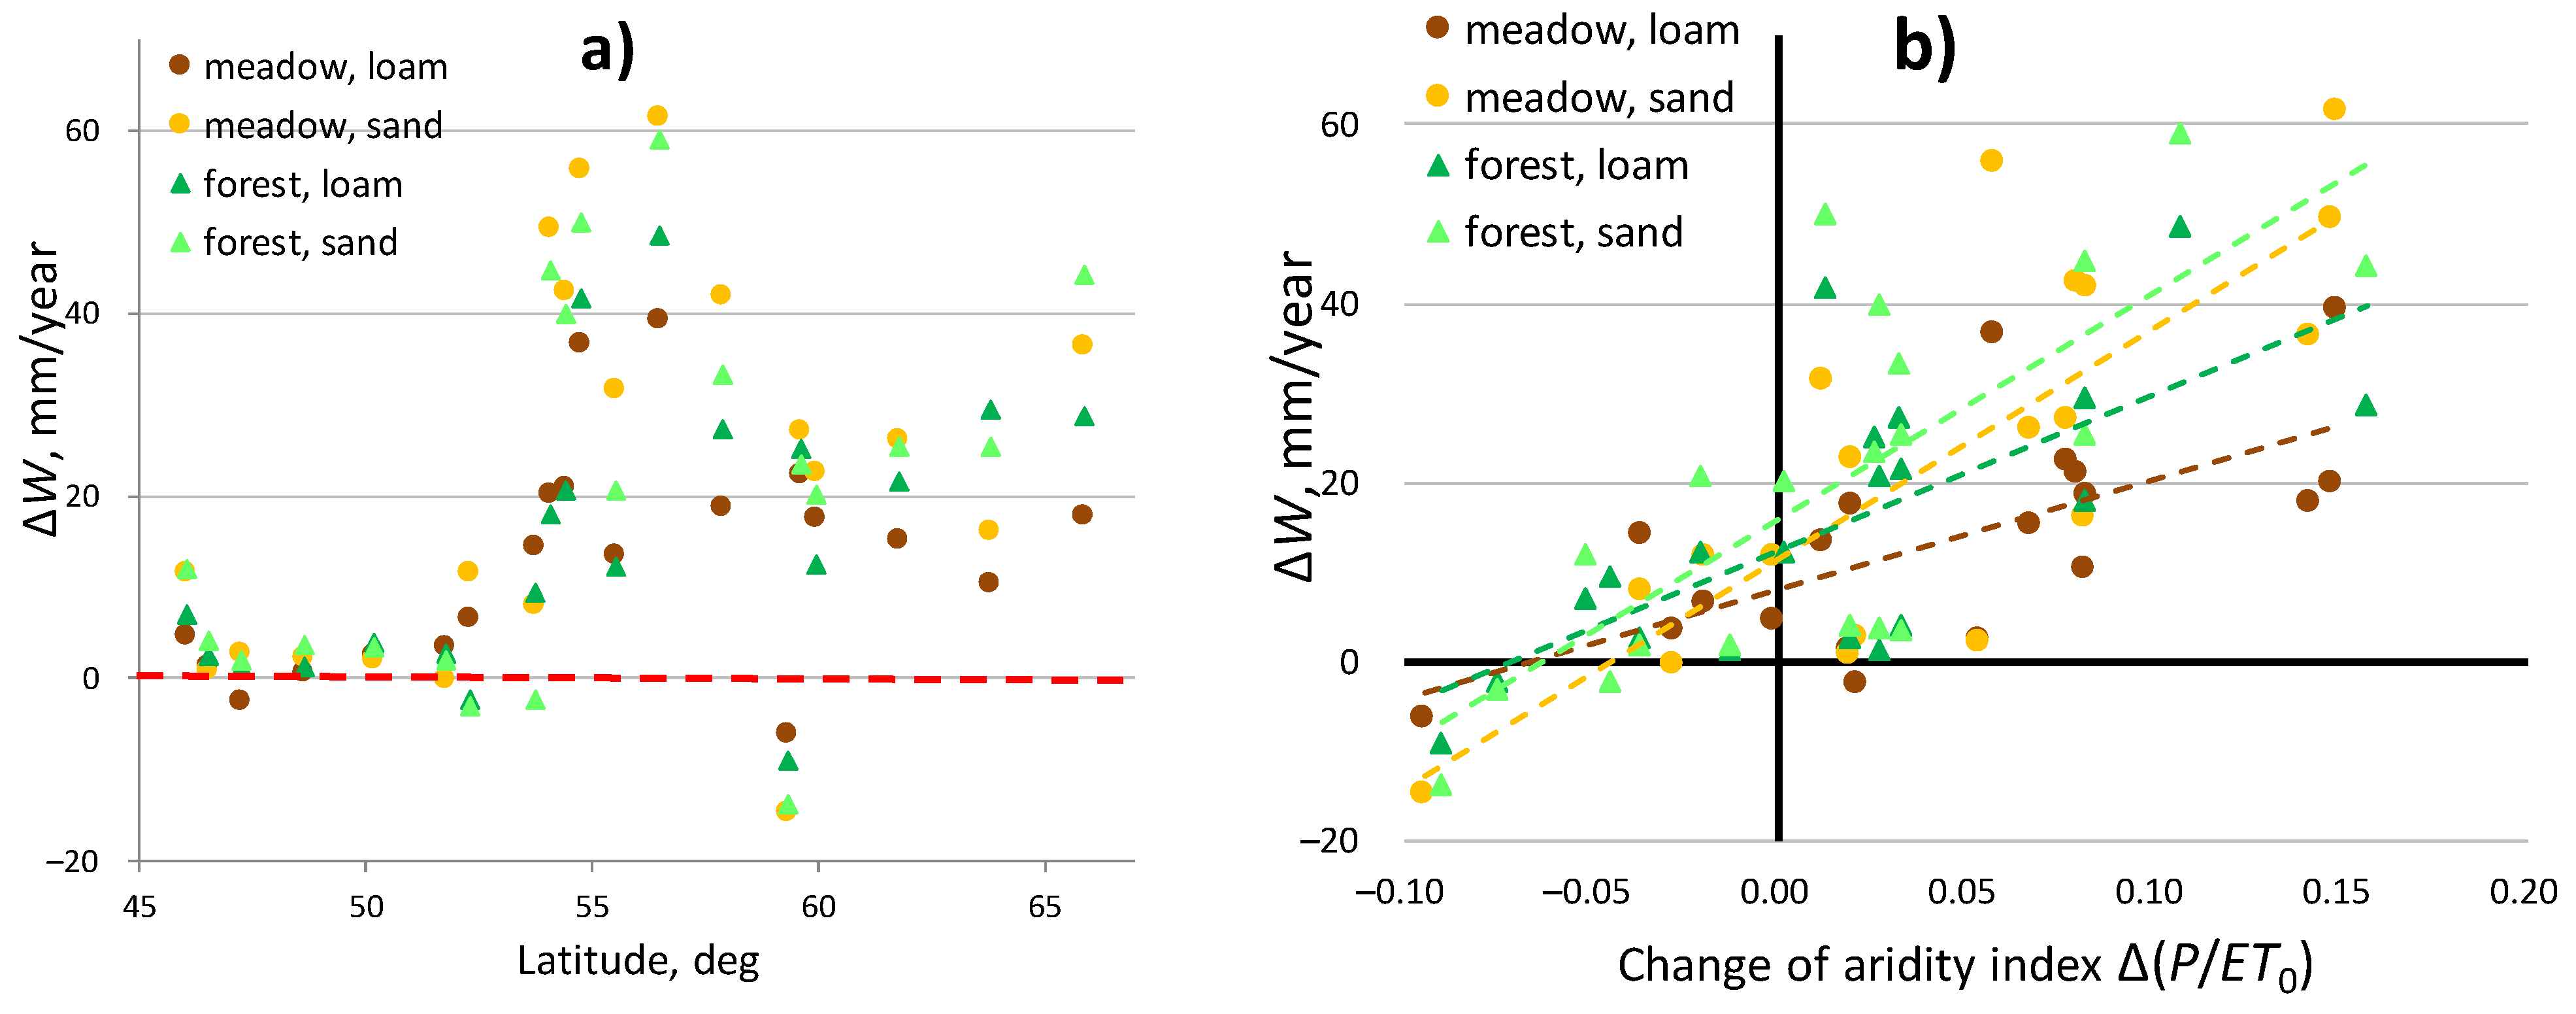
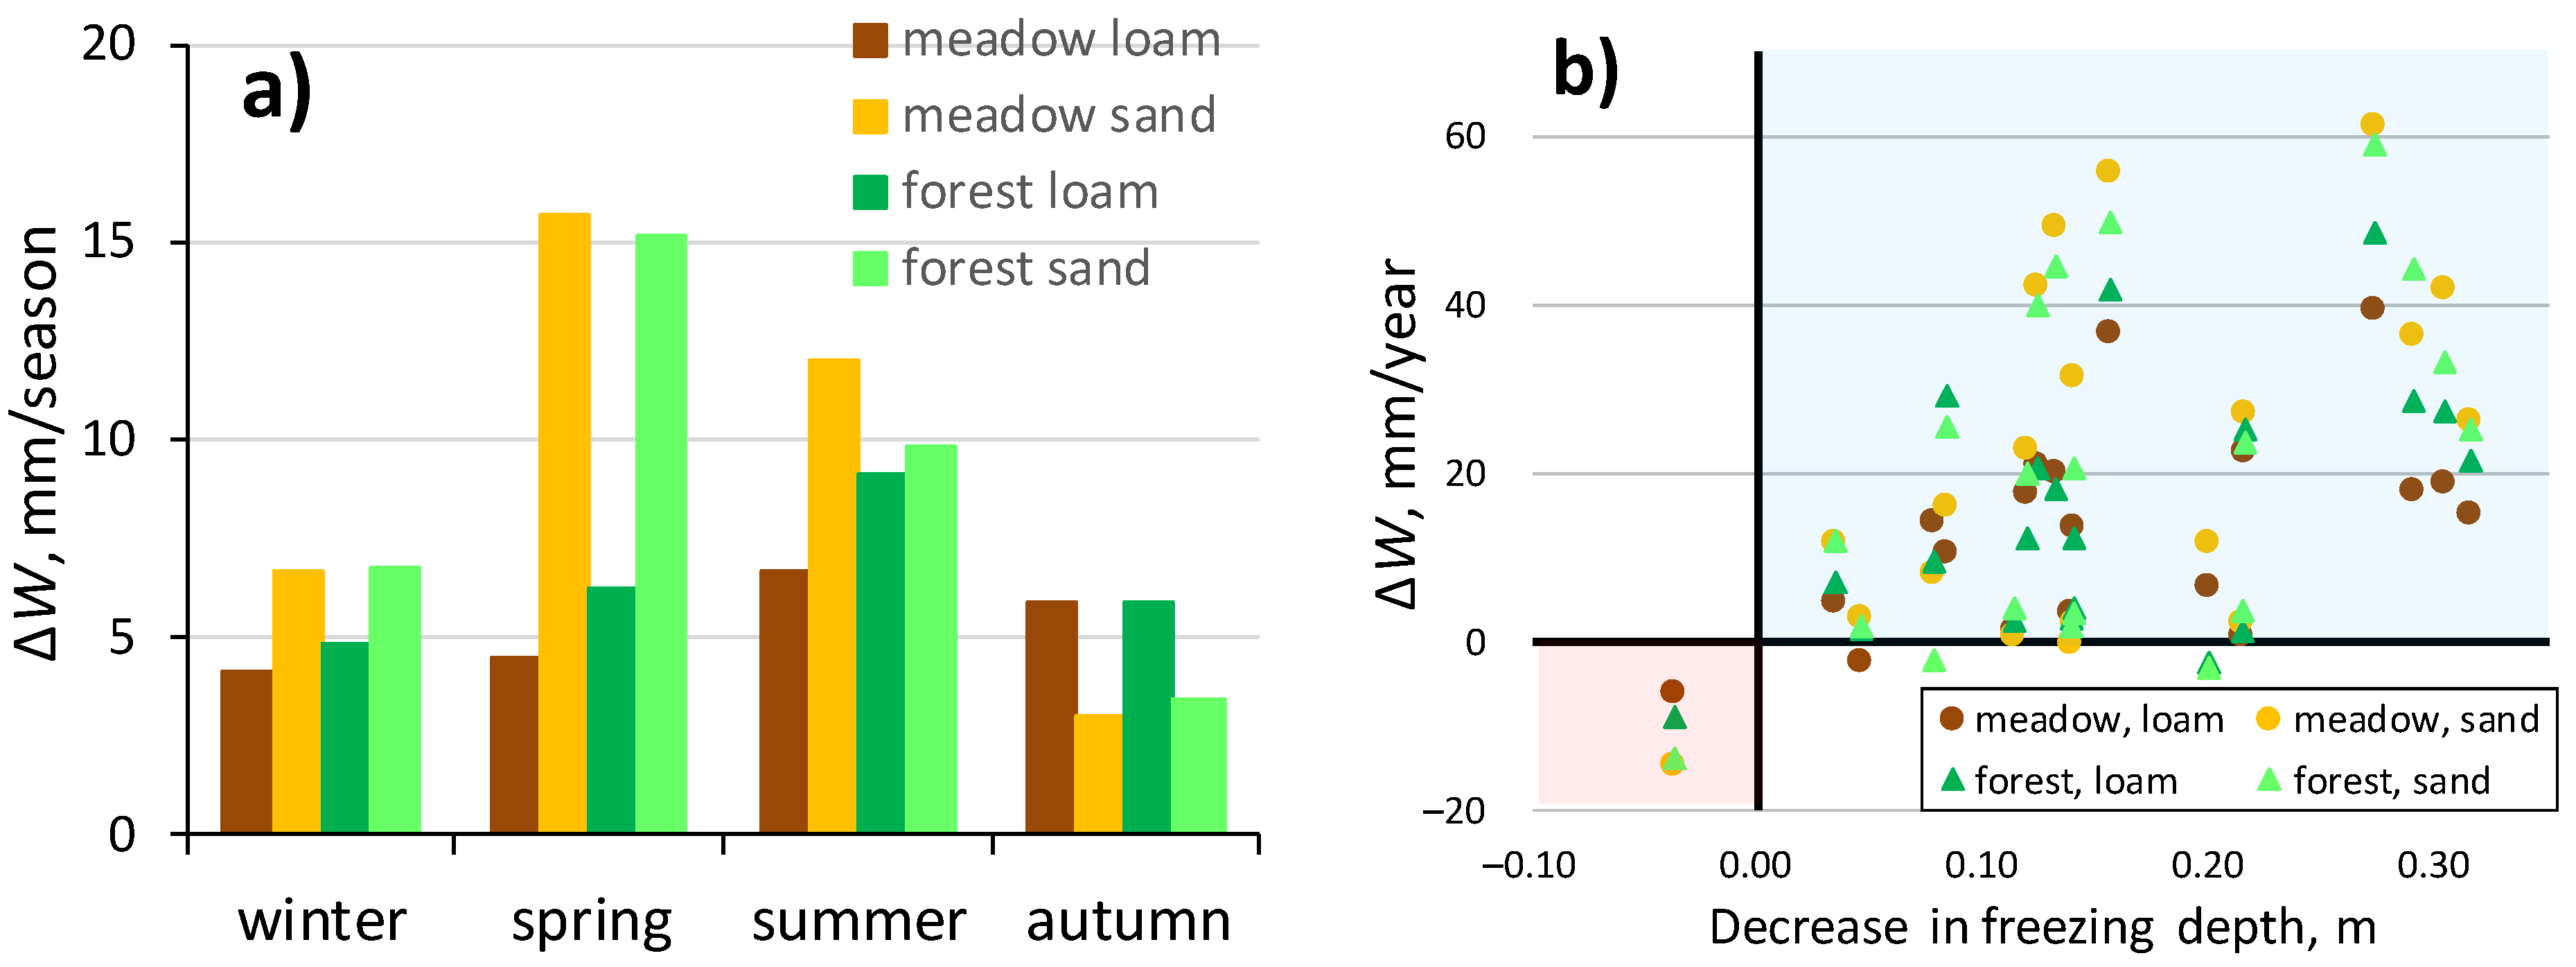
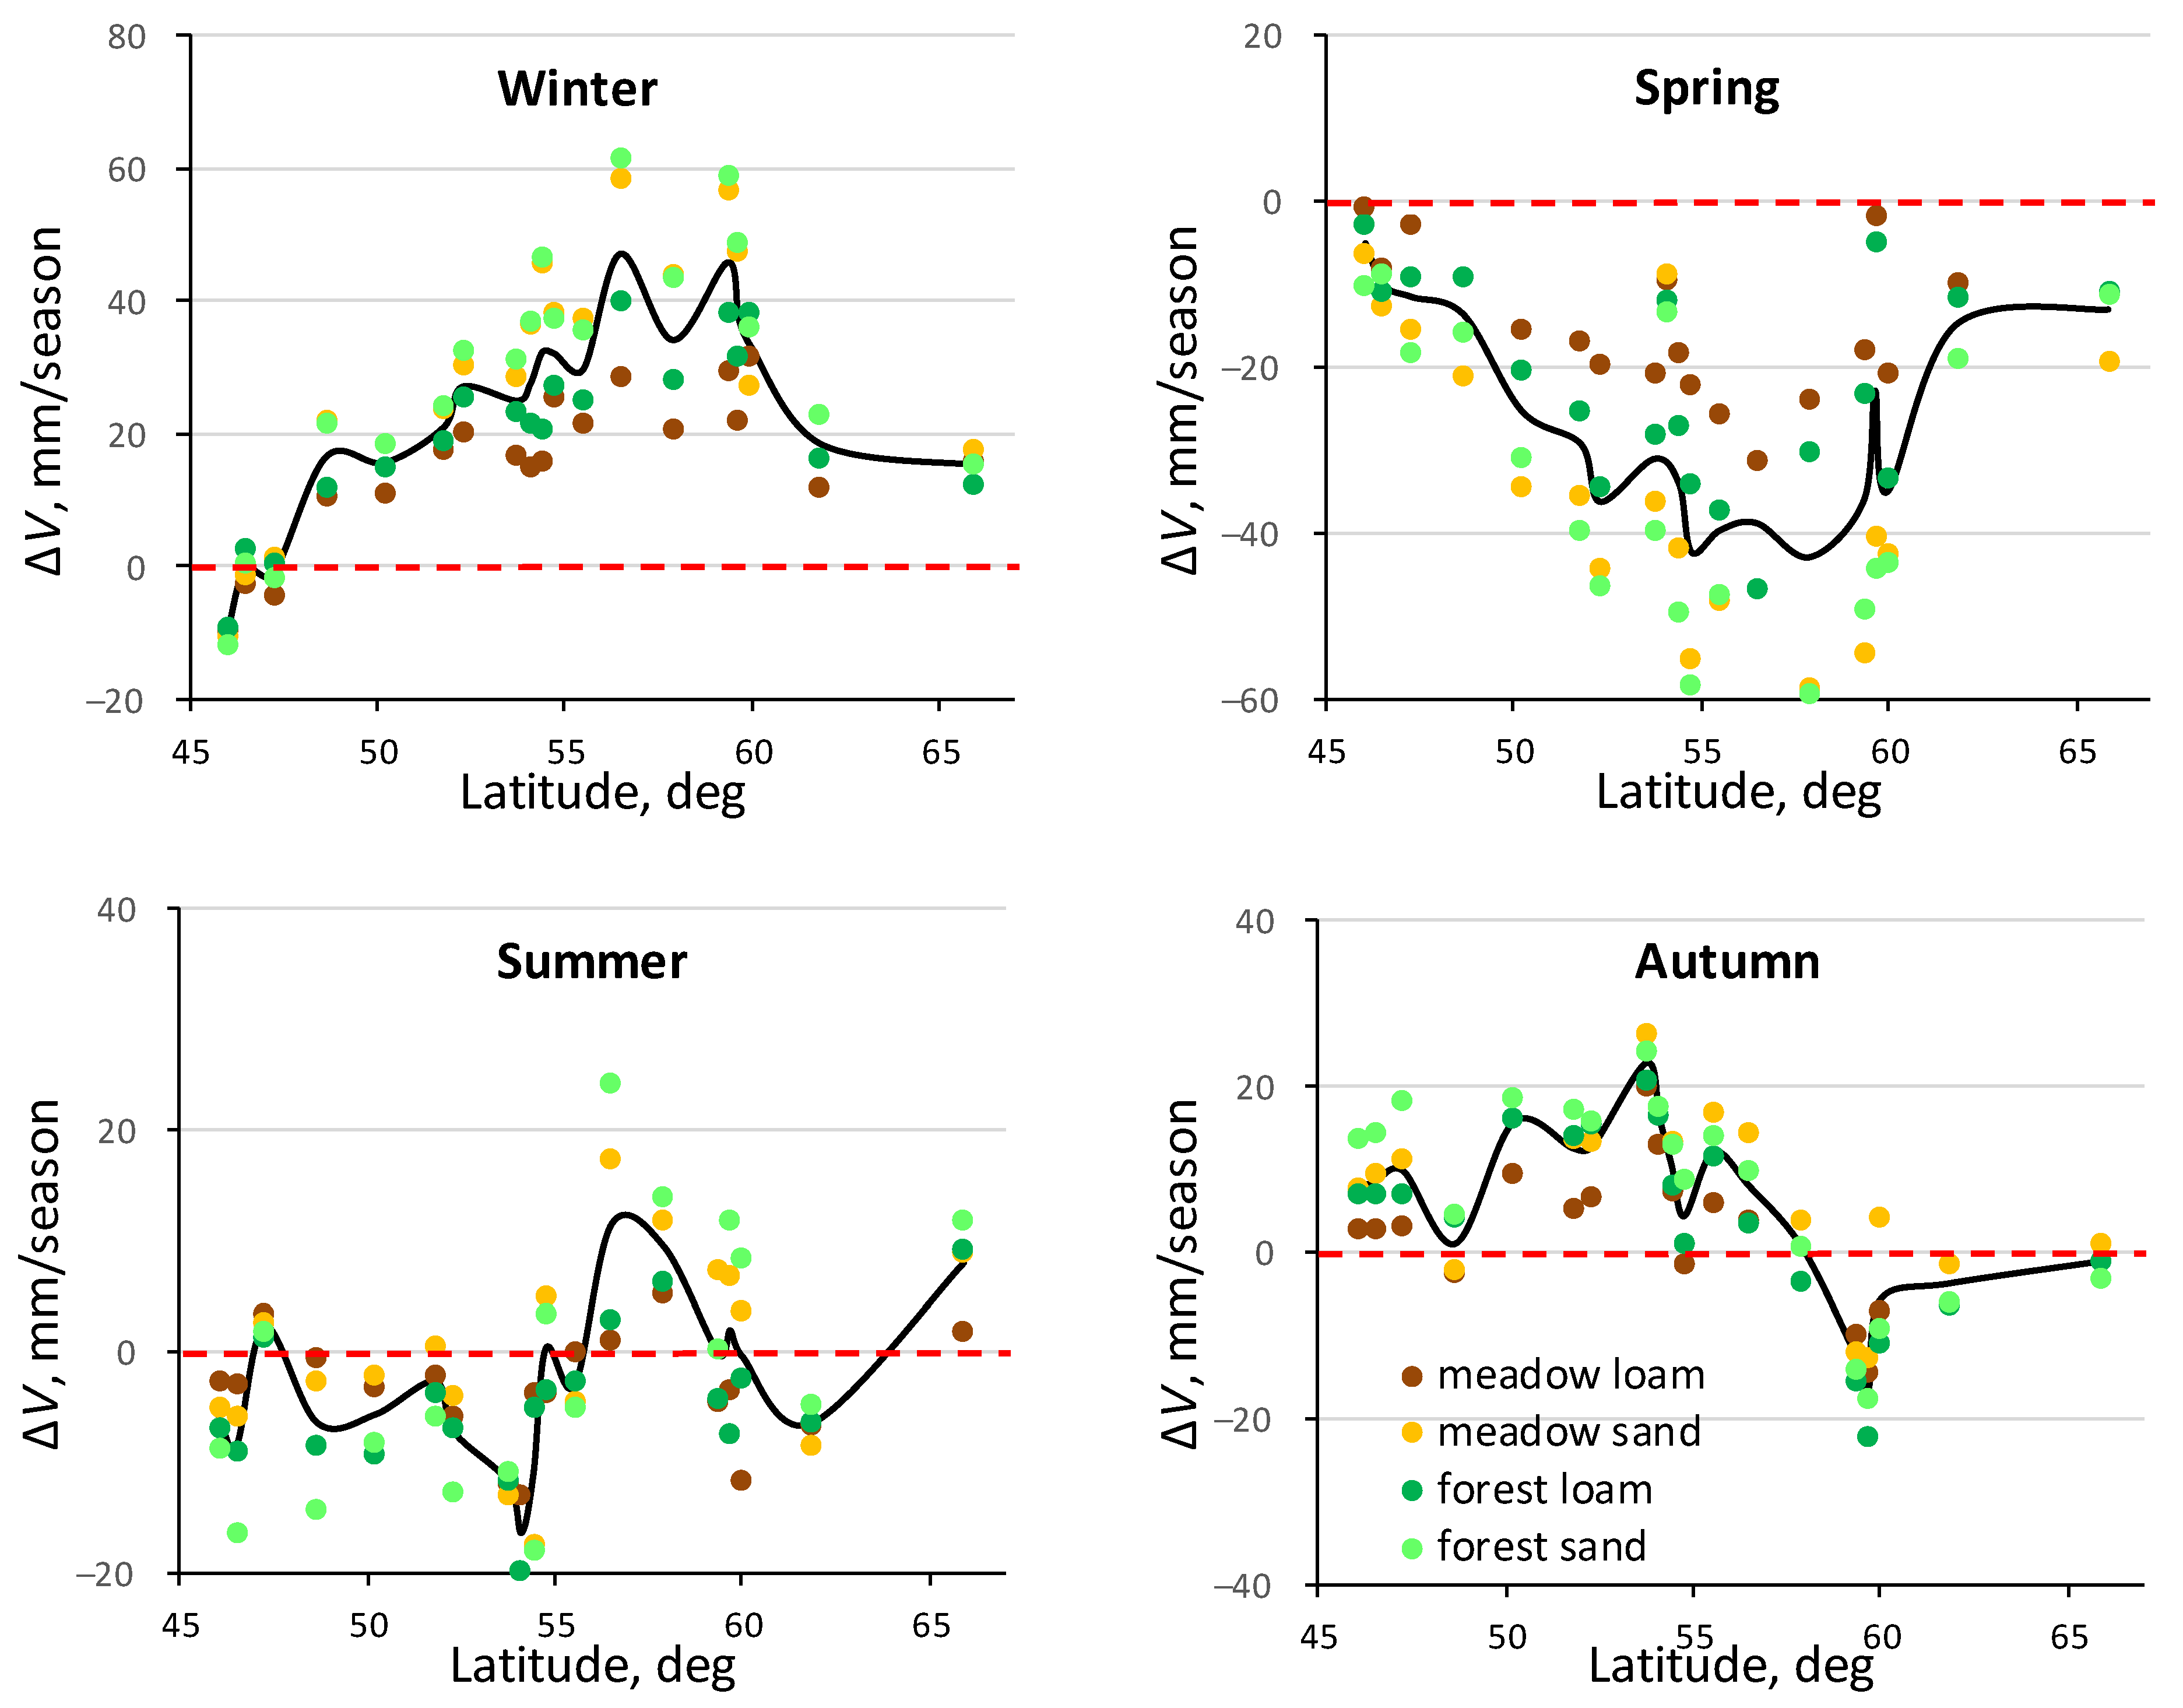
5.3. Groundwater Recharge and Soil Water Storage

Modern changes in the annual groundwater recharge ΔW according to the simulation results differ significantly in latitude. In the south of the ER with strongly water limited conditions (Figure 3b), the groundwater recharge remained almost unchanged (Figure 11a). This is consistent with the results [1,2] showing that in energy limited regions groundwater recharge is not sensitive to climate change. Groundwater recharge increased in the center and north of the ER by 20–60 mm/year with a maximum in the central part of the region (Figure 11a), where energy-limited conditions are replaced by water-limited conditions (Figure 3b). These differences in ΔW correlate well with changes in the aridity index Δ(P/ET0), as shown in Figure 11b. The modeled increase in the annual groundwater recharge in the center and north of the ER in the modern period corresponds to the observed increase in low-water river runoff in winter and summer [32].
An increase in groundwater recharge occurred in all landscapes with maximum absolute values of ΔW on sandy soils (Figure 11). However, on loamy soils, the maximum relative increase in groundwater recharge reaches 50–70%, and more than on sandy soils, where the relative values of ΔW do not exceed 30–40%, compared to the historical period.
Seasonal ΔW variability is also higher on sandy soils due to their higher permeability and maximum groundwater recharge increasing occurs in spring and summer (Figure 12a). The reason for this is the fact that in the cold period there is a significant increase in moisture infiltration into the soil during frequent thaws associated with an increase in air temperature. This volume of melt water reaches the groundwater level faster on more permeable sandy soils, expressed as a peak of ΔW in spring and summer, and on loamy soil recharge increasing is more stable in a year due to slower unsaturated flow to groundwater level. An increase in annual groundwater recharge due to enlarged moisture infiltration in the cold period is supported by the good correlation between simulated ΔW and observed decrease in soil freezing depth (Figure 12b). This is in good agreement with the results of studies in the Volga River basin, which showed that the average depth of soil freezing throughout the basin has decreased by 37% since 1978, which led to an increase in infiltration [34].
The increase in the average annual groundwater recharge due to winter moisture infiltration is maximum in the central part of ER and corresponds to the increase in winter soil moisture storage, which is also maximum in the center of the region (Figure 13).
The simulation results also show that the observed increase in winter air temperature and precipitation during the modern period leads to significant changes in seasonal soil water storage ΔV, and soils have become wetter in winter and drier in spring in most of the region (Figure 13). At the same time, the average annual changes in soil water storage ΔV in the modern period do not exceed ±10 mm/year and do not have latitudinal dependence.
Simulation results also show that differences in soil type have a stronger effect on changes in groundwater recharge (Figure 12a) and soil water storage (Figure 13) than differences in vegetation.

6. Summary and Conclusions

The impact of climate change on processes in critical zone and groundwater in humid conditions is ambiguous [1]. Thus the main goal of the presented studies is to analyze the effect of observed climate changes on the groundwater recharge formation over the European part of Russia, where natural climate conditions are humid and subhumid. Analysis of long-term meteorological data as well as water budget and groundwater recharge simulation were used for this purpose.
Analysis of modern climatic changes in ER, based on a comparison of long-term average annual and seasonal data for the modern (1989–2018) and historical (1965–1988) periods, shows a predominant increase in average annual precipitation and air temperature and decrease in the surface wind speed. Also, an increase in air temperature is more significant in winter, and a decrease in wind speed is almost the same at all seasons.
The results of the water budget and groundwater recharge simulation, based on long-term meteorological data and the same soil and landscape parameters for the whole simulation period were compared in average annual and seasonal values for modern and historical periods to access their climatic changes. This comparison did not show that the observed climatic changes lead to an explicit latitude-dependent pattern of changes in groundwater recharge. These changes are more complex and depend on the set of the observed local variability of meteorological time series and the conditions for the formation of the water balance in the critical zone. The results of the simulation show that despite a significant increase in air temperature groundwater recharge in the southern regions did not change, but even increased in the central and northern regions of ER. There are several main reasons for this phenomenon.
Firstly, in the modern period, there has been no significant increase in evapotranspiration, since the increase in air temperature is significantly compensated by a decrease in wind speed. Thus, a change in the surface wind speed is an important factor affecting the transformation of the water balance, and it should be taken into account when predicting climatic changes in groundwater recharge.
Second, the observed increase in air temperature and precipitation in winter is the main reason for the increase in groundwater recharge, as these climate changes lead to an increase in water infiltration into the soil during the cold season when there is no evapotranspiration. Moreover, an increase in meltwater infiltration during thaws is associated with an observed decrease in the freezing depth, and such changes in the water balance in the cold period lead to significant degradation of the spring flood.
Simulation of modern changes in groundwater recharge shows an increase in recharge in all typical landscapes of the central and northern regions of the ER, with a maximum increase in recharge on sandy soils. The increase in the average annual groundwater recharge in the modern period, obtained from the simulation results, is confirmed by the observed increase in the minimum river runoff in the ER [32,35].
Thus the above model analysis of the modern climatic changes impact on the processes of water balance transformation in the critical zone make it possible to predict them more confidently in the future.

Author Contributions

Conceptualization and methodology S.O.G., S.P.P.; data curation E.A.D.; simulation E.A.D., S.O.G. and S.P.P.; writing S.O.G. and S.P.P. All authors have read and agreed to the published version of the manuscript.

Funding

This research was supported by Russian Science Foundation No. 16-17-10187.

Institutional Review Board Statement

Not applicable.

Informed Consent Statement

Not applicable.

Conflicts of Interest

The authors declare no conflict of interest.

References

  1. Amanambu, A.C.; Obarein, O.A.; Mossa, J.; Li, L.; Ayeni, S.S.; Balogun, O.; Oyebamiji, A.; Ochege, F.U. Groundwater System and Climate Change: Present Status and Future Considerations. J. Hydrol. 2020, 589, 125163. [Google Scholar] [CrossRef]
  2. Cuthbert, M.O.; Gleeson, T.; Moosdorf, N.; Befus, K.M.; Schneider, A.; Hartmann, J.; Lehner, B. Global patterns and dynamics of climate–groundwater interactions. Nature Clim. Change 2019, 9, 137–141. [Google Scholar] [CrossRef]
  3. Fan, Y.; Clark, M.; Lawrence, D.M.; Swenson, S.; Band, L.E.; Brantley, S.L.; Brooks, P.D.; Dietrich, W.E.; Flores, A.; Grant, G.; et al. Hillslope hydrology in global change research and Earth system modeling. Water Resour. Res. 2019, 55, 1737–1772. [Google Scholar] [CrossRef] [Green Version]
  4. Blöschl, G.; Hall, J.; Viglione, A.; Perdigão, R.A.P.; Parajka, J.; Merz, B.; Lun, D.; Arheimer, B.; Aronica, G.T.; Bilibashi, A.; et al. Changing climate both increases and decreases European river floods. Nature 2019, 573, 108–111. [Google Scholar] [CrossRef]
  5. Cuthbert, M.O.; Taylor, R.G.; Favreau, G.; Todd, M.C.; Shamsudduha, M.; Villholth, K.G.; Macdonald, A.M.; Scanlon, B.R.; Kotchoni, D.O.V.; Vouillamoz, J.-M.; et al. Observed controls on resilience of groundwater to climate variability in sub-Saharan Africa. Nature 2019, 572, 230–234. [Google Scholar] [CrossRef]
  6. Condon, L.E.; Atchley, A.L.; Maxwell, R.M. Evapotranspiration depletes groundwater under warming over the contiguous United States. Nat. Commun. 2020, 11, 873. [Google Scholar] [CrossRef] [PubMed]
  7. Fan, Y.; Li, H.; Miguez-Macho, G. Global Patterns of Groundwater Table Depth. Science 2013, 339, 940–943. [Google Scholar] [CrossRef] [Green Version]
  8. Blöschl, G.; Bierkens, M.F.; Chambel, A.; Cudennec, C.; Destouni, G.; Fiori, A.; Kirchner, J.W.; McDonnell, J.J.; Savenije, H.H.; Sivapalan, M.; et al. Twenty-three Unsolved Problems in Hydrology (UPH)–A community perspective. Hydrol. Sci. J. 2019, 64, 1141–1158. [Google Scholar] [CrossRef] [Green Version]
  9. Loucks, D. Solving the 23 Major Mysteries in Hydrology: Who Cares and Why? EGU General Assembly 2020, EGU2020, 364. [Google Scholar] [CrossRef]
  10. Barthel, R.; Banzhaf, S. Groundwater and Surface Water Interaction at the Regional-scale–A Review with Focus on Regional Integrated Models. Water Resour. Manag. 2016, 30, 1–32. [Google Scholar] [CrossRef] [Green Version]
  11. Leterme, B.; Mallants, D.; Jacques, D. Sensitivity of groundwater recharge using climatic analogues and HYDRUS-1d. Hydrol. Earth Syst. Sci. 2012, 16, 2485–2497. [Google Scholar] [CrossRef] [Green Version]
  12. Šimůnek, J.; Šejna, M.; Saito, H.; Sakai, M.; Van Genuchten, M.T. The HYDRUS-1D Software Package for Simulating the One-Dimensional Movement of Water, Heat, and Multiple Solutes in Variably-Saturated Media. Ver. 4.08; Prepr. Depart. of Environ. Sci. University of California: Riverside, CA, USA, 2009; 296p. [Google Scholar]
  13. Šimůnek, J. Estimating groundwater recharge using HYDRUS-1D. Geol. Inst. Bulg. Acad. Sci. 2015, 29, 25–36. [Google Scholar]
  14. Adane, Z.; Zlotnik, V.A.; Rossman, N.R.; Wang, T.; Nasta, P. Sensitivity of Potential Groundwater Recharge to Projected Climate Change Scenarios: A Site-Specific Study in the Nebraska Sand Hills, USA. Water 2019, 11, 950. [Google Scholar] [CrossRef] [Green Version]
  15. De Silva, C.S. Simulation of Potential Groundwater Recharge from the Jaffna Peninsula of Sri Lanka using HYDRUS-1D Model. OUSL Journal 2015, 7, 43–65. [Google Scholar] [CrossRef] [Green Version]
  16. Lu, X.; Jin, M.; van Genuchten, M.T.; Wang, B. Ground water recharge at five representative sites in the Hebei Plain of china: Case study. Ground Water 2011, 49, 286–294. [Google Scholar] [CrossRef]
  17. Wang, T.; Zlotnik, V.A.; Šimůnek, J.; Schaap, M.G. Using pedotransfer functions in vadose zone models for estimating groundwater recharge in semiarid regions. Water Resour. Res. 2009, 45, 12. [Google Scholar] [CrossRef] [Green Version]
  18. Pozdniakov, S.P.; Vasilevsky, P.Y.; Grinevskiy, S.O.; Lekhov, V.A.; Sizov, N.E.; Wang, P. Variability in spatial-temporal recharge under the observed and projected climate: A site-specific simulation in the black soil region of Russia. J. Hydrol. 2020, 590, 125247. [Google Scholar] [CrossRef]
  19. Middleton, N.J.; Thomas, D.S.G. World Atlas of Desertification, 2nd ed.; Arnold: London, UK, 1997. [Google Scholar] [CrossRef]
  20. Grinevskii, S.O.; Pozdnyakov, S.P. Principles of Regional Estimation of Infiltration Groundwater Recharge Based on Geohydrological Models. Water Resour. 2010, 37, 638–652. [Google Scholar] [CrossRef]
  21. Grinevskiy, S.O.; Pozdniakov, S.P. The use of HYDRUS-1D for groundwater recharge estimation in boreal environments. In HYDRUS Software Applications to Subsurface Flow and Contaminant Transport Problems; Šimůnek, J., van Genuchten, M.T., Kodešová, R., Eds.; Dept. of Soil Science and Geology, Czech University of Life Sciences: Prague, Czech Republic, 2013; pp. 107–118. [Google Scholar]
  22. Grinevskiy, S.O.; Pozdnyakov, S.P. A retrospective analysis of the impact of climate change on groundwater resources. Mosc. Univ. Geol. Bull. 2017, 72, 200–208. [Google Scholar] [CrossRef]
  23. Allen, R.G.; Pereira, L.S.; Raes, D.; Smith, M. Crop evapotranspiration: Guidelines for computing crop water requirements. FAO Irrig. Drain. Pap. 1998, 56, 300. Available online: http://www.fao.org/docrep/X0490E/X0490E00.htm (accessed on 5 February 2021).
  24. Pozdniakov, S.P.; Vasilevskiy, P.Y.; Grinevsky, S.O. Estimation of groundwater recharge by flow in vadose zone simulation at the watershed with different landscapes and soil profiles. Geol. Inst. Bulg. Acad. Sci. 2015, 29, 47–58. [Google Scholar]
  25. Pozdniakov, S.P.; Grinevsky, S.O.; Dedulina, E.A. Impact of climate change on long-term dynamics of seasonal freezing in Moscow Region: Retrospective analysis and uncertainties in forecasting for the second half of the 21st century. Earth`s Cryosphere 2019, 4, 22–30. [Google Scholar]
  26. Grinevskii, S.O. Structure and Parameter Schematization of the Vadose Zone for Groundwater Recharge Modeling. Mosc. Univ. Geol. Bull. 2010, 65, 387–398. [Google Scholar] [CrossRef]
  27. Grinevskii, S.O. Modeling root water uptake when calculating unsaturated flow in the vadose zone and groundwater recharge. Mosc. Univ. Geol. Bull. 2011, 66, 189–201. [Google Scholar] [CrossRef]
  28. Zhang, L.; Hickel, K.; Dawes, W.R.; Chiew, F.H.S.; Western, A.W.; Briggs, P.R. A rational function approach for estimating mean annual evapotranspiration. Water Resour. Res. 2004, 40, 02502. [Google Scholar] [CrossRef]
  29. Yang, D.; Sun, F.; Liu, Z.; Cong, Z.; Ni, G.; Lei, Z. Analyzing spatial and temporal variability of annual water-energy balance in nonhumid regions of China using the Budyko hypothesis. Water Resour. Res 2007, 43, W04426. [Google Scholar] [CrossRef]
  30. Li, D.; Pan, M.; Cong, Z.; Zhang, L.; Wood, E. Vegetation control on water and energy balance within the Budyko framework. Water Resour. Res. 2013, 49, 969–976. [Google Scholar] [CrossRef]
  31. Roshydromet Project. The second Assessment Report of RosHydromet on Climate Changes and Their Consequences on the Territory of the Russian Federation. General Summary; Roshydromet: Moscow, Russia, 2014; 58p. [Google Scholar]
  32. Kireeva, M.; Frolova, N.; Rets, E.; Samsonov, T.; Entin, A.; Kharlamov, M.; Telegina, E.; Povalishnikova, E. Evaluating climate and water regime transformation in the European part of Russia using observation and reanalysis data for the 1945–2015 period. Int. J. River Basin Manag. 2020, 18, 491–502. [Google Scholar] [CrossRef]
  33. Kubiak-Wójcicka, K. Variability of Air Temperature, Precipitation and Outflows in the Vistula Basin (Poland). Resources 2020, 9, 103. [Google Scholar] [CrossRef]
  34. Kalyuzhny, I.L.; Lavrov, S.A. Effect of climate changes on the soil freezing depth in the Volga River basin. Ice Snow 2016, 56, 207–220. [Google Scholar] [CrossRef]
  35. Li, L.; Ni, J.; Chang, F.; Yue, Y.; Frolova, N.; Magritsky, D.; Borthwick, A.G.L.; Ciais, P.; Wang, Y.; Zheng, C.; et al. Global trends in water and sediment fluxes of the world’s large rivers. Sci. Bull. 2020, 65, 62–69. [Google Scholar] [CrossRef] [Green Version]
Figure 1. The study area of the European part of Russia and the location of the weather stations used.
Water 13 00428 g001
Figure 2. Observed (lines) and simulated (dashed lines) average intra-annual (a,b) and average winter (c,d) values of freezing depth (black lines) and snow height (blue lines) for Voronezh (a,c) and Belogorka (b,d) weather stations.
Water 13 00428 g002aWater 13 00428 g002b
Figure 3. Annual evaporation ratio (ET/P) as a function of the annual ET0/P index for four simulated landscapes (a) and dependence of ET0/P for different weather stations on latitude (b). The dashed lines on graph (a) are Fu’s equation with the fitted n values using the least-square method. Dotted lines are boundaries for water and energy limited conditions.
Water 13 00428 g003
Figure 4. Average annual meteorological characteristics by weather stations at different latitudes for 1965 to 2018. Upper row: air temperature and wind speed with their linear trends; lower row: air humidity and precipitation. Red dushed lines - average precipitation for 1965–1988 and 1989–2018.
Water 13 00428 g004
Figure 5. Latitudinal changes in long-term average annual (a) and seasonal (b)-(e)precipitation ΔP in modern period and their linear trends (blue dashed lines).
Water 13 00428 g005
Figure 6. Latitudinal changes in long-term average annual (a) and seasonal (b)-(e) air temperature ΔT in the modern period and their linear trends (blue dashed lines).
Water 13 00428 g006
Figure 7. Latitudinal changes in long-term average annual wind speed ΔU (a) and air humidity ΔH (b) in modern period.
Water 13 00428 g007
Figure 8. Latitudinal modern changes in mean annual surface runoff ΔS (a) and its dependence on changes in winter precipitation ΔPw (b).
Water 13 00428 g008
Figure 9. The comparison of simulated intra-annual surface runoff for historical and modern periods in the north (a) and in the south (b) of ER and correlation between simulated spring surface runoff decreasing on loamy soil and observed increasing of winter air temperature (c) and decreasing of soil freezing depth (d).
Water 13 00428 g009
Figure 10. Modeled latitudinal modern changes in mean annual evapotranspiration ΔET (a) and correlations: between changes in mean annual transpiration ΔTR and precipitation ΔP (b); between changes in average annual evaporation ΔE and wind speed ΔU (c).
Water 13 00428 g010aWater 13 00428 g010b
Figure 11. Modeled latitudinal changes in mean annual groundwater recharge ΔW in modern period (a) and the relationship between ΔW and changes in aridity index Δ(P/ET0) (b) with general tendencies for different landscapes (dashed lines).
Water 13 00428 g011
Figure 12. Average seasonal changes in groundwater recharge ΔW for the central and northern parts of ER (a) and the correlation between simulated changes in annual groundwater recharge ΔW and the observed average decrease in the freezing depth (b).
Water 13 00428 g012
Figure 13. Latitudinal changes in average seasonal soil water storage ΔV in modern period. Black line - average for different landscapes.
Water 13 00428 g013
Table 1. Average long-term values of annual, warm season (April-October) and cold season (November-March) precipitation and air temperature for the period 1965-2018 according to ER weather stations.
Weather StationNothern Latitude, Deg.Eastern Longitude, Deg.Precipitation, mmAir Temperature, °C
AnnualWarm SeasonCold SeasonAnnualWarm SeasonCold Season
Mezen65.944.2532.3371.7160.6−0.56.7−10.5
Reboli63.830.8613.1414.7198.41.68.6−8.3
Petrozavodsk61.834.3594.4412.6181.82.99.7−6.6
S.Petersburg60.030.3649.1432.2216.95.512.0−3.6
Tihvin59.733.5746.7478.3268.33.910.8−5.9
Belogorka59.430.1677.5454.9222.64.210.8−5.0
Vologda59.339.9559.0389.6169.42.910.5−7.6
Bologoe57.934.1659.9448.7211.24.311.2−5.4
Kostroma57.840.8616.6423.0193.63.911.6−6.8
Toropec56.531.6737.5473.9263.64.911.7−4.6
Mozhaisk55.536.0655.5454.9200.74.811.9−5.3
Smolensk54.832.1714.6473.6241.05.112.0−4.4
S-Demensk54.434.0687.6469.7217.85.012.0−4.8
Suhinichi54.135.4616.7425.5191.25.112.3−5.0
Zhizdra53.834.7609.9428.4181.55.112.2−4.9
Poniri52.336.3628.5417.1211.45.613.0−4.9
Voronezh51.839.2577.6371.6206.06.614.4−4.2
Valuiki50.238.1571.3357.5213.87.414.9−3.1
Volgograd48.744.4398.1220.5177.68.617.2−3.4
Rostov-Don47.339.8606.4343.7262.89.917.3−0.5
Gigant46.541.3513.8318.8194.910.217.6−0.3
Akhtarsk46.038.1580.6341.0239.611.418.41.6
Publisher’s Note: MDPI stays neutral with regard to jurisdictional claims in published maps and institutional affiliations.

