Article

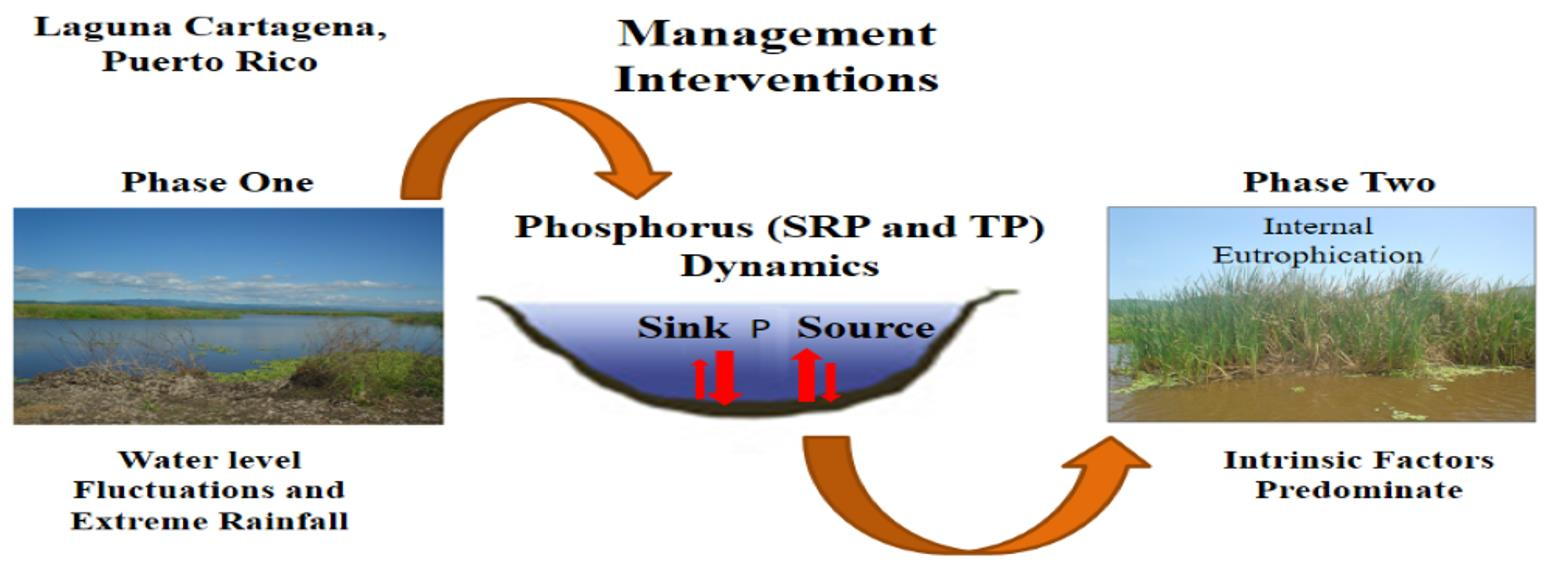
A Case Study of the Effects of Management Interventions on the Phosphorus Dynamics at a Coastal, Eutrophic, Caribbean lagoon (Laguna Cartagena, Puerto Rico)

by
Yashira Marie Sánchez Colón
1,* and
Fred Charles Schaffner
2
1
Public Health Program, Ponce Health Sciences University, Ponce, PR 00732-7004, USA
2
School of Science and Technology, Universidad Ana G Méndez, Gurabo, PR 00778-3030, USA
*
Author to whom correspondence should be addressed.
Water 2021, 13(4), 449; https://doi.org/10.3390/w13040449
Submission received: 31 December 2020 / Revised: 3 February 2021 / Accepted: 4 February 2021 / Published: 9 February 2021
(This article belongs to the Special Issue Dynamics and Biogeochemical Flows in Estuarine and Nearshore Systems)

Abstract

:
Laguna Cartagena is a coastal, eutrophic, shallow lake and freshwater wetland in southwestern Puerto Rico, managed by the US Fish and Wildlife Service. This ecosystem has been impacted by phosphorus loading from adjacent agricultural areas since the 1950s, causing eutrophication and deteriorating wildlife habitats. Herein, we describe phosphorus input and export during September 2010–September 2011 (Phase One) and October 2013–November 2014 (Phase Two). These two phases bracket a period of intensified management interventions including excavation and removal of sediment and vegetation, draining, and burning during the summers of 2012 and 2013. Results indicate that Laguna Cartagena retains a phosphorus (sink) in its sediments, and exhibits nutrient-releasing events (source, mainly total phosphorus) to the lagoon water column, which are associated with rainfall and rising water levels. External factors including water level fluctuations and rainfall influenced phosphorus export during Phase One, but after management interventions (Phase Two), internal processes influenced sink/source dynamics, releasing elevated phosphorus concentrations to the water column. When exposed sediments were re-flooded, phosphorus concentrations to the water column increased, releasing elevated P concentrations downstream to an estuarine wetlands area and the Caribbean Sea. Herein we offer management recommendations to optimize wildlife habitat without elevating phosphorus concentrations.

Graphical Abstract

1. Introduction

Phosphorus (P) and nitrogen (N) eutrophication of aquatic ecosystems and a general deterioration in water quality have increased with human population growth and agricultural development within many watersheds, and sources of watershed nutrient loading include both domestic and agricultural effluents [1,2,3,4,5]. Such activities create negative impacts in natural wetland habitats by changing vegetation, soil biogeochemistry, habitat fragmentation, release of greenhouse gases, and severe vegetative overgrowth, resulting in deteriorating wildlife habitats. At our Laguna Cartagena study site, for example, severe cattail overgrowth and extensive peat formation due to phosphorus loading have reduced open surface conditions to as little as 10% (90% cover) and produced poorly oxygenated water [1,6,7].
Excessive nutrient enrichment of P and N to aquatic ecosystems also leads to: excessive growth of nuisance algae, cyanobacteria, and other aquatic plants; high decomposition rates of the accumulated plant biomass that increase the production of organic matter and affect the biogeochemical cycles of N and P; water acidification; decreases in dissolved oxygen (anoxia and hypoxia); and decreases in biological diversity [1,8,9].
Phosphorus in aquatic ecosystems occurs in both particulate and soluble compartments, in inorganic phosphate (PO4−3) or bound in organic molecules [3,10]. Soluble reactive phosphorus (SRP, o- PO4−3, inorganic phosphorus) is the most readily bioavailable P fraction [10]. Total phosphorus (TP) concentrations of 30–100 µg/L (ppb) and ˃100 µg/L (ppb), are considered eutrophic and hypereutrophic, respectively, for freshwater lakes [11,12,13]. Frequently, the reduction of P loading into aquatic ecosystems has not resulted in reduced eutrophication [7,14]. This is because P tends to accumulate in soil via lithification [15] and subsequent disturbance and mobilization of P-enriched sediments (and possibly organic matter) can cause internal P eutrophication to the water column [16,17,18].
P Sink dynamics are defined as occurring when inflow (inlet) P concentrations exceed outflow (outlet) concentrations (the lagoon absorbs P and sends water of lower P concentration downstream to other aquatic environments) [3]. Conversely, P Source dynamics (or internal P loading) occur when outlet P concentrations exceed inlet concentrations (the lagoon releases P and sends water of higher P concentration downstream to other aquatic environments) [3]. Internal P loading can occur from microbial-driven P release and release of inorganic P from mineral binding sites, especially under anaerobic conditions. These processes are controlled by oxygen concentrations, redox conditions, pH, temperature, and other drivers influenced by changes in hydrology [19].
Hydrological and hydroperiod regimes can directly modify and change the physicochemical environment, stimulate microbial activity, and influence nutrient retention (sink) and release (source) processes. These regimes also transform wetland soils (sediments and organic matter) [3,20] and cause eutrophication [7] as sediments and organic matter provide internal sources of nutrients to the water column. At Laguna Cartagena this has resulted in a proliferation of emergent vegetation and, most notably, extensive floating peat mats (islands) and associated floating vegetation. This emergent vegetation covers ca. 90% of the lagoon’s surface, blocking light penetration and thus prohibiting the growth and photosynthesis of submerged plants, microalgae, and cyanobacteria. The resulting low dissolved oxygen concentrations negatively impact fisheries, and the overgrowth of floating peat islands reduce the available habitat for waterfowl that require open surface conditions.
Symptoms of severe problems of eutrophication in this shallow lagoon (Laguna Cartagena) have been observed since the 1950s, when most of the land area that drains to the lagoon was used for sugar cane cultivation. This formally oligotrophic freshwater wetland was thus affected by very intense phosphorus loading from inorganic agricultural fertilizer until the end of sugar cane cultivation and subsidized fertilizer use in the late 1990s. A legacy of this fertilizer use may remain in the soils but has not been adequately quantified.
In April 2012, the US Fish and Wildlife Service (USFWS) began a conservation plan that emphasized wildlife diversity, focusing especially on providing habitat for water birds and fish, and thus requiring an open water area of about 70% (30% cover), and well-oxygenated water [21]. Hoping to achieve these goals, the agency engaged in management interventions that included the lowering of water levels, completely draining the lagoon by the end of May 2012, then excavating and dredging bottom sediments and removing floating peat mats. The lagoon was subsequently refilled in September of 2012. The lagoon was drained again during July 2013. On 21 August 2013, a prescribed burn of cattail-dominated habitat was conducted at Laguna Cartagena as part of a federal government training exercise for federal firefighters and other emergency personnel (as stated in the press). Refilling of the lagoon commenced immediately after the burn, yet within four months (December 2013) the emergent cattails and floating peat mats had returned to their previous extents.
Given the above events, and knowing beforehand the planning of the management interventions, the primary objective of this study was to assess the influence of these management interventions on phosphorus concentrations of the water released by the lagoon downstream in relation to the water that enters the lagoon, by characterizing soluble reactive phosphorus (SRP) and total phosphorus (TP) concentrations entering and leaving the lagoon prior to interventions (Phase One, September 2010 to September 2011) and after interventions (Phase Two, October 2013 to November 2014). A second objective was to determine the role of precipitations and water level changes on P sink and source dynamics.

2. Materials and Methods

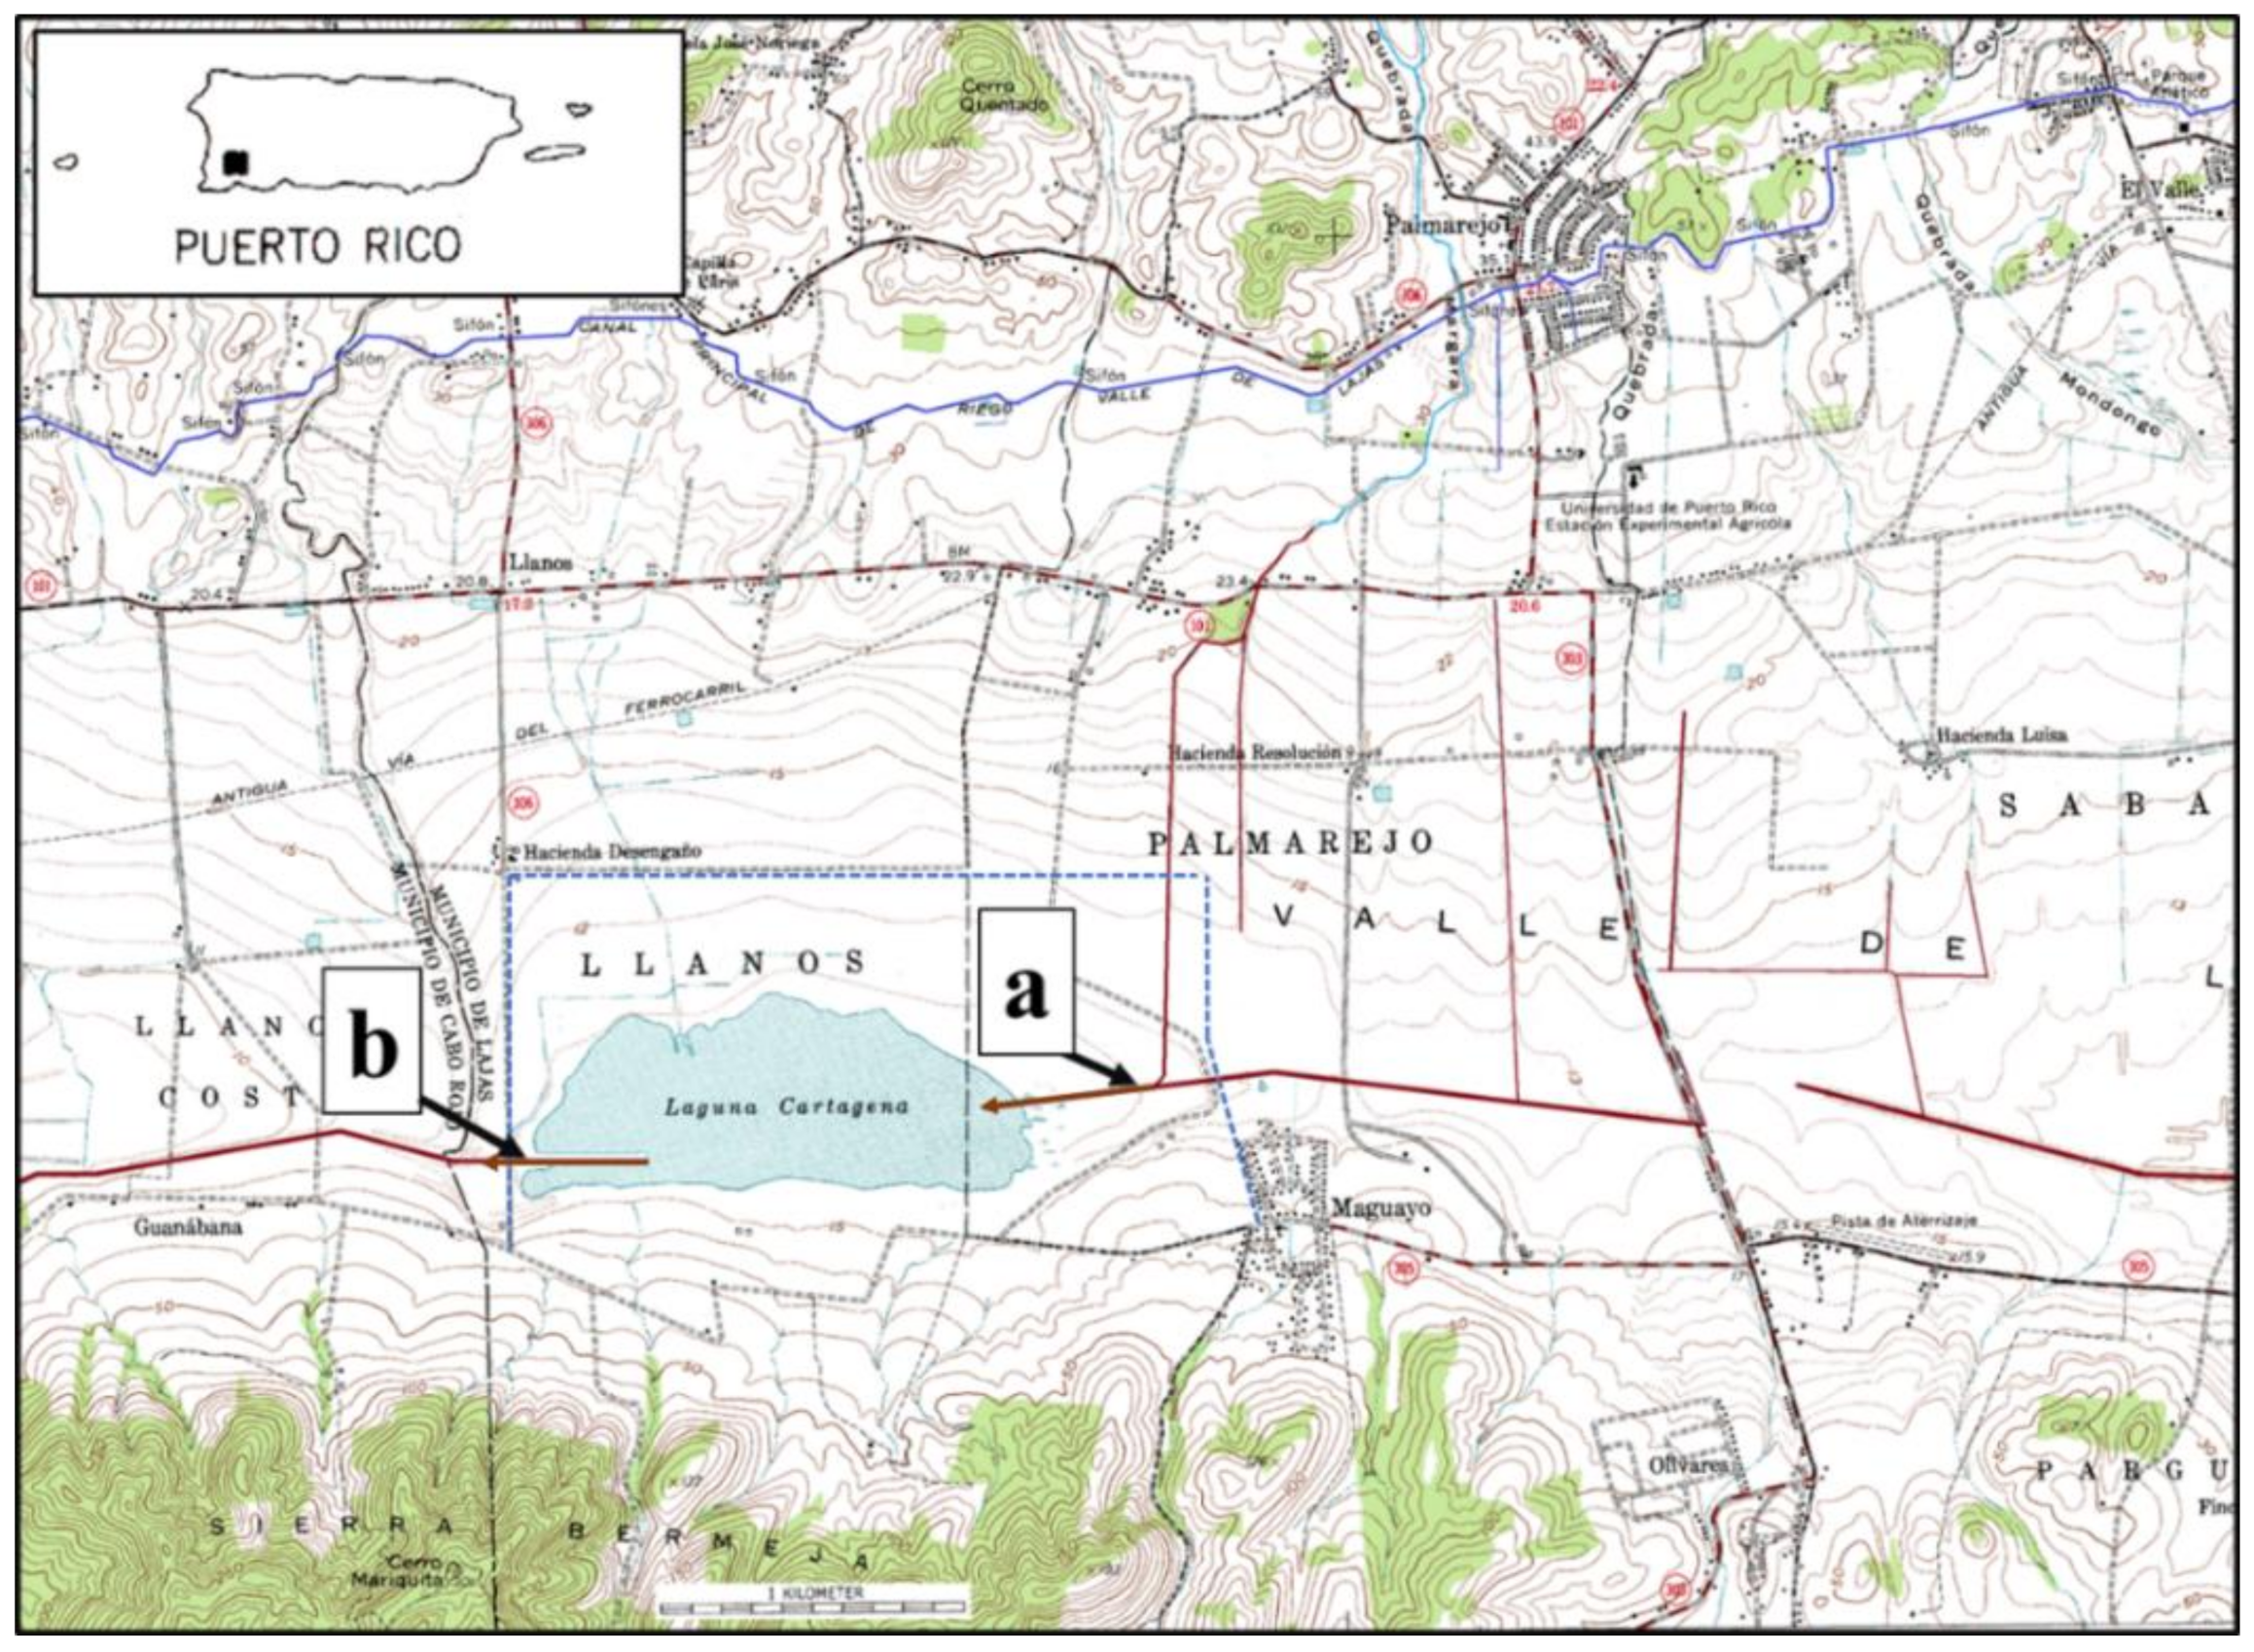
2.1. Description of the Study Site

Laguna Cartagena is situated in the Lajas Valley, Municipality of Lajas, in southwestern Puerto Rico (Figure 1). During the 1950s, the Principal Drainage Canal of the Lajas Valley Irrigation System, adjacent to the town of Magüayo, was connected through Laguna Cartagena. This canal carried agricultural effluent to the lagoon, and the water passed through the lagoon and subsequently flowed westward from the lagoon via an outlet canal (Figure 1) to the wetlands and estuarine areas of the Boquerón State Bird Refuge, and then to the Caribbean Sea.
In 1989, Laguna Cartagena was acquired by US Fish and Wildlife Service (USFWS) and established as Laguna Cartagena National Wildlife Refuge (LCNWR). LCNWR originally was an open-water system and was noted for its abundance of wildlife, including large numbers of individual nesting and migratory waterbirds. Laguna Cartagena National Wildlife Refuge includes this tropical freshwater wetland and associated shallow lake, with a water depth of 0 to 2 m, corresponding to the 9 m and 11 m surface contours on the USGS (US Geological Survey) topographical maps (Figure 1). The depth varies depending on precipitation and most importantly, on water level management by USFWS via the installation and removal of flashboards in the outlet weir.
During 1995 to 1998, SRP (orthophosphate or inorganic P, SRP) concentrations in the lagoon waters ranged to above 1000 and 1500 µg/L [22]. Severe overgrowth of cattails (Typha domingensis) and extensive floating peat mats and floating vegetation still occupy large portions of the available volume and surface area of the lagoon, altering the habitat and thus degrading the abundance and diversity of resident and migratory aquatic birds and fish. The lagoon exhibits other aquatic macrophytes including floating forms such as Pistia stratiotes (water lettuce) and Eichhornia crassipies (water hyacinth) that together with the floating peat mats cover 80–90% of the lagoon surface.

2.2. Sampling and Processing

Water samples were collected in triplicate at mid-column depths from the lagoon’s single inlet and the lagoon’s single outlet to characterize average total P and SRP during the annual cycle. All of the nutrients that enter the lagoon from this half of the drainage basin come together and enter through the combined inlet canal. Sampling occurred at two-week intervals from September 2010 through September 2011 (Phase One of this study) [23,24,25]), prior to management interventions and from October 2013 through November 2014 (Phase Two of this study) [24,25]), after management interventions.
All samples for P (SRP and TP) analyses were collected in glass bottles, preserved with H2SO4, and transported in ice to the Universidad del Turabo (now Ana G. Méndez University, Gurabo). The samples were stored at a low temperature and analyzed within an interval of 1 week and a half after being collected using persulfate digestion and ascorbic acid methods [26]. A Thermo Fisher Scientific, Genesys 20, with a wavelength range between 352 to 1100 nm was used to measure sample absorption at 880 nm.
Rainfall data were obtained weekly from a rain gauge located approximately 6 km north of the lagoon in the upper portion of the watershed, representative of regional rainfall. Daily rainfall data were recorded from August 2010 to September 2011 and September 2013 to November 2014. Stage (water level) data were collected at the adjustable crest weir at the lagoon. Stage was recorded weekly, and for each sampling day between July 2010 to October 2011 and July 2013 to November 2014 to document water level fluctuations. The bottom of the lagoon (0% fill) lies at the 9 m contour above sea level while full stage (100% fill) occurs at the 11 m contour (USGS 7.5-min topographic map), for a potential maximum lagoon depth (100% fill and overflow) of 2 m. Water level is controlled by USFWS’s placement and removal of flashboards at the outlet control structure (a weir) and thus are largely independent of rainfall.
We also analyzed samples of consolidated bottom substrate and flocculence in the center of the lagoon and collected general water quality data such as dissolved oxygen (DO), pH, total dissolved solids (TDS), temperature, turbidity, and nitrogen.
Dissolved oxygen, pH, TDS, temperature, and turbidity were measured in the field for each sampling event. The instruments used for measurement of these parameters were the Hanna Instruments (HI 98186) for DO, AZ Instruments Corp, model 8685 for pH and temperature, an EC/TDS/°C Martini (EC 59) meter for TDS and a turbidity tube for turbidity. Nitrate ( NO 3 ), nitrite ( NO 2 ), and ammonia (NH3) were determined using a HACH DR900 colorimeter. Nitrate was measured using the cadmium reduction method 353.2, nitrite was measured with the USEPA diazotization method and ammonium using the salicylate method. The sediment and flocculence samples were collected in 9 April 2011 (Phase One) and 10 August 2014 (Phase Two). Samples were transported in bags and processed by the Central Analytical Laboratory of the University of Puerto Rico’s Agricultural Experimental Station.

2.3. Statistical Analyses

Mean SRP and TP values were calculated for each sample (triplicate sampling, n = 3 for each sample). Descriptive statistics are herein provided for both Phase One (2010–2011) and Phase Two (2013–2014). One-way ANOVA and paired t-tests (µ1 > µ2) were used to compare phosphorus concentrations between both phases (Phase One and Phase Two). A multiple regression model was used to determine the response of phosphorus (SRPOI and TPOI) to several predictors including water level fluctuations (water levels one week prior to water sampling) and rainfall (one or two weeks prior to water sampling) during both phases. To describe the differences between outlet and inlet P concentrations, SRPOI was defined as the subtraction of SRPOutlet − SRPInlet and TPOI was defined as the subtraction of TPOutlet − TPInlet.
This study was conducted under the authorization of Biosafety Committee (IBC) Protocol B03-017-13 of the Ana G Mendez University System Office of Compliance.

3. Results

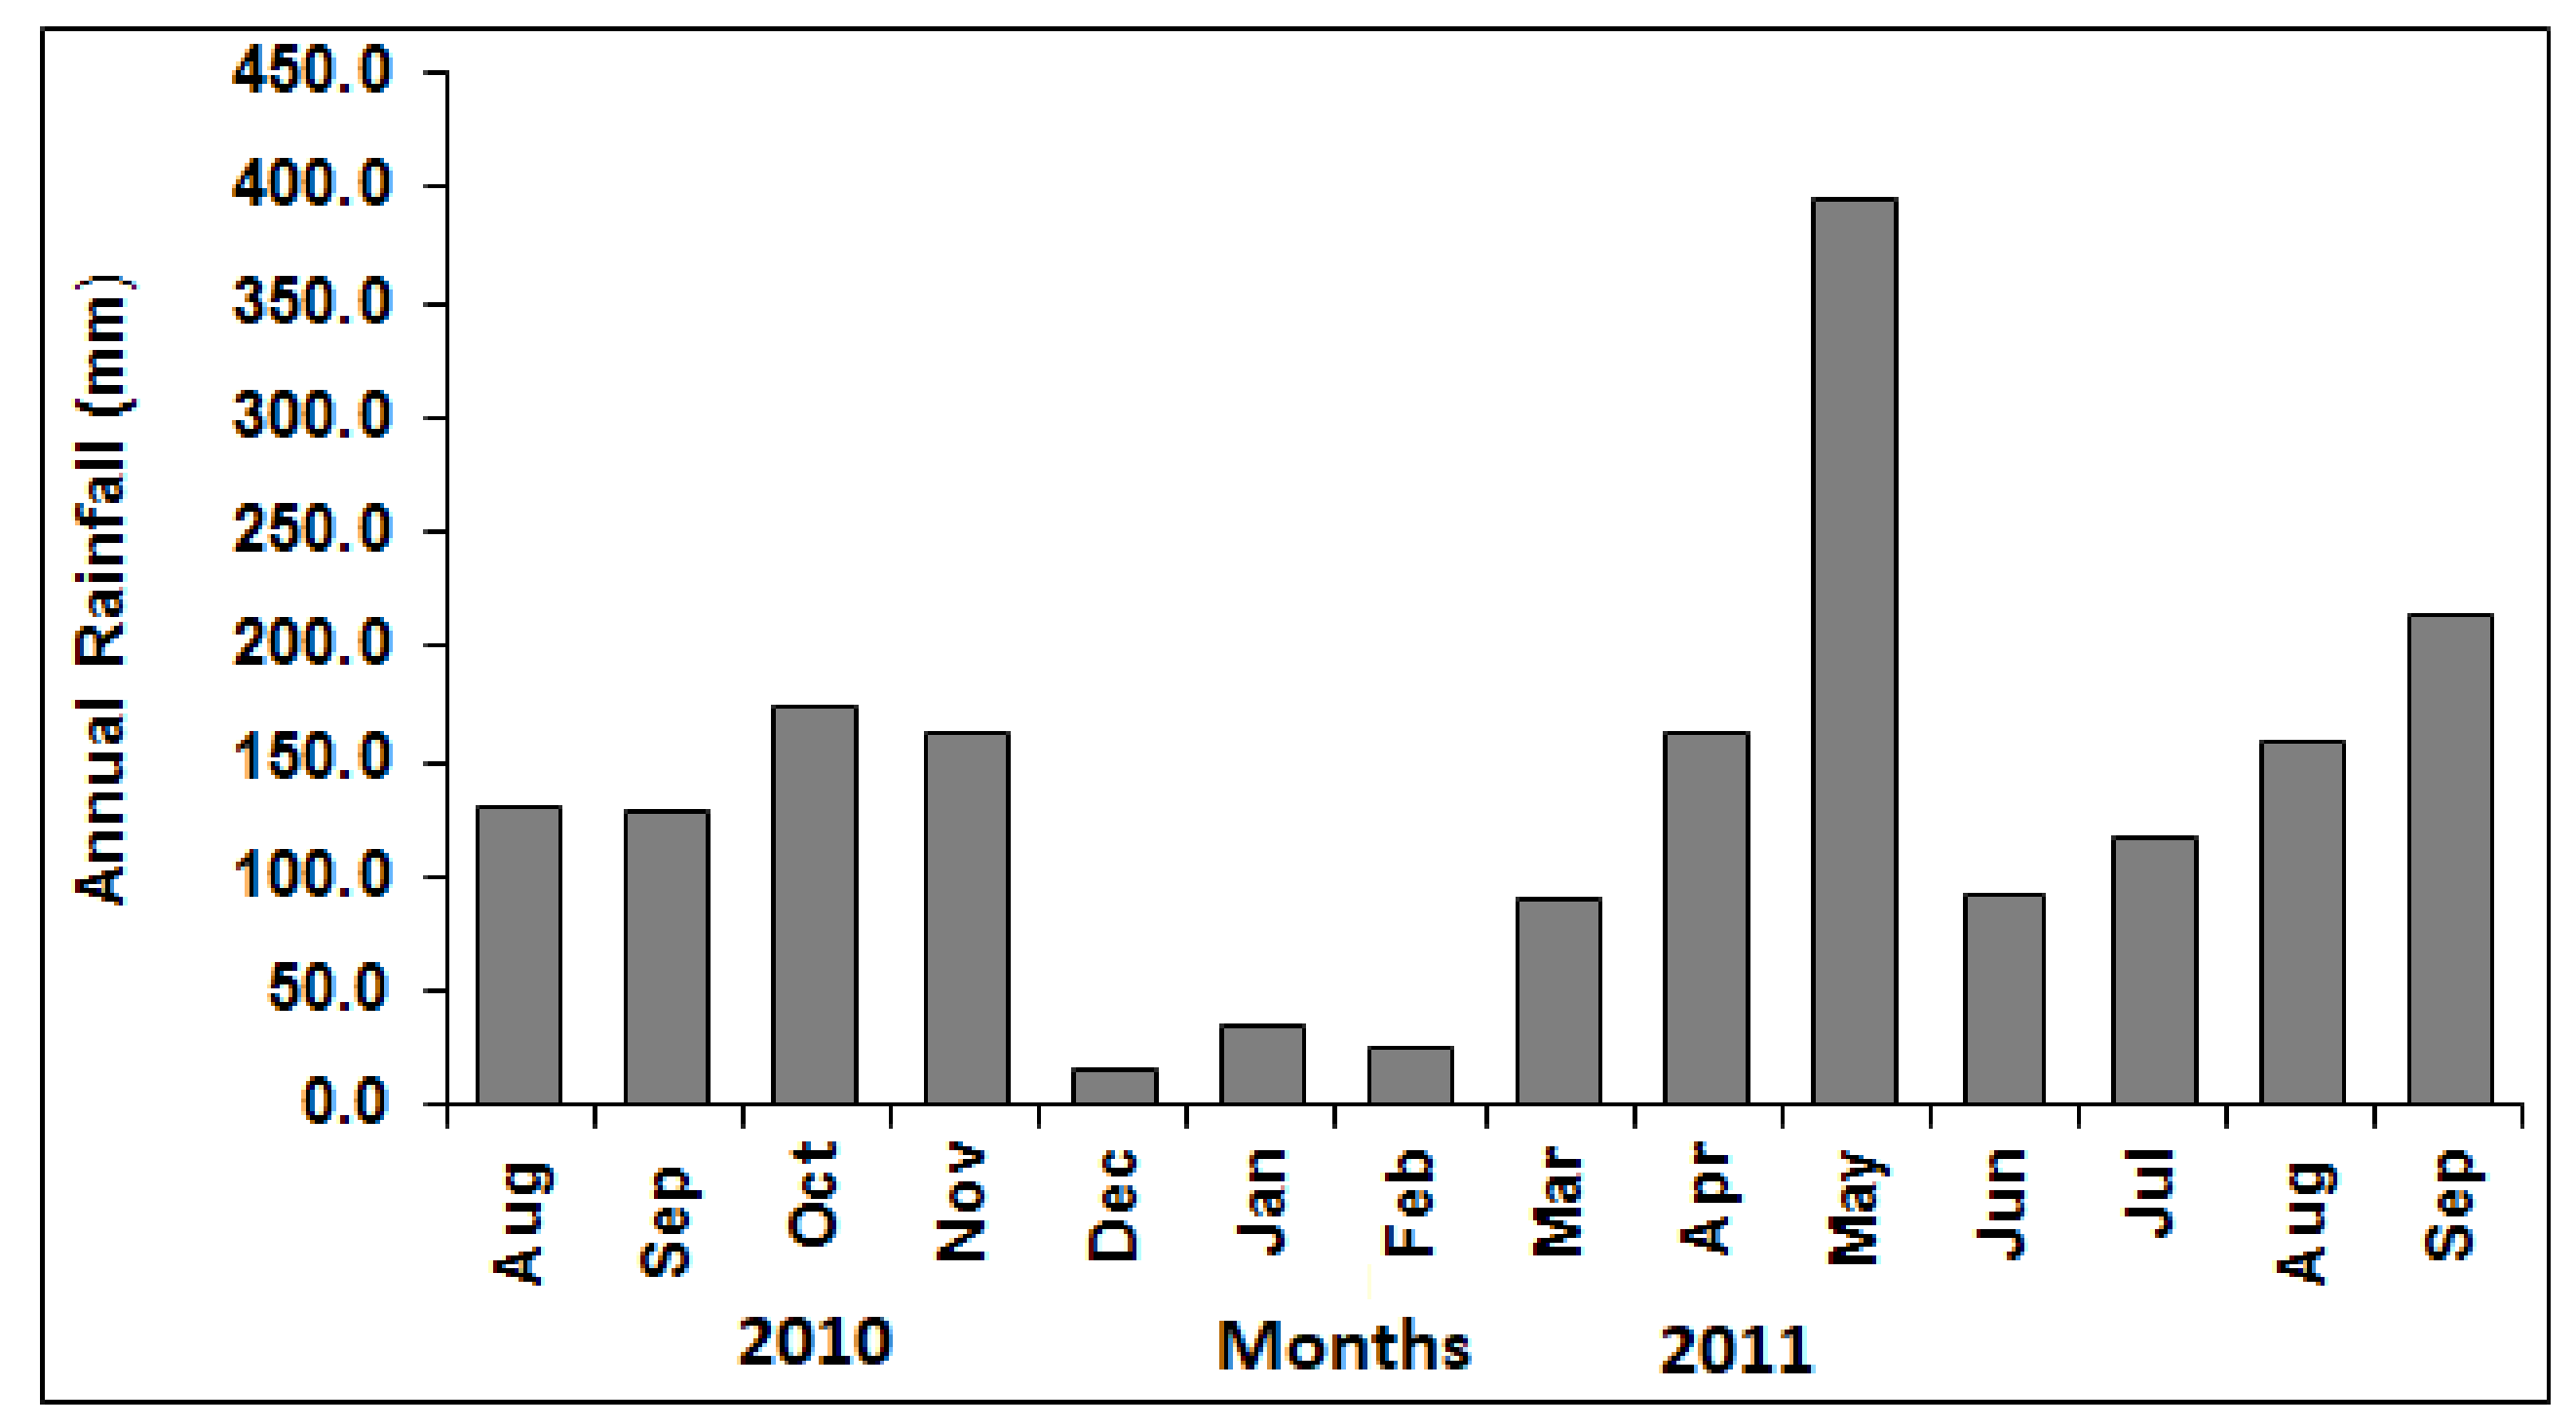
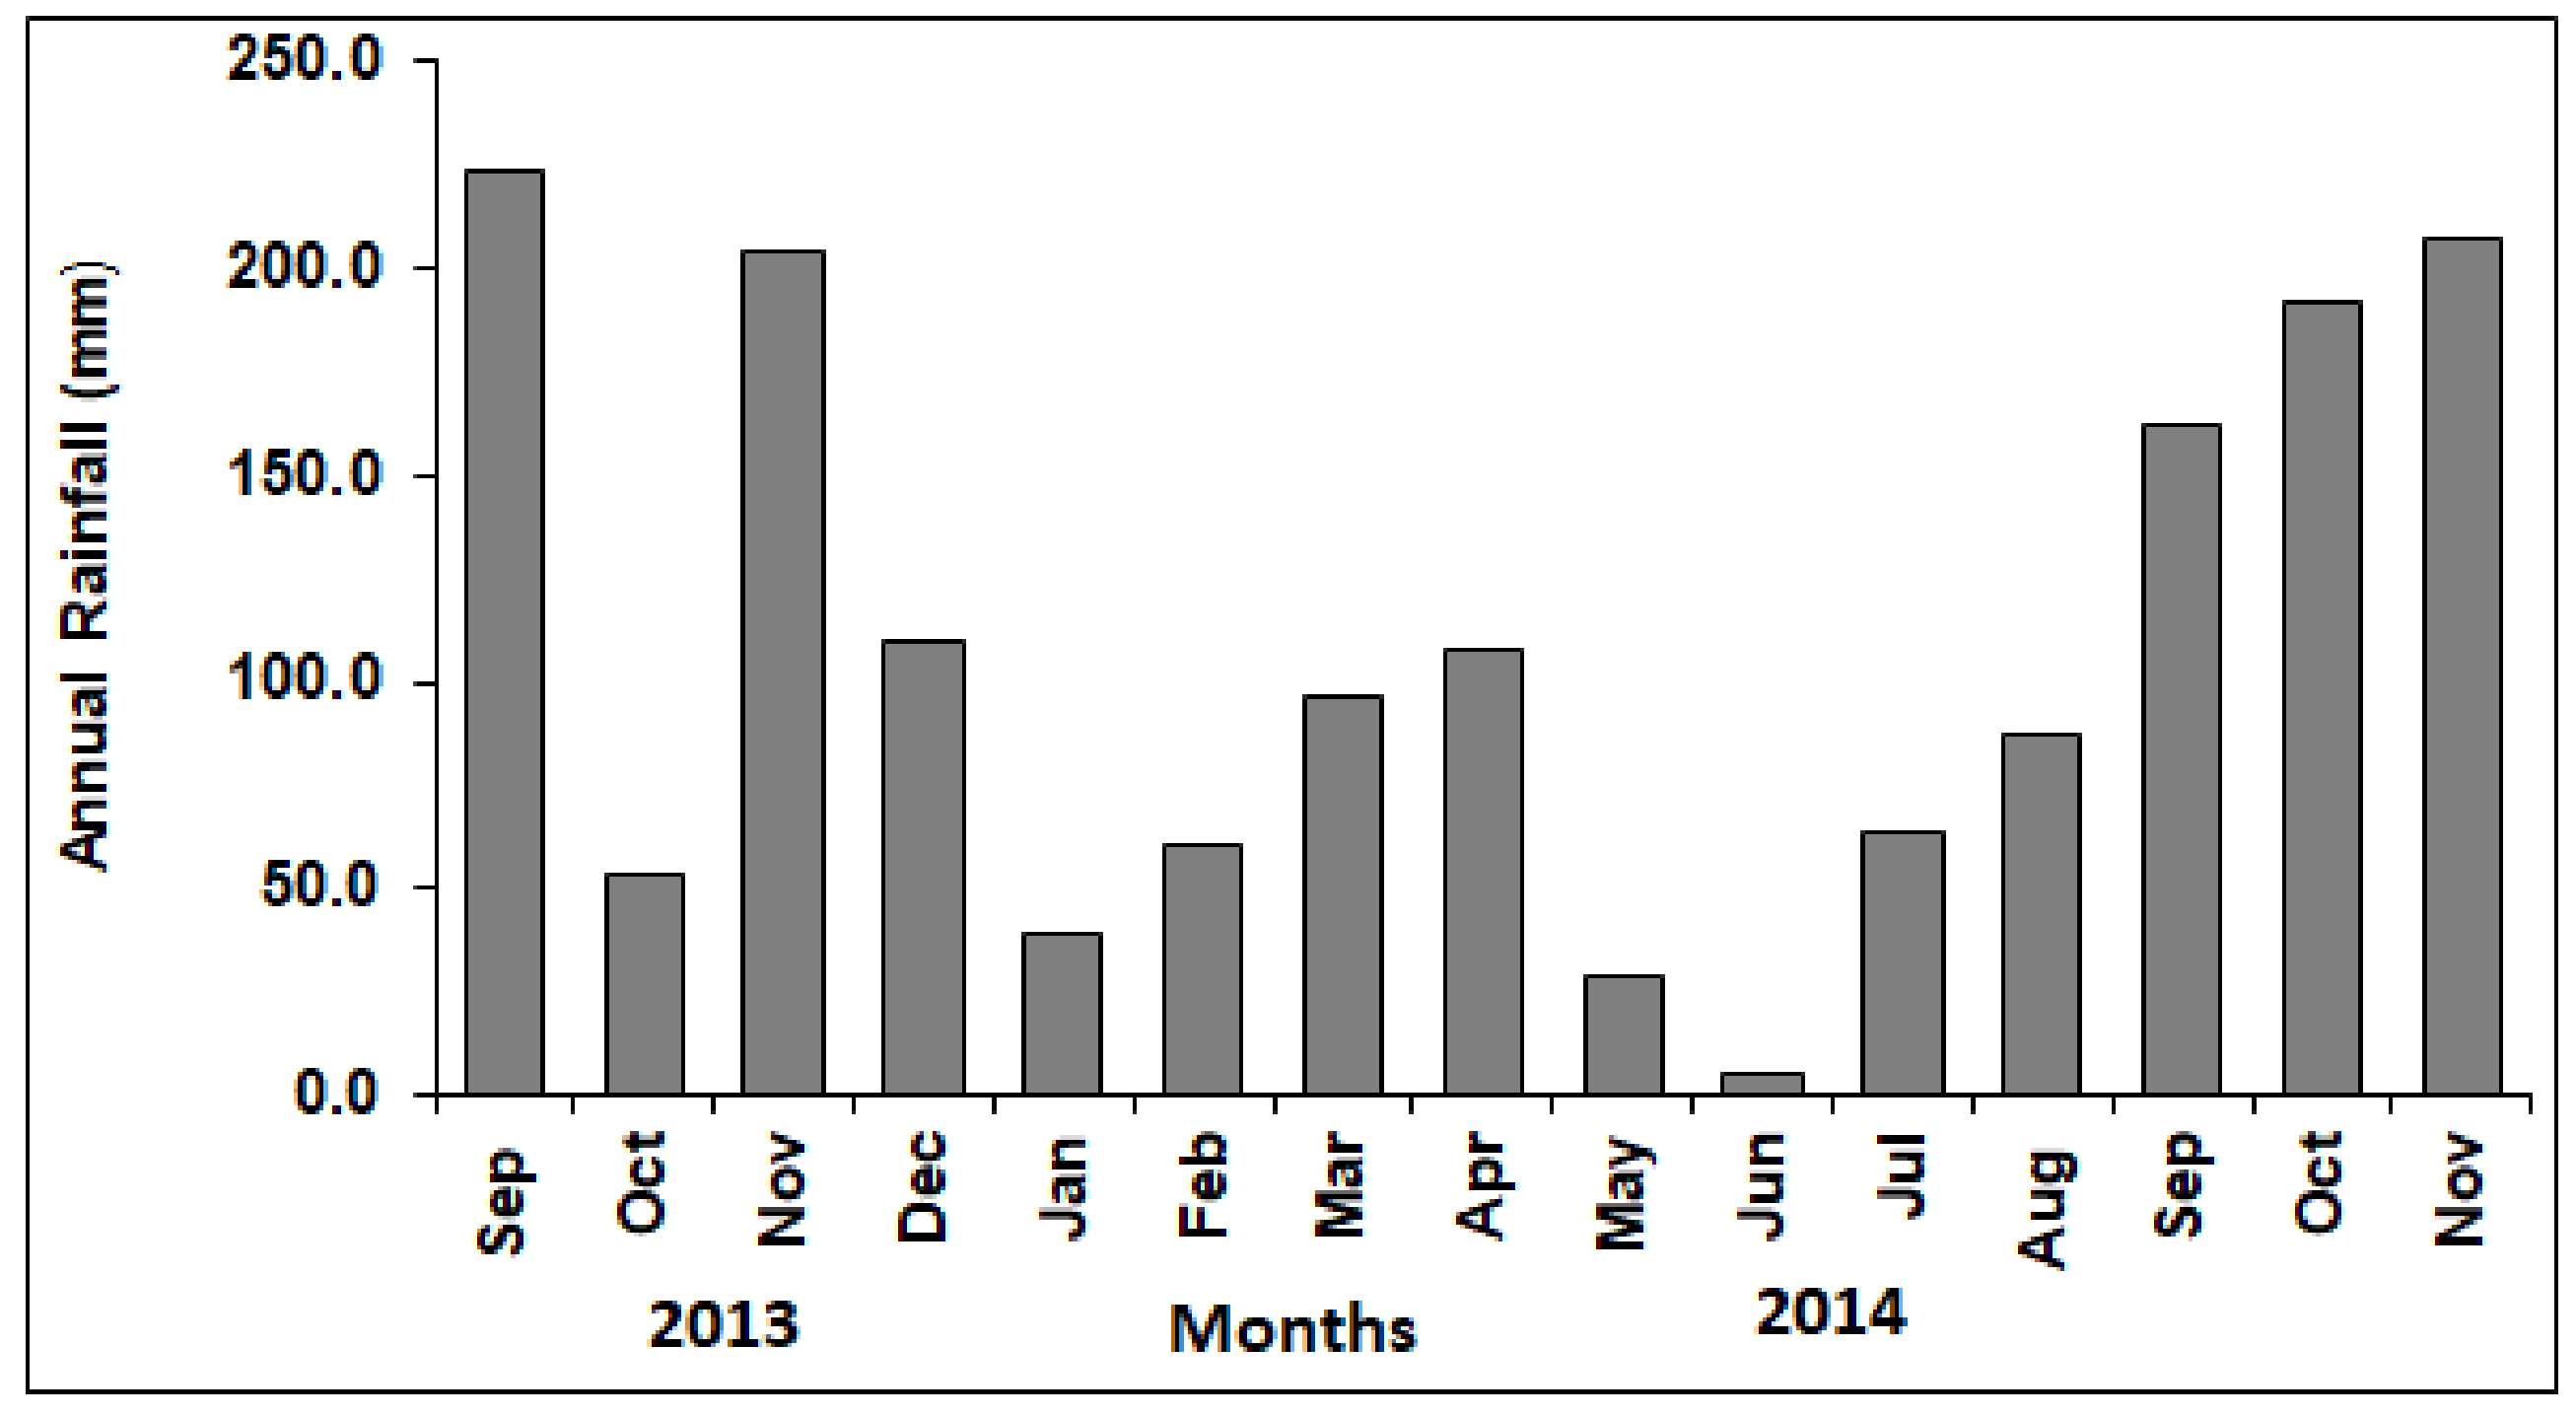
3.1. Rainfall Conditions

Monthly rainfall (mm) for the Laguna Cartagena drainage basin recorded from August 2010 to September 2011 (Figure 2) and September 2013 to November 2014 (Figure 3) indicated heavy rainfall during the months of August to November and April to May, and allowed identification of specific rainfall events that occurred one and two weeks prior to water sample collection.

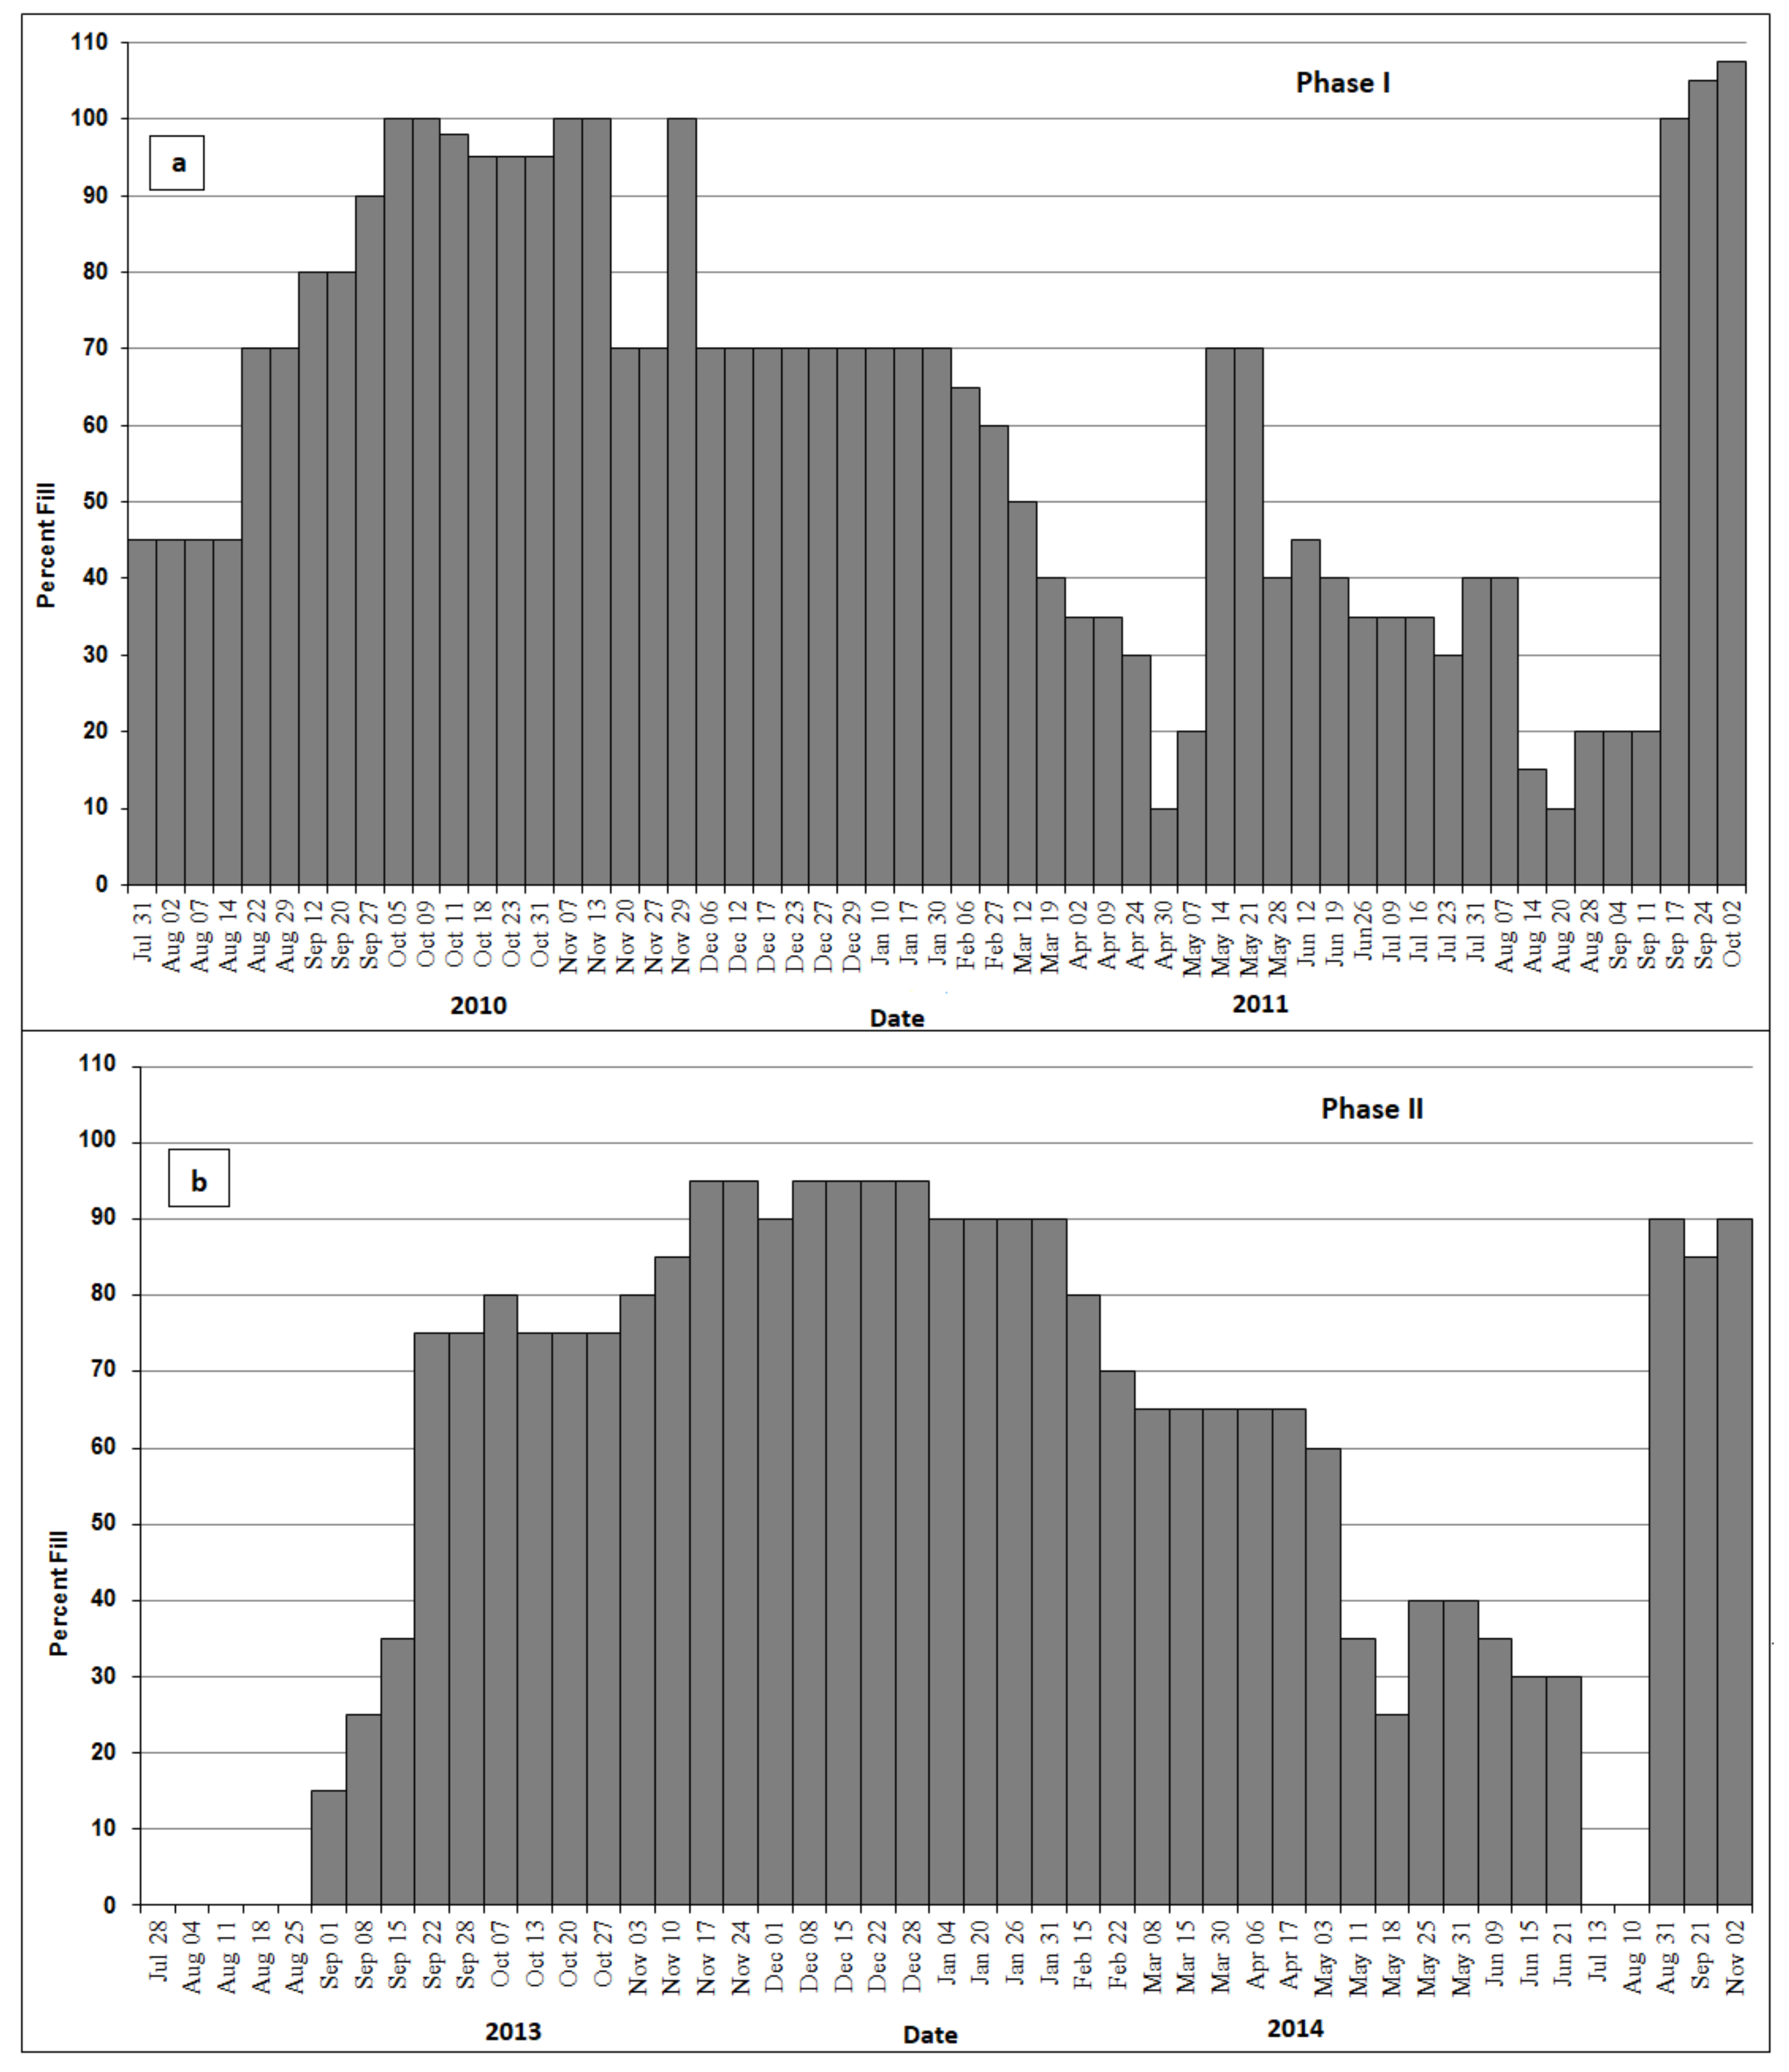
3.2. Stage Fluctuations

The maximum depth of 2 m (100% fill and overflow) at Laguna Cartagena was obtained during Phase One on the following dates: 5 October, 9 October, 7 November, 13 November, 29 November of 2010, 17 September, 24 September, and 2 October of 2011 (Figure 4). Stage was controlled by USFWS by adjustment of the outlet weir crest and differed dramatically between Phase One (Figure 4a) and Phase Two (Figure 4b) of this study, i.e., the agency removed all flashboards from the weir in order to bring the stage level to “0”. Such events included periods of complete draining during summers of 2013 and 2014 (Phase Two) but no complete draining during the summers of 2010 and 2011 (Phase One).

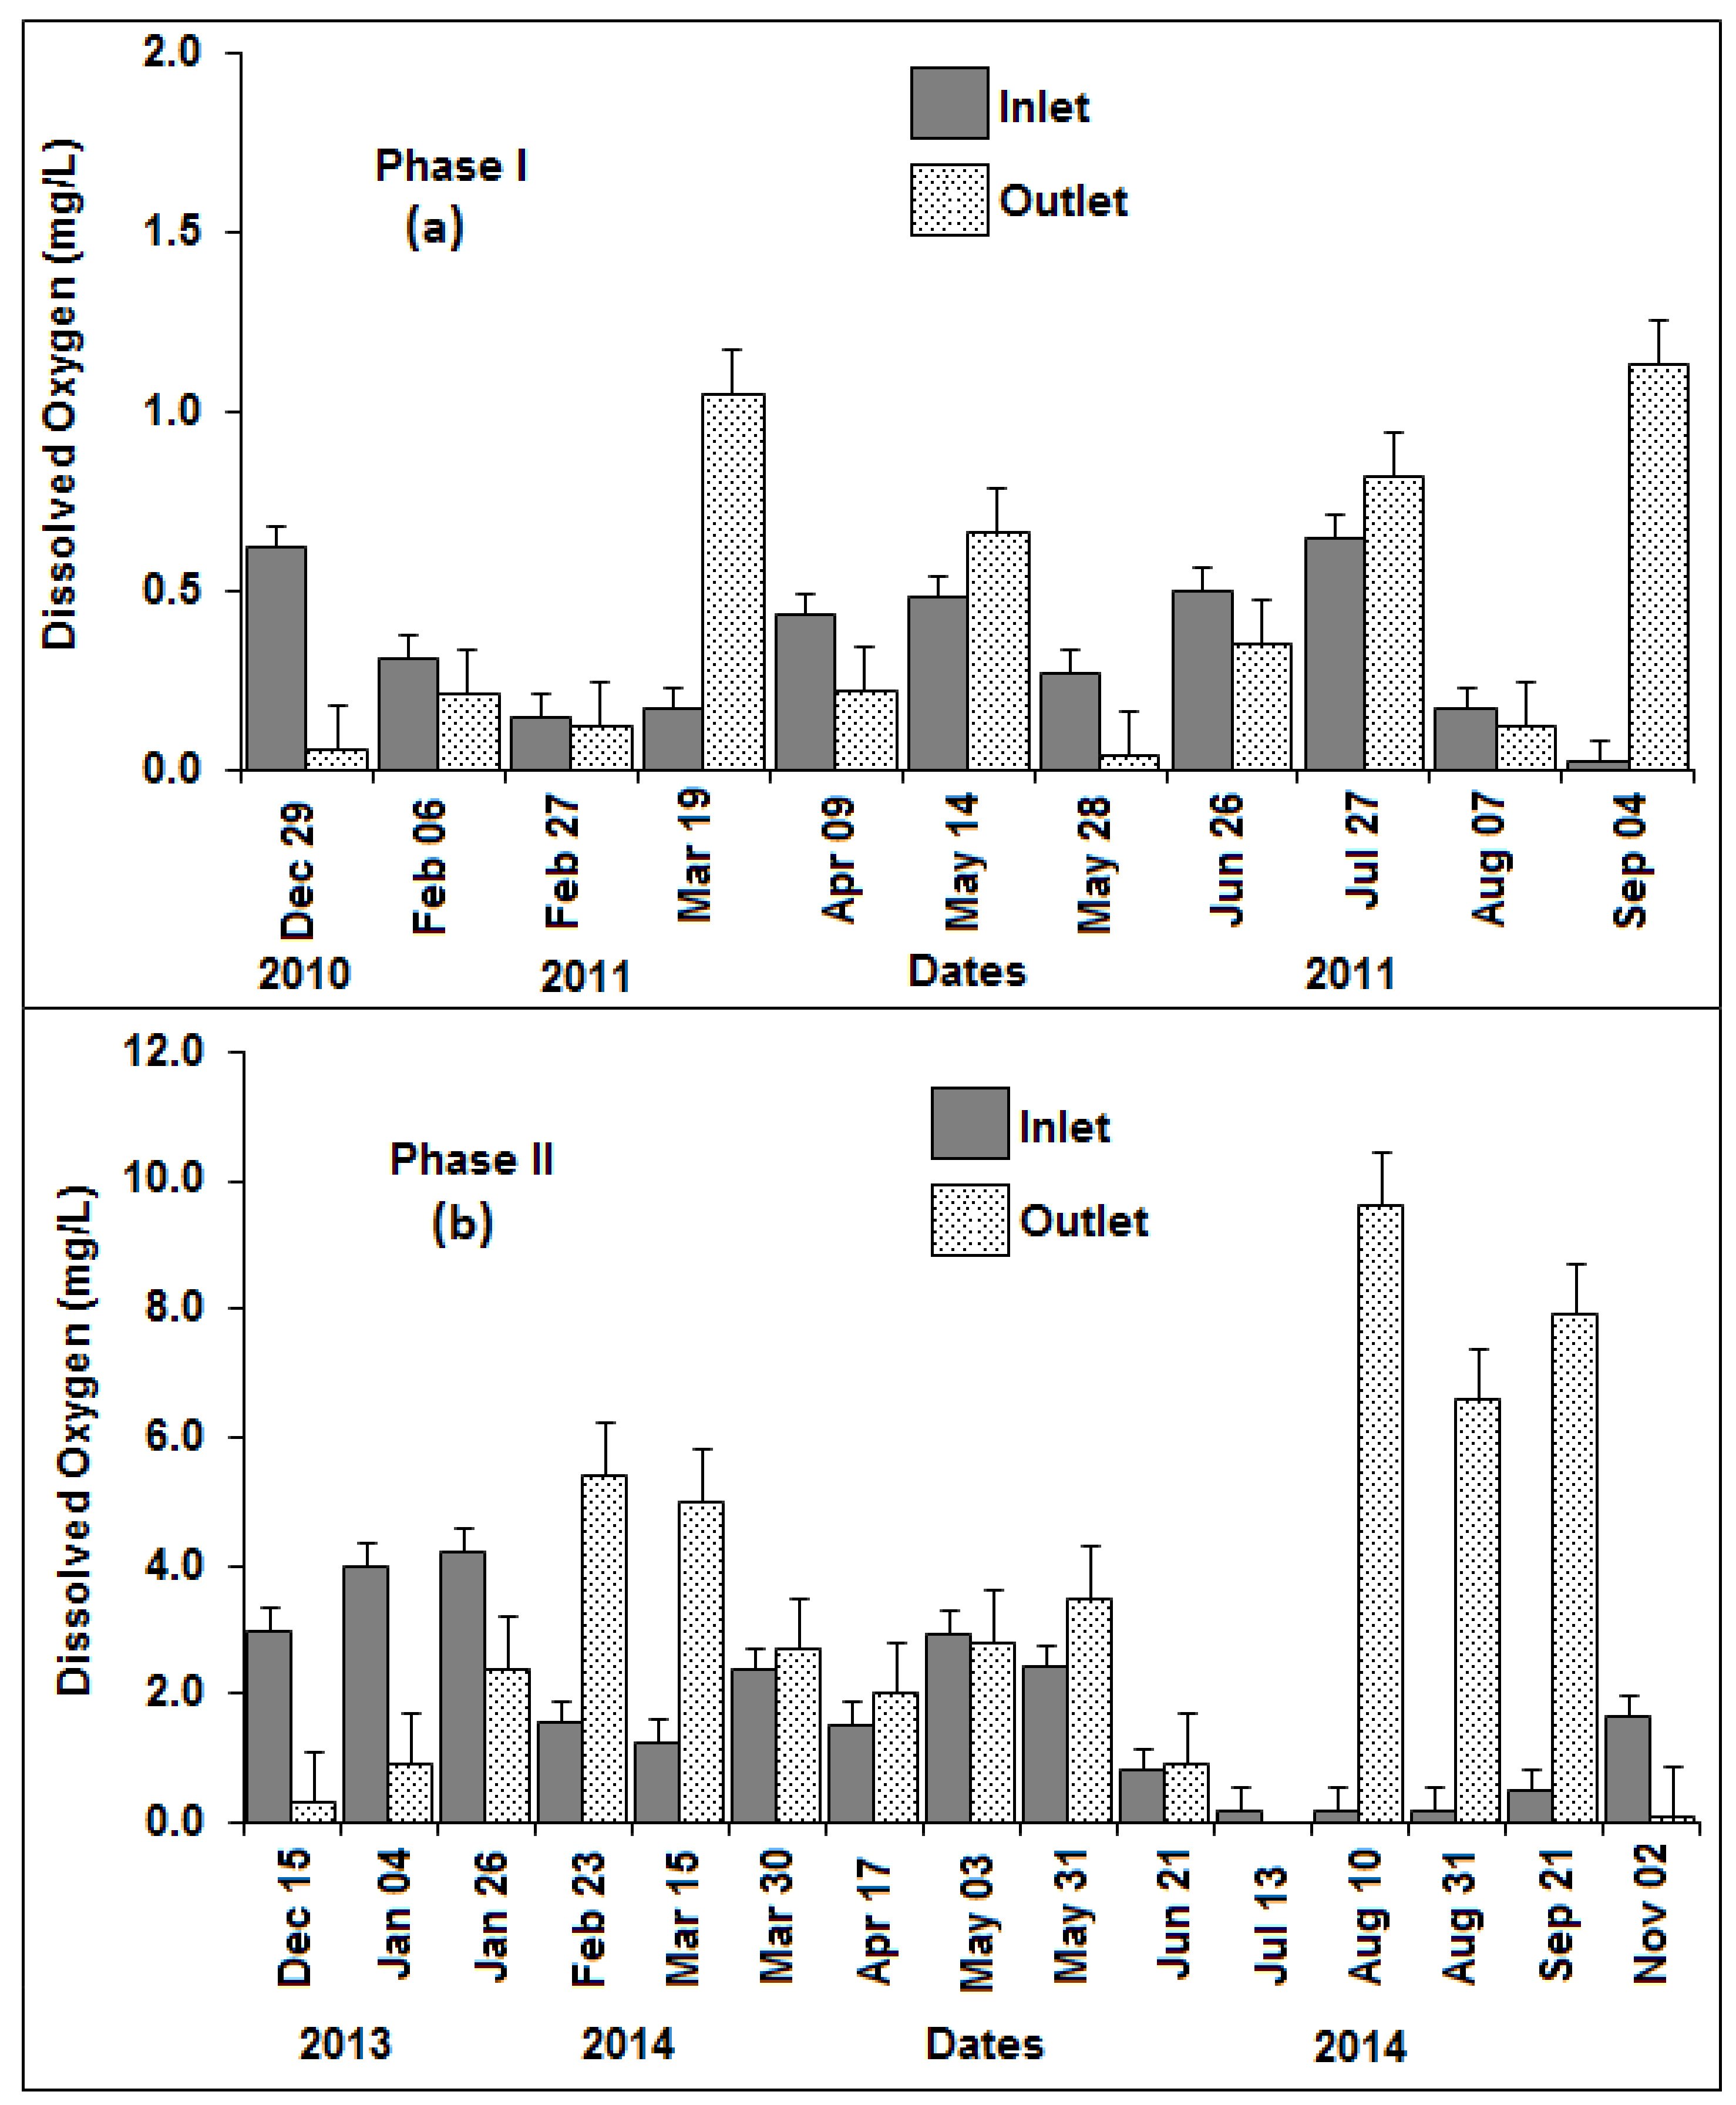
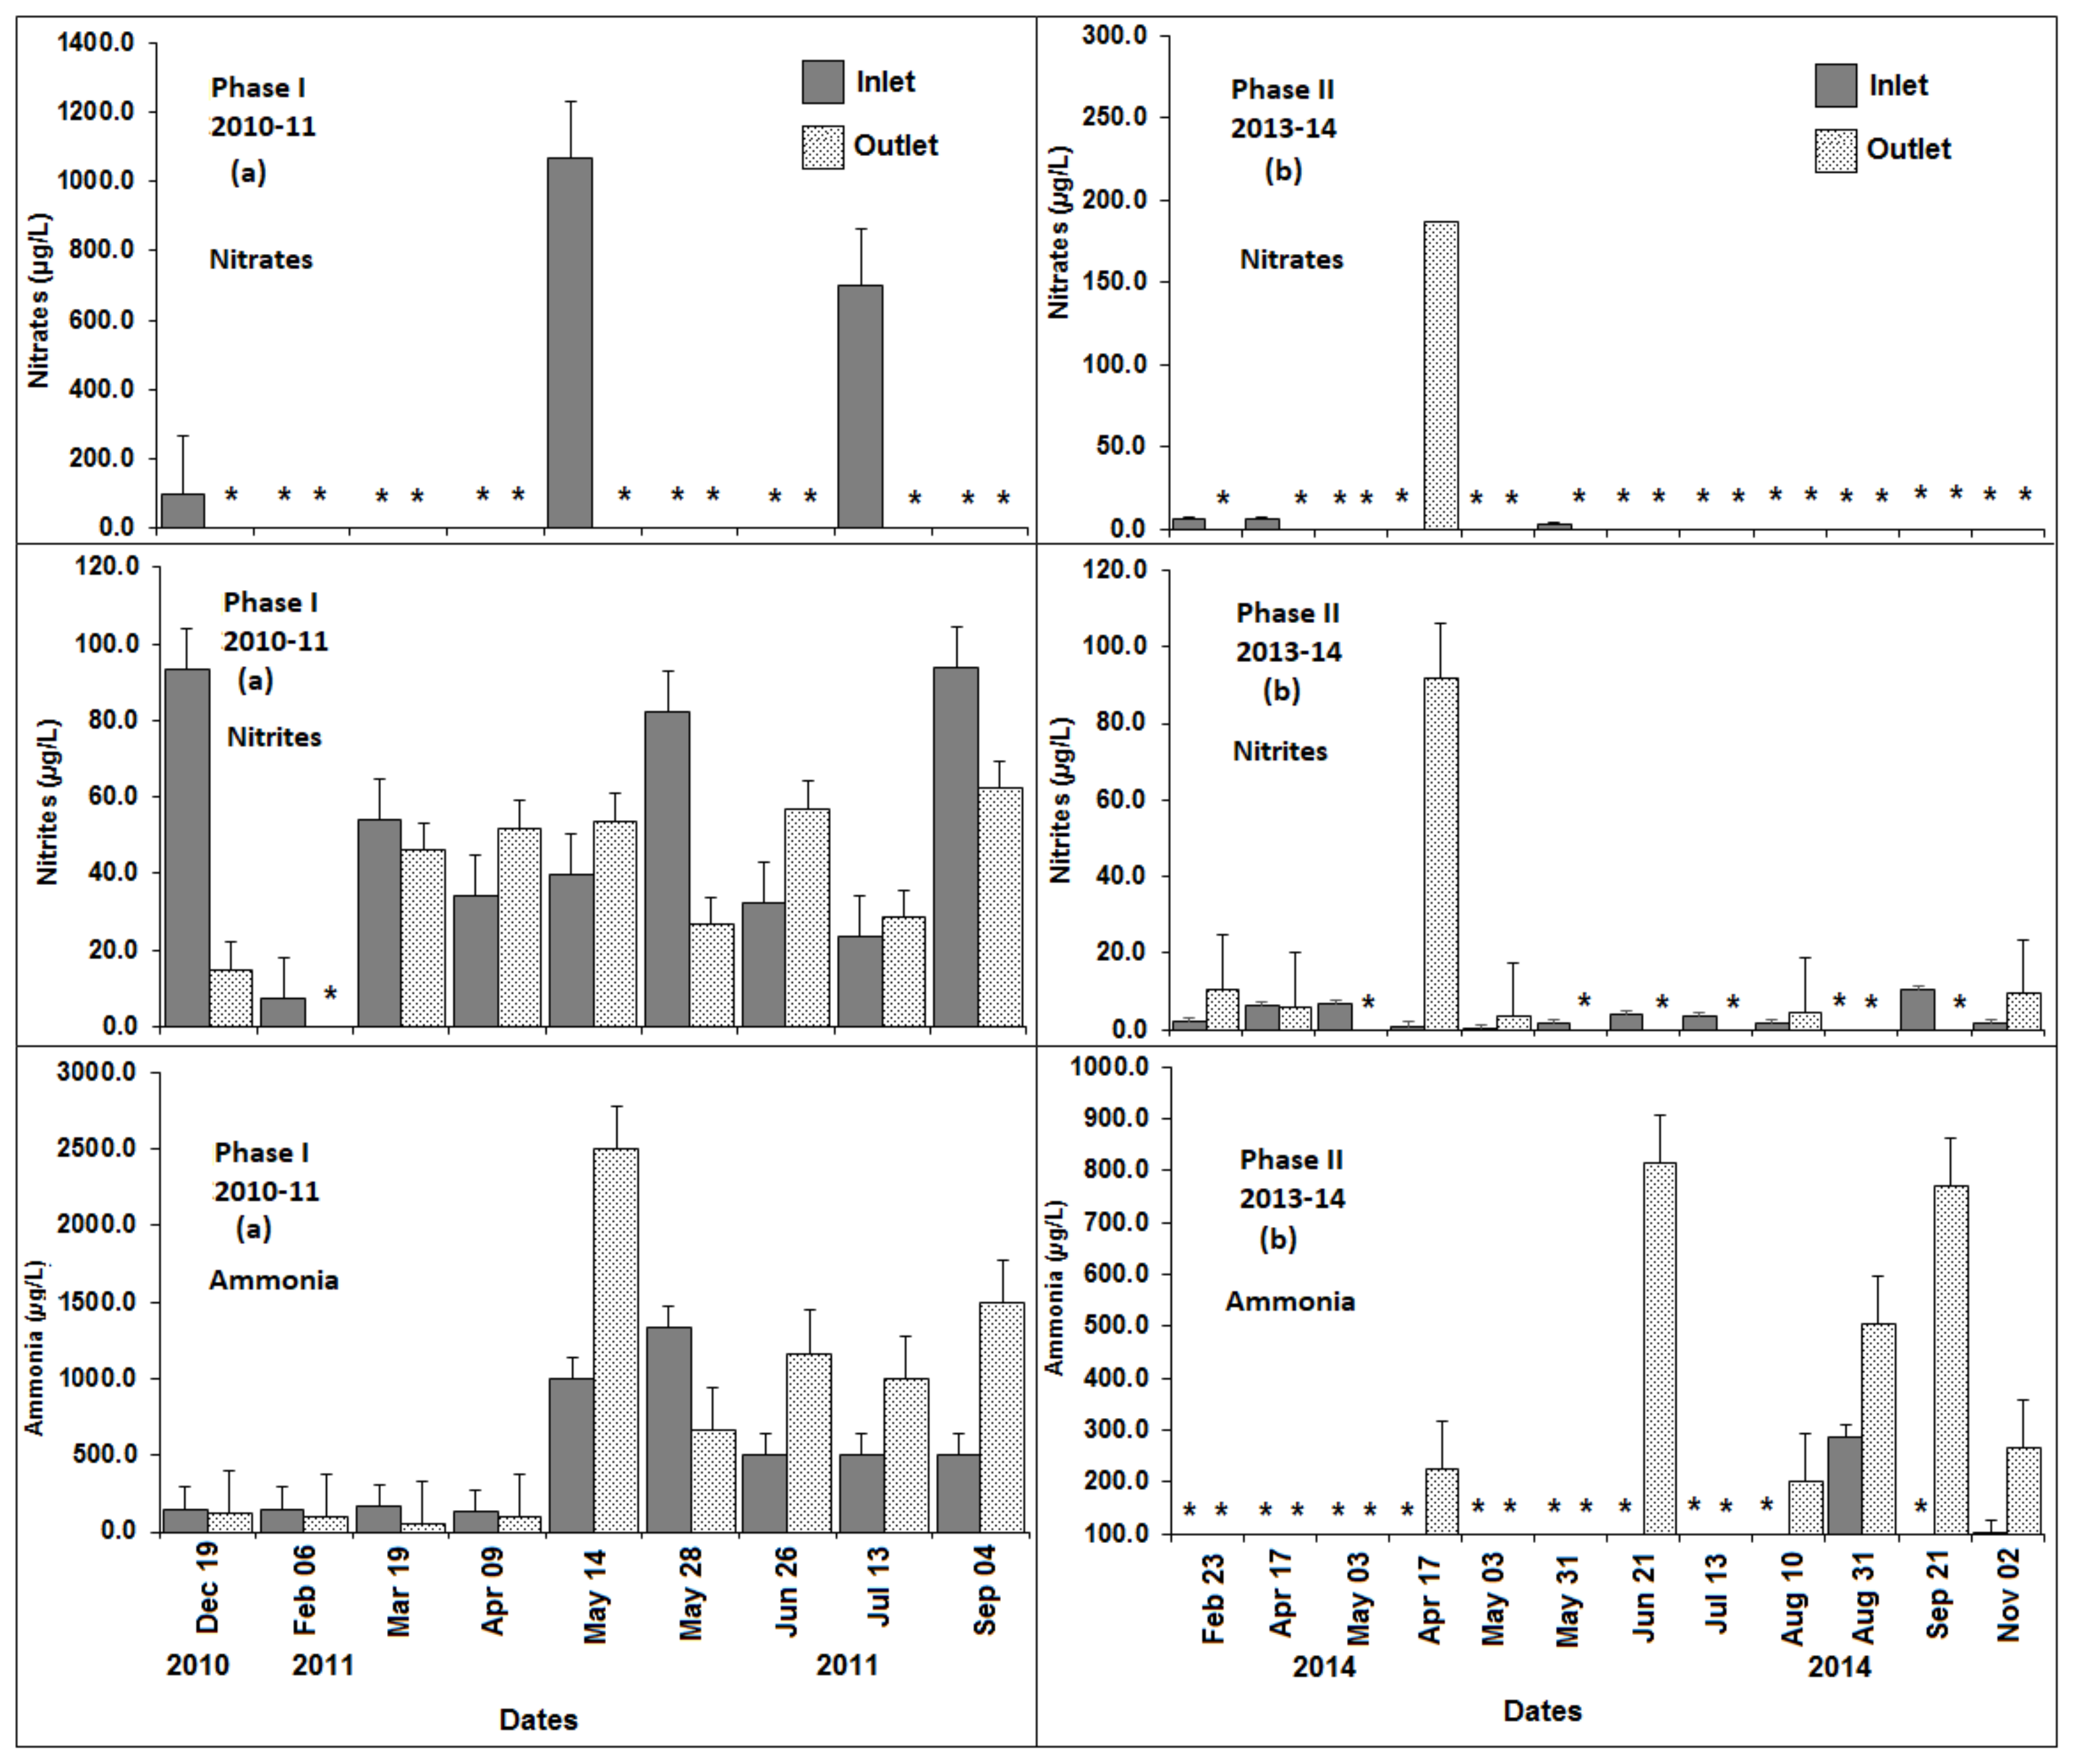
3.3. Dissolved Oxygen, pH, Total Dissolved Solids, Temperature, Turbidity, and Nitrogen

Overall, Laguna Cartagena had a neutral pH (6.9–7.2) and temperatures that ranged from 25.5 °C to 27.6 °C (Table 1). During Phase Two, DO increased for both the inlet (from 0.34 mg/L to 1.79 mg/L) and lagoon’s outlet (from 0.43 mg/L to 3.59 mg/L) (Table 1). The overall DO concentration for 2013–2014 (Phase Two) was significantly greater than for 2010–2011 (Phase One) (Figure 5). During both Phase One (33.6 cm) and Phase Two (29.5 cm), the lagoon’s outlet had a higher turbidity than the inlet (Table 1).
Overall, during both Phase One (2010–2011) and Phase Two (2013–2014), nitrate concentrations were at or near zero (Figure 6). Nitrite and ammonia concentrations for 2010–2011 (Phase One) were significantly greater than for Phase Two.

3.4. Analysis from Consolidated Bottom Substrate and Flocculence Associated with Floating Islands

Consolidated bottom substrate and the flocculence associated with floating islands in the center of the lagoon were acidic and with very high nutrient concentrations for both Phase One and Phase Two of this study (Table 2). For Phase One, the pH for consolidated bottom substrate was typically about 4.16 and it was 3.86 for Phase Two. During 2014 the pH for flocculence in the center cattails was higher (4.30) than during 2011 (2.82).
For 2011 (Phase I) the Pavailable in the consolidated bottom substrate was 7750 µg/L but by 2014 (Phase Two) the available phosphorus (Pavailable) had increased (35,000 µg/L) in the center cattails. In 2013–2014 (Phase Two) the Pavailable (50,720 µg/L) for flocculence was 3-times less than those concentrations in 2011 (Phase One) (13,000 µg/L). By 2014, the %Total Kjeldahl Phosphorus (TKP, the combination of orthophosphates, hydrolyzable phosphorus and organic phosphorus) (0.17%) and %Total Kjeldahl Nitrogen (TKN, the total concentration of organic nitrogen and ammonia) (0.54%) values for consolidated bottom substrate were higher than the 2011 (Phase One) values of 0.09%TKP and 0.39%TKN. By 2014, %TKP in the flocculence decreased to 0.08% and the %TKN increased to 0.98%. During 2014 (Phase Two), nitrate ( NO 3 ) values decreased to non-detectable values for both the consolidated bottom substrate and for flocculence. In 2011, the NO 3 for consolidated bottom substrate was 34,000 µg/L and 1000 µg/L for flocculence. Nitrite ( NO 2 ) was not detectable in neither the consolidated bottom substrate nor in the flocculence for both Phase One and Phase Two of study. In 2011 (Phase One), ammonium in the consolidated bottom substrate was 220,000 µg/L, decreasing to 80,0000 µg/L in 2014 (Phase Two). The NH3 concentrations for flocculence increased from 63,000 µg/L (2010) to 163,000 µg/L (2014).

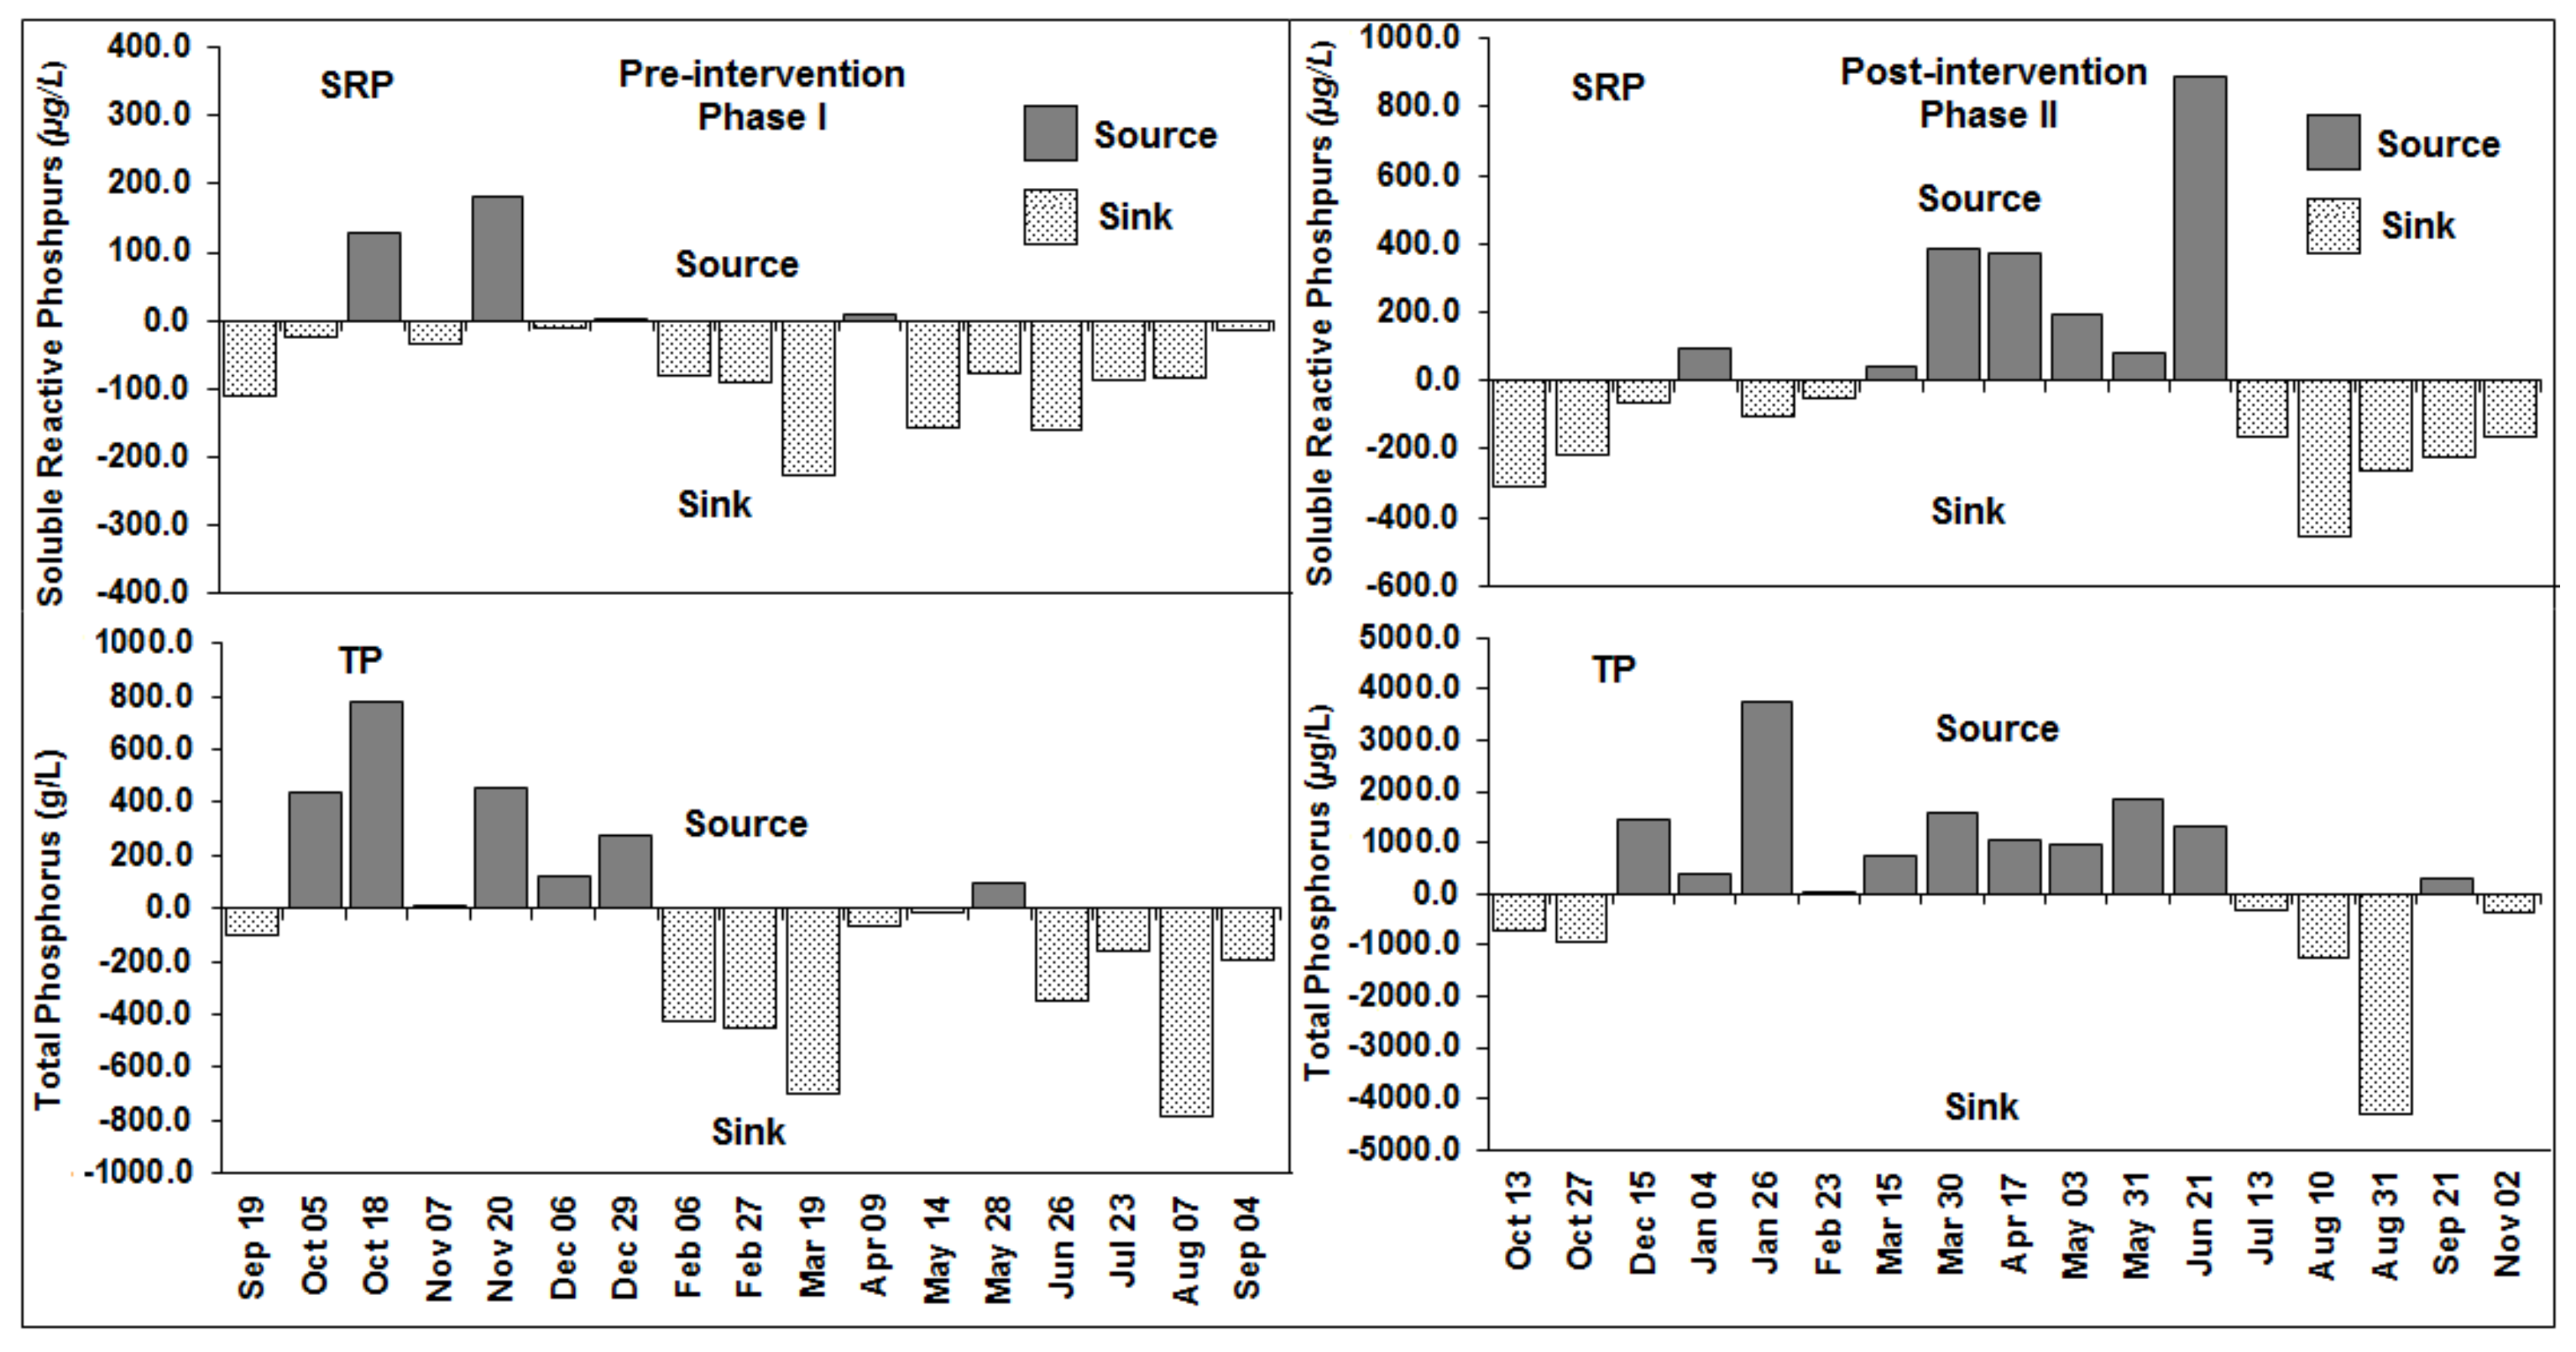
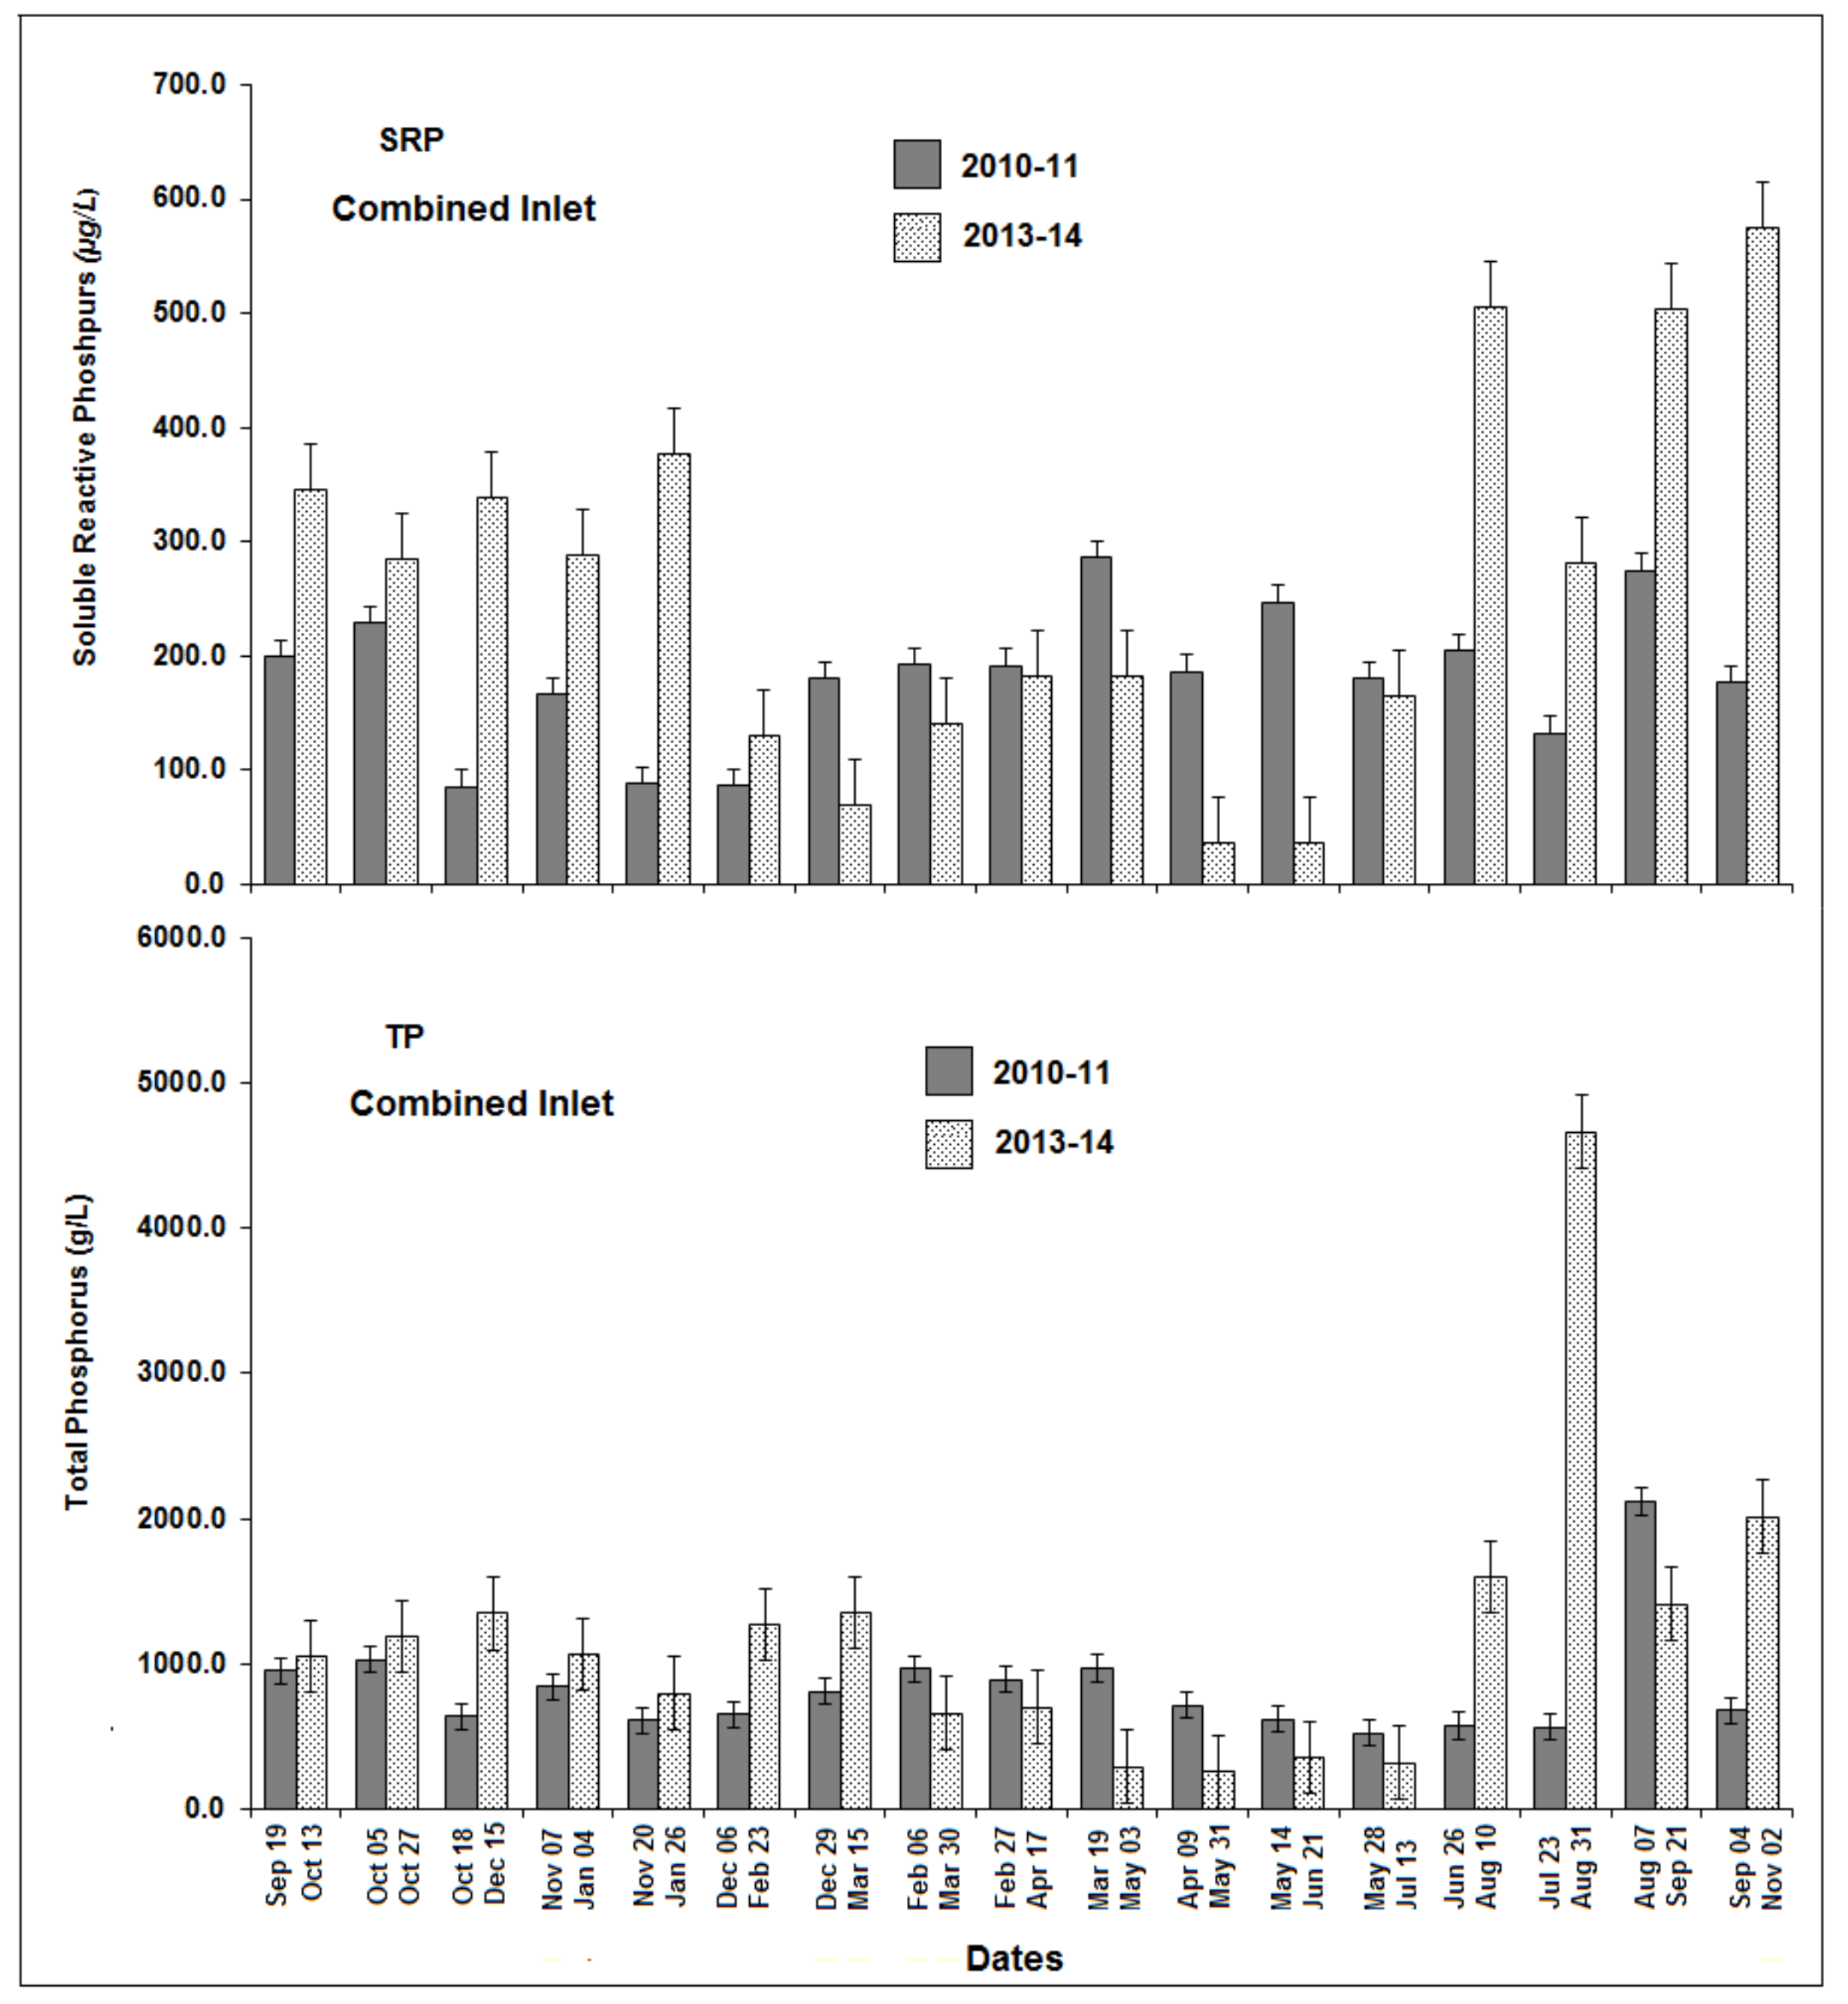
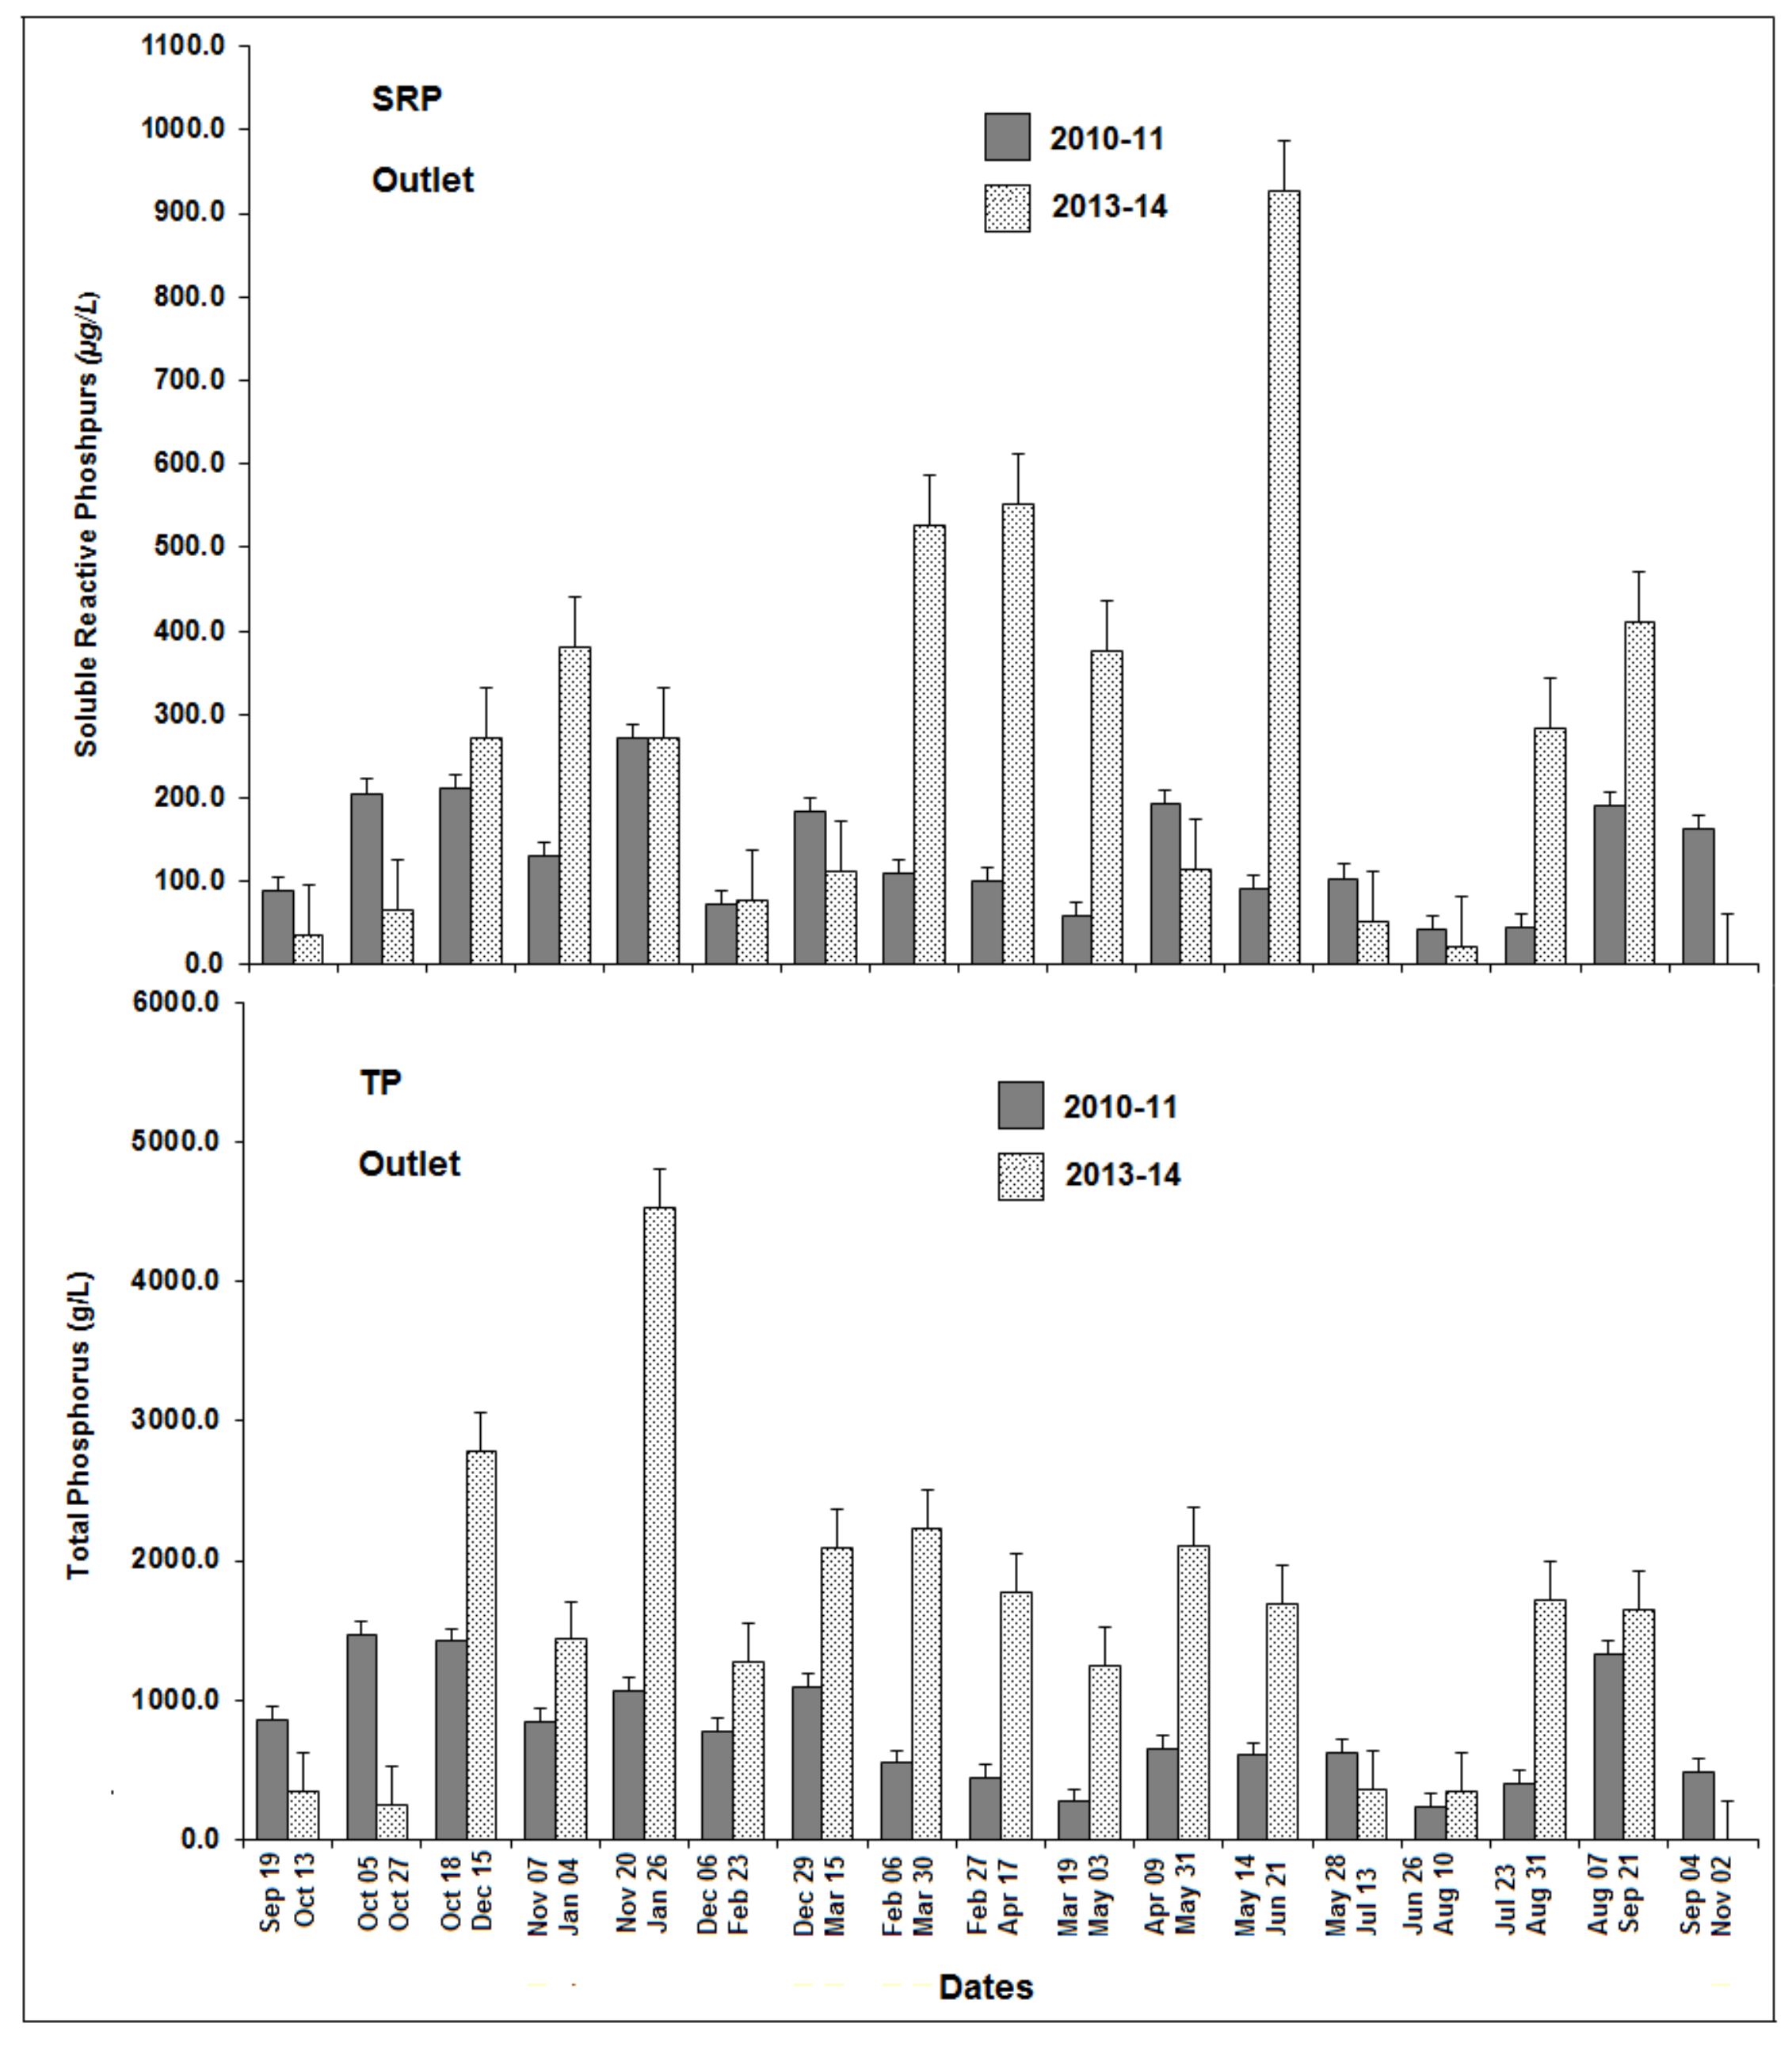
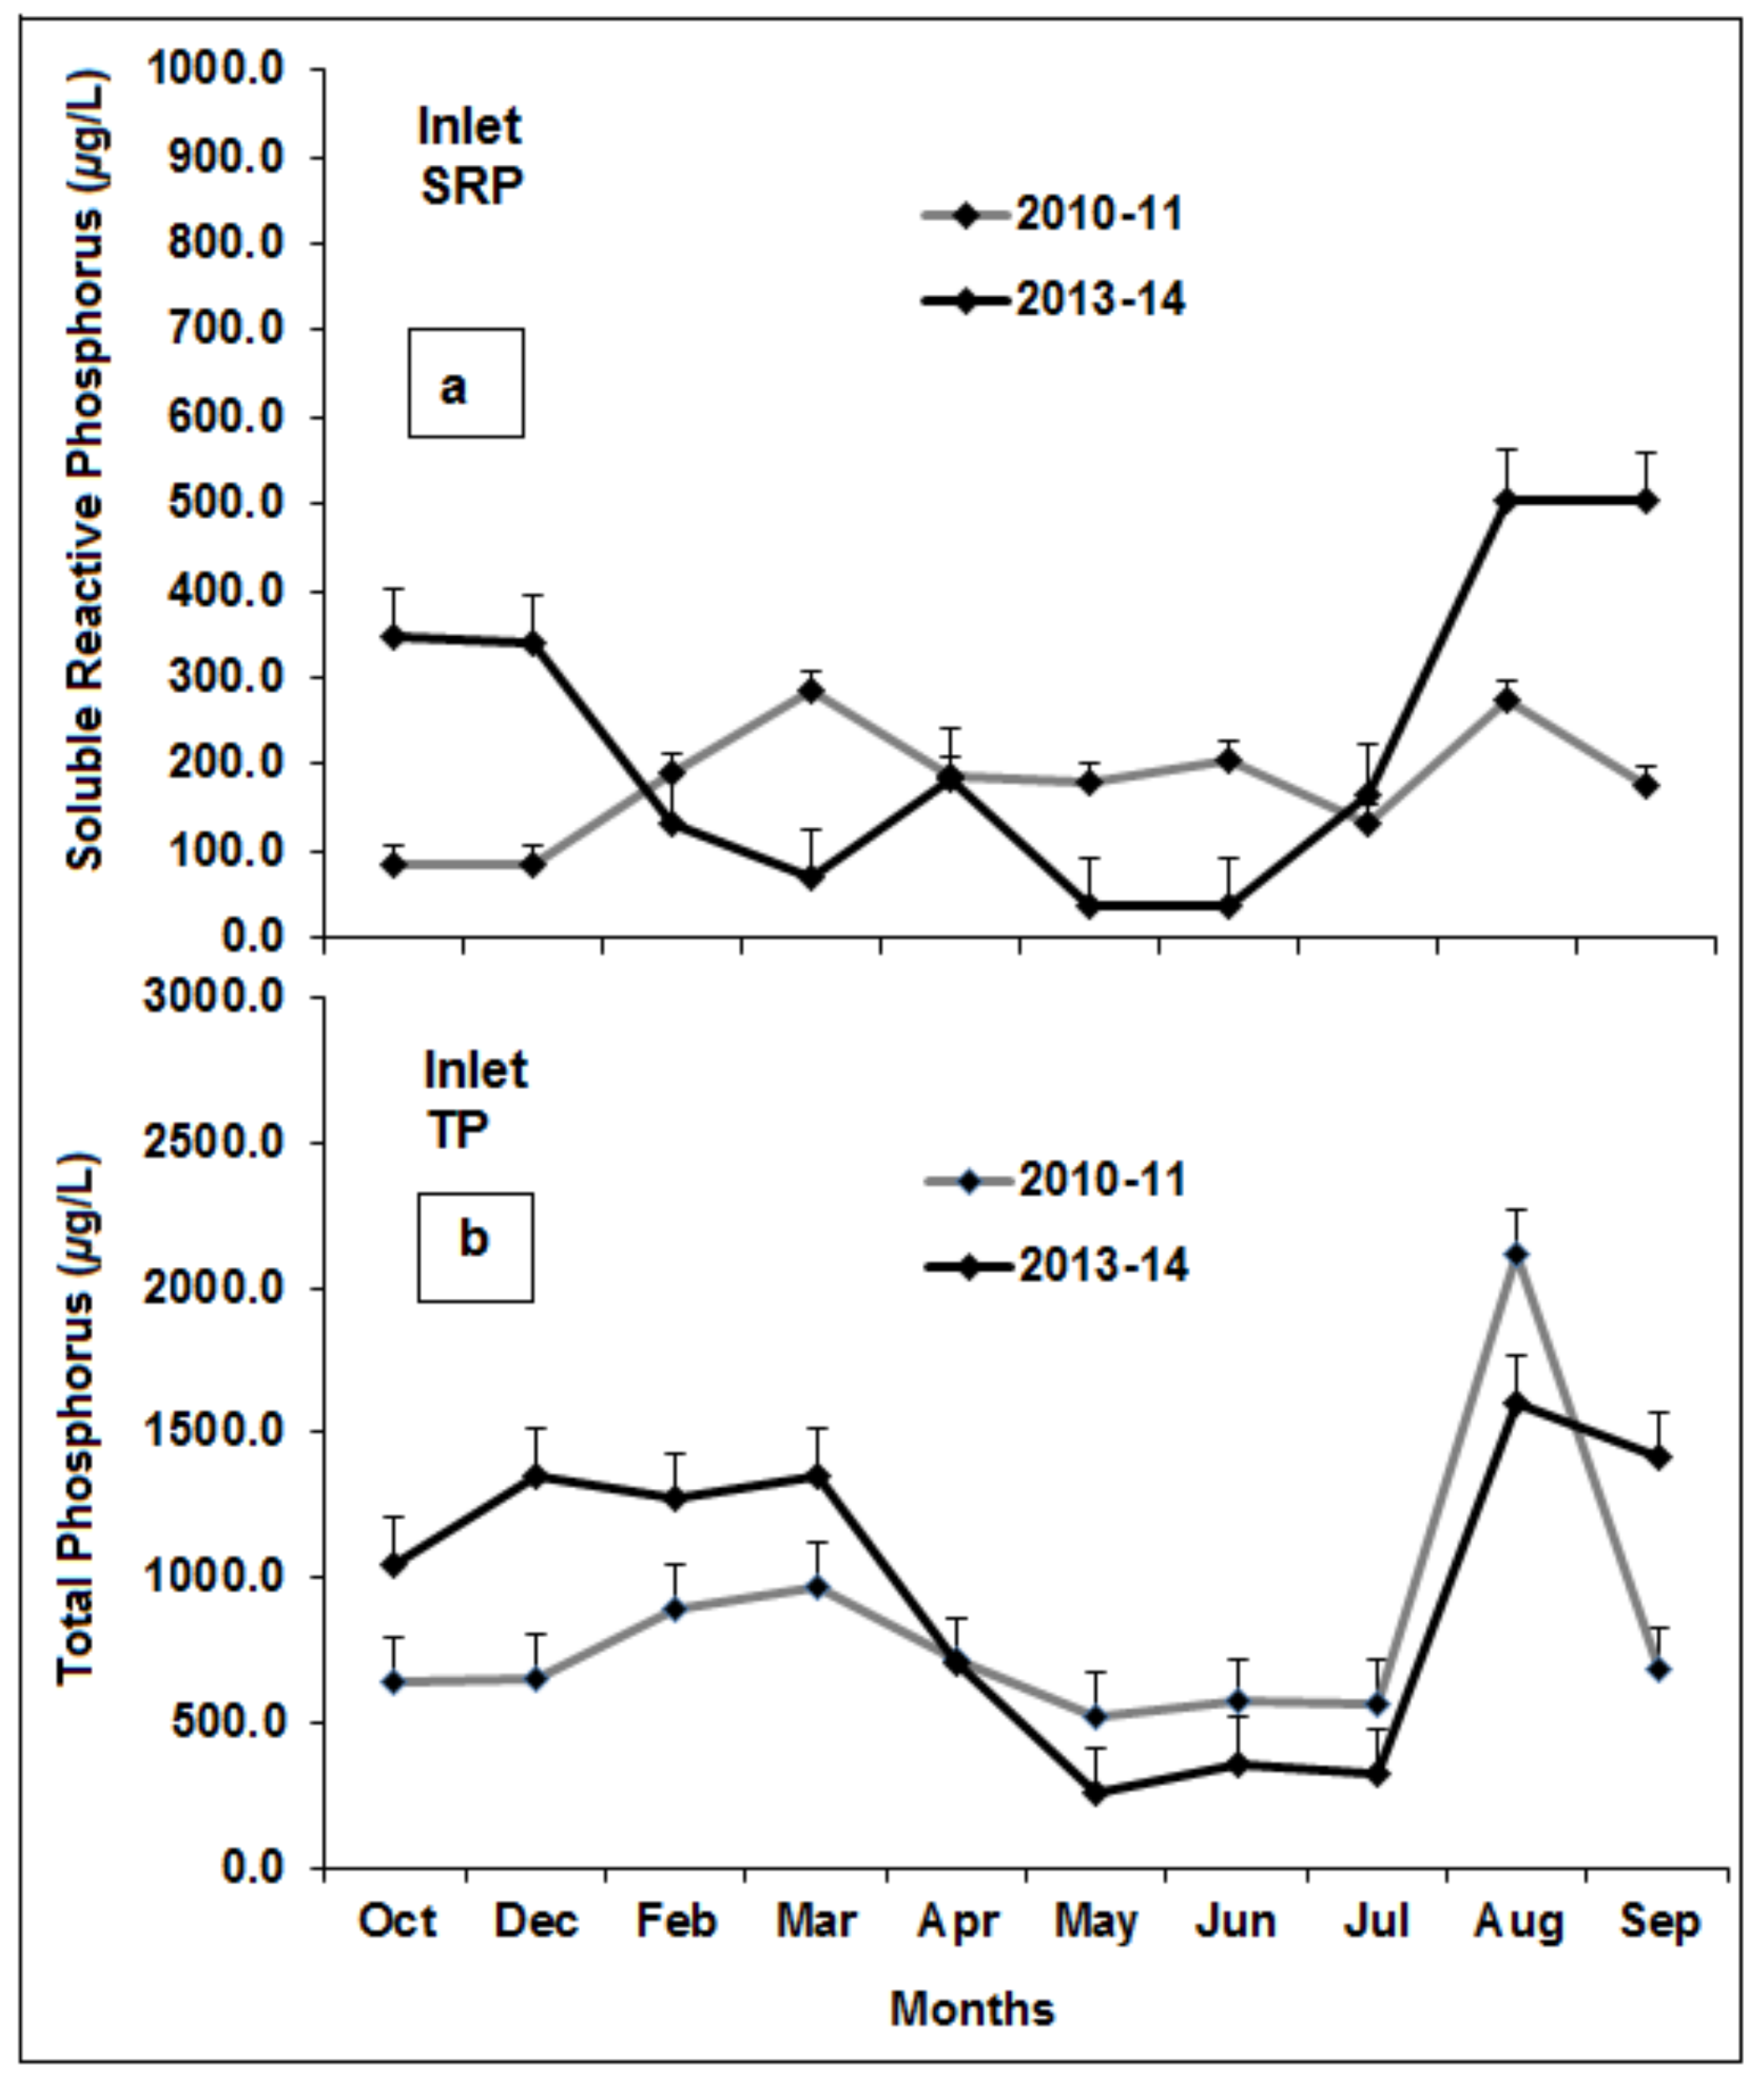
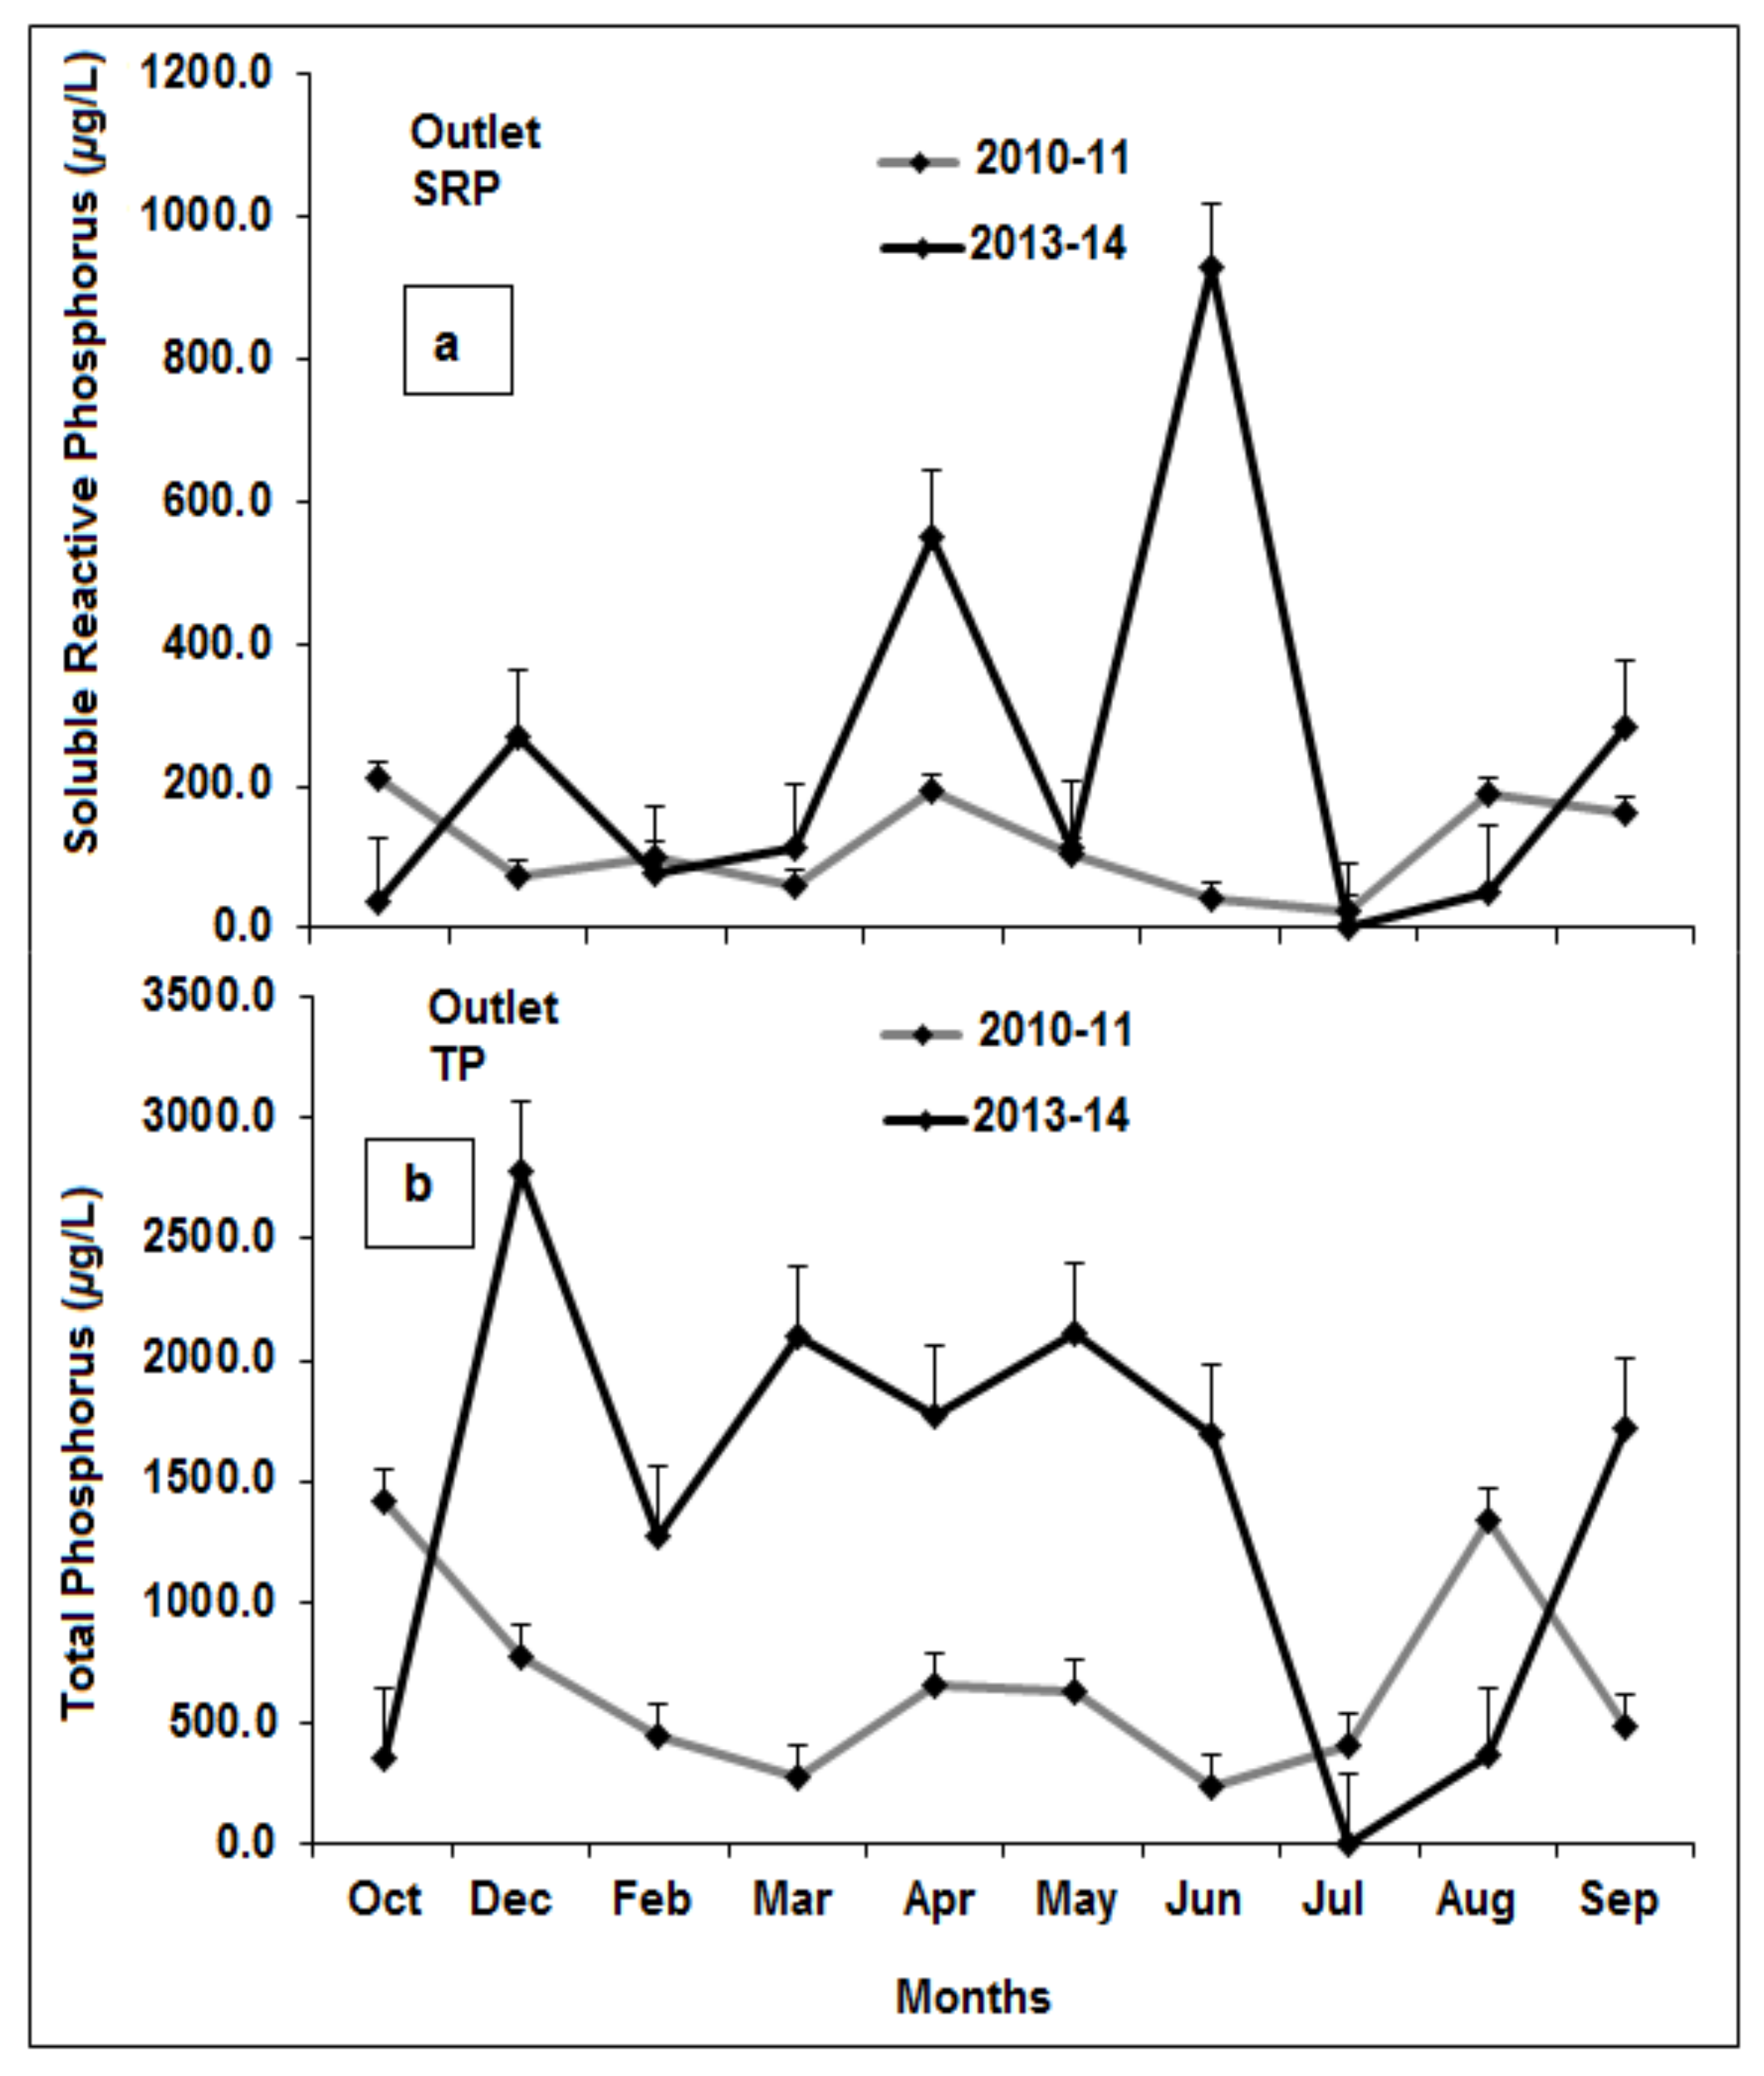
3.5. Phosphorus Source/Sink Dynamics

The SRPOI and TPOI data from 2010–2011 (Phase One) and 2013–2014 (Phase Two) at Laguna Cartagena (Figure 7) exhibited relatively minor P release (source) events during 2010–2011 in contrast to dramatic P export events during 2013–2014. Laguna Cartagena was a significant source of SRP downstream on 18 October, 20 November of 2010 with lesser releases on 29 December of 2010 and 9 April of 2011. The lagoon was a source (release) of TP on six occasions (5 October, 18 October, 20 November, 6 December, 29 December of 2010, and 28 May of 2011) with negligible release on 7 November of 2010. During Phase Two, the lagoon was a source of SRP on 4 January, 15 March, 30 March, 17 April, 3 May, 31 May, and 21 June of 2014 (Figure 7) on 7 of 17 sample periods, and source of TP on 11 of the 17 samplings (5 December of 2013, 4 January, 26 January, 23 February, 15 March, 30 March, 17 April, 3 May, 31 May, 21 June, and 21 September of 2014; Figure 7).

3.6. Source/Sink Dynamics under High Versus Low Rainfall and Water Level Fluctuations

During Phase One of this study (pre intervention, 2010–2011), stage fluctuations (water level (WL) one-week prior to sampling) and rainfall (one week (1R) and two weeks (2R) prior to sampling) affected the source–sink dynamics. The data had a normal distribution and the results of the regression equations were, for SRPOI: −190 + 104 (WL) − 0.614 (1R) + 0.734 (2R) (r2 = 59.4%, p = 0.007) and for TPOI: −736 + 440 (WL) − 0.18 (1R) + 3.23 (2R) (r2 = 55.9%, p = 0.012).
Therefore, both SRP and TP dynamics were functions of stage fluctuations one week prior to sample collection and rainfall both one and two weeks prior to sample collection, indicating the effect of stage and rainfall, with a lag.
During Phase Two (post intervention, 2013–2014), the data also had a normal distribution and the regression equations were, for SRPOI: 130 − 21 (WL) − 7.84 (1R) + 3.64 (2R) (r2 = 22.3%, p = 0.368) and for TPOI: −769 + 1097 (WL) + 18.3 (1R) − 20.1 (2R) (r2 = 12.7%, p = 0.637). Thus, SRP and TP dynamics were not significant functions of stage fluctuations one week prior to sample collection, nor functions of rainfall (neither one nor two weeks prior to sample collection).

3.7. Comparison of Phase One and Phase Two P Concentrations

During Phase One, at the inlet, the minimum values of SRP and TP were 85.4 µg/L and 525.9 µg/L; and the maximum values were 286.8 µg/L and 2117.5 µg/L, and varied with increasing rainfall (Figure 8). SRP concentrations from lagoon’s outlet in Phase One, varied between 43.3 µg/L and 270.8 µg/L (Figure 9). The minimum TP concentration here was 229.4 µg/L and the maximum value was 1471.7 µg/L (Figure 9).
During Phase Two, at the combined inlet the minimum values of SRP and TP were 35.8 µg/L and 253.9 µg/L; and the maximum values were 574.2 µg/L and 4665.3 µg/L (Figure 8). SRP from lagoon’s outlet varied between 20.9 µg/L and 927.5 µg/L (Figure 9). The minimum TP concentrations was 249.3 µg/L, and the maximum value was 4529.1 µg/L (Figure 9).
Overall population means of Inlet SRP concentrations were 180.8 µg/L and 231.5 µg/L for 2010–2011 versus 2013–2014 (Figure 8, Figure 10) and were not significantly different (One-way ANOVA, p = 0.417; Paired-t (µ1 > µ2), p = 0.776). Overall population mean concentrations of inlet TP, at 840.8 µg/L for 2010–2011 and 966.9 µg/L for 2013–2014 were not significantly different (One-way ANOVA, p = 0.575; Paired-t (µ1 > µ2), p = 0.807) (Figure 8, Figure 10).
Although overall population means of outlet SRP concentrations of 127.7 µg/L and 269.8 for 2010–2011 versus 2013–2014 were not significantly different (One-way ANOVA, p = 0.380; Paired-t (µ1 > µ2), p = 0.888), comparisons of similar sampling dates (Figure 9 and Figure 11) show substantially higher concentrations of SRP in Phase Two.
Overall population mean concentrations of outlet TP, for 2013–2014 (1573.0 µg/L) were significantly greater than for 2010–2011 (703.1 µg/L) using one-way ANOVA (p = 0.011) and paired t-tests (µ1 > µ2) (p = 0.025) (Figure 11). Moreover, comparisons of similar sampling dates (Figure 9, Figure 11) show dramatically higher concentrations of TP in Phase Two. Thus, while the phosphorus concentrations of inputs into the lagoon were similar in Phase One and Phase Two, the concentrations of phosphorus in water flowing out of the lagoon were notably higher in the post intervention Phase Two than prior to intervention (Phase One).

4. Discussion

4.1. Phosphorus Inputs and Outlets Before and After Intervention Measures

The channelized external sources of nutrients that enter Laguna Cartagena through the combined inlet at Magüayo collect the nonpoint sources without any treatment measures. Currently, the major external sources of water and nutrients to the lagoon come together in an inlet canal (“a” in Figure 1) and include runoff and nonpoint nutrient pollution from fertilizers applied to adjacent rice and pineapple fields as well as high density livestock (dairy cattle) pastures (and possibly legacy nutrients in the soils of these areas) on the lands formerly used for sugar cane, and water flows from the lagoon outlet to the downstream habitats mentioned previously.
We found no significant differences between P (SRP and TP) concentrations at the inlet canal for Phase One (2010–2011) versus Phase Two (2013–2014). During Phase One (2010–2011), overall mean concentrations of SRP and TP at the inlet canal were 180.8 µg/L and 840.8.0 µg/L, respectively (Figure 8, Figure 10). During Phase Two (2013–2014), the overall mean concentrations of SRP and TP were 231.5 µg/L and 966.9 µg/L, respectively. At the lagoon’s outlet, the mean concentration of TP was significantly higher in Phase Two (1573.0 µg/L) than in Phase One (703.1 µg/L) (Figure 9, Figure 11), and similarly, SRP concentrations at the lagoon’s outlet during Phase Two (269.8 µg/L) were substantially higher than those of Phase One (127.7 µg/L) (Figure 9, Figure 11).

4.2. Role of Precipitation and Water Level Changes in P Sink and Source Dynamics

During both Phase One (2010–2011) and Phase Two (2013–2014) Laguna Cartagena acted at various times as both a sink and source of TP and SRP. The water column in the lagoon is nitrogen depleted, with very low N:P ratios (Figure 6). Overall, high nutrient concentrations are stored in the acidic sediment/substrate of the lagoon and management interventions (primarily draining and dredging) occurred in 2012 and 2013. This study addressed two important Laguna Cartagena substrate types: (a) consolidated bottom substrate and (b) flocculence associated with floating islands. The consolidated bottom substrate is compacted clay and the flocculence or organic substrates are produced from the remains of decomposing macrophytes and cattails accumulated in the lagoon. As organic matter decomposes by the action of soil microorganisms, CO2 is released and as a consequence, the soil is acidified. The plants were growing in matts of floating peat, and water column phosphorus concentrations were so high, especially in relation to the depleted N concentrations, that they were unaffected by plant growth, either before or after the interventions. This is especially evidenced by the fact that upon refilling of the lagoon (after vegetation removal, dredging and draining) the rapidly recovering vegetation did not produce a decline in P concentration from October 2013 to November 2014.
During Phase One (2010–2011), P dynamics within the lagoon were primarily influenced by factors extrinsic to the lagoon: rainfall (one and two weeks prior to sample collection) and water flows to the lagoon (all of which are beyond the control of the management agency). Continual fluctuations in water levels and resulting alternate flooded and drained conditions may substantially alter the stability and redistribution of stored materials including phosphorus (P) in nutrient-impacted wetlands [27,28]. Overall, Laguna Cartagena acted as a sink of SRP and TP under stable conditions, when the inlet concentrations consistently exceeded outlet concentrations, indicating that this ecosystem was assimilating P. Phosphorus that enters Laguna Cartagena tends to accumulate in the sediments and flocculence, and the biota act much like a nutrient “sponge” (a nutrient sink).
Laguna Cartagena sometimes experienced very dramatic events of P release and these dynamics were influenced by the hydrologic regime due to the abrupt periodic flooding and drying cycles imposed on it by agency management. The USFWS abruptly lowered the water level during the summer of 2010, leading to oxidation of the lagoon’s exposed soils caused by exposure to the air and increased retention of P. This oxidation can result in the conversion of organic P to inorganic P, which can be subsequently released into water column [28].
In July 2010, USFWS re-installed all the flashboards to the top of the outlet water control structure, leading to a relatively long residence time of water accumulating behind the structure. Heavy rains fell in August and September of 2010, leading to an elevating water level (without outflow from the lagoon), and the rehydration of the lagoon’s exposed dry organic soils, releasing P. High rainfall events and increasing water levels resulted in resuspension of bottom sediments, high turbidity levels and a substantial increase in TP concentrations of the lagoon water column [29]. High water levels lead to reducing conditions, where oxygen is absent. During Phase One (2010–2011), the lagoon exhibited hypoxic dissolved oxygen concentrations uniformly below 1 mg/L (ppm) that forced P release from sediments [30], forcing a greater flux of P from the organic matter, resulting in internal eutrophication [16,27,31,32].
In contrast, in Phase Two (2013–2014) the lagoon’s P dynamic behavior was primarily influenced by internal biological and physicochemical processes within the lagoon. During this period Laguna Cartagena acted more often as a source of SRP and TP. The increased P release to the water column observed in Phase Two is likely the result of substrate disturbance (sediment and soil) and/or increased rates of plant decomposition in response to management interventions during the summers of 2012 and 2013; that reflect the transformation of sediment binding sites from imposed environmental variations in either oxidation or drying of the sediment, causing dramatic P release. Phosphorus release depends on the concentrations and distribution of P in the sediments, the degree of saturation of exchangeable phosphorus, the intensity of biological and chemical processes taking place at the water-sediment interphase and hydrological conditions [33]. During the post-intervention Phase Two (2013–2014), the lagoon exhibited levels of dissolved oxygen between 0.04 mg/L to 10.54 mg/L (ppm) [24,25], likely attributable to the initial removal of floating peat mats and floating vegetation, allowing greater water surface contact with the air and the penetration of light for photosynthesis by microalgae and submerged plants. Several studies have demonstrated that under aerobic conditions or sediment aeration, P released due to microbial mineralization is transferred to the reductant-soluble, labile, and pore water pools [34].
Although sediment dredging is sometimes used in an attempt to reduce internal P-loading [31,35,36,37], sediment removal can significantly disrupt other wetland processes because of physical disturbance and extensive drawdown of surface water [38]. Disturbance of P-enriched sediments has the potential to cause high phosphorus concentrations in the water column and low underwater irradiance due to sediment resuspension [39]. Sediments with high organic phosphorus promote the photo-release of inorganic phosphorus during resuspension of sediments exposed to simulated sunlight irradiation [40]. Aerobic sediments transforming to anoxic conditions release more P because of higher microbial respiration rates. Moreover, upon refilling, as the lagoon stage increased, more soils were inundated, thus releasing more P. In this study, high turbidity was coincident with increasing TP concentrations, suggesting that the lagoon may have experienced an increase in the amount of mineral turbidity in its water column, again due to greater sediment resuspension and exposure of new sediments to the water column [4].
Thus, the P retention capacity of soils tends to diminish on reflooding after drying, compared with continually flooded soils [27,29,41,42]. Thus, as Laguna Cartagena was drained there were concurrent changes in decomposition and the state of nutrients, making phosphorus more soluble, facilitating its export. Prescribed burning, employed to reduce organic matter and detritus, also converts varying proportions of the biomass and soil organic matter to ash and thus mineralizes nutrients [38,43]. Studies elsewhere, for example, in the Orlando Easterly Wetland (OEW), showed a decrease in SRP concentrations but an increase in the dissolved organic phosphorus (DOP) and particulate phosphorus (PP) resulting from a burn in the OEW [38], consistent with our observations here.

5. Conclusions

This study investigated the effects of intensified management interventions including excavation and removal of sediment and vegetation, draining, and burning on soluble reactive phosphorus (SRP) and total phosphorus (TP) concentrations of lagoon water, focusing on SRP and TP input and export during September 2010–September 2011 (Phase One) and October 2013–November 2014 (Phase Two), and including the roles of precipitation and water level changes on P sink and source dynamics. The results of water and soil/sediment analyses showed that Laguna Cartagena is a hypereutrophic and anoxic ecosystem that acted various times as both a sink and source of TP and SRP with internal phosphorus loading (internal eutrophication) from the lagoon’s own sediments, causing higher phosphorus concentrations in lagoon water, downstream to other ecosystems.
Release of SRP and TP at the lagoon’s outlet during Phase Two was substantially higher than during Phase One. We found no significant differences between P concentrations at the inlet canal for Phase One versus Phase Two. The lagoon also showed depleted N concentrations in the water column. During Phase One, P dynamics within the lagoon were primarily influenced by rainfall (one and two weeks prior sample collection) and water flows to the lagoon. In Phase Two the lagoon acted more often as a source of SRP and TP and this dynamic behavior was primarily influenced by internal biological and physiochemical processes within the lagoon. The USFWS Laguna Cartagena Conservation Plan emphasizes wildlife diversity and habitat restoration, but for this to be achieved the prevention and control of nonpoint P pollution is required, including the control of internal eutrophication. While nutrient and pollution inputs to the lagoon are beyond the control of the USFWS, the agency can nonetheless provide optimal wildlife habitats (keeping vegetative cover to about 30% instead of 90%) through the use of a common floating surface dredge. This would avoid disturbing bottom sediments, thus preventing excessive release of P to the lagoon water column and downstream to other water bodies and the Caribbean Sea. We recommend allowing normal (moderate) seasonal stage level fluctuations, but the complete cessation of draining, dredging, burning, excavations, and other interventions that can alter or disturb sediments.

Author Contributions

Conceptualization, Y.M.S.C. and F.C.S.; methodology, Y.M.S.C.; formal analysis, Y.M.S.C.; investigation, Y.M.S.C.; writing—original draft preparation, Y.M.S.C.; writing—review and editing, F.C.S.; supervision, F.C.S. All authors have read and agreed to the published version of the manuscript.

Funding

This research received no external funding.

Acknowledgments

Many people contributed to this study during the fieldwork, laboratory analysis, and data processing. We thank Karla Montañez for help in the lab and the field. We also wish to thank the Universidad del Turabo (now Ana G. Méndez University, Gurabo) for providing use of laboratory facilities, materials, and partial support for the research. We are grateful to Julia O’Hallorans for her assistance in the sediment analysis. Thanks so much also to Brenda Carolina Torres Velásquez for her support with statistical analyses. We especially appreciate the constructive comments provided by Rebeca de Jesús Crespo, Michael Ross, John Meeder, and the editors and reviewers of MDPI—Waters.

Conflicts of Interest

The authors declare no conflict of interest.

References

  1. Mesa, L.; Mayora, G.; Saigo, M.; Giri, F. Nutrient Dynamics in wetlands of the Middle Paraná River subjected to rotational cattle management. Wetlands 2015, 35, 1117–1125. [Google Scholar] [CrossRef]
  2. Mesa, L.M.; Maldini, C.; Mayora, G.; Saigo, M.; Marchese, M.; Giri, F. Decomposition of cattle manure and colonization by macroinvertebrates in sediment of the Middle Paraná River. J. Soils Sediments 2016, 16, 2319–2325. [Google Scholar] [CrossRef]
  3. Mitsch, W.J.; Gosselink, J.G. Wetland, 5th ed.; John Wiley & Sons: Hoboken, NJ, USA, 2015; pp. 477–501. [Google Scholar]
  4. Baustian, J.J.; Kowalski, K.P.; Czayka, A. Using turbidity measurements to estimate total phosphorus and sediment flux in a Great Lakes coastal wetland. Wetlands 2018, 38, 1059–1065. [Google Scholar] [CrossRef]
  5. González-Rivas, E.J.; Roldán-Pérez, G.; Tundisi, J.G.; Vammen, K.; Örmeci, B.; Forde, M. Eutrophication: A growing problem in the America and the Caribbean. Braz. J. Biol. 2020, 80, 388–389. [Google Scholar]
  6. Spring, D.A.; Croft, L.; Bond, N.R.; Cunningham, S.C.; Mac Nally, R.; Kompas, T. Institutional impediments to conservation of freshwater dependent ecosystems. Sci. Total Environ. 2018, 621, 407–416. [Google Scholar] [CrossRef]
  7. Paredes-Gutiérrez, M.; Torres-Velásquez, C.B.; Sánchez-Colón, Y.M.; Schaffner-Gibbs, F.C. Two mathematical approaches to study the phosphorus eutrophication of a wetland in Puerto Rico. Inge Cuc 2019, 15, 63–76. [Google Scholar] [CrossRef]
  8. Tong, Y.; Zhang, W.; Wang, X.; Couture, R.M.; Larssen, T.; Zhao, Y.; Li, J.; Liang, H.; Liu, X.; Bu, X.; et al. Decline in Chinese lake phosphorus concentration accompanied by shift in sources since 2006. Nat. Geosci. 2017, 10, 507–511. [Google Scholar] [CrossRef]
  9. De Jesús Crespo, R.; Lázaro, P.M.; Yee, S.H. Linking wetland ecosystem services to vector-borne disease: Dengue fever in the San Juan Bay Estuary, Puerto Rico. Wetlands 2018, 39, 1281–1293. [Google Scholar] [CrossRef]
  10. Jarvie, H.P.; Johnson, L.T.; Sharpley, A.N.; Smith, D.R.; Baker, D.B.; Bruuselma, T.W.; Confesor, R. Increased soluble phosphorus loads to Lake Erie: Unintended consequences of conservation practices? J. Environ. Qual. 2017, 46, 123–132. [Google Scholar] [CrossRef] [PubMed] [Green Version]
  11. Vollenweider, R.A. Advances in defining critical loading levels for phosphorus in lake eutrophication. Mem. Inst. Ital. Idrobiol. 1976, 33, 53–83. [Google Scholar]
  12. Vollenweider, R.A. Scientific Fundamentals of the Lutrophication of Lakes and Flowing Waters, with Particular Reference to Phosphorus and Nitrogen as Factors in Eutrophication; Report No. DAS/CSI/68.27; Organization for Economic Cooperation and Development (OECD): Paris, France, 1968. [Google Scholar]
  13. Vollenweider, R.A. Input-output models, with special reference to the phosphorus loading concept in limnology. Schweiz. Z. Hydrol. 1975, 37, 53–84. [Google Scholar]
  14. Ngatia, L.; Taylor, R. Phosphorus Eutrophication and Mitigation Strategies. In Phosphorus—Recovery and Recycling; Zhang, T., Ed.; IntechOpen: London, UK, 2019; ISBN 9781838810221. [Google Scholar]
  15. Schindler, D.W. The dilemma of controlling cultural eutrophication of lakes. Proc. R. Soc. B Biol. Sci. 2012, 279, 4322–4333. [Google Scholar] [CrossRef] [PubMed] [Green Version]
  16. Smolders, A.J.P.; Lamers, L.P.M.; Lucassen, E.C.H.E.T.; Van Der Velde, G.; Roelofs, J.G.M. Internal eutrophication: How it works and what to do about it—A review. Chem. Ecol. 2006, 22, 93–111. [Google Scholar] [CrossRef]
  17. Song, K.; Burgin, A.J. Eutrophication amplifies biological control on internal phosphorus loading in agricultural reservoirs. Ecosystems 2017, 20, 1483–1493. [Google Scholar] [CrossRef]
  18. Won Lee, H.; Seok Lee, Y.; Kim, J.; Jae Lim, K.; Hyun Choi, J. Contribution of internal nutrients loading on the water quality of a reservoir. Water 2019, 11, 1409. [Google Scholar]
  19. Kinsman-Costello, L. Effects of Water Level Fluctuations on Phosphorus, Iron, Sulfur, and Nitrogen Cycling in Shallow Freshwater Ecosystems. Ph.D. Thesis, Michigan State University, East Lansing, MI, USA, 2012. [Google Scholar]
  20. Kinsman-Costello, L.; O’Brien, J.M.; Hamilton, S.K. Natural stressor in uncontaminated sediments of shallow freshwaters: The prevalence of sulfide, ammonia, and reduced iron. Environ. Toxicol. Chem. 2015, 34, 467–479. [Google Scholar] [CrossRef] [Green Version]
  21. U.S. Fish and Wildlife Service. Laguna Cartagena Wildlife Refuge: Comprehensive Conservation Plan and Environment Assessment; USFWS: Washington, DC, USA, 2011. [Google Scholar]
  22. Schaffner, F.C. Accelerated terrestrialization of a subtropical lagoon: The role of agency mismanagement. In Proceedings of the 32nd Annual Conference on Ecosystems Creation and Restoration, Tampa, FL, USA, 27–28 October 2005. [Google Scholar]
  23. Sánchez-Colón, Y.M. Identifying nonpoint sources of phosphorus (P) and nitrogen (N) pollution and dynamics, internal eutrophication and anoxia variability at a tropical freshwater wetland (Laguna Cartagena, Puerto Rico). Ph.D. Thesis, Universidad del Turabo, Gurabo, PR, USA, 2015. [Google Scholar]
  24. Sánchez-Colón, Y.M. Effect of water level fluctuations and rainfall on phosphorus release and binding at a tropical freshwater wetland (Laguna Cartagena, PR). Master’s Thesis, Universidad del Turabo, Gurabo, PR, USA, 2012. [Google Scholar]
  25. Sánchez-Colón, Y.M.; Schaffner, F.C. The dynamics of total and soluble reactive phosphorus in a seasonal eutrophic, tropical freshwater. Ambientis 2017, 2, 2–7. [Google Scholar]
  26. APHA American Public Health Association; American Water Works Association; Water Environment Federation. Standard Methods for the Examination of Water and Wastewater, 22nd ed.; Joint Editorial Board: Baltimore, MD, USA, 2017; p. 1546. [Google Scholar]
  27. Bostic, E.M.; White, J.R. Soil phosphorus and vegetation influence on wetland phosphorus release after simulated drought. Soil Sci. Soc. Am. J. 2007, 71, 238–244. [Google Scholar] [CrossRef]
  28. Pant, H.K.; Reddy, K.R. Hydrologic influence on stability of organic phosphorus in wetland detritus. J. Environ. Qual. 2001, 30, 368–674. [Google Scholar] [CrossRef]
  29. Kinsman-Costello, L.; O’Brien, J.; Hamilton, S.K. Re-flooding a historically drained wetland leads to rapid sediment phosphorus release. Ecosystems 2014, 17, 641–656. [Google Scholar] [CrossRef]
  30. Correll, D.L. Phosphorus: A rate limiting nutrient in surface waters. Poult. Sci. J. 1999, 78, 674–682. [Google Scholar] [CrossRef] [PubMed]
  31. Reddy, K.R.; Fisher, M.M.; Wang, Y.; White, J.R.; James, R.T. Potential effects of sediment dredging on internal phosphorus loading in a shallow, subtropical lake. Lake Reserv. Manag. 2007, 23, 27–38. [Google Scholar] [CrossRef] [Green Version]
  32. Banaszuk, P.; Wysocka-Czubaszek, A.; Kamocki, A.K. Internal eutrophication of restored peatland stream: The role of bed sediments. Ecol. Eng. 2011, 37, 260–268. [Google Scholar] [CrossRef]
  33. Bartoszek, L.; Tomaszek, J.A. Phosphorus distribution in the bottom sediments of the Solina-Myczkowce Reservoirs. Environ. Prot. Eng. 2007, 33, 25–32. [Google Scholar]
  34. Dieter, D.; Herzog, C.; Hupfer, M. Effects of drying on phosphorus uptake in re-flooded lake sediments. Environ. Sci. Pollut. Res. 2015, 22, 17065–17081. [Google Scholar] [CrossRef]
  35. Jing, L.; Liu, X.; Bai, S.; Wu, C.; Ao, H.; Liu, J. Effects of sediment dredging on internal phosphorus: A comparative field study focused on iron and phosphorus forms in sediments. Ecol. Eng. 2015, 82, 267–271. [Google Scholar] [CrossRef]
  36. Yu, J.; Ding, S.; Zhong, J.; Fan, C.; Chen, Q.; Yin, H.; Zhang, L.; Zhang, Y. Evaluations of simulated dredging to control internal phosphorus release from sediments: Focused on phosphorus transfer and resupply across the sediment—Water interface. Sci. Total Environ. 2017, 592, 662–673. [Google Scholar] [CrossRef]
  37. Chang, M.; Cui, J.; Lin, J.; Ding, S.; Gong, M.; Ren, M.; Tsang, D.C.W. Successful control of internal phosphorus loading after sediment dredging for 6 years: A field assessment using high-resolution sampling techniques. Sci. Total Environ. 2018, 616, 927–936. [Google Scholar]
  38. White, J.R.; Gardner, L.M.; Sees, M.; Corstanje, R. The short term effects of prescribed burning on biomass removal and the release of nitrogen and phosphorus in a treatment wetland. J. Environ. Qual. 2008, 37, 2386–2391. [Google Scholar] [CrossRef]
  39. Havens, K.E.; James, R.T.; East, T.L.; Smith, V.H. N:P ratios, light limitation, and cyanobacterial dominance in a subtropical lake impacted by non-point source nutrient pollution. Environ. Pollut. 2003, 122, 379–390. [Google Scholar] [CrossRef]
  40. Li, X.; Guo, M.; Duan, X.; Zhao, J.; Hua, Y.; Zhou, Y.; Liu, G.; Dionysiou, D.D. Distribution of organic phosphorus species in sediment profiles of shallow lakes and its effect on photo-release of phosphate during sediment resuspension. Environ. Int. 2019, 130, 104916. [Google Scholar] [CrossRef] [PubMed]
  41. Zhang, K.; Cheng, P.; Zhong, B.; Wand, D. Total phosphorus release from bottom sediments in flowing water. J. Hydrodyn. Ser. B 2012, 24, 589–594. [Google Scholar] [CrossRef]
  42. Xiao, Y.; Chang, H.; Yu, W.; Ll, Z. Effects of water flow on the uptake of phosphorus by sediments: An experimental investigation. J. Hydrodyn. Ser. B 2016, 28, 329–332. [Google Scholar] [CrossRef]
  43. Smith, R.L.; Smith, T.M. Ecología, 6th ed.; Pearson Education: Madrid, Spain, 2007; pp. 704–776. [Google Scholar]
Figure 1. Location of Laguna Cartagena (USGS (US Geological Survey) San German Quadrangle). The shaded area denotes the water surface level (the 10 m contour) at the time of the 1982 update. (a) Inlet to the lagoon (combined inlet canal, the Principal Drainage Canal adjacent to the town of Magüayo and (b) the outlet (exit canal) within the lagoon. The dashed blue line indicates the jurisdictional limits of the National Wildlife Refuge around the lagoon.
Water 13 00449 g001
Figure 2. Monthly rainfall for Lajas Puerto Rico, for August 2010 to September 2011.
Water 13 00449 g002
Figure 3. Monthly rainfall for Lajas Puerto Rico, for September 2013 to November 2014.
Water 13 00449 g003
Figure 4. Fluctuations in water levels (% fill) at Laguna Cartagena during (a) Phase One of the study (31 July 2010 through 2 October 2011) and (b) Phase Two of the study (28 July 2013 through 2 November 2014). The nominal maximum depth is 2.0 m (100% fill), from the lagoon bottom at the 9 m contour, to the maximum lagoon surface elevation at the 11 m contour.
Water 13 00449 g004
Figure 5. Dissolved oxygen (DO) from combined inlet and the lagoon’s outlet for the period of: (a) 29 December 2010 to 4 September 2011 (Phase One) and (b) 15 December 2013 to 2 November 2014 (Phase Two).
Water 13 00449 g005
Figure 6. Nitrogen (nitrate, nitrite, and ammonia) from combined inlet and the lagoon’s outlet for the period of: (a) 19 December 2010 to 4 September 2011 (Phase One) and (b) 23 February 2014 to 2 November 2014 (Phase Two). (*)Values are treated as zero (0) or if the measurable absorbance is less than the calibration range of the test.
Water 13 00449 g006
Figure 7. Source and Sink dynamics at Laguna Cartagena from 19 September 2010 to 4 September 2011 (pre-dredging Phase One) and from 13 October 2013 to 2 November 2014 (post-dredging, Phase Two).
Water 13 00449 g007
Figure 8. Soluble reactive phosphorus (SRP) and total phosphorus (TP) concentrations (µg/L) measured at the combined inlet from 19 August 2010 to 4 September 2011 and from 13 October 2013 to 2 November 2014.
Water 13 00449 g008
Figure 9. Soluble reactive phosphorus (SRP) and total phosphorus (TP) concentrations (µg/L) measured at the lagoon’s outlet from 19 August 2010 to 4 September 2011 and from 13 October 2013 to 2 November 2014.
Water 13 00449 g009
Figure 10. Soluble reactive phosphorus (SRP) and total phosphorus (TP) concentrations (µg/L) measured at combined inlet near Magüayo for common sampling dates during (a) 2010–2011 and (b) 2013–2014.
Water 13 00449 g010
Figure 11. Soluble reactive phosphorus (SRP) and total phosphorus (TP) concentrations (µg/L) measured at the lagoon outlet for common sampling dates during (a) 2010–2011 and (b) 2013–2014.
Water 13 00449 g011
Table 1. Means of physical–chemical parameters monitored at Laguna Cartagena.
LocationDO (mg/L)pHTDS (mg/L)Temp (°C)Turbidity (cm) *
Lagoon Inlet
2010–20110.34 ± 0.207.1 ± 0.6325 ± 15725.5 ± 2.149.0 ± 25
2013–20141.80 ± 1.47.2 ± 0.3255 ± 6526.5 ± 1.968.9 ± 27
Lagoon Outlet
2010–20110.43 ± 0.406.9 ± 0.5243 ± 9327.2 ± 3.033.6 ± 13
2013–20143.59 ± 2.97.0 ± 1.2459 ± 20327.6 ± 2.740.0 ± 19
* Observation tube method. Higher numbers denote greater clarity, less turbidity.
Table 2. Analysis for consolidated bottom substrate and flocculence from the center mat and cattail (Typha domingensis) areas in the lagoon.
Location pH%TKPPavailable
(µg/L)
%TKNNH3
(µg/L)
N O 3
(µg/L)
N O 2
(µg/L)
Consolidate bottom substrate
Center cattails2010–114.160.0977500.39220,00034,000ND*
2013–143.860.1735,0000.5480,000ND*ND*
Flocculence associated with floating islands
Center cattails2010–112.820.2150,7200.7063,00010001000
2013–144.300.0813,0000.98163, 000ND*ND*
Results of substrate samples (consolidate and flocculence) from 9 April 2011 and 10 August 2014 were processed by Central Analytical Laboratory of the University of Puerto Rico’s Agricultural Experimental Station [23,24]. ND* = Not detectable.
Publisher’s Note: MDPI stays neutral with regard to jurisdictional claims in published maps and institutional affiliations.

