
Structural and Functional Variations of the Macrobenthic Community of the Adige Basin along the River Continuum

 ,
,  ,
,  , and
, and
Abstract
:1. Introduction
2. Materials and Methods
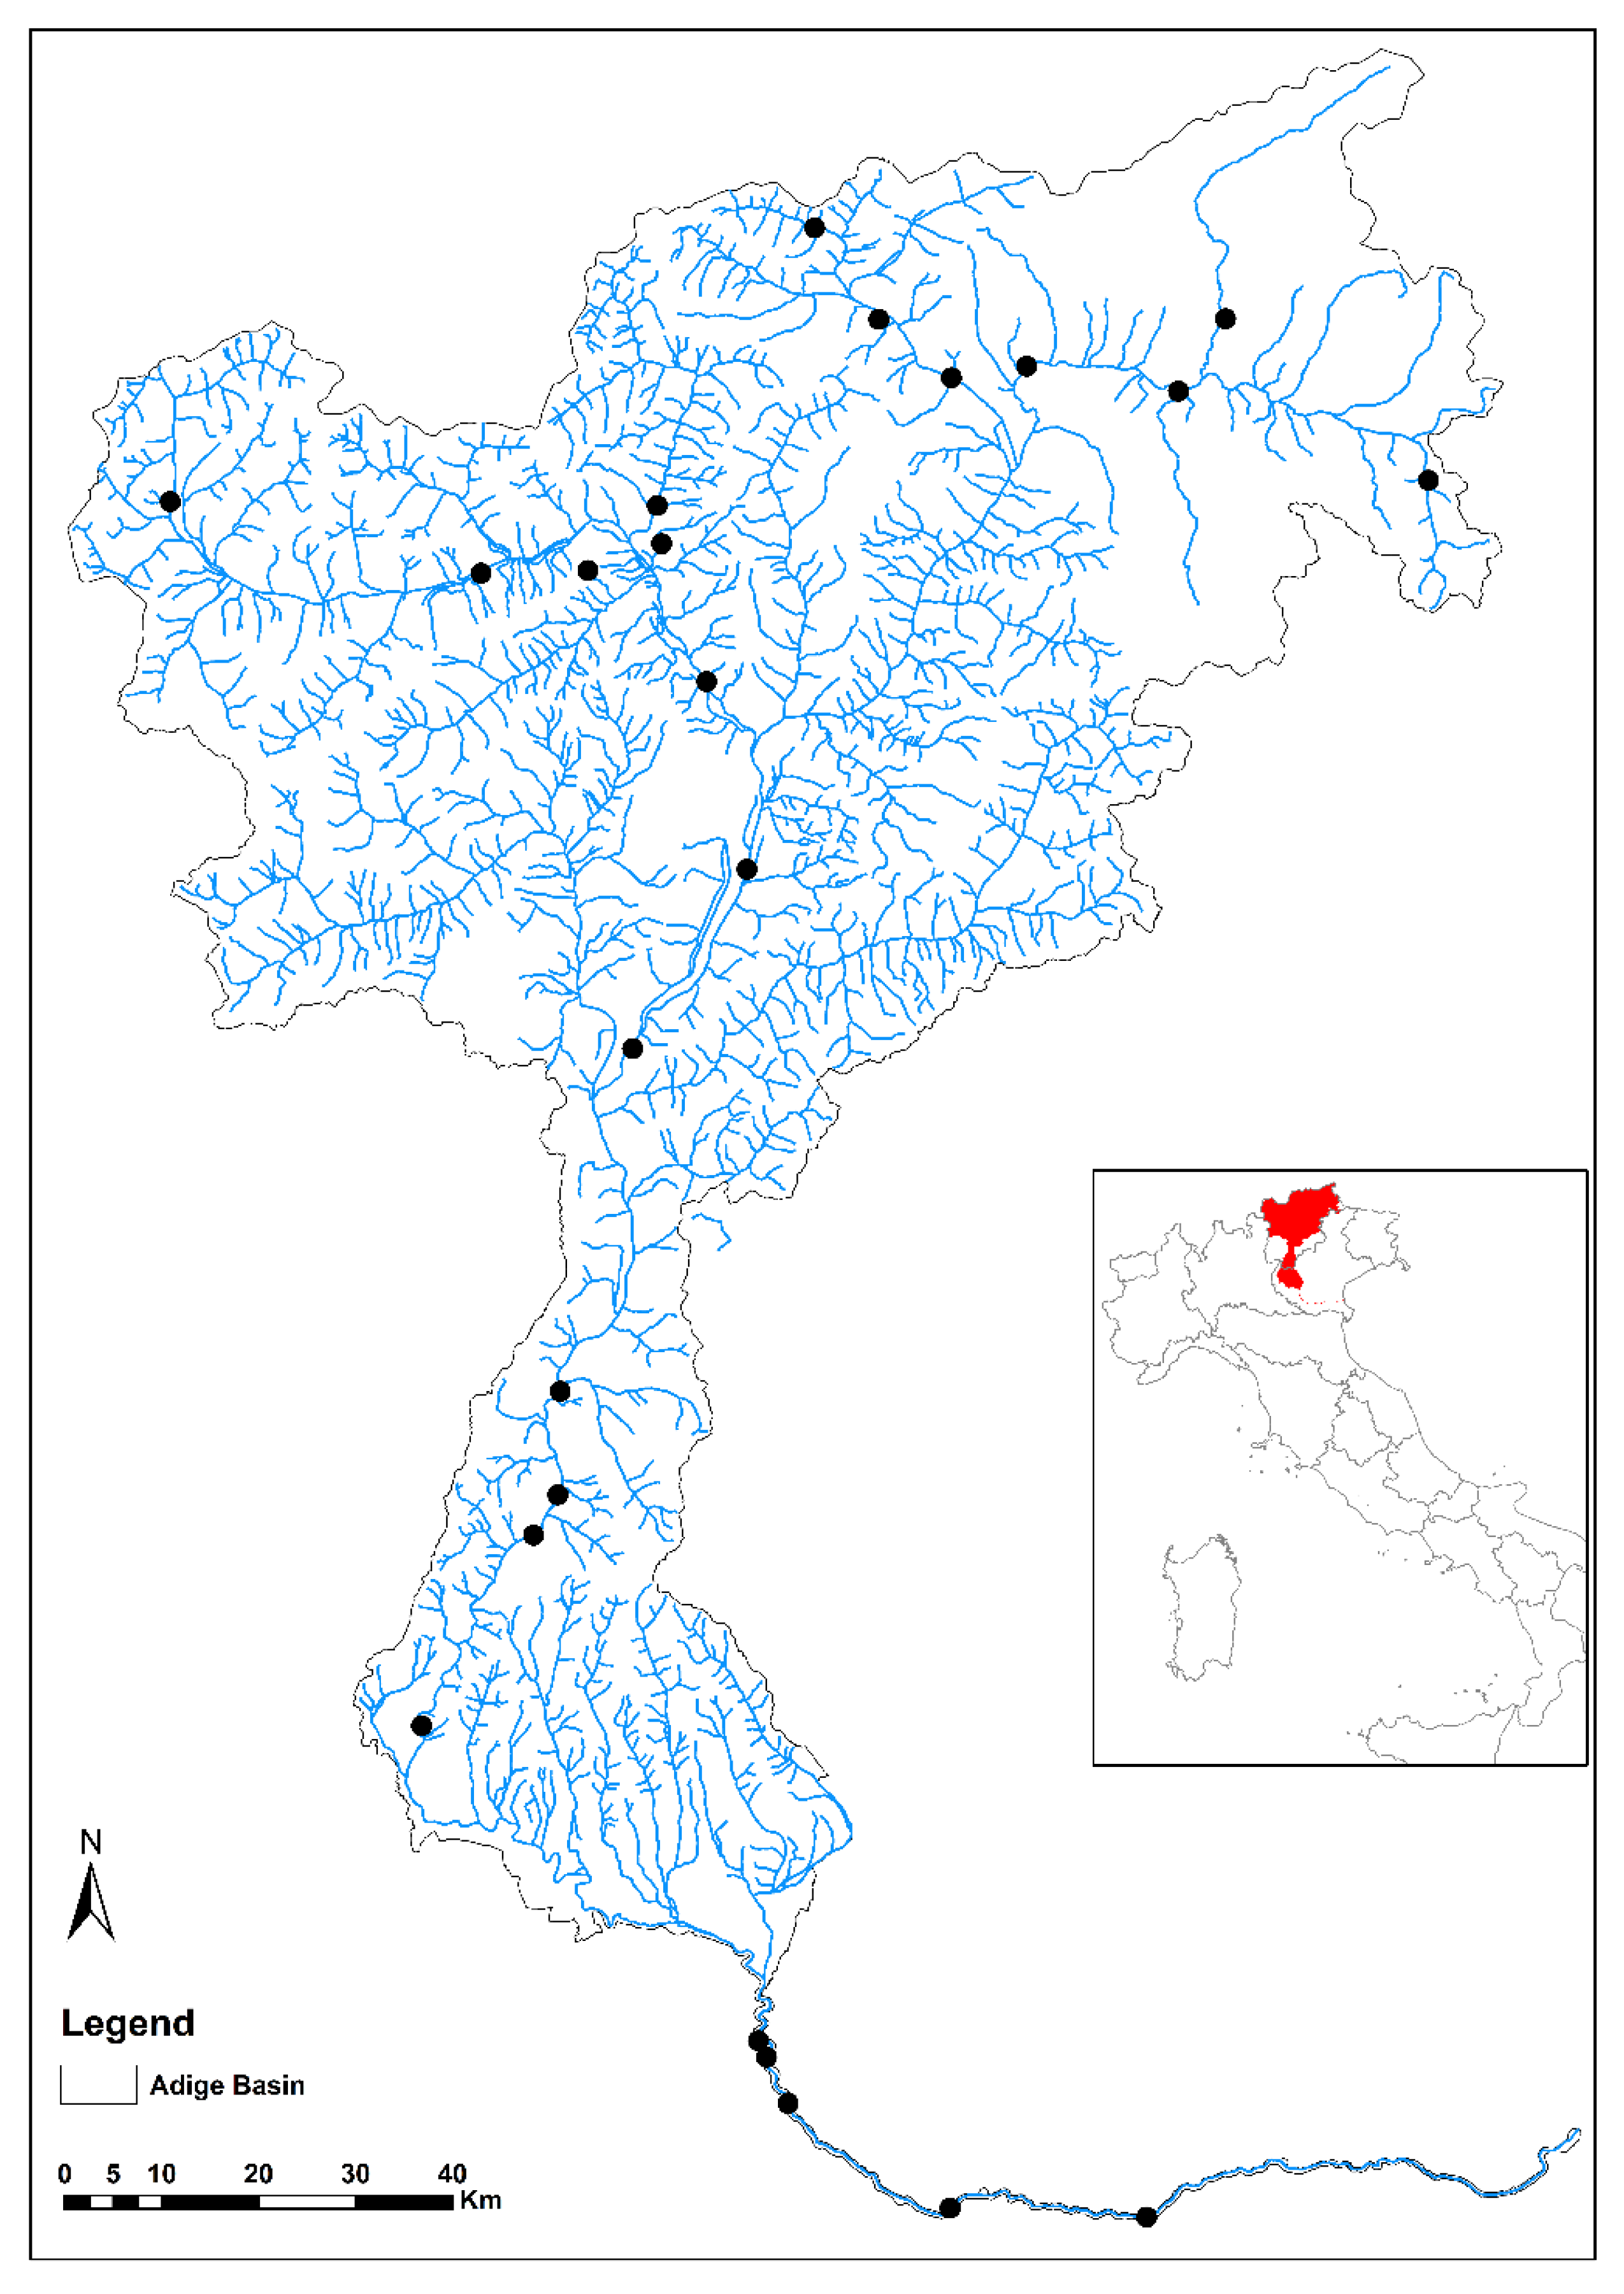
2.1. Study Area
2.2. Sampling Methodology, Community Indices and Environmental Descriptors
2.3. Methods of Analysis
3. Results
4. Discussion
Author Contributions
Funding
Institutional Review Board Statement
Informed Consent Statement
Data Availability Statement
Conflicts of Interest
References
- Water Framework Directive. Directive 2000/60/EC of the European Parliament and of the Council of 23 October 2000 Estab-lishing a Framework for Community Action in the Field of Water Policy. 2000. Available online: https://eur-lex.europa.eu/legal-content/EN/TXT/?uri=CELEX%3A32000L0060 (accessed on 1 November 2020).
- Vannote, R.L.; Minshall, G.W.; Cummins, K.W.; Sedell, J.R.; Cushing, C.E. The river continuum concept. Can. J. Fish. Aquat. Sci. 1980, 37, 130–137. [Google Scholar] [CrossRef]
- Doretto, A.; Piano, E.; Larson, C.E. The River Continuum Concept: Lessons from the past and perspectives for the future. Can. J. Fish. Aquat. Sci. 2020, 77, 1853–1864. [Google Scholar] [CrossRef]
- Brown, B.L.; Swan, C.M.; Auerbach, D.A.; Campbell Grant, E.H.; Hitt, N.P.; Maloney, K.O.; Patrick, C. Metacommunity theory as a multispecies, multiscale framework for studying the influence of river network structure on riverine communities and ecosystems. J. N. Am. Benthol. Soc. 2011, 30, 310–327. [Google Scholar] [CrossRef]
- Junk, W.J.; Bayley, P.B.; Sparks, R.E. The flood pulse concept in river-floodplain systems.pdf. Can. J. Fish. Aquat. Sci. 1989, 106, 110–127. [Google Scholar]
- Ward, J.V.; Stanford, J.A. The serial discontinuity concept: Extending the model to floodplain rivers. Regul. Rivers Res. Manag. 1995, 10, 156–168. [Google Scholar] [CrossRef]
- Thorp, J.H.; Thoms, M.C.; Delong, M.D. The riverine ecosystem synthesis: Biocomplexity in river networks across space and time. River Res. Appl. 2006, 22, 123–147. [Google Scholar] [CrossRef]
- Benda, L.; Poff, N.L.; Miller, D.; Dunne, T.; Reeves, G.; Pess, G.; Pollock, M. The network dynamics hypothesis: How channel networks structure riverine habitats. Bioscience 2004, 55, 413–427. [Google Scholar] [CrossRef] [Green Version]
- Schmera, D.; Árva, D.; Boda, P.; Bódis, E.; Bolgovics, Á.; Borics, G.; Csercsa, A.; Deák, C.; Krasznai, E.; Lukács, B.A.; et al. Does isolation influence the relative role of environmental and dispersal-related processes in stream networks? An empirical test of the network position hypothesis using multiple taxa. Freshw. Biol. 2018, 63, 74–85. [Google Scholar] [CrossRef]
- Curtis, W.J.; Gebhard, A.E.; Perkin, J.S. The river continuum concept predicts prey assemblage structure for an insectivorous fish along a temperate riverscape. Freshw. Sci. 2018, 37, 618–630. [Google Scholar] [CrossRef] [Green Version]
- Larsen, S.; Bruno, M.C.; Vaughan, I.P.; Zolezzi, G. Testing the River Continuum Concept with geostatistical stream-network models. Ecol. Complex. 2019, 39, 100773. [Google Scholar] [CrossRef] [Green Version]
- Jiang, X.; Xiong, J.; Xie, Z.; Chen, Y. Longitudinal patterns of macroinvertebrate functional feeding groups in a Chinese river system: A test for river continuum concept (RCC). Quat. Int. 2011, 244, 289–295. [Google Scholar] [CrossRef]
- Wallace, J.B.; Webster, J.R. The role of macroinvertebrates in stream ecosystem function. Annu. Rev. Entomol. 1996, 41, 115–139. [Google Scholar] [CrossRef]
- Covich, A.P.; Palmer, M.A.; Crowl, T.A. The role of benthic invertebrate species in freshwater ecosystems: Zoobenthic species influence energy flows and nutrient cycling. Bioscience 1999, 49, 119–127. [Google Scholar] [CrossRef] [Green Version]
- Muresan, A.N.; Gaglio, M.; Aschonitis, V.; Nobili, G.; Castaldelli, G.; Fano, E.A. Structural and functional responses of macroinvertebrate communities in small wetlands of the Po delta with different and variable salinity levels. Estuar. Coast. Shelf Sci. 2020, 238, 106726. [Google Scholar] [CrossRef]
- Rosser, Z.C.; Pearson, R.G. Hydrology, hydraulics and scale influence macroinvertebrate responses to disturbance in tropical streams. J. Freshw. Ecol. 2018, 33, 1–17. [Google Scholar] [CrossRef] [Green Version]
- Permanent Secretariat of the Alpine Convention. Alpine Convention Water and Water Management Issues: Report on the State of the Alps; Permanent Secretariat of the Alpine Convention: Innsbruck, Austria, 2009; ISBN 978-8-89-043483-9. [Google Scholar]
- Pollice, A.; Jona-Lasinio, G.; Gaglio, M.; Blanchet, F.G.; Fano, E.A. Modelling the effect of directional spatial ecological processes for a river network in Northern Italy. Ecol. Indic. 2020, 112, 106144. [Google Scholar] [CrossRef]
- Gaglio, M.; Aschonitis, V.; Castaldelli, G.; Fano, E.A. Land use intensification rather than land cover change affects regulating services in the mountainous Adige river basin (Italy). Ecosyst. Serv. 2020, 45, 101158. [Google Scholar] [CrossRef]
- Chiogna, G.; Majone, B.; Cano Paoli, K.; Diamantini, E.; Stella, E.; Mallucci, S.; Lencioni, V.; Zandonai, F.; Bellin, A. A review of hydrological and chemical stressors in the Adige catchment and its ecological status. Sci. Total Environ. 2016, 540, 429–443. [Google Scholar] [CrossRef] [PubMed] [Green Version]
- Braioni, M.G. Faunistic research in a fluvial ecosystem study: The case of the River Adige. Bolletino di Zool. 1994, 61, 415–424. [Google Scholar] [CrossRef] [Green Version]
- Pavoni, B.; Duzzin, B.; Donazzolo, R. Contamination by chlorinated hydrocarbons (DDT, PCBs) in surface sediment and macrobenthos of the river Adige (Italy). Sci. Total Environ. 1987, 65, 21–39. [Google Scholar] [CrossRef]
- Duzzin, B.; Pavoni, B.; Donazzolo, R. Macroinvertebrate communities and sediments as pollution indicators for heavy metals in the river Adige (Italy). Water Res. 1988, 22, 1353–1363. [Google Scholar] [CrossRef]
- Giulivo, M.; Stella, E.; Capri, E.; Esnaola, A.; López de Alda, M.; Diaz-Cruz, S.; Mandaric, L.; Muñoz, I.; Bellin, A. Assessing the effects of hydrological and chemical stressors on macroinvertebrate community in an Alpine river: The Adige River as a case study. River Res. Appl. 2019, 35, 78–87. [Google Scholar] [CrossRef]
- De Castro-Català, N.; Dolédec, S.; Kalogianni, E.; Skoulikidis, N.T.; Paunovic, M.; Vasiljević, B.; Sabater, S.; Tornés, E.; Muñoz, I. Unravelling the effects of multiple stressors on diatom and macroinvertebrate communities in European river basins using structural and functional approaches. Sci. Total Environ. 2020, 742, 140543. [Google Scholar] [CrossRef] [PubMed]
- Laliberté, E.; Legendre, P. A distance-based framework for measuring functional diversity from multiple traits. Ecology 2010, 91, 299–305. [Google Scholar] [CrossRef] [PubMed]
- MarLIN BIOTIC - Biological Traits Information Catalogue. Available online: www.marlin.ac.uk/biotic (accessed on 7 February 2021).
- Thorp, J.H.; Covich, A.P. Ecology and Classification of North American Freshwater Invertebrates; Accademic Press: Cambridge, MA, USA, 2010; ISBN 9780123748553. [Google Scholar]
- Krumbein, W.C.; Sloss, L.L. Stratigraphy and Sedimentation; Freeman: San Francisco, CA, USA, 1963. [Google Scholar]
- Armstrong, F.A.J.; Stearns, C.R.; Strickland, J.D.H. The measurement of upwelling and subsequent biological process by means of the Technicon Autoanalyzer® and associated equipment. Deep. Res. Oceanogr. Abstr. 1967, 14, 381–389. [Google Scholar] [CrossRef]
- American Public Health Association (APHA). American Public Health Association Method 3112: Standard Methods for the Examination of Water and Wastewater, 18th ed.; Greenberg, A., Clesceri, L.S., Eaton, A.D., Eds.; APHA: Washington, DC, USA, 1992. [Google Scholar]
- Bower, C.E.; Holm-Hansen, T. A Salicylate–Hypochlorite Method for Determining Ammonia in Seawater. Can. J. Fish. Aquat. Sci. 1980, 37, 794–798. [Google Scholar] [CrossRef]
- Henriques-Oliveira, A.L.; Nessimian, J.L. Aquatic macroinvertebrate diversity and composition in streams along an altitudinal gradient in Southeastern Brazil. Biota Neotrop. 2010, 10, 115–128. [Google Scholar] [CrossRef] [Green Version]
- Wang, Y.; Liu, J.J.; Liu, W.; Feng, Q.; Li, B.L.; Lu, H.; Wang, S. Spatial variation in macrobenthic assemblages and their relationship with environmental factors in the upstream and midstream regions of the Heihe River Basin, China. Environ. Monit. Assess. 2021, 193, 1–22. [Google Scholar] [CrossRef]
- Chiogna, G.; Skrobanek, P.; Narany, T.S.; Ludwig, R.; Stumpp, C. Effects of the 2017 drought on isotopic and geochemical gradients in the Adige catchment, Italy. Sci. Total Environ. 2018, 645, 924–936. [Google Scholar] [CrossRef]
- Botta-Dukát, Z. Rao’s quadratic entropy as a measure of functional diversity based on multiple traits. J. Veg. Sci. 2005, 16, 533–540. [Google Scholar] [CrossRef]
- Pakeman, R.J. Functional trait metrics are sensitive to the completeness of the species’ trait data? Methods Ecol. Evol. 2014, 5, 9–15. [Google Scholar] [CrossRef]
- Rezende, R.S.; Santos, A.M.; Henke-Oliveira, C.; Gonçalves, J.F. Effects of spatial and environmental factors on benthic a macroinvertebrate community. Zoologia 2014, 31, 426–434. [Google Scholar] [CrossRef] [Green Version]
- Aschonitis, V.G.; Feld, C.K.; Castaldelli, G.; Turin, P.; Visonà, E.; Fano, E.A. Environmental stressor gradients hierarchically regulate macrozoobenthic community turnover in lotic systems of Northern Italy. Hydrobiologia 2016, 765, 131–147. [Google Scholar] [CrossRef]
- Stendera, S.; Adrian, R.; Bonada, N.; Cañedo-Argüelles, M.; Hugueny, B.; Januschke, K.; Pletterbauer, F.; Hering, D. Drivers and stressors of freshwater biodiversity patterns across different ecosystems and scales: A review. Hydrobiologia 2012, 696, 1–28. [Google Scholar] [CrossRef]
- Calabrese, S.; Mezzanotte, V.; Marazzi, F.; Canobbio, S.; Fornaroli, R. The influence of multiple stressors on macroinvertebrate communities and ecosystem attributes in Northern Italy pre-Alpine rivers and streams. Ecol. Indic. 2020, 115, 106408. [Google Scholar] [CrossRef]


| Groups | Taxonomic Level | Abbreviation | Groups | Taxonomic Level | Abbreviation | ||
|---|---|---|---|---|---|---|---|
| Hyrudinea | Dina | Erp | Heteroptera | F | Corixidae | Cori | |
| Glossiphonia | Glo | Odonata | Coneagrion | Coe | |||
| Oligochaeta | F | Lumbricidae | Lum | Plecoptera | Capnia | Cap | |
| F | Naididae | Nai | Chloroperla | Chl | |||
| Trombidiformes | F | Hydracarina | Hyd | Leuctra | Leu | ||
| Amphipoda | Gammarus | Gam | Nemoura | Nem | |||
| Isopoda | Asellus | Ase | Dinocras | Per | |||
| Coleoptera | Dytiscus | Dyt | Isoperla | Perl | |||
| Esolus | Elm | Taeniopterix | Tae | ||||
| Limnius | Elmi | Trichoptera | Brachycentrus | Bra | |||
| Hydraena | Hydra | F | Glossosomatidae | Glo | |||
| Berosus | Hydro | Hydropsyche | Hydrops | ||||
| Diptera | Anthomyia | Ant | Hydroptila | Hytrop | |||
| Atherix | Ath | Lepidostoma | Lep | ||||
| Blepharicera | Ble | Allogamus | Limn | ||||
| Bezzia | Cer | Philopotamus | Phi | ||||
| SF | Chironominae | Chi | Polycentropus | Pol | |||
| T | Corynoneurini | Cor | F | Psychomiidae | Psyc | ||
| F | Dolichopodidae | Dol | Rhyacophila | Rhy | |||
| F | Empididae | Emp | Sericostoma | Ser | |||
| Hexatoma | Lim | Bivalvia | Sphaerium | Sph | |||
| SF | Orthocladiinae | Ort | Gasteropoda | Aplexa | Phy | ||
| SF | Prodiamesinae | Pro | Bithynella | Bit | |||
| Pericoma | Psy | Lymnea | Lym | ||||
| Simulium | Sim | Theodoxus | Ner | ||||
| SF | Tanypodinae | Tan | Planorbis | Pla | |||
| Tanytarsus | Tany | Valvata | Val | ||||
| Tipula | Tip | Nematoda | P | Nem | |||
| Ephemeroptera | Baetis | Bae | Turbellaria | Dugesia | Dug | ||
| Caenis | Cae | Planaria | Plan | ||||
| Ephemerella | Eph | Polycelis | Den | ||||
| Ecdyonurus | Hep | ||||||
| Parameter | Unit | Abbreviation | Max | Min | Mean | St.Dev. |
|---|---|---|---|---|---|---|
| Altitude | m a.s.l. | Alt | 1270 | 8 | 449.58 | 411.27 |
| Granulometry | φ | Gran | 5 | −7 | 0.46 | 3.86 |
| Nitrate concentration | mg L−1 | NO3− | 1.58 | 0.08 | 0.47 | 0.31 |
| Ammonia concentration | mg L−1 | NH4+ | 361.73 | 11 | 61.16 | 77.54 |
| Distance from spring | km | Dist | 356 | 10 | 132.38 | 116.29 |
| Streambed width | m | Width | 125 | 2 | 58.33 | 49.86 |
| Water Depth | cm | Depth | 105 | 15 | 57.71 | 36.56 |
| Temperature | °C | Temp | 18.8 | 6.8 | 13.32 | 3.61 |
| Oxygen concentration | mg L−1 | O2 | 11.02 | 7.5 | 9.52 | 0.77 |
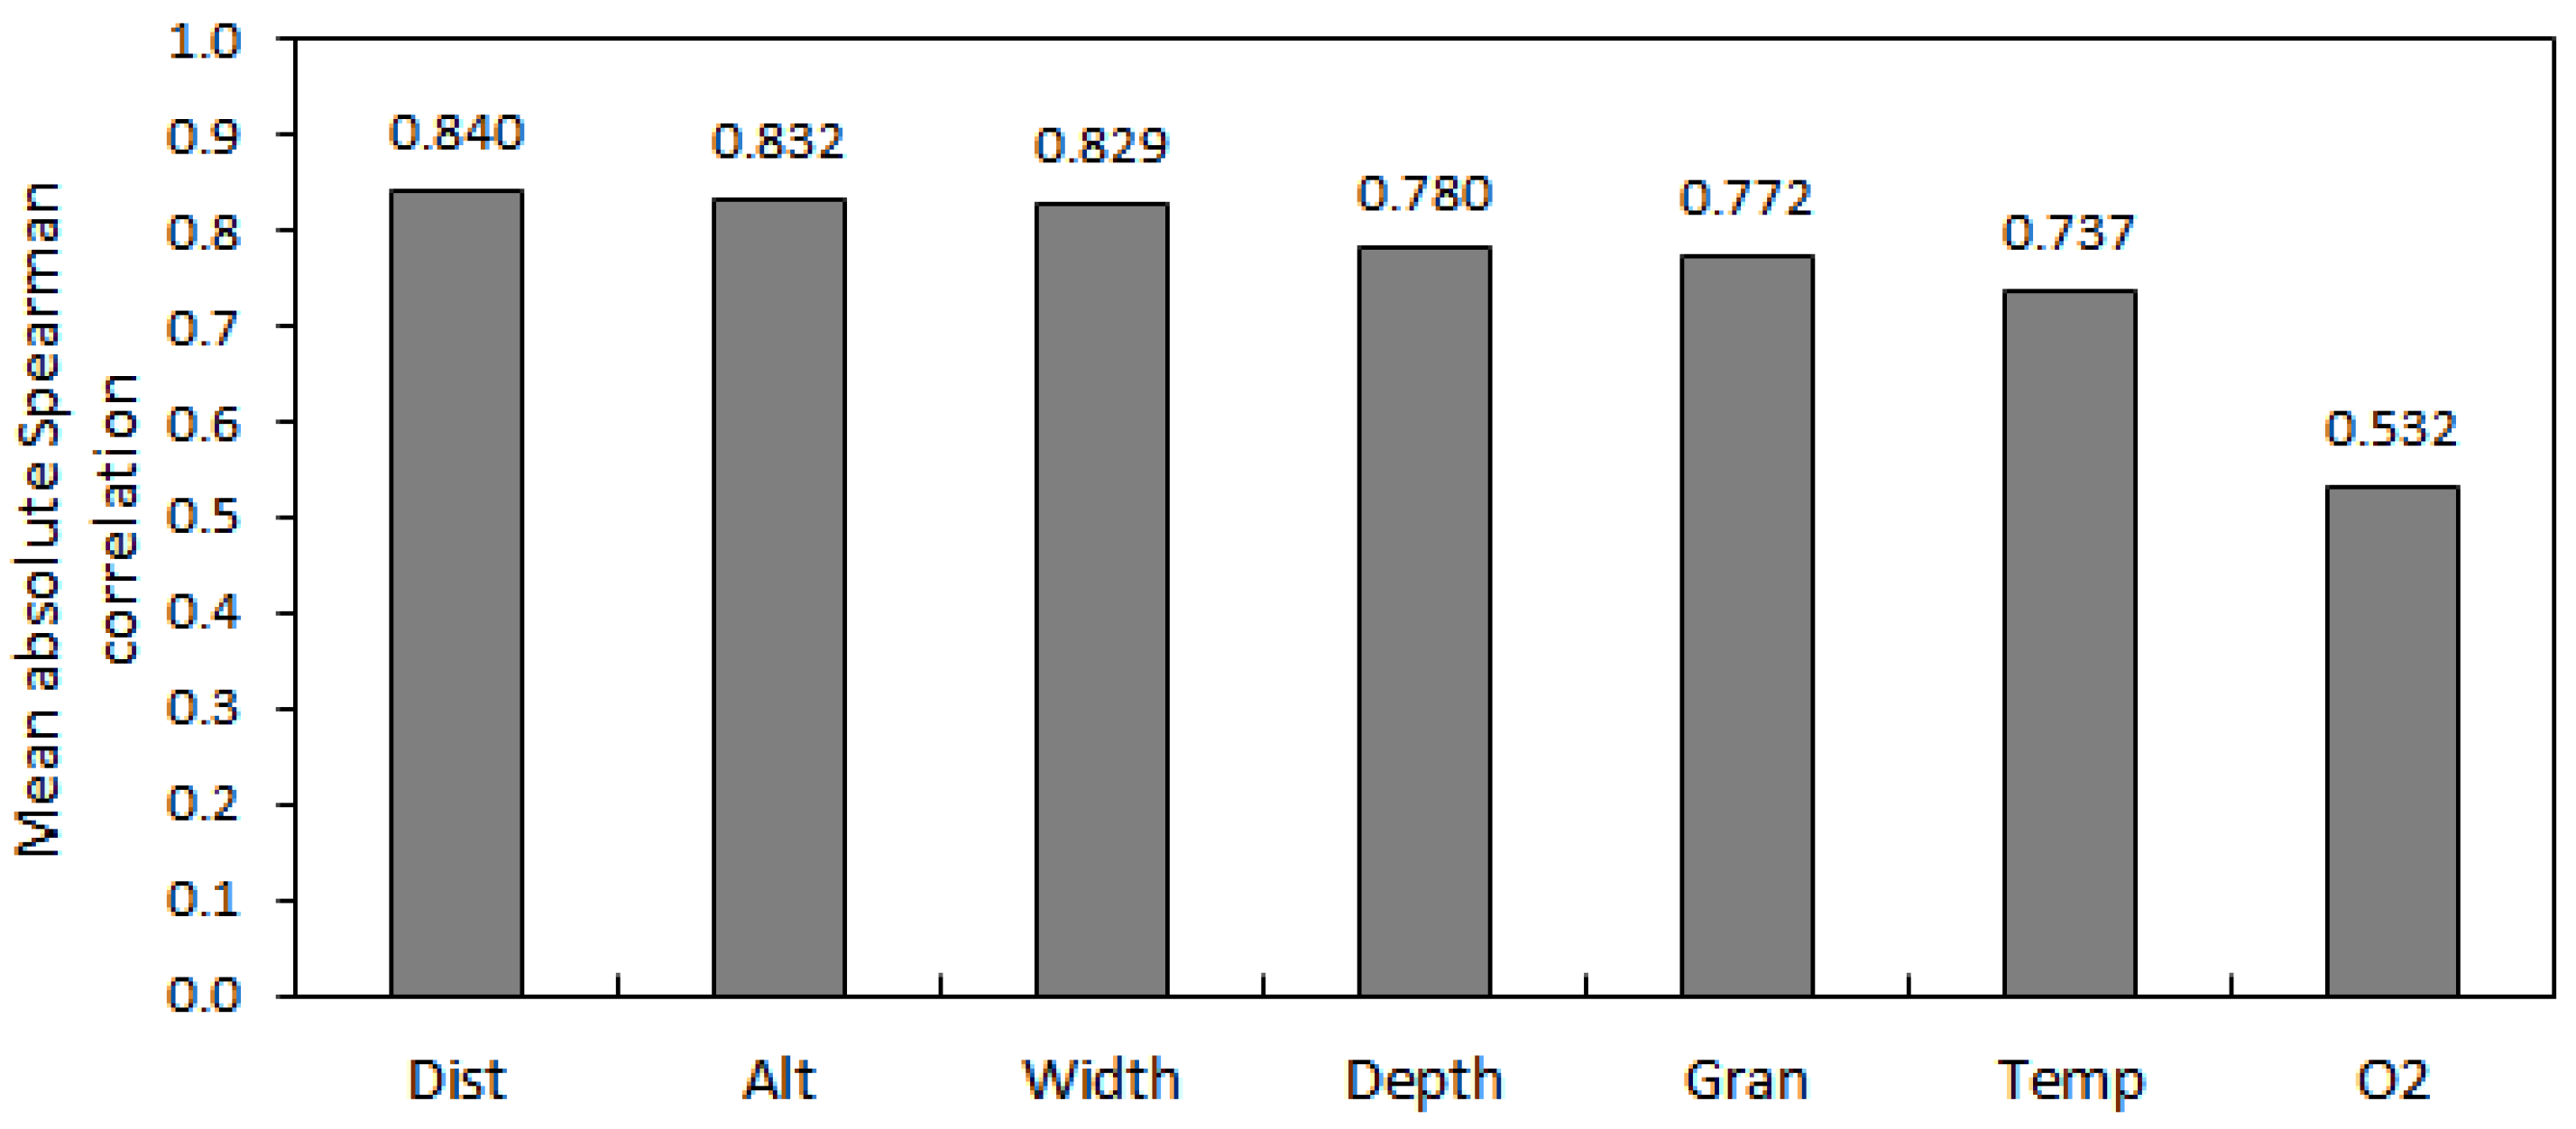
| p | Alt | Gran | NO3− | NH4+ | Dist | Width | Depth | Temp | O2 | |
|---|---|---|---|---|---|---|---|---|---|---|
| r | ||||||||||
| Alt | - | <0.001 | 0.283 | 0.329 | <0.001 | <0.001 | <0.001 | <0.001 | 0.015 | |
| Gran | −0.844 | - | 0.557 | 0.359 | <0.001 | <0.001 | <0.001 | 0.001 | 0.013 | |
| NO3− | 0.224 | −0.122 | - | 0.213 | 0.296 | 0.180 | 0.306 | 0.917 | 0.248 | |
| NH4+ | −0.204 | 0.191 | 0.260 | - | 0.260 | 0.237 | 0.231 | 0.177 | 0.351 | |
| Dist | −0.975 | 0.889 | −0.218 | 0.235 | - | <0.001 | <0.001 | <0.001 | 0.008 | |
| Width | −0.958 | 0.898 | −0.280 | 0.246 | 0.955 | - | <0.001 | 0.001 | 0.019 | |
| Depth | −0.904 | 0.797 | −0.214 | 0.250 | 0.880 | 0.949 | - | 0.001 | 0.042 | |
| Temp | −0.803 | 0.686 | −0.022 | 0.282 | 0.786 | 0.723 | 0.726 | - | 0.001 | |
| O2 | 0.507 | −0.519 | 0.241 | −0.195 | −0.555 | −0.488 | −0.423 | −0.699 | - | |
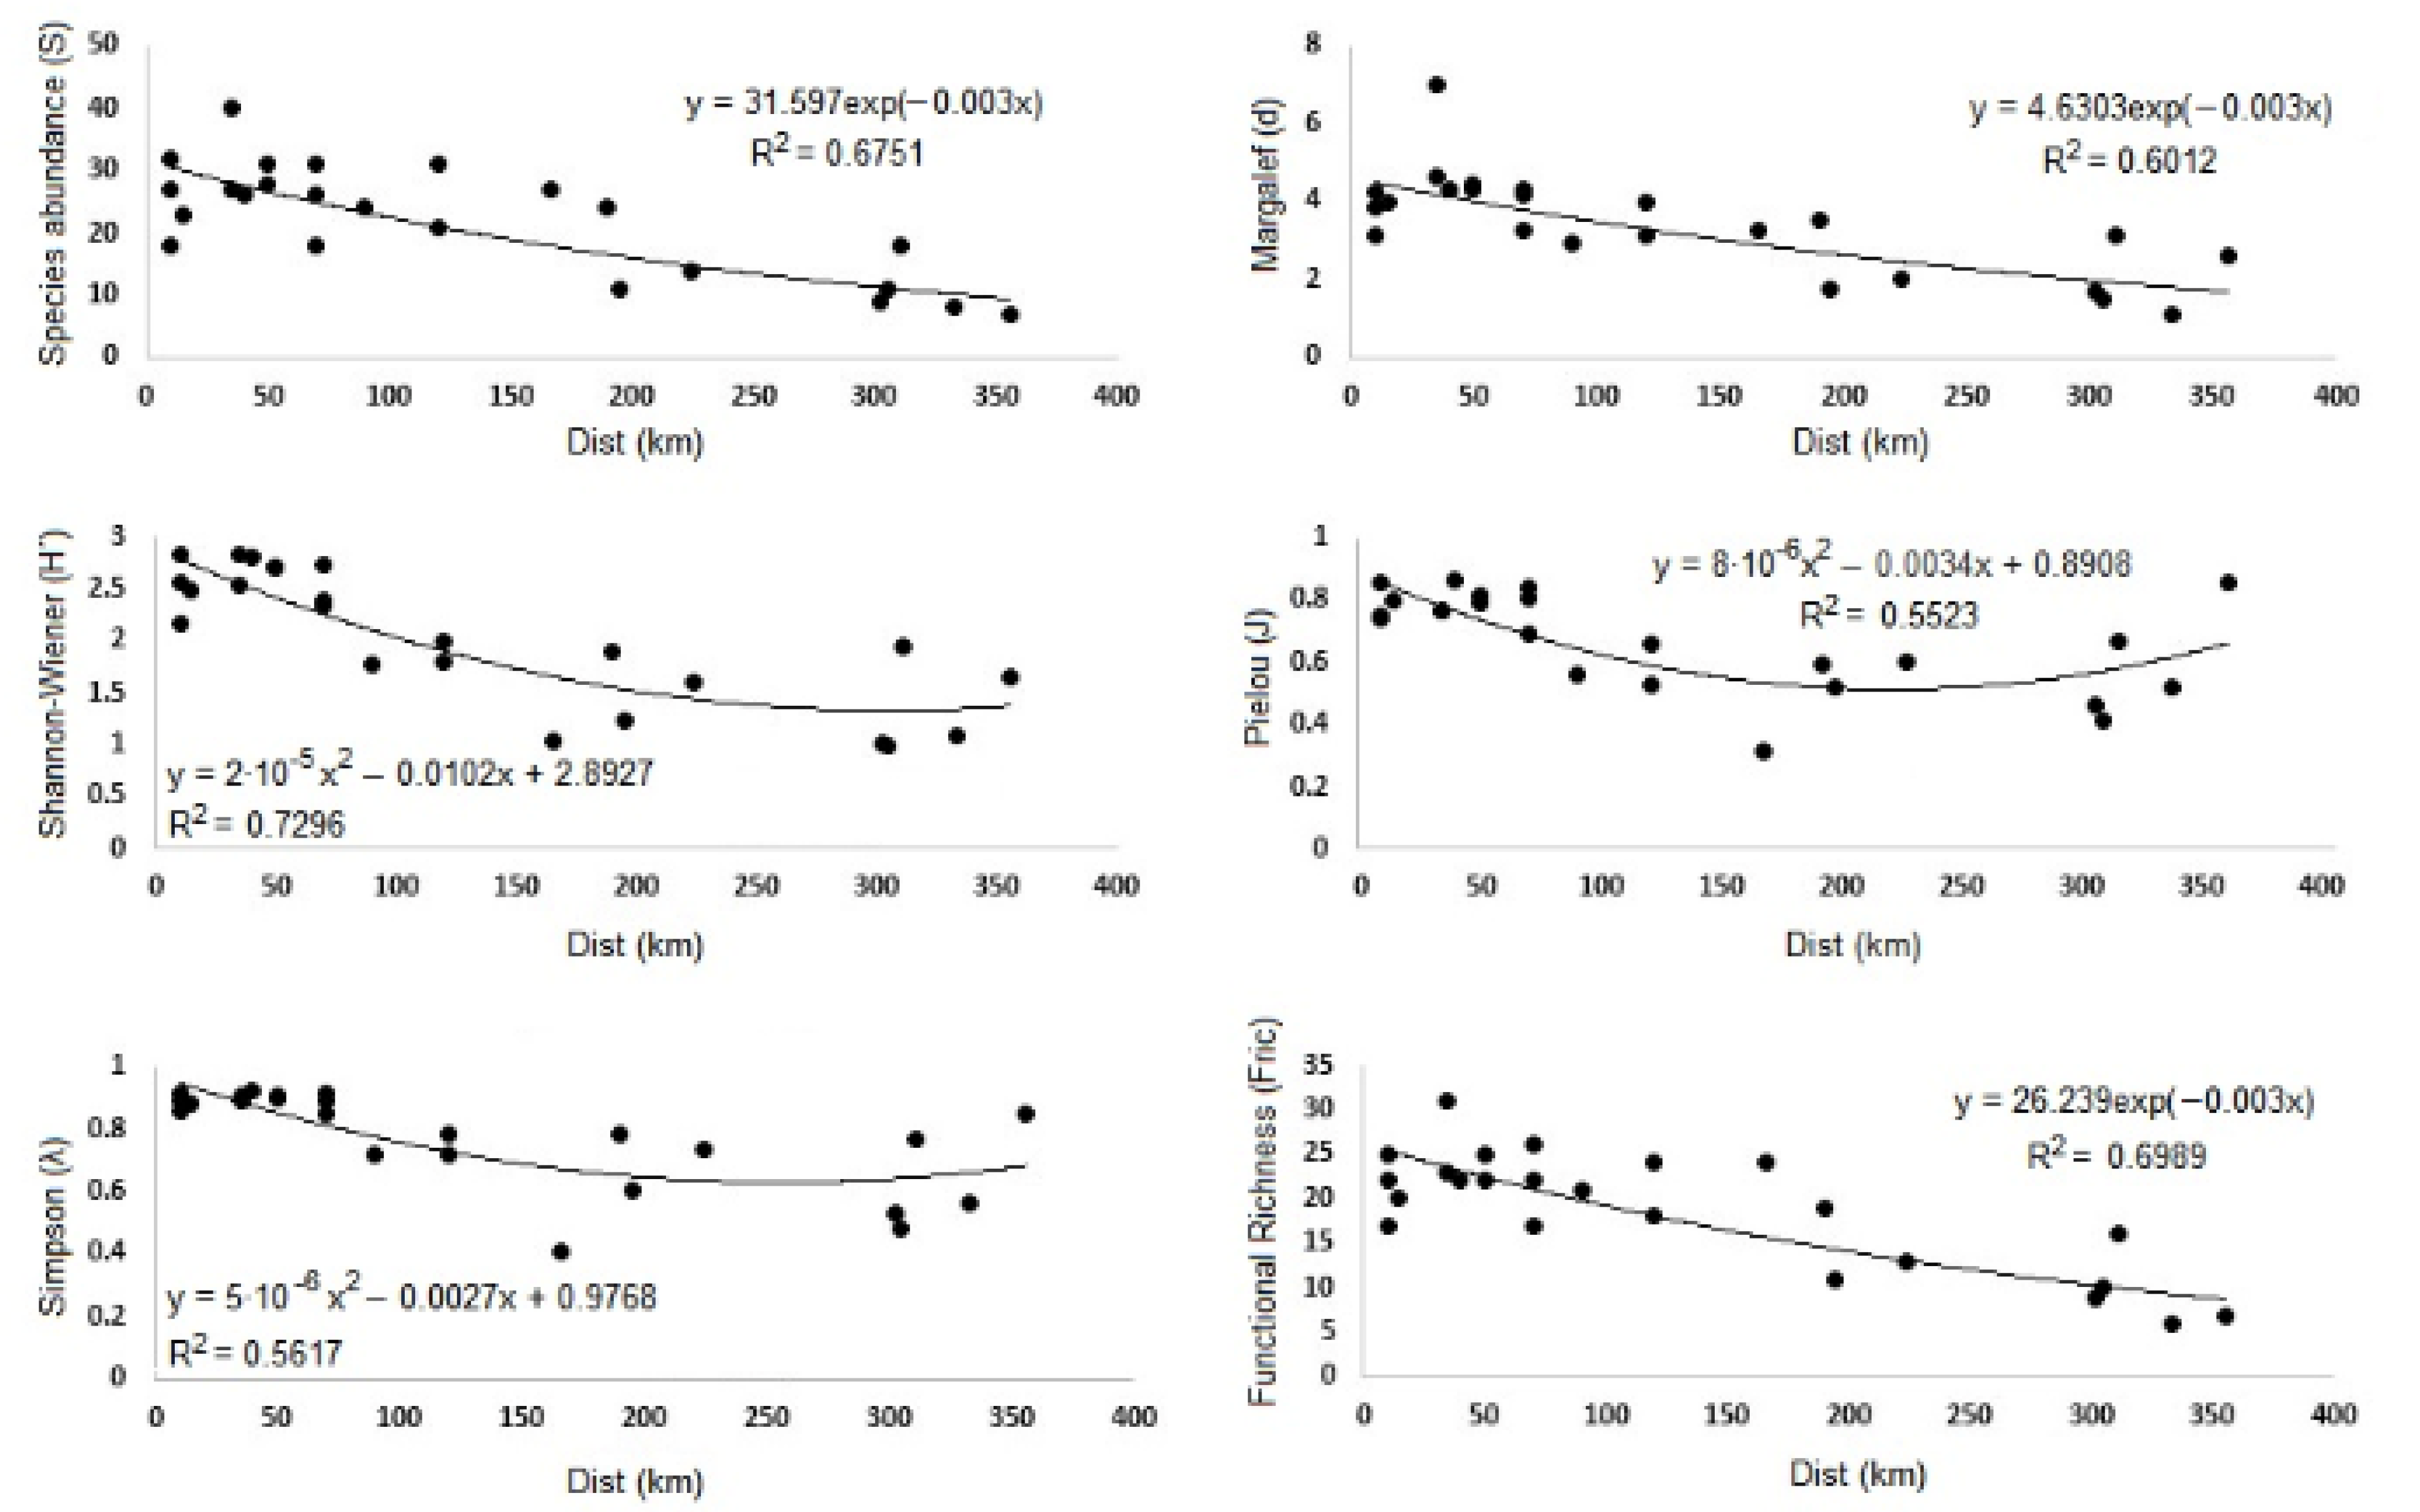
| Index | p-Value | R2 | Model | Equation |
|---|---|---|---|---|
| S | ** | 0.6751 | Exp | y = 31.597 exp(−0.003x) |
| N | ns | - | - | - |
| H′ | *** | 0.7296 | Pol | y = 2 × 10−5x2 − 0.0102x + 2.8927 |
| d | *** | 0.6012 | Exp | y = 4.6303 exp(−0.003x) |
| J | *** | 0.5523 | Pol | y = 8 × 10−6x2 − 0.0034x + 0.8908 |
| λ | *** | 0.5617 | Pol | y = 5 × 10−6x2 − 0.0027x + 0.9768 |
| FRic | ** | 0.6989 | Exp | y = 26.239 exp(−0.003x) |
| FEve | ns | - | - | - |
| RaoQ | ns | - | - | - |
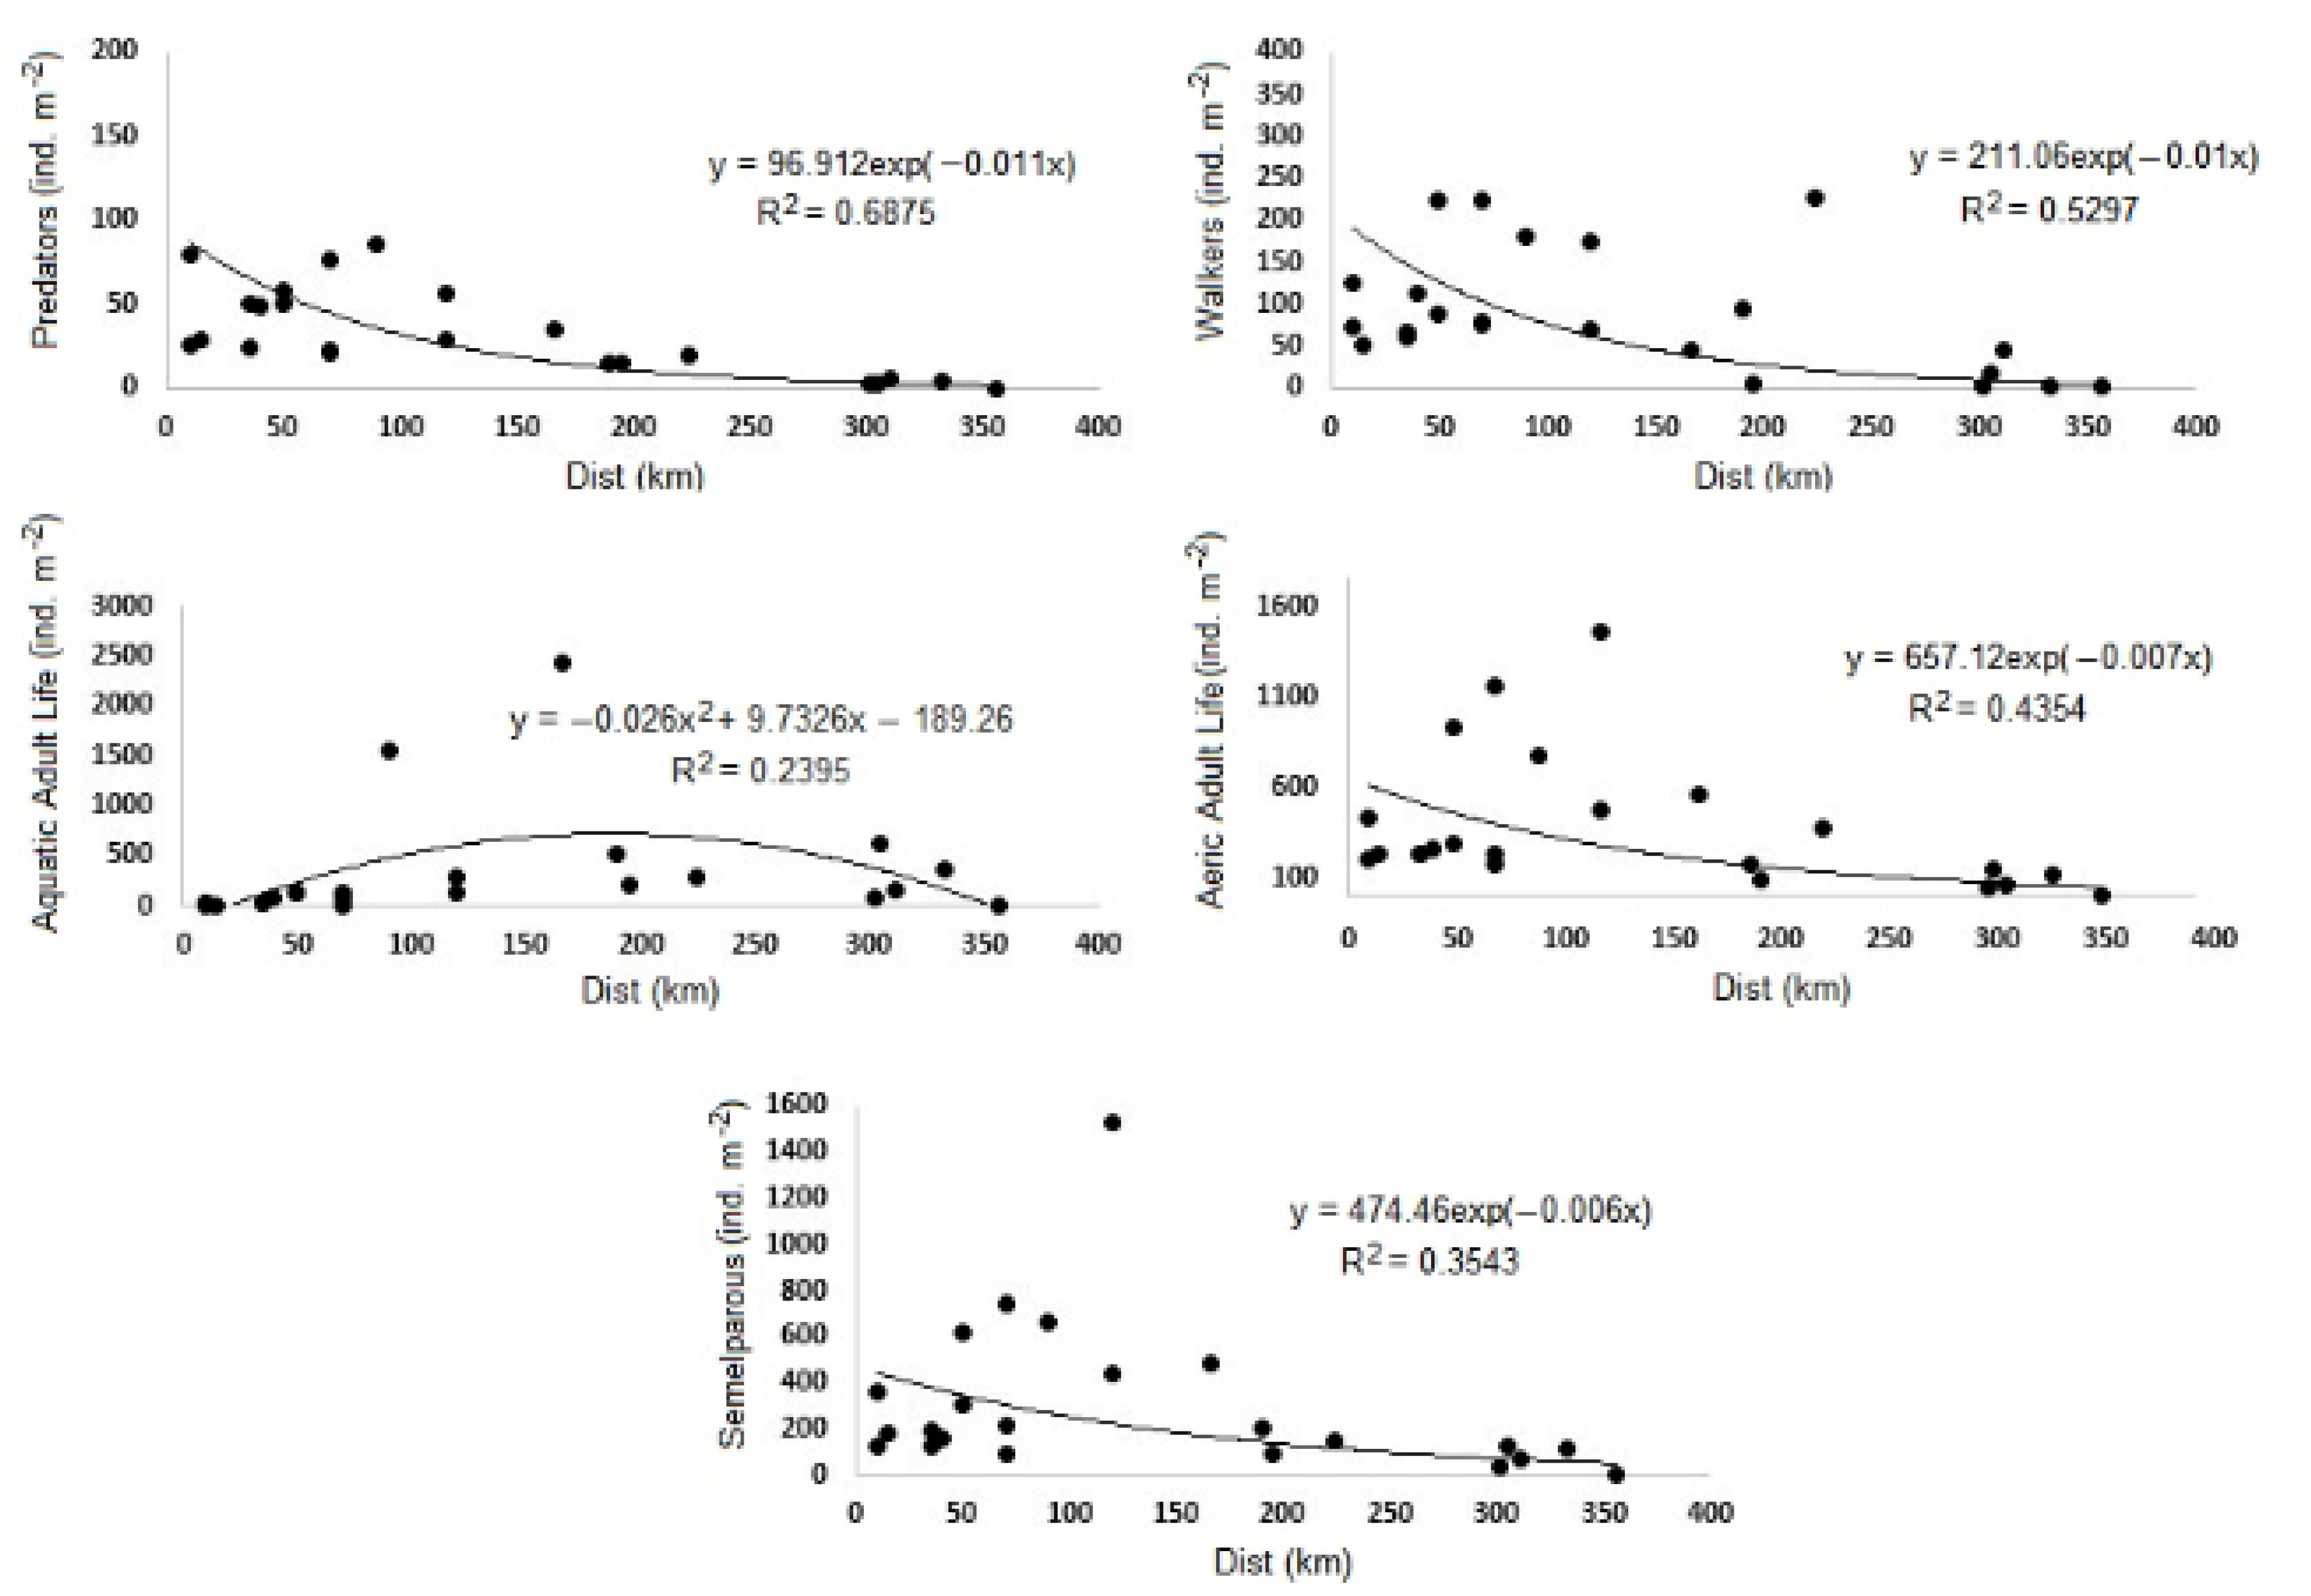
| Biological Traits | p-Value | R2 | Model | Equation | |
|---|---|---|---|---|---|
| Feeding Group | Deposit Feeder | ns | - | - | - |
| Predator | ** | 0.6875 | Exp | y = 96.912 exp(−0.011x) | |
| Scrapers | ns | - | - | - | |
| Shredder | ns | - | - | - | |
| Filter Feeder | ns | - | - | - | |
| Mobility | Burrower | ns | - | - | - |
| Swimmer | ns | - | - | - | |
| Walker | * | 0.5297 | Exp | y = 211.06 exp(−0.01x) | |
| Adult Life | Aeric | * | 0.4354 | Exp | y = 657.12 exp(−0.007x) |
| Aquatic | * | 0.2395 | Pol | y = −0.026x2 + 9.7326x − 189.26 | |
| Life Span | Long | ns | - | - | - |
| Medium | ns | - | - | - | |
| Short | ns | - | - | - | |
| Reproductive Frequency | Iteroparous | ns | - | - | - |
| Semelparous | * | 0.3543 | Exp | y = 474.46 exp(−0.006x) | |
| Habitat Choice | Generalist | ns | - | - | - |
| Specialist | ns | - | - | - | |
Publisher’s Note: MDPI stays neutral with regard to jurisdictional claims in published maps and institutional affiliations. |
© 2021 by the authors. Licensee MDPI, Basel, Switzerland. This article is an open access article distributed under the terms and conditions of the Creative Commons Attribution (CC BY) license (http://creativecommons.org/licenses/by/4.0/).
Share and Cite
Gaglio, M.; Aschonitis, V.; Muresan, A.N.; Vincenzi, F.; Castaldelli, G.; Fano, E.A. Structural and Functional Variations of the Macrobenthic Community of the Adige Basin along the River Continuum. Water 2021, 13, 451. https://doi.org/10.3390/w13040451
Gaglio M, Aschonitis V, Muresan AN, Vincenzi F, Castaldelli G, Fano EA. Structural and Functional Variations of the Macrobenthic Community of the Adige Basin along the River Continuum. Water. 2021; 13(4):451. https://doi.org/10.3390/w13040451
Chicago/Turabian StyleGaglio, Mattias, Vassilis Aschonitis, Alexandra Nicoleta Muresan, Fabio Vincenzi, Giuseppe Castaldelli, and Elisa Anna Fano. 2021. "Structural and Functional Variations of the Macrobenthic Community of the Adige Basin along the River Continuum" Water 13, no. 4: 451. https://doi.org/10.3390/w13040451