Article

Major Elements in the Upstream of Three Gorges Reservoir: An Investigation of Chemical Weathering and Water Quality during Flood Events

1
Institute of Earth Sciences, China University of Geosciences (Beijing), Beijing 100083, China
2
State Key Laboratory of Simulation and Regulation of Water Cycle in River Basin, Beijing 100083, China
3
Department of Water Ecology and Environment, China Institute of Water Resources and Hydropower Research, Beijing 100083, China
*
Author to whom correspondence should be addressed.
Water 2021, 13(4), 454; https://doi.org/10.3390/w13040454
Submission received: 28 December 2020 / Revised: 4 February 2021 / Accepted: 5 February 2021 / Published: 9 February 2021
(This article belongs to the Special Issue River Water Management and Water Quality)

Abstract

:
Rivers transport terrestrial matter into the ocean, constituting a fundamental channel between inland and oceanic ecosystem and affect global climate change. To reveal chemical weathering processes and environmental health risks during flood periods, water samples were collected in the upper reaches of Three Gorges Reservoir (TGR) in 2020. HCO3 and Ca2+ were the most abundant anions and cations of the river water, respectively. The range of HCO3 concentration was between 1.81 and 3.02 mmol/L, while the mean content of Ca2+ was 1.03 mmol/L. The results of the Piper diagram and element ratios revealed that the river solutes were mainly contributed by carbonate weathering and gypsum-rich evaporite dissolution. A mass balance model indicated that the contribution order of sources to cations in the main channel (Yibin-Luzhou) was evaporites > carbonates > atmospheric input > silicates. The order in the Chongqing—Three Gorges Dam was carbonates > atmospheric input > evaporites > silicates. These results showed a lithologic control on hydrochemical characteristics. Most sampling sites were suitable for agricultural irrigation according to the water quality assessment. However, indexes sodium adsorption ratio (SAR) and soluble sodium percentage (Na%) were higher than 1.0 in Yibin-Luzhou and 30% in Yibin–Chongqing, respectively, suggesting a potential sodium hazard. In addition, except Tuojiang River and Shennong River, the risk of sodium hazard in tributaries was relatively low. High Na+ concentration in irrigation water can damage soil structure and function and ultimately affect agricultural production. Water quality in the upstream of a Piper diagram should attract enough attention.

1. Introduction

As the channel that connects inland waters with the ocean, the river is the main carrier to transport inland materials [1,2]. It provides water for human activities (e.g., irrigation and drinking water) [3,4,5], as well as power generation and aquatic habitats [6,7,8,9]. It is also the carrier of pollutants brought by human activities [10,11,12,13,14]. Meanwhile, rivers are one of the major players in the carbon cycle [15,16,17,18]. CO2 in rivers can affect climate change by being released into the atmosphere due to higher partial pressure [19,20,21]. Rock weathering, atmospheric input and soil consumption contribute to the river inorganic carbon composition [22,23,24]. The weathering processes can increase river solutes concentration, further affecting water chemistry [25,26] and the carbon cycle [24,27,28]. In addition, human activities can also have an impact on carbon fluxes in rivers [17,29,30]. For example, damming alter the geochemical behavior of inorganic carbon in Changjiang has been reported [31,32,33]. However, the carbon cycle in rivers is complex; understand the contribution of natural weathering on rivers is important before the impact of human activities can be revealed. Therefore, it is necessary to study the relationship between chemical weathering and rivers water chemistry.
River solutes can provide information about weathering processes [34,35,36,37,38]. The primary sources of river solutes are natural sources, such as atmospheric input and rock weathering [39,40,41,42,43]. Qu et al. [44] measured and analyzed the elemental composition and other environmental indicators in 11 rivers on the Tibetan Plateau, suggesting that carbonate weathering dominated the major ions in rivers of southern Tibetan Plateau and the central riverine ions were dominated by evaporite dissolution and silicate weathering. Similarly, by the methods of Piper, Gibbs, and mixing models, the source of rock weathering of the major riverine ions such as Yamuna River, Gandaki River and Xijiang River has also been revealed [45,46,47]. Anthropogenic inputs are another important source, such as agricultural irrigation and industrial production are another important source [48,49,50]. In addition, human-accelerated weathering can improve the major ions migration rate in urban rivers [51]. Overall, measurements of river solute chemical composition can provide a better knowledge of weathering processes and the degree of human disturbance to the river, and then the water quality can be assessed accordingly.
The Three Gorges Dam (TGD), which intercepts the Changjiang River, is the largest dam-building project in the world [52,53,54]. The changes in the water chemistry of this basin have been constantly a concern for decades [55,56,57]. The data of the Changjiang River monitoring stations over 35 years were analyzed by Chen et al. [58], who indicated the role of rock weathering in hydrochemistry could not be neglected. Based on the mass balance equation, Chetelat et al. [34] further pointed out the major cations in Changjiang River were mainly from dissolution products of carbonate rocks, and anthropogenic input also had a certain influence. A certain amount of research downstream of the TGR was reported, aiming to understand the effects of the damming and chemical weathering process [58,59,60,61,62,63]. Although some local studies have investigated the weathering source of major ions upstream of the TGR [64,65,66,67], the hydrochemical processes during periods of flood events are still unclear. The risks of irrigation water in the basin are also unclear. The contribution of natural weathering to the river solutes can be better understood by collecting the hydrochemical information during the flood period. Therefore, this study in the upstream of the TGR (Yibin-Wushan) aims to examine (1) elements composition of the river water, (2) source analysis of cations in the river and (3) the water quality and risks. This study enriches the information of the chemical weathering in the TGR river water during the flood period and provides a reference for the management of irrigation water resources in the Changjiang River basin.

2. Research Area and Methods

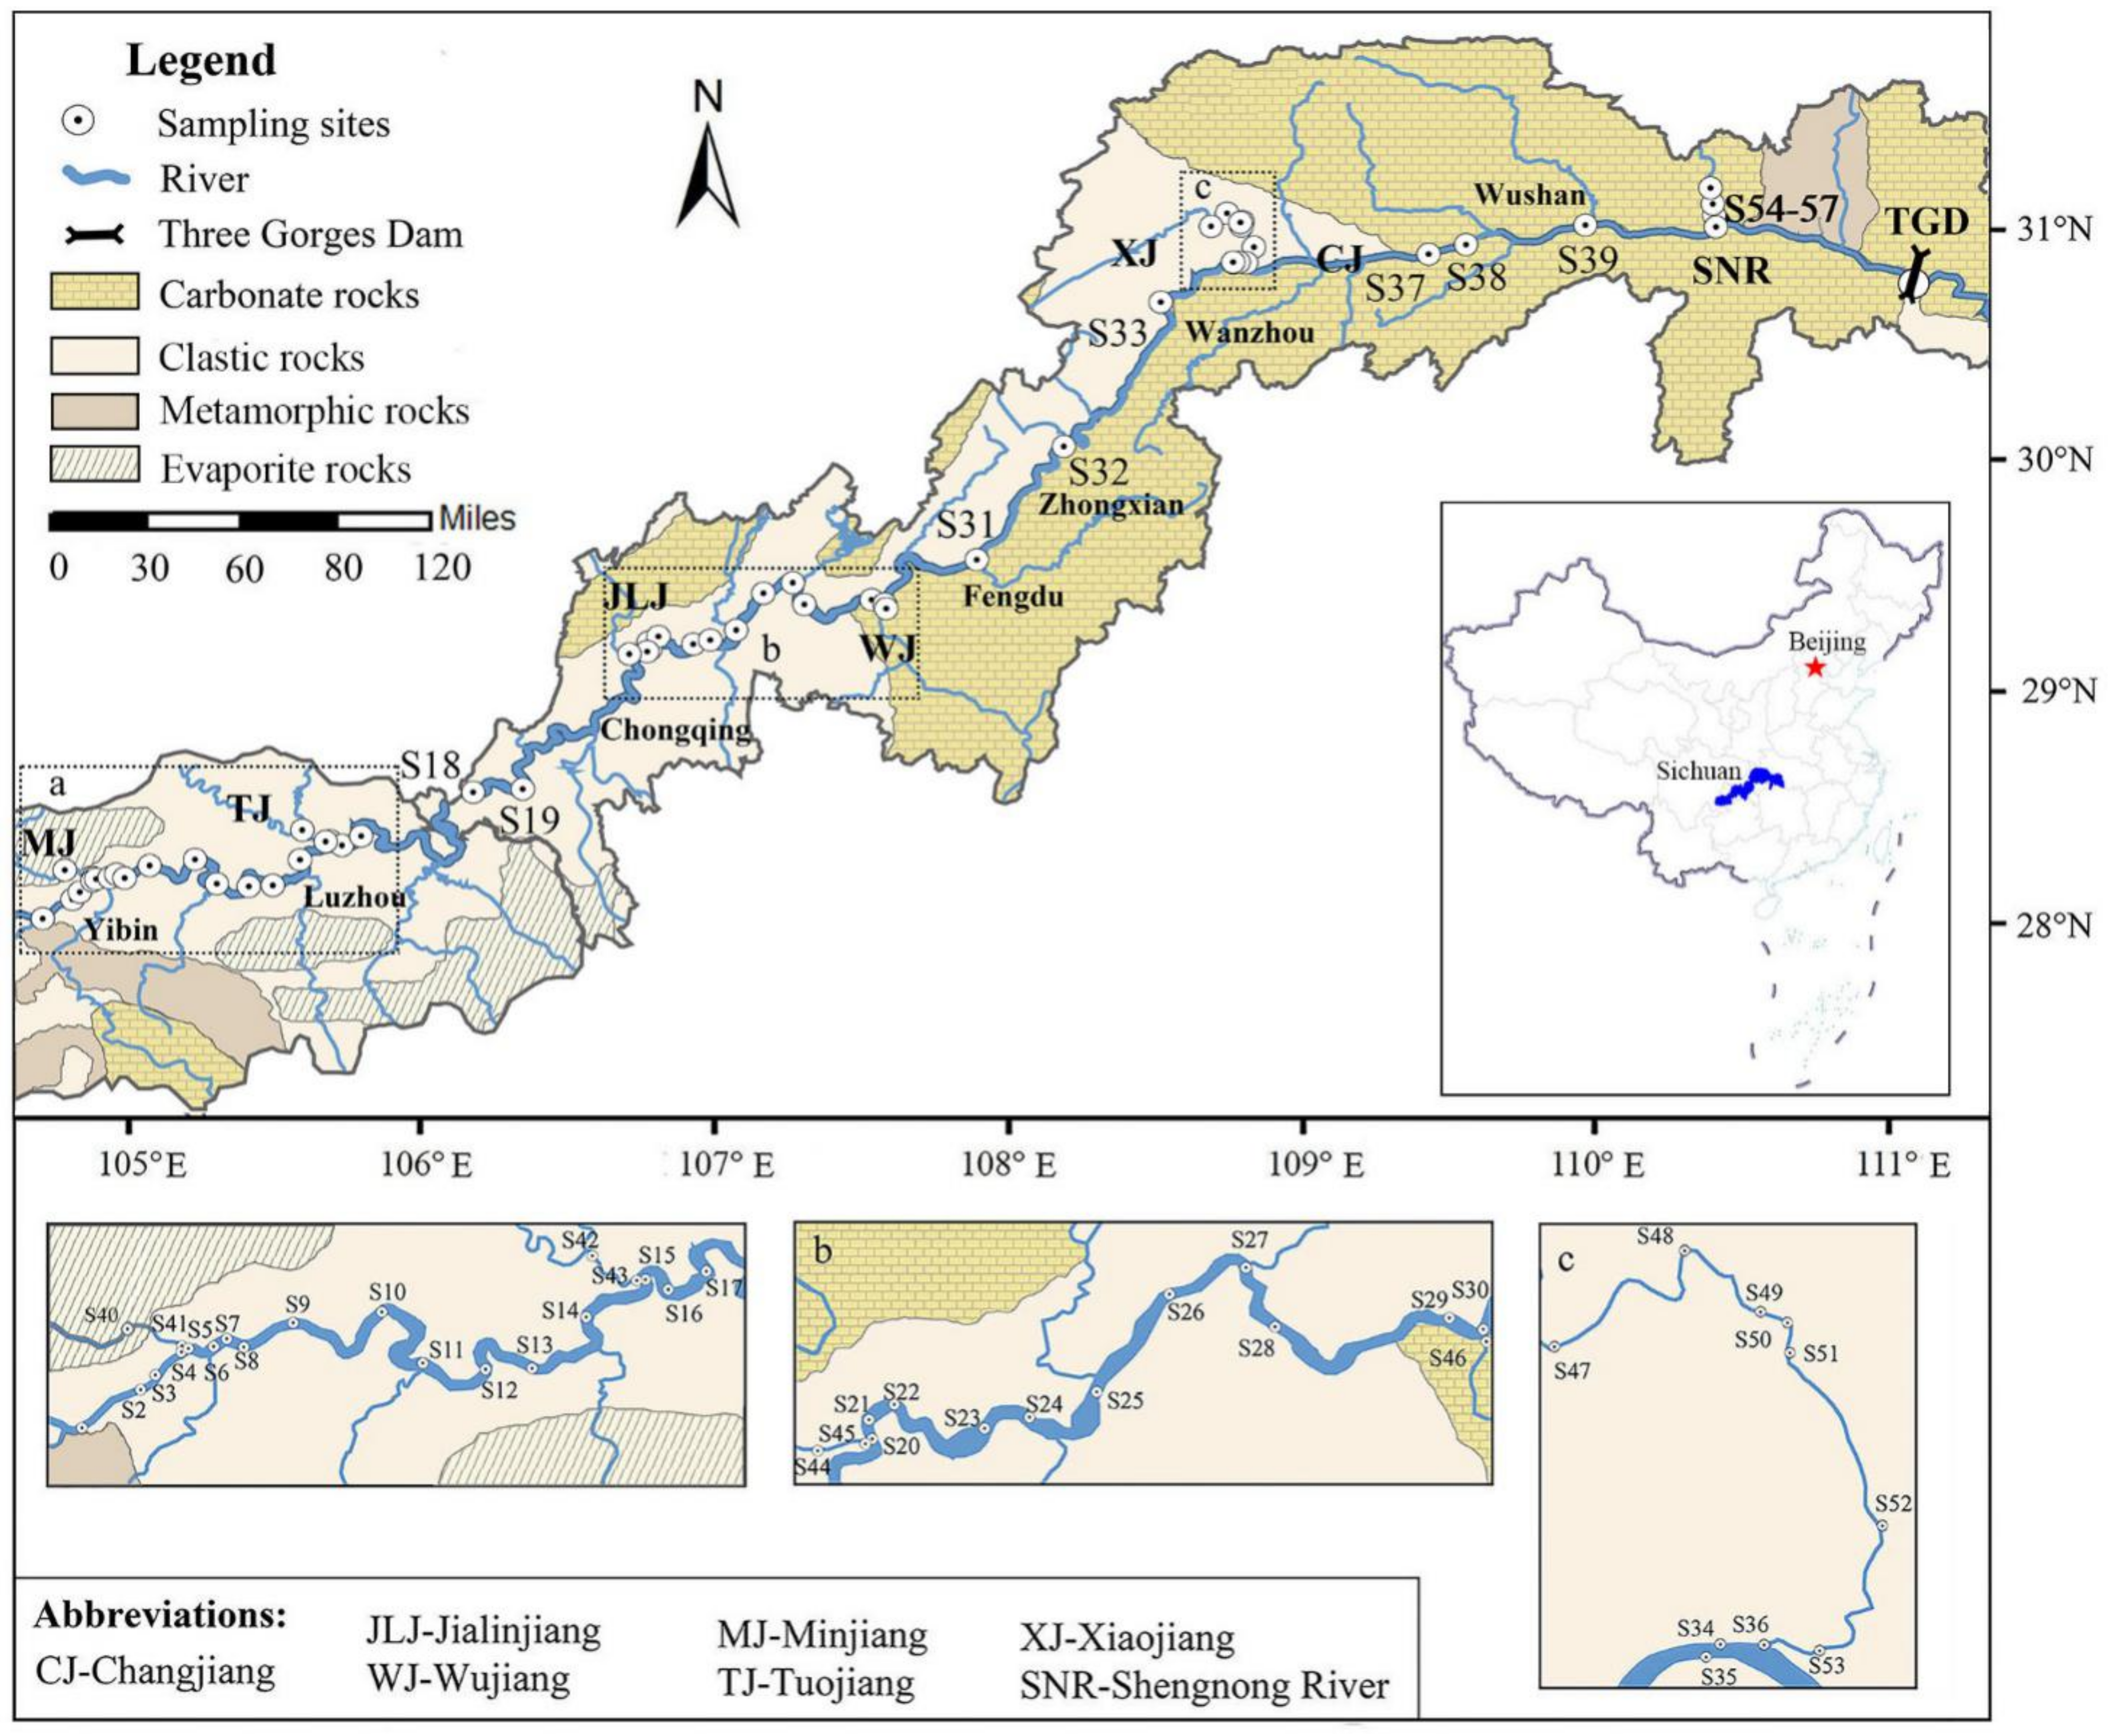
2.1. Location of Area

TGD was built in the Yichang City of Hubei Province, which is the largest dam in the world with a length of about 2309 m and 185 m in height [52]. After Changjiang River was held back by the TGD, the floodwaters gradually covered the area from Chongqing City to Yichang City (from west to east), eventually becoming known as the Three Gorges Reservoir (TGR) [68]. According to the Köppen climate classification, Yibin-Luzhou and part of Chongqing belong to humid subtropical (Cfa), and most of the area from Chongqing to TGD belongs to dry-winter subtropical (Cwa) [69]. The annual precipitation is between 1000–1800 mm [70]. Precipitation in June and July 2020 were between 200 and 300 mm and 300–500 mm, respectively, and rainfall in the Wanzhou-Wushan region exceeded 500 mm in July (Changjiang River Hydrological Network, www.cjh.com.cn (accessed on 11 December 2020)). From April to September of each year is the period of the wet season, the rest of the month for the dry season [53].
As shown in Figure 1, clastic rocks of red beds contain quartz and feldspars widely distributed from Yibin to Fengjie (S38) and evaporate rocks dominated by gypsum are concentrated in this region [71]. Large areas of carbonate rocks occur from Chongqing to TGD, contain materials such as calcites, dolomites and calcium chloride, and the main outcrop along the river are calcite-dominated limestones [71,72]. In addition, metamorphic rocks are outcropping in Yibin and Badong.
Sampling sites include the main channel (start from Yibin in the west) and some tributaries (Minjiang River, Tuojiang River, Jialingjiang River, Wujiang River, Xiaojiang River and Shennong River) of Changjiang River, located between longitudes 104°26′ to 110°19′ and latitudes 28°37′ to 31°11′. The elevation of the sampling sites is approximately between 64 and 270 m. The farthest sampling site (S1) from TGD is at Yibin City, nearly 994 km from the dam.

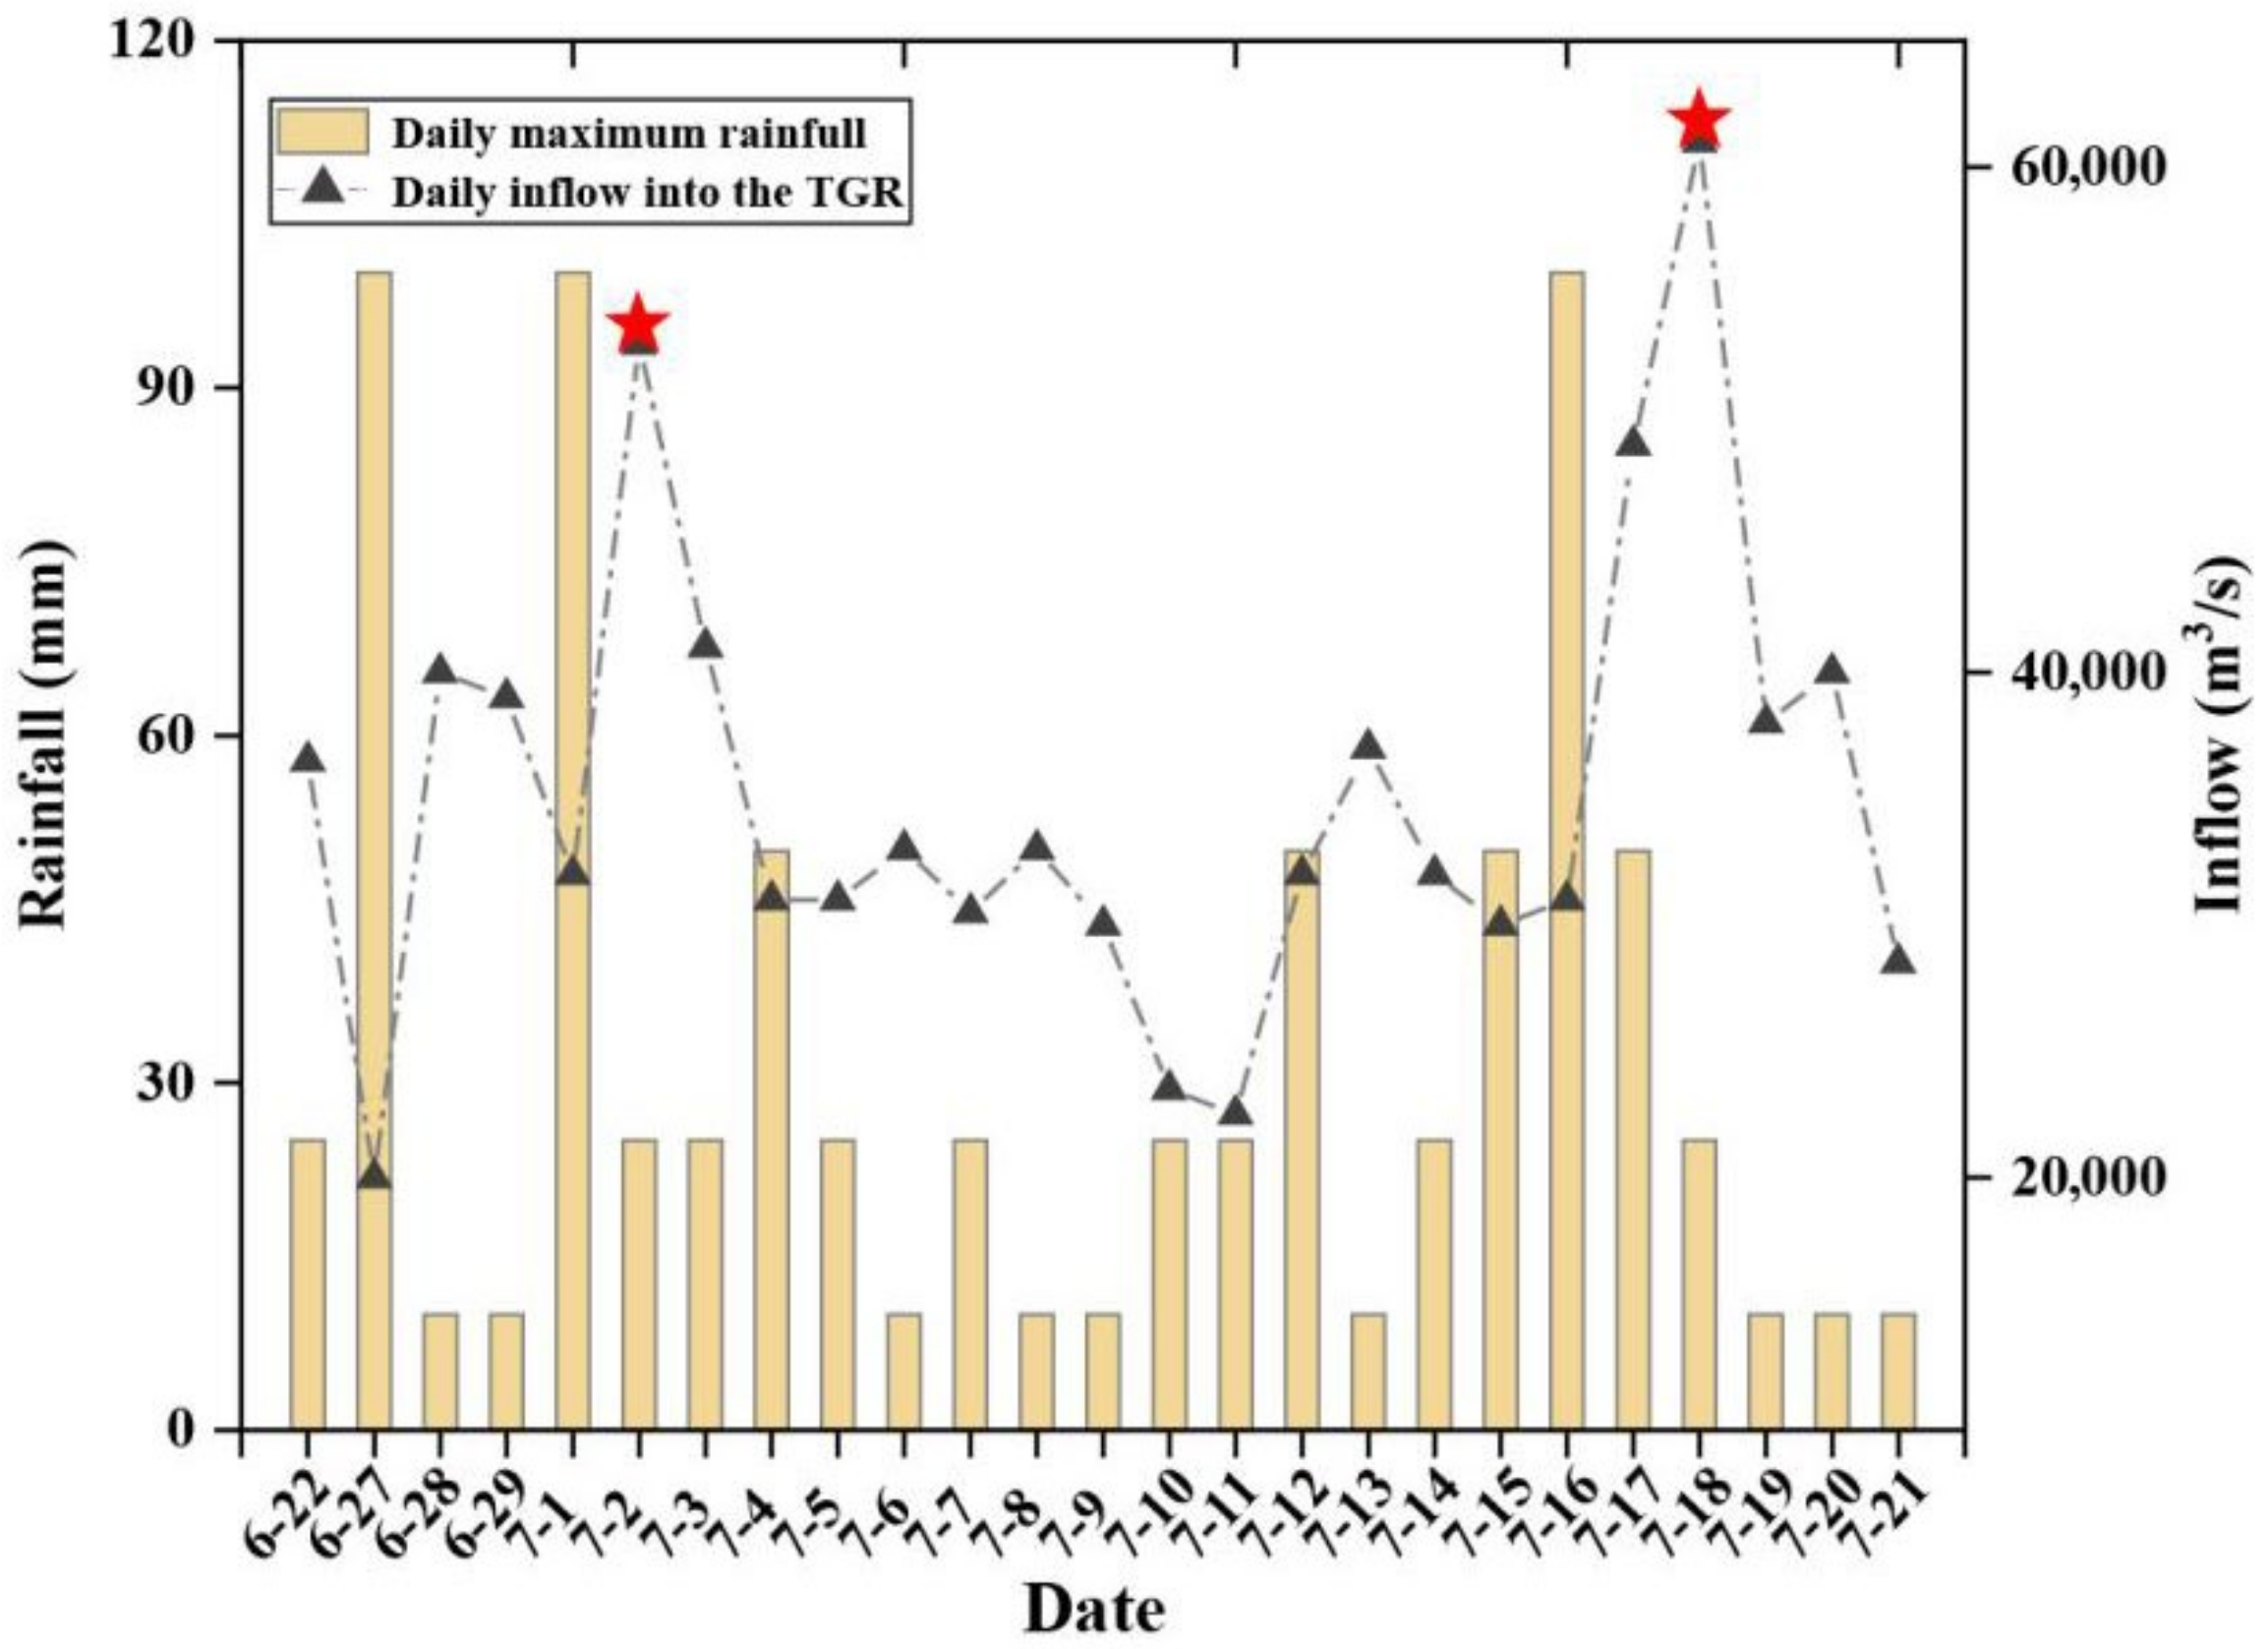
2.2. Sample Collection and Treatment

From June 25 to July 21, 2020, fifty-seven surface water samples in the main channel (Changjiang River) and tributaries in the TGR were collected. As shown in Figure 2, rainfall continuously occurred during the data collection period, resulting in two flood events—one on July 2 and the other on July 18. From June 25 to 28, water samples from the main stream (Badong to Fengjie and part of Chongqing), Shennong River and Wujiang River were collected, and the remaining water samples were collected in July. The river water samples were collected in the center of the river under a depth of about 50 cm.
All samples were filtered using cellulose acetate membranes (the diameter was 0.47 mm and the aperture was 0.22 μm) on the sampling day and then stored in precleaned high-density polyethylene (HDPE) bottles. After this, the samples that were used for cationic measurement were acidized (by ultra-purified HNO3) to keep the water pH < 2. A global positioning system (GPS) was used for recording sampling locations, while pH values of water samples were measured with a pH meter (Rex., Shanghai, China).
Measurement of total dissolved solids (TDS), water temperature and electrical conductivity (EC) was performed in the field at the time of sampling with a portable multiparameter instrument (YSI Inc., Yellow Springs, OH, USA). A total of 0.02 M HCl was used to titrate the value of HCO3. An inductively coupled plasma optical emission spectrometer (Optima 5300DV, PerkinElmer Inc., Waltham, MA, USA) and an ion chromatograph (ICS-600, Thermo Fisher Scientific Inc., USA) were used to determine the concentration of cations (Na+, Mg2+, K+ and Ca2+) and anions (NO3-N, Cl, F and SO42−) in water samples, respectively. To ensure the quality of analysis, blank, duplicate samples and standard solutions (GBW08606 and GBW082051, National Research Center for Certified Reference Materials, China) were measured, and the deviation of all duplicate samples was within 5%. All the measured raw data of of all samples please see Table S1.

2.3. Methods for Chemical Weathering Analysis

A Na-normalized molar ratio can be used to roughly determine the type of rocks from which chemical weathering of rivers is derived [24,73]. Thus, the chemical composition of the silicate, carbonate and evaporite end members were assigned as [Ca2+]/[Na+] and [HCO3]/[Na+] ratios [73]. In addition, the ratios of [SO42−/HCO3] and [Ca2+ + Mg2+]/[HCO3] were used to identify the contribution from soluble rocks (gypsum and carbonates). The contributions of silicate minerals (albite and anorthite) were determined by the ratios of [Na+ + K+/HCO3] and [Ca2+ + Mg2+/HCO3]. Stoichiometry of weathering processes was based on the following reactions:
2 Ca x Mg ( 1 x ) CO 3 + H 2 SO 4 2 xCa 2 + + 2 ( 1 x ) Mg 2 + + 2 HCO 3 + SO 4 2
Ca x Mg ( 1 x ) CO 3 + H 2 O + CO 2 xCa 2 + + ( 1 x ) Mg 2 + + 2 HCO 3
2 Na x K ( 1 x ) AlSi 3 O 8 + H 2 SO 4 2 xNa + + 2 ( 2 x ) K + + SO 4 2 + 6 SiO 2 + 2 AlOOH
2 Na x K ( 1 x ) AlSi 3 O 8 + H 2 CO 3 2 xNa + + 2 ( 1 x ) K + + 2 HCO 3 + 6 SiO 2 + 2 AlOOH
CaAl 2 Si 2 O 8 + H 2 SO 4 Ca 2 + + SO 4 2 + 2 SiO 2 + 2 AlOOH
CaAl 2 Si 2 O 8 + H 2 CO 3 Ca 2 + + 2 HCO 3 + 2 SiO 2 + 2 AlOOH

2.4. Assessment of Irrigation Water Quality

Water quality assessment can help a visually understand the potential risks of water quality to farmland. Salinity and alkalinity are an important index affecting soil quality. The soluble sodium percentage (Na%), residual sodium carbonate (RSC) and indexes sodium adsorption ratio (SAR), which were adopted in this study, are commonly used to assess the salinity and alkalinity of irrigation water. The calculation formulas are as Equations (7)–(9):
SAR = Na + × [ 2 / ( Ca 2 + + Mg 2 + ) ] 1 / 2
Na % = 100 % × Na + / ( Na + + K + + Ca 2 + + Mg 2 + )
RSC = ( HCO 3 + CO 3 2 ) ( Ca 2 + + Mg 2 + )

2.5. Statistical and Spatial Analysis

ArcGIS 10.4 GIS (ESRI®) (Environmental Systems Research Institute; Redlands, CA, USA) was used to draw the map of the study area and the sampling points. Correlation analysis of data was performed using the “Pearson’s bivariate correlation” function of SPSS 25.0, and a Piper diagram was made with the function of “three-line diagram” by software Origin 2018. Adobe Illustrator 2018 and Software Origin 2018 were used to made figures.

3. Results and Discussion

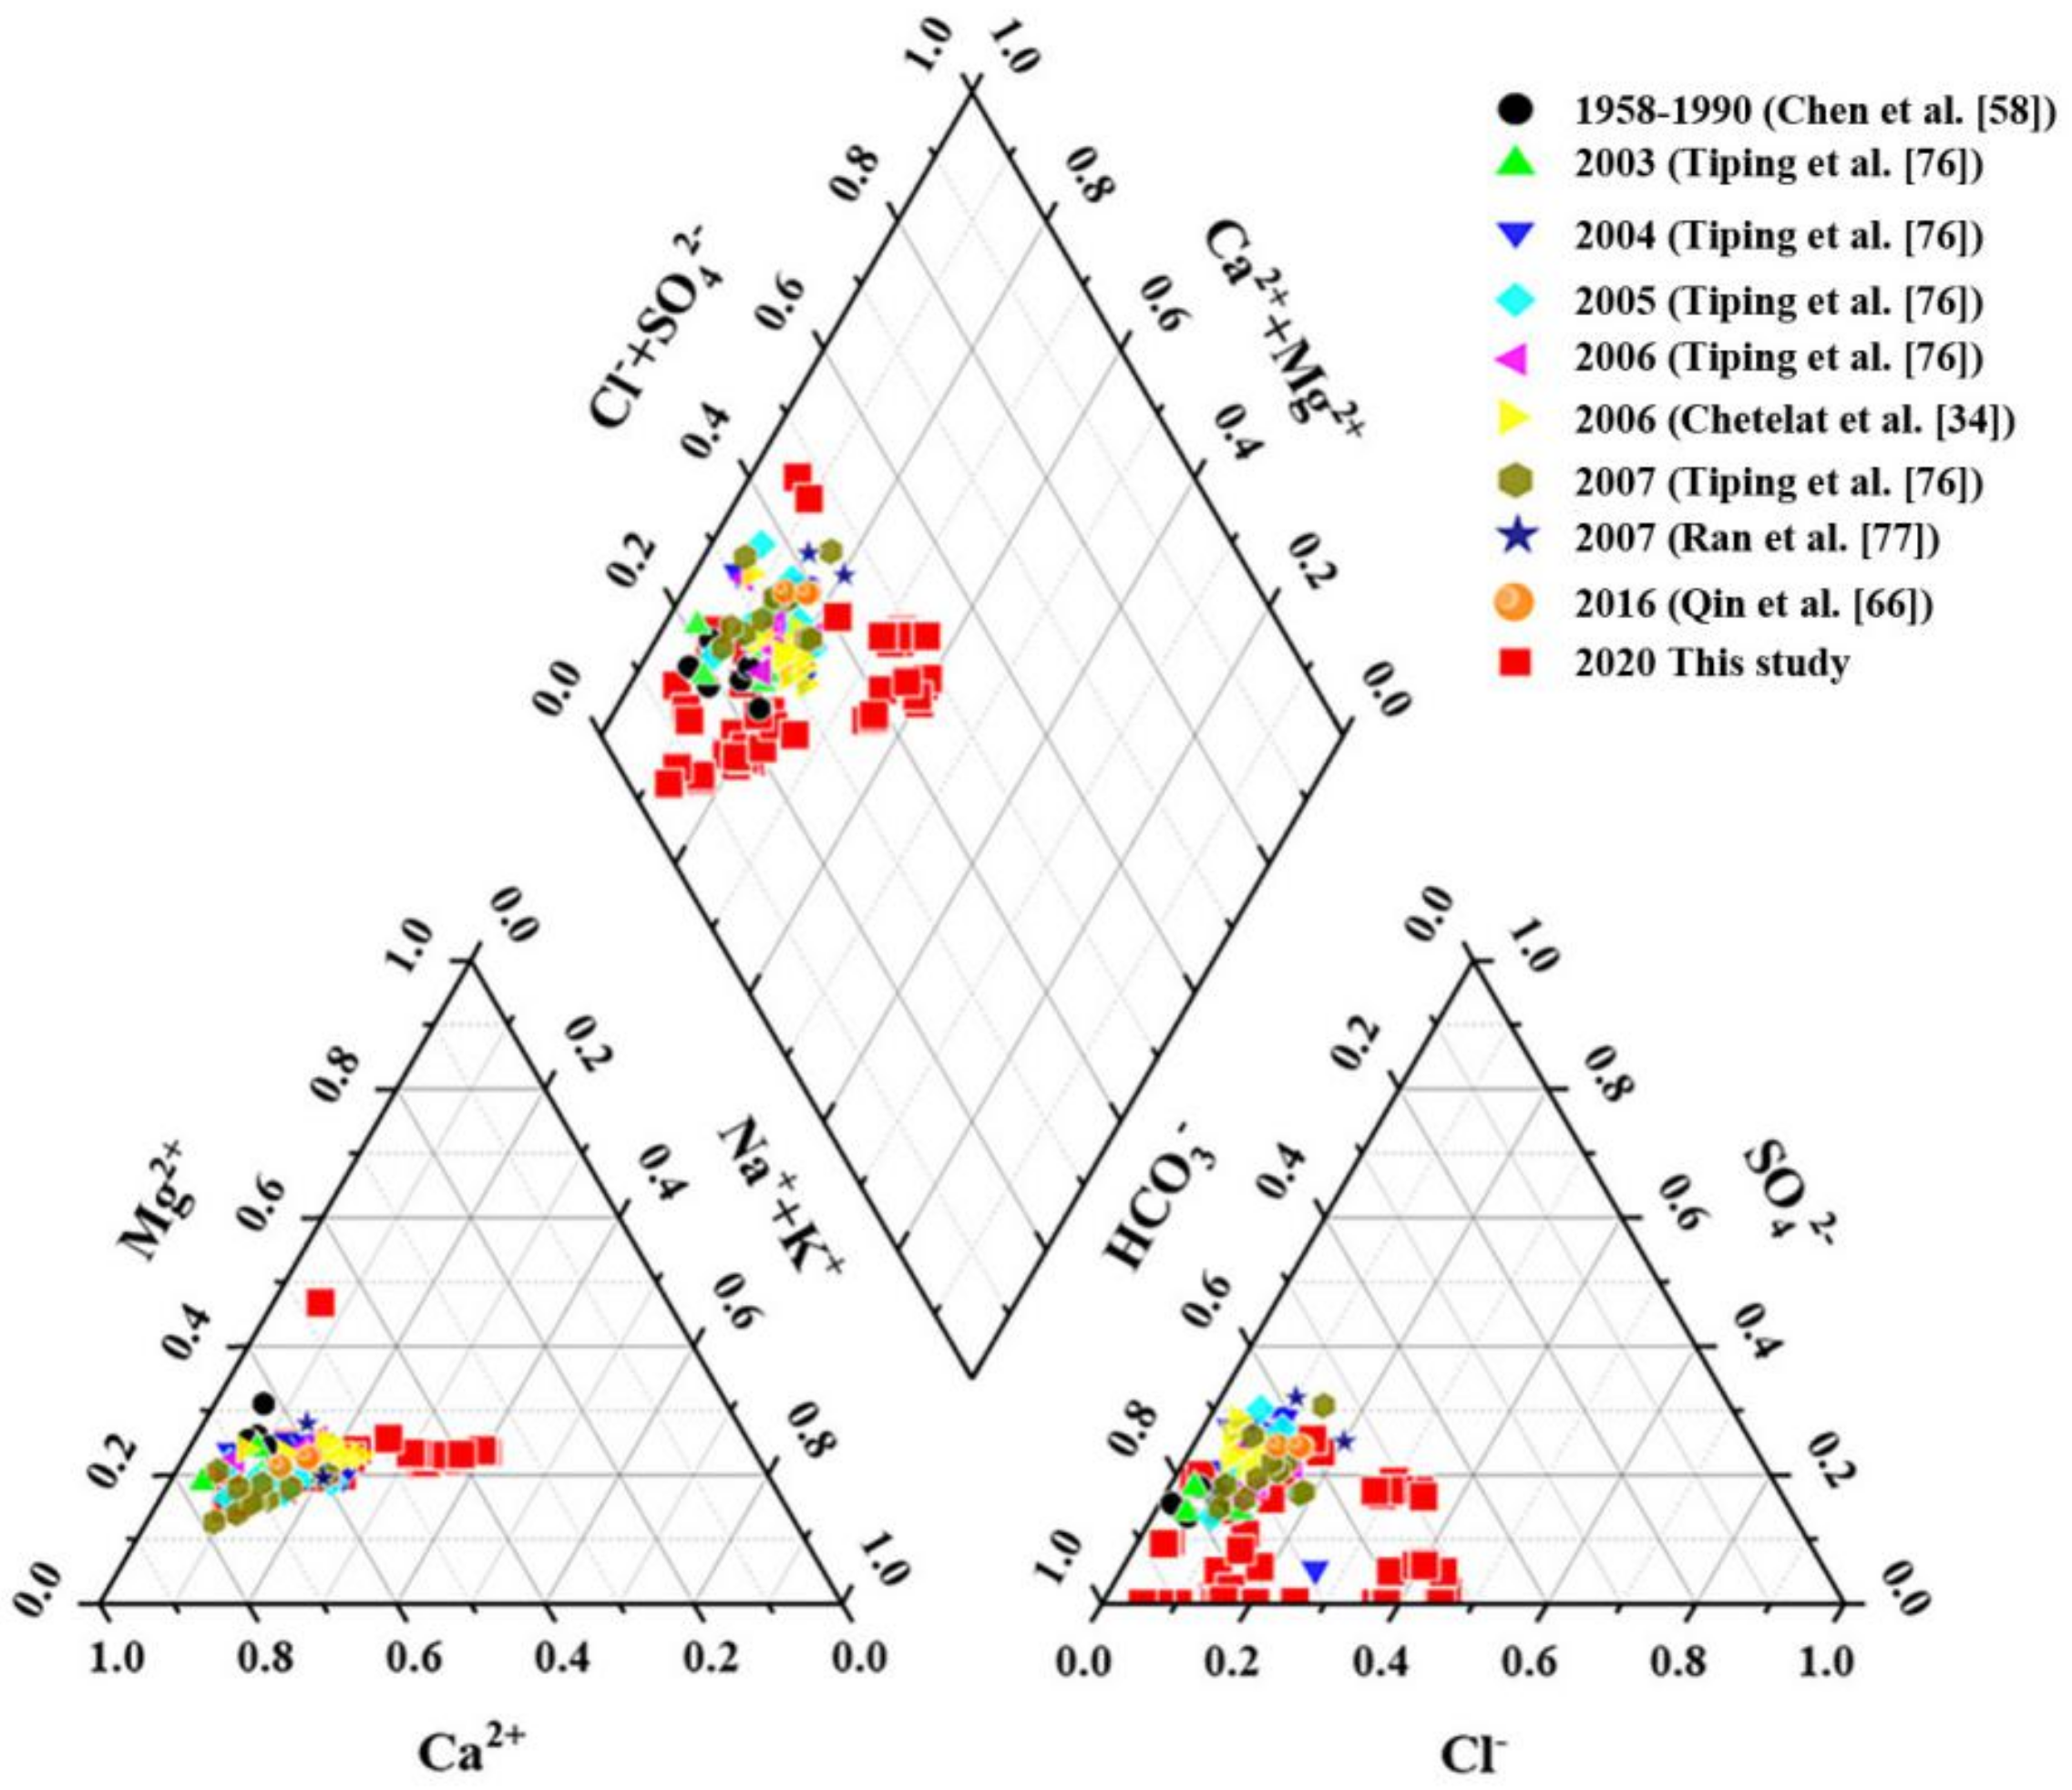
3.1. Hydrochemical Characteristics

The chemical compositions of the river in the TGR are shown in Table 1. The mean pH value was 7.84 in the main stream and 7.74 in tributaries, indicating that the river water was slightly alkaline. The normalized inorganic charge balance of most samples was ≤10, suggesting the anion and anion in samples were basically balanced, and the data were reliable. In the main stream of the TGR, the concentration of TDS was between 178 and 410 mg/L (mean value was 292 mg/L), while the range of EC (mean value was 522 μs/cm) was between 318 and 734 μs/cm. The decreasing trend of TDS values from west to east may be due to the difference in lithologic composition. Evaporites are the main bedrock of Yibin-Luzhou (by the west) reach, while the region near the dam is mostly carbonic acid (by the east) (Figure 1). Evaporite dissolves much faster than carbonate and silicate [34,74]. Additionally, the low TDS concentrations were observed in the reservoir area, and the larger amount of the river water and precipitation may dilute the absolute concentrations [75]. As for tributaries, most parameter values of water samples were lower than those in the main stream; this may be due to solutes from the tributaries pooling in the main channel.
Compared with previous data, the hydrochemical composition of the TGR main stream in 2020 was different (Table 2). The concentration of Cl (37.95 mg/L) and Na+ + K+ (28.24 mg/L) were higher than other months and the mean of the year. The value of SO42− (17.10 mg/L) was obviously lower than others [34,58,67,76]. The content of SO42− can be associated with dissolved gypsum-rich evaporates, oxidation of sulfide deposits and human activities. The increased concentrations of Na+ and Cl may be due to the rainfall. Precipitation in the upper and middle reaches of the Changjiang River increased by 40 to 70 percent in June and July 2020 compared with previous years (Changjiang River Hydrological Network, www.cjh.com.cn (accessed on 11 December 2020)). Since the evaporites (the most soluble rocks) are present in the TGR region and rainfall could increase its amount of dissolved, which may result in an increase of Na+ and Cl [34,72].
Piper diagram reflects the constitute of major elements in samples of this study and superimposed with data reported by other studies from 1958–1990 [58], 2003–2007 [34,76,77], and 2016 [66] (Figure 3). All sample data in this study and collected data are distributed in a narrow range. HCO3 was the most abundant anion in the river, followed by Cl and SO42−. As for cations, Ca2+ accounted for more than half of the total cations, the order of concentration was Ca2+ > Mg2+ > Na+ + K+. The type of the upstream TGR was Ca2+ − Mg2+ − HCO3—type from the distribution range of data. Some rivers in China also fall into this type reported from previous studies, such as Zhujiang River [78], Xijiang River [79] and Yalong River [80]. It suggested a weathering process of carbonate-control may occur in the water chemistry.
The correlation analysis results showed Ca2+ and K+ had a positive correlation (r = 0.471, p < 0.01, Table 3), Na+ was also significantly positively correlated with Mg2+ (r = 0.672, p < 0.01), which indicated their source were probably same. In addition, Na+ and Ca2+ were significantly positively correlated with Cl and SO42−, respectively. This result may suggest that the evaporite rocks had a certain contribution to the ions in the river water. However, the correlation of ions was not a complete indicator of their origin since the correlation may also be derived from dilution [73].

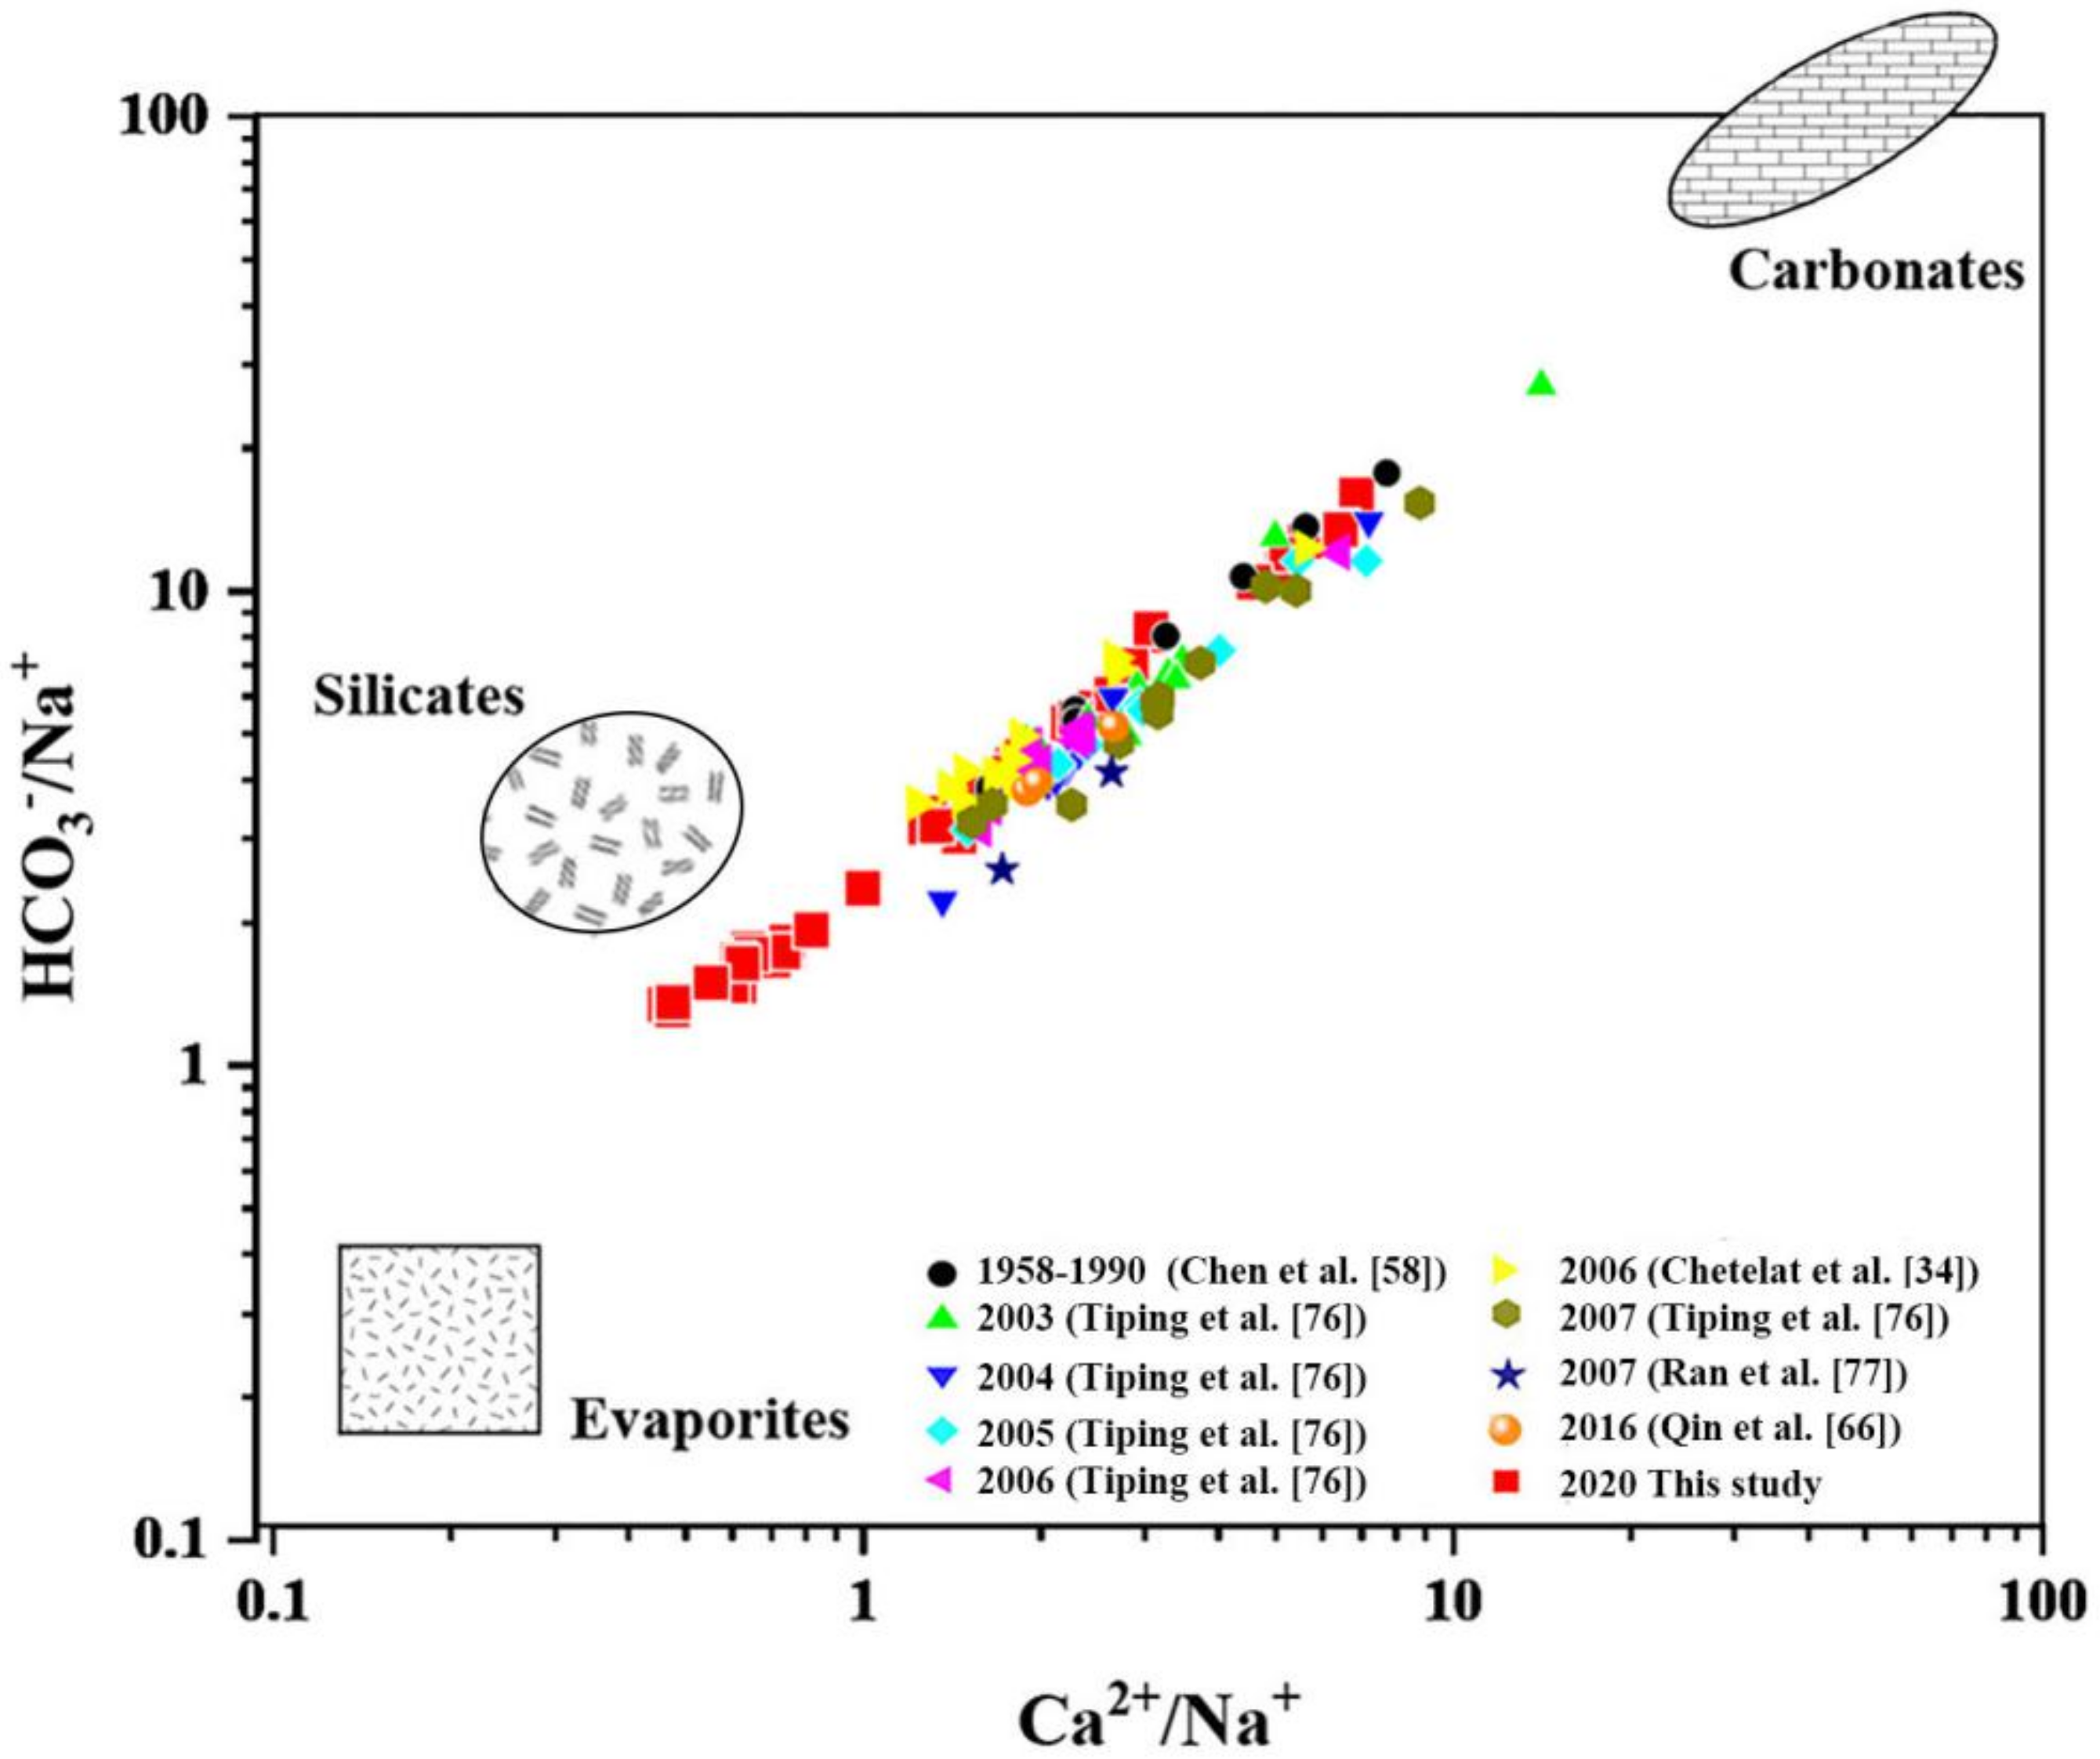
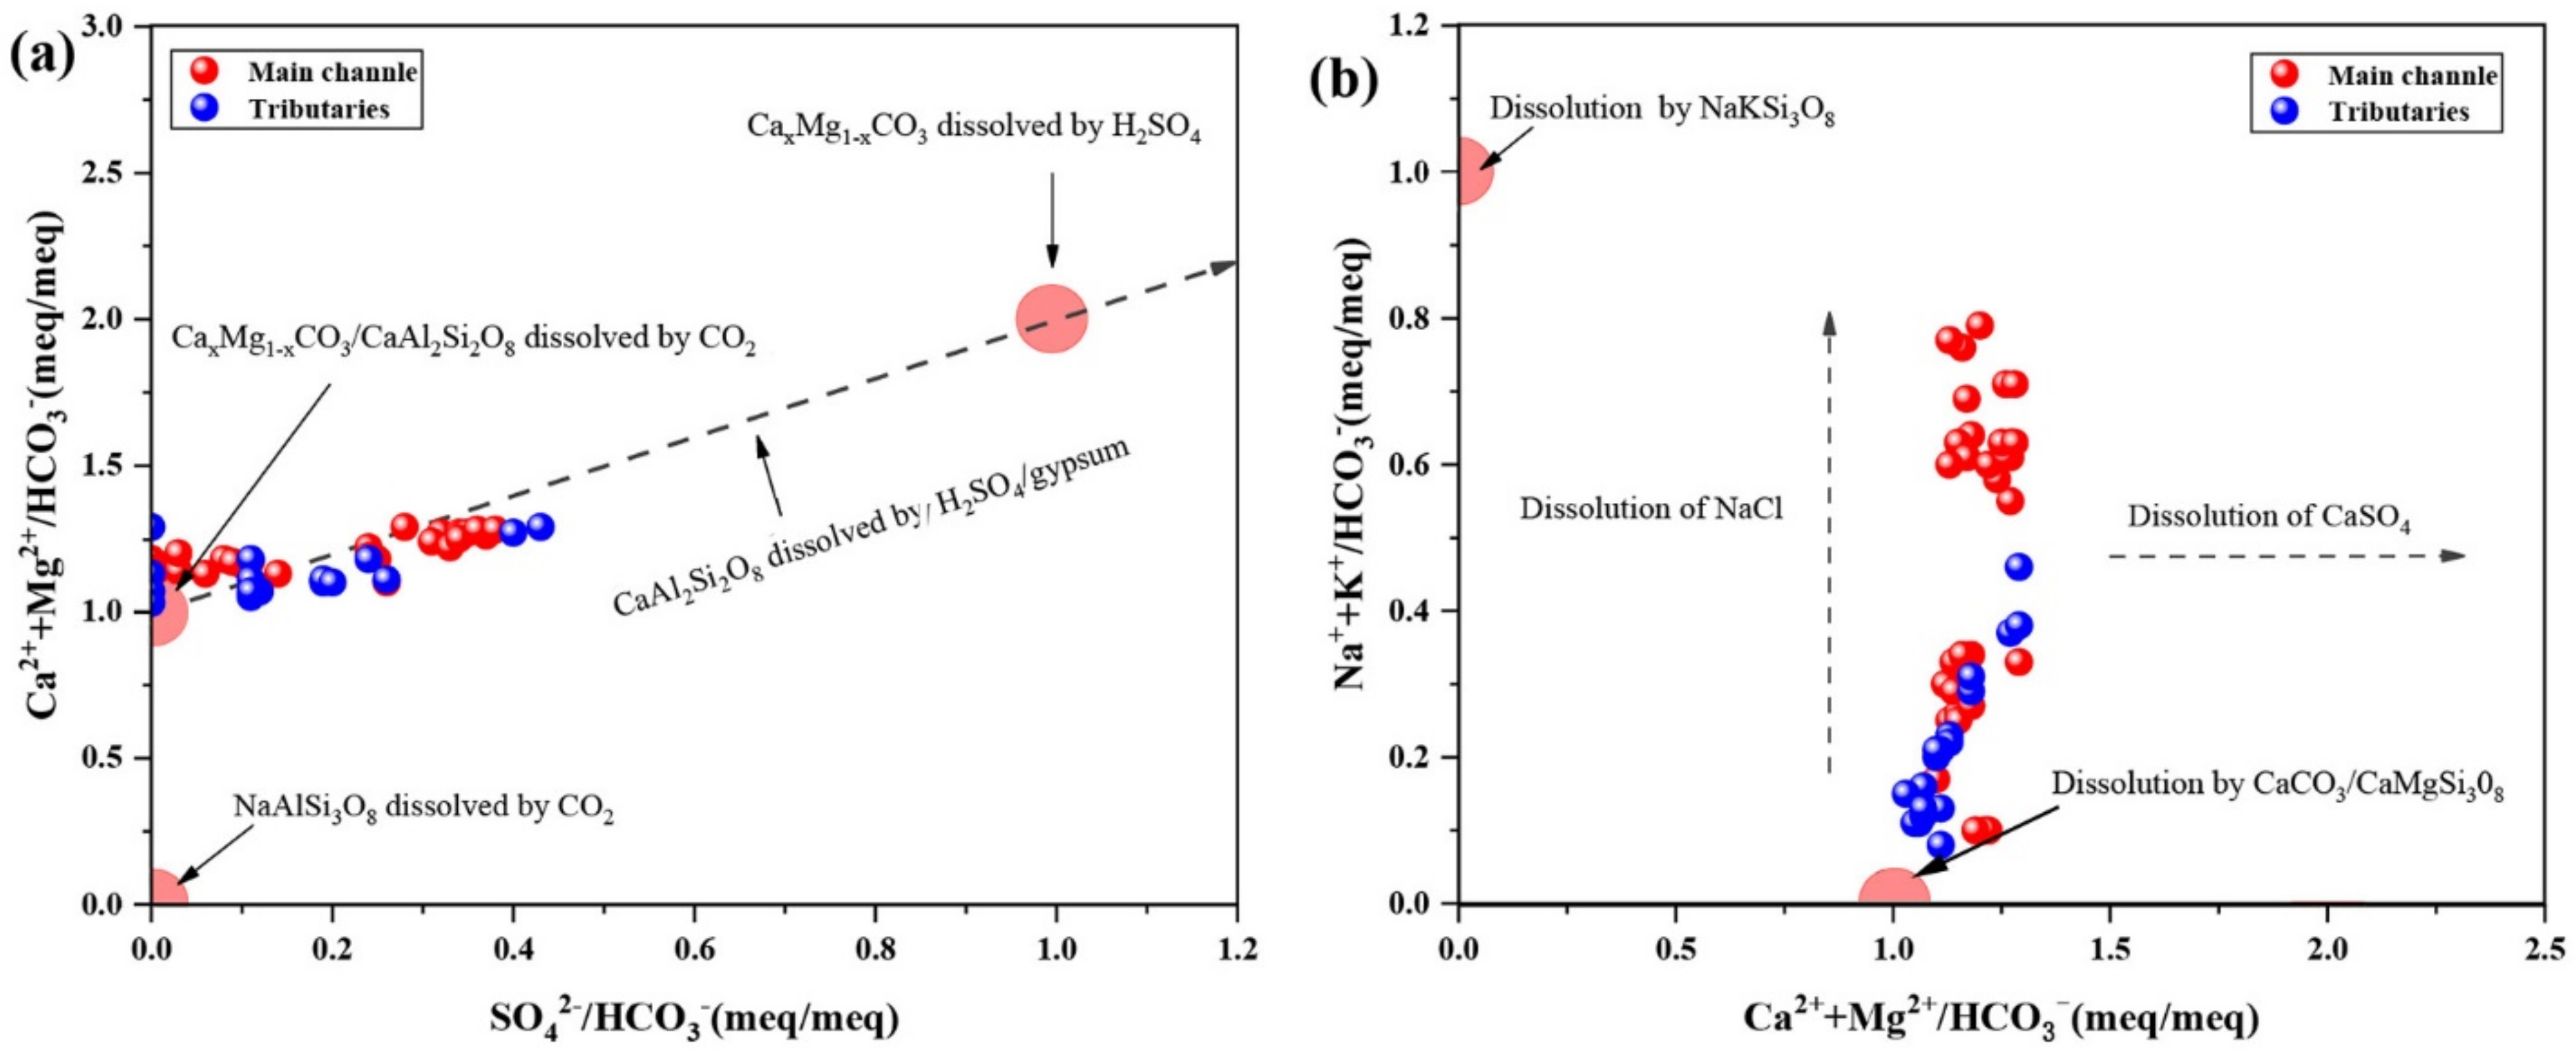
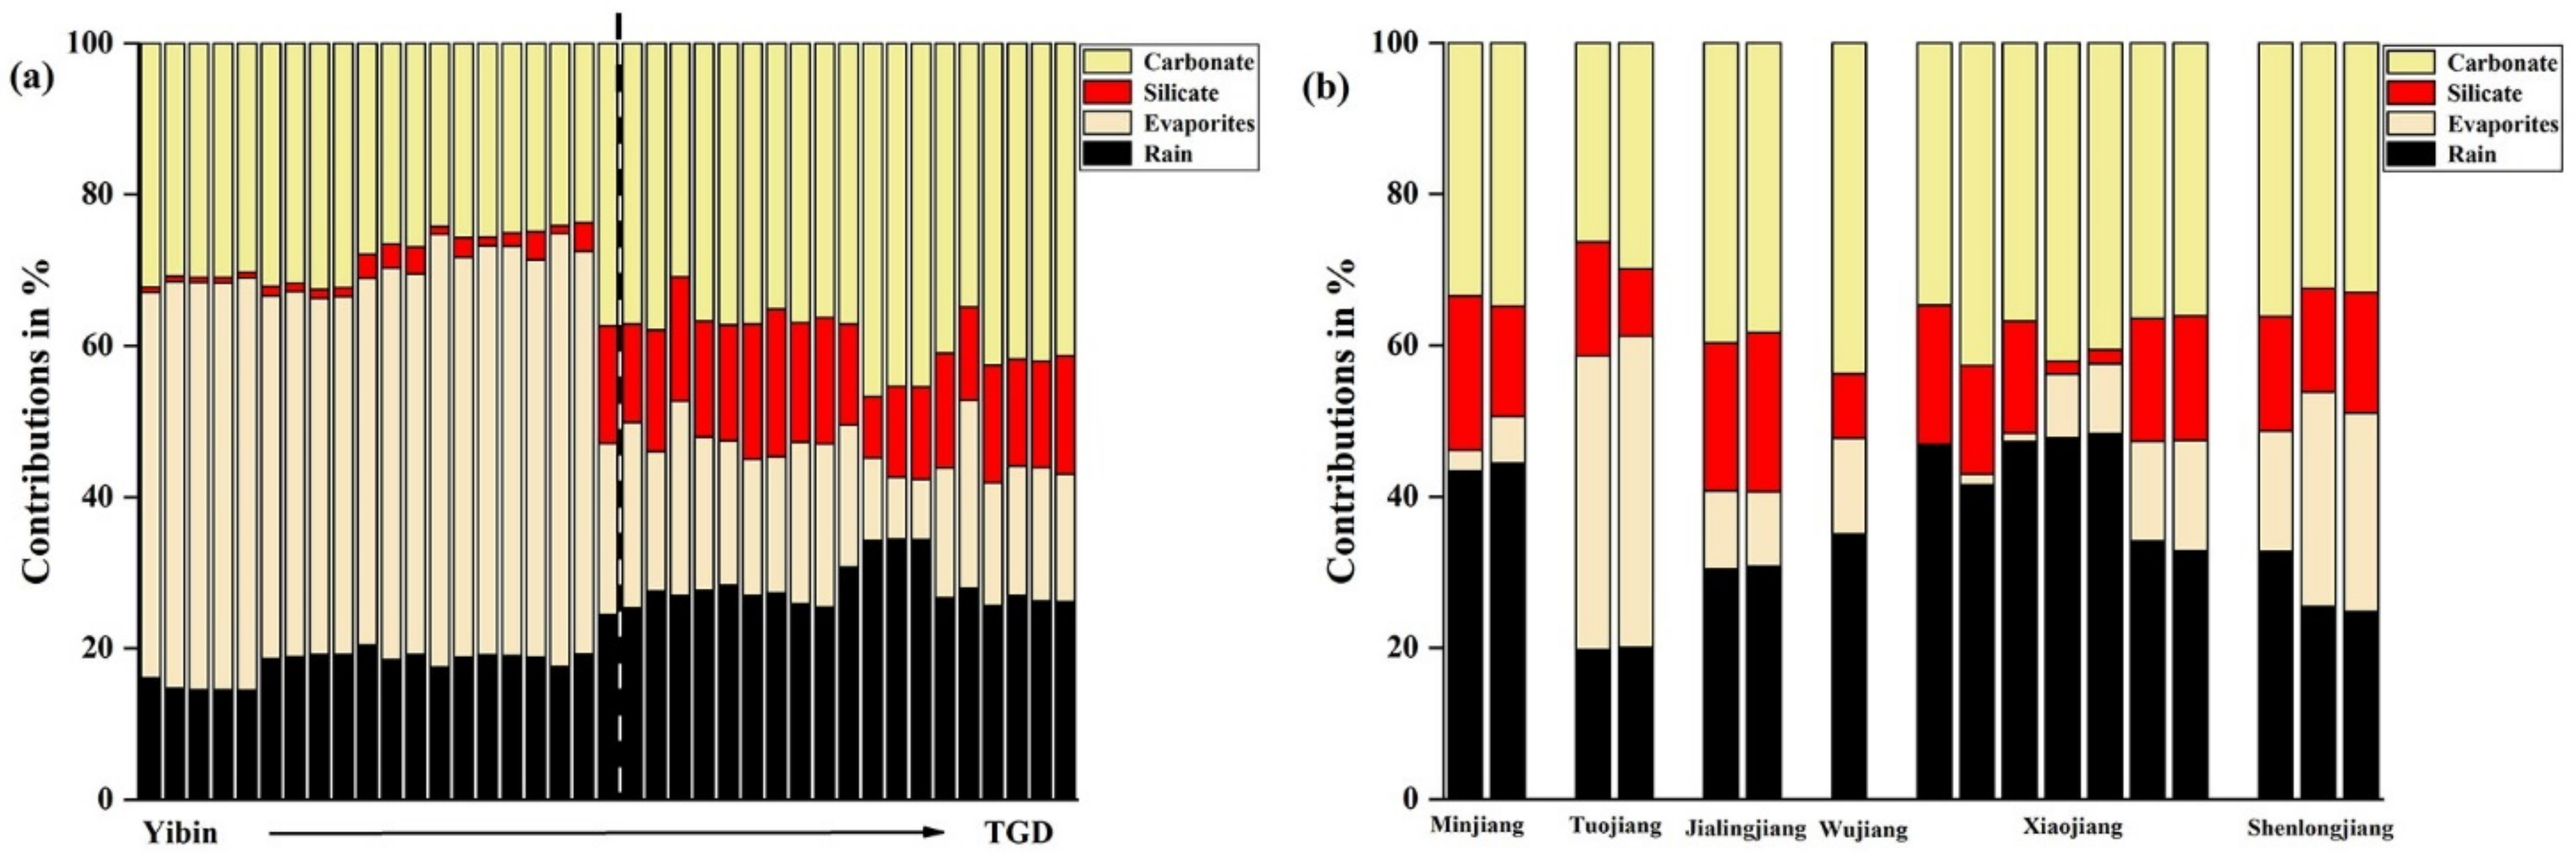
3.2. Stoichiometry of Weathering Processes

As shown in Figure 4, the elemental ratio of the main channel and tributaries upstream of the TGR was distributed between the end-members of evaporites, silicates and carbonates, indicating a process of mixed weathering occurred in the catchment. Most data collected from other years within the study area are distributed within the range in our data, Showed a similar contribution to weathering. The sampling points from Chetelat et al. [34] and Ding et al. [76] are the closest to this study, but their data sample point distribution is closer to between silicates and carbonates end-member. Ratios near the end-member of evaporites were mostly from Yibin and Luzhou, and the content of Na+ and Cl in these samples was higher than that in other regions. This may be due to the heavy rainfall. The precipitation during the sampling period was 40–70% higher than it in previous years, and evaporites in the Yibin-Luzhou region contributed more than those in the lower reaches [34], the combined action of these conditions may lead to the increase of local evaporates dissolution.
In Figure 5a, three red circles represent the three different end-members, respectively. According to Equations (4)–(9), when the value of [HCO3/Ca2+ + Mg2+] is about 2 and the ratio of [SO42−/HCO3] is close to 1, the dissolution of CaxMg1-XCO3 is caused only by sulfuric acid. If carbonic acid completely controlled the dissolution of CaAl2Si2O8 or CaxMg1−XCO3, the value of [HCO3/Ca2+ + Mg2+] and [HCO3/SO42−] should be 0. In addition to these, there are end-members of albite dissolution. In this study, the ion ratios of the TGR were littered between three end-members. The [Ca2+ + Mg2+/HCO3] values of most samples were close to 1, and the ratios of [SO42−/HCO3] were distributed between 0 and 0.5. This result suggests that the minerals of the TGR were mainly dissolute by carbonic acid. In addition, the farther the sampling point was from the dam, the greater the ratio of [Ca2+ + Mg2+/HCO3] and [SO42−/HCO3]. There is no volcanic activity or mineral deposit in the TGR basin, but evaporitic rocks are present [67]. Dissolution of gypsum in evaporitic rocks produces SO42−, which can increase the ratios of [SO42−/HCO3]. According to previous studies, the contribution of evaporites to the Changjiang River Basin decreases gradually from the upper to the lower reaches, which is consistent with the trend of these ratios [34,58]. Thus, the contribution of SO42− in our study possibly from gypsum dissolution in evaporites.
Similarly, the two end-members in Figure 5b were defined according to Formulas (4)–(9). If the ions in the river were all formed by dissolving NaKSi3O8, then [Ca2+ + Mg2+/HCO3] should close to 0. Correspondingly, if all contribution derived from CaCO3 and CaMgSi3O8, the ratios of [Na+ + K+/HCO3] and [Ca2+ + Mg2+/HCO3] are 0 and 1, respectively. The distribution of all ratios was between two end-members, and the ratios of [Ca2+ + Mg2+/HCO3] were higher than [Na+ + K+/HCO3]. This result suggests the TGR basin was more derived from weathering of CaCO3 and CaMgSi3O8. Another trend from data was farther away from the dam, follows by higher ratios of [Na+ + K+/HCO3] and [Ca2+ + Mg2+/HCO3]. As discussed earlier, the dissolution of evaporitic rocks can provide Na+, Cl, and SO42−. This trend is consistent with the geological background of the study area [34,57,58]. In addition, human activities (e.g., industrial production and irrigation) may also contribute to the concentration of [Na+ + K+] [5,81].
Discussing the source apportionment of the river solutes in the TGR can reflect the contribution of different sources. The sources of riverine ions include atmospheric precipitation, chemical weathering and human activities [39,72,82]. The atmospheric input mainly refers to the precipitation since the abundance of rainfall during the sampling period (Figure 2) has an important contribution to the river ions in the TGR. According to the geological background of the study area (Figure 1), this basin is dominated by large areas of carbonate rocks, gypsum-based evaporites and silicate minerals such as feldspar. Usually, Mg2+ and Ca2+ are primarily produced from the dissolution of silicates, evaporites and carbonates, SO42− and Cl are connect with dissolved evaporate rocks, K+ and NO3 are mainly related to atmosphere and anthropogenic inputs [73,83]. K+ and Na+ can also be derived from the dissolution of salts and weathering of feldspar. The previous results showed that the content of K+ was low (Table 1), and there was no significant correlation with Cl (Table 3), so the contribution of potassium salts was excluded. Due to the low concentration of K+ and NO3-N in samples, anthropogenic inputs were not considered as a part of the ion source. Therefore, the potential source of the main ions in the TGR is expressed as follows:
[ K + ] river = [ K + ] atmosphere + [ K + ] silicates
[ Cl ] river = [ Cl ] atmosphere + [ Cl ] evaporites
[ SO 4 2 ] river = [ SO 4 2 ] atmosphere + [ SO 4 2 ] evaporites
[ Na + ] river = [ Na + ] atmosphere + [ Na + ] evaporites + [ Na + ] silicates
[ Ca 2 + ] river = [ Ca 2 + ] atmosphere + [ Ca 2 + ] evaporites + [ Ca 2 + ] silicates + [ Ca 2 + ] carbonates
[ Mg 2 + ] river = [ Mg 2 + ] atmosphere + [ Mg 2 + ] evaporites + [ Mg 2 + ] silicates + [ Mg 2 + ] carbonates
[ Cl ] evaporites = [ Na + ] evaporites
[ SO 4 2 ] evaporites = [ Ca 2 + ] evaporites
The lowest value of Cl (0.08 mmol/L) in the river was assumed to be the concentration of it in rainfall. Subsequently, the atmospheric input of other ions was calculated by the ratio between each ion and Cl in rainwater (Table 4). Then the contributions of [K+]silicates, [Cl]evaporites and [SO42−]evaporites can be calculated by subtracting their respective concentrations in the rain from their respective concentration in the river. Since [Cl]evaporites is equal to [Na+]evaporites, the [Na+]river is equal to the sum of the atmosphere input and silicates concentrations of Na+ and the evaporites content of Cl. With reference equilibrium formulas (Equations (10)–(17)) and ratios of end-members (Table 3), the contribution of different sources of the remaining ions can be calculated in a similar way.
As shown in Figure 6, the contributions of each source were calculated using the equation and corresponding ratio. Overall, the cations of the Changjiang River trunk stream in the upper reach of the TGR came from evaporite rocks (1–57%) and carbonate rocks (24–47%), accounting for 35% and 34%, respectively on average. The closer to the TGD, the more cation accumulation in the trunk stream was affected by carbonate weathering and rainfall (Figure 6a). The left side of the dotted line is the samples of Yibin-Luzhou, while 52% of cations in the main stream were from evaporite rocks and rarely came from silicate (14%), which was similar to the report of Chetelat et al. [34]. The data to the right of the dotted line belongs to Chongqing—TGD. The cationic contribution of evaporite rocks to these samples only accounts for 18%, while the contribution of carbonate rocks accounts for 39% at most. In tributaries (Figure 6b), carbonate weathering (account for 37%) and precipitation (account for 35%) play an important role in cation accumulation. This result corresponds to ratios of [Na+ + K+/HCO3] to [Ca2+ + Mg2+/HCO3] (Figure 5b). In addition, evaporite rocks made the most contribution to the cations in the Tuojiang River, accounting for about 40%. The contribution rate of evaporite to Xiaojiang River gradually increases from upper to lower reaches. In general, in the wet season, the contribution of major elements in the upper reach of the TGR mainly comes from rainfall and the dissolution of carbonate rocks and evaporite rocks.
In fact, the concentrations of ions in the river water were also affected by the dissolution rates of rocks [73,80]. Different rock types have different dissolution rates, which can result in differences in actual rock weathering contribution rates from theoretical ones calculated by the mass balance equation, especially during the flood season (increased rainfall and runoff). Usually, the dissolving rate of evaporates is much higher than carbonates and silicates [34,72]. Hence, during the flood events, it can be inferred that the actual contribution rate of evaporites can be larger than the calculated values in evaporites-rich regions (such as Yibin-Luzhou), while the contribution rate of silicates and carbonates may be smaller. Overall, the trends of rock contribution rates in Figure 6 were reliable because these trends were consistent with the geological background and the law of dissolution.

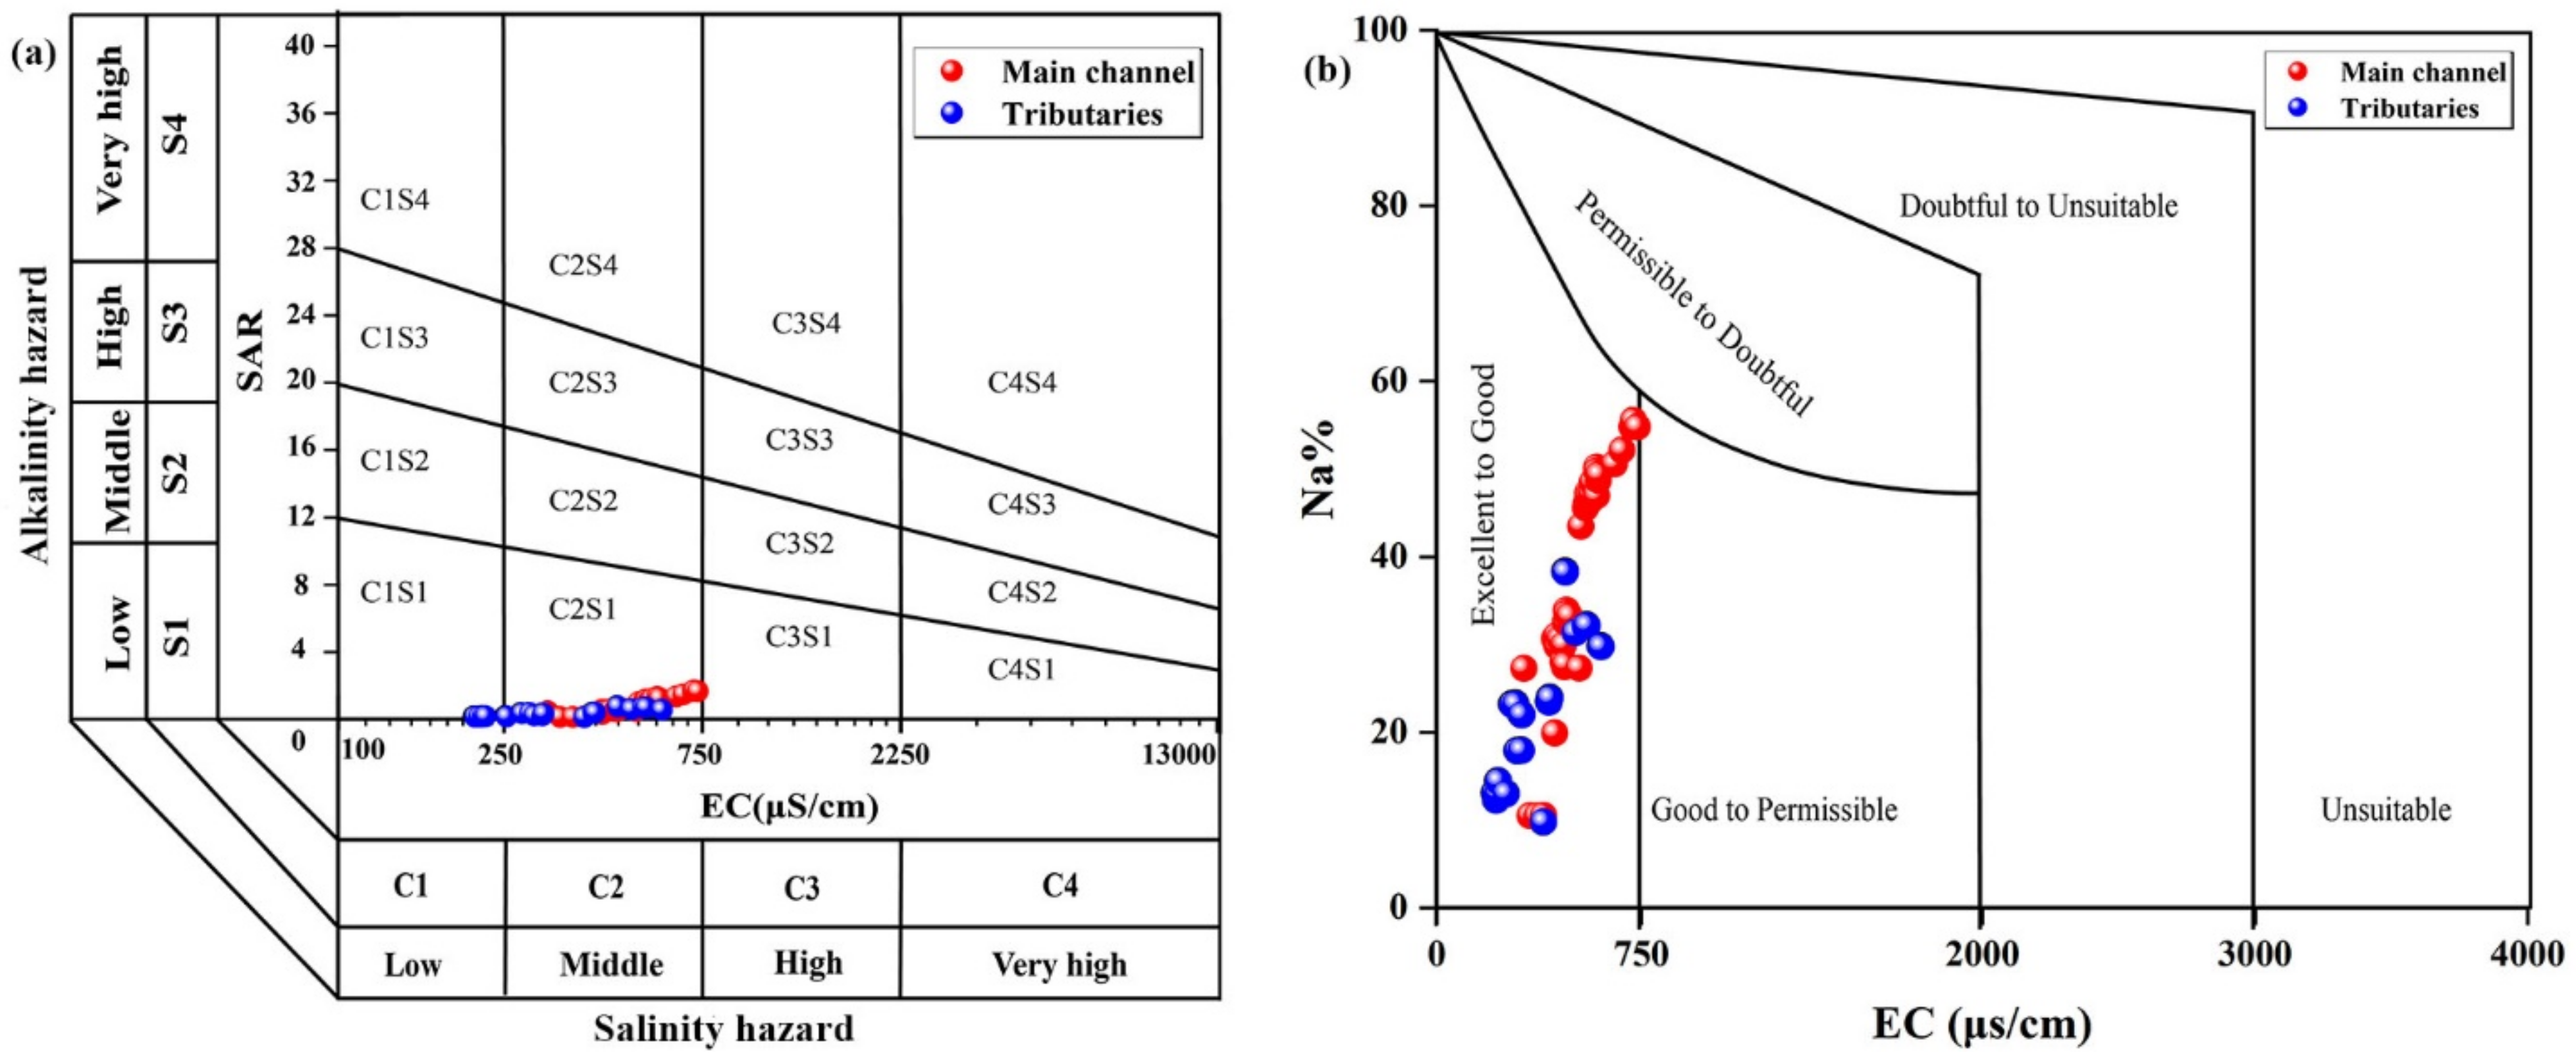
3.3. Potential Risks to Water Quality from Chemical Weathering

The Changjiang River flowing through the TGR is the main source of agricultural irrigation [84,85]. The acceleration of chemical weathering can cause solute changes in water, which is possible to affect the soil quality of farmland [50,81,86]. In this study, the index of SAR, Na% and RSC, which reflect the sodium hazard of irrigation water to the soil, was used to show the impact of accelerated weathering on water salinity and alkalinity.
SAR < 1, Na% < 30% and RSC < 1 in water samples were considered to be excellent or good quality. In the trunk stream, the SAR and Na% values of most sample points distributed in urban areas (Yibin, Luzhou and Chongqing) were higher (SAR > 1 and Na% > 30%) than in other regions, and the same characteristic occurs in the Tuojiang River, suggesting a sodium hazard. Accelerating chemical weathering can be the reason. A rainstorm can accelerate the erosion of the rock and soil [87]; meanwhile, rainwater falling into the river also increases the amounts of ions in water. As shown in Figure 7, the United States salinity laboratory diagram (USSL) and Wilcox diagrams are used to indicate the potential salinity hazard in the TGR. All sampling sites were distributed in C2S1 and C1S1 (C stands for conductivity and S for salinity) and “excellent to good” space from diagrams. This result indicates that the irrigation water in this region was of good quality and have a low risk of salinization. Overall, potential sodium hazards in this basin need to be paid attention to. Especially in urban areas, targeted policies need to be developed.

4. Conclusions

Composition analysis, source identification and sodium hazard assessment of the major ions in the upper reach of the TGR rivers during the wet season, which was performed by statistical and stoichiometric methods. The chemical weathering processes change during flood events, while the composition and source of the river solutes vary on a watershed scale. The conclusions can be list as follows:
(1)
The dominant hydrochemical facies was Ca2+ − Mg2+ − HCO3. The order of cationic was Ca2+ > Mg2+ > Na+ + K+, while the order of anions was HCO3 > Cl > SO42−. Ca2+ and HCO3 dominated the total cations and anions, respectively;
(2)
Hydrochemistry of the river during flood events was controlled by the weathering of carbonates and evaporites. Cationic sources of Yibin-Luzhou River trunk were mainly from weathering of gypsum-rich evaporite rocks, while weathering of carbonate rocks was dominant in the TGR section;
(3)
Due to chemical weathering accelerated by heavy rains, sodium hazards exist in Changjiang River that flows through Yibin, Luzhou and Chongqing. Long-term watering of the land can damage soil aggregates, thereby affecting crop yields. Measures need to be taken to improve water quality.
Overall, the ionic composition of the river water in the TGR was mainly derived from natural chemical weathering, which was controlled by the weathering of evaporites and carbonates, and their contributions vary significantly from the upstream to the downstream. This study provides effective data support for understanding the chemical weathering of the river water in the TGR during the flood period and is helpful to understand better the impact of large-scale hydropower projects on the ecological environment. However, as it is greatly affected by natural conditions and human activities, the source of the river solute is very complex, which requires long-term monitoring and more diversified methods to study.

Supplementary Materials

The following are available online at https://www.mdpi.com/2073-4441/13/4/454/s1, Table S1. Raw data of major ions concentration and other hydrochemical parameters in TGR. Table S2. Raw data of precipitation and inflow in TGR (Changjiang River Hydrological Network, www.cjh.com.cn (11 December 2020)).

Author Contributions

Conceptualization, G.H. and D.W.; methodology, J.Z., X.L. and D.W.; validation, D.W. and G.H.; formal analysis, D.W., J.Z. and X.L.; investigation, M.H. and Y.W.; data curation, D.W.; writing—original draft preparation, D.W., J.L. and G.H.; writing—review and editing, D.W., G.H., and J.L.; project administration, G.H.; funding acquisition, G.H. All authors have read and agreed to the published version of the manuscript.

Funding

This work was supported jointly by the National Natural Science Foundation of China (No., U1802241, 41325010) and the State Key Laboratory of Simulation and Regulation of Water Cycle in River Basin (SKL2020TS07).

Institutional Review Board Statement

Not applicabable.

Informed Consent Statement

Not applicabable.

Data Availability Statement

The data presented in this study are available in Supplementary Materials.

Acknowledgments

The authors gratefully acknowledge the group of Mingming Hu for their assistance with field sampling.

Conflicts of Interest

The authors declare no conflict of interests.

References

  1. Beusen, A.H.W.; Bouwman, A.F.; Van Beek, L.P.H.; Mogollón, J.M.; Middelburg, J.J. Global riverine N and P transport to ocean increased during the 20th century despite increased retention along the aquatic continuum. Biogeosciences 2016, 13, 2441–2451. [Google Scholar] [CrossRef] [Green Version]
  2. Sharples, J.; Middelburg, J.J.; Fennel, K.; Jickells, T.D. What proportion of riverine nutrients reaches the open ocean? Glob. Biogeochem. Cycles 2017, 31, 39–58. [Google Scholar] [CrossRef] [Green Version]
  3. Zeng, J.; Han, G. Preliminary copper isotope study on particulate matter in Zhujiang River, southwest China: Application for source identification. Ecotoxicol. Environ. Saf. 2020, 198, 110663. [Google Scholar] [CrossRef]
  4. Jones, E.; Qadir, M.; Van Vliet, M.T.; Smakhtin, V.; Kang, S.-M. The state of desalination and brine production: A global outlook. Sci. Total Environ. 2019, 657, 1343–1356. [Google Scholar] [CrossRef] [PubMed]
  5. Li, P.; He, S.; He, X.; Tian, R. Seasonal Hydrochemical Characterization and Groundwater Quality Delineation Based on Matter Element Extension Analysis in a Paper Wastewater Irrigation Area, Northwest China. Expo. Health 2017, 10, 241–258. [Google Scholar] [CrossRef]
  6. Adimalla, N. Groundwater Quality for Drinking and Irrigation Purposes and Potential Health Risks Assessment: A Case Study from Semi-Arid Region of South India. Expo. Health 2019, 11, 109–123. [Google Scholar] [CrossRef]
  7. Kuriqi, A.; Pinheiro, A.N.; Sordo-Ward, A.; Garrote, L. Influence of hydrologically based environmental flow methods on flow alteration and energy production in a run-of-river hydropower plant. J. Clean. Prod. 2019, 232, 1028–1042. [Google Scholar] [CrossRef]
  8. Reid, A.J.; Carlson, A.K.; Creed, I.F.; Eliason, E.J.; Gell, P.A.; Johnson, P.T.J.; Kidd, K.A.; MacCormack, T.J.; Olden, J.D.; Ormerod, S.J.; et al. Emerging threats and persistent conservation challenges for freshwater biodiversity. Biol. Rev. 2018, 94, 849–873. [Google Scholar] [CrossRef] [Green Version]
  9. Moran, E.F.; Lopez, M.C.; Moore, N.; Müller, N.; Hyndman, D.W. Sustainable hydropower in the 21st century. Proc. Natl. Acad. Sci. USA 2018, 115, 11891–11898. [Google Scholar] [CrossRef] [Green Version]
  10. Zhang, P.; Qin, C.; Hong, X.; Kang, G.; Qin, M.; Yang, D.; Pang, B.; Li, Y.; He, J.; Dick, R.P. Risk assessment and source analysis of soil heavy metal pollution from lower reaches of Yellow River irrigation in China. Sci. Total Environ. 2018, 633, 1136–1147. [Google Scholar] [CrossRef]
  11. Zeng, J.; Han, G.; Yang, K. Assessment and sources of heavy metals in suspended particulate matter in a tropical catchment, northeast Thailand. J. Clean. Prod. 2020, 265, 121898. [Google Scholar] [CrossRef]
  12. Luo, W.; Su, L.; Craig, N.J.; Du, F.; Wu, C.; Shi, H. Comparison of microplastic pollution in different water bodies from urban creeks to coastal waters. Environ. Pollut. 2019, 246, 174–182. [Google Scholar] [CrossRef]
  13. Kumar, V.; Sharma, A.; Kumar, R.; Bhardwaj, R.; Thukral, A.K.; Rodrigo-Comino, J. Assessment of heavy-metal pollution in three different Indian water bodies by combination of multivariate analysis and water pollution indices. Hum. Ecol. Risk Assess. Int. J. 2018, 26, 1–16. [Google Scholar] [CrossRef]
  14. Zeng, J.; Han, G. Tracing zinc sources with Zn isotope of fluvial suspended particulate matter in Zhujiang River, southwest China. Ecol. Indic. 2020, 118, 106723. [Google Scholar] [CrossRef]
  15. Drake, T.W.; Raymond, P.A.; Spencer, R.G.M. Terrestrial carbon inputs to inland waters: A current synthesis of estimates and uncertainty. Limnol. Oceanogr. Lett. 2018, 3, 132–142. [Google Scholar] [CrossRef] [Green Version]
  16. Abril, G.; Martinez, J.-M.; Artigas, L.F.; Moreira-Turcq, P.; Benedetti, M.F.; Vidal, L.; Meziane, T.; Kim, J.-H.; Bernardes, M.C.; Savoye, N.; et al. Amazon River carbon dioxide outgassing fuelled by wetlands. Nat. Cell Biol. 2013, 505, 395–398. [Google Scholar] [CrossRef]
  17. Li, S.; Luo, J.; Wu, D.; Xu, Y.J. Carbon and nutrients as indictors of daily fluctuations of pCO2 and CO2 flux in a river draining a rapidly urbanizing area. Ecol. Indic. 2020, 109, 105821. [Google Scholar] [CrossRef]
  18. Han, G.; Tang, Y.; Wu, Q.; Liu, M.; Wang, Z. Assessing Contamination Sources by Using Sulfur and Oxygen Isotopes of Sulfate Ions in Xijiang River Basin, Southwest China. J. Environ. Qual. 2019, 48, 1507–1516. [Google Scholar] [CrossRef] [PubMed]
  19. Duvert, C.; Butman, D.; Marx, A.; Ribolzi, O.; Hutley, L.B. CO2 evasion along streams driven by groundwater inputs and geomorphic controls. Nat. Geosci. 2018, 11, 813–818. [Google Scholar] [CrossRef]
  20. Lauerwald, R.; Laruelle, G.G.; Hartmann, J.; Ciais, P.; Regnier, P.A. Spatial patterns in CO2 evasion from the global river network. Glob. Biogeochem. Cycles 2015, 29, 534–554. [Google Scholar] [CrossRef] [Green Version]
  21. Li, X.; Han, G.; Liu, M.; Song, C.; Zhang, Q.; Yang, K.; Liu, J. Hydrochemistry and Dissolved Inorganic Carbon (DIC) Cycling in a Tropical Agricultural River, Mun River Basin, Northeast Thailand. Int. J. Environ. Res. Public Health 2019, 16, 3410. [Google Scholar] [CrossRef] [Green Version]
  22. Liu, J.; Han, G. Effects of chemical weathering and CO2 outgassing on δ13CDIC signals in a karst watershed. J. Hydrol. 2020, 589, 125192. [Google Scholar] [CrossRef]
  23. Marx, A.; Dusek, J.; Jankovec, J.; Sanda, M.; Vogel, T.; Van Geldern, R.; Hartmann, J.; Barth, J.A.C. A review of CO2 and associated carbon dynamics in headwater streams: A global perspective. Rev. Geophys. 2017, 55, 560–585. [Google Scholar] [CrossRef]
  24. Maher, K.; Chamberlain, C.P. Hydrologic Regulation of Chemical Weathering and the Geologic Carbon Cycle. Science 2014, 343, 1502–1504. [Google Scholar] [CrossRef]
  25. Kaushal, S.S.; Likens, G.E.; Pace, M.L.; Utz, R.M.; Haq, S.; Gorman, J.; Grese, M. Freshwater salinization syndrome on a continental scale. Proc. Natl. Acad. Sci. USA 2018, 115, E574–E583. [Google Scholar] [CrossRef] [Green Version]
  26. Liu, J.; Han, G.; Liu, X.; Yang, K.; Li, X.; Liu, M. Examining the Distribution and Variation of Dissolved Carbon Species and Seasonal Carbon Exports within the Jiulongjiang River Basin (Southeast China). J. Coast. Res. 2019, 35, 784. [Google Scholar] [CrossRef]
  27. Zhong, J.; Li, S.-L.; Liu, J.; Ding, H.; Sun, X.; Xu, S.; Wang, T.; Ellam, R.M.; Liu, C. Climate Variability Controls on CO2 Consumption Fluxes and Carbon Dynamics for Monsoonal Rivers: Evidence from Xijiang River, Southwest China. J. Geophys. Res. Biogeosci. 2018, 123, 2553–2567. [Google Scholar] [CrossRef] [Green Version]
  28. Liu, J.; Han, G. Controlling factors of riverine CO2 partial pressure and CO2 outgassing in a large karst river under base flow condition. J. Hydrol. 2021, 593, 125638. [Google Scholar] [CrossRef]
  29. Quesada, B.; Arneth, A.; Robertson, E.; De Noblet-Ducoudré, N.; De Noblet, N. Potential strong contribution of future anthropogenic land-use and land-cover change to the terrestrial carbon cycle. Environ. Res. Lett. 2018, 13, 064023. [Google Scholar] [CrossRef]
  30. Ru, H.; Li, Y.; Sheng, Q.; Zhong, L.; Ni, Z. River damming affects energy flow and food web structure: A case study from a subtropical large river. Hydrobiology 2019, 847, 679–695. [Google Scholar] [CrossRef]
  31. Peng, X.; Liu, C.; Wang, B.; Zhao, Y.-C. The impact of damming on geochemical behavior of dissolved inorganic carbon in a karst river. Chin. Sci. Bull. 2014, 59, 2348–2355. [Google Scholar] [CrossRef]
  32. Liu, D.; Bai, Y.; He, X.; Pan, D.; Chen, C.-T.A.; Li, T.; Xu, Y.; Gong, C.; Zhang, L. Satellite-derived particulate organic carbon flux in the Changjiang River through different stages of the Three Gorges Dam. Remote Sens. Environ. 2019, 223, 154–165. [Google Scholar] [CrossRef]
  33. Yang, S.L.; Xu, K.H.; Milliman, J.D.; Yang, H.F.; Wu, C.S. Decline of Yangtze River water and sediment discharge: Impact from natural and anthropogenic changes. Sci. Rep. 2015, 5, 12581. [Google Scholar] [CrossRef]
  34. Chetelat, B.; Liu, C.-Q.; Zhao, Z.; Wang, Q.; Li, S.; Li, J.; Wang, B. Geochemistry of the dissolved load of the Changjiang Basin rivers: Anthropogenic impacts and chemical weathering. Geochim. Cosmochim. Acta 2008, 72, 4254–4277. [Google Scholar] [CrossRef]
  35. Jiang, H.; Liu, W.; Zhao, T.; Sun, H.; Xu, Z. Water geochemistry of rivers draining karst-dominated regions, Guangxi province, South China: Implications for chemical weathering and role of sulfuric acid. J. Asian Earth Sci. 2018, 163, 152–162. [Google Scholar] [CrossRef]
  36. Roberts, D.S.; Raol, Y.H.; Bandyopadhyay, S.; Lund, I.V.; Budreck, E.C.; Passini, M.J.; Wolfe, J.H.; Brooks-Kayal, A.R.; Russek, S.J. Egr3 stimulation of GABRA4 promoter activity as a mechanism for seizure-induced up-regulation of GABAA receptor 4 subunit expression. Proc. Natl. Acad. Sci. USA 2005, 102, 11894–11899. [Google Scholar] [CrossRef] [Green Version]
  37. Shao, J.; Yang, S.; Li, C. Chemical indices (CIA and WIP) as proxies for integrated chemical weathering in China: Inferences from analysis of fluvial sediments. Sediment. Geol. 2012, 110–120. [Google Scholar] [CrossRef]
  38. Liu, X.-L.; Han, G.; Zeng, J.; Liu, M.; Li, X.-Q.; Boeckx, P. Identifying the sources of nitrate contamination using a combined dual isotope, chemical and Bayesian model approach in a tropical agricultural river: Case study in the Mun River, Thailand. Sci. Total Environ. 2021, 760, 143938. [Google Scholar] [CrossRef]
  39. Tipper, E.T.; LeMarchand, E.; Hindshaw, R.S.; Reynolds, B.C.; Bourdon, B. Seasonal sensitivity of weathering processes: Hints from magnesium isotopes in a glacial stream. Chem. Geol. 2012, 312–313, 80–92. [Google Scholar] [CrossRef]
  40. Zhang, Z.-H.; Liu, W.; Han, L.; Chen, X.; Cui, Q.; Yao, H.; Wang, Z. Disintegration behavior of strongly weathered purple mudstone in drawdown area of three gorges reservoir, China. Geomorphology 2018, 315, 68–79. [Google Scholar] [CrossRef]
  41. Galy, V.; Peucker-Ehrenbrink, B.; Eglinton, T. Global carbon export from the terrestrial biosphere controlled by erosion. Nat. Cell Biol. 2015, 521, 204–207. [Google Scholar] [CrossRef] [PubMed]
  42. Aufdenkampe, A.K.; Mayorga, E.; Raymond, A.P.; Melack, J.M.; Doney, S.C.; Alin, S.R.; Aalto, R.E.; Yoo, K. Riverine coupling of biogeochemical cycles between land, oceans, and atmosphere. Front. Ecol. Environ. 2011, 9, 53–60. [Google Scholar] [CrossRef] [Green Version]
  43. Marchina, C.; Natali, C.; Fahnestock, M.; Pennisi, M.; Bryce, J.; Bianchini, G. Strontium isotopic composition of the Po river dissolved load: Insights into rock weathering in Northern Italy. Appl. Geochem. 2018, 97, 187–196. [Google Scholar] [CrossRef]
  44. Qu, B.; Zhang, Y.; Kang, S.; Sillanpää, M. Water quality in the Tibetan Plateau: Major ions and trace elements in rivers of the “Water Tower of Asia”. Sci. Total Environ. 2019, 649, 571–581. [Google Scholar] [CrossRef]
  45. Dalai, T.; Krishnaswami, S.; Sarin, M. Major ion chemistry in the headwaters of the Yamuna river system. Geochim. Cosmochim. Acta 2002, 66, 3397–3416. [Google Scholar] [CrossRef]
  46. Pant, R.R.; Zhang, F.; Rehman, F.U.; Wang, G.; Ye, M.; Zeng, C.; Tang, H. Spatiotemporal variations of hydrogeochemistry and its controlling factors in the Gandaki River Basin, Central Himalaya Nepal. Sci. Total Environ. 2018, 622, 770–782. [Google Scholar] [CrossRef] [PubMed]
  47. Han, G.; Liu, C.-Q. Water geochemistry controlled by carbonate dissolution: A study of the river waters draining karst-dominated terrain, Guizhou Province, China. Chem. Geol. 2004, 204, 1–21. [Google Scholar] [CrossRef]
  48. Ding, H.; Liu, C.-Q.; Zhao, Z.-Q.; Li, S.-L.; Lang, Y.-C.; Li, X.-D.; Hu, J.; Liu, B.-J. Geochemistry of the dissolved loads of the Liao River basin in northeast China under anthropogenic pressure: Chemical weathering and controlling factors. J. Asian Earth Sci. 2017, 138, 657–671. [Google Scholar] [CrossRef]
  49. Liu, J.; Han, G.; Liu, X.-L.; Liu, M.; Song, C.; Zhang, Q.; Yang, K.; Li, X. Impacts of Anthropogenic Changes on the Mun River Water: Insight from Spatio-Distributions and Relationship of C and N Species in Northeast Thailand. Int. J. Environ. Res. Public Health 2019, 16, 659. [Google Scholar] [CrossRef] [PubMed] [Green Version]
  50. Alexakis, D.E.; Gotsis, D.; Giakoumakis, S. Assessment of drainage water quality in pre- and post-irrigation seasons for supplemental irrigation use. Environ. Monit. Assess. 2011, 184, 5051–5063. [Google Scholar] [CrossRef]
  51. Kaushal, S.S.; Duan, S.; Doody, T.R.; Haq, S.; Smith, R.M.; Johnson, T.A.N.; Newcomb, K.D.; Gorman, J.; Bowman, N.; Mayer, P.M.; et al. Human-accelerated weathering increases salinization, major ions, and alkalinization in fresh water across land use. Appl. Geochem. 2017, 83, 121–135. [Google Scholar] [CrossRef]
  52. Wang, H.; Sun, F.; Liu, W. Characteristics of streamflow in the main stream of Changjiang River and the impact of the Three Gorges Dam. Catena 2020, 189, 104498. [Google Scholar] [CrossRef]
  53. Wu, Q.; Han, G. Sulfur isotope and chemical composition of the rainwater at the Three Gorges Reservoir. Atmos. Res. 2015, 155, 130–140. [Google Scholar] [CrossRef]
  54. Dai, Z.; Liu, J.T. Impacts of large dams on downstream fluvial sedimentation: An example of the Three Gorges Dam (TGD) on the Changjiang (Yangtze River). J. Hydrol. 2013, 480, 10–18. [Google Scholar] [CrossRef]
  55. Cui, J.; Zhang, Y.; Yang, F.; Chang, Y.; Du, K.; Chan, A.; Yao, D. Seasonal fluxes and sources apportionment of dissolved inorganic nitrogen wet deposition at different land-use sites in the Three Gorges reservoir area. Ecotoxicol. Environ. Saf. 2020, 193, 110344. [Google Scholar] [CrossRef] [PubMed]
  56. Wang, H.; Li, M.; Sun, C.; Wu, W.; Ran, X.; Zang, J. Variability in water chemistry of the Three Gorges Reservoir, China. Heliyon 2020, 6, e03610. [Google Scholar] [CrossRef] [PubMed]
  57. Wang, X.; Yang, S.; Ran, X.; Liu, X.-M.; Bataille, C.P.; Su, N. Response of the Changjiang (Yangtze River) water chemistry to the impoundment of Three Gorges Dam during 2010. Chem. Geol. 2018, 487, 1–11. [Google Scholar] [CrossRef]
  58. Chen, J.; Wang, F.; Xia, X.; Zhang, L. Major element chemistry of the Changjiang (Yangtze River). Chem. Geol. 2002, 187, 231–255. [Google Scholar] [CrossRef]
  59. Ding, S.; Chen, P.; Liu, S.; Zhang, G.; Zhang, J.; Dan, S.F. Nutrient dynamics in the Changjiang and retention effect in the Three Gorges Reservoir. J. Hydrol. 2019, 574, 96–109. [Google Scholar] [CrossRef]
  60. Xu, Z.; Shi, C.; Tang, Y.; Han, H. Chemical and Strontium Isotopic Compositions of the Hanjiang Basin Rivers in China: Anthropogenic Impacts and Chemical Weathering. Aquat. Geochem. 2011, 17, 243–264. [Google Scholar] [CrossRef]
  61. Yang, S.; Jiang, S.; Ling, H.; Xia, X.; Sun, M.; Wang, D. Sr-Nd isotopic compositions of the Changjiang sediments: Implications for tracing sediment sources. Sci. China Ser. D Earth Sci. 2007, 50, 1556–1565. [Google Scholar] [CrossRef]
  62. Zhang, L.; Qiao, B.; Wang, H.; Tian, M.; Cui, J.; Fu, C.; Huang, Y.; Yang, F. Chemical Characteristics of Precipitation in a Typical Urban Site of the Hinterland in Three Gorges Reservoir, China. J. Chem. 2018, 2018, 1–10. [Google Scholar] [CrossRef] [Green Version]
  63. Deng, K.; Yang, S.; Lian, E.; Li, C.; Yang, C.; Wei, H. Three Gorges Dam alters the Changjiang (Yangtze) river water cycle in the dry seasons: Evidence from H-O isotopes. Sci. Total Environ. 2016, 562, 89–97. [Google Scholar] [CrossRef]
  64. Li, S.; Lu, X.; He, M.; Zhou, Y.; Li, L.; Ziegler, A.D. Daily CO2 partial pressure and CO2 outgassing in the upper Yangtze River basin: A case study of the Longchuan River, China. J. Hydrol. 2012, 466, 141–150. [Google Scholar] [CrossRef]
  65. Qin, J.; Huh, Y.; Edmond, J.M.; Du, G.; Ran, J. Chemical and physical weathering in the Min Jiang, a headwater tributary of the Yangtze River. Chem. Geol. 2006, 227, 53–69. [Google Scholar] [CrossRef]
  66. Qin, T.; Yang, P.; Groves, C.; Chen, F.; Xie, G.; Zhan, Z. Natural and anthropogenic factors affecting geochemistry of the Jialing and Yangtze Rivers in urban Chongqing, SW China. Appl. Geochem. 2018, 98, 448–458. [Google Scholar] [CrossRef]
  67. Zhang, A.; Zhang, J.; Liu, S. Spatial and temporal variations of dissolved silicon isotope compositions in a large dammed river system. Chem. Geol. 2020, 545, 119645. [Google Scholar] [CrossRef]
  68. Ma, Y.; Li, S. Spatial and temporal comparisons of dissolved organic matter in river systems of the Three Gorges Reservoir region using fluorescence and UV–Visible spectroscopy. Environ. Res. 2020, 189, 109925. [Google Scholar] [CrossRef]
  69. Wang, T.; Zhou, D.; Sheng, X.; Fan, G.; Zhang, H. Koppen’s climate classification map for China. J. Meteorol. Sci. 2020, 40, 752–760. [Google Scholar] [CrossRef]
  70. Li, S.; Jia, Z. Heavy metals in soils from a representative rapidly developing megacity (SW China): Levels, source identification and apportionment. Catena 2018, 163, 414–423. [Google Scholar] [CrossRef]
  71. Wang, Z.; Yang, S.; Li, P.; Li, C.; Cai, J. Detrital mineral compositions of the Changjiang river sedments and their tracing implications. Acta Eol. Sinica 2006, 24, 570–578. [Google Scholar] [CrossRef]
  72. Herath, I.K.; Wu, S.; Ma, M.H.; Jianli, W.; Chandrajith, R. Tracing controlling factors of riverine chemistry in a headwater tributary of the Yangtze River, China, inferred from geochemical and stable isotopic signatures. Environ. Sci. Pollut. Res. 2019, 26, 23899–23922. [Google Scholar] [CrossRef]
  73. Gaillardet, J.; Dupré, B.; Louvat, P.; Allegre, C.J. Global silicate weathering and CO2 consumption rates deduced from the chemistry of large rivers. Chem. Geol. 1999, 159, 3–30. [Google Scholar] [CrossRef]
  74. Cao, Y.; Tang, C.; Cao, G.; Wang, X. Hydrochemical zoning: Natural and anthropogenic origins of the major elements in the surface water of Taizi River Basin, Northeast China. Environ. Earth Sci. 2016, 75, 811. [Google Scholar] [CrossRef]
  75. Chen, J.; Wang, F.; Meybeck, M.; He, D.; Xia, X.; Zhang, L. Spatial and temporal analysis of water chemistry records (1958–2000) in the Huanghe (Yellow River) basin. Glob. Biogeochem. Cycles 2005, 19, 3016. [Google Scholar] [CrossRef]
  76. Tiping, D.; Gao, J.; Tian, S.; Shi, G.; Chen, F.; Wang, C.; Luo, X.; Han, D. Chemical and Isotopic Characteristics of the Water and Suspended Particulate Materials in the Yangtze River and Their Geological and Environmental Implications. Acta Geol. Sin. 2014, 88, 276–360. [Google Scholar] [CrossRef]
  77. Ran, X.; Yu, Z.; Yao, Q.; Chen, H.; Mi, T. Major ion geochemistry and nutrient behaviour in the mixing zone of the Changjiang (Yangtze) River and its tributaries in the Three Gorges Reservoir. Hydrol. Process. 2010, 24, 2481–2495. [Google Scholar] [CrossRef]
  78. Liu, J.; Han, G. Distributions and Source Identification of the Major Ions in Zhujiang River, Southwest China: Examining the Relationships Between Human Perturbations, Chemical Weathering, Water Quality and Health Risk. Expo. Health 2020, 12, 849–862. [Google Scholar] [CrossRef]
  79. Xu, Z.; Liu, C.-Q. Chemical weathering in the upper reaches of Xijiang River draining the Yunnan–Guizhou Plateau, Southwest China. Chem. Geol. 2007, 239, 83–95. [Google Scholar] [CrossRef]
  80. Zhang, X.; Xu, Z.; Liu, W.; Moon, S.; Zhao, T.; Zhou, X.; Zhang, J.; Wu, Y.; Jiang, H.; Zhou, L. Hydro-Geochemical and Sr Isotope Characteristics of the Yalong River Basin, Eastern Tibetan Plateau: Implications for Chemical Weathering and Controlling Factors. Geochem. Geophys. Geosyst. 2019, 20, 1221–1239. [Google Scholar] [CrossRef]
  81. Liu, J.; Han, G. Major ions and δ34SSO4 in Jiulongjiang River water: Investigating the relationships between natural chemical weathering and human perturbations. Sci. Total Environ. 2020, 724, 138208. [Google Scholar] [CrossRef]
  82. Zhu, H.; Li, Y.; Wu, L.; Yu, S.; Xin, C.; Sun, P.; Xiao, Q.; Zhao, H.; Zhang, Y.; Qin, T. Impact of the atmospheric deposition of major acid rain components, especially NH4, on carbonate weathering during recharge in typical karst areas of the Lijiang River basin, southwest China. Appl. Geochem. 2020, 114, 104518. [Google Scholar] [CrossRef]
  83. Li, X.; Han, G.; Liu, M.; Yang, K.; Liu, J. Hydro-Geochemistry of the River Water in the Jiulongjiang River Basin, Southeast China: Implications of Anthropogenic Inputs and Chemical Weathering. Int. J. Environ. Res. Public Health 2019, 16, 440. [Google Scholar] [CrossRef] [Green Version]
  84. Nakayama, T.; Shankman, D. Evaluation of uneven water resource and relation between anthropogenic water withdrawal and ecosystem degradation in Changjiang and Yellow River basins. Hydrol. Process. 2013, 27, 3350–3362. [Google Scholar] [CrossRef]
  85. Li, S.; Liu, H.; Zhang, L.; Li, X.; Wang, H.; Zhuang, Y.; Zhang, F.; Zhai, L.; Fan, X.; Hu, W.; et al. Potential nutrient removal function of naturally existed ditches and ponds in paddy regions: Prospect of enhancing water quality by irrigation and drainage management. Sci. Total Environ. 2020, 718, 137418. [Google Scholar] [CrossRef] [PubMed]
  86. Alexakis, D.E. Meta-Evaluation of Water Quality Indices. Application into Groundwater Resources. Water 2020, 12, 1890. [Google Scholar] [CrossRef]
  87. Han, G.; Tang, Y.; Liu, M.; Van Zwieten, L.; Yang, X.; Yu, C.; Wang, H.; Song, Z. Carbon-nitrogen isotope coupling of soil organic matter in a karst region under land use change, Southwest China. Agric. Ecosyst. Environ. 2020, 301, 107027. [Google Scholar] [CrossRef]
Figure 1. The sampling sites upstream of the Three Gorges Reservoir (TGR).
Water 13 00454 g001
Figure 2. Daily maximum rainfall and inflow in the TGR during the sampling period. Red asterisks indicate the No. 1 and No. 2 floods of 2020, which have formed in the upper reaches of Changjiang River (from left to right). Data were collected from Changjiang River Hydrological Network (www.cjh.com.cn (accessed on 11 December 2020), more details please see Table S2).
Water 13 00454 g002
Figure 3. Piper diagram of upstream of the TGR.
Water 13 00454 g003
Figure 4. Using Na-normalized molar ratio in the upstream of the TGR.
Water 13 00454 g004
Figure 5. Possible weathering process diagram of ions. (a) the ratios of Ca2+ + Mg2+ and SO42− to HCO3, respectively; (b) ratios of Na+ + K+/HCO3 and Ca2+ + Mg2+/HCO3.
Water 13 00454 g005
Figure 6. Different source ratios of cations in sampling sites. (a) Sources ratios of cations in the main channel; (b) the value of cations sources ratios in different tributaries. In the two pictures, the x-coordinate sample points are arranged in order from far to near distance from TGD.
Water 13 00454 g006
Figure 7. Salinity–alkalinity evaluation of water quality in the TGR. (a) Template of USSL; (b) template of Wilcox.
Water 13 00454 g007
Table 1. Values of major elements and other hydrochemical parameters in the TGR.
ParametersDetection LimitMain Channel
(n 1 = 39)
Tributaries
(n = 18)
RangeMeancv%RangeMeancv%
F (mg/L)0.030.14–1.250.2474.270.16–0.610.2942.54
Cl (mg/L)0.043.27–89.4837.9569.032.84–51.2616.2992.29
NO3 N (mg/L)0.060.00–25.549.1986.110.00–20.834.78151.96
SO42−(mg/L)0.100.00–43.9117.01100.680.00–60.1317.13104.82
HCO3 (mg/L)-134.83–184.09156.027.03110.50–176.05139.0015.51
Na+ (mg/L)0.034.09–51.6325.3254.963.44–21.849.9366.16
K+ (mg/L)0.012.38–3.502.929.262.25–5.483.0530.79
Ca2+ (mg/L)0.0437.93–46.5241.795.4529.02–55.3439.5919.00
Mg2+ (mg/L)0.017.31–16.7011.5321.813.98–20.309.2749.44
TDS (mg/L)1178–41029219.83119–33320235.33
EC (μs/cm)1318–73452219.96212–60136135.57
pH0.017.26–8.197.842.187.39–7.927.742.11
1n—number of samples.
Table 2. Hydrochemical composition of the main stream in different months (the units of ions concentration were mg/L).
MonthsClSO42−Ca2+Mg2+HCO3Na+ + K+Reference
April13.0141.0147.7611.36154.0014.86Tiping et al. [76]
June–July37.9517.1041.7911.53156.0228.24This study
July19.9328.3244.218.87142.6516.49Tiping et al. [76]
August11.6637.7337.249.48144.3616.02Chetelat et al. [34]
August–October26.55----24.09Zhang et al. [67]
Whole year19.1043.0036.4710.30133.5015.44Qin et al. [66]
8.0722.0743.858.17131.9011.80Chen et al. [58]
Table 3. Pearson’s correlation coefficients between major ions.
ParametersFClNO3-NSO42−Na+K+Ca2+Mg2+HCO3EC
F1
Cl0.2231
NO3-N0.2290.1681
SO42−0.0530.116−0.564 **1
Na+0.2340.924 **0.2350.1471
K+0.1100.117−0.0940.397 **0.2131
Ca2+0.117−0.015−0.0890.729 **0.1320.471 **1
Mg2+0.1620.699 **0.1790.0510.672 **0.167−0.0011
HCO30.2420.460 **0.279 *0.1240.622 **0.309 *0.729 **0.322 **1
EC0.1980.764 **0.460 **0.1300.909 **0.277 *0.378 **0.590 **0.806 **1
* and ** means a significant correlation between two parameters, which the p-values are lower than 0.05 and 0.01, respectively.
Table 4. Ratio of different end-members used in the calculation.
K+/ClNa+/ClSO42/ClCa2+/ClMg2+/ClCa2+/Na+Mg2+/Na+K+/Na+References
Rain0.550.59-5.570.56-- Wu and Han [53]
Rain--2.06---- Zhang et al. [62]
Silicates-----0.350.24 Gaillardet et al. [73]
Publisher’s Note: MDPI stays neutral with regard to jurisdictional claims in published maps and institutional affiliations.

