
Unified Packing Model for Improved Prediction of Porosity and Hydraulic Conductivity of Binary Mixed Soils


College of Petroleum Engineering and Geosciences, King Fahd University of Petroleum and Minerals, Dhahran 31261, Saudi Arabia
Water 2021, 13(4), 455; https://doi.org/10.3390/w13040455
Submission received: 3 January 2021
/
Revised: 4 February 2021
/
Accepted: 6 February 2021
/
Published: 10 February 2021
(This article belongs to the Section Hydraulics and Hydrodynamics)
Abstract
:Binary mixed soils, containing coarse sand particles mixed with variable content of fines (fine sand, silt, or clay) are important for several environmental and engineering applications. The packing state (or porosity) of such sand-fines mixtures controls several important physical properties such as hydraulic conductivity. Therefore, developing an analytical packing model to predict porosity of binary mixed soils, based on properties of pure unmixed sand and fines (endmembers), can contribute to predicting hydraulic conductivity for the mixtures without the need for extensive laboratory measurements. Toward this goal, this study presents a unified packing model for the purpose of predicting the porosity and hydraulic conductivity of binary mixed soils as function of fines fraction. The current model modifies an existing packing model developed for coarse binary mixed soils to achieve three main improvements: (1) being inclusive of wide range of binary mixed soils covering the whole range particle sizes, (2) incorporating the impact of cohesive packing behavior of the fines on binary mixture porosity, and (3) accounting for the impact of clay swelling. The presented model is the first of its kind incorporating the combined impact of all three factors: particle size ratio, fines cohesive packing and swelling, on binary mixtures porosity. The predictions of the modified model are validated using experimental published data for the porosity of sand-fines mixtures from 24 different studies. The model shows significant improvement in predicting porosity compared to existing packing models that frequently underestimate the porosity. By using the predicted porosity as an input in Kozeny–Carman formulation, the absolute mean error in predicting hydraulic conductivity, as function of fines fraction for 16 different binary mixed soils, is reduced by 50% when compared to the use of the previous packing model. The current model provides insights about the endmembers properties (porosity, hydraulic conductivity, and grain size) and fines content required to achieve a certain target desirable porosity and hydraulic conductivity of the mixed soils. This can assist the optimization of soil mixing design for various applications.
1. Introduction
Binary mixed soils are composed of large particles such as coarse sand, mixed with finer particles like fine sand, silt, clay, or bentonite. The packing state (or porosity) of such sand–fines mixtures controls several important physical properties such as hydraulic conductivity and shear strength [1,2,3,4,5,6]. Binary mixed soils have received increasing attention due to their abundance as economically important sediment and for their applications as liners and cutoff walls [7,8,9], in filter design [10,11,12], and in concrete mixing [13,14,15]. Therefore, predicting porosity (or void ratio) and hydraulic conductivity of binary mixed soils can be important for various disciplines including environmental and water resources sciences as well as geotechnical and civil engineering [16,17,18,19,20,21]. In particular, it is very important in practice to determine the fines content that is needed to achieve certain desirable porosity (n) and hydraulic conductivity (K) values in the binary mixture. This can be achieved by preparing binary mixed soils by mixing two endmembers (pure unmixed sand and pure clay for example) at variable fines content and then measuring n and K of the resultant mixtures. Such approach requires extensive laboratory testing and is time consuming. To overcome this issue, one would ideally like to be able to predict n and K of binary mixed soils as function of fines content based on the properties of endmembers and without the need to conduct extensive experimental work. Toward this goal, this study aims to present an approach that can be used to predict n and K of binary mixed soils using input parameters from the pure unmixed endmembers.
Several studies have shown that K of mixed soils can be estimated based Kozeny–Carman formulation which requires n as an input [6,21,22,23,24,25]. Therefore, developing a packing model that can accurately predict n of binary mixed soils can assist the prediction of K for binary mixed soils. Many studies attempted to develop an analytical model for the prediction of binary mixtures porosity based on the properties of unmixed fine and large particles endmembers [7,23,25,26,27,28,29,30,31]. Studies from the field of powder and concrete technology [29,30,31] presented an analytical packing model that is based on ideal packing condition: both fines and large particles maintain their unmixed porosity after mixing. Such ideal packing implies that fine particles effectively fill the pore space between larger particles with no packing disturbance. The ideal packing model is theoretically applicable in the case of significantly low fine particle size () to large particle size () ratio, / [29,30,31]. Nevertheless, large body of literature reported that the ideal packing model frequently underestimates the porosity for sand–fines mixtures [2,23,26,27,32,33]. Therefore, several studies (e.g., [23,25,26]) introduced correction parameters into the ideal packing model in an attempt to correct for the deviation from ideal packing case due to increasing /. The correction parameters are empirically expressed as function of / whose increase is a main reason for non-ideal packing as suggested by few studies [23,25,26].
Recent studies however have shown that accounting for particle size ratio (/) is not enough to explain deviation from ideal packing [7,33]. Two other factors that are relevant here include the cohesive nature of fines [33,34] and the volume expansion of swelling clays [7,35]. Cohesive packing (forming aggregates) of very fine particles is due to inter-particle forces, such as electrostatic forces and van der Waals, which can overcome the impact of gravity force [36,37] resulting in very different packing compared to non-cohesive coarse sands. On the other hand, volume expansion upon saturation of swelling clays such as bentonite can disturb the packing of large particles filling more pore space between them [7,35]. Incorporating such factors into the packing model can be important since fine particles used in binary mixed soils cover wide range of sizes and composition varying from fine sand to silt and clay (including swelling and non-swelling clay).
Existing packing models developed for sand–fines mixtures account for either particle size ratio (e.g., [14,25,26]), fines cohesive packing [33], or swelling impact [7]. The applicability of such models to wide range of binary mixed soils remain unclear leading to uncertain prediction of porosity and consequently errors in hydraulic conductivity estimation. Incorporating all three factors together into a single packing model can be important since fine particles used in binary mixed soils cover wide range of sizes and components varying from fine sand to silt and clay (including swelling and non-swelling clay). This study thus aims to develop a unified packing model that accurately predicts the porosity or void ratio of binary mixed soils as function of fines fraction and using input parameters obtained from the endmembers alone (pure large sand packing and pure fines packing). In doing so, the effects of particle size ratio, fines cohesive packing, and swelling on binary mixtures porosity are all incorporated in one single model. This can ultimately result in improved prediction of hydraulic conductivity for binary mixed soils. Firstly, theoretical background of binary mixture packing is reviewed, highlighting limitations of existing models. Secondly, an existing packing model developed initially for coarse mixed soils is modified to account for all three factors mentioned above: /, fines cohesive packing and swelling. The modified model is validated using experimental published data for various binary mixed soils characterized by wide range of /, and fines components including cohesive clays and swelling bentonite. The resultant predicted porosity is then used as an input in Kozeny–Carman formation to highlight improvement in the prediction of hydraulic conductivity over the use of outputs from earlier packing models.
2. Background
2.1. Packing Theory and Model for Binary Mixed Soils
Packing theory for binary mixtures (composed of large particles mixed with finer ones) and porosity prediction for sand–fines mixtures are briefly described here where more details can be found in [25,29,38]. When large particles (such as coarse sands) are mixed with finer particles (such as fine sands or clay), the porosity (or void ratio) of the binary mixture decreases first with fines content before porosity starts to increase with increase of fines fraction (Figure 1). At low fines volume fraction (), fine particles fill in the porosity between the larger particles which results in reducing porosity until reaching a minimum porosity point (Figure 1). Such point corresponds to the case where fine particles completely fill the interparticle pores between larger particles [25,38]. The fine fraction required to achieve the minimum porosity (maximum packing density) is frequently referred to as critical fines fraction, . Beyond this point, increasing the fines fraction would require the replacement of solid large particles by the aggregates of micro-porous fines, thus increasing mixture porosity. According to the packing theory of binary mixtures [25,28,29,30,31], an “ideal” packing requires that mixing process does not disturb the original packing and porosity of fine or large particles. That is, the porosity of the pure endmembers does not change after mixing. Such ideal packing is predominantly a theoretical limit that requires significantly low fine-to-large particle size ratio, /. The porosity of binary mixtures in case of ideal packing has been described using a linear packing model and it represents a lower bound (i.e., most dense packing) as shown in Figure 1. The upper bound represents “no mixing” condition between large and fine particles (Figure 1). In this case, either / is one or the two end-members are not mixed together but rather occurs at two separate layers (Figure 1; case C). Nevertheless, the packing in real sand–fines mixtures deviates from both the upper and lower bounds, frequently described as “non-ideal” packing [25,29,33,38]. In this case, the porosity-fines fraction trend frequently plots in between the upper and lower bounds as shown in Figure 1.
The main physical explanation for the deviation of real mixed soils from the ideal packing is the increase of fine-to-large particle, / as reported by several studies [6,14,23,25,31,39]. In this case, fines start to disturb the packing of sands and vice versa, creating an extra pore space between the fine particles as well as along the wall of larger sands (Figure 1; schematic B). Several semi-empirical packing models have been developed to correct for the deviation from the ideal packing for binary mixtures of glass beads [6,12,28] and mixed soil [14,23,25,26,27]. This was done by incorporating one or more correction coefficients/functions, expressed as function of /, into the ideal packing model [14,23,25,26,27]. There are different formulations for non-ideal packing model and correction coefficients but this current work builds upon and modifies the model developed initially by Zhang et al. [25]. This is due to the simplicity of the model in terms of formulation and physical concept. The model uses one simple “mixing-degree” correction coefficient, M, to account for the contribution of increasing / to the deviation from ideal packing. Additionally, the authors showed how the model prediction can be used for estimating hydraulic conductivity [25], which is of interest for this study as well.
Zhang et al. [25] showed that the porosity of binary mixture () can be estimated using:
where is the porosity of unmixed large particles (i.e., sands) and is the porosity of unmixed fines. The mixing correction coefficient, M, has been empirically related to the particle size ratio, and can be found using Equation (3) as reported by Zhang et al. [25]:
In Equation (3), and correspond to the median particle size (d50) of the fines and large particles, respectively. In case d50 is not available, the average between upper and lower sieve values can be used. Since is not known as a priori, a practical approach to calculate at any is to calculate the porosity using both Equations (1) and (2) and then choose the maximum value at any given [27,28]. It is worth mentioning that when = 1, Equations (1) and (2) reduce to the ideal packing case while = 0 represents the no-mixing condition. Since the preparation of mixed soil specimens is frequently done using the mass fraction instead of volume fraction, it is convenient to covert fines volume fraction () to mass fraction () in Equations (1) and (2) which can be achieved through the following equations [7,32]:
In the equations above, and are the solid particle density of fine and large particles, respectively. The packing model described here can also be expressed in terms of void ratio, e, by substituting n with e/(1 + e) in Equations (1) and (2).
2.2. Limitations of Existing Models
Although the above model provided reasonable estimates for the porosity of some binary mixed soils [25], it has some limitations. Firstly, Equation (3) for the determination of M from particle sizes was based on 4 data points only where the values of did not cover the range between 0.30 and 1. This study however develops an expression for M based on published experimental data on porosity and void ratio of more than 50 sand–fines mixtures from 24 different studies covering the whole range for up to 1.
Another important limitation of the model above is that it does not apply to mixed soils containing cohesive fines characterized by very small particles (such as clay or fine silt) as highlighted by Zhang et al. [25]. For very small (<0.05), M is set equal to one rather than using Equation (3) [25]. The model in this case reduces to the ideal packing case which frequently underestimates the porosity of sand–fines mixtures characterized by small [2,32,33]. Inter-particle forces, such as electrostatic forces and van der Waals, can overcome the impact of gravity force for very fine particles [36,37] resulting in very different packing compared to non-cohesive coarse sands. An earlier study [33] showed that ideal packing model underestimates porosity of sand–clay and sand–silt mixtures due to the cohesive nature of clay/silt which is neither considered in ideal packing model nor in the mixing correction parameter M (Equation (3)). The study showed that a packing model, developed initially for dry binary glass beads powders, can be used to predict porosity in sand–clay mixture [33]. Nevertheless, the model was not tested on saturated mixed soils and it is not applicable to mixtures characterized by larger than 0.1 [33]. Rather than modifying the glass beads powder packing model, this study incorporates the impact of cohesive packing by modifying Equation (3) in the mixed soils model developed by Zhang et al. [25]. This can help to develop a unified model for binary mixed soils characterized by variable and cohesive nature.
Another important point considered here when modifying the model above, is to incorporate the impact of swelling and volume expansion upon saturation on packing and porosity. This can be essential for binary mixed soils containing bentonite for example [7,38]. A study done by Xu et al. [7] utilized ideal packing model to model the porosity of sand–bentonite mixtures after incorporating volume expansion through an empirical parameter. However, the ideal packing model developed does not incorporate the impact of particle size ratio () or fines cohesive packing. Consequently, the use of approach presented by Xu et al. [7] can drastically underestimates the porosity of mixed soils characterized by relatively large (>0.1) or in the presence of cohesive fines as mentioned earlier. This study thus modifies a non-ideal packing model (Equations (1)–(3)) to incorporate the impact of swelling on packing and porosity/void-ratio.
In summary, this study modifies the model developed by Zhang et al. [25] to achieve the following improvements:
- (a)
- Developing a correction function that is inclusive of wide range of binary mixed soils from 24 different studies.
- (b)
- Incorporating the impact of fines cohesive-packing behavior (for clay or fine silt) on the binary mixture porosity
- (c)
- Modifying the model formulation to account for the impact of swelling (for expansive clays) on mixed soils porosity.
The main aim here is to present a “unified” model that can be used to predict the porosity of sand–fines mixed soils characterized by variable values while considering the cohesive and swelling nature of fines. The modification and validation of the unified packing model are shown in the next section followed by the use of the resultant porosity for hydraulic conductivity prediction.
3. Packing Model Modification and Validation
3.1. Updated Formulation for Mixing Coefficient M
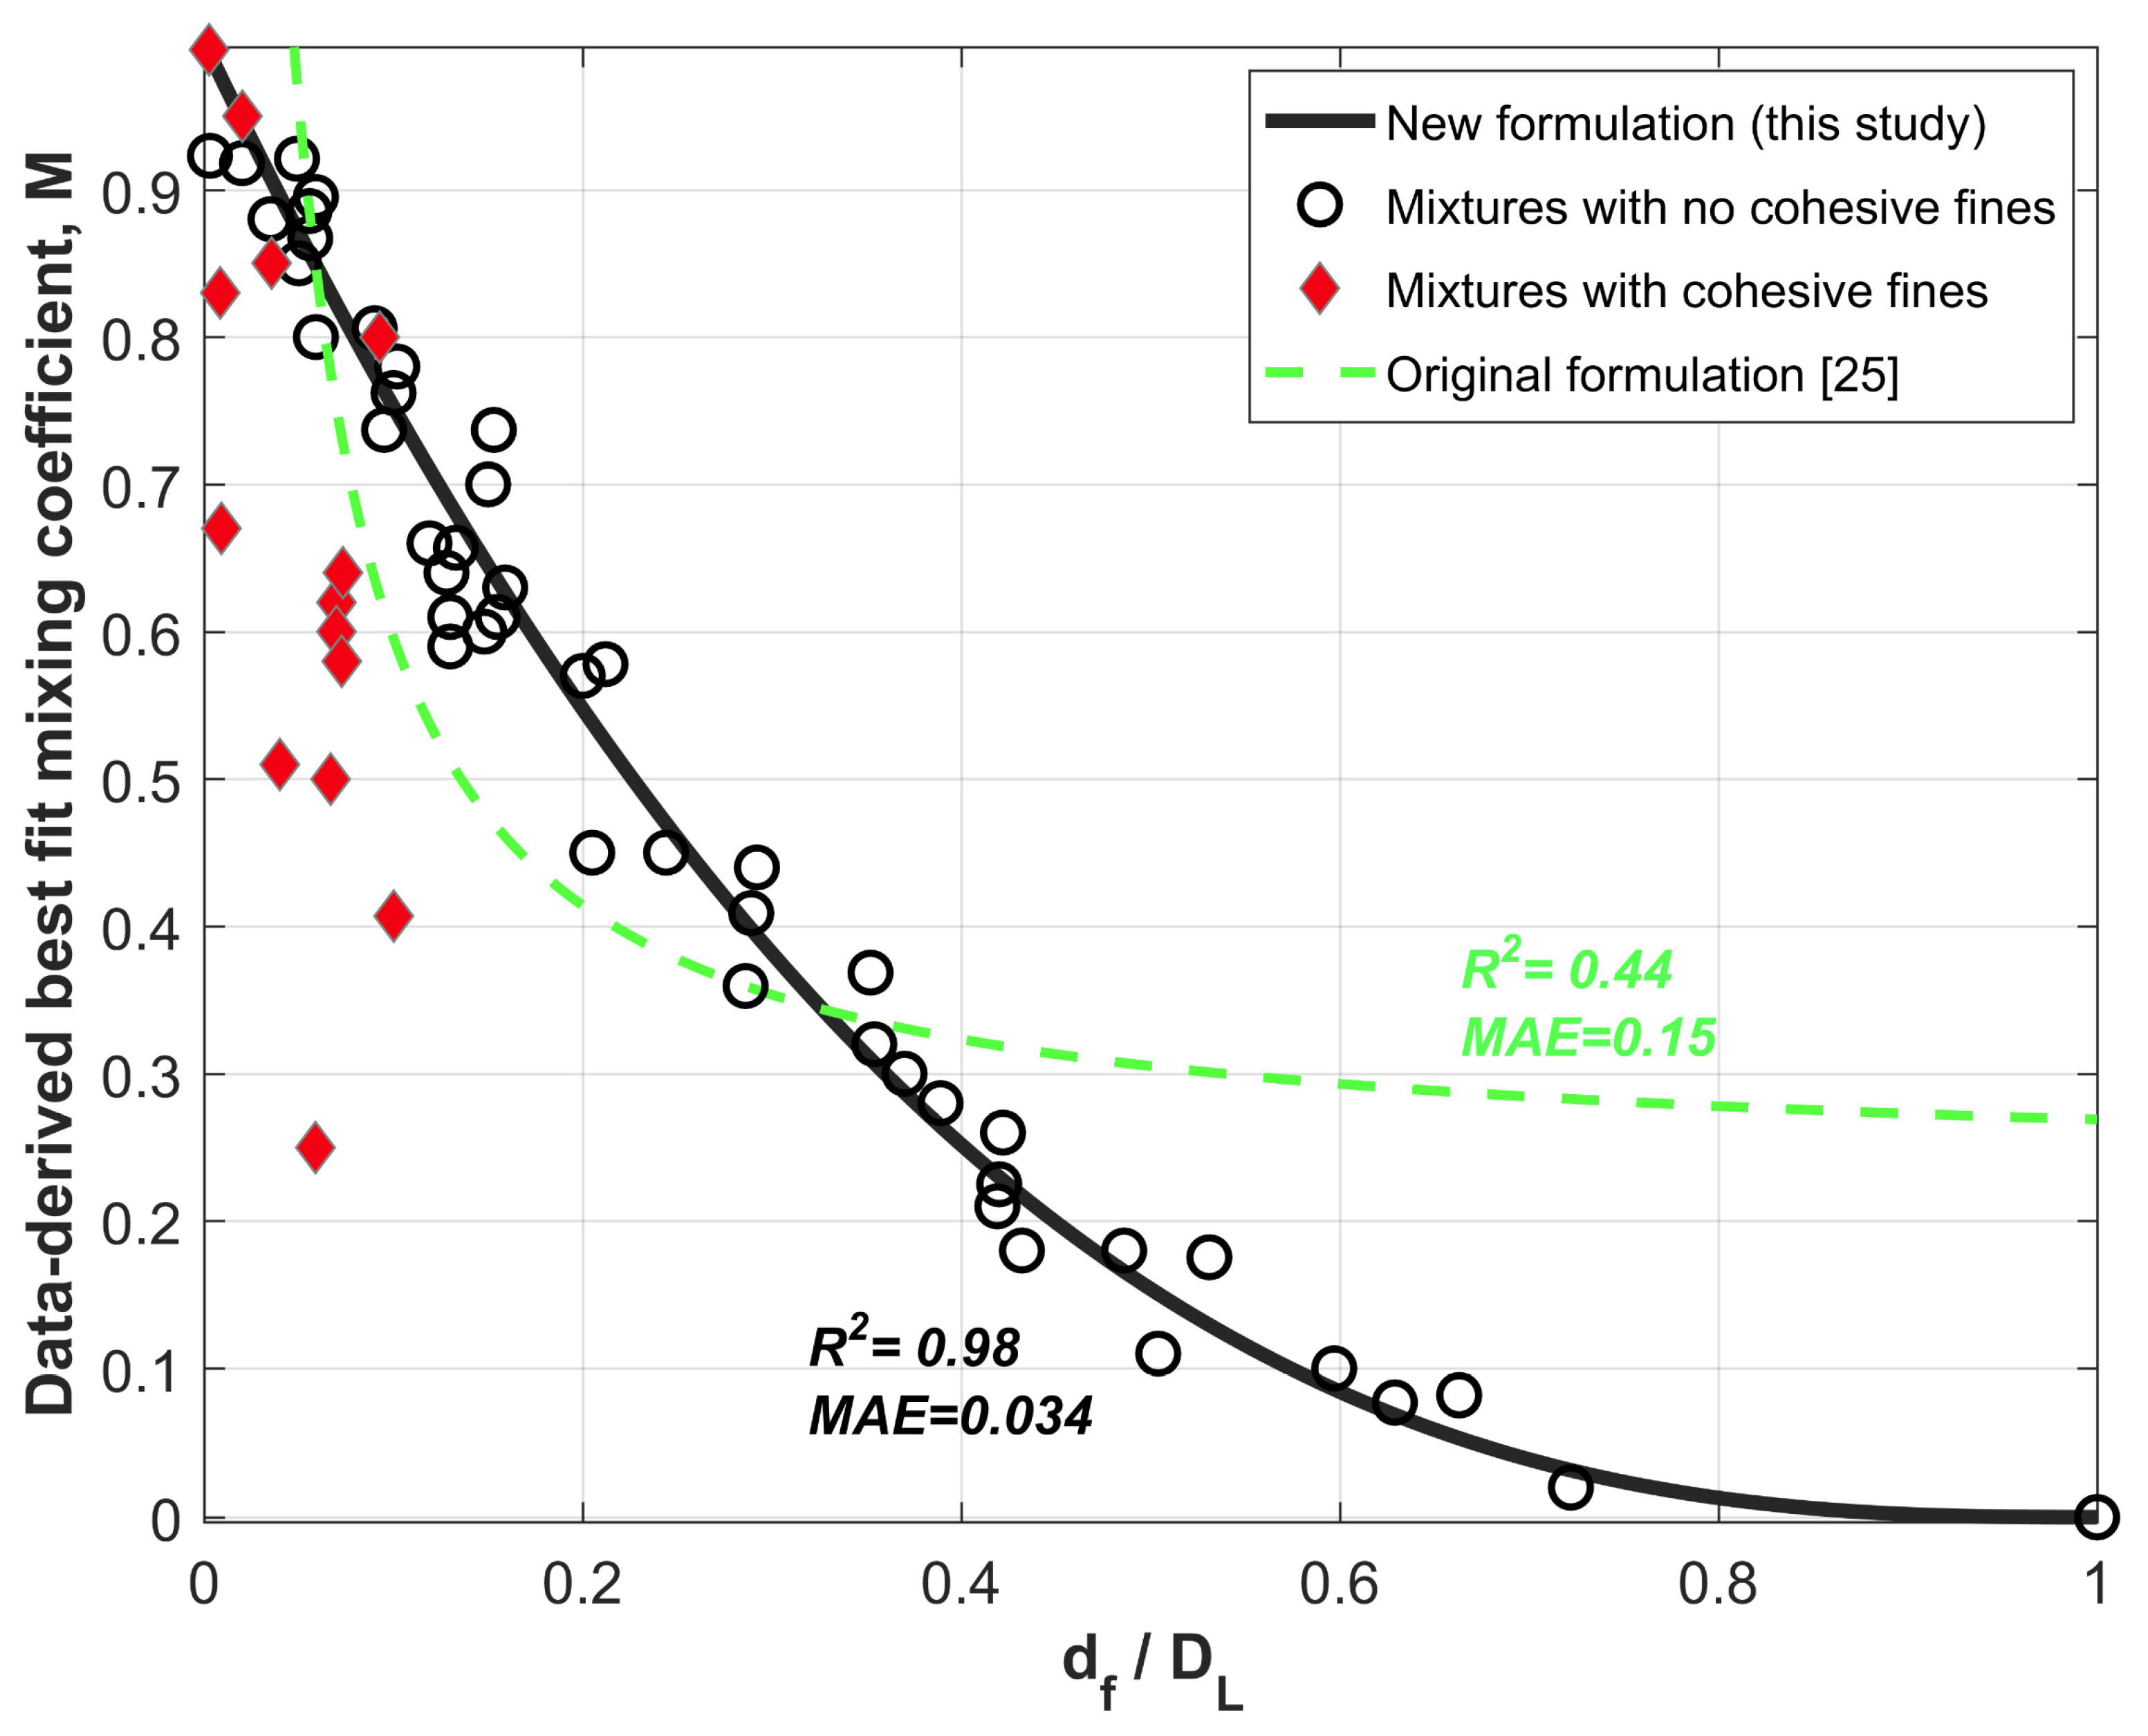
In the first step for packing model modification, measured porosity (or void ratio) values as function fines fraction of more than 50 binary mixed soils from total of 24 published studies were used to update Equation (3). Out of the total 24 published work, 12 studies [6,17,23,25,30,40,41,42,43,44,45,46] focused on mixed graded sand soils with no cohesive fines (i.e., no clay or fine silt) while the other 12 studies [7,30,32,47,48,49,50,51,52,53,54,55] reported data for mixtures consisting cohesive fines. Equations (1) and (2) were used to find the best fit mixing parameter M that reproduces the porosity-fines fraction experimental trend for each binary mixture. Figure 2 shows the data-derived best fit M versus where the median particle size (d50) was used in this case to define and . The data points are classified based on two groups: one for mixtures with no cohesive fines, and another for mixed soils involving cohesive fines. It is evident from Figure 2 that majority of mixtures containing cohesive particles deviate significantly from the overall trend for non-cohesive mixtures. The results in Figure 2 suggest that the formulation for M in non-cohesive mixtures has to be different from that for mixtures with cohesive components. This section discusses the modified equation for non-cohesive mixtures while the next section addresses the incorporation of cohesive impact. Considering only the data for non-cohesive mixtures (black circles in Figure 2), one may notice that Equation (3) does not match the data well, simply because it was developed based on much smaller number of data points. The updated formulation for M (black curve in Figure 2) is:
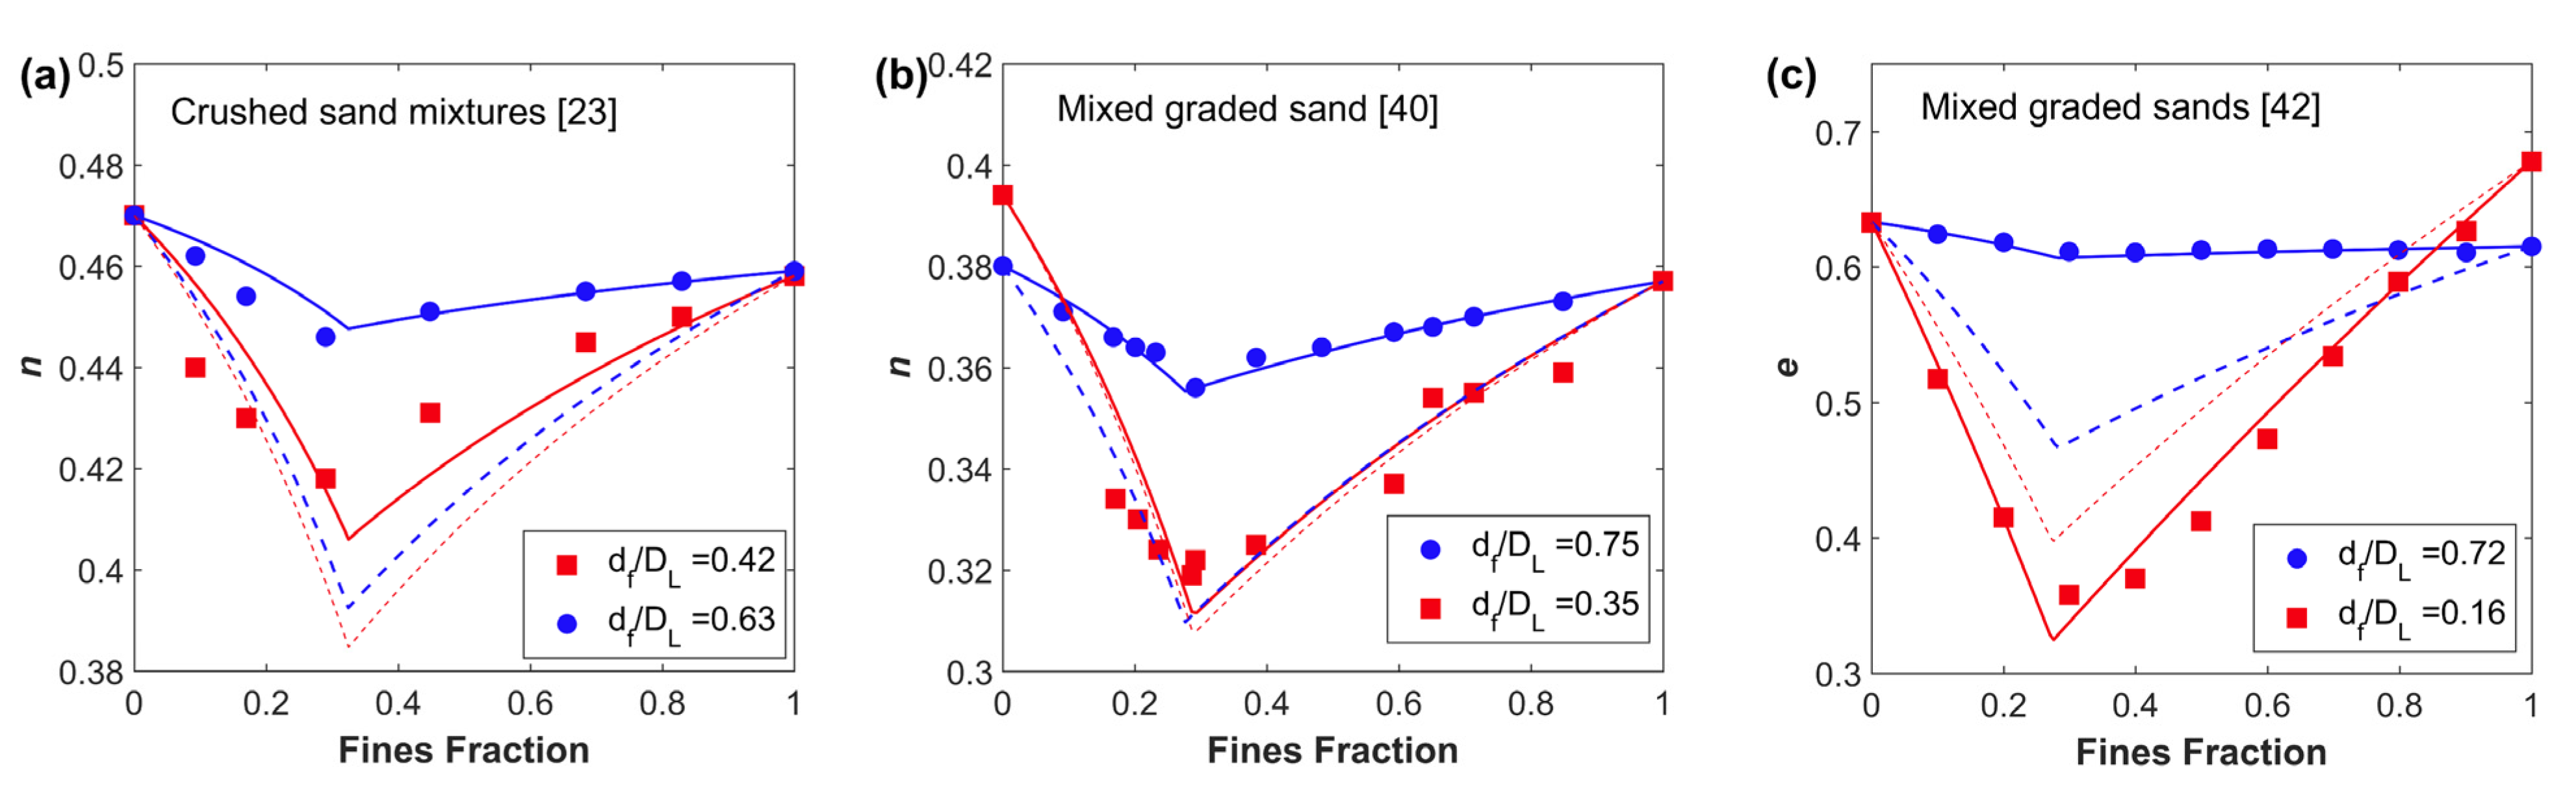
Equation (6) does not only fit the data better than Equation (3), but it also honors the two boundary conditions of ideal mixing (M ≈ 1 when approaches zero) and no-mixing (M = 0 when = 1). The use of Equation (6) to estimate M resulted in high correlation coefficient (Figure 2; R2 = 0.98) and reduced the mean absolute error (MAE) by 77% compared to the use of Equation (3) reported originally by [25]. Figure 3 shows examples for the prediction of porosity or void ratio of binary mixed soils as function of fines fraction. The current modified model (Equations (1), (2) and (6)) provided better prediction of porosity/void ratio compared to the original model (Equations (1)–(3)), especially for mixtures characterized by large values (Figure 3; blue data points). This is because the original model was developed based on much smaller number of data points that did not cover larger than 0.3. On the other hand, the current model is developed based on wide range of mixed soils (covering the whole range of
(Equation (6)) are shown in dashed green and solid black curves, respectively. The correlation coefficient (R2) and mean absolute error (MAE) are shown in black and green colors next to the curves.
3.2. Incorporation of Cohesive Packing Behavior
As highlighted earlier in Figure 2, mixed soils containing cohesive fines such as clay and fine silt require a different treatment compared to completely non-cohesive mixtures. The method adopted here for the incorporation of fines cohesive packing builds upon the approach suggested by an earlier study on glass beads powder from the powder technology and chemical engineering disciplines [34]. The authors introduced the concept of effective particle size ratio, Re, which is larger than the actual due to fines aggregation [34]. In the absence of cohesive fines, Re is equal to [34]. The authors defined a critical fine particle size value (), that separates the cohesive from non-cohesive packing behavior. Below , the effect of cohesive inter-particle forces on packing overcome the impact of gravity, thus porosity of fines packing increases drastically with the decrease of particle size. When fines have particle size above (non-cohesive packing), porosity does not change drastically with changes in particle size. In light of the above discussion, Equation (3) is modified to become:
where the effective particle size ratio, , can be obtained using the following equation [34]:
In Equation (8), p is a constant between 0 and 1 that quantifies the degree of cohesive packing for the fines [34]. The decrease in p, means physically an increase in the degree of cohesive packing. This leads to the formation of larger fines cohesive aggregates ( increases) and consequently, Re increases. The parameter x in the equation above describes how much packing disturbance in the binary mixture is caused by the fines cohesive packing and it is given by [34]:
From Equation (9), one can infer that the decrease in / leads to a decrease in indicating that cohesive fines significantly disturb the larger particles packing in the binary mixture. As a result, increases for a given p according to Equation (8), resulting in higher M values (Equation (7)) and causing porosity to increase at a given fines fraction. To sum up, the non-ideal packing in the case of mixed soils containing cohesive finds is a result of increasing the effective particle size ratio () which is accounted for in the modified formulation by (a) decrease in p, and/or (b) decrease in x.
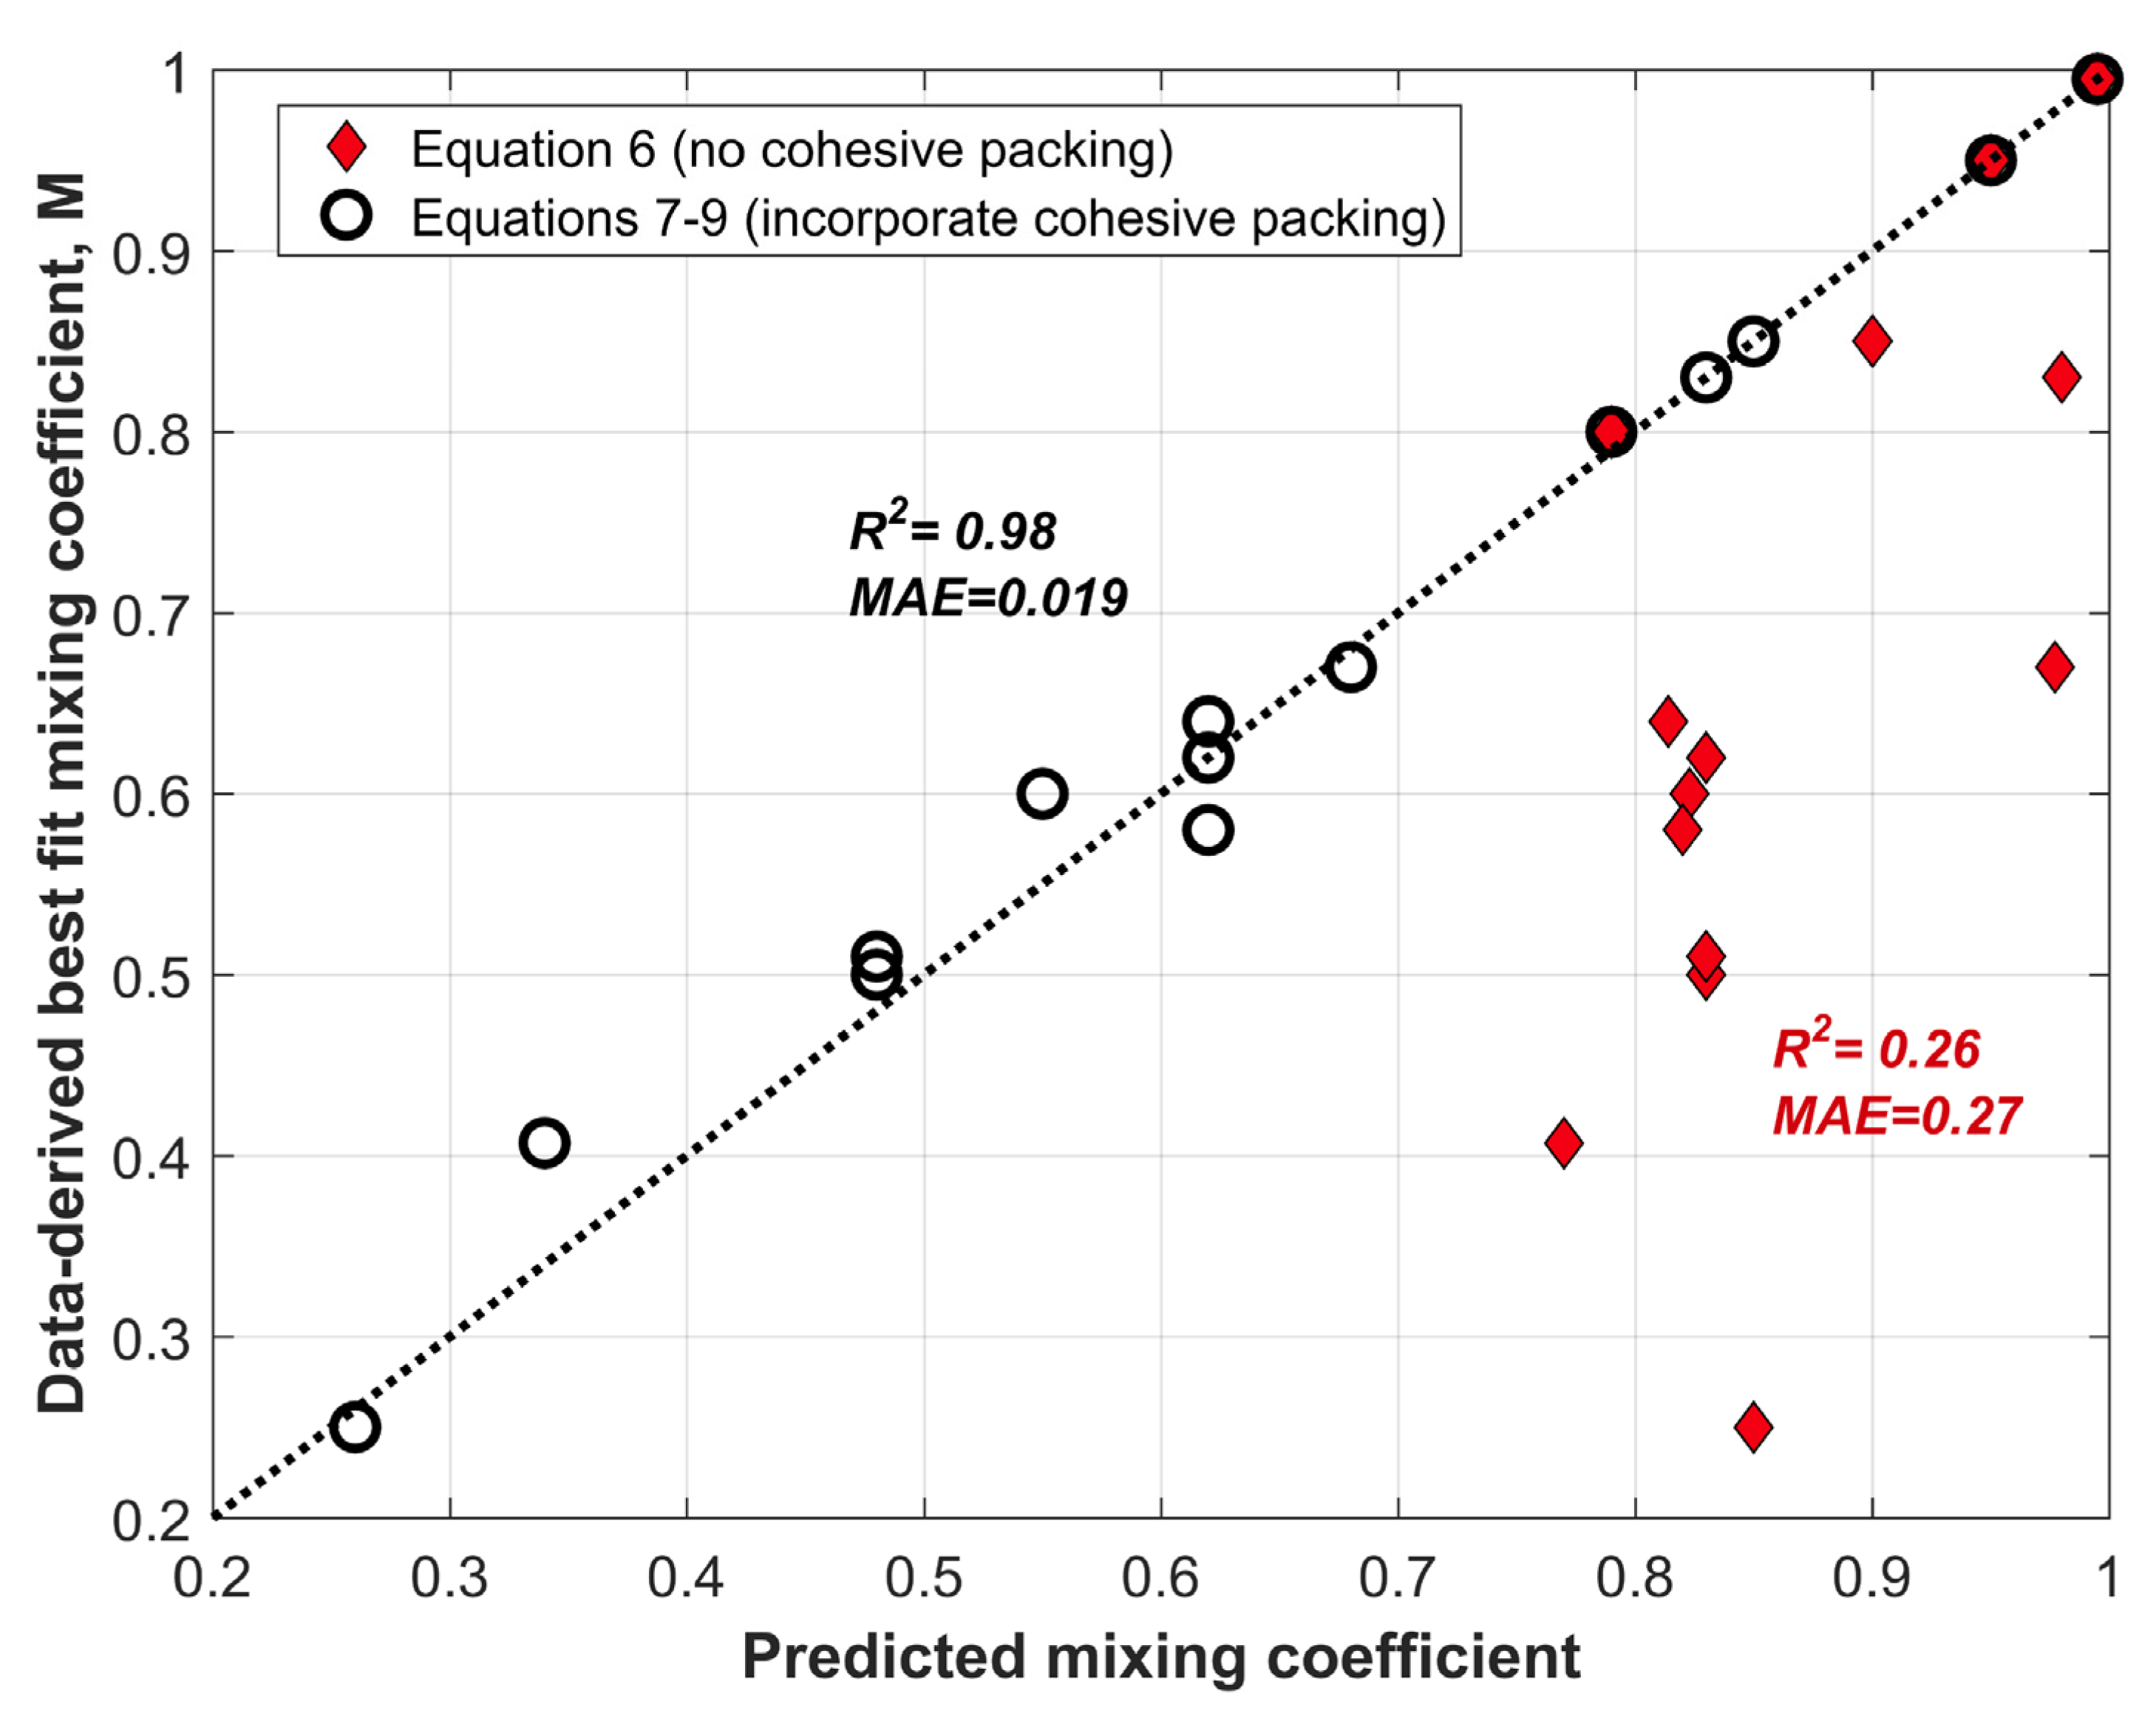
The updated formulations above require the determination of and p for binary mixed soils containing sand and cohesive fines. An earlier study [33] showed that = 0.150 mm works well for sandy soils. The only remaining parameter p, can then be estimated using Equations (7)–(9) to find the average value of p that best reproduces the best fit M derived from experimental data in Figure 2 for mixtures containing cohesive particles. All binary mixed soils used here are composed of large particles (i.e., sand) and fine cohesive particles (i.e., clay or silt), characterized by very small (≤0.1) and (<0.15 mm). The average best fit value for p was found to be 0.25 and the resultant M, estimated from Equations (7)–(9), is compared with the actual best fit values (the ones derived based on experimental data as in Figure 2) as shown in Figure 4. Significant improvement in the prediction of the actual M is observed when incorporating the fines cohesive packing (Equations (7)–(9); R2 = 0.98) compared to the formulation for non-cohesive packing (Equation (6); R2 = 0.26), as shown in Figure 4. The mean absolute error in predicting M is reduced by more than 90% when incorporating fines cohesive packing (Figure 4). It is worth mentioning that prediction of M using Equations (6) and (7) would match each other when x approaches 1 as would approach according to Equation (8). This is the case for three mixtures in Figure 4 where is very large (>0.750 mm) resulting in very large / and consequently x approaches 1 according to Equation (9). Figure 5 shows few examples highlighting how the new formulation incorporating cohesive packing improved the prediction of porosity (or void ratio) for mixed soils. It is evident that the new formulations correct the under-prediction of mixtures porosity encountered when ignoring the impact of fines cohesive packing.
3.3. Incorporation of Swelling
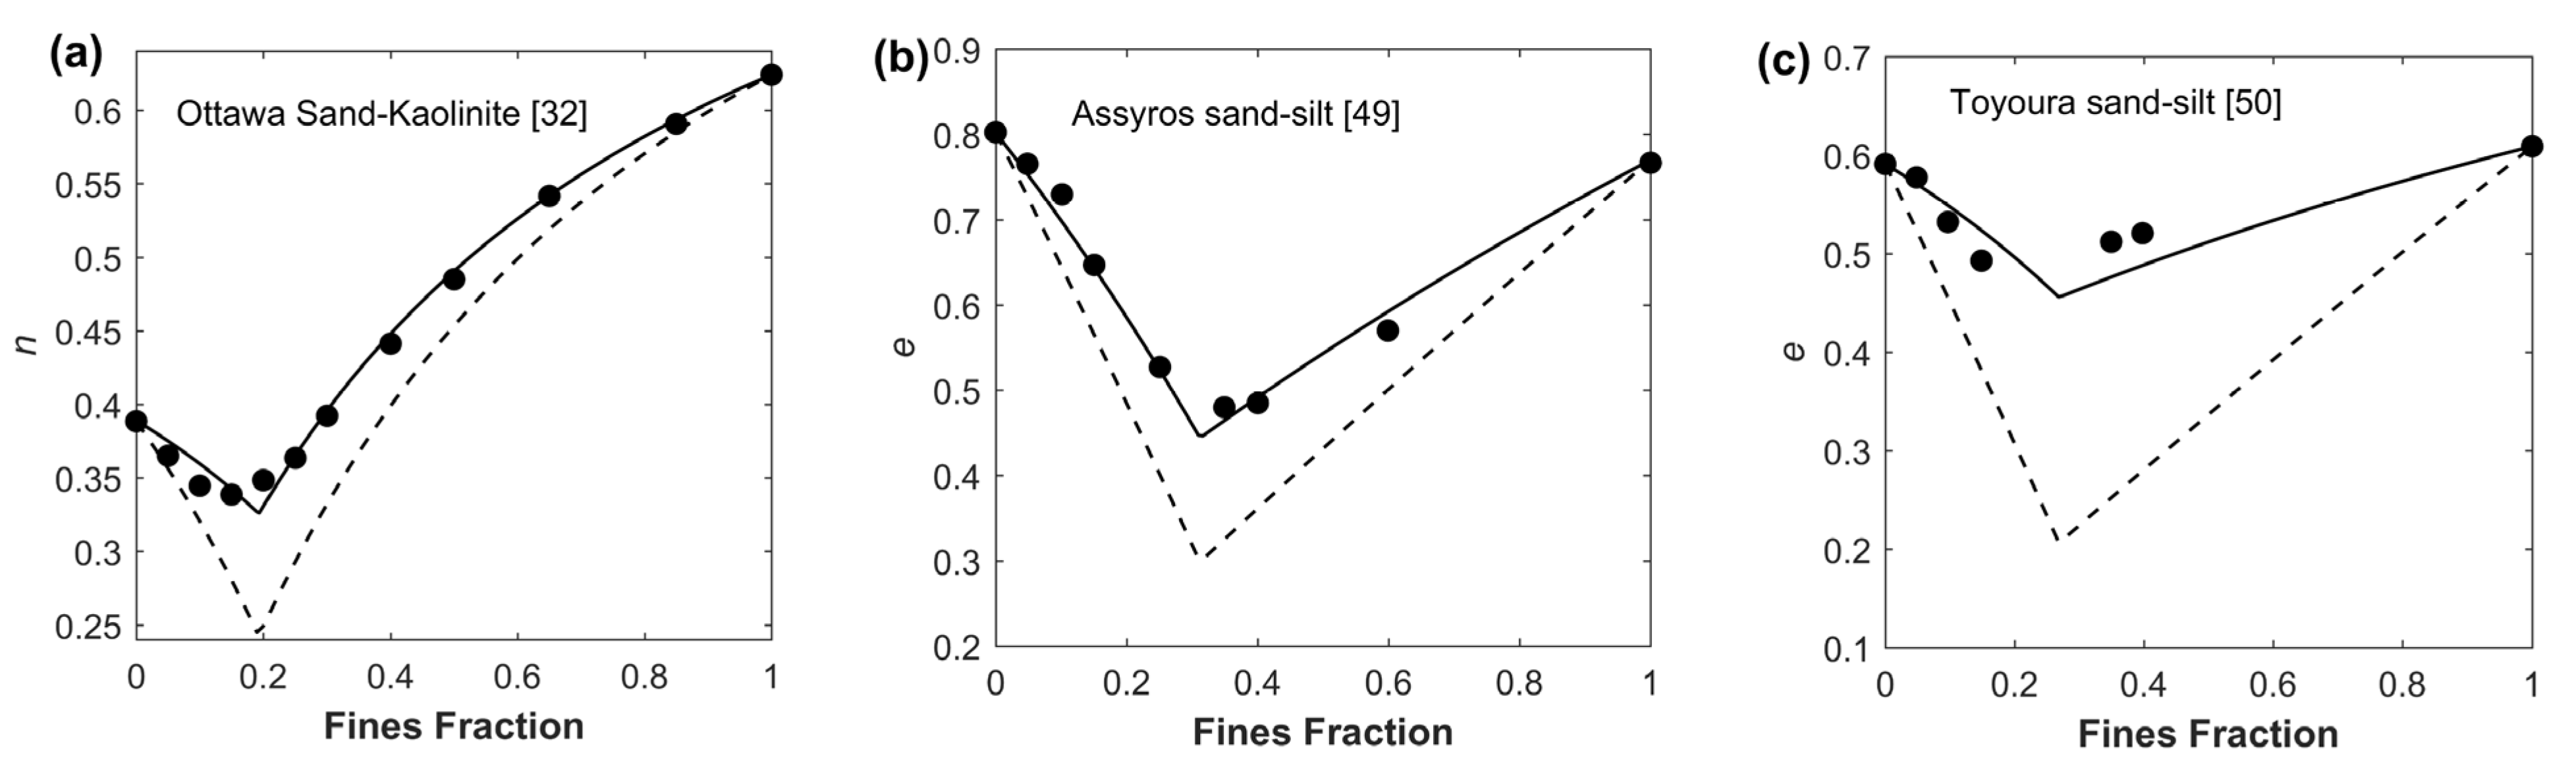
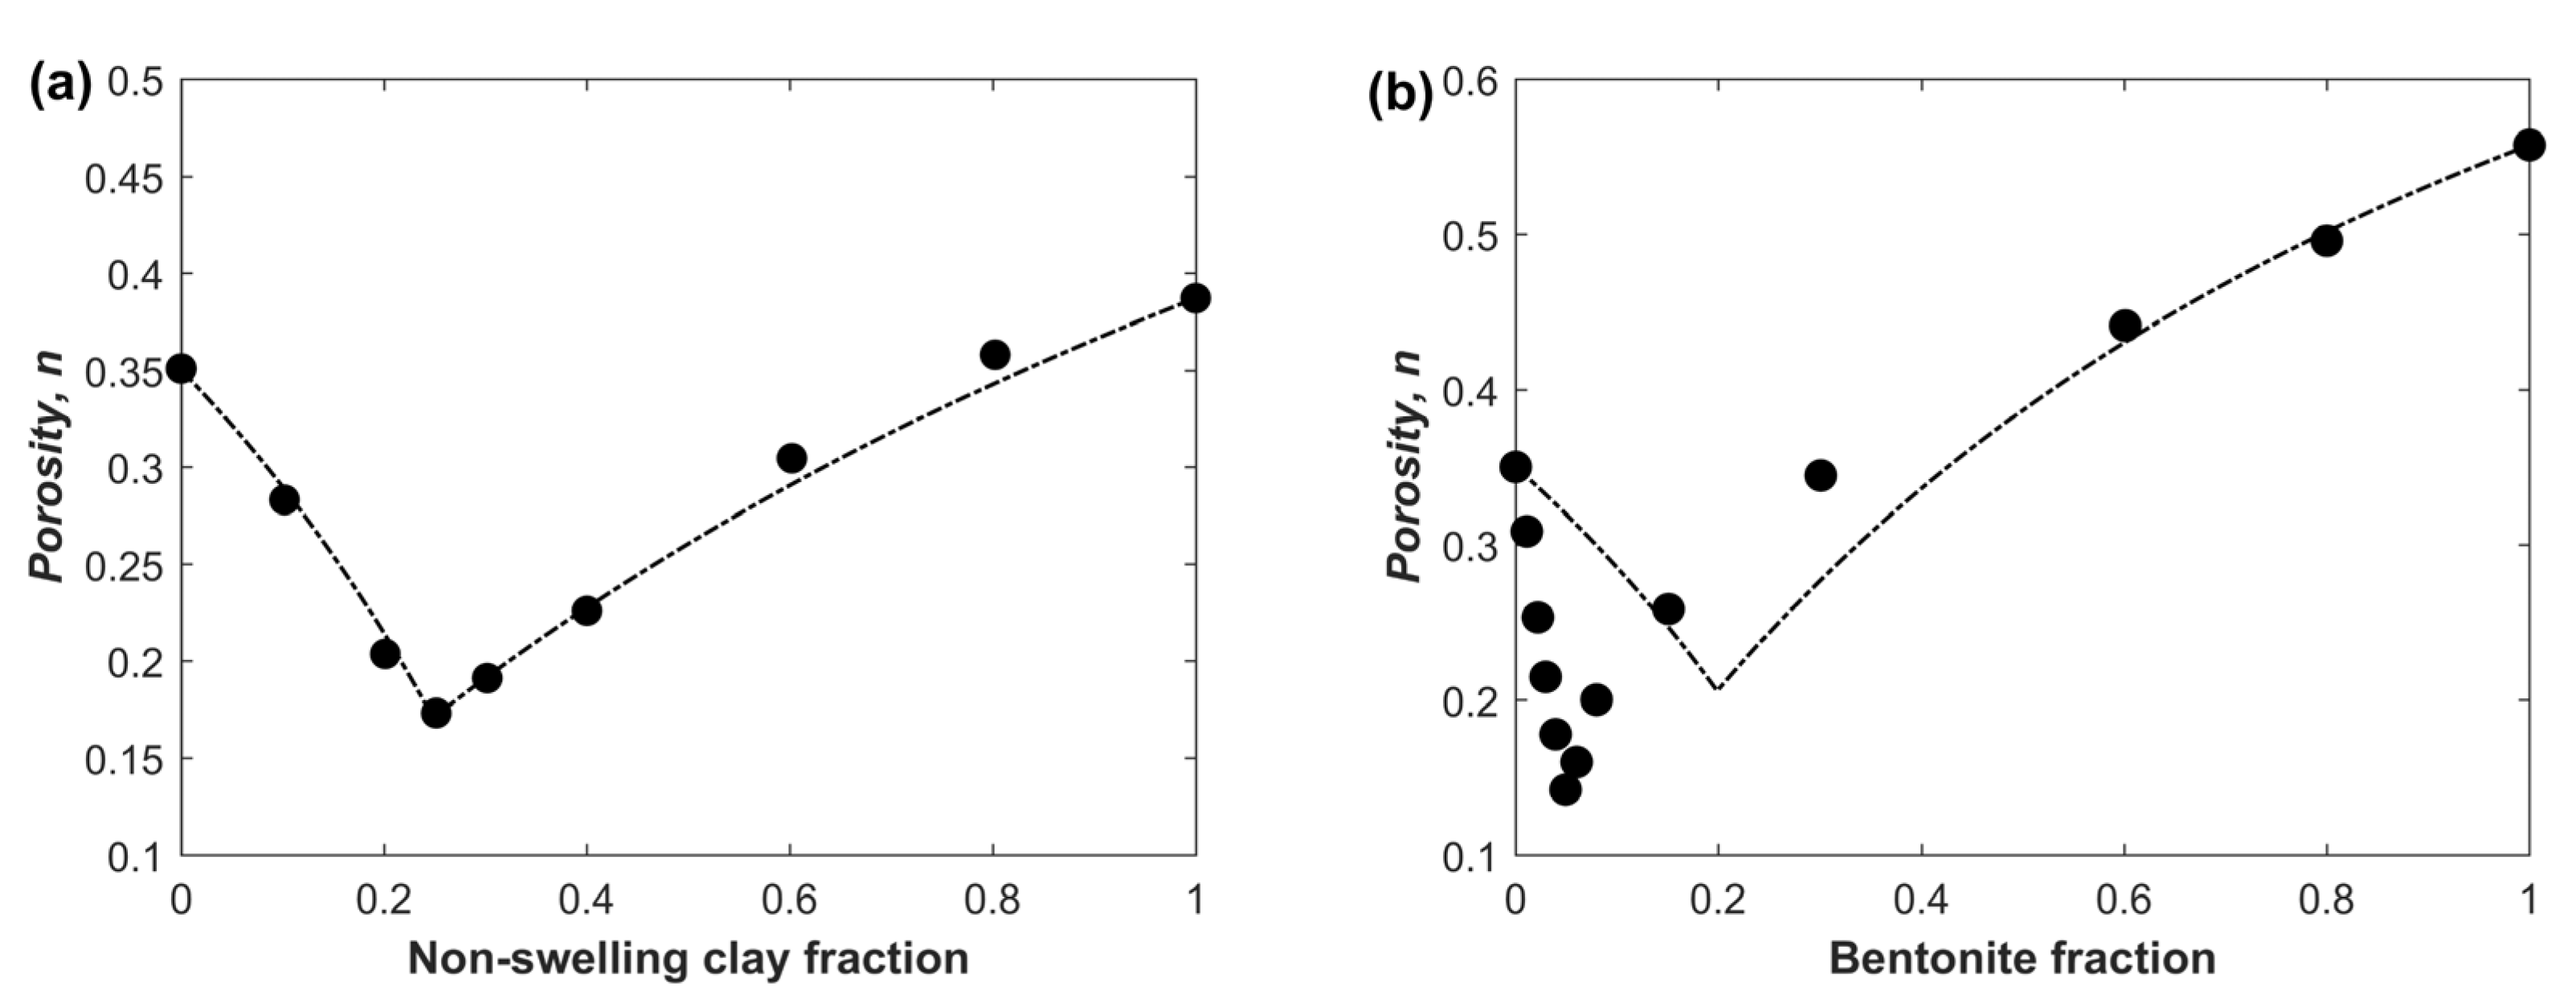
In this section, the impact of swelling (i.e., volume expansion upon saturation) on packing is incorporated in the model. Bentonite is an example of a swelling clay that has much higher swell index compared to non-swelling clay such as kaolinite [7,35]. Xu et al. [7] investigated porosity variations of sand–bentonite mixtures as function of bentonite fraction and compared that with mixtures of sand and non-expansive clay (Figure 6). The results in Figure 6 shows that the presence of expansive fines lowered the critical fines fraction at which minimum porosity is observed, in comparison with the non-expansive clay. The black dashed curve in Figure 6 shows also the prediction of the current model (Equations (1), (2) and (7)–(9)) without incorporating the swelling impact. While the model could accurately predict the porosity and critical fines fraction (0.24) of the mixtures involving non-expansive clay (Figure 6a), the predictions do not match the measurements in the case of sand–bentonite mixtures especially at low bentonite fraction (Figure 6b). Ignoring the impact of swelling results in overestimating both the critical fines fraction (predicted is 0.2 while actual is 0.05) and the minimum porosity value (predicted is 0.20 while measured is 0.14) as shown in Figure 6b. The decrease of minimum porosity and critical fines fraction is due to the expansion of bentonite volume upon saturation, where smaller amount of bentonite can fill more space in between the larger sands compared to the case of non-swelling clay.
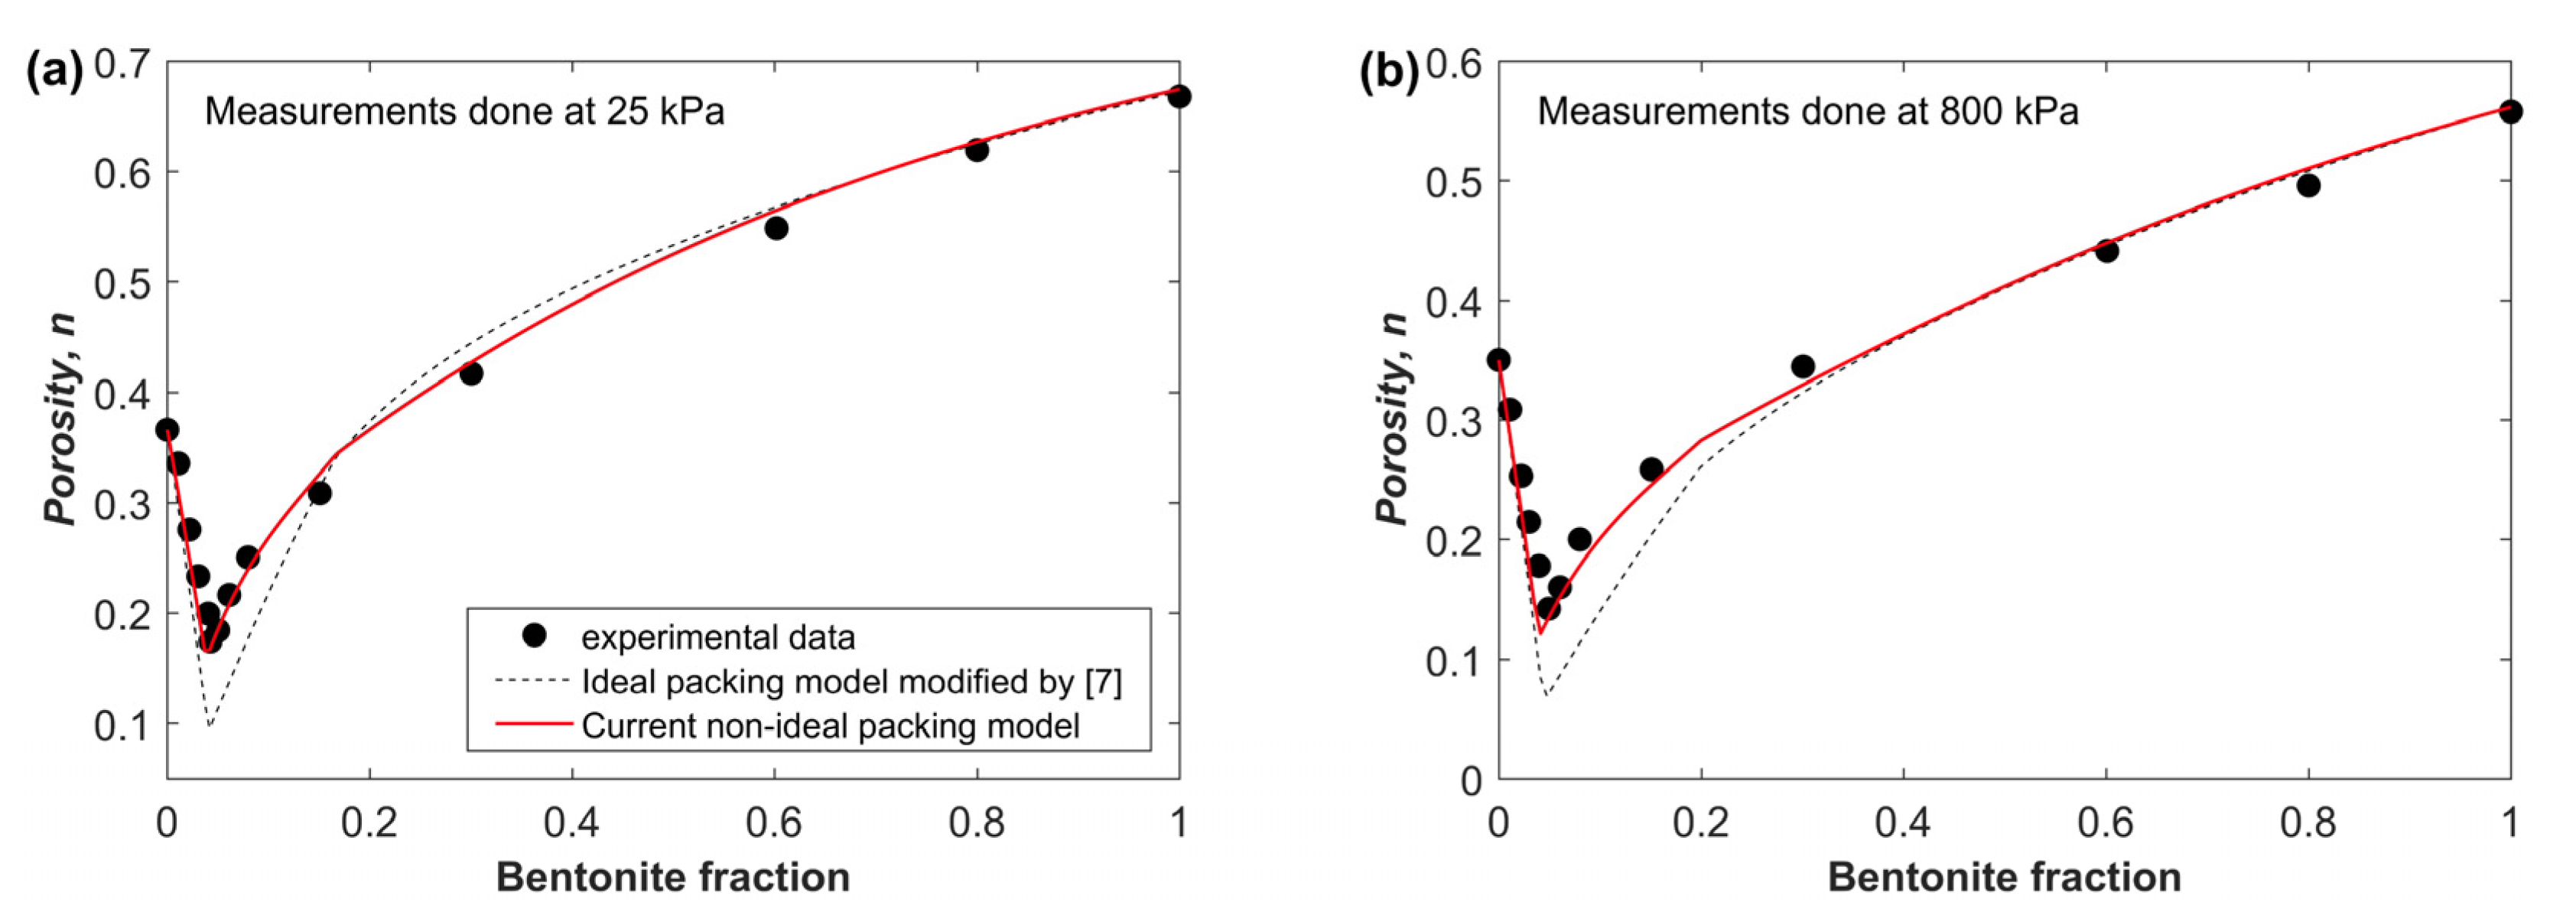
In order to account for the impact of swelling, Xu et al. [7] suggested to incorporate a volume expansion parameter, S, in the ideal packing model. The parameter S describes the increase in fines volume due to swelling and it can be estimated based on the swell index of the clays [7]. For the mixtures shown in Figure 6, the non-swelling clay-J has a swell index of 1.6 (mL/2 g) while bentonite has swell index of 17 (mL/2 g) [7]. Taking the non-swelling clay in Figure 6a as a reference (S = 1), the volume expansion parameter for bentonite can be estimated using S = 17/1.6 = 10.6 [7]. The incorporation of S in the ideal packing model improved the prediction of porosity as shown in Figure 7, in comparison with predictions ignoring swelling impact (Figure 6b). The mixtures prepared by Xu et al. [7] are characterized by very small and very large (0.75 mm), which might explain the reasonable prediction of the ideal packing model although it slightly underestimates porosity at low bentonite fraction (Figure 7). Nevertheless, the model developed by Xu et al. [7] does not take into account particle size ratio (it does not include M) or cohesive packing, and thus its applicability is questioned for mixtures characterized by larger . Therefore, this study alternatively incorporates the parameter S in the present non-ideal packing model as follows:
- 1
- When , the parameter S multiplies the volume fraction of fines so that the porosity of the mixture is decreased, which can be found using:
- 2
The resultant packing model matches the experimental data well as shown in Figure 7. There is a slight improvement over the model developed by Xu et al. [7] primarily due to the different formulation used here for in addition to accounting for cohesive packing. The main advantage however is that the current unified model can be applied to mixtures with wide range of containing swelling clays. In contrast, the model presented by Xu et al. [7] does not account for variations in which is a major source of deviation from ideal packing as mentioned earlier.
4. Discussion
4.1. Unified Packing Model for Practical Applications
Based on the results shown above, a summary of the unified packing model is shown in this section. The model presented here can be used to predict porosity or void ratio of binary mixed soils, as function of fines fraction and based on input parameters obtained from the pure endmembers alone. The model has better performance that the original models because it incorporates the impact of all three factors: particle size ratio (), fines cohesive packing and clay swelling. The required input parameters include and swelling index (for swelling clay only). Other parameters such as p and have been determined earlier to have values of 0.25 and 0.150 mm, respectively, as shown above (Section 3.2) and are substituted in the following equations.
For Equation (15), in case swelling index is not available, S = 10 can be used as an approximation for bentonite. The resultant porosity from the model above is expressed as function of volume fraction which can be converted to mass fraction through Equations (4) and (5) as done throughout this study. One application of this model is to predict the value of the minimum possible porosity and the critical fines fraction required to achieve such case. This can save time and effort to optimize mixing and achieve a certain target porosity or void ratio without the need to perform extensive experiments to figure out the right mixing proportions. According to the model presented here, achieving maximum packing density (minimum porosity) for the binary mixture requires (a) very small where is above 0.750 mm so that is very small and M approaches 1 (Equations (16)–(18)), and (b) small and (Equation (13)). Porosity is also a critical parameter for the determination of hydraulic conductivity, thus the next section discusses how the modeled porosity can be used in the prediction of hydraulic conductivity for binary mixed soils.
4.2. Prediction of Hydraulic Conductivity
The aim here in this discussion is to examine how the use of the above packing model can assist in accurately predicting the hydraulic conductivity, K, for binary mixed soils characterized by variable particle size ratio and fines types (fine sand, silt, or clay). Porosity is a major quantity that controls K where both quantities are linked through the Kozeny–Carman formula (Equation (8)):
In the equation above, is the representative particle size; is fluid density; and is the dynamic viscosity and is gravitational acceleration. The same equation can be used to estimate intrinsic permeability but without including the terms . It is worth mentioning that there are other formulations that relate porosity and hydraulic conductivity but Kozeny–Carman is among the most frequently used with high reliability [6,7,22,23,24,25,40,53,56]. Both porosity and representative particle size need to be determined so that K can be estimated. While porosity of the mixture can be estimated using the packing model presented here (Equations (13)–(18)), of the mixture at any given can be estimated as follows [25]:
where and are the representative particle size of the sand and fines, respectively. Both and can be calculated through Equation (19) and by using the measured K and n values of the endmembers (i.e., pure unmixed sand and fines). The coefficient b follows a sigmoidal trend from 0 to −1 as increases from 0 to 1 and it can be empirically estimated by the following equation [25]:
where is the critical large particle volume fraction (and a is an empirical parameter that determines the steepness of the b-curve. The following steps were followed to find a: (1) the for binary mixed soils, where K data is available [7,23,25,32,40,48,53,57,58], was calculated using the measured and K, of the binary mixtures and using Equation (19); (2) Equations (20) and (21) were then used to find the best fit parameter a, which reproduces the of the mixtures at variable fines fractions. It was found that a = 10 provides the best estimates for of the different binary mixtures examined in this study.
The practical steps for the calculation of hydraulic conductivity are as follow:
- 1
- Calculating as function of using the packing model presented here (Equations (13)–(18)). The value of is obtained from the packing model presented above as described earlier.
- 2
- Calculating and through Equation (19) and by using the measured porosity and hydraulic conductivity of the pure endmembers as inputs in the equation.
- 3
- Calculating as function of using Equations (20) and (21) by setting a = 10 and .
- 4
- Calculating hydraulic conductivity as function of for the binary mixed soil using Equation (19).
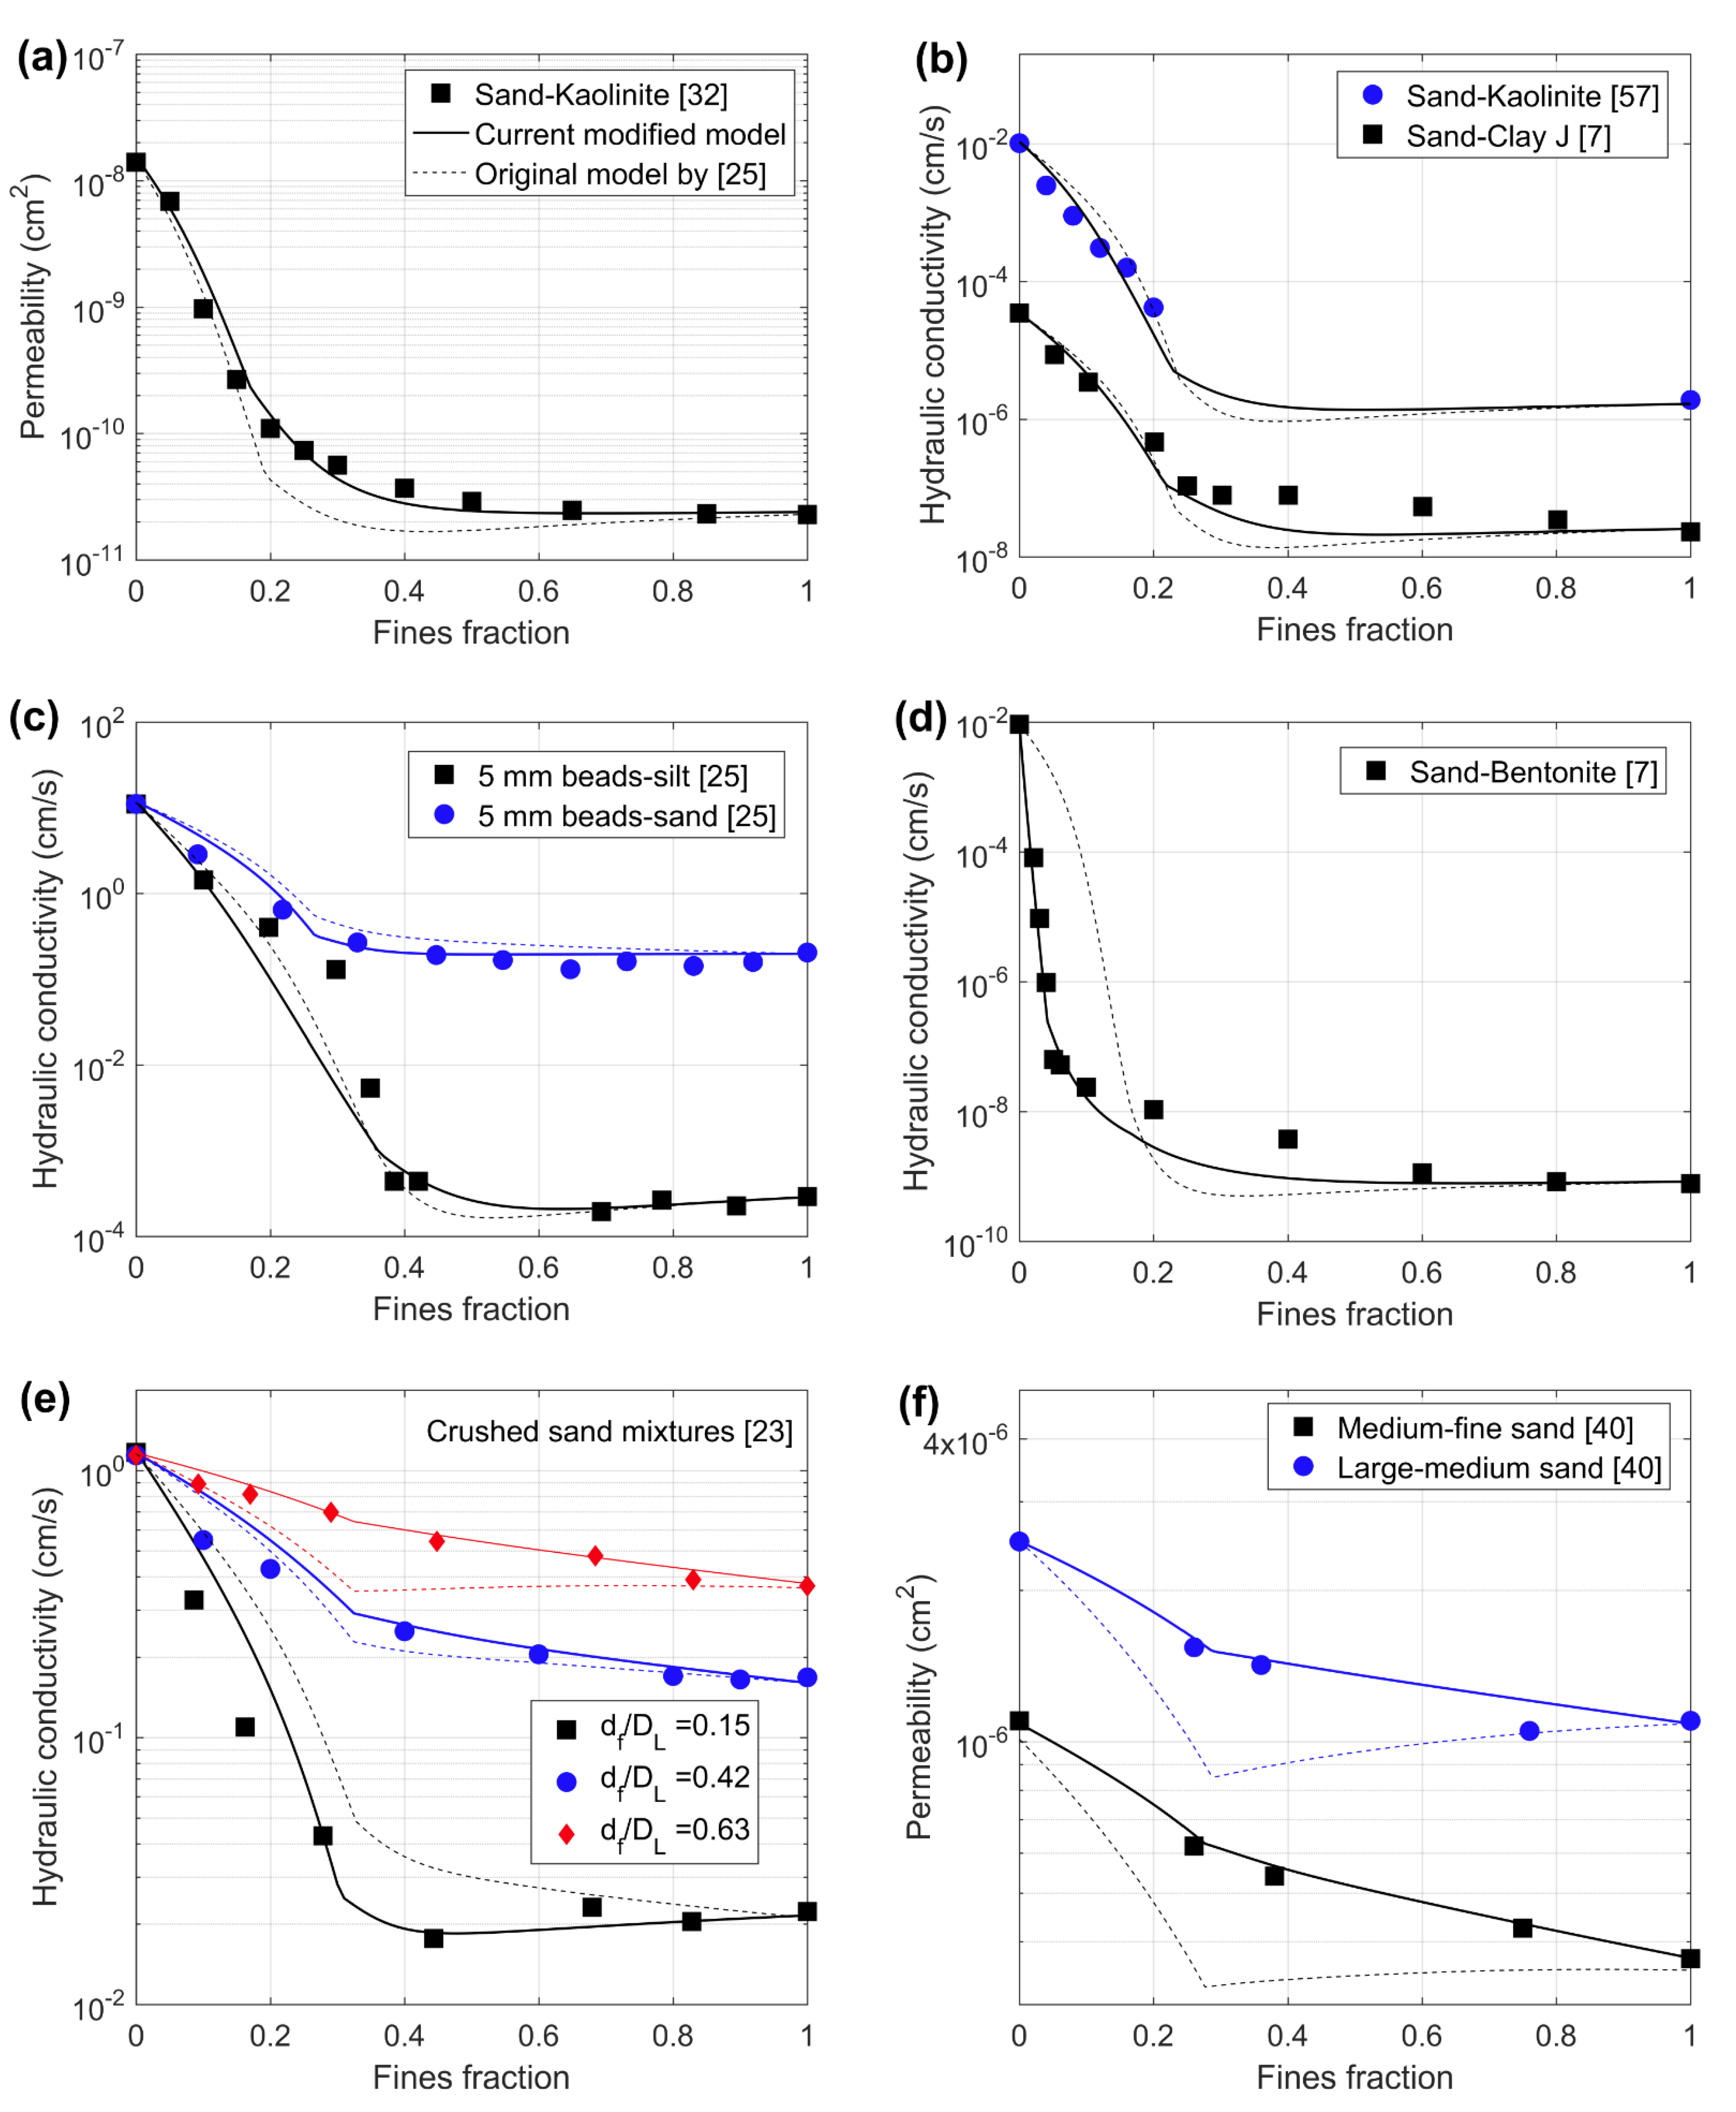
The prediction of K using the above approach have been tested using measurements of K for 16 different mixtures from nine different studies [7,23,25,32,40,48,53,57,58]. For mixtures involving clays (very low K), flexible wall permeameter (ASTM D5084) was predominantly used (e.g., [7,57]), while constant head method (ASTM D2434) was used for mixtures involving coarser graded sand (e.g., [23,25]). Figure 8 shows some examples for the prediction of K as function of fines fraction. Figure 8a–c show sand–fines mixtures characterized by small , Figure 8d is for sand–bentonite mixtures, while Figure 8e,f are predominantly for mixtures characterized by larger (graded sand binary mixtures). The prediction of the current model is shown in bold solid curves while the prediction using the approach presented by Zhang et al. [25] (Equations (1)–(3) and (19)–(21)) are shown in dashed curves. The predictions of the current model outperform that of Zhang et al. [25] especially, for mixtures involving bentonite or large . Figure 8d shows that ignoring the impact of swelling results in overestimation of K by one to two orders of magnitude in the mixtures at low fraction of bentonite. This can be explained by the overestimation of critical fines fraction as well as overestimation of porosity at low bentonite fraction as shown earlier in Figure 6b. Moreover, the packing model presented by Zhang et al. [25] under-predicts porosity of binary mixtures characterized by large (Figure 3) which consequently results in underestimation of K for such mixtures (Figure 8e,f). Based on the results, K at any given fine fraction of mixed graded sand increases as increases (Figure 8e,f). This is essentially due to the larger pore sizes present in the case of coarser particles compared to very fine particles.
For engineering purposes, it is important to determine the swelling bentonite content that is required to achieve sufficiently low hydraulic conductivity below the typical regulatory requirement (1 × 10⁻⁷ cm/s) [7,59,60,61]. Such sand–bentonite mixture can be used as barrier/liner material in several engineering applications including landfill, slurry cutoff walls, and radioactive waste disposal [7,8,9,61,62,63,64]. According to the results in Figure 8d, the low K limit is achieved at bentonite percentage of 5%. To investigate this further, Figure 9 shows K as function of bentonite fraction for various mixtures. The curves represent the modeling results incorporating (solid curves) or ignoring (dashed curves) the swelling impact. The curves were constructed based on the endmember data from [59]. The open symbols in Figure 9 correspond to data from different studies where endmembers measurements were not available. All data followed similar behavior where the presented model, incorporating swelling impact, could successfully predict the K of sand-bentonite mixtures. The regulatory limit of K (1 × 10⁻⁷ cm/s) is reached at bentonite percentage that is around 4–5% for medium sand–bentonite mixtures (Figure 9) which is consistent with results in Figure 8d. Such K limit is achieved at slightly lower bentonite fraction for mixtures containing fine sand (Figure 9) which also agrees with the modeling results. On the other hand ignoring the swelling impact in the packing model results in significant overestimation of K and bentonite content required for reaching the regulatory limit.
The mean absolute error in predicting K using the presented modified model is 0.032 cm/s while it is 0.064 cm/s when following the original model developed by Zhang et al. [25]. That is, the use of the current modified model reduces the mean absolute error in predicting K of binary mixed soils by 50%. Moreover, an important advantage of the current model is that it is applicable for wide range of binary mixed soils covering different particle sizes and fines types. It is a “unified” model that takes into account variable factors including: (a) full range of , (b) fines cohesive packing and (c) swelling impact.
Developing an accurate packing model can assist several real life applications such as (a) calculating the primary volume, porosity and permeability of deposited unconsolidated sediments when modeling sedimentary basins [65,66,67], (b) optimizing concrete and aggregates mixing design to achieve a desirable porosity and hydraulic conductivity values [13,14,15,18,19], and (c) designing liners and cut off walls [7,8,9,23,61,62]. For example, the fines fraction as well as the endmembers properties required to achieve a target hydraulic conductivity can be predicted. This can be done without the need for extensive mixing or laboratory measurements. Only properties (n, K, and grain size) of unmixed endmembers need to be measured and used as input parameters in the model through which the porosity and hydraulic conductivity of the binary mixed soil can be predicted at the full range of fines fraction. According to the presented model, minimizing the fines fraction required to reduce K significantly (occurs around ) would be ideally achieved by using a swelling clay such as bentonite (Figure 8d). Additionally, the hydraulic conductivity of the mixed soils can be minimized at any given fines fraction by choosing endmembers so that is small (Figure 8e). Conditions mentioned in Section 4.1 for minimizing porosity can also be considered when targeting a low hydraulic conductivity mixtures.
4.3. Discussion on Input Parameters and Further Potential Development
There are several input parameters that are required by the presented model where their reported values were based on the calibration with various published datasets. Some of the most important parameters include p = 0.25 (Equation (8)), S = 10 (Equations (10) and (11)) and a = 10 (Equation (21)). The use of such values is justified by the good match with experimental data reported for the large number of mixtures used in the calibration and validation process. Details regarding the physical meaning and estimation/calibration of the different parameters can be found in Section 3.2, Section 3.3 and Section 4.2. It is worth mentioning that re-calibration of the parameters could be conducted especially when dealing with mixtures composed of different sediment or particles (like rod-like particles) than the sand-fines mixtures used here. The model also requires measurements of porosity and hydraulic conductivity of the end-members. This section discusses sensitivity of the results to various input parameters values and provide some insights regarding feasible alternatives.
The cohesive packing parameter, p quantifies the degree of cohesive packing of the fines. The values of p that best reproduces the experimental results (Figure 4) ranges from 0.21 to 0.28 with an average of 0.25. This range is considered to be narrow given that p can theoretically vary between 0 and 1. Figure 10 demonstrates the variations of porosity that correspond to such range in p (red curves), where the average p is shown in black solid curve. It is evident from the figure that even the upper and lower limit for p range (0.28 and 0.21) are very close to the overall trend. The maximum difference in the porosity predicted using p = 0.21 and p = 0.28 is 0.02 (2 porosity units) and it can be observed at the critical fines fraction ( = 0.2) as shown in Figure 10. The results in Figure 10 suggest that small perturbation (±0.04) in average reported p dose not impact the porosity prediction significantly (red curves in Figure 10). However, much larger variations (±0.15) would provide unsatisfactory results (green curves in Figure 10) but such values were not observed for any of the mixtures.
Regarding the swelling parameter, S, it can be estimated using the measured swell index of the expansive clay (Equation (15)). In case swell index is not available, S = 10 could be considered as it shows already good match with various experimental results (Figure 8d and Figure 9) where the swell index was not reported. It is worth mentioning that a decrease in S would physically mean less swelling which in turn results in reaching the regulatory K limit (1 × 10⁻⁷ cm/s) and the critical fines fraction at larger fines content.
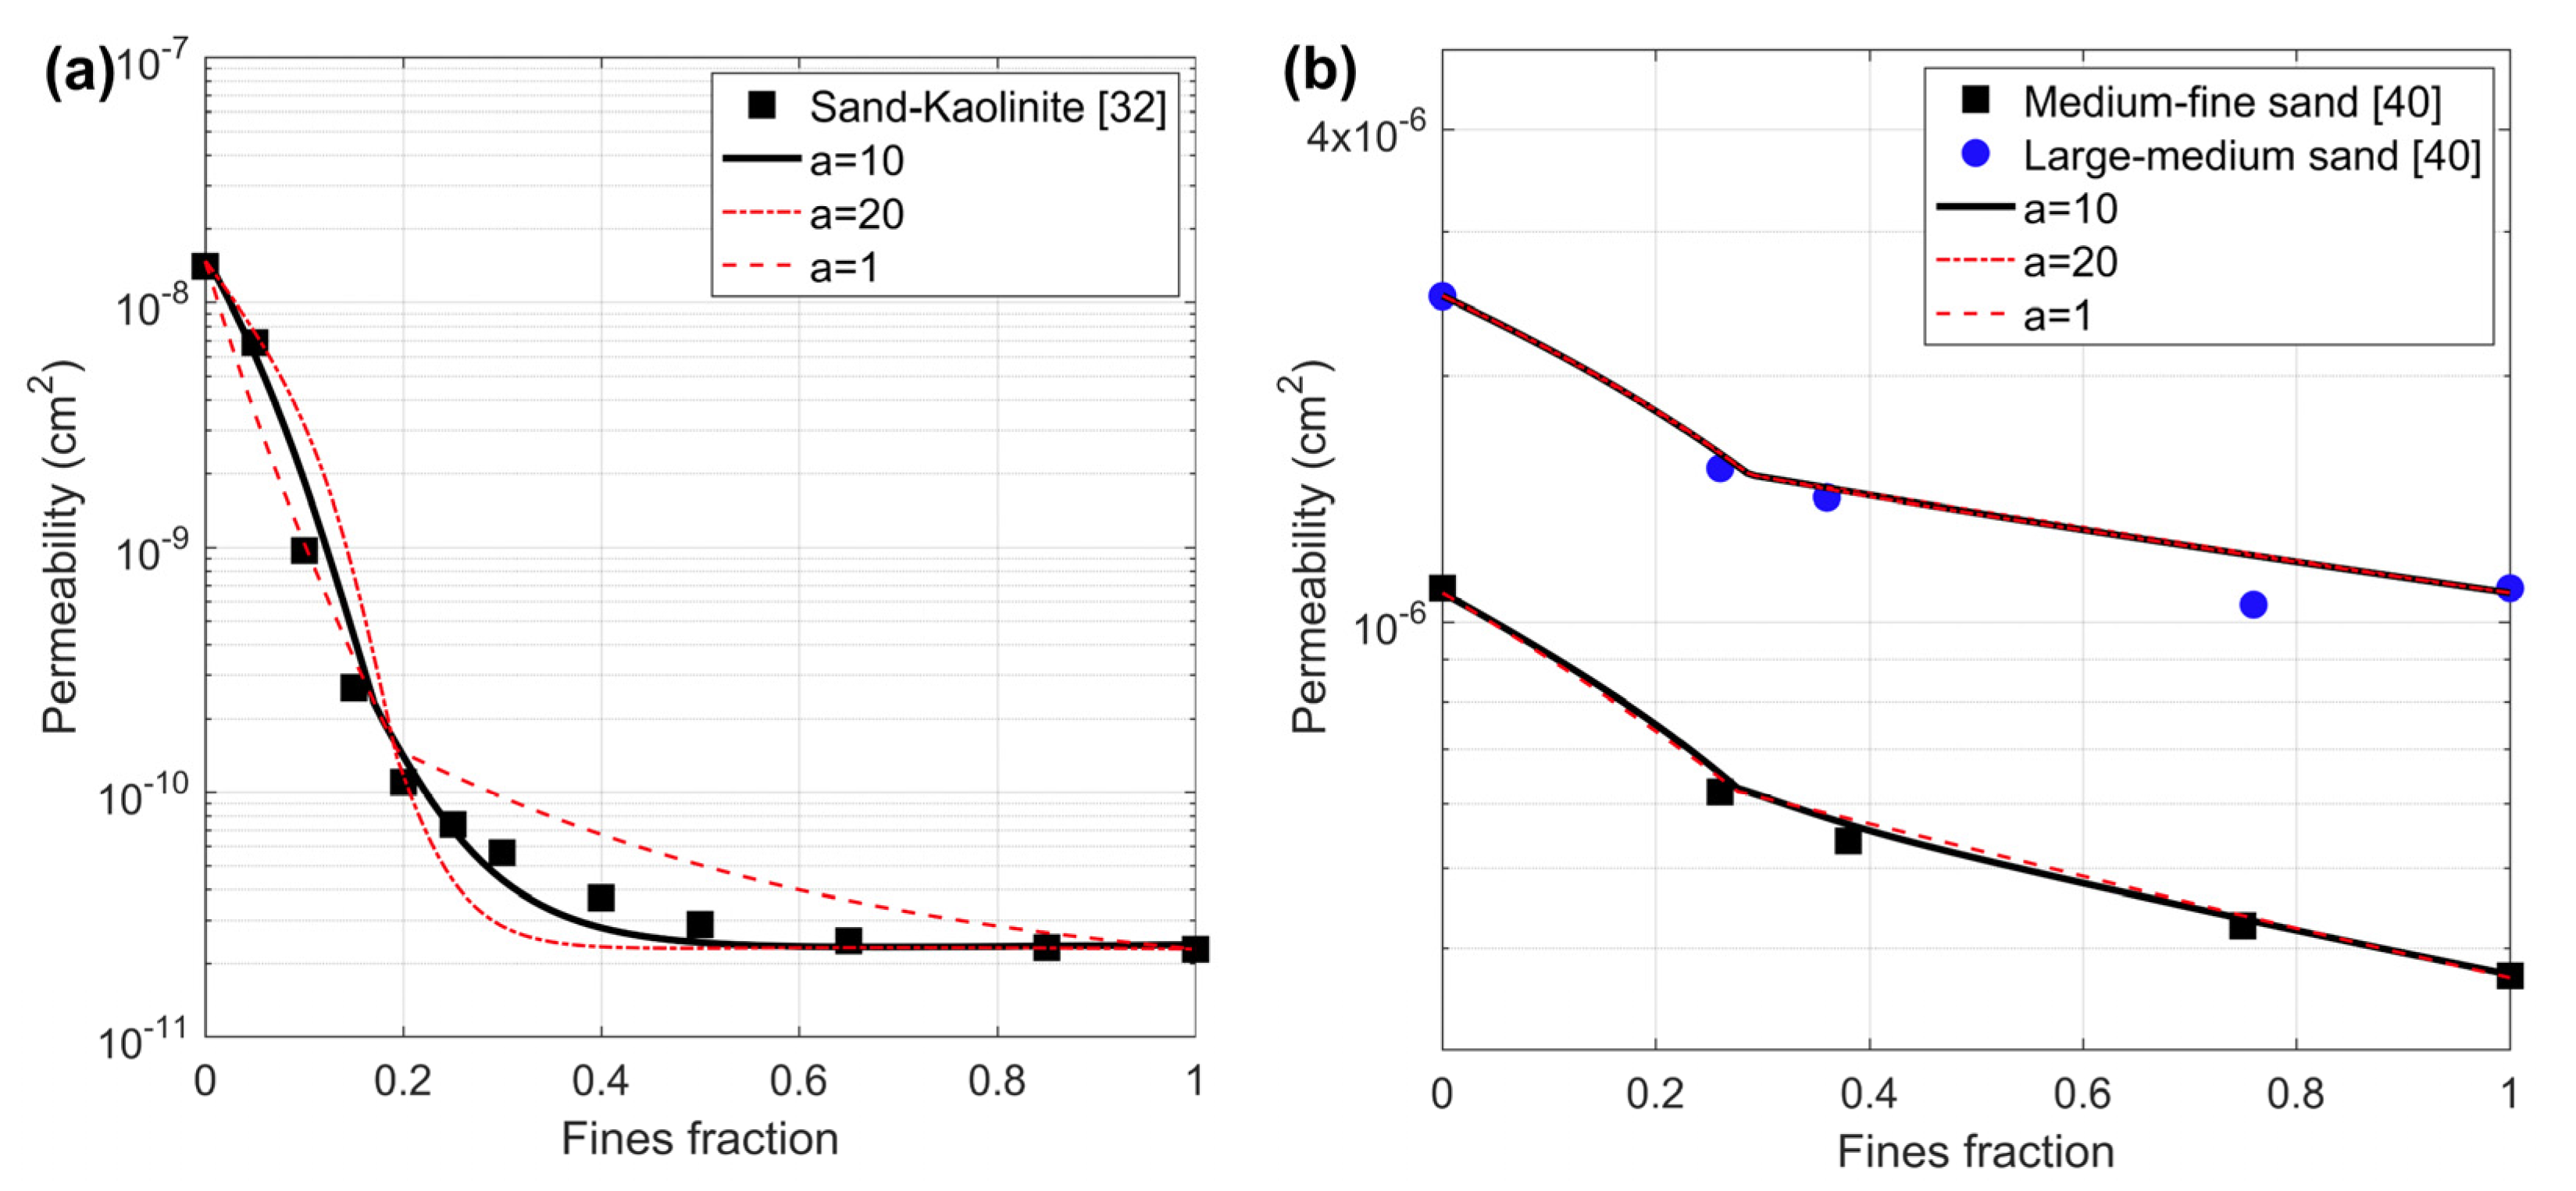
Regarding the parameter a, it is used to find the representative particle size for the binary mixture (Equations (20) and (21)). The average best fit value was found to be 10 while Figure 11 shows examples for the impact of varying a on the predicted permeability. For mixtures involving very fine particles (e.g., clay), deviation from a = 10 can slightly reduce the accuracy of the predicted permeability (Figure 11a). This is particularly the case for mixtures with fines fraction above 0.2 when using a values that are much lower than 10. In contrast, variations in a do not seem to impact the accuracy of permeability prediction for binary mixtures involving sand graded particles (in the absence of clay) as shown in Figure 11b. It seems that the difference between the endmembers representative particle size (or K) has to be very large (one or two orders of magnitudes), like the case between sand and clay, in order for parameter a to impact the predicted permeability. Otherwise, the predictions are not sensitive to variations in a. The use of a = 10 can ensure reasonable prediction of permeability even in the presence of very fine silt or clay (Figure 8 and Figure 11).
Another important input parameter that the presented model requires is porosity of the pure endmembers ( and ). The advantage of using the measured values for and is that it provides an accurate calibration points for the model which in turns result in accurate prediction. In case that measurements for and are not available, one may use existing empirical relations to predict porosity (or void ratio) of endmembers based on their particle size analysis and morphological characteristics such as roundness [68,69]. Such empirical relations are however developed for uniform sands and cannot be applied to pure fine silt or clay due to the complex packing of the latter. That is, the porosity of endmembers can be predicted using existing empirical relations [68,69] and then used as inputs in the current model when only dealing with binary mixtures composed of graded sands. It is important to mention that such approach can reduce the accuracy of the mixtures prediction due to the error introduced in the predicted and (percentage error varies between 4.9% and 8.5% [68]). Moreover, using empirical relations to find the porosity of endmembers would restricted the model applicability as this is not feasible in the presence of very fine silt or clays. Future work may consider developing relations for predicting the pure clay porosity based on other measurable properties such as plasticity index and particle size and morphology. Such development is outside the focus of this current work which focuses on the porosity of binary mixtures rather than pure uniform packing of endmembers.
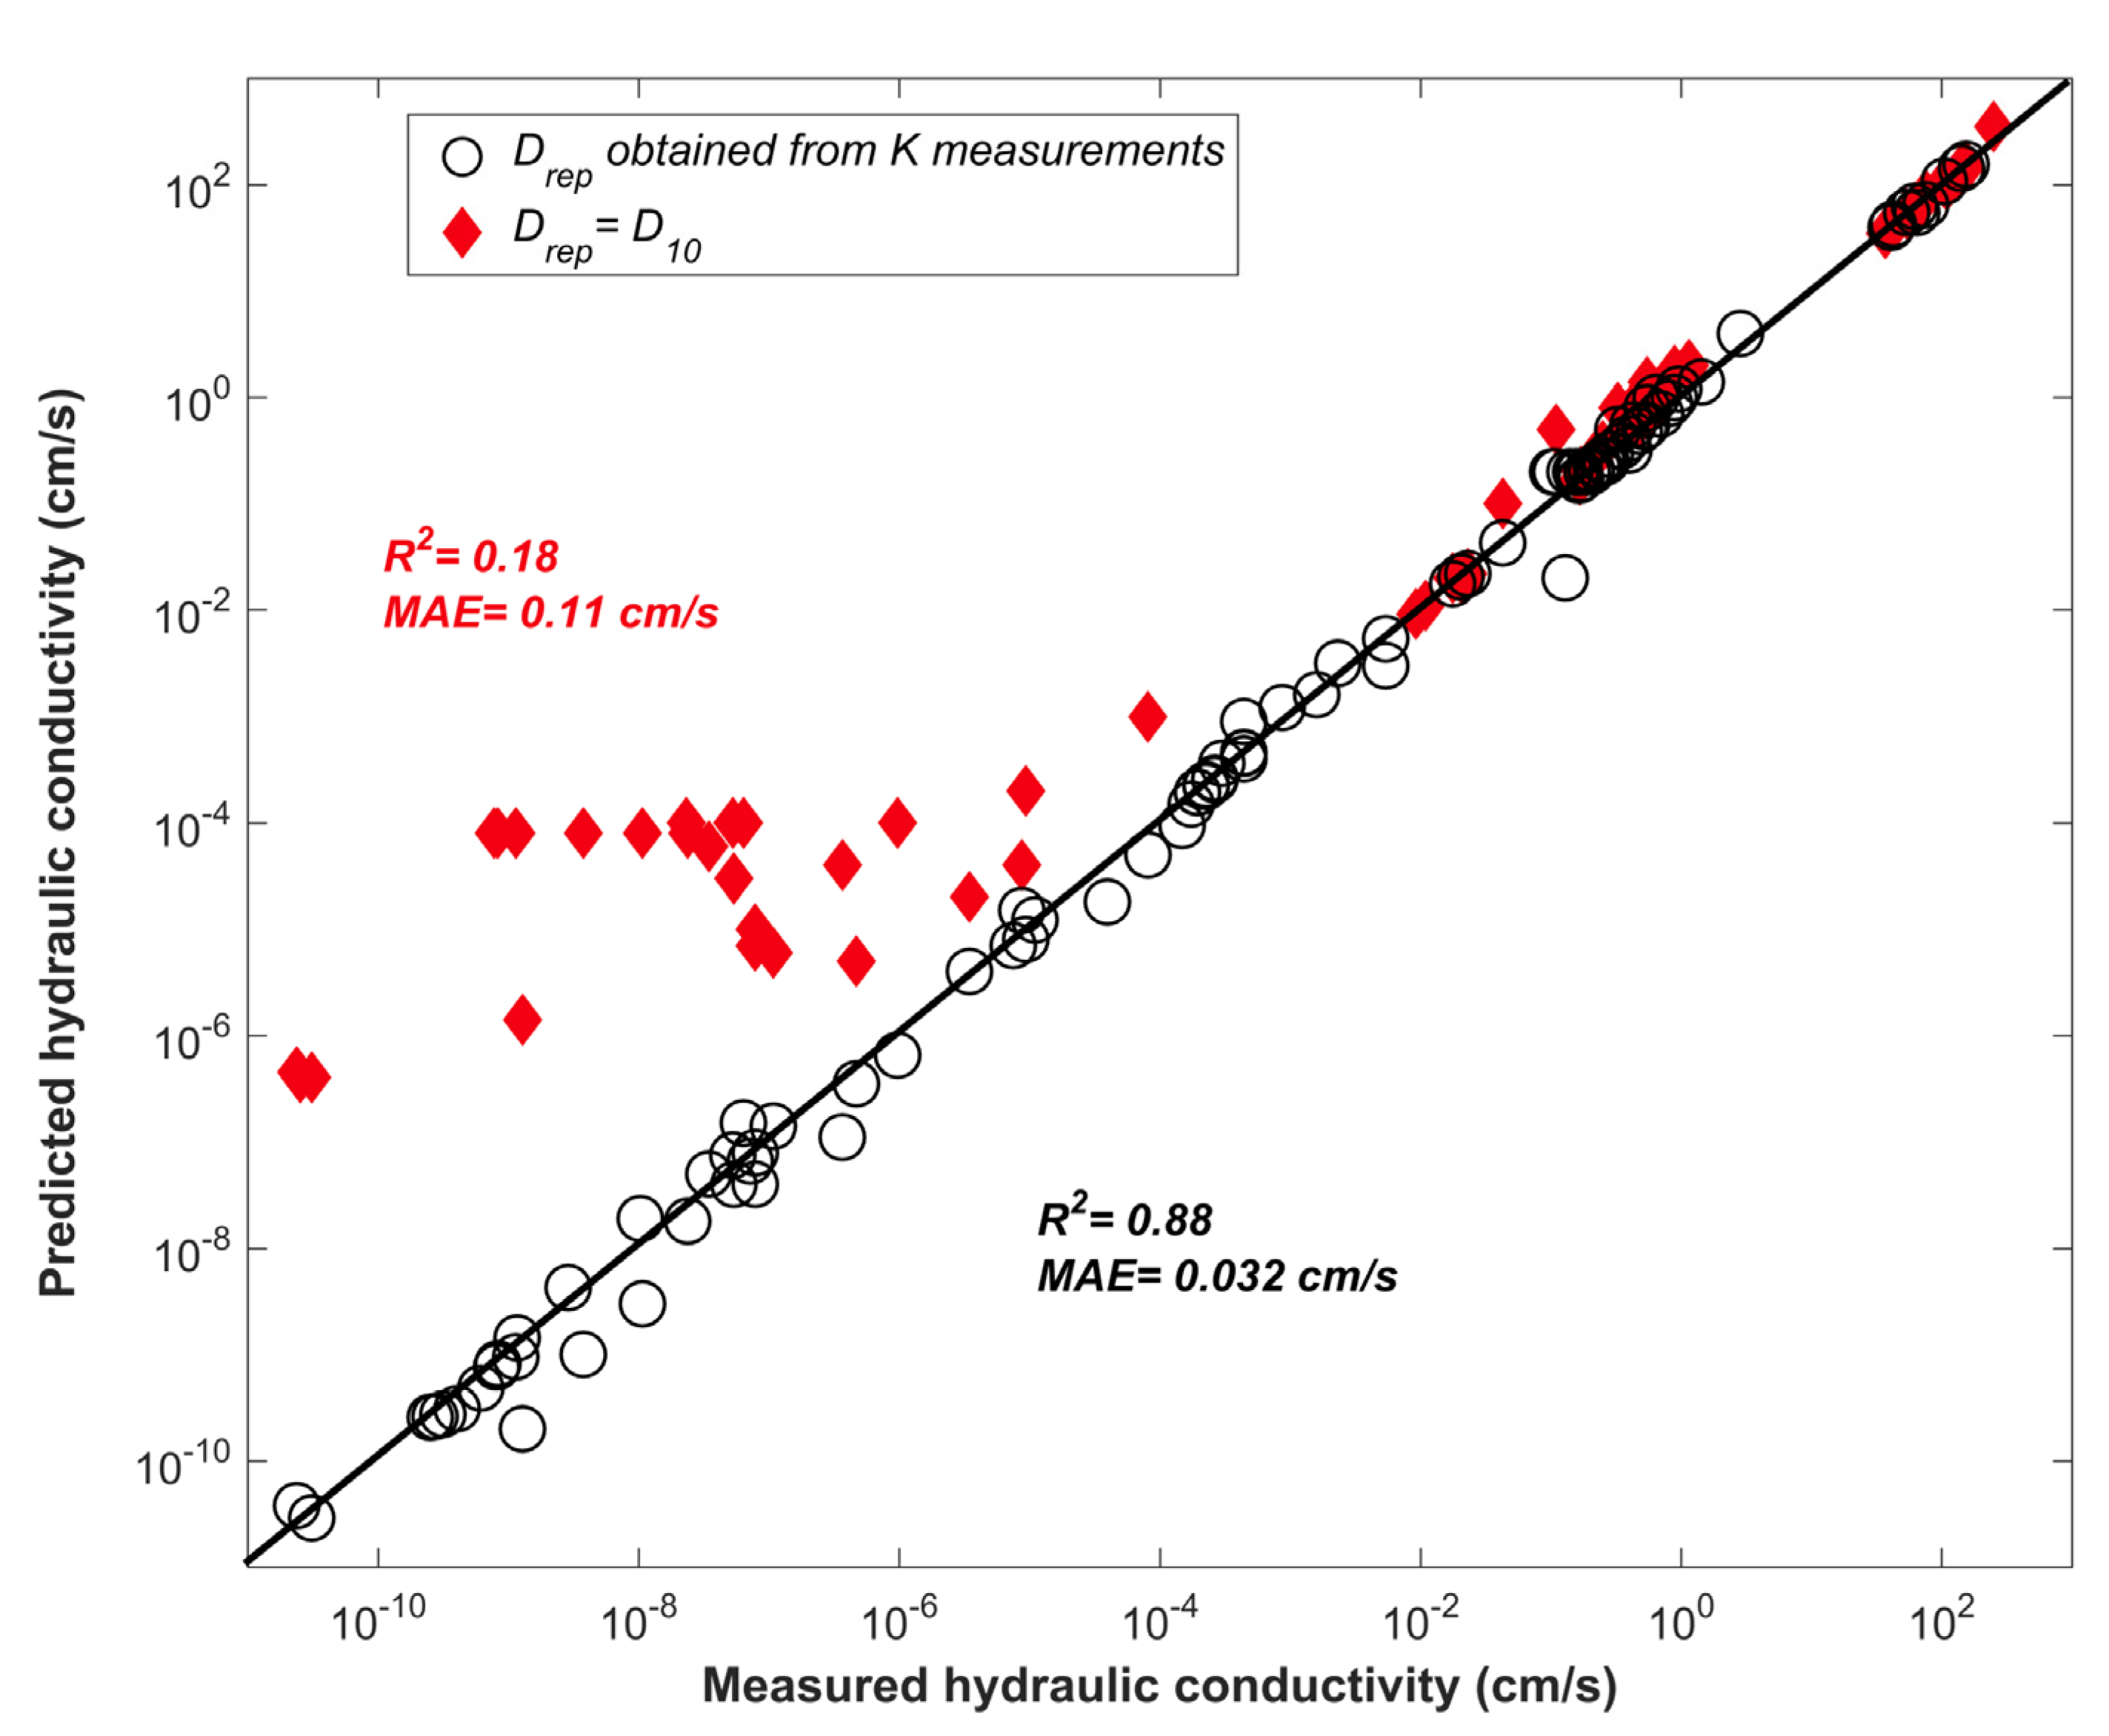
The current model also requires permeability or hydraulic conductivity, K, of the pure endmembers as inputs in the model since it is needed for the estimation of representative particle sizes ( and in Equations (19) and (20)). Measuring K of the endmembers is probably the most time consuming task in applying the current model but can ensure accurate prediction of representative particle sizes and K for the binary mixtures as function of fines fraction. In case K measurements are not available for endmembers, representative particle size might be estimated based on particle size distribution of the sediment [22,23,70,71]. There are different formulations to predict representative particle size based on particle size distribution but they frequently provide an estimate that is close to the effective grain size D10 [23,71,72,73]. Several studies showed that D10 can be used to obtain representative particle size and thus estimate K for sandy soils [71,72,73]. Following such approach, D10 might be used to find the representative particle size of the endmembers as an alternative to using measured K. In order to evaluate how such an approach impacts the accuracy of K prediction of the binary mixtures, D10 of the pure sand and pure fines (whenever available from the examined published work [7,23,25,32,40,48,53,57,58]) were used to represent and , respectively. The prediction of binary mixed soil K in this case does not require K of endmembers as an input. Figure 12 displays a comparison between the accuracy of the model when using K of endmembers as inputs (black circles) and when rather using D10 (red diamonds). Overall, the use of endmembers K to estimate Drep results in much better prediction of binary mixtures K (R2 = 0.88; MAE = 0.032) compared to the use of D10 (R2 = 0.18; MAE = 0.11). The results show that using D10 = Drep works well for mixtures characterized by high K (sand graded mixtures with no clay). Nevertheless, significant underestimation of K is observed for mixtures involving clays (low K) if D10 is used instead of K to define Drep. This is consistent with the fact the use of D10 and particle size distribution to estimate Drep and K was developed for sands rather than fines [23,71,72,73]. This results suggests that D10 can be good alternatives to using K of large sand particles to estimate Drep but such approach does not work for the fines in case of clay or fine silt. Alternative approaches to find representative particle size for clays can be considered in future development.
Porosity (or void ratio) is an important parameter that can impact various properties of binary mixed soils including liquefaction resistance [49], shear strength [4,45], and compressional velocity [32]. Therefore, estimating the void ratios of the binary mixed soils based on the current model can assist and improve the evaluation of such properties. For example, porosity has inverse relationship with compressional velocity, thus correcting the underestimation of porosity for mixtures involving clay (Figure 5) can help avoid the overestimation of compressional velocity as pointed out by [32]. Additionally, the current model can provide information about the critical fines content at which the mixture micro-geometrical arrangement shifts from sand-dominated to fines-dominated regime. Such information can be useful in understanding the liquefaction resistance and shear strength behavior of binary mixed soils as function of fines fraction [45,49]. For instance, liquefaction resistance is controlled by relative density (which is function of void ratios) but the resistance is higher in sand-dominated mixtures compared to fines-dominated mixtures at the same relative density [49]. Nevertheless, this study focuses on the prediction of porosity (or void ratio) and hydraulic conductivity. The use of the developed model and predicted void ratios or hydraulic conductivity in evaluating liquefaction resistance, shear strength or compressional velocity of mixed soils is outside the scope of the current work and can be considered in future development.
It is worth mentioning that the current developed model is applicable for sand-fines mixtures. The formulations and values of input parameter have been calibrated based on mixtures of coarse sands and fines (fine silt, or clay). The model is not intended for application in case of idealized and synthesized particles such as spheres and cylinders that can be of great significance to industrial and chemical engineering. The model formulations (Equations (14)–(18)) and values of input parameters (e.g., M, p, a, and S) would need to be re-calibrated if the current model is to be applied to such particles. There are also other packing models developed specifically for such synthesized particles that can rather be used [10,74,75,76,77,78].
5. Conclusions
This study presents a unified packing model for the purpose of predicting the porosity and hydraulic conductivity of binary mixed soils as function of fines fraction. The model modifies the formulations developed originally by Zhang et al. [25], to achieve three main improvements: (1) developing a correction function that is inclusive of wide range of binary mixed soils covering the whole range of , (2) it takes into account the cohesive packing behavior of the fines (clay or fine silt), and (3) it accounts for the impact of clay swelling. The presented model requires input parameters that can be obtained from the pure unmixed endmember including porosity, hydraulic conductivity and grain size. The model shows significant improvement in predicting porosity compared to existing models that frequently underestimate the porosity especially for mixtures with very small (<0.05) or large (>0.35) . The output of the model can also be used to improve the estimation of hydraulic conductivity of the soil mixtures. It was found that using the current packing model can reduce the mean absolute error in estimating hydraulic conductivity by 50% when compared to the original model developed by Zhang et al. [25]. The current model can be used to optimize concrete and soil mixing design to achieve a desirable porosity and hydraulic conductivity values.
The presented model requires the porosity and hydraulic conductivity of endmembers as input parameters. An alternative could be the use of empirical relations to find porosity and hydraulic conductivity of endmembers as function of particle size analysis and morphological characteristics. Such alternative can provide reasonable results for uniform sand endmembers but further work is needed to develop an approach for the cases involving fine silt or clay. The current study focused on developing an improved packing model for the purpose of predicting porosity and hydraulic conductivity of binary mixed soils. Further work may consider examining the implications of such model for understanding and predicting other important properties including liquefaction resistance and shear strength.
Funding
This research was funded by the Research Startup Grant no. SF19007 awarded to A.El-Husseiny by the College of Petroleum Engineering and Geosciences, in King Fahd University of Petroleum and Minerals (KFUPM).
Institutional Review Board Statement
Not applicable.
Informed Consent Statement
Not applicable.
Data Availability Statement
No new data were created or analyzed in this study. Data sharing is not applicable to this article. All data used are from published studies which were cited in relevant text and figures.
Acknowledgments
The author thanks the College of Petroleum Engineering and Geosciences in King Fahd University of Petroleum and Minerals for supporting this work.
Conflicts of Interest
The author declares no conflict of interest.
References
- Hwang, H.; Jeen, S.K.; Suleiman, A.A.; Lee, K. Comparison of Saturated Hydraulic Conductivity Estimated by Three Different Methods. Water 2017, 9, 942. [Google Scholar] [CrossRef] [Green Version]
- Koltermann, C.E.; Gorelick, S.M. Fractional packing model for hydraulic conductivity derived from sediment mixtures. Water Resour. Res. 1995, 31, 3283–3297. [Google Scholar] [CrossRef]
- El-Husseiny, A.; Vanorio, T. Porosity-permeability relationship in dual porosity carbonate analogs. Geophysics 2017, 82, MR65–MR74. [Google Scholar] [CrossRef]
- Salgado, R.; Bandini, P.; Karim, A. Shear strength and stiffness of silty sand. J. Geotech. Geoenviron. Eng. 2000, 126, 451–462. [Google Scholar] [CrossRef]
- Selig, E.; Ladd, R. Evaluation of Relative Density Measurements and Applications: Evaluation of Relative Density and Its Role in Geotechnical Projects Involving Cohesionless Soils; ASTM International: West Conshohocken, PA, USA, 1973. [Google Scholar]
- Kamann, P.J.; Ritzi, R.W.; Dominic, D.F.; Conrad, C.M. Porosity and permeability in sediment mixtures. Ground Water 2007, 45, 429–438. [Google Scholar] [CrossRef] [PubMed]
- Xu, H.; Zhu, W.; Qian, X.; Wang, S.; Fan, X. Studies on hydraulic conductivity and compressibility of backfills for soil-bentonite cutoff walls. Appl. Clay Sci. 2016, 132, 326–335. [Google Scholar] [CrossRef]
- Sällfors, G.; Öberg-Högsta, A.-L. Determination of hydraulic conductivity of sand-bentonite mixtures for engineering purposes. Geotech. Geol. Eng. 2002, 20, 65–80. [Google Scholar] [CrossRef]
- Akgün, H.; Koçkar, M.; Aktürk, Ö. Evaluation of a compacted bentonite/sand seal for underground waste repository isolation. Environ. Geol. 2006, 50, 331–337. [Google Scholar] [CrossRef]
- Mota, M.; Teixeira, J.A.; Bowen, W.R.; Yelshin, A. Binary spherical particle mixed beds: Porosity and permeability relationship measurements. Trans. Filt. Soc. 2001, 1, 101–106. [Google Scholar]
- Mota, M.; Teixeira, J.A.; Bowen, W.R.; Yelshin, A. Interference of coarse and fine particles of different shape in mixed porous beds and filter cakes. Miner. Eng. 2003, 16, 135–144. [Google Scholar] [CrossRef] [Green Version]
- Dias, R.; Teixeira, J.A.; Mota, M.; Yelshin, A. Tortuosity variation in a low density binary particulate bed. Separat. Purificat. Technol. 2006, 51, 180–184. [Google Scholar] [CrossRef] [Green Version]
- Moini, M.; Sobolev, K.; Flores-Vivian, I.; Amirjanov, A. Modeling and Experimental Evaluation of Aggregate Packing for Effective Application in Concrete. J. Mater. Civ. Eng. 2019, 31. [Google Scholar] [CrossRef]
- Kwan, A.K.H.; Fung, W.W.S. Packing density measurement and modelling of fine aggregate and mortar. Cem. Concr. Compos. 2009, 31, 349–357. [Google Scholar] [CrossRef]
- Wong, V.; Chan, K.W.; Kwan, A.K.H. Applying theories of particle packing and rheology to concrete for sustainable development. Org. Technol. Manag. Constr. 2013, 5, 844–851. [Google Scholar] [CrossRef] [Green Version]
- Kerimov, A.; Mavko, G.; Mukerji, T.; Dvorkin, J.; Al Ibrahim, M.A. The influence of convex particles’ irregular shape and varying size on porosity, permeability, and elastic bulk modulus of granular porous media: Insights from numerical simulations. J. Geophys. Res. Solid Earth 2018, 123, 10,563–10,582. [Google Scholar] [CrossRef]
- Kim, M.; Seo, H. Evaluation of one- and two-parameter models for estimation of void ratio of binary sand mixtures deposited by dry pluviation. Granul. Matter 2019, 21, 71. [Google Scholar] [CrossRef]
- Park, J.; Santamarina, J.C. Revised soil classification system for coarse-fine mixtures. J. Geotech. Geoenviron. Eng. 2017, 143, 04017039. [Google Scholar] [CrossRef] [Green Version]
- Osuji, S.O.; Inerhunwa, I. Determination of optimum characteristics of binary aggregate mixtures. Civ. Environ. Res. 2015, 7, 68–75. [Google Scholar]
- Shakoor, A.; Cook, B.D. The effect of stone content, size, and shape on the engineering properties of a compacted silty clay. Environ. Eng. Geosci. 1990, xxvii, 245–253. [Google Scholar] [CrossRef]
- Alakayleh, Z.; Clement, P.; Fang, X. Understanding the Changes in Hydraulic Conductivity Values of Coarse- and Fine-Grained Porous Media Mixtures. Water 2018, 10, 313. [Google Scholar] [CrossRef] [Green Version]
- Chapuis, R.P. Predicting the saturated hydraulic conductivity of soils: A review. Bull. Eng. Geol. Environ. 2012, 71, 401–434. [Google Scholar] [CrossRef]
- Choo, H.; Lee, W.; Lee, C.; Burns, S.E. Estimating Porosity and particle size for hydraulic conductivity of binary mixed soils containing two different-sized silica particles. J. Geotech. Geoenviron. Eng. 2018, 144, 04017104. [Google Scholar] [CrossRef]
- Ren, X.W.; Zhao, Y.; Deng, Q.L.; Kang, J.Y.; Li, D.X.; Wang, D.B. A relation of hydraulic conductivity-void ratio for soils based on Kozeny-Carman equation. Eng. Geol. 2016, 213, 89–97. [Google Scholar] [CrossRef]
- Zhang, Z.F.; Ward, A.L.; Keller, J.M. Determining the porosity and saturated hydraulic conductivity of binary mixtures. Vadose Zone J. 2011, 10, 313–321. [Google Scholar] [CrossRef] [Green Version]
- Chang, C.S.; Wang, J.Y.; Ge, L. Modeling of minimum void ratio for sand-silt mixtures. Eng. Geol. 2015, 196, 293–304. [Google Scholar] [CrossRef]
- El-Husseiny, A.; Vanorio, T.; Mavko, G. Predicting porosity of binary mixtures made out of irregular nonspherical particles: Application to natural sediments. Adv. Powder Technol. 2019, 30, 1558–1566. [Google Scholar] [CrossRef]
- Yu, A.B.; Standish, N. Estimation of the porosity of particle mixtures by a linear-mixture packing model. Ind. Eng. Chem. Res. 1991, 30, 1372–1385. [Google Scholar] [CrossRef]
- Lade, P.V.; Liggio, C.D.; Yamamuro, J.A. Effects of non-plastic fines on minimum and maximum void ratios of sand. Geotech. Test. J. 1998, 21, 336–347. [Google Scholar]
- Westman, A.E.R.; Hugill, H.R. The packing of particles. J. Am. Ceram. Soc. 1930, 13, 767–779. [Google Scholar] [CrossRef]
- Yu, A.B.; Standish, N. Porosity calculation of multi-component mixtures of particles. Powder Technol. 1987, 52, 233–246. [Google Scholar] [CrossRef]
- Marion, D.; Nur, A.; Yin, H.; Han, D. Compressional velocity and porosity in sand-clay mixtures. Geophysics 1992, 57, 554–563. [Google Scholar] [CrossRef]
- El-Husseiny, A. Improved Packing Model for Functionally Graded Sand-Fines Mixtures—Incorporation of Fines Cohesive Packing Behavior. Appl. Sci. 2020, 10, 562. [Google Scholar] [CrossRef] [Green Version]
- Zou, R.P.; Gan, M.L.; Yu, A.B. Prediction of the porosity of multi-component mixtures of cohesive and non-cohesive particles. Chem. Eng. Sci. 2011, 66, 4711–4721. [Google Scholar] [CrossRef]
- Aksu, I.; Bazilevskaya, E.; Karpyn, Z.T. Swelling of clay minerals in unconsolidated porous media and its impact on permeability. GeoResJ 2015, 7, 1–13. [Google Scholar] [CrossRef] [Green Version]
- Israelachvili, J.N. Intermolecular & Surface Forces, 2nd ed.; Academic Press: London, UK, 1991. [Google Scholar]
- Visser, J. Van der Waals and other cohesive forces affecting powder fluidization. Powder Technol. 1989, 58, 1–10. [Google Scholar] [CrossRef]
- Simpson, D.C.; Evans, T.M. Behavioral thresholds in mixtures of sand and Kaolinite clay. J. Geotech. Geoenviron. Eng. 2016, 142, 04015073. [Google Scholar] [CrossRef]
- Liu, Z.R.; Ye, W.M.; Zhang, Z.; Wang, Q.; Chen, Y.G.; Cui, Y.J. Particle size ratio and distribution effects on packing behavior of crushed GMZ bentonite pellets. Powder Technol. 2019, 351, 92–101. [Google Scholar] [CrossRef]
- Phillips, P.M. Porosity and Permeability of Bimodal Sediment Mixtures Using Natural Sediments. Master’s Thesis, Wright State University, Dayton, OH, USA, 2007. [Google Scholar]
- Kwan, A.K.H.; Wong, V.; Fung, W.W.S. A 3-paramter packing density model for angular rock aggregate particles. Powder Technol. 2015, 274, 154–162. [Google Scholar] [CrossRef]
- Yilmaz, Y. A study on the limit void ratio characteristics of medium to fine mixed graded sands. Eng. Geol. 2009, 104, 290–294. [Google Scholar] [CrossRef]
- Guyon, E.; Oger, L.; Plona, T.J. Transport-properties in sintered porous-media composed of 2 particle sizes. J. Phys. D Appl. Phys. 1987, 20, 1637–1644. [Google Scholar] [CrossRef]
- McGeary, R.K. Mechanical packing of spherical particles. J. Am. Ceram. Soc. 1961, 44, 513–522. [Google Scholar] [CrossRef]
- Ueda, T.; Matsushima, T.; Yamada, Y. Effect of particle size ratio and volume fraction on shear strength of binary granular mixture. Granul. Matter 2011, 13, 731–742. [Google Scholar] [CrossRef]
- Cho, Y.T. The Study of GCTS Triaxial Apparatus Function and Mixing Sand Void Ratio. Master’s Thesis, Department of Civil Engineering, National Taiwan University, Taipei City, Taiwan, 2014. [Google Scholar]
- Yang, J.; Wei, L.M. Collapse of loose sand with the addition of fines: The role of particle shape. Géotechnique 2012, 62, 1111–1125. [Google Scholar] [CrossRef] [Green Version]
- Steiakakis, E.; Gamvroudis, C.; Komodromos, A.; Repouskou, E. Hydraulic conductivity of compacted kaolin–sand specimens under high hydraulic gradients. Electron. J. Geotech. Eng. 2012, 17, 783–799. [Google Scholar]
- Polito, C.P.; Martin, J.R. Effects of nonplastic fines on the liquefaction resistance of solids. J. Geotech. Geoenviron. Eng. 2001, 127, 408–415. [Google Scholar] [CrossRef]
- Zlatovic, S.; Ishihara, K. Normalized behavior of very loose non-plastic soils: Effects of fabric. Soils Found. 1997, 37, 47–56. [Google Scholar] [CrossRef] [Green Version]
- Thevanayagam, S.; Shenthan, T.; Mohan, S.; Liang, J. Undrained fragility of clean sands, silty sands and sandy silts. J. Geotech. Geoenviron. Eng. 2002, 128, 849–859. [Google Scholar] [CrossRef]
- Yang, S.L.; Sandven, R.; Grande, L. Instability of sand-silt mixtures. Soil Dyn. Earthq. Eng. 2006, 26, 183–190. [Google Scholar] [CrossRef]
- Knoll, M.D.; Knight, R. Relationships between dielectric and hydrogeologic properties of sand–clay mixtures. In Proceedings of the 5th International Conference on Ground Penetrating Radar, Kitchener, ON, Canada, 12–16 June 1994; pp. 45–61. [Google Scholar]
- Choo, H.; Lee, W.; Lee, C. Compressibility and small strain stiffness of kaolin clay mixed with varying amounts of sand. KSCE J. Civ. Eng. 2017, 21, 2152–2161. [Google Scholar] [CrossRef]
- Eberli, G.P.; Baechle, G.T.; Anselmetti, F.S.; Incze, M.L. Factors controlling elastic properties in carbonate sediments and rocks. Lead. Edge 2003, 22, 654–660. [Google Scholar] [CrossRef]
- Říha, J.; Petrula, L.; Hala, M.; Alhasan, Z. Assessment of empirical formulae for determining the hydraulic conductivity of glass beads. J. Hydrol. Hydromech. 2018, 66, 337–347. [Google Scholar] [CrossRef] [Green Version]
- Belkhatir, M.; Arab, A.; Della, N.; Schanz, T. Laboratory study on the hydraulic conductivity and pore pressure of sand-silt mixtures. Mar. Georesources Geotechnol. 2014, 32, 106–122. [Google Scholar] [CrossRef]
- Fuentes, W.M.; Hurtado, C.; Lascarro, C. On the influence of the spatial distribution of the fine content in the hydraulic conductivity of sand-clay mixtures. Earth Sci. Res. J. 2018, 22, 239–249. [Google Scholar] [CrossRef]
- Gleason, M.H.; Daniel, D.; Eykholt, G.R. Calcium and Sodium Bentonite for Hydraulic Containment Applications. J. Geotech. Geoenviron. Eng. 1997, 123, 438–445. [Google Scholar] [CrossRef]
- Kenney, T.C.; Veen, W.A.V.; Swallow, M.A.; Sungaila, M.A. Hydraulic conductivity of compacted bentonite-sand mixtures. Canad. Geotech. J. 1992, 29, 364–374. [Google Scholar] [CrossRef]
- Komine, H. Predicting hydraulic conductivity of sand–bentonite mixture backfill before and after swelling deformation for underground disposal of radioactive wastes. Eng. Geol. 2010, 114, 123–134. [Google Scholar] [CrossRef]
- Gueddouda, M.K.; Goual, I.; Benabed, B.; Taibi, S.; Aboubekr, N. Hydraulic properties of dune sand–bentonite mixtures of insulation barriers for hazardous waste facilities. J. Rock Mech. Geotech. Eng. 2016, 8, 541–550. [Google Scholar] [CrossRef] [Green Version]
- Ghazi, A.F. Engineering Characteristics of Compacted Sand-Bentonite Mixtures. Master’s Thesis, Edith Cowan University, Joondalup, Australia, 2015. [Google Scholar]
- Koda, E.; Osinski, P. Bentonite cut-off walls: Solution for landfill remedial works. Environ. Geotech. 2017, 4, 223–232. [Google Scholar] [CrossRef]
- Yiming, Y.; Zhang, L.; Luo, X. Calculating the primary porosity of unconsolidated sands based on packing texture: Application to braided river sands. Mar. Pet. Geol. 2019, 107, 515–526. [Google Scholar] [CrossRef]
- Luijendijk, E.; Gleeson, T. How well can we predict permeability in sedimentary basins? Deriving and evaluating porosity–permeability equations for noncemented sand and clay mixtures. Geofluids 2015, 15, 67–83. [Google Scholar] [CrossRef] [Green Version]
- Wu, W.; Li, W. Porosity of bimodal sediment mixture with particle filling. Int. J. Sediment Res. 2017, 32, 253–259. [Google Scholar] [CrossRef]
- Chang, C.S.; Deng, Y.; Meidani, M. A multi-variable equation for relationship between limiting void ratios of uniform sands and morphological characteristics of their particles. Eng. Geol. 2018, 237, 21–31. [Google Scholar] [CrossRef]
- Chapuis, R.P. Estimating the in situ porosity of sandy soils sampled in boreholes. Eng. Geol. 2012, 141–142, 57–64. [Google Scholar] [CrossRef]
- Carrier, W.D. Goodbye, Hazen; Hello, Kozeny–Carman. J. Geotech. Geoenviron. Eng. 2003, 129, 1054–1056. [Google Scholar] [CrossRef]
- Koch, K.; Kemna, A.; Irving, J.; Holliger, K. Impact of changes in grain size and pore space on the hydraulic conductivity and spectral induced polarization response of sand. Hydrol. Earth Syst. Sci. 2011, 15, 1785–1794. [Google Scholar] [CrossRef] [Green Version]
- Ishaku, J.M.; Gadzama, E.W.; Kaigama, U. Evaluation of empirical formulae for determination of hydraulic conductivity based on grain-size analysis. J. Geol. Min. Res. 2011, 3, 105–113. [Google Scholar]
- Cheng, C.; Chen, X. Evaluation of methods for determination of hydraulic properties on an aquifer-aquitard system hydrologically connected to river. Hydrogeol. J. 2007, 15, 669–678. [Google Scholar] [CrossRef]
- Wong, V.; Kwan, A.K.H. A 3-parameter model for packing density prediction of ternary mixes of spherical particles. Powder Technol. 2014, 268, 357–367. [Google Scholar] [CrossRef]
- Nan, W.; Wang, Y.; Liu, Y.; Tang, H. DEM simulation of the packing of rodlike particles. Adv. Powder Technol. 2015, 26, 527–536. [Google Scholar] [CrossRef]
- Zhao, J.; Li, S.; Zou, R.; Yu, A. Dense random packings of spherocylinders. Soft Matter 2012, 8, 1003–1009. [Google Scholar] [CrossRef]
- Zou, R.P.; Yu, A. Evaluation of the packing characteristics of mono-sized non-spherical particles. Powder Technol. 1996, 88, 71–79. [Google Scholar] [CrossRef]
- Yu, A.B.; Zou, R.P.; Standish, N. Modifying the linear packing model for predicting the porosity of non-spherical particle mixtures. Ind. Eng. Chem. Res. 1996, 35, 3730–3741. [Google Scholar] [CrossRef]
Figure 1.
Illustration of binary mixture porosity variation as function of fines fraction. The ideal mixing case (black curve) results in lowest porosity at any given fines fraction compared to non-ideal (blue curves) and no-mixing (red curve) cases. M refers to the mixing correction parameter in Equations (1) and (2). Schematic drawings of the corresponding packing for points (A–C) are shown to the right of the plot. Blue arrows in schematic drawing (B) refer to large pore space introduced due to packing disturbance. Figure is modified after [23].

Figure 2.
Data-derived best fit mixing coefficient, M, as function of particle size ratio for two groups of binary mixtures: non-cohesive mixed soil in black circles (data from [6,17,23,25,30,40,41,42,43,44,45,46]) and mixtures with cohesive fines component shown in red diamond (data from [7,30,32,47,48,49,50,51,52,53,54,55]). The predictions of M based on original formulation (Equation (3)) and the modified one.

Figure 3.
Porosity (n) or void ratio (e) as function of fines fraction for different binary mixed soils. Subfigures (a)–(c) show different examples from different binary mixed soils where data sources are displayed in the upper left corner for each plot. The fine-to-large grain size ratio for each mixture is shown where blue data points represent mixtures characterized by larger compared to red data points. The dashed blue and red curves correspond to the prediction from the original model (Equations (1)–(3)) while the current modified model (Equations (1), (2) and (6)) predictions are shown in solid curves.

Figure 4.
Comparison between the data-derived best fit mixing coefficient M, and the predicted values for mixtures involving cohesive fines (clay or fine silt). Predictions were done using two different approaches: without incorporating cohesive packing (red diamonds), versus incorporating cohesive packing (black circles). The correlation coefficient (R2) and mean absolute error (MAE) for each approach are shown in red and black color.

Figure 5.
Porosity (n) or void ratio (e) as function of fines fraction for different binary mixed soils containing cohesive packing. Subfigures (a)–(c) show different examples from different binary mixed soils where the source of the data is cited in the upper part of the plot. Dashed curves refer to the model prediction without accounting for fines cohesive packing (Equations (1), (2) and (6)) while solid curves correspond to the prediction of the modified model (Equations (1), (2), and (7)–(9)).

Figure 6.
Porosity as function fines fraction for: (a) mixtures of Fujian sand and Jiangning non-swelling clay (clay-J), (b) mixtures of Fujian sand and bentonite. Experimental results (black circles) are reported by Xu et al. [7]. Dashed black curves correspond to the predictions of the model discussed above (Equations (1), (2) and (7)–(9)) without incorporation of swelling impact.

Figure 7.
Porosity as function of bentonite fraction for a mixture of Fujian sand and bentonite where data were measured by Xu et al. [7] under pressure of (a) 25 kPa and (b) 800 kPa. Red curve correspond to the prediction from the current model (Equations (7)–(9) and (10)–(12)) while the dashed black curve represents the prediction from the modified ideal packing model by Xu et al. [7].

Figure 8.
Hydraulic conductivity (or permeability) as function of fines fraction for various binary mixed soils. Subfigures (a)–(f) show different examples from different binary mixed soils where the source of the data is shown in the right upper corner. The prediction of the current model (Equations (13)–(18) and (19)–(21)) is shown in bold solid curves while the prediction using the approach presented by Zhang et al. [25] (Equations (1)–(3) and (19)–(21)) is shown in dashed curves.

Figure 9.
Hydraulic conductivity as function of bentonite fraction for various sand–bentonite mixtures. The figure shows bentonite fraction up to only 0.3 to highlight the impact of ignoring swelling which is most significant at low bentonite fraction. The prediction of the current model (Equations (13)–(18) and (19)–(21), S = 10)is shown in bold solid curves while the prediction using the approach presented by Zhang et al. [25] (Equations (1)–(3) and (19)–(21)) is shown in dashed curves.

Figure 10.
Porosity as function of fines fraction for sand–Kaolinite mixtures from [32]. The different curves were produced using the presented model (Equations (11)–(18)) for different p values. The average value reported based on all mixtures examined is 0.25 (black solid curve) while the red curves show the upper and lower values of the feasible range. Green curves are for p values far the feasible range showing unsatisfactory prediction.

Figure 11.
Permeability as function of fines fraction for (a) sand–Kaolinite mixtures from [32], and (b) binary graded sand mixtures [40]. The different curves were produced using the current model ((13)–(18) and (19)–(21)) for different a values. The average value reported based on all mixtures examined is 10 (black solid curve) while the red curves represent the prediction at different a values. No obvious differences are noticed except in the presence of clay in the mixture.

Figure 12.
Comparison between the measured and predicted hydraulic conductivity using current model (Equations (13)–(18) and (19)–(21)). Red data points correspond to the predictions done by using and to define and in Equation (20) while the black circles refer to the prediction using K of endmembers as input parameters to estimate and . The use of and was not possible in some mixtures where the required particle size was not reported.

Publisher’s Note: MDPI stays neutral with regard to jurisdictional claims in published maps and institutional affiliations. |
© 2021 by the author. Licensee MDPI, Basel, Switzerland. This article is an open access article distributed under the terms and conditions of the Creative Commons Attribution (CC BY) license (http://creativecommons.org/licenses/by/4.0/).
Share and Cite
MDPI and ACS Style
El-Husseiny, A. Unified Packing Model for Improved Prediction of Porosity and Hydraulic Conductivity of Binary Mixed Soils. Water 2021, 13, 455. https://doi.org/10.3390/w13040455
AMA Style
El-Husseiny A. Unified Packing Model for Improved Prediction of Porosity and Hydraulic Conductivity of Binary Mixed Soils. Water. 2021; 13(4):455. https://doi.org/10.3390/w13040455
Chicago/Turabian StyleEl-Husseiny, Ammar. 2021. "Unified Packing Model for Improved Prediction of Porosity and Hydraulic Conductivity of Binary Mixed Soils" Water 13, no. 4: 455. https://doi.org/10.3390/w13040455
Note that from the first issue of 2016, this journal uses article numbers instead of page numbers. See further details here.