
Modeling Bacterial Regrowth and Trihalomethane Formation in Water Distribution Systems


Civil and Environmental Engineering, Technion—Israel Institute of Technology, Haifa 32000, Israel
*
Author to whom correspondence should be addressed.
Water 2021, 13(4), 463; https://doi.org/10.3390/w13040463
Submission received: 18 January 2021
/
Revised: 28 January 2021
/
Accepted: 6 February 2021
/
Published: 10 February 2021
(This article belongs to the Special Issue Multi-Quality Water Distribution Systems Analysis: Simulation and Management)
Abstract
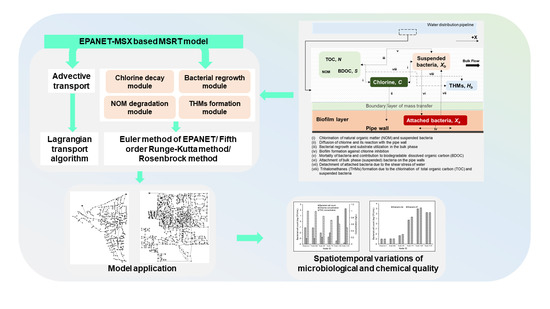
:The formation of bacterial regrowth and disinfection by-products is ubiquitous in chlorinated water distribution systems (WDSs) operated with organic loads. A generic, easy-to-use mechanistic model describing the fundamental processes governing the interrelationship between chlorine, total organic carbon (TOC), and bacteria to analyze the spatiotemporal water quality variations in WDSs was developed using EPANET-MSX. The representation of multispecies reactions was simplified to minimize the interdependent model parameters. The physicochemical/biological processes that cannot be experimentally determined were neglected. The effects of source water characteristics and water residence time on controlling bacterial regrowth and Trihalomethane (THM) formation in two well-tested systems under chlorinated and non-chlorinated conditions were analyzed by applying the model. The results established that a 100% increase in the free chlorine concentration and a 50% reduction in the TOC at the source effectuated a 5.87 log scale decrement in the bacteriological activity at the expense of a 60% increase in THM formation. The sensitivity study showed the impact of the operating conditions and the network characteristics in determining parameter sensitivities to model outputs. The maximum specific growth rate constant for bulk phase bacteria was found to be the most sensitive parameter to the predicted bacterial regrowth.
1. Introduction
The focus during the operation of water distribution systems (WDSs) is to maintain the risk of trade-off between protection against opportunistic pathogens and the disinfection by-products (DBPs) [1]. Water quality models, specifically multispecies reactive-transport (MSRT) models that simulate the interactions and transport of various abiotic and biotic factors in the WDSs, become significant in this regard. Most of the attempts to model the bacterial regrowth and DBP formation in WDSs utilized deterministic approaches applying theoretical knowledge about reactions of the numerous reactive water species [2].
The conceptual base for multispecies modeling in WDSs was set forth by the pioneering work of [3]. The deterministic model, named the SANCHO model, developed by [4], established itself as a convenient water quality modeling tool. However, the SANCHO model, not linked with a hydraulic analysis model, later became inadequate to investigate water quality under unsteady flow conditions. Nonetheless, the PICCOBIO model [5], effectively linked with a hydraulic analysis model (Piccolo), facilitated dynamic modeling of water quality variations within the distribution pipes.
Apparently, during the development of the PICCOBIO model, the researchers complicated the mathematical descriptions and increased the number of parameters used for describing the multispecies interactions. The model postulated that the biofilm layers would consist of chlorinated and non-chlorinated layers, and that the diffusion of chlorine would only take place up to the chlorinated layer. In addition, the reactions of hypochlorite ions and hypochlorous acid were separately addressed to explain the reaction kinetics of chlorine in WDSs. As the expected variation in pH is negligible during the conveyance of water in distribution pipes, significant changes might not happen to the relative proportions of the two forms of free chlorine. Therefore, a more general and simplified kinetic description with a smaller number of parameters, neglecting the effect of pH, could have provided a good explanation of the process of bacterial mortality induced by free chlorine. Equally, the use of different reaction rates for hypochlorous acid and hypochlorite ions in the mathematical description of chlorine disappearance reactions could have also been avoided and instead, a simpler kinetic relationship could have been advocated. The number of parameters employed in the kinetic descriptions for detachment could also be lower, and a much simpler mathematical description could have been adopted, reducing the computational efforts.
The later model proposed by [6] successfully overcame many of the aforementioned drawbacks of the PICCOBIO model. These researchers simplified the mathematical expressions to define the multispecies processes concerning bacterial regrowth inside distribution pipes. However, the bacterial detachment from the biofilm layers was assumed to follow first-order kinetics concerning bacterial counts in this attempt. Consequently, the model by [6] failed in explicitly accounting for the temperature effects and the turbulent shear effects on the biofilm dynamics [7]. The mechanistic model developed by [8], akin to [6], presumed first-order dependence of the detaching bacteria with both the flow velocity and the biofilm density. However, specific conceptual issues plagued the model by [8], and several assumptions made during its development stage have been proven to be inadequate by recent studies [9].
All the above-discussed mechanistic MSRT models dealt mainly with the microbiological interactions in the WDSs and the microbiological quality of the delivered water. None of the above models considered the formation and transport of DBPs in WDSs. An attempt in this regard, by developing the WU-MSRT model, was reported by [10]. A similar work, utilizing a Cellular Automata-based model (CA-MSRT model), was recently reported by [11]. Both the 1-D models (WU-MSRT and CA-MSRT) considered Trihalomethanes (THMs) as the surrogate for DBPs in WDSs and utilized the concepts of bacterial regrowth, biofilm formation, and the dynamics of chlorine decay and natural organic matter (NOM) degradation reported by earlier researchers [5,6,8]. Consequently, the multispecies interactions between chlorine, NOM, and microbial biomass were represented in both the bulk and wall phases of distribution pipes through complex equations constituting many interdependent parameters. The bulk phase represented the dynamic portion of the distribution pipe, while the wall phase represented the thin static biofilm layer [5].
It may be noted that the quality of any mechanistic model predictions depends on the certainty of understanding the processes [12]. Unfortunately, the state of knowledge about several multispecies interactions in WDSs, included in the models mentioned above, is inadequate for making deterministic water quality predictions. Additionally, technical infeasibilities plague the direct measurement of reactive species at the biofilm layers, specifically chlorine and NOM. Hence, the calibration and validation of the existing deterministic models using real-world data become challenging for practitioners.
Nevertheless, it has to be agreed that the conceptual base and the computational efficiency of MSRT modeling have evolved and improved, respectively, over time. However, after the development of the PICCOBIO model, the research remained more or less as an academic exercise. It failed to advance in terms of evolving practically applicable and easy-to-use simulation engines. This paper explicitly addresses this issue by developing a mechanistic model to aid the WDSs design and operation using EPANET-MSX [13]. EPANET-MSX is the multispecies extension of EPANET [14], the most widely used package for modeling WDSs. To date, a bacterial regrowth and THM formation model using EPANET-MSX has not been developed.
The proposed model considers the advective transport and physicochemical and biological reactions of chlorine, NOM, bacteria, and THMs in WDSs. However, unlike the earlier reported works, primary importance is given to the simplification of the representation of the multispecies reactions in WDSs and minimizing the number of interdependent parameters. Likewise, the physicochemical and biological interactions that cannot be experimentally investigated are omitted in the conceptual stage. A detailed sensitivity analysis of the proposed model is presented by applying the model to benchmark problems to benefit the practitioners in categorizing the model parameters for future applications. Given the recent drifts towards non-chlorinated operation [2], the prospect of the proposed model applicability on non-chlorinated WDSs is also ascertained.
The remainder of the paper is organized as follows: Section 2 explains the development of the MSRT model. The conceptual and numerical details of the model are elucidated in this section. Section 3 features the application of the developed model to demonstrate the effects of source water characteristics and water residence time in controlling bacterial regrowth and DBP formation in WDSs. Section 4 presents the deterministic sensitivity analysis of the proposed mechanistic model in detail. Limitations and conclusions of the present study are summarized in Section 5 and Section 6, respectively.
2. Model Development
2.1. Conceptual Model
The proposed mechanistic model combines the advective transport with the physicochemical and biological reactions of the following five species: chlorine, total organic carbon (TOC), biodegradable OC (BDOC), bacteria (both suspended and attached), and THMs. Due to the homogeneous configuration of the distribution pipes, a 1-D modeling approach was selected [15] to represent the spatiotemporal distributions of the aforementioned species in WDSs. Chlorine was the disinfectant chemical inhibiting bacterial activity, while BDOC was the organic fraction acting as the substrate for bacterial regrowth. TOC and BDOC were the surrogate parameters for NOM in water, and they represent the mass of the total and biodegradable organic matter present in the water, respectively. The BDOC is only a fraction of TOC that can be assimilated and/or mineralized by the heterotrophic flora residing in WDSs [16]. Its absence in the delivered water limits the bacterial activity in WDSs [17].
The Pseudomonas bacteria strains, with organic carbon contents in the cell varying between 1.04 × 10⁻⁸ and 1.40 × 10⁻⁹ mg-carbon(C)/CFU [18], were selected as surrogates for bacteria inside the bulk phase and biofilm layers. For simplification, the bacterial cells’ organic carbon contents were approximated as 1 × 10⁻⁹ mg-C/CFU [10,11]. The biofilm layers were represented as a uniform layer distributed evenly across the perimeter of distribution pipes [19]. The transformation between the bulk and biofilm layers was assumed to occur via attachment and detachment mechanisms. THMs account for more than fifty per cent of all the halogenated DBPs in WDSs, and they induce carcinogenic and reproductive risks [20,21]. Thus, in this study, THMs were selected as the surrogate for DBPs in distribution pipes, and it was presumed that they form in the bulk phase by the chlorination of both NOM and bacteria-derived DBP precursors [22]. The effects of pipe material and zero-valent iron in water in the formation of DBPs [23] were neglected to simplify the model formulation.
2.2. Multispecies Interactions
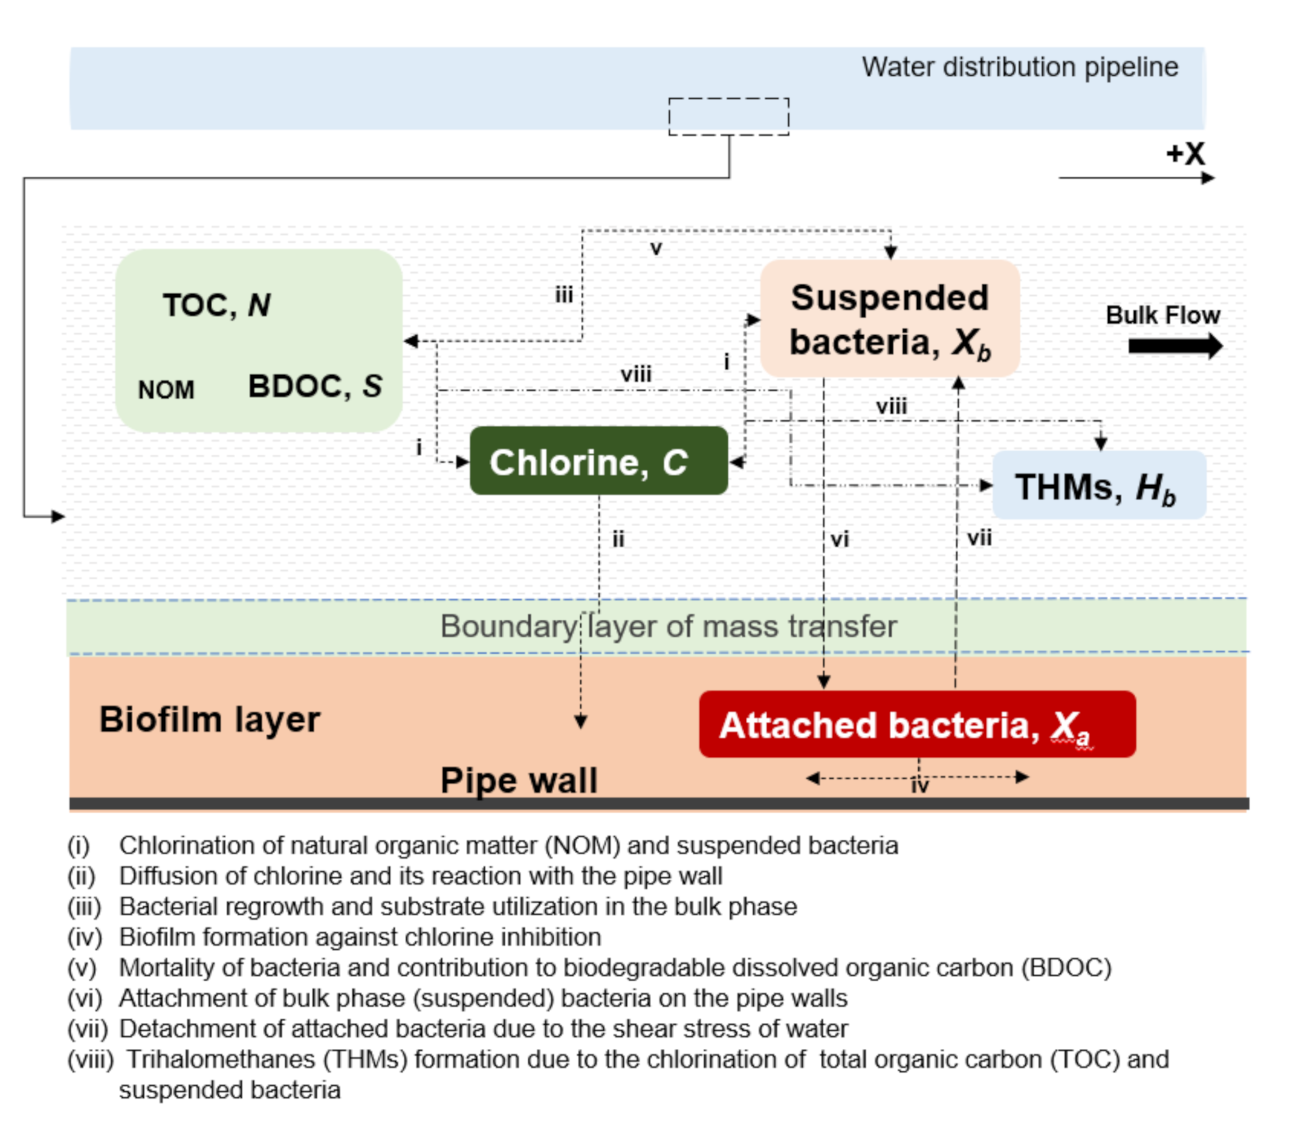
The physicochemical and biological interactions between the five species considered in the model formulation are schematically represented in Figure 1.
The multispecies reactions considered in the model are as follows:
(i) Chlorination of NOM and suspended bacteria.
The reactions of chlorine with the NOM and the bulk phase bacteria, causing its decay in the bulk phase, were represented using second-order kinetics based on the concept of competing reactions in water [24].
(ii) Diffusion of chlorine and its reaction with the pipe wall.
The diffusion of chlorine from the bulk to the wall phase was approximated to occur across an “unstirred” boundary layer [6]. For interpretation, the mass transfer and the subsequent chlorine reactions with the pipe material and the biofilm layers were described by first-order kinetics concerning bulk chlorine concentration [14].
(iii) Bacterial regrowth and substrate utilization in the bulk phase.
The Monod formulation was applied to model the regrowth and substrate utilization of the suspended bacteria. Empirical expressions were incorporated to describe the chlorine inhibition and temperature influence on the growth reactions [8].
(iv) Biofilm formation against chlorine inhibition.
A first-order approximation was selected to model the attached bacterial regrowth against chlorine inhibition to avoid representing the influence of the NOM in the biofilm layers on the biofilm dynamics. A resistance factor was incorporated into the empirical expression describing the chlorine inhibition to accommodate the greater resistance of the attached bacteria against the chlorine-induced inactivity [25].
(v) Mortality of bacteria and contribution to BDOC.
The natural mortality of bacteria was modeled with first-order kinetics with an aim to simplify the complex processes associated with bacterial mortality by senescence and the grazing of bacteria by protozoa [5]. The chlorine-induced mortality was modeled with second-order kinetics based on the concept of competing reactions in water [11]. It was considered that 30% of the dead bacteria enriches the BDOC by releasing intracellular matter during cell lysis [5].
(vi) Attachment of bulk phase (suspended) bacteria on the pipe walls.
A first-order dependence on the suspended bacteria [26] and a zero-order reliance on the biofilm density were assumed to represent the deposition of the bulk phase bacteria on the biofilm to generalize the mass transfer of bacterial cells across the thin “unstirred” layer separating the bulk phase from the wall phase.
(vii) Detachment of attached bacteria due to the shear stress of water.
The bacterial detachment from the biofilm layers was approximated to have first-order dependence on the shear stress induced by the flow velocity [7] and the attached bacterial density [27].
(viii) THM formation due to the chlorination of TOC and suspended bacteria.
The THM formation, caused by the chlorination of NOM, and bacteria-derived DBP precursors were modeled using the reaction yield coefficients [28].
2.3. Numerical Model
A set of advective-reactive (AR) equations (Equations (1)–(6)) were framed to describe the mass balance concerning the five species within the distribution pipes. The AR equation describes physical, chemical, and biological phenomena where concentrations of the five species under consideration were transformed inside water distribution pipes due to the combination of two processes: advection and reactions. Advective transport describes the movement of the five species in the fluid flow direction by virtue of the flow velocity inside the distribution pipes. The reactions include the equilibrium and kinetically controlled multispecies interactions explained before.
The notations C, N, S, X, and H denote the five variables (chlorine, TOC, BDOC, bacteria, and THMs, respectively). The notations b and a related to X indicate the suspended and attached bacteria, respectively. For the other notations: = time (s); = flow velocity (m/s); = distance along the axial direction (m); = second-order kinetic constant corresponding to reactions between chlorine and NOM (L/mg-C.s); = second-order kinetic constant corresponding to reactions between chlorine and bacteria (L/CFU.s); = wall decay coefficient (m/s); = mass-transfer coefficient of chlorine (m/s); = hydraulic mean radius (m); = growth yield of bacteria (CFU/mg-C); = maximum specific growth rate of bacteria (1/s); = half-saturation constant (mg-C/L); = bacterial growth inactivation constant (L/mg-chlorine (Cl)); = optimal temperature for bacterial activity (°C); = temperature-dependent shape parameter (°C); = reaction yield coefficient for bacteria (CFU/mg-Cl); = reaction yield coefficient for NOM (mg-C/mg-Cl); = fraction of dead bacteria contributing to BDOC; = bacterial mortality constant (1/s); = deposition/attachment constant (1/s); = bacterial detachment coefficient (m.s/g); = shear stress at pipe wall (g/m.s2); = resistance factor of attached bacteria to chlorine-induced mortality; = reaction yield coefficient corresponding to THM formation from chlorination of NOM (µg-THM/mg-Cl); = reaction yield coefficient corresponding to THM formation from chlorination of bacteria (µg-THM/mg-Cl). The base values of the parameters, selected based on a detailed review of the literature, are reported in Table 1.
Equations (1)–(4) and Equation (6), corresponding to the bulk phase species, are partial differential equations, including the advection term and the multispecies interactions. Simultaneously, Equation (5), corresponding to the attached bacteria, is an ordinary differential equation representing the regrowth of biofilm within a reactor of zero mass flux. The diffusion to the biofilm layers from the bulk phase is neglected for TOC (Equation (2)), BDOC (Equation (3)), and THMs (Equation (6)) considering the associated uncertainty of the process and the practical difficulty to experimentally measure the NOM content and THM concentration in the biofilm layers.
At the nodes/junctions where two or more pipes meet, the mixing of the water parcels was assumed to be instantaneous and complete. After mixing, the water parcels leave these nodes with the flow-weighted average of concentrations coming from the incoming pipes. Thus, the concentration of the bulk phase species leaving the node at any time is shown in Equation (7), given below.
The notations used are: = concentration of any bulk phase species at node (mg/L); = number of incoming pipes at node ; = flow rate in pipe (L/s); = concentration of any bulk phase species inside pipe (mg/L); = length of pipe (m); = external source flow rate into node (L/s); = external source concentration of any bulk phase species at node (mg/L); = total number of nodes in the network.
The complete mixing model [14] was selected at the storage tanks by assuming that all water parcels entering a tank are instantaneously and wholly mixed with the water parcels already present in the tank. This assumption makes modeling the temporal variations of the bulk phase species within the tanks quite simple as it requires no extra parameters to describe it. Additionally, it applies well to all the storage components that are operated in a fill-and-draw manner [35].
2.4. Model Implementation
Solving the set of mass-conservation equations (Equations (1)–(7)) will deliver the concentrations of the five model species at different values of and . In the present work, the EPANET-MATLAB toolkit [36], based on a MATLAB Class, “epanet”, was utilized in this regard. The toolkit enables the operation of EPANET 2.0 and EPANET-MSX as shared object libraries for hydraulic and water quality modeling, respectively. Their dynamic link library (DLL) for Windows was used through the programming interface of MATLAB. Before using EPANET-MSX for water quality analysis, the EPANET 2.0 network (as. inp file format) was applied to simulate the hydraulic dynamics using the EPANET DLL and derive the flow/pressure values. The multispecies interactions in the form of model governing equations are described as .msx file formats. These were generated and implemented using the MATLAB interface. The dynamic multispecies water quality was then simulated by applying the EPANET-MSX DLL to derive the concentrations of the model species at pipes, demand nodes, and storage tanks. The default Lagrangian transport algorithm of EPANET 2.0 and EPANET-MSX was applied to solve the advective transport part of the model equations, and the fifth-order Runge–Kutta integrator with automatic time step control was utilized to solve the reaction part.
3. Model Application
3.1. Test Problems
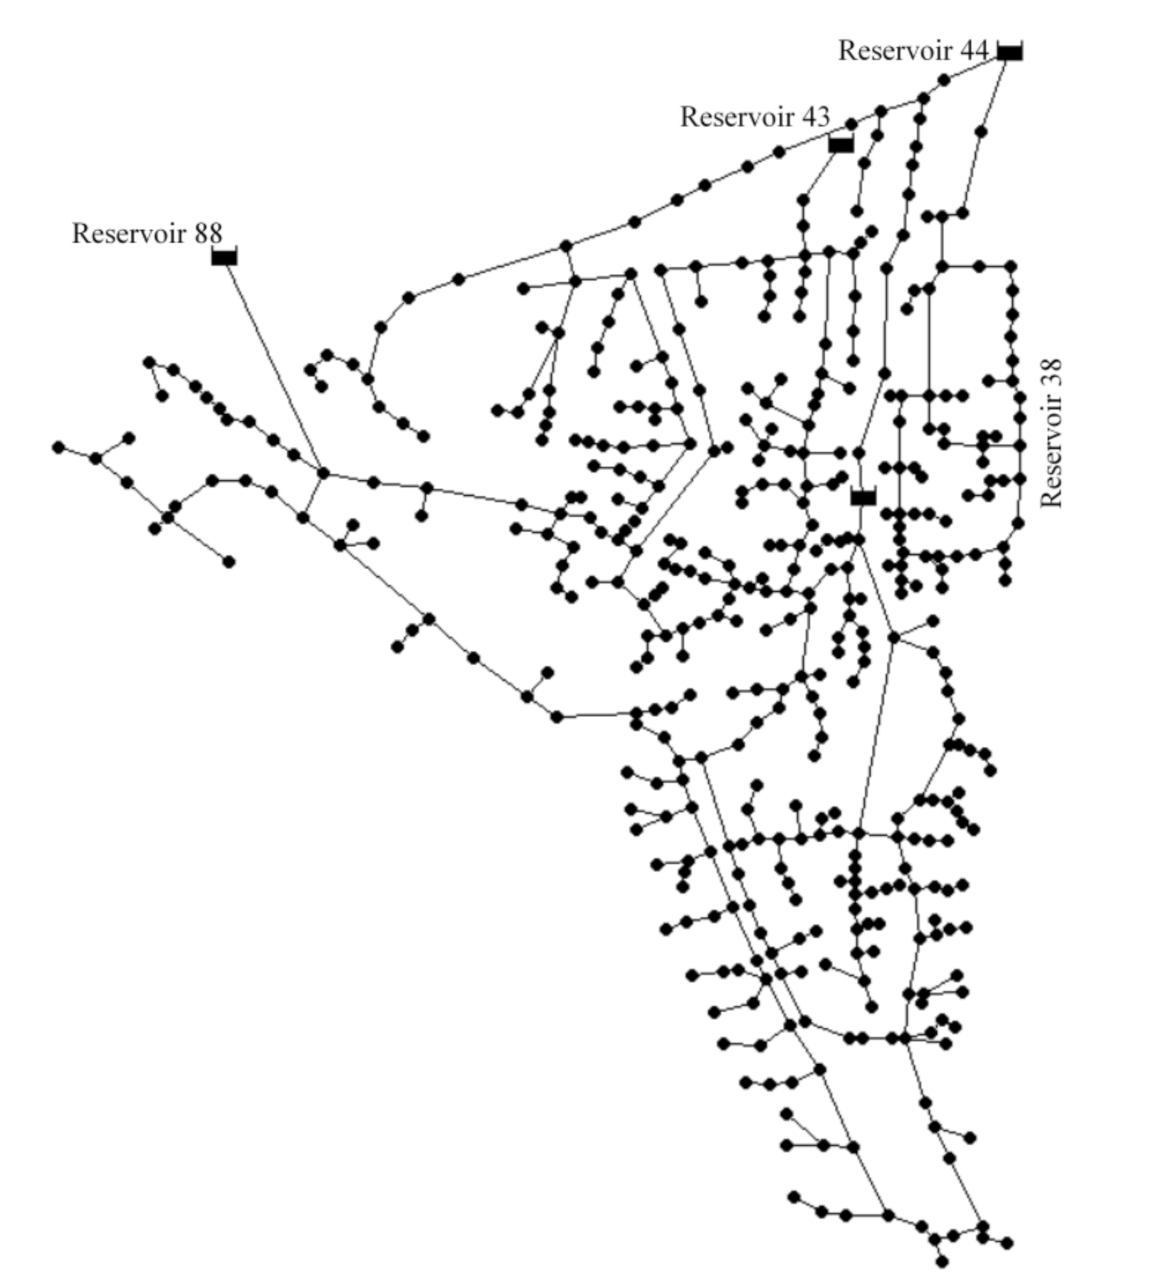
The applicability of the proposed MSRT model was demonstrated by applying it to two well-tested benchmark networks. The Balerma network [37] was selected as Test Problem 1. It is an adaptation of the irrigation network in the province of Almeria (Spain). The network has four reservoirs, 443 demand nodes, and 454 pipes. The Balerma network layout is given in Figure 2.
The second network (Test Problem 2) selected is the KLmod network [38], which is the modified version of the network proposed initially by [39]. KLmod is a single-sourced network consisting of 935 demand nodes and 1274 pipes, meeting the average demand of 29.1 million L/day. The schematic of the KLmod network is shown in Figure 3.
3.2. Test Conditions
The water quality analysis was performed at different operating conditions to elucidate the significance of the boundary conditions (source water characteristics) in determining the microbiological and chemical qualities of the delivered water at the demand nodes. Three scenarios (Scenarios 1a, 1b, and 1c) were selected for Test Problem 1 (Table 2) by varying the chlorine concentration, NOM content, and the bacterial cell count of the treated water supplied from the four source nodes (Reservoir IDs 38, 43, 44, and 88). The free chlorine concentration was varied as 0.5, 1.0, and 2.0 mg-Cl/L and the TOC content was varied as 1.0, 2.0, and 3.0 mg-C/L. The source water with a TOC value of 1.0 mg-C/L corresponds to biologically treated water with minimum NOM content [40]. A TOC value of 3.0 mg-C/L represents water with possible organic pollution [11]. The bacterial cell count values in the source water are changed to 0.01, 0.1, 1.0, 10, and 100 CFU/mL to indicate different degrees of microbiological quality of the source water.
For Test Problem 2, four scenarios (Scenarios 2a, 2b, 2c, and 2d) were considered by varying the supplied water characteristics in the reservoir (Reservoir ID 1) (Table 3). The free chlorine content was varied as 0.5 and 1.0 mg-Cl/L, and the TOC values were changed to 1.0 and 2.0 mg-C/L. The bacterial cell count was kept at 0.001 CFU/mL for all the scenarios. Such a very low value of bacterial cell count indicates the source water meeting the bacteriological quality requirements for direct human consumption.
Water quality analysis was performed on Test Problems 1 and 2 under three and two scenarios, respectively, to test the proposed model’s performance under non-chlorinated conditions. Scenarios 1d, 1e, and 1f (Table 2) are comparable to Scenarios 1a, 1b, and 1c, except that the chlorine concentration is zero at the four nodes. Similarly, Scenarios 2e and 2f (Table 3) for Test Problem 2 correspond to Scenarios 2a and 2b with chlorine concentration in Reservoir ID 1 as zero.
At zero chlorine concentration, the chlorine decay (Equation (1)) and THM formation (Equation (6)) modules of the MSRT model become inactive, and all the reaction terms in Equations (2)–(5) constituting chlorine except the term corresponding to bacterial regrowth and substrate utilization are converted to zero. Additionally, under non-chlorinated conditions, the term becomes 1, and the chlorine inhibition to the bacterial regrowth in the Monod formulation becomes nonexistent.
For the water quality analysis of both the problems, the BDOC content was assumed to be 30% of the TOC, and the THM concentration at the source nodes is deemed absent. The water temperature is considered as 25 °C. The analysis corresponding to all the scenarios mentioned above for Test Problems 1 and 2, using the proposed MSRT model, is performed with a time step of 300 s until 0.1% convergence in the values of all the reactive species (steady-state condition) is achieved in the nodes.
3.3. Results and Discussion
For Test Problem 1, with four source nodes, the average flow velocity inside the pipes and average water age at the demand nodes were 0.89 m/s and 1.02 h, respectively. For Test Problem 2, with a single source node, the average flow velocity inside the pipes was 0.19 m/s, and the average water age at the demand nodes was 7.2 h. Only <6% of the nodes of Test Problem 2 had water age value of less than 1 h, while at the same point in Test Problem 1 this was >47%. Four demand nodes of Test Problem 1 with Node IDs 1, 72, 265, and 403 with contributions from only one source node, i.e., Reservoir IDs 88, 38, 44, and 43, respectively, were selected to demonstrate the effects of the source water characteristics in determining the water quality. The water age in these four nodes was obtained as 1.33, 1.51, 1.13, and 1.67 h, respectively. To establish the impacts of water residence time in the water quality, five demand nodes (Node IDs 608, 387, 770, 1185, and 1319) of Test Problem 2 with water ages of 0.10, 2.76, 6.53, 14.60, and 25.71 h, respectively, were selected.
3.3.1. Effects of Source Water Characteristics
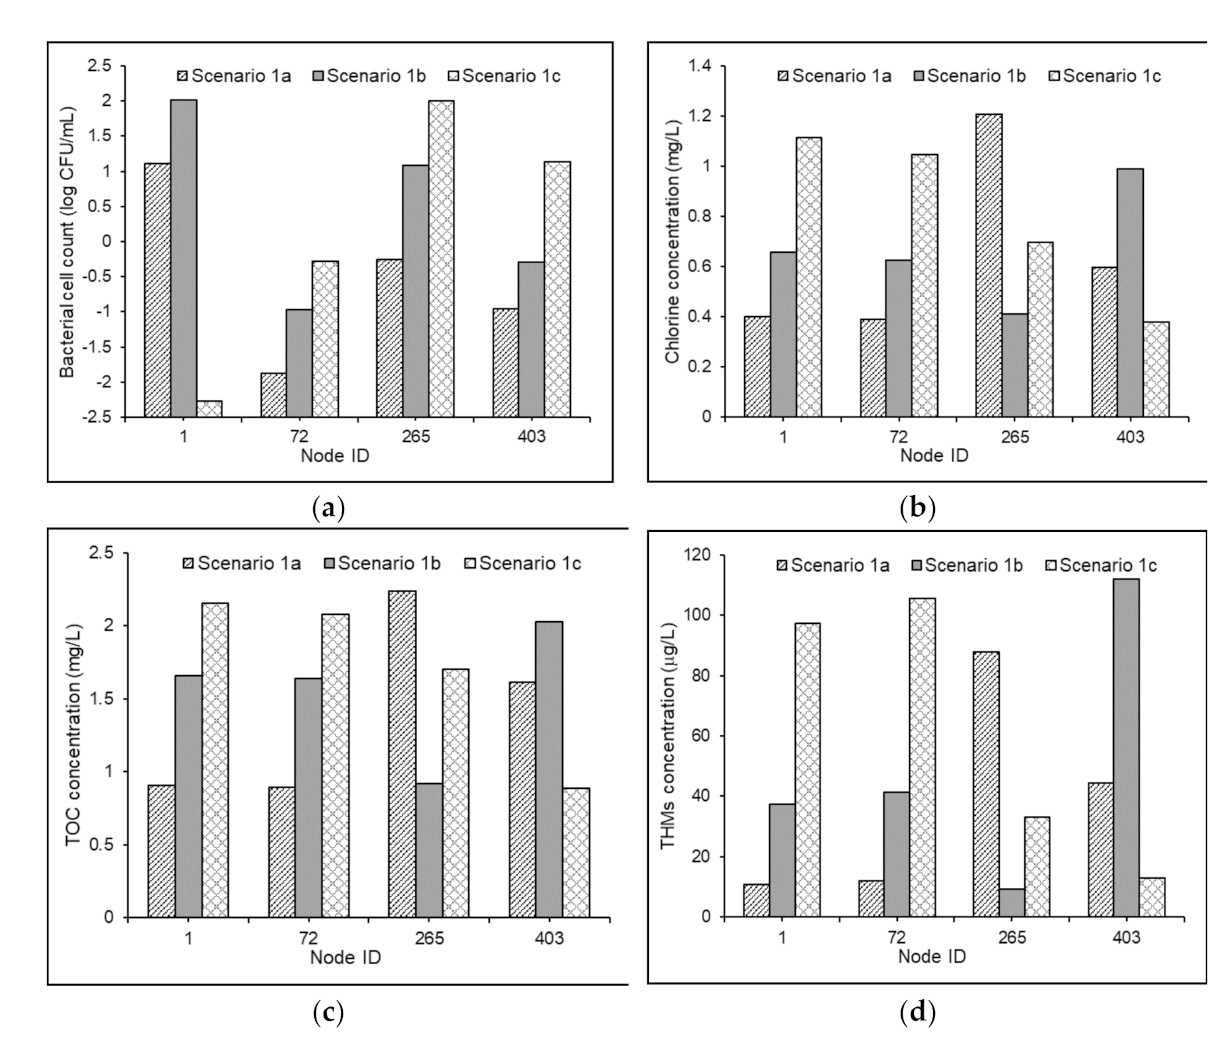
The steady-state values of bacterial cell count, chlorine concentrations, TOC concentrations, and THM concentrations in the four nodes of Test Problem 1 under Scenarios 1a, 1b, and 1c are shown in Figure 4.
The bacterial cell counts in the four nodes under the three scenarios varied between 5.3 and 1.4 × 10⁴ CFU/mL. The results established the direct effects of free chlorine and organic substrate (BDOC) on the bacterial regrowth inside distribution pipes. Under Scenarios 1a and 1c, the increases in the bacterial counts in the delivered water at nodes 265 and 1 were found to be 2.75 log scale and 0.72 log scale, respectively (Figure 4a). This indicated the significance of the bacteriological quality of the source water in influencing the degree of bacterial regrowth under similar growth environments, which could be attributed to the first-order dependence of the bacterial concentration in the growth reaction term represented by Monod formulation in Equation (4). It was observed that the NOM degradation induced by bacteria (substrate utilization) was subservient when compared with its degradation caused by the reactions with available chlorine (Figure 4b,c). This could be related to the scales of the selected values of the parameters , , and . The observed results of THM concentrations in the four nodes (Figure 4d) indicated that the reactions between chlorine and NOM entirely influence the model predictions, and the role of bacterial-derived precursors in the dynamics of DBP formation is insignificant.
3.3.2. Effects of Water Residence Times
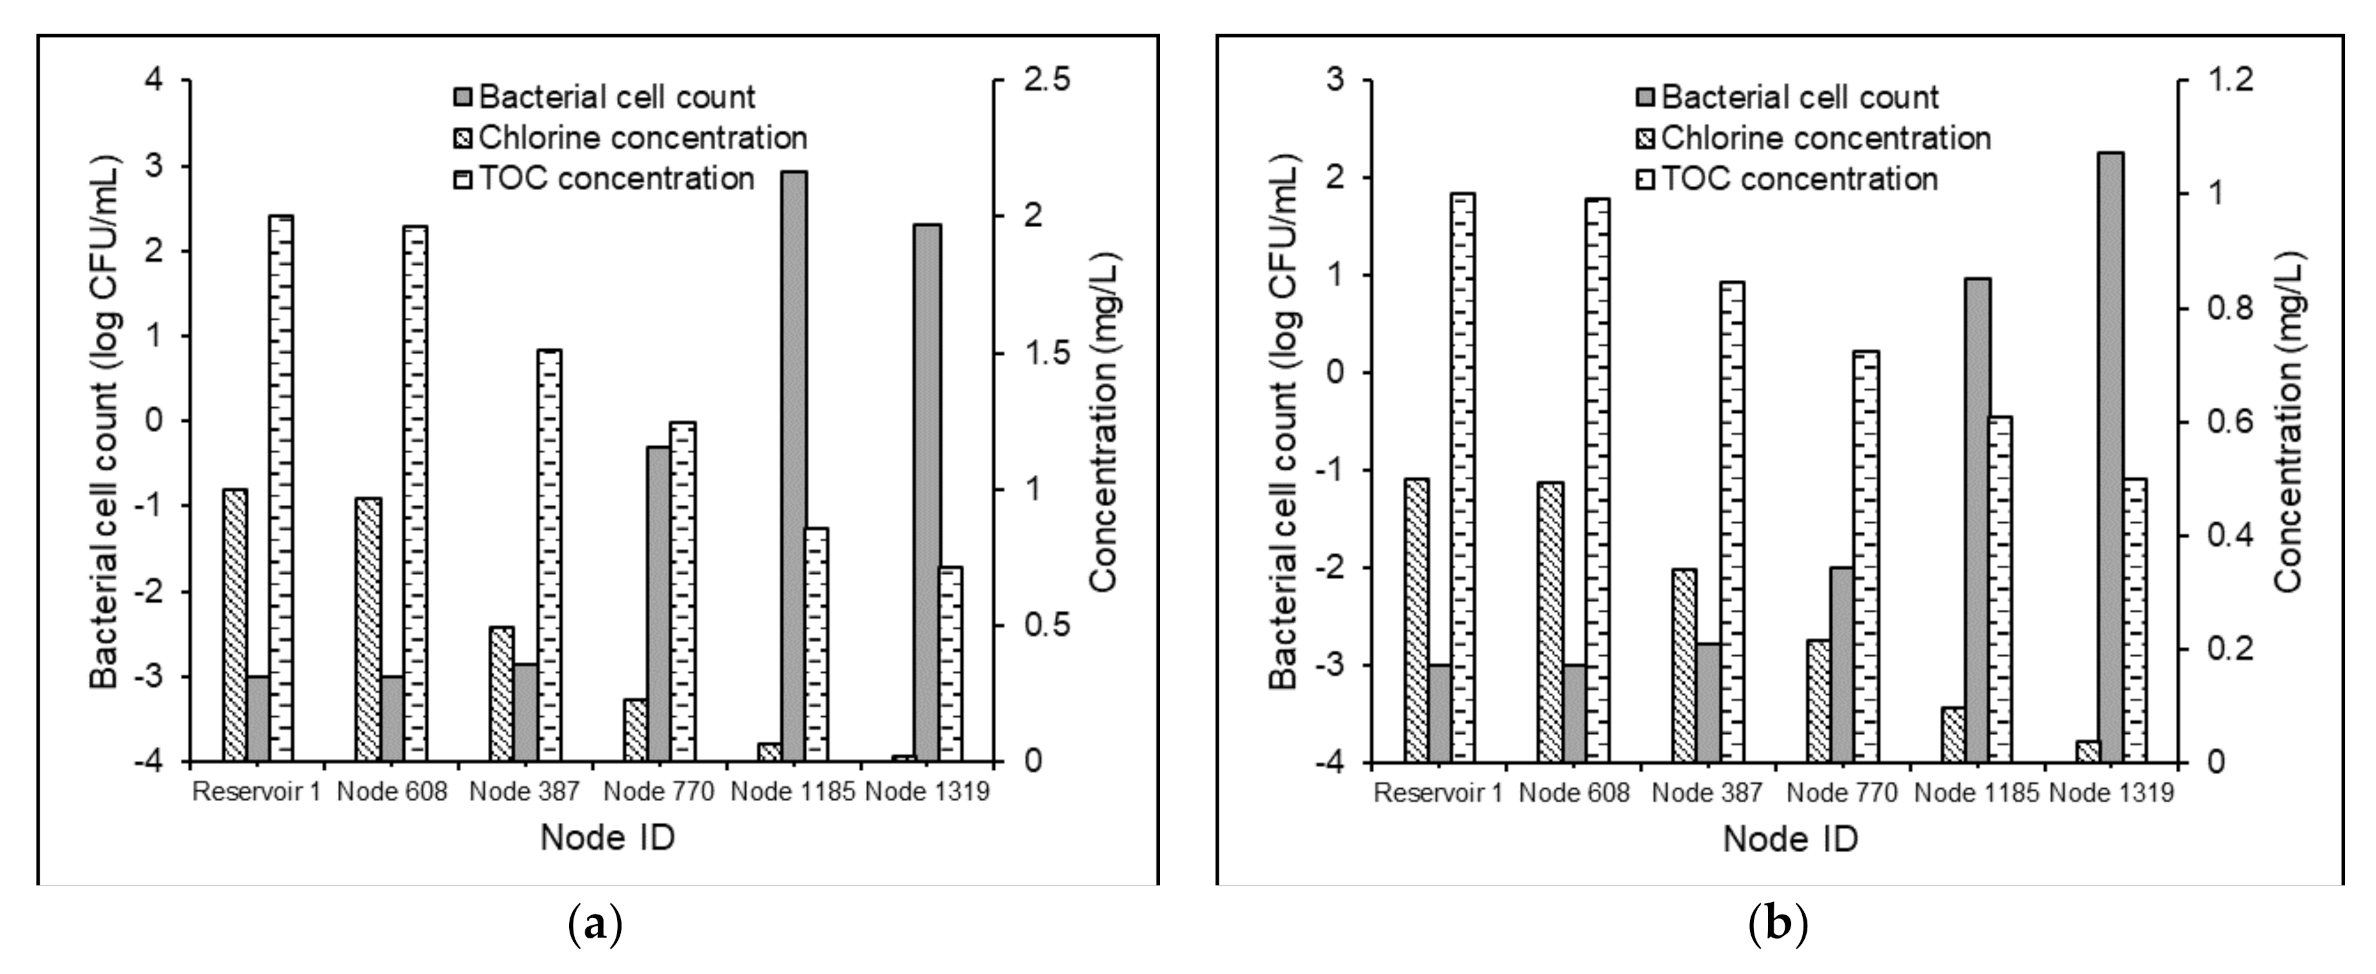
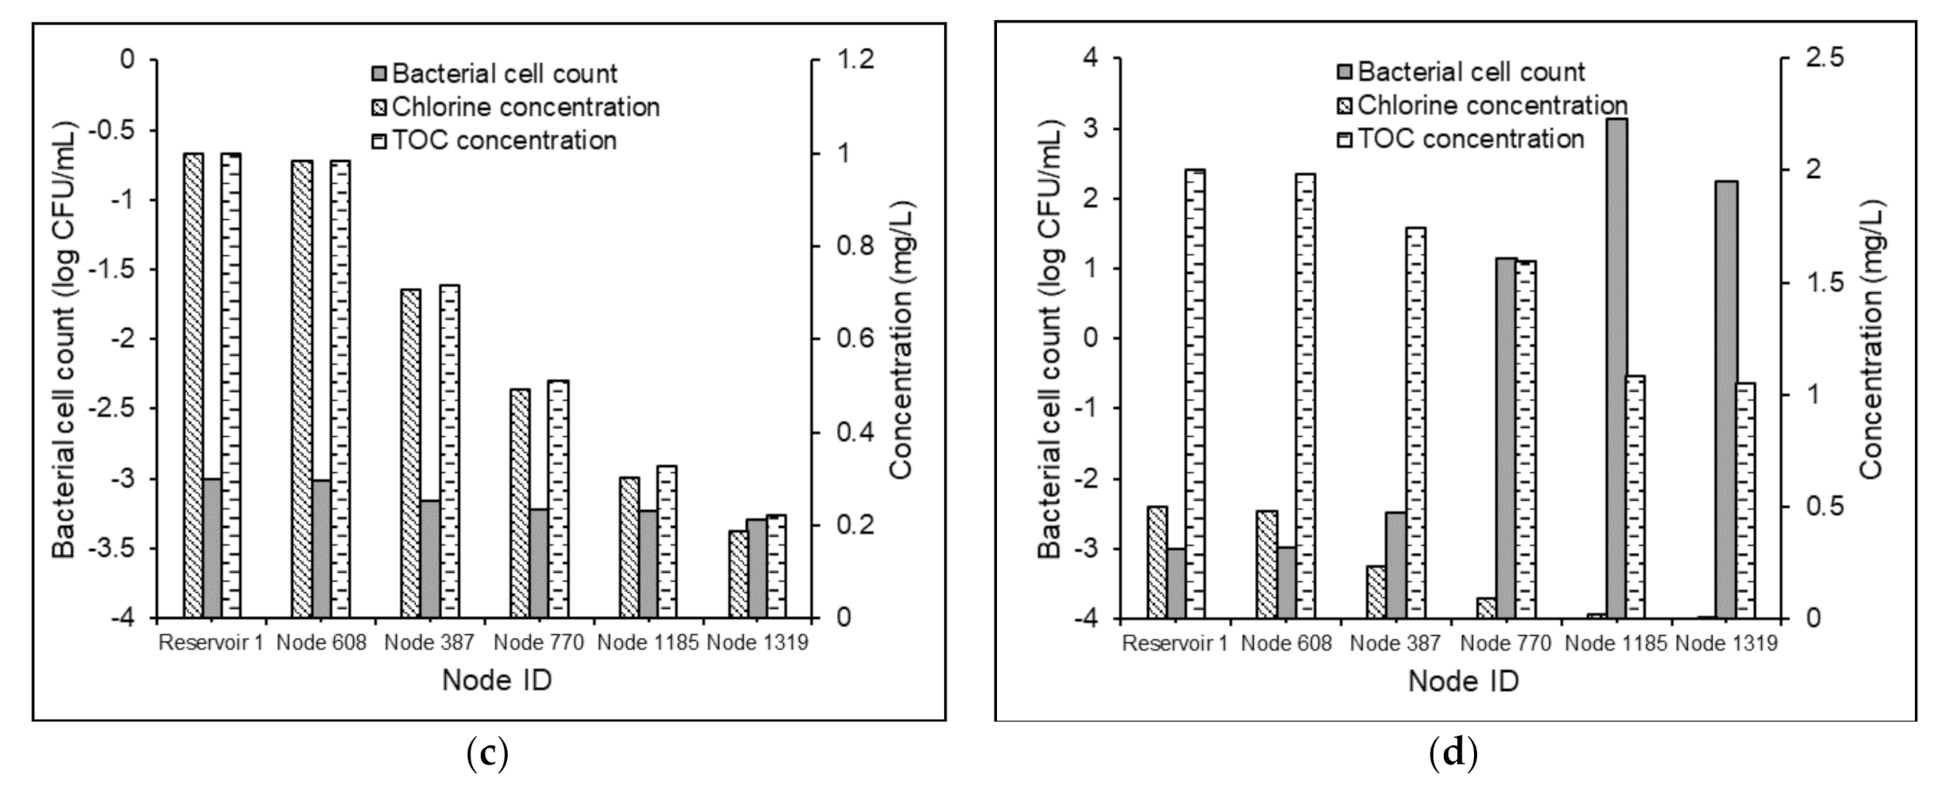
The bacterial cell counts, chlorine concentrations, and TOC concentrations in the five demand nodes of Test Problem 2 under the Scenarios 2a, 2b, 2c, and 2d are shown in Figure 5.
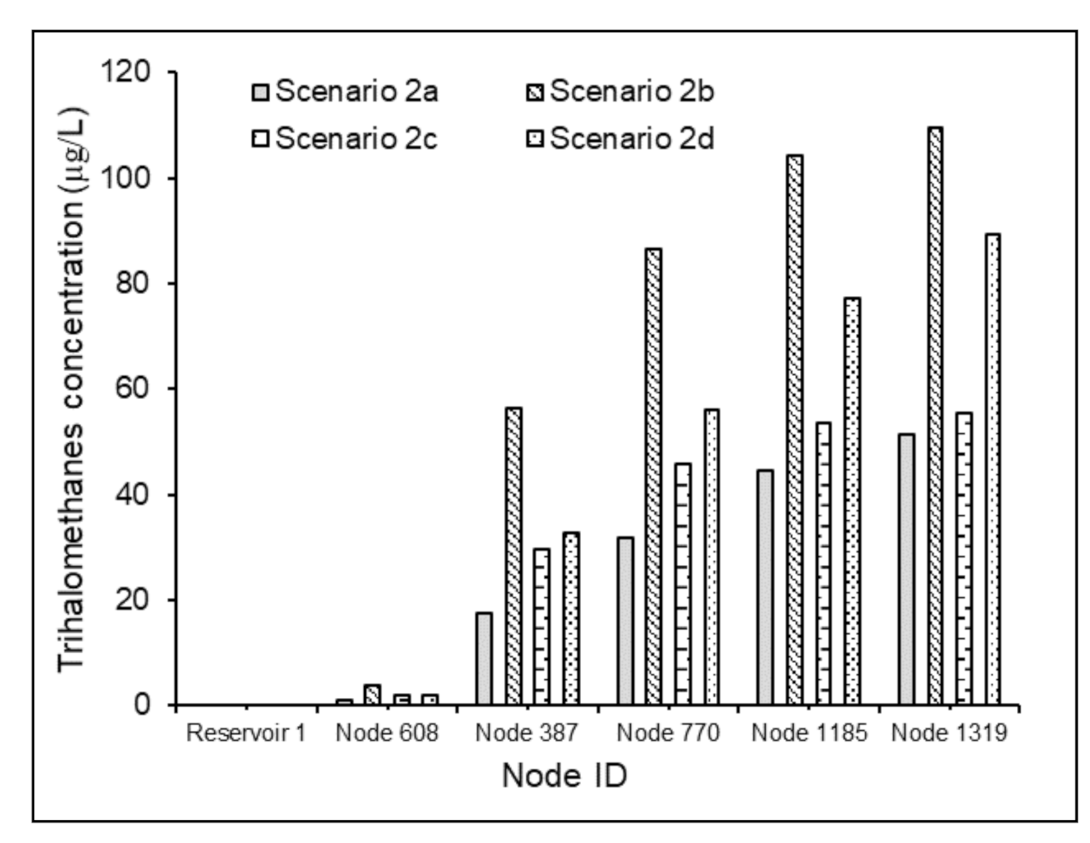
The results specified the direct correlation between water age and bacterial regrowth inside distribution pipes. Under Scenario 2a, a continuous increase in the bacterial cell count from 0.001 to 183 CFU/mL was observed (Figure 5a). However, under Scenario 2b, the bacterial regrowth followed a downward trend after the water age value 14.60 h (Figure 5b). This could be attributed to the relative values of the reaction terms corresponding to regrowth and mortality in Equation (4). A 100% increase in the free chlorine concentration and 50% reduction in the TOC content under Scenario 2d, compared to Scenario 2c, effectuated a reversal of a 6.1 log scale increment in the bacterial activity to a 0.23 log scale decrement (Figure 5c,d). These results established the advantages of the effective regulation of the relative concentrations of chlorine and NOM in the supplied water to control the bacteriological quality in WDSs with relatively greater water age values. Nevertheless, a 60% increase in the THM concentration (Figure 6) was observed between Scenarios 2c and 2d.
This showed that the benefits of inhibiting the bacterial regrowth accomplished by increasing the chlorine concentration of source water are attained only at the expense of increased THM formation in the delivered water. Hence, it may be inferred that even under very low organic loading (TOC = 1 mg/L), an optimal selection of the chlorine dose may be essential to minimize the microbiological and chemical risks in the delivered water.
3.3.3. Water Quality Modeling in Non-chlorinated Systems
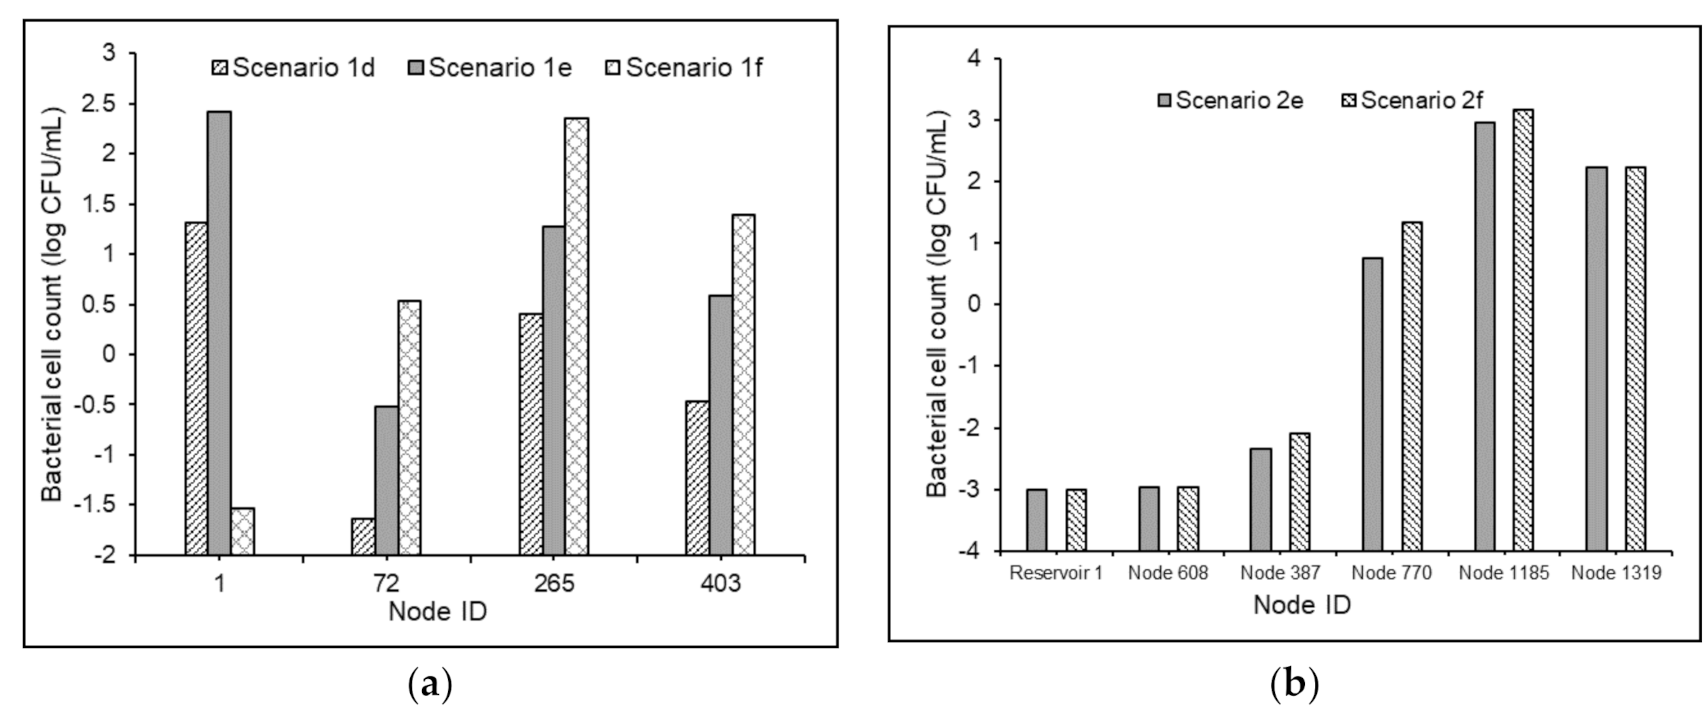
The proposed MSRT functioned well under non-chlorinated conditions for both Test Problems 1 and 2. As expected, the absence of free chlorine in water favored the bacterial regrowth in the delivered water (Figure 7).
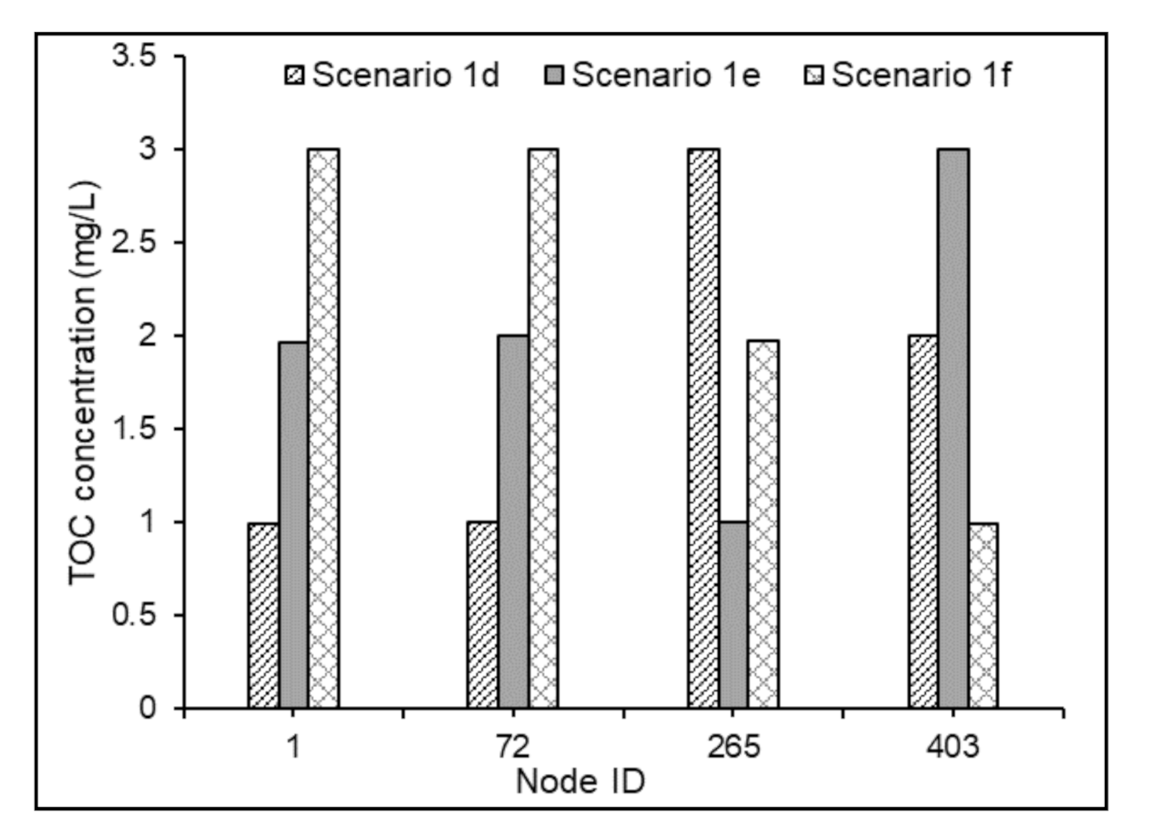
The maximum increment in the bacterial cell counts at the demand nodes of the Test Problem 1, under non-chlorinated conditions, was observed to be 0.73 log scale, 1.23 log scale, and 1.19 log scale, respectively, for Scenarios 1d, 1e, and 1f when compared with Scenarios 1a, 1b, and 1c (Figure 7a). Similarly, when compared with Scenarios 2a and 2b, the maximum increment in the bacterial cell counts in the demand nodes of test problems under Scenarios 2e and 2f was found to be 3 log scale and 3.47 log scale, respectively (Figure 7b). Nevertheless, the average comparative increments under the scenarios mentioned above for Test Problem 2 were obtained as 1.33 log scale and 1.20 log scale, respectively. This showed that in the absence of chlorine’s inhibitory effects in water, the model predictions of bacterial regrowth under substrate loadings of 0.3 and 0.6 mg-C/L are comparable. This might be attributed to the magnitude of the value selected in the bacterial regrowth module. However, the NOM degradation in the water in the absence of free chlorine was subservient (Figure 8) compared to that in chlorinated water. This is partly attributed to the magnitude of the selected value of , and partly to the higher rates of the reactions between chlorine and organic matter in WDSs.
4. Parameter Sensitivity Analysis
4.1. Deterministic Sensitivity Analysis Procedure
The proposed mechanistic MSRT model provides a framework to understand the interactions among chlorine, NOM, and bacteria in WDSs and predict the outcome of these interactions on the microbiological and chemical qualities of the delivered water. Even though all the model parameters can be derived through deterministic experimental investigations, the uncertainties in the state of knowledge about some of the mechanisms considered during the model formulation impede us from warranting deterministic predictions. Parameter sensitivity analysis becomes accordingly significant in this regard. This helps us to calculate the deviations in the model outputs in a localized region of the space of parameter inputs.
The simple deterministic sensitivity analysis procedure [41] was selected in this study for performing parameter analysis. The procedure is based on the idea of varying one uncertain model parameter at a time. The sensitivity is defined [12] as follows:
where is the normalized relative sensitivity coefficient or elasticity, is the state variable, is the model parameter of interest, and is the perturbation step. In the present work, value in Equation (8) was selected as 0.01, as suggested by [12]. The concentrations of suspended bacteria, chlorine, and THMs, which are the outputs of the bacterial regrowth module, chlorine decay module, and THM formation module, were selected as the state variables for conducting the parameter sensitivity analysis. In total, 17 parameters were selected, and the analysis was performed under all the scenarios mentioned in Table 2 and Table 3 by increasing one parameter (out of 17 parameters) by 1% and keeping all other parameters at their base values. Using Equation (8), the normalized relative sensitivity coefficient values corresponding to the three state variables (, , and ) mentioned above were determined at every demand node (and storage tanks, if any) for each time step under all the test conditions. The
values obtained at all the nodes for the entire simulation period were compared to select the maximum value of the sensitivity coefficient. The maximum values of corresponding to the three modules, thus obtained, are reported as the sensitivity of a model parameter to the model outputs.
4.2. Sensitivity of Model Parameters
The parameter sensitivity analysis results for all the loading conditions (Table 2 and Table 3) on Test Problems 1 and 2 are presented in Table 4 and Table 5, respectively. The “+” and “−” signs associated with the values indicate the increment and decrement, respectively. Interestingly, the values were found to be highly dependent on the operating conditions. This shows the impact of the source water characteristics in determining the various multispecies reactions in WDSs and directing the sensitivity of the model outputs to the assumed parameter values. The reported results indicate that the network characteristics play a crucial part in controlling the scale of the values. Out of the two problems considered, the values were comparatively higher for Test Problem 2 than that for Test Problem 1. This could be attributed to the water residence time inside pipes in both the WDSs. The greater water residence times, caused by the low flow velocities, might have enhanced the interactions between the six reactive species within the system domain and influenced the bacterial regrowth in Test Problem 2 significantly more compared to that in Test Problem 1.
4.2.1. Parameter Sensitivity on Bacterial Regrowth Module Outputs
The values corresponding to the bacterial regrowth module were relatively higher than the chlorine decay and the THM formation modules of the MSRT model. The average values for were obtained as 2.422 and 28.437 from the analyses conducted on Test Problems 1 and 2. The results confirm that the growth parameter has the maximum value out of the 17 parameters, hence it is most significant in determining the model predictions on microbiological quality. The value +2.433 of the parameter corresponding to Scenario 1a specified that the bacterial regrowth module output of the MSRT model would increase by 2.433% when the parameter was increased by 1% from its base value while keeping all other parameters at their base values.
The analysis results revealed that the network characteristics significantly influence the order of sensitivity of model parameters on the bacterial regrowth module outputs. For Test Problem 1, and were the second most sensitive parameters, while for Test Problem 2, was the parameter most influencing the bacteriological activity after . The parameters and defining the reactions between chlorine and bacteria were observed to have the same values (Table 4 and Table 5). Nevertheless, these two parameters were found to be insensitive ( < 1) to the outputs of the chlorine decay module. This showed that the significance of these two parameters and their influence on the model outputs is governed by the second reaction term on the right-hand side (RHS) of Equation (4), describing the chlorine-induced mortality of the bulk phase bacteria. The growth parameter was observed to have a noticeable decrementing effect on the bacterial regrowth module predictions. This parameter controls the growth dynamics in the Monod kinetic formula.
The comparison of the values corresponding to the reaction yield coefficients ( and ) and the reaction rate constants ( and ) concerning the outputs of the chlorine decay and bacterial regrowth modules helps present a clear image of the comparative importance of the chlorine reactions with NOM and bacteria in influencing the model predictions. The bacterial regrowth module outputs are more sensitive to and compared to the outputs of the chlorine decay module. This infers the significance of the second reaction term on the RHS of Equation (3) in governing the substrate utilization and bacterial activity, defined by the first reaction term in the RHS of Equation (4). The parameter , defining the effect of chlorine in inhibiting bacterial regrowth, was also found to have a prominent control over the bacterial regrowth module outputs and a decremental effect on the growth dynamics.
Interestingly, the parameter , describing the cell mass generation from unit substrate consumption, was insensitive ( < 1) to the bacterial regrowth module outputs corresponding to Test Problem 1. However, it was found to have a noticeable influence (average = 1.956) on the outputs from the analysis on Test problem 2. This could be attributed to the operating conditions and, more particularly, the substrate concentration and bacterial cell counts in the source water. The analysis of Test Problem 2 was carried out with comparatively lower bacterial cell counts ( = 1 CFU/mL) in the source water. Consequently, the 1% increment in the value induced a more significant influence on the bacterial activity [42] in Test Problem 2 compared to that in Test Problem 1.
Another parameter that has shown marked influence on the bacterial regrowth module outputs is the parameter , defining the attachment (first-order kinetics) of the bulk phase bacteria on the biofilm layers. However, the detachment coefficient was found to be insignificant in influencing the bulk phase bacteriological activity predictions. Similarly, another parameter , defining the biofilm growth dynamics, was also observed to be unimportant in regulating the model predictions on bulk phase bacterial concentrations. Altogether, the sensitivity analysis results give the impression that the model predictions of bacterial dynamics are most sensitive to the bulk phase growth reaction. The results also established that the biofilm parameters defining the bacterial interactions do not significantly control bulk phase microbiological quality predictions.
4.2.2. Parameter Sensitivity on Chlorine Decay Module Outputs
Overall, the values corresponding to the chlorine decay module of the MSRT model were not significantly high. This indicated that the model predicted chlorine concentrations are not sensitive to most of the 17 parameters considered. was the parameter most influencing the dynamics of chlorine decay. The parameter was observed to be the second most significant in determining the model predictions. It is interesting to note the slightly higher values of the growth parameters (, , and ), particularly for Test Problem 2 (Table 5). This proves the importance of the first reaction term on the RHS of Equation (2) in controlling the dynamics of chlorine reactions defined by Equation (1).
4.2.3. Parameter Sensitivity on THM Formation Module Outputs
The value corresponding to the parameter was found to be 1, and for the parameter , the same was obtained to be less than 0.001. It may be noted these two parameters only appear in the THM formation module (Equation (6)), and they have no impact on the outputs of the other five modules of the MSRT model (Equations (1)–(5)). Hence, it could be inferred that the share of the model predicted THM formation by the reactions between chlorine and bacteria-derived DBP precursors (second reaction term on the RHS of Equation (6)), in the total THM formation was less than 0.1% for all the scenarios tested. In other words, more than 99.9% of the model predicted THM formation corresponds to the reactions between chlorine and NOM. This explains the relatively trivial but obvious impact of the parameters linked with the NOM degradation on the outputs of the THM formation module. Nevertheless, other than for the parameters , and , the values of all other parameters were relatively small (Table 4 and Table 5), and hence, their sensitivity on model predictions may be ignored.
4.3. Parameter Sensitivity under Non-chlorinated Conditions
The parameter sensitivity analysis revealed that the values corresponding to the bacterial regrowth module for both Test Problems 1 and 2 under non-chlorinated conditions are comparable to those obtained under chlorinated conditions. Nonetheless, a noticeable increment in the values corresponding to the parameter was observed, specifically for Test Problem 1 (Table 6). This indicated that the sensitivity of the model predicted bacteriological quality on increases in the absence of inhibitory effects of chlorine in the water. The parameters and were observed to be the second and third most significant parameters in influencing the outputs of the bacterial regrowth module. Interestingly, the variations in the values of the model parameters under different operating conditions were relatively lower in the absence of free chlorine in water (Table 4, Table 5 and Table 6).
This could be attributed to the reduced influence caused by the lesser number of reaction terms in the model governing equations due to no chlorine being in the system domain. The higher BDOC concentrations observed under non-chlorinated conditions showed that the reactions of NOM with chlorine are more substantial in determining its degradation in water than its utilization as a substrate in the growth reactions of the bulk phase bacteria. The analysis results also established the insensitivity of the bacterial regrowth module outputs to the parameters defining the biofilm dynamics.
5. Limitations of the Study and Future Scope
The paper attempted to develop a generic, easy-to-use simulation engine to aid the WDSs design and operation. However, the proposed MSRT model utilizes the computing environment of EPANET-MSX, and hence, it is plagued with the numerical limitations of the Lagrangian transport algorithm. Further, the model is purely advective, and due to this reason, its pertinency in systems operated with low flow velocities may be re-examined. The model selects only one bacteria strain (Pseudomonas) to simplify the interpretations of microbiological interactions in the bulk and wall phases of the WDS. However, Pseudomonas cannot be recommended as the prototypical organism, representing the heterogeneous bacterial community in WDSs. Thus, incorporating more bacterial strains might be considered in the future to improve the applicability of the proposed model. The formation and transport of THMs are only considered in the present study. There may be other DBPs, inducing more severe carcinogenic and reproductive risks, which need to be included in the model formulation. A detailed experimental/field investigation may be required to understand and adjust the various model parameters. Future work aims to calibrate and validate the MSRT model for predicting the microbiological and chemical quality variations in real-world WDSs.
6. Conclusions
An EPANET-MSX based mechanistic MSRT model to predict the temporospatial variations of bacteriological and chemical qualities in WDSs was presented. The model applicability was demonstrated by applying it to two well-tested benchmark networks under both chlorinated and non-chlorinated conditions. The results established the model’s suitability to be applied in WDSs operated with or without disinfectant chemical residuals. The direct effects of the effective regulation of chlorine and organic loading concentrations in the supplied water to control the bacterial regrowth and THM formation in WDSs were analyzed. In chlorinated WDSs, when operated with very low organic loading, the chlorine dose played an essential part in minimizing the chemical risks of the delivered water. The deterministic parameter sensitivity analysis revealed the impact of the operating conditions and the network characteristics in determining the extent of various multispecies reactions in WDSs and directing the sensitivity of the model outputs to the kinetic parameters. The analysis results established that the maximum specific growth rate constant for bulk phase bacteria () is most significant when defining the model predictions on bacterial dynamics in WDSs.
Author Contributions
Conceptualization, G.R.A. and A.O.; Methodology, G.R.A., L.K., and A.O.; Writing—Original Draft Preparation, G.R.A.; Writing—Review and Editing, L.K. and A.O.; Supervision, A.O.; Project Administration, A.O.; Funding Acquisition, A.O. All authors have read and agreed to the published version of the manuscript.
Funding
This research was supported by a grant from the Ministry of Science & Technology of the State of Israel and Federal Ministry of Education and Research (BMBF), Germany.
Institutional Review Board Statement
Not applicable.
Informed Consent Statement
Not applicable.
Data Availability Statement
The data presented in this study are available on request from the corresponding author.
Conflicts of Interest
The authors declare no conflict of interest.
References
- Liu, L.; Xing, X.; Hu, C.; Wang, H. One-year survey of opportunistic premise plumbing pathogens and free-living amoebae in the tap-water of one northern city of China. J. Environ. Sci. 2019, 77, 20–31. [Google Scholar] [CrossRef] [PubMed]
- Albert, M.; Hijnen, W.; Van Vossen, J.; Blokker, M. Modelling Bacterial Biomass in a Non-chlorinated Drinking Water Distribution System. Procedia Eng. 2017, 186, 127–134. [Google Scholar] [CrossRef]
- Lu, C.; Biswas, P.; Clark, R.M. Simultaneous transport of substrates, disinfectants and microorganisms in water pipes. Water Res. 1995, 29, 881–884. [Google Scholar] [CrossRef]
- Servais, P.; Laurent, P.; Billen, G.; Gatel, D. Development of a Model of BDOC and Bacterial Biomass Fluctuations in Distribution Systems. Rev. Sci. Eau 1995, 8, 427–462. [Google Scholar]
- Dukan, S.; Levi, Y.; Piriou, P.; Guyon, F.; Villon, P. Dynamic modelling of bacterial growth in drinking water networks. Water Res. 1996, 30, 1991–2002. [Google Scholar]
- Munavalli, G.R.; MohanKumar, M.S. Dynamic simulation of multicomponent reaction transport in water distribution systems. Water Res. 2004, 38, 1971–1988. [Google Scholar] [CrossRef] [PubMed]
- Horn, H.; Reiff, H.; Morgenroth, E. Simulation of growth and detachment in biofilm systems under defined hydrodynamic conditions. Biotechnol. Bioeng. 2003, 81, 607–617. [Google Scholar] [CrossRef]
- Zhang, W.; Miller, C.T.; DiGiano, F.A. Bacterial Regrowth Model for Water Distribution Systems Incorporating Alternating Split-Operator Solution Technique. J. Environ. Eng. 2004, 130, 932–941. [Google Scholar] [CrossRef]
- Monteiro, L.; Carneiro, J.; Covas, D.I.C. Modelling chlorine wall decay in a full-scale water supply system. Urban Water J. 2020, 17, 754–762. [Google Scholar] [CrossRef]
- Abokifa, A.A.; Yang, Y.J.; Lo, C.S.; Biswas, P. Investigating the role of biofilms in trihalomethane formation in water distribution systems with a multicomponent model. Water Res. 2016, 104, 208–219. [Google Scholar] [CrossRef]
- Abhijith, G.R.; Mohan, S. Cellular Automata-based Mechanistic Model for Analyzing Microbial Regrowth and Trihalomethanes Formation in Water Distribution Systems. J. Environ. Eng. 2021, 147, 04020145. [Google Scholar] [CrossRef]
- Digiano, F.A.; Zhang, W. Uncertainty analysis in a mechanistic model of bacterial regrowth in distribution systems. Environ. Sci. Technol. 2004, 38, 5925–5931. [Google Scholar] [CrossRef] [PubMed]
- Shang, F.; Uber, J.G.; Rossman, L.A. EPANET Multi-Species Extension User’s Manual; Risk Reduction Engineering Laboratory, US Environmental Protection Agency: Cincinnati, OH, USA, 2007; p. 115. [Google Scholar]
- Rossman, L.A. EPANET 2: Users Manual; National Risk Management Research Laboratory, US Environmental Protection Agency: Cincinnati, OH, USA, 2000. [Google Scholar]
- Naser, G.; Karney, B.W. A 2-D transient multicomponent simulation model: Application to pipe wall corrosion. J. Hydro-Environ. Res. 2007, 1, 56–69. [Google Scholar] [CrossRef]
- Huck, P.M. Measurement of biodegradable organic matter and bacterial growth potential in drinking water. J. Am. Water Work. Assoc. 1990, 82, 78–86. [Google Scholar] [CrossRef]
- Escobar, I.C.; Randall, A.A.; Taylor, J.S. Bacterial growth in distribution systems: Effect of assimilable organic carbon and biodegradable dissolved organic carbon. Environ. Sci. Technol. 2001, 35, 3442–3447. [Google Scholar] [CrossRef]
- Kim, D.; Chung, S.; Lee, S.; Choi, J. Relation of microbial biomass to counting units for Pseudomonas aeruginosa. Afr. J. Microbiol. Res. 2012, 6, 4620–4622. [Google Scholar] [CrossRef]
- Picioreanu, C.; Van Loosdrecht, M.C.M.; Heijnen, J.J. Two-Dimensional Model of Biofilm Detachment Caused by Internal Stress from Liquid Flow. Biotechnol. Bioeng. 2001, 70, 205–218. [Google Scholar] [CrossRef]
- Nieuwenhuijsen, M.J.; Toledano, M.B.; Eaton, N.E.; Fawell, J.; Toledano, B.; Eaton, E.; Elliott, P.; Nieuwenhuijsen, J. Chlorination Disinfection Byproducts in Water and Their Association with Adverse Reproductive Outcomes: A Review. Occup. Environ. Med. 2000, 57, 73–85. [Google Scholar] [CrossRef] [PubMed] [Green Version]
- Sohn, J.; Amy, G.; Cho, J.; Lee, Y.; Yoon, Y. Disinfectant decay and disinfection by-products formation model development: Chlorination and ozonation by-products. Water Res. 2004, 38, 2461–2478. [Google Scholar] [CrossRef]
- Wang, J.; Liu, X.; Wai, T.; Xiao, J.; Chow, A.T.; Keung, P. Disinfection byproduct formation from chlorination of pure bacterial cells and pipeline biofilms. Water Res. 2013, 47, 2701–2709. [Google Scholar] [CrossRef]
- Domínguez-Tello, A.; Arias-Borrego, A.; García-Barrera, T.; Gómez-Ariza, J.L. A two-stage predictive model to simultaneous control of trihalomethanes in water treatment plants and distribution systems: Adaptability to treatment processes. Environ. Sci. Pollut. Res. 2017, 24, 22631–22648. [Google Scholar] [CrossRef]
- Clark, R.M.; Sivaganesan, M. Predicting Chlorine Residuals in Drinking Water: Second Order Model. J. Water Resour. Plan. Manag. 2002, 128, 152–161. [Google Scholar] [CrossRef]
- Chen, X.; Stewart, P.S. Chlorine penetration into artificial biofilm is limited by a reaction-diffusion interaction. Environ. Sci. Technol. 1996, 30, 2078–2083. [Google Scholar] [CrossRef]
- Bois, F.Y.; Fahmy, T.; Block, J.C.; Gatel, D. Dynamic modeling of bacteria in a pilot drinking-water distribution system. Water Res. 1997, 31, 3146–3156. [Google Scholar] [CrossRef]
- Schrottenbaum, I.; Uber, J.; Ashbolt, N.; Murray, R.; Janke, R.; Szabo, J.; Boccelli, D. Simple Model of Attachment and Detachment of Pathogens in Water Distribution System Biofilms. In Proceedings of the World Environmental and Water Resources Congress 2009, Kansas City, MO, USA, 17–21 May 2009; ASCE: Reston, VA, USA; pp. 145–157. [Google Scholar]
- Clark, R.M.; Sivaganesan, M. Predicting Chlorine Residuals and Formation of TTHMs in Drinking Water. J. Environ. Eng. 2002, 124, 1203–1210. [Google Scholar] [CrossRef]
- Kiéné, L.; Lu, W.; Lévi, Y. Relative importance of the phenomena responsible for chlorine decay in drinking water distribution systems. Water Sci. Technol. 1998, 38, 219–227. [Google Scholar] [CrossRef]
- Abhijith, G.R.; Mohan, S. Random Walk Particle Tracking embedded Cellular Automata model for predicting temporospatial variations of chlorine in water distribution systems. Environ. Process. 2020, 7, 271–296. [Google Scholar] [CrossRef]
- Camper, A.K. Factors Limiting Microbial Growth in Distribution Systems: Laboratory and Pilot-Scale Experiments; American Water Works Association: Denver, CO, USA, 1996. [Google Scholar]
- Billen, G.; Servais, P.; Bouillot, P.; Ventresque, C. Functioning of biological filters used in drinking-water treatment—the Chabrol model. J. Water Supply Res. Technol. 1992, 41, 231–241. [Google Scholar]
- Characklis, W.G.; Marshall, K.C. Biofilms; Wiley: New York, NY, USA, 1990; ISBN 0-471-82663-4. [Google Scholar]
- Clark, R.M. Chlorine demand and TTHM formation kinetics: A second-order model. J. Environ. Eng. 1998, 124, 16–24. [Google Scholar] [CrossRef]
- Hernandez-Lopez, R.D.; Tzatchkov, V.G.; Martin-Dominguez, A.; Alcocer-Yamanaka, V.H. Study of hydraulics and mixing in roof tanks used in intermittent water supply. J. Water Sanit. Hyg. Dev. 2016, 6, 547–554. [Google Scholar] [CrossRef]
- Eliades, D.G.; Kyriakou, M.; Vrachimis, S.G.; Polycarpou, M.M. EPANET-MATLAB Toolkit: An Open-Source Software for Interfacing EPANET with MATLAB. In Proceedings of the Computing and Control for the Water Industry (CCWI) 2016, Amsterdam, The Netherlands, 4 August 2016; pp. 1–8. [Google Scholar]
- Reca, J.; Martínez, J. Genetic algorithms for the design of looped irrigation water distribution networks. Water Resour. Res. 2006, 42, 1–9. [Google Scholar] [CrossRef]
- Bi, W.; Dandy, G.C.; Maier, H.R. Improved genetic algorithm optimization of water distribution system design by incorporating domain knowledge. Environ. Model. Softw. 2015, 69, 370–381. [Google Scholar] [CrossRef]
- Kang, D.; Lansey, K. Revisiting Optimal Water-Distribution System Design: Issues and a Heuristic Hierarchical Approach. J. Water Resour. Plan. Manag. 2012, 138, 208–217. [Google Scholar] [CrossRef]
- Hozalski, R.M.; Bouwer, E.J.; Goel, S. Removal of natural organic matter (NOM) from drinking water supplies by ozone-biofiltration. Water Sci. Technol. 1999, 40, 157–163. [Google Scholar] [CrossRef]
- Loucks, D.P.; Beek, E. Van Water Resources Systems Planning and Management: An Introduction to Methods, Models And Applications, 1st ed.; UNESCO: Paris, France, 2005; ISBN 9231039989. [Google Scholar]
- Lele, U.N.; Watve, M.G. Bacterial growth rate and growth yield: Is there a relationship? Proc. Indian Natl. Sci. Acad. 2014, 80, 537–546. [Google Scholar] [CrossRef]
Figure 1.
Physicochemical and biological interactions considered in the model formulation.

Figure 2.
Schematic of the Balerma Network (Test Problem 1).

Figure 3.
Schematic of KLmod Network (Test Problem 2).

Figure 4.
Steady-state values of (a) bacterial cell counts and concentrations of (b) chlorine, (c) TOC, and (d) Trihalomethanes (THMs) in the nodes of Test Problem 1 under Scenarios 1a, 1b, and 1c.
Figure 4.
Steady-state values of (a) bacterial cell counts and concentrations of (b) chlorine, (c) TOC, and (d) Trihalomethanes (THMs) in the nodes of Test Problem 1 under Scenarios 1a, 1b, and 1c.

Figure 5.
Steady-state values of bacterial cell counts and concentrations of chlorine and TOC in Test Problem 2 under Scenarios (a) 2a, (b) 2b, (c) 2c, and (d) 2d.
Figure 5.
Steady-state values of bacterial cell counts and concentrations of chlorine and TOC in Test Problem 2 under Scenarios (a) 2a, (b) 2b, (c) 2c, and (d) 2d.


Figure 6.
Steady-state THM concentrations in the nodes of Test Problem 2 under Scenarios 2a, 2b, 2c, and 2d.
Figure 6.
Steady-state THM concentrations in the nodes of Test Problem 2 under Scenarios 2a, 2b, 2c, and 2d.

Figure 7.
Steady-state bacterial cell counts in the nodes of (a) Test Problem 1 and (b) Test Problem 2 under non-chlorinated conditions.
Figure 7.
Steady-state bacterial cell counts in the nodes of (a) Test Problem 1 and (b) Test Problem 2 under non-chlorinated conditions.

Figure 8.
Steady-state TOC concentrations in the nodes of Test Problem 1 under Scenarios 1d, 1e, and 1f corresponding to non-chlorinated conditions.
Figure 8.
Steady-state TOC concentrations in the nodes of Test Problem 1 under Scenarios 1d, 1e, and 1f corresponding to non-chlorinated conditions.


Table 1.
Values and formulas of the parameters used in the multispecies reactive-transport (MSRT) model.
Table 1.
Values and formulas of the parameters used in the multispecies reactive-transport (MSRT) model.
| Parameter | Value/Formula | Unit | Reference | Base Value Selected |
|---|---|---|---|---|
| L/mg-C.s | [29] | - | ||
| L/CFU.s | [10] | - | ||
| 1.04 × 10⁻⁷–1.43 × 10⁻⁵ | m/s | [30] | 1.04 × 10⁻⁷ m/s | |
| 0.0072 | mg/m2.s | [12] | ||
| 1.39 × 10⁻⁵–4.2 × 10⁻⁴ | 1/s | [6,31] | 4.2 × 10⁻⁴ 1/s | |
| 7.2 × 10⁻¹⁶–6.1 × 10⁻¹⁰ | mg-C/CFU.s | [26] | 8.6 × 10⁻⁷ 1/s | |
| 0.05–1.20 | mg-C/L | [32,33] | 0.195 mg-C/L | |
| 0.007–1.50 | mg-C/mg-C | [26] | 0.007 × 10⁶ CFU/mg-C | |
| 0.05–5.0 | L/mg-Cl | [6,10,26] | 0.35 L/mg-Cl | |
| 37 | °C | [12] | 37 °C | |
| 7 | °C | [12] | 7 °C | |
| 0.59 ± 0.15 | mg-C/mg-Cl | [26] | 0.34 × 10⁶ CFU/mL | |
| 0.4–4.88 | mg-C/mg-Cl | [34] | 0.98 mg-C/mg-Cl | |
| a | 0.3 | - | [5] | 0.3 |
| 9 × 10⁻⁷–1.8 × 10⁻⁵ | 1/s | [6,26] | 6.3 × 10⁻⁵ 1/s | |
| 5.5 × 10⁻⁶–4.2 × 10⁻⁴ | 1/s | [26] | ||
| 4 × 10⁻⁴ | 1/s | [6] | 6.618 × 10⁻⁷ m.s/g | |
| 6.618 × 10⁻⁷ | m.s/g | [27] | ||
| Blasius equation | g.m/s2 | [7] | Temperature effects on water dynamic viscosity | |
| 3–3000 | - | [26] | 100 | |
| 5.68–188.20 | µg-THM /mg-Cl | [28,34] | 118.435 µg-THM /mg-Cl | |
| 4.487 | µg-THM /mg-Cl | [10] | 4.487 µg-THM /mg-Cl |
Table 2.
Details of the scenarios considered for Test Problem 1.
| Scenario ID | Reservoir ID 38 | Reservoir ID 43 | Reservoir ID 44 | Reservoir ID 88 | ||||||||
|---|---|---|---|---|---|---|---|---|---|---|---|---|
| C0 * | Xb0 * | N0 * | C0 | Xb0 | N0 | C0 | Xb0 | N0 | C0 | Xb0 | N0 | |
| Scenario 1a | 0.5 | 0.01 | 1.0 | 1.0 | 0.1 | 2.0 | 2.0 | 1 | 3.0 | 0.5 | 10 | 1.0 |
| Scenario 1b | 1.0 | 0.1 | 2.0 | 2.0 | 1 | 3.0 | 0.5 | 10 | 1.0 | 1.0 | 100 | 2.0 |
| Scenario 1c | 2.0 | 1 | 3.0 | 0.5 | 10 | 1.0 | 1.0 | 100 | 2.0 | 2.0 | 0.01 | 3.0 |
| Scenario 1d | - | 0.01 | 1.0 | - | 0.1 | 2.0 | - | 1 | 3.0 | - | 10 | 1.0 |
| Scenario 1e | - | 0.1 | 2.0 | - | 1 | 3.0 | - | 10 | 1.0 | - | 100 | 2.0 |
| Scenario 1f | - | 1 | 3.0 | - | 10 | 1.0 | - | 100 | 2.0 | - | 0.01 | 3.0 |
* , , and denote chlorine concentration (mg-Cl/L), bacterial cell count (CFU/mL), and total organic carbon (TOC) concentration (mg-C/L), respectively, in the source nodes (reservoirs).
Table 3.
Details of the scenarios considered for Test Problem 2.
| Scenario ID | Water Quality Characteristics in the Reservoir ID 1 | |
|---|---|---|
| Scenario 2a | 0.5 | 1.0 |
| Scenario 2b | 1.0 | 2.0 |
| Scenario 2c | 0.5 | 2.0 |
| Scenario 2d | 1.0 | 1.0 |
| Scenario 2e | - | 1.0 |
| Scenario 2f | - | 2.0 |
Table 4.
Results of the parameter sensitivity analysis conducted for Test Problem 1.
| Parameter | |||||||||
|---|---|---|---|---|---|---|---|---|---|
| Bacterial Regrowth Module | Chlorine Decay Module | THM Formation Module | |||||||
| Scenario 1a | Scenario 1b | Scenario 1c | Scenario 1a | Scenario 1b | Scenario 1c | Scenario 1a | Scenario 1b | Scenario 1c | |
| 0.435 | 0.952 | 0.882 | −0.488 | −0.583 | −0.543 | 0.995 | 0.995 | 0.996 | |
| −1.116 | −1.747 | −1.749 | - | −0.001 | - | - | - | - | |
| 0.022 | 0.005 | 0.003 | −0.018 | −0.017 | −0.015 | −0.001 | −0.001 | −0.002 | |
| 2.433 | 2.148 | 2.145 | - | 0.002 | 0.002 | - | - | - | |
| 0.002 | 0.001 | 0.001 | - | - | - | - | - | - | |
| −0.689 | −0.542 | −0.906 | - | −0.001 | −0.001 | - | - | - | |
| 0.002 | 0.011 | 0.016 | - | −0.003 | −0.002 | - | - | - | |
| −0.551 | −0.833 | −0.821 | - | −0.001 | −0.001 | - | - | - | |
| −1.116 | −1.747 | −1.749 | - | - | - | - | - | - | |
| −0.194 | −0.437 | −0.357 | 0.101 | 0.141 | 0.126 | −0.014 | −0.017 | −0.008 | |
| a | - | - | - | - | - | - | - | - | - |
| −0.080 | −0.077 | −0.082 | - | - | - | - | - | - | |
| . | −1.184 | −0.567 | −0.499 | - | - | - | - | - | - |
| 0.003 | 002 | 0.003 | - | - | - | - | - | - | |
| 0.003 | 0.005 | 0.003 | - | - | - | - | - | - | |
| - | - | - | - | - | - | 1.000 | 1.000 | 1.000 | |
| - | - | - | - | - | - | - | - | - | |
Table 5.
Results of the parameter sensitivity analysis conducted for Test Problem 2.
| Parameter | ||||||||||||
|---|---|---|---|---|---|---|---|---|---|---|---|---|
| Bacterial Regrowth Module | Chlorine Decay Module | THM Formation Module | ||||||||||
| Scenario 2a | Scenario 2b | Scenario 2c | Scenario 2d | Scenario 2a | Scenario 2b | Scenario 2c | Scenario 2d | Scenario 2a | Scenario 2b | Scenario 2c | Scenario 2d | |
| 1.831 | 3.211 | 3.658 | 0.474 | −2.121 | −3.483 | −5.217 | −0.835 | 0.996 | 0.993 | 0.994 | 0.995 | |
| −3.837 | −2.942 | −2.563 | −5.099 | −0.066 | −0.198 | −0.055 | - | 0.006 | 0.006 | 0.001 | - | |
| 0.183 | 0.105 | 0.061 | 0.280 | −0.086 | −0.083 | −0.080 | −0.092 | −0.015 | −0.009 | −0.008 | −0.012 | |
| 35.327 | 24.195 | 43.618 | 10.610 | 0.646 | 1.964 | 0.987 | - | −0.056 | −0.060 | −0.038 | - | |
| - | - | - | - | - | - | - | - | - | - | - | - | |
| −14.172 | −7.627 | −10.193 | −6.091 | −0.287 | −0.828 | −0.317 | - | - | 0.024 | 0.015 | - | |
| 2.102 | 1.850 | 1.916 | - | −0.026 | −0.097 | −0.055 | - | 0.002 | 0.002 | −0.001 | - | |
| −1.522 | −1.427 | −1.420 | −1.469 | −0.026 | −0.091 | −0.022 | - | 0.002 | 0.003 | 0.001 | - | |
| −3.837 | −2.942 | −2.563 | −5.099 | −0.065 | −0.188 | −0.041 | - | 0.006 | 0.006 | 0.002 | - | |
| −8.576 | −6.580 | −3.000 | −10.282 | 1.173 | 2.028 | 1.373 | 1.588 | −0.128 | −0.127 | −0.058 | −0.378 | |
| a | - | 0.001 | 0.001 | - | - | - | - | - | - | - | - | - |
| −1.103 | −0.628 | −0.935 | −0.553 | −0.021 | −0.059 | −0.031 | - | 0.002 | 0.002 | 0.001 | - | |
| −9.367 | −5.445 | −8.017 | −4.799 | −0.183 | −0.533 | −0.273 | - | 0.016 | 0.016 | 0.011 | - | |
| 0.008 | 0.007 | 0.007 | 0.001 | - | - | - | - | - | - | - | - | |
| - | - | - | - | - | - | - | - | - | - | - | - | |
| - | - | - | - | - | - | - | - | 1.000 | 1.000 | 1.000 | 1.000 | |
| - | - | - | - | - | - | - | - | - | - | - | - | |
Table 6.
Values corresponding to the bacterial regrowth module for Test Problems 1 and 2 under non-chlorinated conditions.
Table 6.
Values corresponding to the bacterial regrowth module for Test Problems 1 and 2 under non-chlorinated conditions.
| Parameter | |||||
|---|---|---|---|---|---|
| Test Problem 1 | Test Problem 2 | ||||
| Scenario 1d | Scenario 1e | Scenario 1f | Scenario 2e | Scenario 2f | |
| - | - | - | - | - | |
| - | - | - | - | ||
| - | - | - | - | - | |
| 2.727 | 2.726 | 2.711 | 33.359 | 32.105 | |
| - | - | - | - | - | |
| −0.674 | −0.743 | −0.773 | −10.730 | −6.736 | |
| 0.002 | 0.001 | 0.013 | 2.002 | 1.843 | |
| - | - | - | - | - | |
| - | - | - | - | - | |
| - | - | - | - | - | |
| a | - | - | - | - | - |
| −0.062 | −0.062 | −0.062 | −0.839 | −0.641 | |
| −0.552 | −0.552 | −0.551 | −7.194 | −5.554 | |
| 0.002 | 0.001 | 0.001 | 0.001 | 0.001 | |
| - | - | - | - | - | |
| - | - | - | - | - | |
| - | - | - | - | - | |
Publisher’s Note: MDPI stays neutral with regard to jurisdictional claims in published maps and institutional affiliations. |
© 2021 by the authors. Licensee MDPI, Basel, Switzerland. This article is an open access article distributed under the terms and conditions of the Creative Commons Attribution (CC BY) license (http://creativecommons.org/licenses/by/4.0/).
Share and Cite
MDPI and ACS Style
Abhijith, G.R.; Kadinski, L.; Ostfeld, A. Modeling Bacterial Regrowth and Trihalomethane Formation in Water Distribution Systems. Water 2021, 13, 463. https://doi.org/10.3390/w13040463
AMA Style
Abhijith GR, Kadinski L, Ostfeld A. Modeling Bacterial Regrowth and Trihalomethane Formation in Water Distribution Systems. Water. 2021; 13(4):463. https://doi.org/10.3390/w13040463
Chicago/Turabian StyleAbhijith, Gopinathan R., Leonid Kadinski, and Avi Ostfeld. 2021. "Modeling Bacterial Regrowth and Trihalomethane Formation in Water Distribution Systems" Water 13, no. 4: 463. https://doi.org/10.3390/w13040463
Note that from the first issue of 2016, this journal uses article numbers instead of page numbers. See further details here.