
A Computer Program to Support the Selection of Turbines to Recover Unused Energy at Hydraulic Networks


1
Departamento de Ingeniería Minera, Mecánica, Energética y de la Construcción, Área de Ingeniería Mecánica, Escuela Técnica Superior de Ingeniería, Campus El Carmen, Universidad de Huelva, 21007 Huelva, Spain
2
Departamento de Ciencias Agroforestales, Área de Mecánica de Fluidos, Escuela Técnica Superior de Ingeniería, Campus El Carmen, Universidad de Huelva, 21007 Huelva, Spain
*
Author to whom correspondence should be addressed.
Water 2021, 13(4), 467; https://doi.org/10.3390/w13040467
Submission received: 22 December 2020
/
Revised: 3 February 2021
/
Accepted: 8 February 2021
/
Published: 11 February 2021
(This article belongs to the Special Issue Soft Computing for Water and Aquatic Resource Management)
Abstract
:For this paper, a computer program was designed and developed to calculate which turbines could be placed in a water distribution system considering the hydraulic constraints. The aforementioned turbines are placed in locations where we have unused hydraulic energy, i.e., when this energy is dissipated by a regulating valve. In our case, what we do is place a turbine to make use of that excess energy. Once the data has been entered into the program, it provides the type or types of turbines that can be placed in each location, what power these turbines would be, and how much they would generate annually. The program offers us two calculation options. In the first, and simpler, one, it would be done using the net head at the location where the turbine is to be placed. For this option, it would only be necessary to introduce the flow rate, the net head, and the hours that the turbine will be in operation to perform the calculation. The second option would be in the case where we did not have the net head, and, instead, we had the gross head. In this case, we have to calculate the head losses. Normally, this would be the most used option because there are usually no pressure drops. To perform the calculation, in this case, it is necessary to know, apart from what is mentioned in the first option, the characteristics of the pipe (diameter, length, and material).
1. Introduction
The use of excess energy in pressurized water systems is an alternative to the microgeneration of electricity that could be included in action plans and policies that favor the development of a sustainable economy compatible with social and environmental welfare requirements [1].
Hydraulic power is a “natural” energy production source that should be considered as an optimal source of energy to produce electrical energy. The potential energy savings and the impact of these alternatives on the energy efficiency of the water supply systems are highly variable [2], depending on their location, since, in each of them, we find a flow rate and a different net head. Today, there is a great scientific and technical interest in analyzing and evaluating the possibilities of recovering the unused energy in pressurized and gravity water distribution systems. Topics of interest include the optimal location and operation scheme of the hydraulic machine to be installed, as well as the influence of this one on the control and management of the pipeline network [3,4,5,6,7].
Computer programs similar to the one we have developed in this work have been published in the specialized literature. For example, Lof et al. [8] have developed a product method, system, and computer program to improve the commercial value of the electrical energy produced in a wind turbine production facility. There are other studies in which methods are proposed for obtaining the measurements of the photovoltaic and wind hybrid system. The intention is to characterize the photovoltaic module, the wind generator, and the battery, obtaining the performance in each of the proposed facilities [9]. Another alternative to consider is the development of a mobile prototype platform, based on augmented reality and smartphone multimedia technology, operating in a combination of real-world environment and computer-generated data to augment human perception of a scene in real time [10].
On the other hand, there are papers in which a review of the different computer tools that can be used to analyze the integration of renewable energies is carried out. With regard to this, they provide the information needed to guide the decision-maker to adequate energy analysis tools that must be completed [11].
In other papers, the design of a program for optimization and data storage is carried out. A second layer was used to analyze the acquired data to model water consumption. A program to take into account to carry out these works would be MATLAB [12]. In order to carry out the program, a flowchart has been devised, similar to the one which we will use to develop the schematic of the program [13].
The objective of this paper was the design and development of a computer program to support the selection of turbines which can use the dissipated energy in pressure water supply systems. The input variables of this application, designed with a user-friendly framework, are the hydraulic constraints of the water pipelines network under study (flow rate and net head available, or flow rate, gross head, and pipe characteristics). The output are the possible hydraulic machines (turbines and/or pumps working as turbines (PATs)) that meet the hydraulic constraints and are available on the market today.
2. Materials and Methods
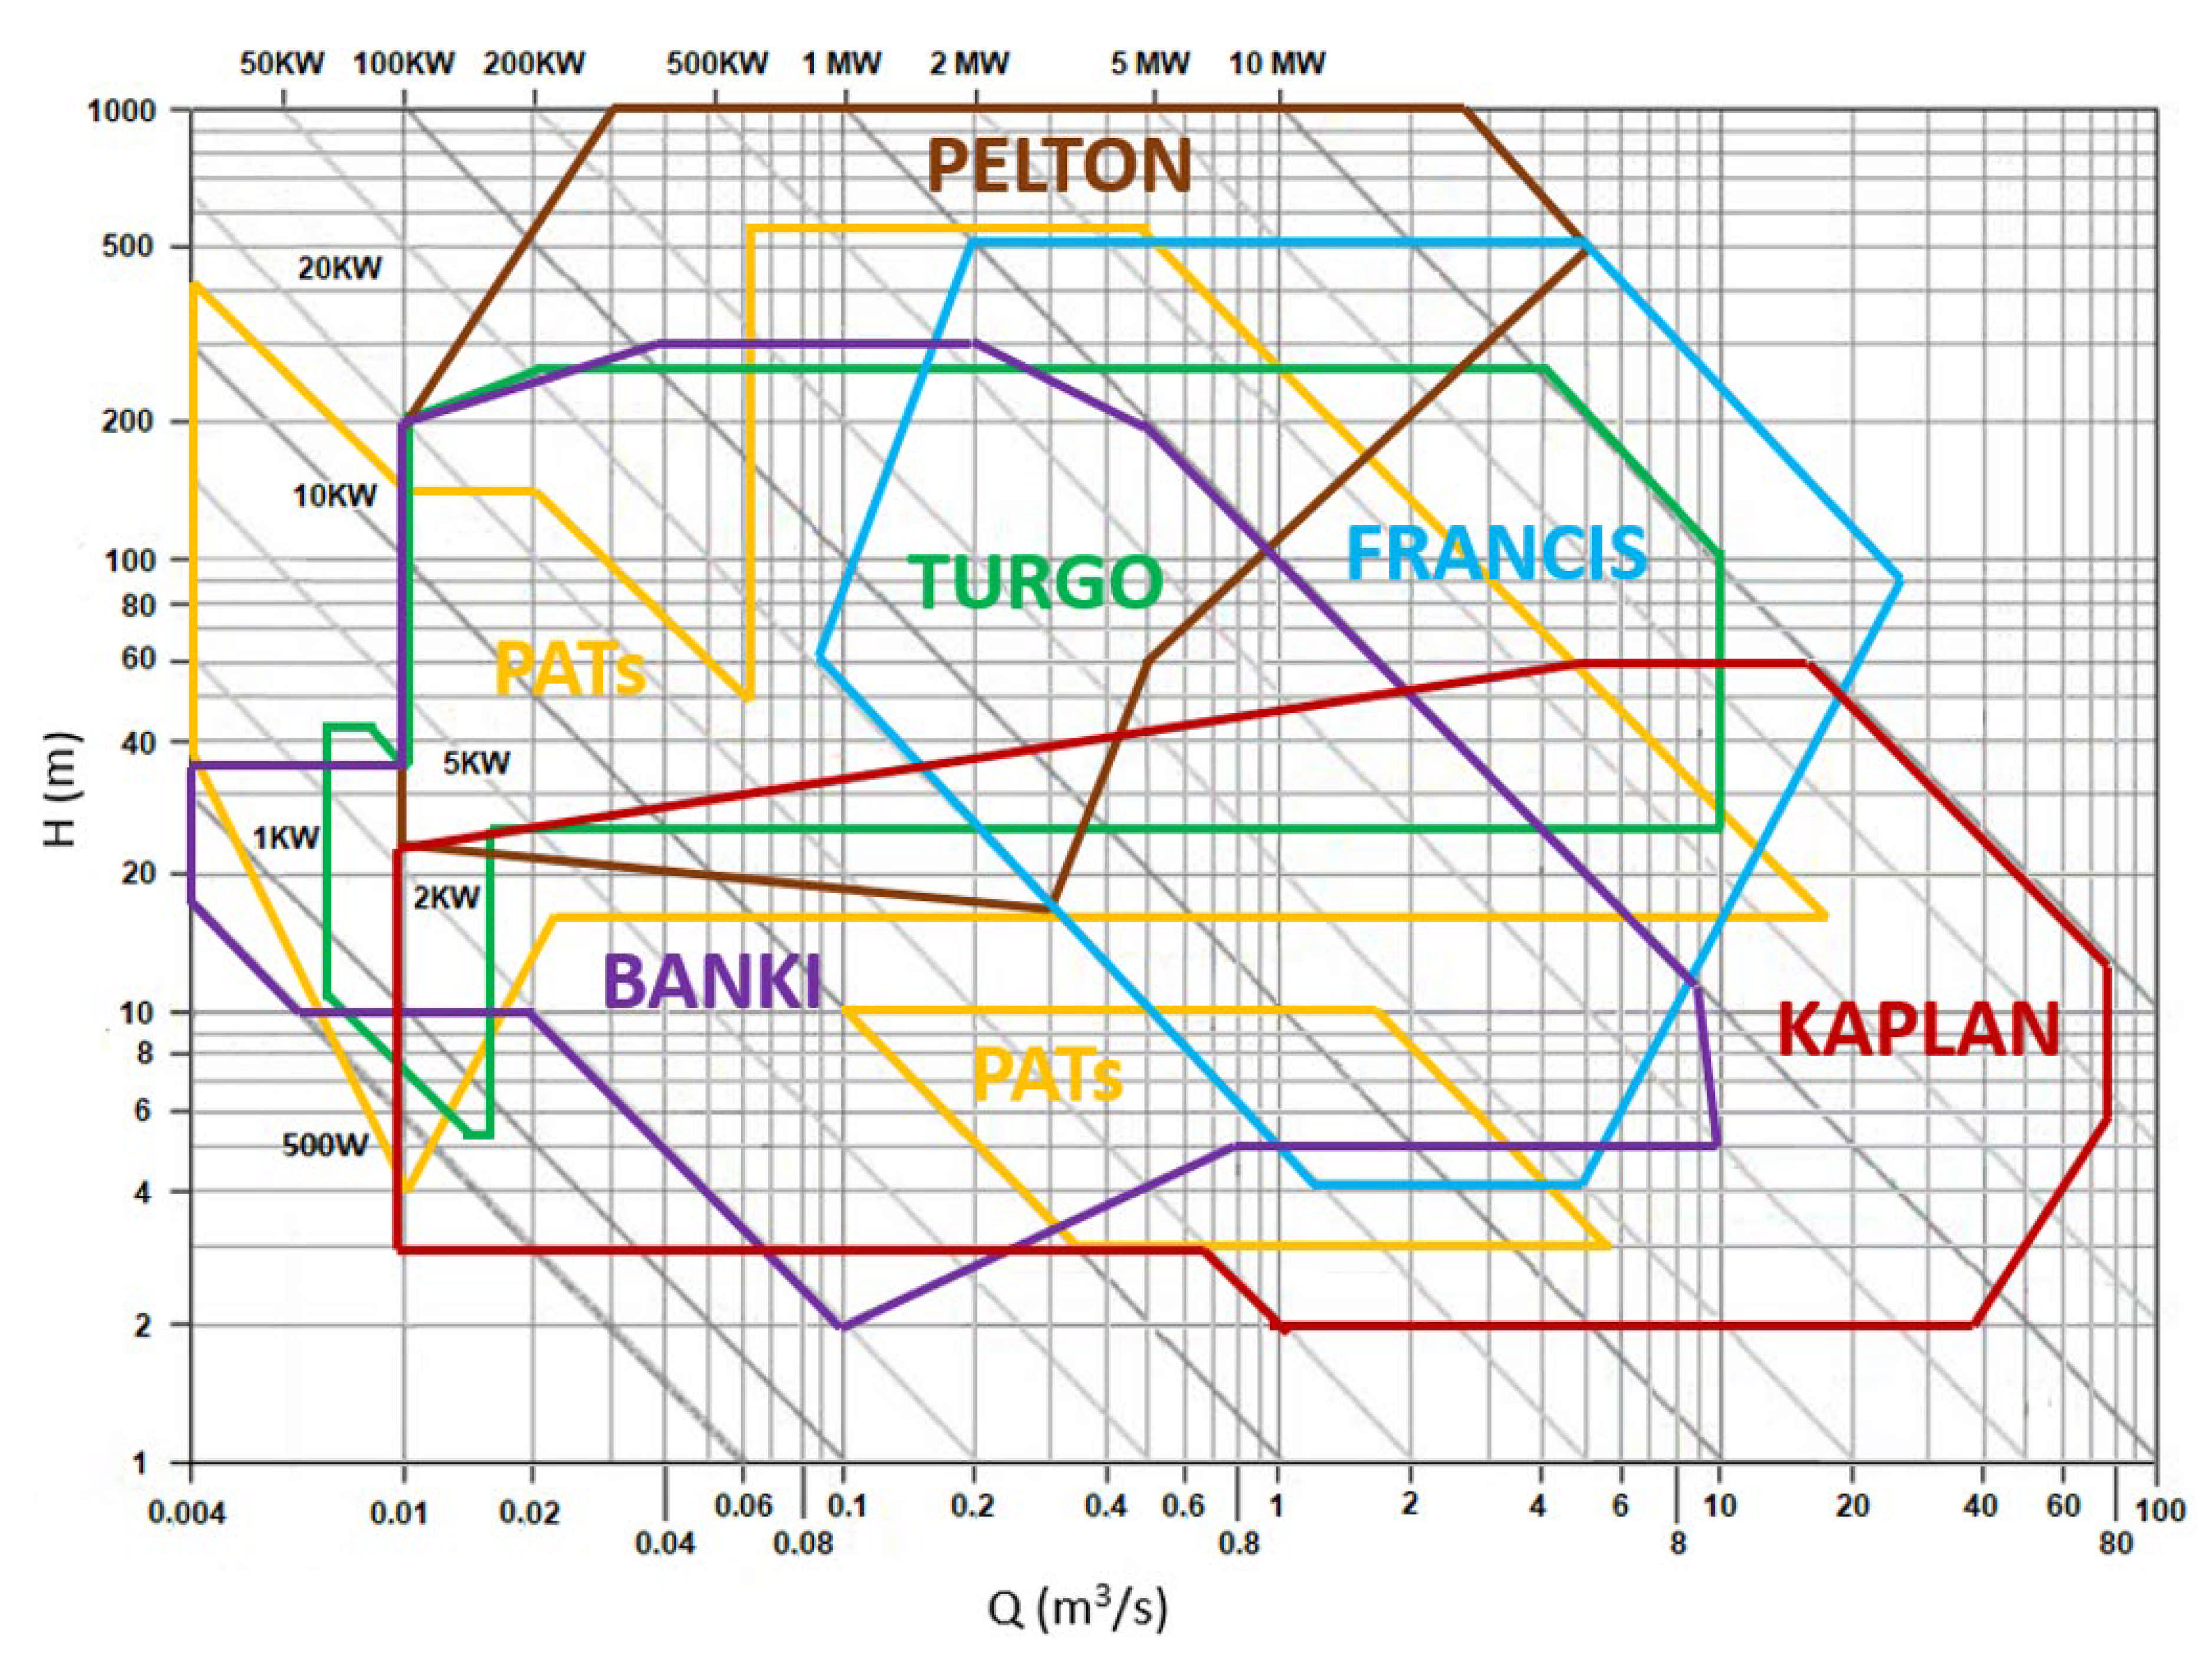
In order to carry out the computer program, we made a diagram (Figure 1) which represents the ranges in which the most widely used turbines work in the current market. This diagram net head (H)-flow rate (Q) has been made using a data collection of different manufacturers and suppliers of commercial turbines, among which are BANKI, FRANCIS, KAPLAN, PAT (Pump as Turbine), PELTON, and TURGO. All of the sections in this figure are made up of the different models of each type of existing turbine, considering its net head (m), its flow rate (m3/s), and its power (W).
Once the diagram with the turbine sections was made, the Jordan curve theorem [14,15] was used in order to read this diagram. The theorem consists of choosing the vertices of each of the sections to be studied and thereby defining those sections under study. Finally, once the theorem has been implemented into the program, the data to be studied can be entered, and the program will tell us which section the said data belongs to and, therefore, which is the ideal turbine for the said location.
The code consists of generating the effective sections of each turbine (Figure 1). With regard to this, its vertices are indicated in the graph. Each vertex is stored in an object of the class “Point”, in which the coordinates of that vertex are found. To define the figure, we are going to save all of its vertices in a list, and we are going to save that list in an object of the class “Figure”.
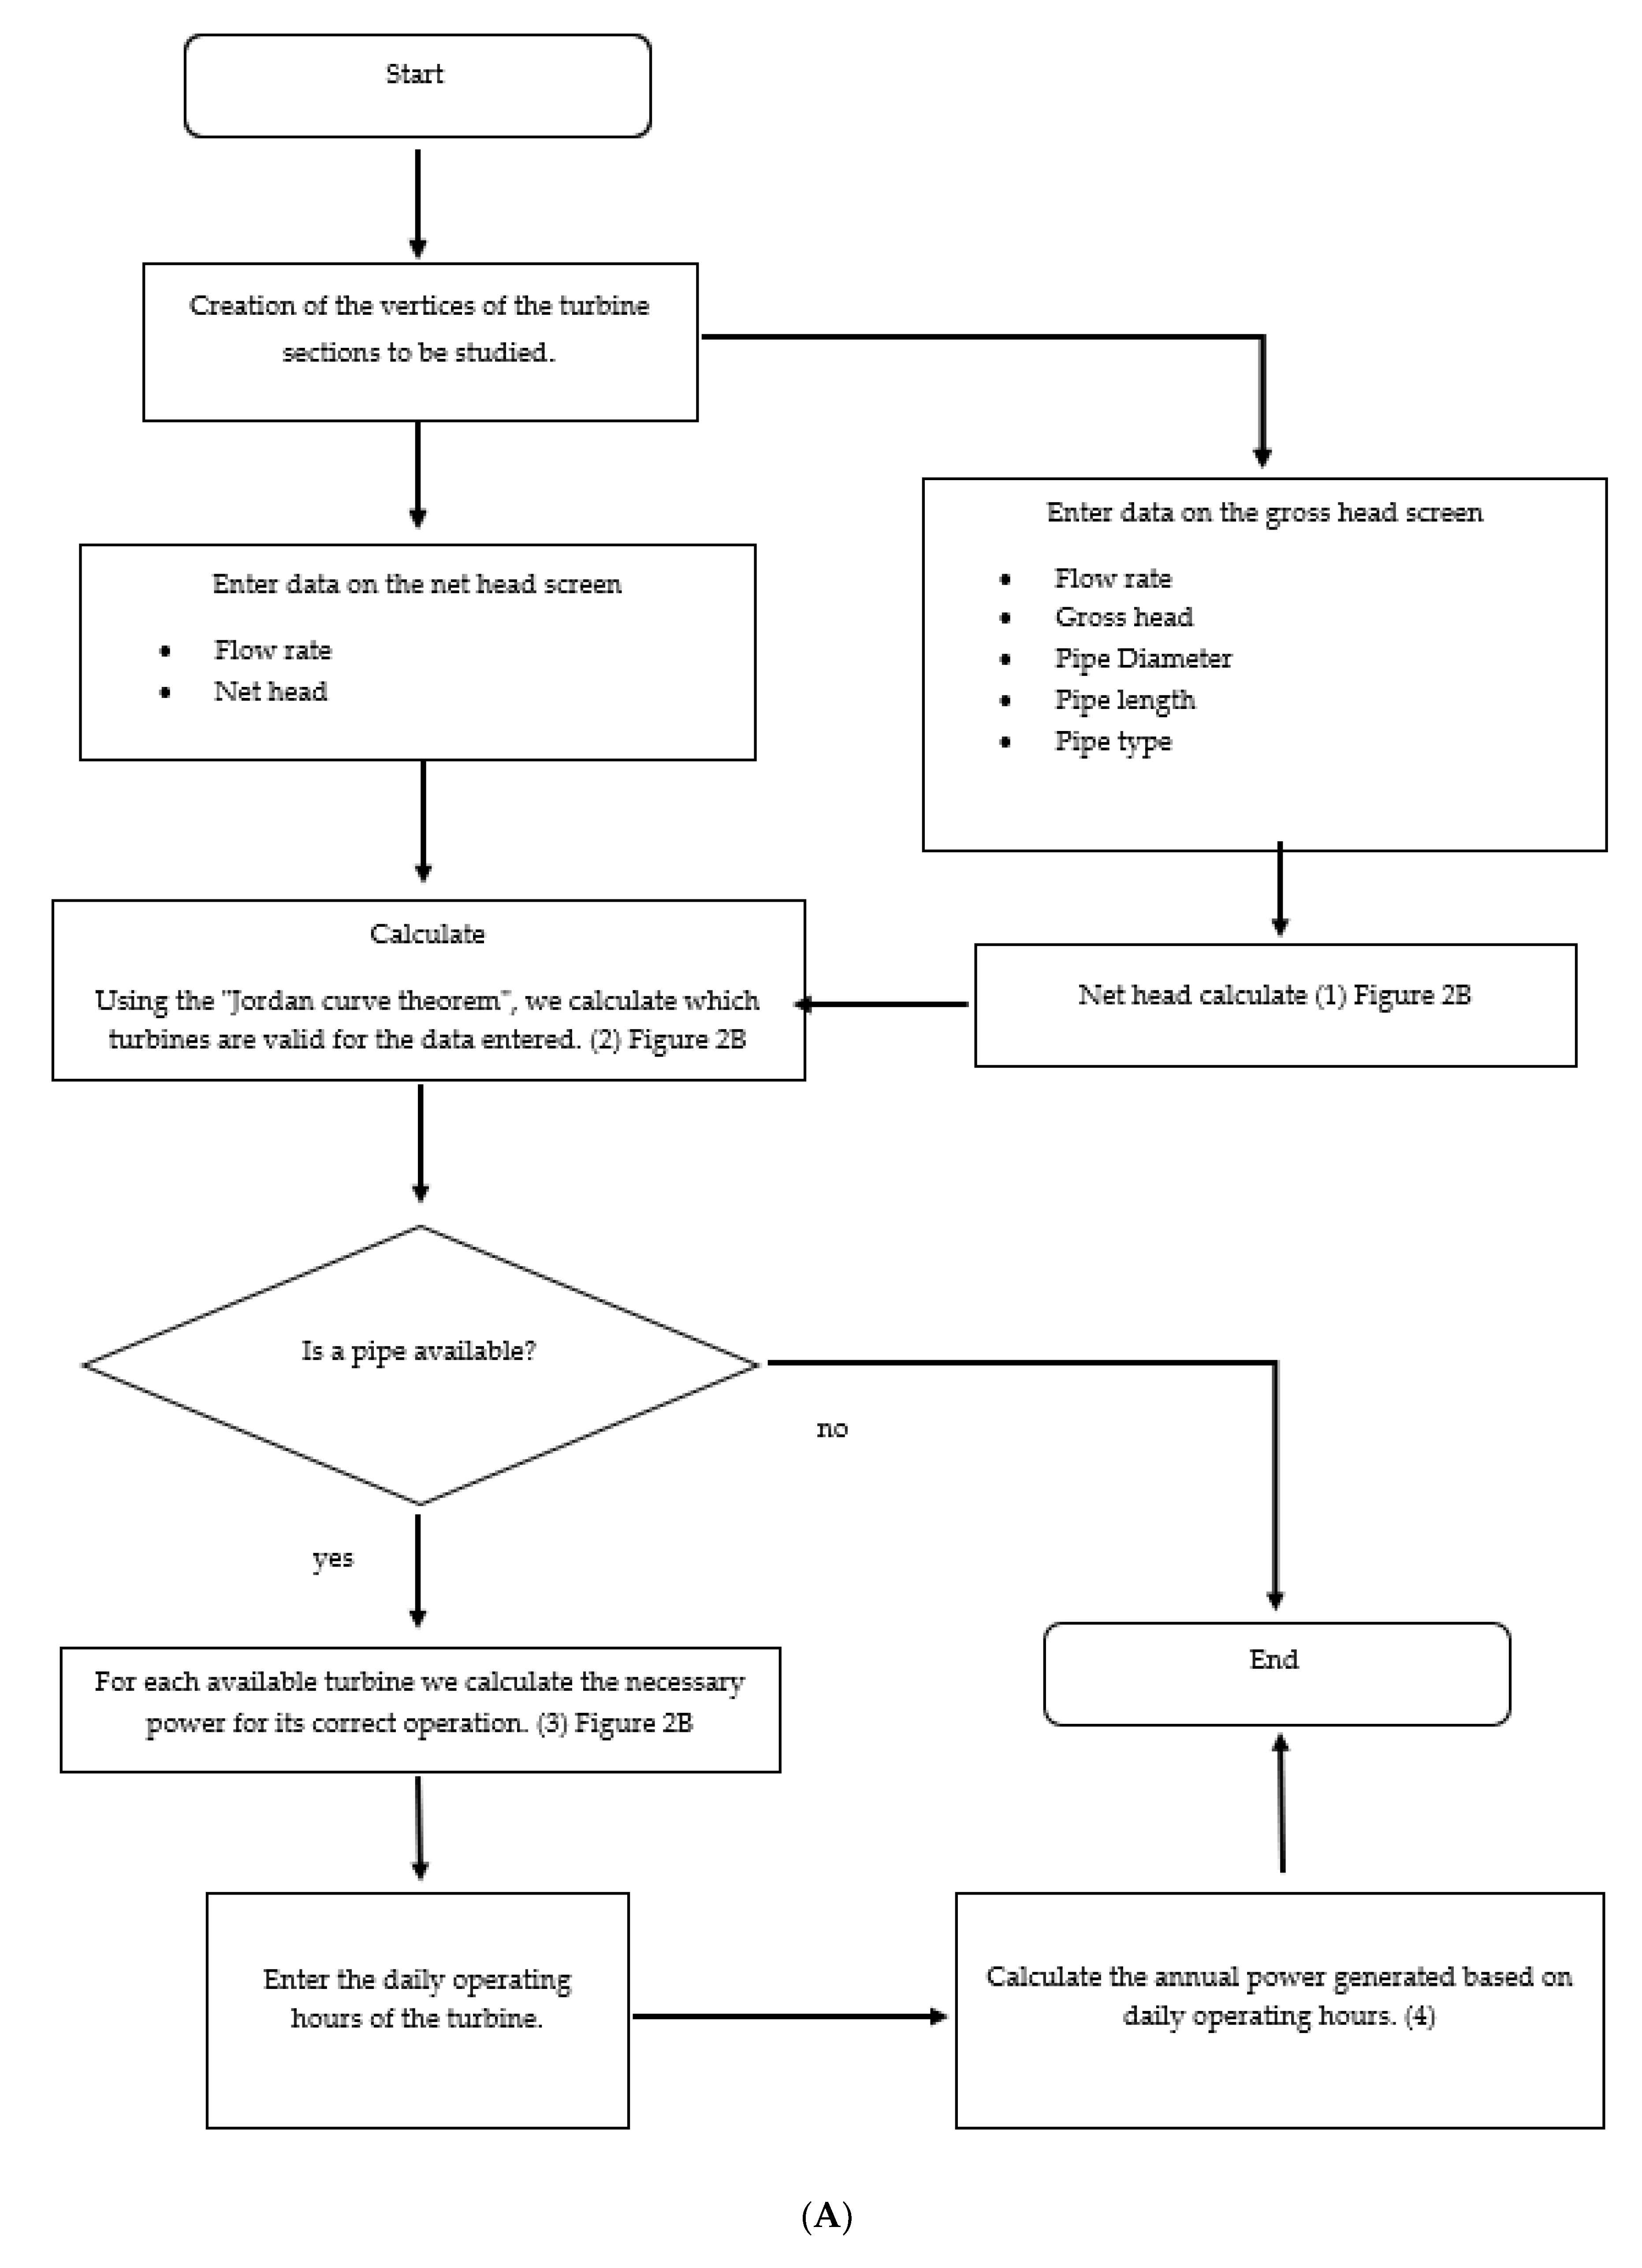
The flowchart, which follows the program that was carried out, can be seen in Figure 2A,B.
The program pulls a line from a point in any direction, with which you can tell if that point is inside or outside the section (Figure 2B). To do this, you have to look at the number of times that line collides with the edges of the figure. If it collides 0 or an even number of times, the point is outside the section, while, if it collides an odd number of times, the point is inside the section.
The program has two initial options, as we have observed in the flow rate diagram, which are the first one using the net head, as we can see in Figure 3 and Figure 4, in which some practical examples have been made. The second option would be using the gross head, as can be seen in the practical cases of Figure 4 and Figure 5.
3. Results and Discussion
In this section, we are going to carry out four practical cases, as examples, to check the application. In the first two, the net head will be used, and, in the other two, it will be done with the gross head. For all cases, the calculations will be carried out in two ways, with the application and with the relevant equations. Description with more detailed of followed methodology and of the characteristics of water distribution networks under study is in Rodríguez-Pérez and Pulido-Calvo [16] and Rodríguez-Pérez et al. [17]. Finally, the results obtained will be compared.
Case study 1 (La Puebla de Guzmán, Huelva) (net head):
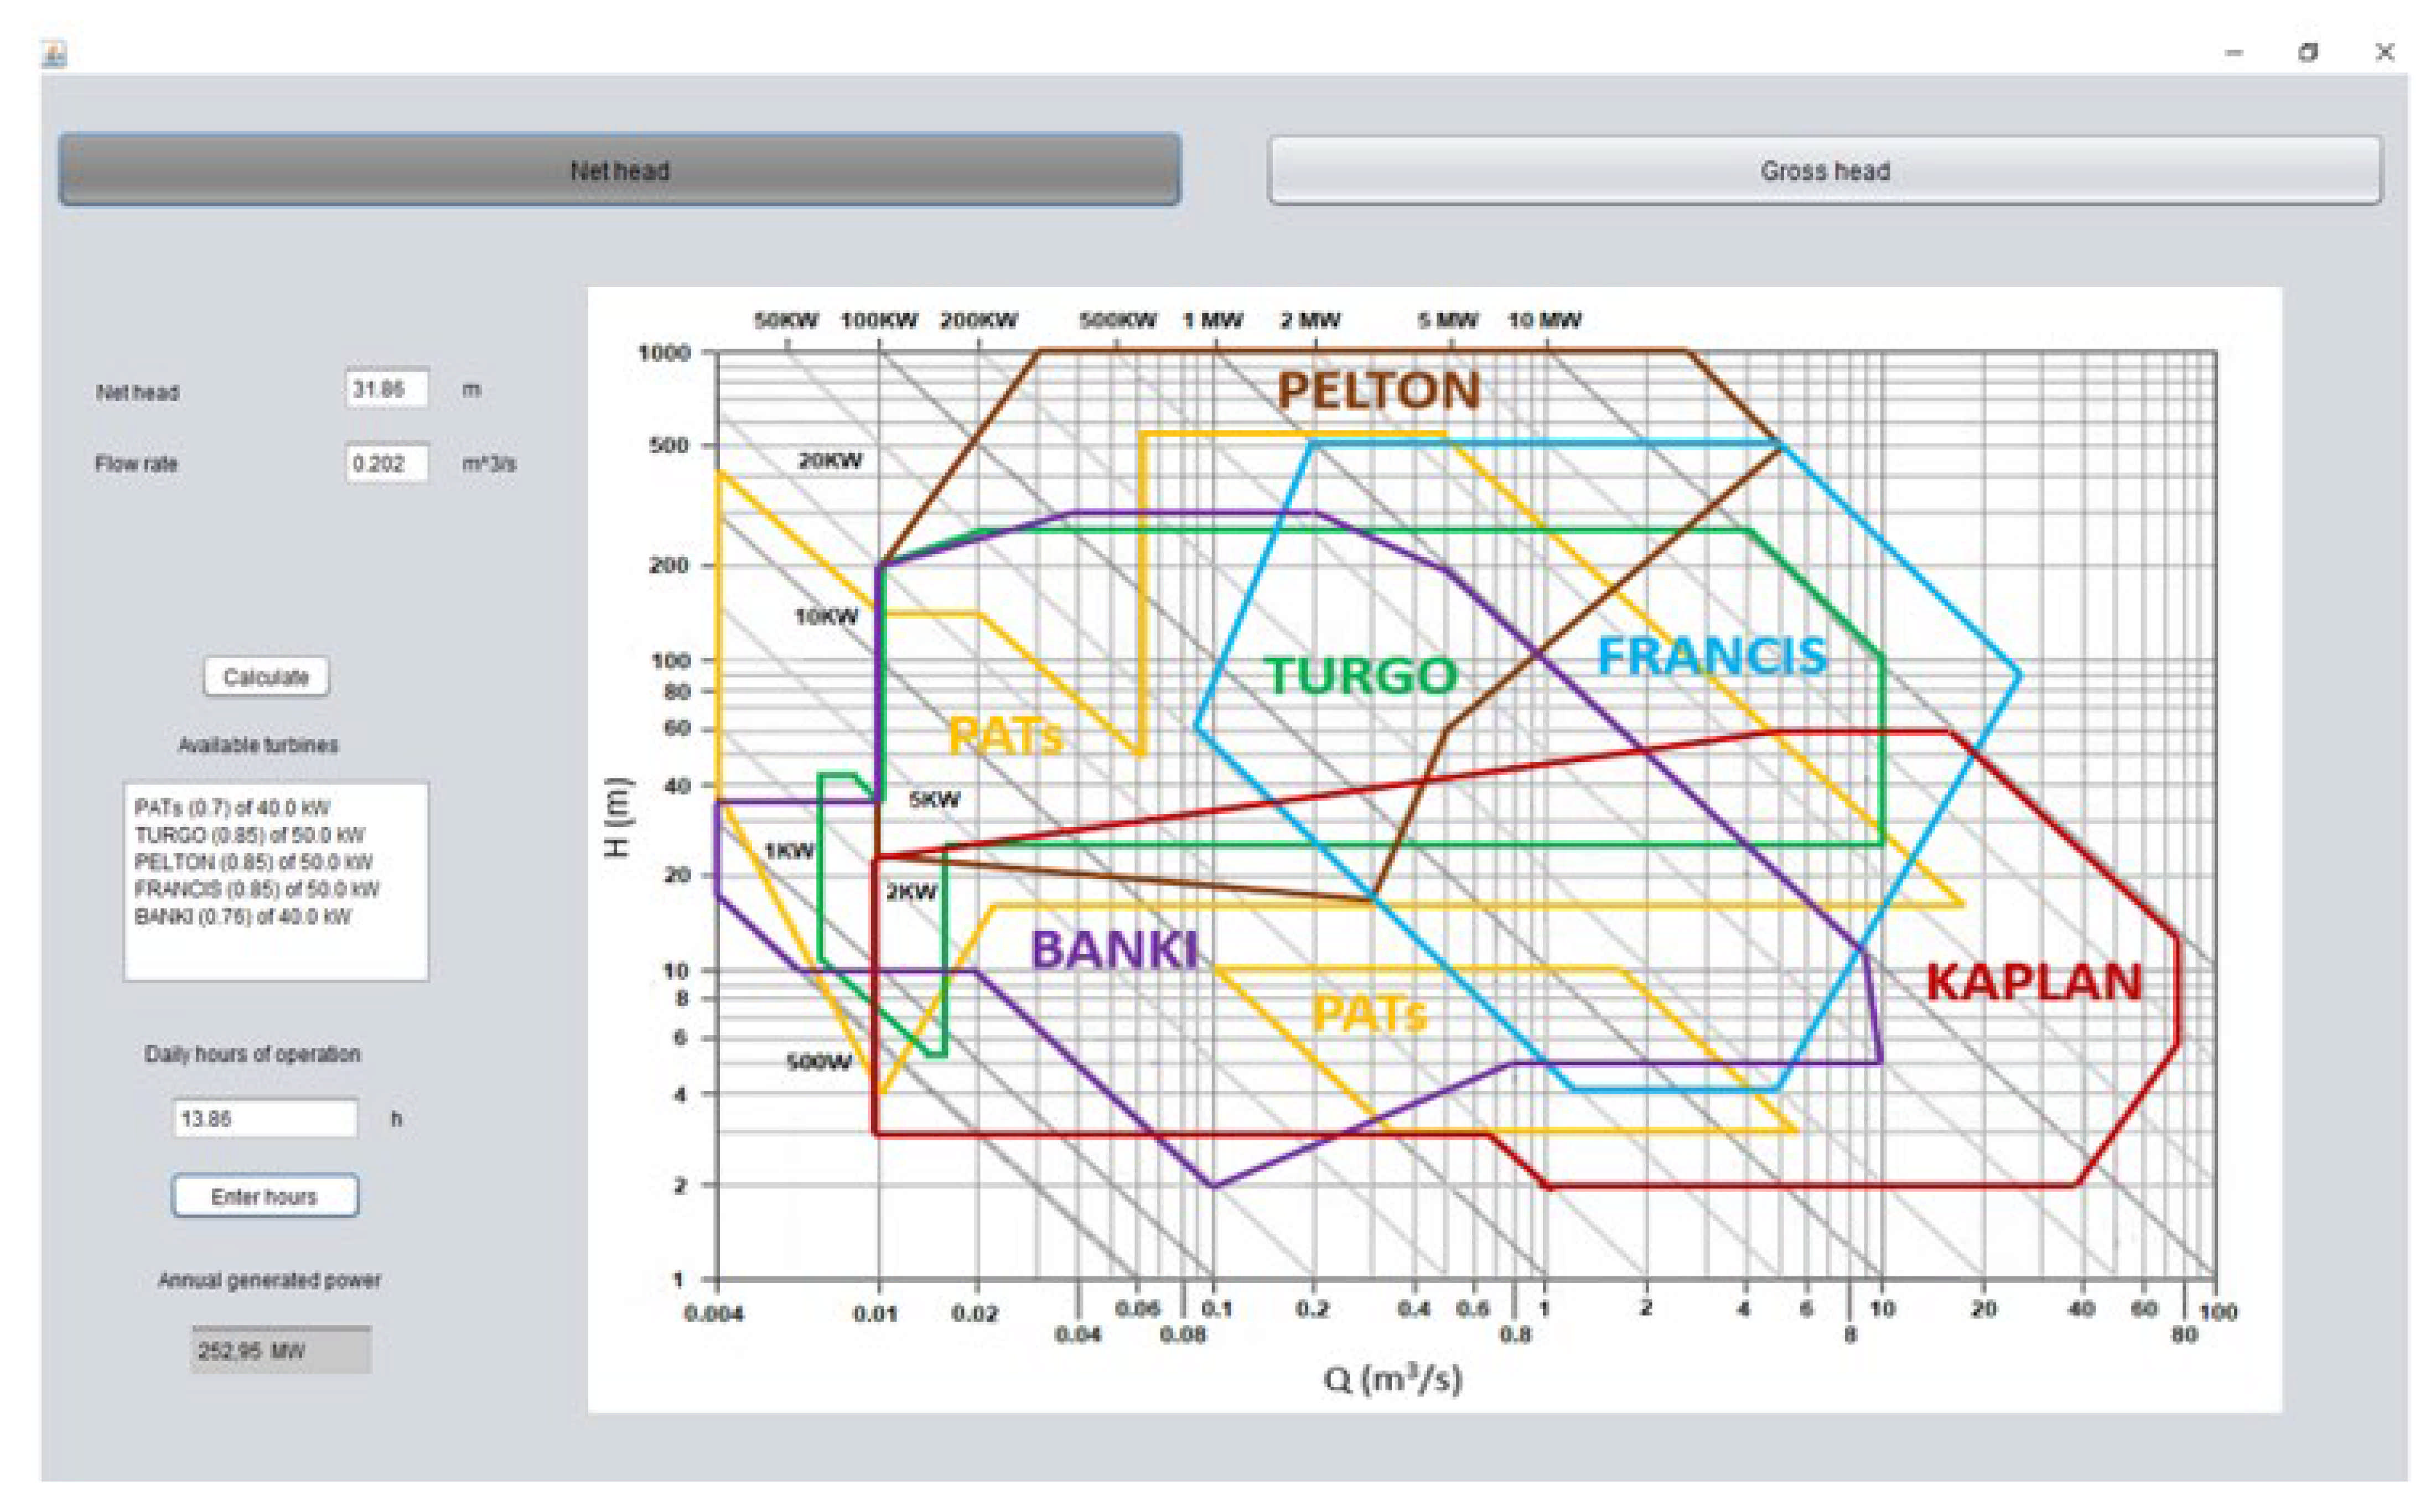
In this first case study, the water distribution system of the municipality of La Puebla de Guzmán (Huelva, southwestern Spain) is analyzed to find out the possibility of installing one turbine that can utilize the unused hydraulic energy in these facilities. In order to do this, the possibility of placing it in the wastewater treatment plant (WWTP), where one regulating valve is located at its inlet, will be studied [16]. For this case, we are going to use the net head (H), which is 31.86 m. The average flow rate at the inlet of the regulating valve is 220 L/s (Q). The power generated by the hydraulic machine is calculated as:
where Q is the flow rate that is transferred by the hydraulic machine, H is the net head, ŋ is the efficiency of the hydraulic machine (an average value of 85% is considered for Pelton, Francis, Kaplan, and Turgo turbines, 76% for the Banki turbine, and 70% for the pumps working as PAT turbines) [18,19,20,21,22], and ɣ is the specific weight of water (9810 N/m3). In our case, we are going to consider 85% efficiency because in the selected location we can place turbines that have 85% efficiency (Figure 1).
P = ɣ · ŋ · Q · H,
The turbine would be in operation 14 h a day throughout the year (5110 h). We consider that 1% of the annual time is for turbine maintenance; therefore, the hours in operation of the turbine annually would be 5058.9 h (13.86 h/day). The maximum usable energy would have to be calculated as:
Usable energy = annual hours × P,
Pregulating valve = 0.85 · 9810 (N/m3) · 0.220 (m3/s) · 31.86 (m) = 58,446.2 W.
As we can see in Figure 1, we would be between the 50 kW and 100 kW power turbines, and, in this case, a 50 kW turbine is selected. The reason for this is that the turbine can continue working if the operation schemes of the hydraulic network are different from the specified nominal values. Therefore, the maximum usable annual energy would be:
Annual energy = 5058.9 (h/year) · 50,000 (W) = 252,945 MWh/year.
Now, we enter the data in the application, and we obtain the window shown in Figure 3.
As we can see in Figure 3, we obtained the same results as previously mentioned. The computer program says that we can use five types of turbines with the efficiency of each one of them, which are PATs (70%), Turgo (85%), Pelton (85%), Francis (85%), and Banki (76%) [18,19,20,21,22]. These have a power of 50 kW, with the exception of PATs, which, due to their low efficiency, would be 40 kW. On the other hand, the program informs us that the annual power generated would be 252.95 MW.
Case study 2 (Aracena, Huelva) (net head):
In this second case study, the Aracena water supply system (Huelva, southwestern Spain) will be used. It has a supply reservoir from which the water is distributed to one regulation valve, for which its purpose is to regulate the drinking water flow requirements of this town [17]. For this case, we are going to use the net head (H), which is 50.81 m. The average flow rate (Q) at the inlet of the regulating valve is 15 L/s.
The turbine would be in operation 24 h a day throughout the year (8760 h). We consider that 1% of the annual time is for turbine maintenance; therefore, the hours in operation of the turbine annually would be 8672.4 h (23.76 h/day). In our case, we are going to consider 85% efficiency since, in the selected location, we can place turbines that have 85% efficiency (Figure 1). The maximum usable energy would have to be calculated as:
Pregulating valve = 0.85 · 9810 (N/m3) · 0.015 (m3/s) · 50,810 (m) = 6.36 kW.
As we can see in Figure 1, we would be between 6 kW and 7 kW of power, and, in this case, a 6 kW turbine is selected. The reason for this is that the turbine can continue working if the operation schemes of the hydraulic network are different from the specified nominal values. Therefore, the maximum usable annual energy would be:
Annual energy = 8672.4 (h/year) · 6000 (W) = 52.03 MWh/year.
Now, we enter the data in the application, and we obtain the following results shown in Figure 4:
As we can see in Figure 4, we obtained the same results as previously mentioned. The computer program says that we can use five types of turbines with the efficiency of each one of them, which are PATs (70%), Turgo (85%), Pelton (85%), and Banki (76%) [18,19,20,21,22]. These have a power of 6 kW, with the exception of PATs, which, due to their low efficiency, would be 5 kW. On the other hand, the program informs us that the annual power generated would be 52.03 MW.
Case study 3 (La Puebla de Guzmán, Huelva) (gross head):
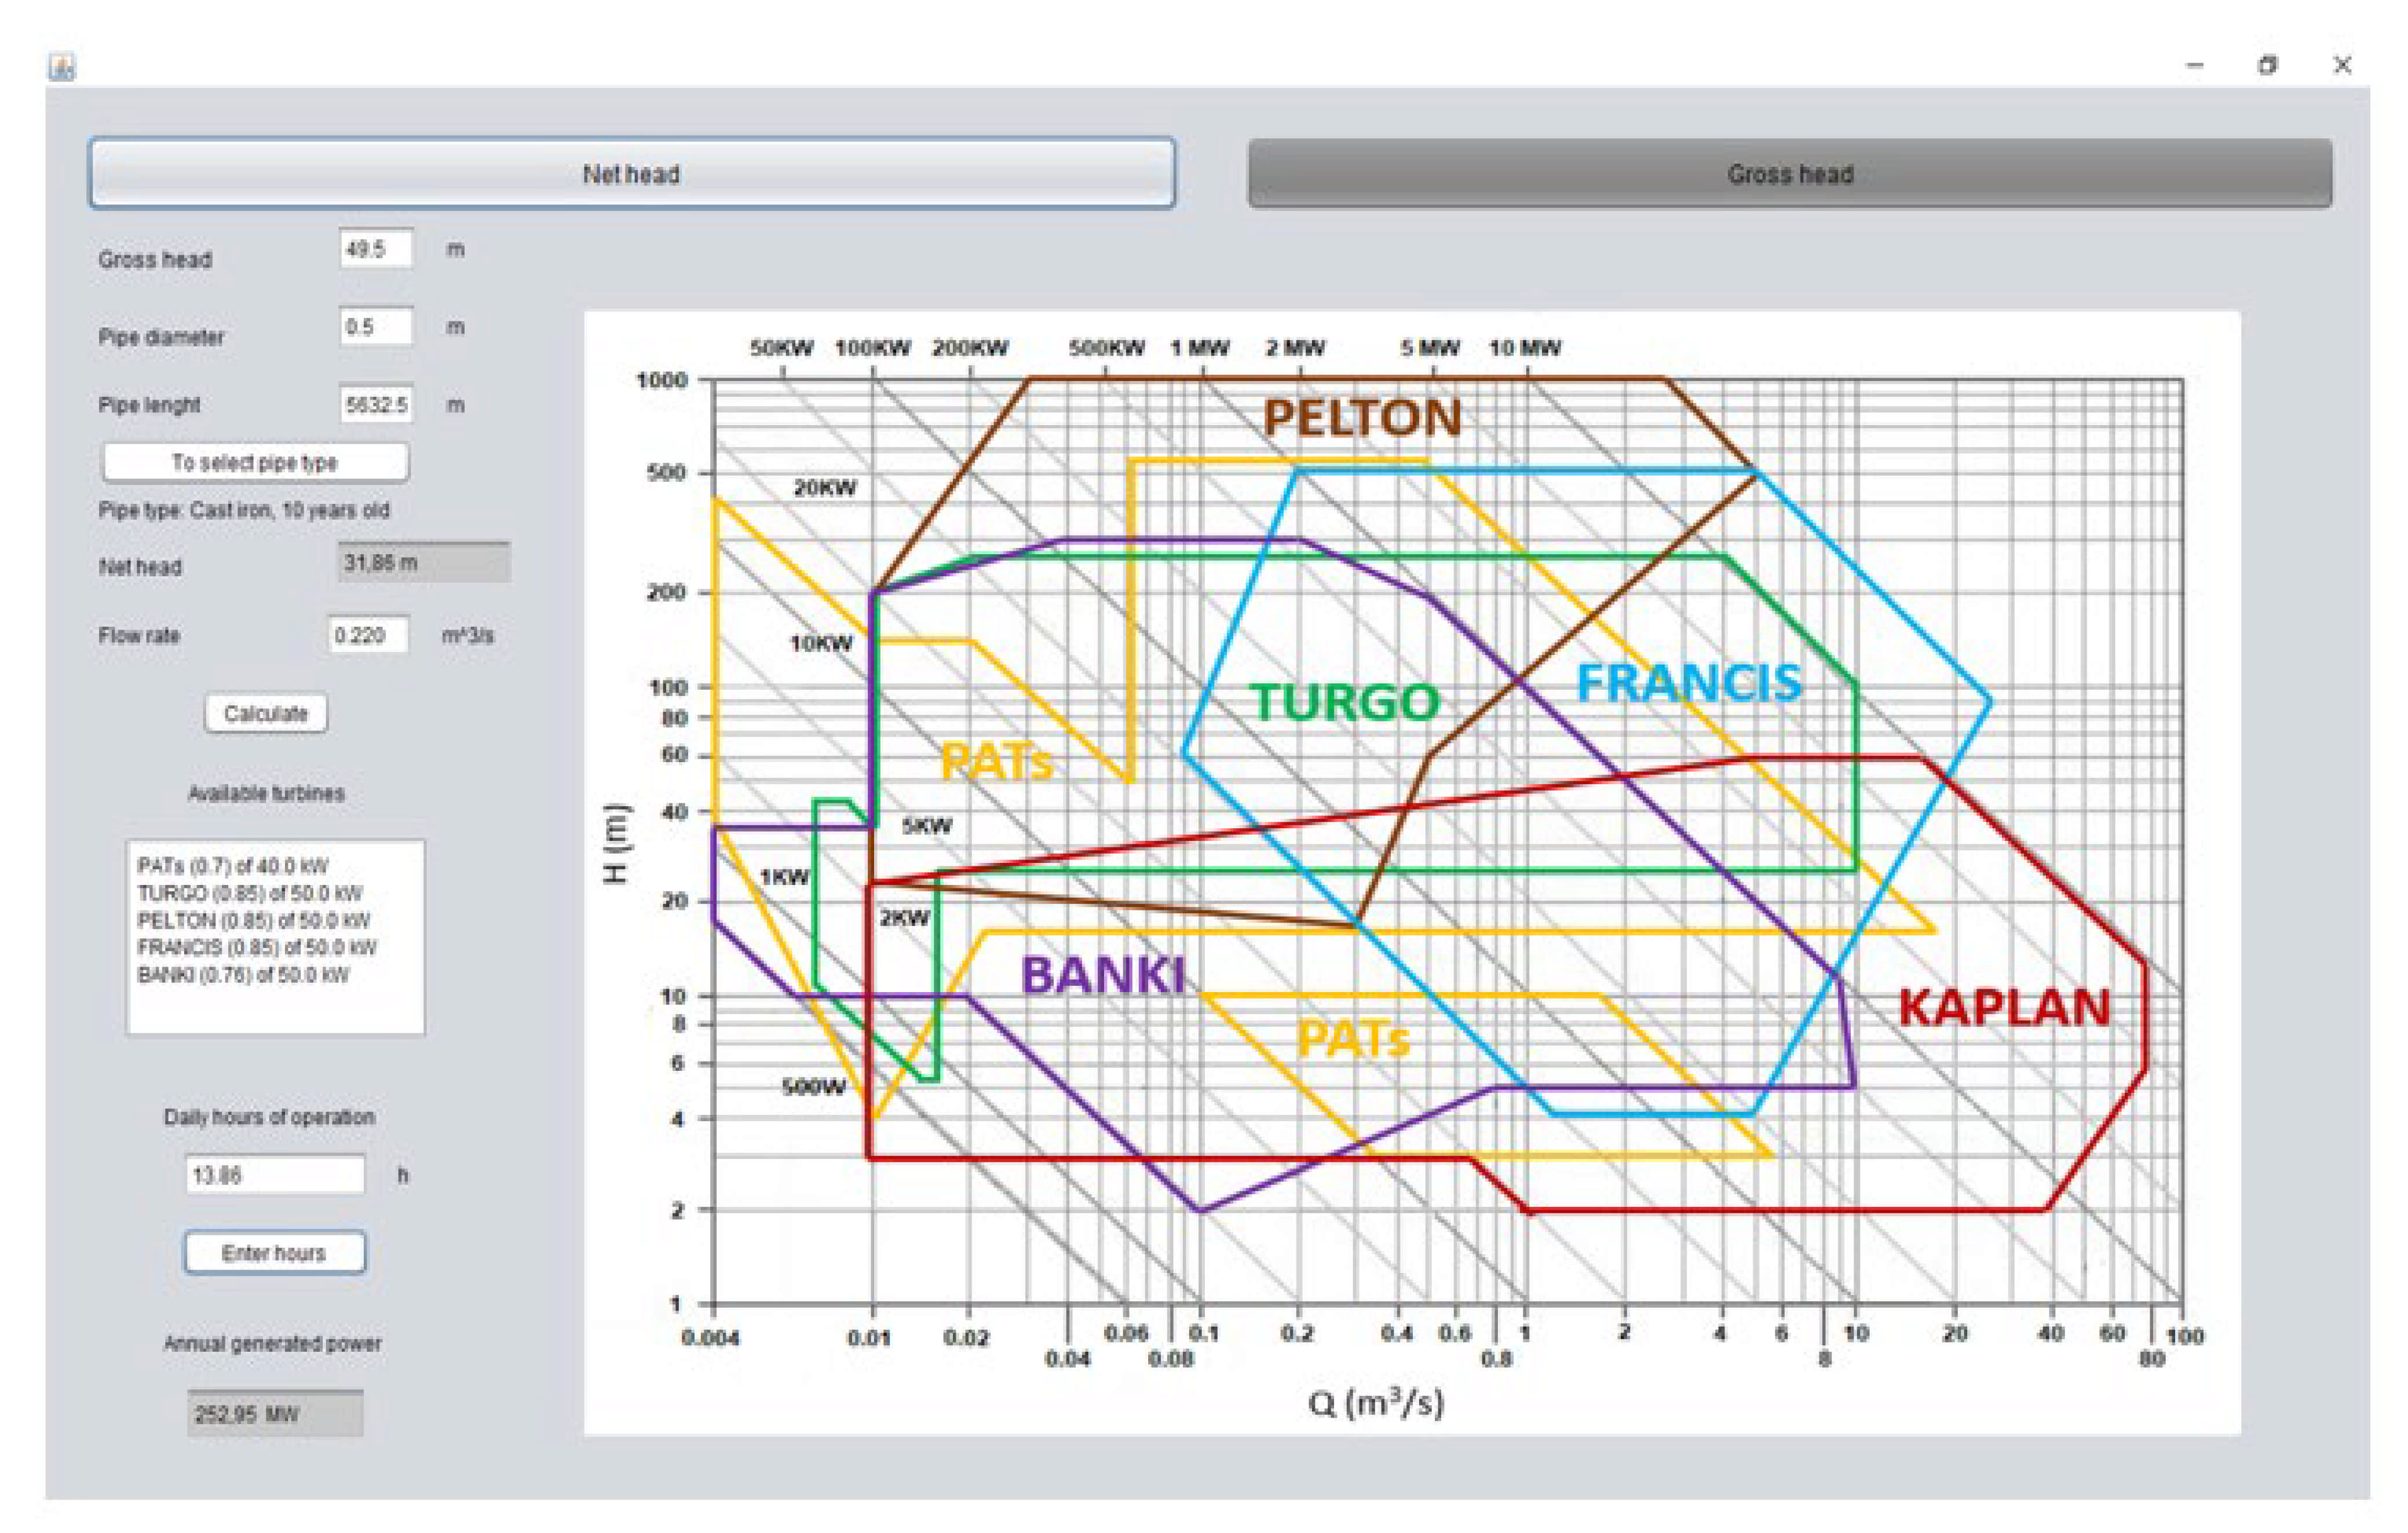
In this third case study, we will analyze the water distribution system of the municipality of La Puebla de Guzmán (Huelva, southwestern Spain) in order to find out the possibility of installing one turbine that can recovery the unused hydraulic energy in these facilities. In order to do this, the possibility of placing it in the wastewater treatment plant (WWTP), where one regulating valve is located at its entrance, will be studied [16]. The regulation reservoir from which it emerges in water by gravity is at a height of 236.4 m. From this point, the water is distributed through a pipeline with a 10-year-old cast iron pipe. This has a diameter of 500 mm to the regulating valve, located at the entrance to the WWTP at a height of 186.9 m. The average flow rate (Q) at the inlet of the regulating valve is 220 L/s, and the gross head (gross head = net head + hydraulic losses) is 49.50 m.
For a pipeline with diameter 0.5 m, length 5632.58 m, and 10-year-old cast iron pipe, a C coefficient of the Hazen-Williams equation of 110 is considered, and the hydraulic losses (Hf) can be calculated as:
H = 49.50 (m) − 17.64 (m) = 31.86 m.
The turbine would be in operation 14 h a day throughout the year (5110 h). We consider that 1% of the annual time is for turbine maintenance; therefore, the hours in operation that the turbine is annually is 5058.9 h (13.86 h/day). In our case, we are going to consider 85% efficiency since, in the selected location, we can place turbines that have 85% efficiency (Figure 1). The maximum usable energy would have to be calculated as:
Usable energy = annual hours × P,
Pregulating valve = 0.85 · 9810 (N/m3) · 0.220 (m3/s) · 31.86 (m) = 58,446.2 W.
As we can see in Figure 1, we would be between the 50 kW and 100 kW power turbines, and, in this case, a 50 kW turbine is selected. The reason for this is that the turbine can continue working if the operation schemes of the hydraulic network are different from the specified nominal values. Therefore, the maximum usable annual energy would be:
Annual energy = 5058.9 (h/year) · 50,000 (W) = 252,945 MWh/year.
Now, we enter the data in the application, and we obtain the following results showed in Figure 5:
As we can see in Figure 5, we obtained the same results as previously mentioned. The computer program says that we can use five types of turbines with the efficiency of each one of them, which are PATs (70%), Turgo (85%), Pelton (85%), Francis (85%), and Banki (76%) [18,19,20,21,22]. These have a power of 50 kW, with the exception of PATs, which, due to their low efficiency, would be 40 kW. On the other hand, the program informs us that the annual power generated would be 252.95 MW.
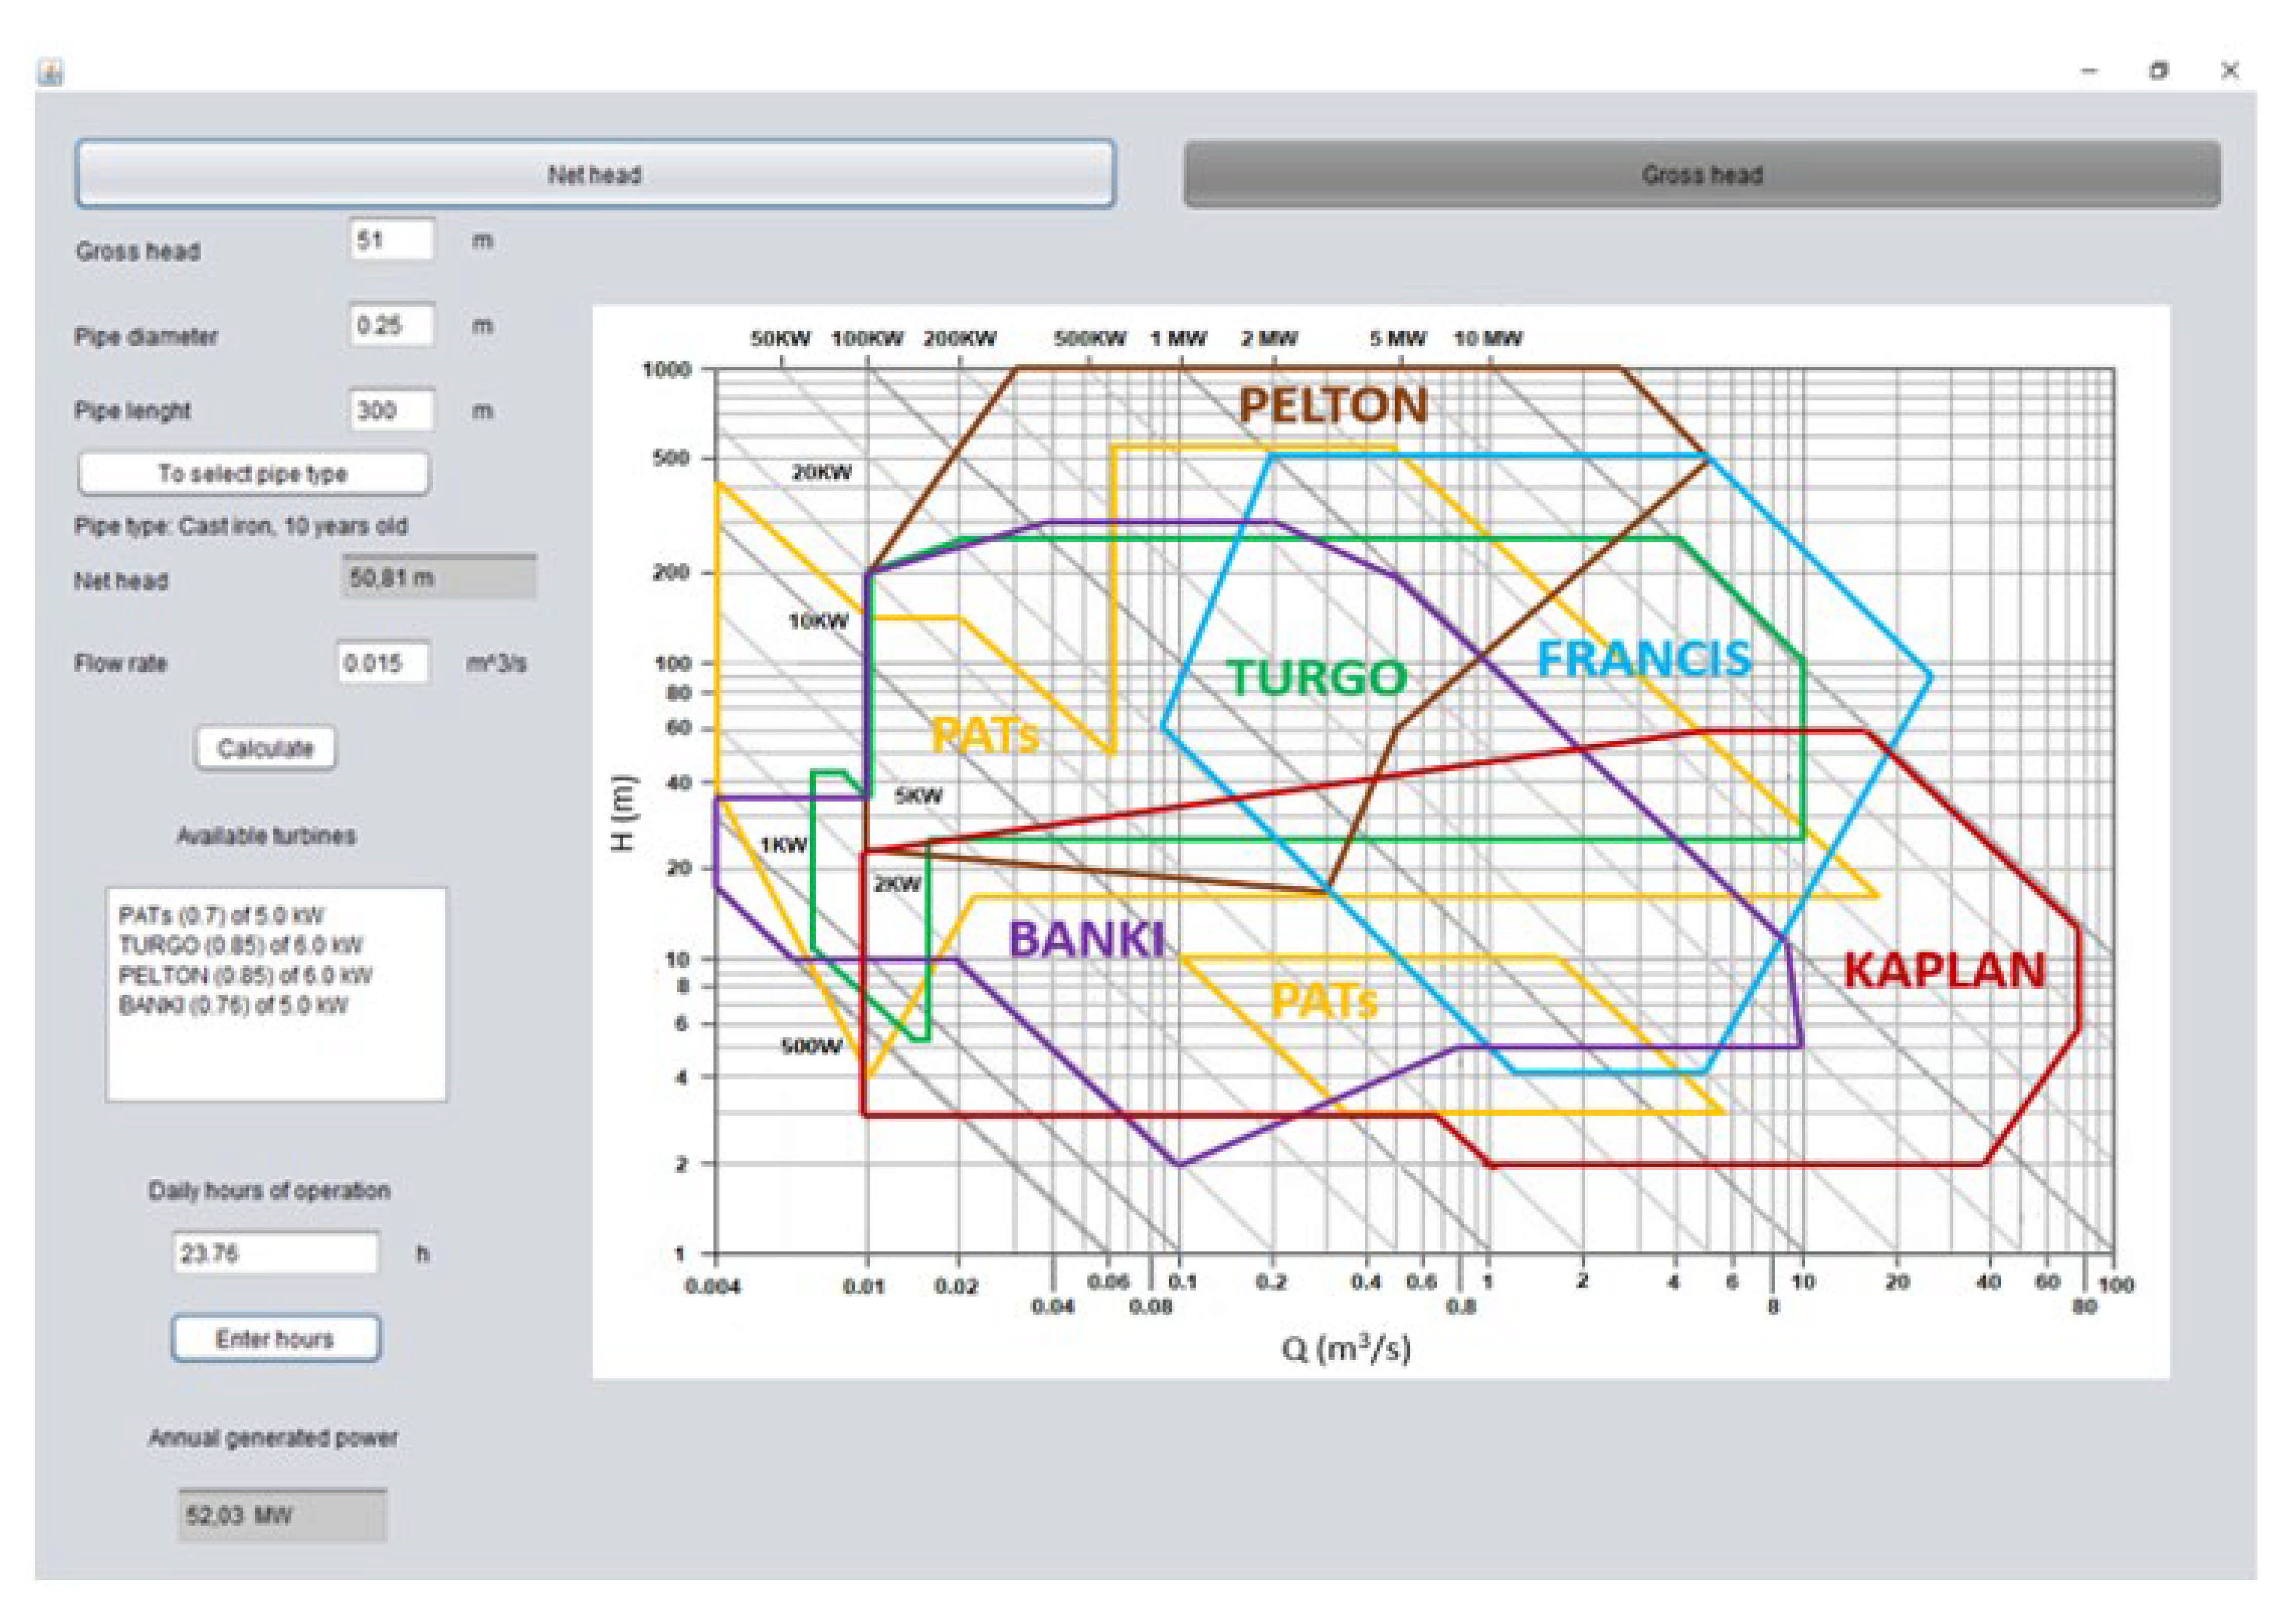
Case study 4 (Aracena, Huelva) (gross head):
In this second case study, the Aracena (Huelva, southwestern Spain) water supply system will be used. It has a supply reservoir at an altitude of 715 m. From this, the water is distributed through a 250 mm diameter cast iron pipe (pipe length is 300 m) to the regulation valve, located at a height of 664 m. The purpose of this is to regulate the drinking water flow requirements of this area [17]. The average flow (Q) at the inlet of the regulation valve is 15 L/s, and the gross head is 51 m. The Aracena regulation valve is a pressure reducing valve with an external pilot. The pipe is made of 250 mm cast iron and is 10 years old.
For 10-year-old cast iron pipe, a C coefficient of the Hazen-Williams equation of 110 is considered, and the head loss (Hf) can be calculated as:
H = 51(m) − 0.190 (m) = 50,810 m.
The turbine would be in operation 24 h a day throughout the year (8760 h). We consider that 1% of the annual time is for turbine maintenance; therefore, the hours in operation of the turbine annually would be 8672.4 h (23.76 h/day). In our case, we are going to consider 85% efficiency since, in the selected location, we can place turbines that have 85% efficiency (Figure 1). The maximum usable energy would have to be calculated as:
Pregulating valve = 0.85 · 9810 (N/m3) · 0.015 (m3/s) · 50,810 (m) = 6.36 kW.
As we can see in Figure 1, we would be between 6 kW and 7 kW power turbines, and, in this case, a 6 kW turbine is selected. The reason for this is that the turbine can continue working if the operation schemes of the hydraulic network are different from the specified nominal values. Therefore, the maximum usable annual energy would be:
Annual energy = 8672.4 (h/year) · 6000 (W) = 52.03 MWh/year.
Now, we enter the data in the application, and we obtain the following results:
As we can see in Figure 6, we obtained the same results as previously mentioned. The computer program says that we can use five types of turbines with the efficiency of each one of them, which are PATs (70%), Turgo (85%), Pelton (85%), and Banki (76%) [18,19,20,21,22]. These have a power of 6 kW, with the exception of PATs, which, due to their low efficiency, would be 5 kW. On the other hand, they are informed that the annual power generated would be 52.03 MW.
4. Conclusions
A computer program has been designed and developed to help make decisions for the selection of turbines to be installed in pressurized water distribution systems. The purpose of this is to make use of unused hydraulic energy. This expert system integrates one net head-flow rate graph. This is elaborated from commercial turbines and PATs, which facilitates the selection of the optimal hydraulic machine based on the hydraulic requirements of the installation under study. The gross head or the net head in the hydraulic network can be entered as starting data, as well as the flow rate that circulates through the pipe network. Similarly, other output data from the program developed is the estimation of the annual energy generated by the hydraulic machine, which will make it possible, in future projects, to determine the profitability of the investment. Consequently, this will propose the feasibility of installation and execution.
Author Contributions
Conceptualization and methodology: A.M.R.-P. and I.P.-C.; validation, formal analysis, and investigation: A.M.R.-P., I.P.-C., and P.C.-R.; software: A.M.R.-P. and P.C.-R.; writing—original draft preparation: A.M.R.-P. and P.C.-R.; writing—review and supervision: I.P.-C. All authors have read and agreed to the published version of the manuscript.
Funding
This research received no external funding.
Institutional Review Board Statement
Not applicable.
Informed Consent Statement
Not applicable.
Data Availability Statement
Data is contained within the article.
Acknowledgments
The authors would like to thank Deryck Barker Fraser for the translation of the manuscript.
Conflicts of Interest
The authors declare no conflict of interest.
References
- European Commission. A Strategic Framework on Climate and Energy for the Period 2020–2030. In Communication from the Commission to the European Parliament, the Council, the European Economic and Social Committee and the Committee of the Regions; European Commission: Brussels, Belgium, 2014. [Google Scholar]
- Nogueira-Vilanova, M.R.; Perrella-Balestieri, J.A. Energy and hydraulic efficiency in conventional water supply systems. Renew. Sustain. Energy Rev. 2014, 30, 701–714. [Google Scholar] [CrossRef]
- Fecarotta, O.; Mc Nabola, A. Optimal location of pumps as turbines (PATs) in water distribution networks to recover energy and reduce leakage. Water Resour. Manag. 2017, 31, 5043–5059. [Google Scholar] [CrossRef]
- Creaco, E.; Campisano, A.; Fontana, N.; Marini, G.; Page, P.R.; Walski, T. Real time control of water distribution networks: A state-of-the-art review. Water Research 2019, 161, 517–530. [Google Scholar] [CrossRef] [PubMed]
- Fontana, N.; Giugni, M.; Marini, G.; Zollo, R. Operation of a prototype for real time control of pressure and hydropower generation in water distribution networks. Water Resour. Manag. 2019, 33, 697–712. [Google Scholar] [CrossRef]
- Fernández-García, I.; Mc Nabola, A. Maximizing hydropower generation in gravity water distribution networks: Determining the optimal location and number of pumps as turbines. J. Water Resour. Plan. Manag. 2020, 146, 04019066. [Google Scholar] [CrossRef]
- Creaco, E.; Galuppini, G.; Campisano, A.; Ciaponi, C.; Pezzinga, G. A bi-objective for optimizing the installation of PATs in systems of transmission mains. Water 2020, 12, 330. [Google Scholar] [CrossRef] [Green Version]
- Lof, P.-A.K.; Gertmar, L.G.I.; Andren, L.A.T. System, Method and Computer Program Product for Enhancing Commercial Value of Electrical Power Produced from a Renewable Energy Power Production Facility. U.S. Patent No 6512966, 28 January 2003. [Google Scholar]
- Ai, B.; Yang, H.; Shen, H.; Liao, X. Computer-aided design of PV/wind hybrid system. Renew. Energy 2003, 28, 1491–1512. [Google Scholar] [CrossRef]
- Mirauda, D.; Erra, U.; Agatiello, R.; Cerverizzo, M. Applications of mobile augmented reality to water resources management. Water 2017, 9, 699. [Google Scholar] [CrossRef] [Green Version]
- Connolly, D.; Lund, H.; Mathiesen, B.V.; Leahy, M. A review of computer tools for analysing the integration of renewable energy into various energy systems. Appl. Energy 2010, 87, 1059–1082. [Google Scholar] [CrossRef]
- Pardo, M.A.; Riquelme, A.J.; Jodar-Abellan, A.; Melgarejo, J. Water and energy demand management in pressurized irrigation networks. Water 2020, 12, 1878. [Google Scholar] [CrossRef]
- Nasser, A.A.; Rashad, M.Z.; Hussein, S.E. A Two-Layer Water Demand Prediction System in Urban Areas Based on Micro-Services and LSTM Neural Networks. IEEE Access 2020, 8, 147647–147661. [Google Scholar] [CrossRef]
- Berg, G.; Julian, W.; Mines, R.; Richman, F. The constructive Jordan curve theorem. Rocky Mt. J. Math. 2010, 5, 225–236. [Google Scholar] [CrossRef]
- Hales, T.C. Jordan’s proof of the Jordan curve theorem. Stud. Logic Gramm. Rhetor. 2007, 10, 45–60. [Google Scholar]
- Rodríguez-Pérez, A.M.; Pulido-Calvo, I. Analysis and viability of microturbines in hydraulic networks: A case study. J. Water Supply Res. Technol. 2019, 68, 474–482. [Google Scholar] [CrossRef]
- Rodríguez-Pérez, A.M.; Pérez-Calañas, C.; Pulido-Calvo, I. Selección de la Localización y el Tipo de Microturbinas en Redes Hidráulicas a Presión. In VI Jornadas de Ingeniería del Agua; Universidad de Castilla-La Mancha: Toledo, Spain, 2019; pp. 553–556. [Google Scholar]
- Quaranta, E.; Bonjean, M.; Cuvato, D.; Nicolet, C.; Dreyer, M.; Gaspoz, A.; Rey-Mermet, S.; Boulicaut, B.; Pratalata, L.; Pinelli, M.; et al. Hydropower case study collection: Innovative low head and ecologically improved turbines, hydropower in existing infrastructures, hydropeaking reduction, digitalization and governing systems. Sustainability 2020, 12, 8873. [Google Scholar] [CrossRef]
- Hasmatuchi, V.; Bosioc, A.I.; Luisier, S.; Münch-Alligné, C. A dynamic approach for faster performance measurements on hydraulic turbomachinery model testing. Appl. Sci. 2018, 8, 1426. [Google Scholar] [CrossRef] [Green Version]
- Postacchini, M.; Darvini, G.; Finizio, F.; Pelagalli, L.; Soldini, L.; Di Giuseppe, E. Hydropower generation through pump as turbine: Experimental study and potential application to small-scale WDN. Water 2020, 12, 958. [Google Scholar] [CrossRef] [Green Version]
- Pérez-Sánchez, M.; Sánchez-Romero, F.J.; Ramos, H.M.; López-Jiménez, P.A. Energy recovery in existing water networks: Towards greater sustainability. Water 2017, 9, 97. [Google Scholar] [CrossRef] [Green Version]
- Sinagra, M.; Aricò, C.; Tucciarelli, T.; Morreale, G. Experimental and numerical analysis of a backpressure Banki inline turbine for pressure regulation and energy production. Renew. Energy 2020, 149, 980–986. [Google Scholar] [CrossRef]
Figure 1.
Diagram net head (H)-flow rate (Q) for the selection of turbines and PATs (Pumps as Turbines) according to operation requirements.
Figure 1.
Diagram net head (H)-flow rate (Q) for the selection of turbines and PATs (Pumps as Turbines) according to operation requirements.

Figure 2.
(A) Flowchart that describes the steps of the computer program developed. (B) Flowchart that describes the steps of the computer program developed.
Figure 2.
(A) Flowchart that describes the steps of the computer program developed. (B) Flowchart that describes the steps of the computer program developed.


Figure 3.
Main window of the computer application developed: results of case study 1.

Figure 4.
Main window of the computer application developed: results of case study 2.

Figure 5.
Main window of the computer application developed: results of case study 3.

Figure 6.
Main window of the computer application developed: results of case study 4.

Publisher’s Note: MDPI stays neutral with regard to jurisdictional claims in published maps and institutional affiliations. |
© 2021 by the authors. Licensee MDPI, Basel, Switzerland. This article is an open access article distributed under the terms and conditions of the Creative Commons Attribution (CC BY) license (http://creativecommons.org/licenses/by/4.0/).
Share and Cite
MDPI and ACS Style
Rodríguez-Pérez, Á.M.; Pulido-Calvo, I.; Cáceres-Ramos, P. A Computer Program to Support the Selection of Turbines to Recover Unused Energy at Hydraulic Networks. Water 2021, 13, 467. https://doi.org/10.3390/w13040467
AMA Style
Rodríguez-Pérez ÁM, Pulido-Calvo I, Cáceres-Ramos P. A Computer Program to Support the Selection of Turbines to Recover Unused Energy at Hydraulic Networks. Water. 2021; 13(4):467. https://doi.org/10.3390/w13040467
Chicago/Turabian StyleRodríguez-Pérez, Ángel Mariano, Inmaculada Pulido-Calvo, and Pablo Cáceres-Ramos. 2021. "A Computer Program to Support the Selection of Turbines to Recover Unused Energy at Hydraulic Networks" Water 13, no. 4: 467. https://doi.org/10.3390/w13040467
Note that from the first issue of 2016, this journal uses article numbers instead of page numbers. See further details here.