
An Overview of Flood Risk Analysis Methods


1
Department of Meteorology and Hydrology, Faculty of Geography, University of Bucharest, Bd. Nicolae Bălcescu No 1, 1st District, 010041 Bucharest, Romania
2
Centre for Integrated Analysis and Territorial Management, University of Bucharest, 010041 Bucharest, Romania
3
National Institute of Hydrology and Water Management, București-Ploiești Road, 97E, 1st District, 013686 Bucharest, Romania
4
Research Institute of the University of Bucharest, 90-92 Sos. Panduri, 5th District, 050663 Bucharest, Romania
5
Simion Mehedinți–Nature and Sustainable Development Doctoral School, University of Bucharest, 010041 Bucharest, Romania
*
Author to whom correspondence should be addressed.
Water 2021, 13(4), 474; https://doi.org/10.3390/w13040474
Submission received: 23 January 2021
/
Revised: 5 February 2021
/
Accepted: 8 February 2021
/
Published: 11 February 2021
(This article belongs to the Special Issue Flash-Flood Susceptibility, Forecast and Warning)
Abstract
:Scientific papers present a wide range of methods of flood analysis and forecasting. Floods are a phenomenon with significant socio-economic implications, for which many researchers try to identify the most appropriate methodologies to analyze their temporal and spatial development. This research aims to create an overview of flood analysis and forecasting methods. The study is based on the need to select and group papers into well-defined methodological categories. The article provides an overview of recent developments in the analysis of flood methodologies and shows current research directions based on this overview. The study was performed taking into account the information included in the Web of Science Core Collection, which brought together 1326 articles. The research concludes with a discussion on the relevance, ease of application, and usefulness of the methodologies.

1. Introduction
Floods represent a natural phenomenon that annually generates significant economic and human losses [1,2,3]. Researchers’ constant concern is the risk of floods to which the population is exposed. Various scientific methods can determine the magnitude and impact of floods. The large variety of these methods provided, the wide range of primary data used, the computer methods of processing, and spatial representation lead to identifying an optimal approach or methodologies for the researched area’s specific conditions.
Hydraulic models (from 1D to 3D) are the most used method worldwide to generate flood maps for different return periods. The values of maximum flow and water layer thickness are the primary input information for any of these models. In this regard, several high-performance widely used models have been developed: the Hydrologic Engineering Center’s (HEC) River Analysis System model from the US Army Corps of Engineer HEC; the MIKE 11 hydraulic model, developed at the Danish Hydraulic Institute; or the MIKE 21, modeling the FLO 2D model for 2D models. In this regard, the following works can be mentioned [4,5,6,7,8,9].
A very important increase in interest was represented by the number of research papers that approached the flood susceptibility estimation using bivariate statistics and machine learning models. This domain is in continuous development and includes scientific works from [10,11,12,13,14,15].
However, some risk assessment research assessing the potential damage caused by floods produces flood maps combined with social and economic spatial data. This economic assessment of losses involves many parameters, some very subjective, that interact in a complex and non-linear way [16,17,18,19].
A current trend in research and hydrological models includes real-time flood economic losses. The estimates are based on geospatial data to delineate the areas and targets affected by floods [18,20,21,22]. This article aims to present current flood analysis methods, highlighting the methodologies used, the research areas, the progress made in this field, and the accessibility of information. Highlighting the current research directions and the most important methods helps to select an optimal research method quickly and can also help in pointing out the major gaps that should be addressed in future studies.
2. Materials and Methods
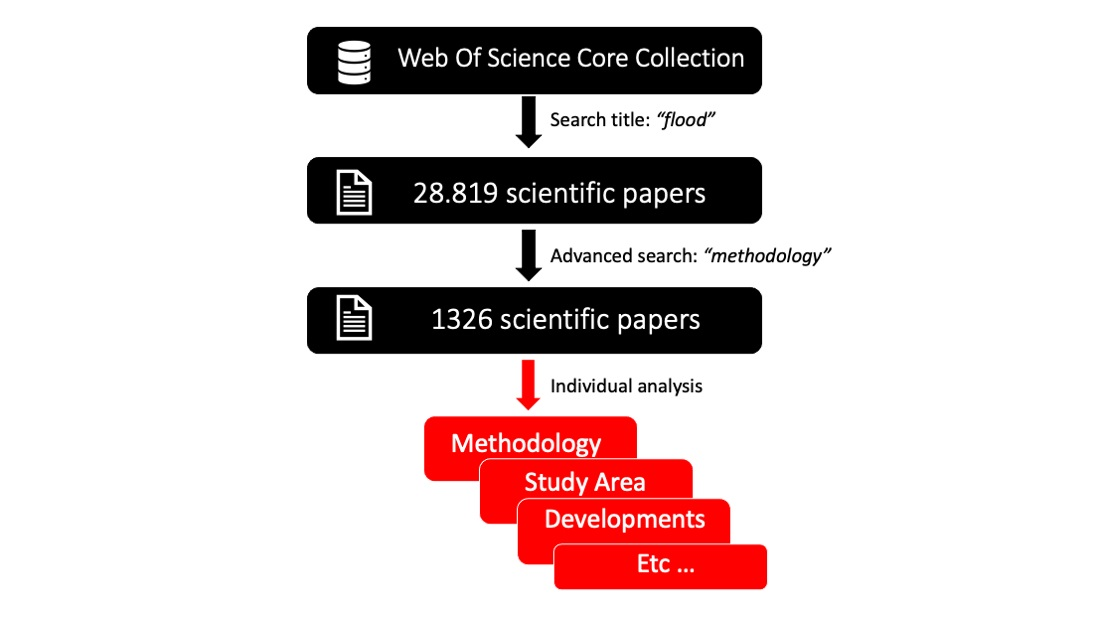
The analysis is focused exclusively on the works that researchers have published in scientific articles, using the Web of Science Core Collection database until 1 October 2020. Articles containing TITLE-ABS-KEY (flood *) were searched, and finally, 28,819 research works that addressed various aspects of floods were identified. Further, a “Refine Results” filter was applied with the term (methodology *), and only 1694 papers remained for the future analysis. An additional analysis of the papers showed us that 368 articles did not meet the research requirements, because they were included in other research fields (biology, chemistry, computer science). Thus, the number of analyzed articles was reduced to 1326.
A scan of the resulting titles indicated that they generally corresponded to the proposed objective of analyzing the types of methodologies used in flood research. They are analyzed in the next stage, for which the selected articles were reviewed individually to keep only those that referred to the goal of our study (for example, topics such as the effects of floods on flora and fauna were eliminated).The articles were classified based on the main topics presented in their abstracts. They were then revised and combined with articles on similar topics. This was an iterative process, with abstracts revised several times to ensure that the articles were adequately selected according to the proposed objective criteria.
The analysis presents the papers identified based on our search criteria. The Web of Science Core Collection database was chosen for the quality of the publications and their impact in the development of research, regardless of the research field. The analysis showed that most researchers prefer English, but some papers were written in Spanish and French. Still, the number of publications written in these two languages was rather low. Thus, our search may have omitted papers that could contribute to the methodological development of flood assessment because they were not explicitly identified within our selection method.
3. Results
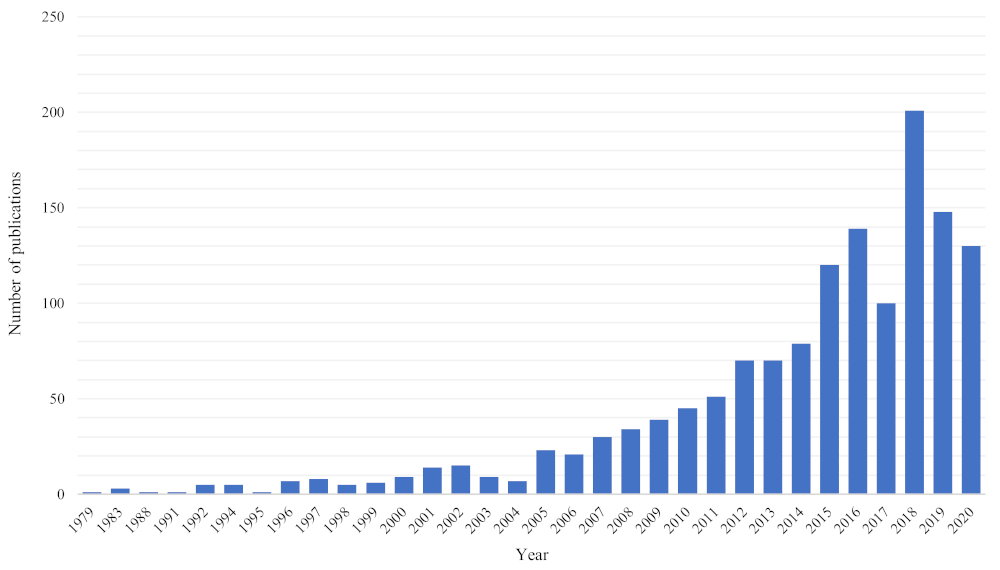
The selected papers were published between 1979 and 2020 (Figure 1). It is worth noting the increase in the number of publications after the year 2000. In the last decade, researchers managed to publish up to 201 papers per year, with a mean of 115 papers/year, and with the lowest number of 45 papers in 2010.
Due to their important negative effects, floods and their impact on society represent a priority in the work of researchers today. The Web of Sciences database revealed that over 1326 research papers mainly focused on this topic (Figure 1). Analyzing the distribution of papers within the Web of Science database, around 52.18% were located in the field of water resources, 26.97% in the multidisciplinary geosciences, 22.66% in the environmental sciences, 17.82% in civil engineering, 14.93 % in meteorology and the atmospheric sciences, 7.91% in environmental studies, and 4.3% in environmental engineering and remote sensing. The top ten domains ended with 3.71% in physical geography and 3.54% in geography.
Various institutions funded over 53% of the research. The institution with the largest number of published articles is currently the National Natural Science Foundation of China (NSFC), with 78 articles analyzed in our study, representing 4.60%. The Engineering Physical Sciences Research Council (EPSRC), the European Union (EU), and the Natural Environment Research Council (NERC) were identified with 44 published papers (2.59%). The National Science Foundation (NSF) had 30 articles (1.77%), the Natural Sciences and Engineering Research Council of Canada had 23 articles (1.35%), and the Spanish Government had 19 articles (1.12%). The European Commission Joint Research Center and the Federal Ministry of Education Research (BMBF) had 15 articles each (0.88%), closely followed by the Coordination for the Improvement of Higher Education Personnel (CAPES) and the Ministry of Education, Culture, Sports, Science, and Technology (MEXT) of Japan with 14 articles (0.82%). The China Scholarship Council, the Fundamental Research Funds for the Central Universities, and the Portuguese Foundation for Science and Technology followed with 13 articles (0.76%).
With a number between 11 (0.64%) and 7 articles (0.41%), we identified the National Council for Scientific and Technological Development (CNPQ), National Key Research and Development Program of China, Ministry Of Science and Technology Taiwan, National Key R&D Program of China, Spanish Ministry of Economy and Competitiveness, French National Research Agency (ANR), Ministry of Education, University and Research (MIUR) Research, National Basic Research Program of China, Australian Government, Interinstitutional Council Of Science and Technology (CICYT ), and Department for Environment Food Rural Affairs (DEFRA). The Chinese organizations had the highest number of articles on this topic, followed by Europe and the United States.
The most prolific authors were as follows: Bates, Paul with 21 articles (1.23%); Beven, John Keith with 17 articles (0.99%); Karamouz, Mohammad with 16 articles (0.94%); Hall, Jim W. with 13 articles (0.76%); Djordjević, Slobodan with 12 items (0.708%); Di Baldassarre, Giuliano, Ouarda, Taha, and Pappenberger, Florian with 11 items (0.64%), Borga Marco and Simonovic Slobodan P. with 10 items (0.59%), Bodoque, Jose Maria with 9 papers (0.53%), Herrero, Andrés Díez, Gouldby, Ben, Mediero, Luis, and Ping-an Zhong with 8 papers (0.47%), and Benito, Gerardo, Bobée, B., Chen, AS., Dottori, Francesco, Hong Yang, Jongman, Brenden, and Leandro, Jorge with 7 articles (0.41%) each.
The top journals that included the most published papers indicated both an interest in the topic and the prestige of the publishers and reviewers concerned with increasing the quality of published articles. On 1 October 2020, 104 articles (6.13%) relevant to our research were published. The following journals had the most published papers: Natural Hazards had 94 papers (5.54%), Natural Hazards and Earth System Sciences 66 articles (3.89%), Journal of Flood Risk Management 65 articles (3.83%), Water 61 articles (3.60%), Water Resources Research had 50 articles (2.9%), Disaster Prevention and Management 38 articles (2.24%), Hydrology and Earth System Sciences 32 articles (1.889%), Hydrological Processes 30 articles (1.77%), Science of the Total Environment 28 articles (1.65%), Journal of Hydrologic Engineering 27 papers (1.59%), Hydrological Sciences Journal (Journal Des Sciences Hydrologiques) and Water Resources Management 25 articles each (1.476%), International Journal of Disaster Resilience in the Built Environment and Sustainability 21 articles (1.24%), Remote Sensing 20 articles (1.18%), Houille Blanche Revue Internationale de L’Eau and Stochastic Environmental Research and Risk Assessment 18 articles each (1.06%), Environmental Earth Sciences and International Journal of Disaster Risk Reduction 14 articles each (0.82%), Advances in Water Resources and Water Science and Technology 13 articles each (0.76%), and, last but not least, Proceedings Of The Institution Of Civil Engineers Water Management 12 papers (0.70%) and International Journal Of Climate Change Strategies And Management and Journal Of Coastal Research 11 articles each (0.64%).
Generally, the authors were affiliated with university centers, but there were also situations when they were part of institutes or private hydrological research companies. The following affiliations were prominent: the University of Bristol had a total of 35 articles (2.06%); the Delft University of Technology had 32 articles (1.88%); the University of Exeter had 25 articles (1.47%); Lancaster University had 25 articles (1.47%); the University of Tehran had 23 articles (1.35%); Consiglio Nazionale delle Ricerche (CNR) had 17 articles (1%); the European Commission, Newcastle University, Delft Institute for Water Education (formerly known as UNESCO IHE), the University of Oxford, and the University of Quebec had 15 articles each (0.88%); Middlesex University had 14 articles (0.82%); Deltares, Hohai University, the University of Coimbra, and Wuhan University had 13 articles each (0.76%); the Center for Ecology and Hydrology, Hydraulics Research (HR) Wallingford, the Indian Institute of Technology, the Polytechnic University of Milan, the University of Basilicata, the University of Bologna, the University of Bucharest, the University of Genoa, and the University of Oklahoma had 12 articles each (0.70%).
3.1. Spatial Distribution of Research
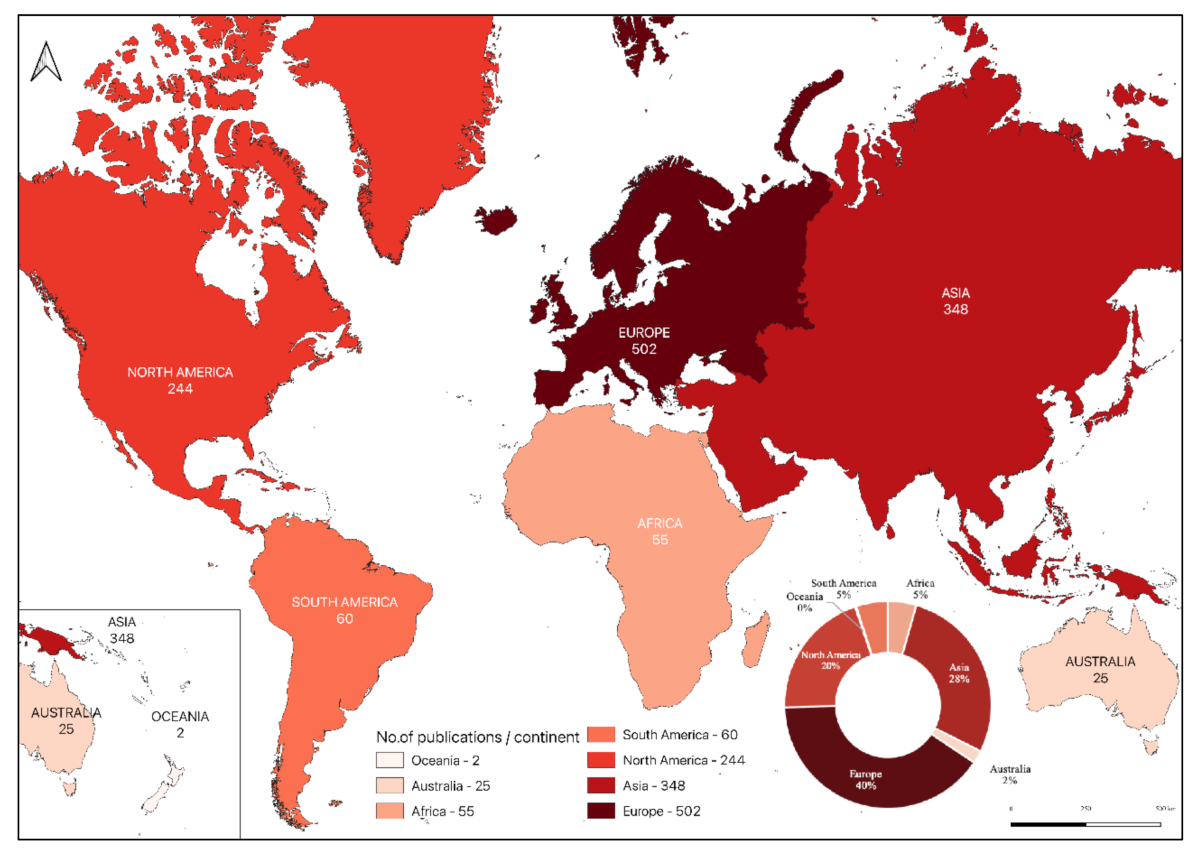
The research was mainly focused on the following three major regions: Continental Europe [22,23,24,25,26] with about 40% of articles, Asia with 28% [27,28,29,30,31], and North America with 20% [32,33,34,35,36]. South America (5%) [37,38,39,40,41] and Africa (4%) [42,43,44,45,46] showed less research interest (Figure 2). Following a detailed analysis of each region, we found that the most researched areas were: the United States, representing 13.19% of the total articles analyzed and 71.72% of the articles located in North America [47,48,49]; the United Kingdom, with 90 articles representing 17.92% of the articles in Europe and 6.78% of the total papers [50,51,52]; Italy and Spain, accounting for 5.27% of the entire articles and 13.94% of the scientific papers published in Europe, respectively [53,54,55]; and China, accounting for 5.27% of the total articles and 20.11% of the articles in Asia [56,57,58]. A significant percentage of publications also came from India, representing 16.6% of all Asian scientific articles and 4.37% of the total publications [59,60,61]. The latest analysis of publications showed us that the papers that have China and India as their study area are increasingly numerous.
3.2. Research Methods and Advances in Flood Research
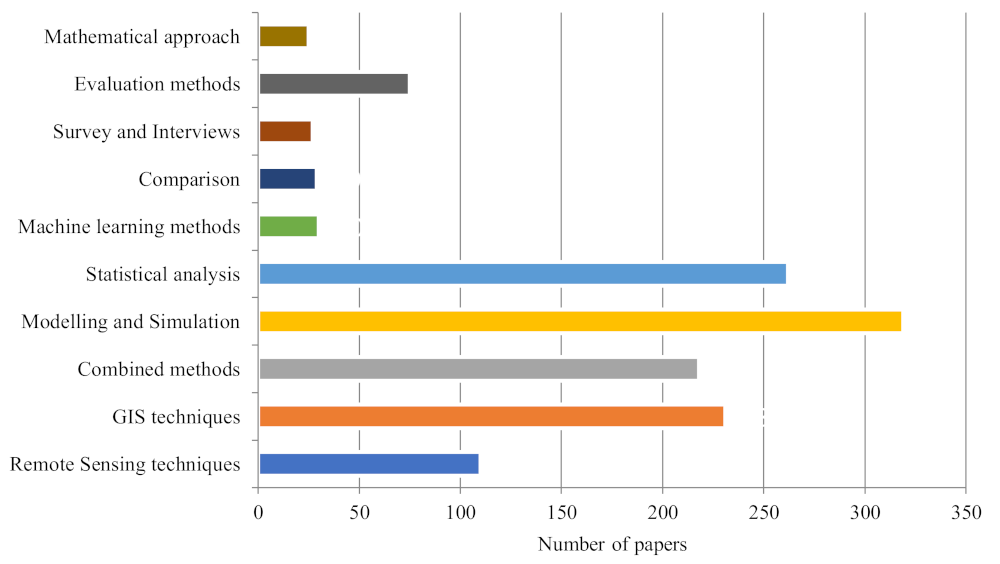
It is worth highlighting the variety of methods and their use in research. The detailed analysis of the papers allowed us to identify and classify the methodologies proposed within ten categories: remote sensing techniques, geographic information systems (GIS) techniques, combined methods (GIS—machine learning, GIS—modeling—simulation), modeling and simulation, statistical analysis, machine learning methods, comparison, survey and interviews, evaluation methods, and statistical and mathematical methods (Figure 3). Among these methodologies, the most popular methodological approach was that of modeling and simulation (hydrological, hydraulic, hydrodynamic), representing 24% of the total articles [68,69,70,71,72,73], followed by statistical analysis at 20% [74,75,76,77,78] and GIS techniques at 17% [79,80,81,82,83,84], while 16% of the articles proposed the use of combined methodologies [85,86,87,88,89]. The papers based on remote sensing techniques (analyzed via GIS environments) represented 8% of the total [90,91,92,93,94] and used ERS-1, Kompsat-2, LANDSAT, MODIS, and Sentinel-II imagery. Evaluation-based methodologies, consisting of framework proposals, reviews, and pre- and post-flood assessments, which have a theoretical aspect, represented 6% of the total articles [95,96,97,98,99,100].
The role of geospatial technologies—remote sensing and GIS—has been a significant step in flood modeling, forecasting, and hazard assessment. Flood modeling requires the analyst to acquire, maintain, and widely use a spatial database. Remote sensing and GIS are excellent techniques that can meet these requirements.
The role of remote sensing in river basin hydrologic modeling as part of the entire runoff modeling process is due to its ability to provide continuous spatial data, measurements of hydrological variables that are not available through traditional techniques, and especially its ability to provide global data, e.g., long-term.
Modeling and simulation techniques refer to flood modeling as the process of transforming precipitation into a flood hydrograph. In this way, floods are approximated physically or mathematically (using mathematical equations) where the relationships between them represent the state at the system’s entry and exit. Geographic information systems (GIS) have increased the importance of remote sensing by improving spatial modeling efficiency. This process has increased the ability to estimate hydrological models.
The hydrological model is a mathematical representation of hydrological processes in a river basin in a simplified form. It was used primarily to understand and explain hydrological processes and for hydrological prediction. This model can be of different types, depending on the kind of approach: deterministic or stochastic. A hydrological model is deterministic if it represents the physical processes in a river basin without considering randomness. It becomes a stochastic model when it incorporates in its random mathematical representation variables and their probability of distribution in the space of parameters.
On the other hand, the hydraulic models used show water flows’ evolution to simulate water movement during floods, along waterways, reservoirs, and hydraulic structures. One of the most used hydrological and hydraulic modeling systems is the HEC river analysis system (RAS). The Hydrologic Engineering Center – Hydrologic Modelling System (HEC-HMS) is a generalized modeling system designed to simulate river basin dendritic systems’ precipitation–runoff processes with a wide range of applicability.
The HEC RAS is an integrated software system designed to operate one-dimensional hydraulic calculations for a complete network of natural and artificial channels.
The combined methodologies use a mix of remote sensing and GIS techniques with those of modeling and simulation, statistics, or integration of machine learning algorithms. Recent years have shown us a diversification in the methodological approaches proposed by researchers, so that more and more research using methodologies based on machine learning (2% of articles) [100,101,102,103] and comparative methods (2% of total papers) [16,17,104,105,106] is starting to be published. The use of combined methods is also gaining more and more interest from researchers.
Mathematical theories were the first approaches to flood patterns, mainly using hydrological data. Based on existing data, new models have been created for areas with similar characteristics [107,108,109]. Statistics were used as soon as the databases allowed their processing with good results [110,111,112,113,114]. The development of GIS techniques has allowed the spatialization of these methodologies, leading to combined methods.
Statistical analysis was used mainly in estimating flood frequency. Until 1966, the most widely used distribution for flood frequency analysis was the type I extreme value distribution, also called the Gumbel distribution, followed by the lognormal. Both of the above distributions are still commonly used, commonly referred to in hydrology as Pearson type III and log-Pearson type III.
Tiago de Oliveira (1982) developed a statistical decision procedure to choose between the Gumbel, Frechet, and Weibull models. The fact is that hydrological data rarely fulfill the classical asymptotic theory’s assumptions, and thus, the Gumbel, Frechet, or Weibull model is used.
Remote sensing techniques represent the beginning in this sense, so that later, the methods are based on GIS techniques, modeling, and simulation, and recently on machine learning methods [115]. The development of data processing techniques in a large volume and the use of a large number of parameters has allowed for the development of new methodological approaches of high precision to mitigate the effects caused by floods. The spatialization of these methodologies using GIS techniques has opened the way for researchers to develop or improve existing methods but also to combine algorithms, thus leading to the creation of hybrid algorithms [17,105,106].
4. Discussion
The analyzed papers highlight the interest regarding the study of floods and methodologies for their most accurate analysis. Easy access to databases (e.g., European Environment Agency, United States Geological Survey (USGS), NASA, European Space Agency, Japanese Aerospace Exploration Agency (JAXA)) and high-speed information processing have led to the emergence of numerous publications in this field. At the beginning, survey and interview analysis methods and statistical–mathematical methods were used to study the characteristic parameters of floods; later on, the development of GIS, remote sensing, machine learning, modeling and simulation techniques contributed to the creation of new methods capable of providing a simulation of the phenomenon in different scenarios [106,116,117,118,119,120,121,122]. The technological progress has led to the development of combined methodologies and comparative approaches to highlight the effectiveness of the methods used and their ease of implementation in risk management systems and water resources. This finding also indicates the shortcomings of existing systems that cannot integrate all the parameters in the study of floods. There are also limitations generated by the infrastructure for obtaining data, transmitting, processing, and interpreting them. The development of these analysis methods also led to the formation of new analytical skills of specialists who generated new analysis methods, such as machine learning and comparison. At this time, the need to know the extent of the flood phenomenon to reduce the risk generated became evident. These methods, which are based mainly on the processing of geospatial information without requiring a high level of experience of those who use it, create disparities in the analysis of the phenomenon with the risk of results and methods inconsistent with the field reality [123,124,125,126,127,128]. Numerous methodologies that are presented as a novelty are not found in the current practical activity, as there is no validation of them in real-case scenarios. Some national organizations do not have the technical and economic support to implement such methods in their current activity [129,130,131,132,133,134,135]. Research into the effectiveness of the methods presented in the published articles and their implementation in the current applications of the profile organizations should also be encouraged by giving the minimum requirements of IT infrastructure (hardware and software), professional training, and access to specialized databases. New methodologies generally involve the aggregation of complex databases and high-resolution imagery, all generating the need for high-performance IT equipment but also for staff training.
The paper presents an overview of current research methodologies and identifies the methodological spectrum used in flood analysis, providing researchers with a general overview.
It should be noted, however, that the study has some limitations. There may be relevant additional research published in databases other than the one under consideration (Web of Science Core Collection), such as SCOPUS, African Journals Online, and Google Scholar.
5. Conclusions
The present study tried to highlight various aspects, methods, and approaches of flood study methodologies between 1979 and 2020.We analyzed 1326 articles of the most prolific researchers to make a solid and coherent analysis on the various methods used. The progress in the methodological framework and methodological approaches to floods was examined, highlighting the models used.
The research presents an overview of the methodologies used in global flood analysis. This wide range of methods used has advantages and disadvantages. Based on the experience of researchers specializing in the development of flood evolution methodologies, examples of good or bad practices in their current use can be developed later. It is difficult to compare the results presented by the numerous publications available to determine a generally standardized approach. Models set on determining databases have a higher accuracy, remote sensing techniques can advance outcomes over large areas of territory that are difficult to access, and machine learning methods offer advantages in data processing, the validation of results, or the integration of a large number of parameters. Therefore, the standardization of methodologies needs to be done at a regional level and depending on the scenario. Advances in geospatial techniques, especially in remote sensing, GIS, 3D hydrological models, and machine learning algorithms, have revolutionized the methodology of flood analysis.
Multidimensional approaches, models based on machine learning, high-resolution satellite imagery, hydraulic modeling, and a selection of efficient flood conditioning parameters are suggested for an in-depth hazard analysis. The use of multidimensional approaches, sophisticated models, site-specific indicators, and high-resolution satellite data are areas where further research is required.
Author Contributions
Conceptualization, D.C.D., R.C. and M.C.P.; methodology, D.C.D.; software, M.C.P.; validation, R.C.; formal analysis, D.C.D.; writing—original draft preparation, D.C.D. and M.C.P.; writing—review and editing, D.C.D. and R.C. All authors have read and agreed to the published version of the manuscript.
Funding
This research received no funding.
Acknowledgments
The authors gratefully acknowledge the anonymous reviewers for their helpful comments and suggestions to improve the previous version of the manuscript.
Conflicts of Interest
The authors declare no conflict of interest.
References
- Hoyois, P.; Guha-Sapir, D. Three Decades of Floods in Europe: A Preliminary Analysis of EMDAT Data. Available online: /paper/Three-decades-of-floods-in-Europe%3A-a-preliminary-of-Hoyois-Guha-Sapir/23baf9ce41979cf5651c4e8116ba76fdb8e4c4cf (accessed on 22 December 2020).
- IPCC. Climate Change 2007: Impacts, Adaptation and Vulnerability. Contribution of Working Group II to the Fourth Assessment Report of the Intergovernmental Panel on Climate Change; Parry, M.L., Canziani, O.F., Palutikof, J.P., Van Der Linden, P.J., Hanson, C.E., Eds.; Cambridge University Press: Cambridge, UK; New York, NY, USA, 2007; p. 976. [Google Scholar]
- Zwenzner, H.; Voigt, S. Improved Estimation of Flood Parameters by Combining Space Based SAR Data with Very High Resolution Digital Elevation Data. Hydrol. Earth Syst. Sci. 2009, 13, 567–576. [Google Scholar] [CrossRef] [Green Version]
- Yang, J.; Townsend, R.D.; Daneshfar, B. Applying the HEC-RAS model and GIS techniques in river network floodplain delineation. Can. J. Civil Eng. 2006, 33, 19–28. [Google Scholar] [CrossRef]
- Thakur, B.; Parajuli, R.; Kalra, A.; Ahmad, S.; Gupta, R. Coupling HEC-RAS and HEC-HMS in precipitation runoff modelling and evaluating flood plain inundation map. In Proceedings of the World Environmental and Water Resources Congress 2017, Sacramento, CA, USA, 21–25 May 2017; pp. 240–251. [Google Scholar]
- Thompson, J.R.; Iravani, H.; Clilverd, H.M.; Sayer, C.D.; Heppell, C.M.; Axmacher, J.C. Simulation of the hydrological impacts of climate change on a restored floodplain. Hydrol. Sci. J. 2017, 62, 2482–2510. [Google Scholar] [CrossRef] [Green Version]
- Khalfallah, C.B.; Saidi, S. Spatiotemporal floodplain mapping and prediction using HEC-RAS-GIS tools: Case of the Mejerda river, Tunisia. J. Afr. Earth Sci. 2018, 142, 44–51. [Google Scholar] [CrossRef]
- Dhote, P.R.; Aggarwal, S.P.; Thakur, P.K.; Garg, V.A.I.B.H.A.V. Flood inundation prediction for extreme flood events: A case study of Tirthan River, North West Himalaya. Himal Geol. 2019, 40, 128–140. [Google Scholar]
- Huţanu, E.; Mihu-Pintilie, A.; Urzica, A.; Paveluc, L.E.; Stoleriu, C.C.; Grozavu, A. Using 1D HEC-RAS modeling and LiDAR data to improve flood hazard maps’ accuracy: A case study from Jijia floodplain (NE Romania). Water 2020, 12, 1624. [Google Scholar] [CrossRef]
- Chapi, K.; Singh, V.P.; Shirzadi, A.; Shahabi, H.; Bui, D.T.; Pham, B.T.; Khosravi, K. A novel hybrid artificial intelligence approach for flood susceptibility assessment. Environ. Model. Softw. 2017, 95, 229–245. [Google Scholar]
- Shafizadeh-Moghadam, H.; Valavi, R.; Shahabi, H.; Chapi, K.; Shirzadi, A. Novel forecasting approaches using combination of machine learning and statistical models for flood susceptibility mapping. J. Environ. Manag. 2018, 217, 1–11. [Google Scholar] [CrossRef] [Green Version]
- Termeh, S.V.R.; Kornejady, A.; Pourghasemi, H.R.; Keesstra, S. Flood susceptibility mapping using novel ensembles of adaptive neuro fuzzy inference system and metaheuristic algorithms. Sci. Total Environ. 2018, 615, 438–451. [Google Scholar] [CrossRef]
- Choubin, B.; Moradi, E.; Golshan, M.; Adamowski, J.; Sajedi-Hosseini, F.; Mosavi, A. An ensemble prediction of flood susceptibility using multivariate discriminant analysis, classification and regression trees, and support vector machines. Sci. Total Environ. 2019, 651, 2087–2096. [Google Scholar] [CrossRef]
- Costache, R.; Hong, H.; Wang, Y. Identification of torrential valleys using GIS and a novel hybrid integration of artificial intelligence, machine learning and bivariate statistics. Catena 2019, 183, 104179. [Google Scholar] [CrossRef]
- Costache, R.; Bui, D.T. Identification of areas prone to flash-flood phenomena using multiple-criteria decision-making, bivariate statistics, machine learning and their ensembles. Sci. Total Environ. 2020, 712, 136492. [Google Scholar] [CrossRef]
- Costache, R. Flash-Flood Potential Index Mapping Using Weights of Evidence, Decision Trees Models and Their Novel Hybrid Integration. Stoch. Environ. Res. Risk Assess. 2019, 33, 1375–1402. [Google Scholar] [CrossRef]
- Costache, R.; Popa, M.C.; Tien Bui, D.; Diaconu, D.C.; Ciubotaru, N.; Minea, G.; Pham, Q.B. Spatial Predicting of Flood Potential Areas Using Novel Hybridizations of Fuzzy Decision-Making, Bivariate Statistics, and Machine Learning. J. Hydrol. 2020, 585, 124808. [Google Scholar] [CrossRef]
- Dutta, D.; Herath, S.; Musiake, K. An Application of a Flood Risk Analysis System for Impact Analysis of a Flood Control Plan in a River Basin. Hydrol. Process. 2006, 20, 1365–1384. [Google Scholar] [CrossRef]
- Murlidharan, T.L.; Durgaprasad, J.; Appa Rao, T.V.S.R. Knowledge-Based Expert System for Damage Assessment and Vulnerability Analysis of Structures Subjected to Cyclones. J. Wind Eng. Ind. Aerodyn. 1997, 72, 479–491. [Google Scholar] [CrossRef]
- Jonkman, S.N.; Vrijling, J.K. Loss of Life Due to Floods. J. Flood Risk Manag. 2008, 1, 43–56. [Google Scholar] [CrossRef]
- Lei, X.; Chen, W.; Avand, M.; Janizadeh, S.; Kariminejad, N.; Shahabi, H.; Costache, R.; Shahabi, H.; Shirzadi, A.; Mosavi, A. GIS-Based Machine Learning Algorithms for Gully Erosion Susceptibility Mapping in a Semi-Arid Region of Iran. Remote Sens. 2020, 12, 2478. [Google Scholar] [CrossRef]
- Abdelkarim, A.; Al-Alola, S.S.; Alogayell, H.M.; Mohamed, S.A.; Alkadi, I.I.; Youssef, I.Y. Mapping of GIS-Flood Hazard Using the Geomorphometric-Hazard Model: Case Study of the Al-Shamal Train Pathway in the City of Qurayyat, Kingdom of Saudi Arabia. Geosciences 2020, 10, 333. [Google Scholar] [CrossRef]
- Costache, R.; Zaharia, L. Flash-Flood Potential Assessment and Mapping by Integrating the Weights-of-Evidence and Frequency Ratio Statistical Methods in GIS Environment—Case Study: Bâsca Chiojdului River Catchment (Romania). J. Earth Syst. Sci. 2017, 126, 59. [Google Scholar] [CrossRef]
- Ferreira, T.M.; Santos, P.P. An Integrated Approach for Assessing Flood Risk in Historic City Centres. Water 2020, 12, 1648. [Google Scholar] [CrossRef]
- Jenkins, K.; Hall, J.; Glenis, V.; Kilsby, C. A Probabilistic Analysis of Surface Water Flood Risk in London. Risk Anal. 2018, 38, 1169–1182. [Google Scholar] [CrossRef]
- Țîncu, R.; Zêzere, J.L.; Crăciun, I.; Lazăr, G.; Lazăr, I. Quantitative Micro-Scale Flood Risk Assessment in a Section of the Trotuș River, Romania. Land Use Policy 2020, 95, 103881. [Google Scholar] [CrossRef]
- Vojtek, M.; Vojteková, J. Flood Susceptibility Mapping on a National Scale in Slovakia Using the Analytical Hierarchy Process. Water 2019, 11, 364. [Google Scholar] [CrossRef] [Green Version]
- Elhag, M.; Abdurahman, S.G. Advanced Remote Sensing Techniques in Flash Flood Delineation in Tabuk City, Saudi Arabia. Nat. Hazards 2020, 103, 3401–3413. [Google Scholar] [CrossRef]
- Kanani-Sadat, Y.; Arabsheibani, R.; Karimipour, F.; Nasseri, M. A New Approach to Flood Susceptibility Assessment in Data-Scarce and Ungauged Regions Based on GIS-Based Hybrid Multi Criteria Decision-Making Method. J. Hydrol. 2019, 572, 17–31. [Google Scholar] [CrossRef]
- Kumar, N.; Lal, D.; Sherring, A.; Issac, R.K. Applicability of HEC-RAS & GFMS Tool for 1D Water Surface Elevation/Flood Modeling of the River: A Case Study of River Yamuna at Allahabad (Sangam), India. Model. Earth Syst. Environ. 2017, 3, 1463–1475. [Google Scholar] [CrossRef]
- Shadmehri Toosi, A.; Calbimonte, G.H.; Nouri, H.; Alaghmand, S. River Basin-Scale Flood Hazard Assessment Using a Modified Multi-Criteria Decision Analysis Approach: A Case Study. J. Hydrol. 2019, 574, 660–671. [Google Scholar] [CrossRef]
- Xu, H.; Ma, C.; Lian, J.; Xu, K.; Chaima, E. Urban Flooding Risk Assessment Based on an Integrated K-Means Cluster Algorithm and Improved Entropy Weight Method in the Region of Haikou, China. J. Hydrol. 2018, 563, 975–986. [Google Scholar] [CrossRef]
- Gado, T.A.; Nguyen, V.-T.-V. An At-Site Flood Estimation Method in the Context of Nonstationarity II. Statistical Analysis of Floods in Quebec. J. Hydrol. 2016, 535, 722–736. [Google Scholar] [CrossRef]
- Gómez-Palacios, D.; Torres, M.A.; Reinoso, E. Flood Mapping through Principal Component Analysis of Multitemporal Satellite Imagery Considering the Alteration of Water Spectral Properties Due to Turbidity Conditions. Geomat. Nat. Hazards Risk 2017, 8, 607–623. [Google Scholar] [CrossRef]
- Gutenson, J.L.; Ernest, A.N.S.; Oubeidillah, A.A.; Zhu, L.; Zhang, X.; Sadeghi, S.T. Rapid Flood Damage Prediction and Forecasting Using Public Domain Cadastral and Address Point Data with Fuzzy Logic Algorithms. JAWRA J. Am. Water Resour. Assoc. 2018, 54, 104–123. [Google Scholar] [CrossRef]
- Yochum, S.E.; Scott, J.A.; Levinson, D.H. Methods for Assessing Expected Flood Potential and Variability: Southern Rocky Mountains Region. Water Resour. Res. 2019, 55, 6392–6416. [Google Scholar] [CrossRef]
- Zhong, M.; Wang, J.; Jiang, T.; Huang, Z.; Chen, X.; Hong, Y. Using the Apriori Algorithm and Copula Function for the Bivariate Analysis of Flash Flood Risk. Water 2020, 12, 2223. [Google Scholar] [CrossRef]
- Fava, M.C.; Mazzoleni, M.; Abe, N.; Mendiondo, E.M.; Solomatine, D.P. Improving Flood Forecasting Using an Input Correction Method in Urban Models in Poorly Gauged Areas. Hydrol. Sci. J. 2020, 65, 1096–1111. [Google Scholar] [CrossRef]
- Fernández, D.S.; Lutz, M.A. Urban Flood Hazard Zoning in Tucumán Province, Argentina, Using GIS and Multicriteria Decision Analysis. Eng. Geol. 2010, 111, 90–98. [Google Scholar] [CrossRef]
- Fustos, I.; Abarca-del-Rio, R.; Ávila, A.; Orrego, R. A Simple Logistic Model to Understand the Occurrence of Flood Events into the Biobío River Basin in Central Chile. J. Flood Risk Manag. 2017, 10, 17–29. [Google Scholar] [CrossRef] [Green Version]
- Muñoz, P.; Orellana-Alvear, J.; Willems, P.; Célleri, R. Flash-Flood Forecasting in an Andean Mountain Catchment—Development of a Step-Wise Methodology Based on the Random Forest Algorithm. Water 2018, 10, 1519. [Google Scholar] [CrossRef] [Green Version]
- Velásquez, N.; Hoyos, C.D.; Vélez, J.I.; Zapata, E. Reconstructing the 2015 Salgar Flash Flood Using Radar Retrievals and a Conceptual Modeling Framework in an Ungauged Basin. Hydrol. Earth Syst. Sci. 2020, 24, 1367–1392. [Google Scholar] [CrossRef] [Green Version]
- Bang, H.; Miles, L.; Gordon, R. Evaluating Local Vulnerability and Organisational Resilience to Frequent Flooding in Africa: The Case of Northern Cameroon. Foresight 2019, 21, 266–284. [Google Scholar] [CrossRef]
- Hategekimana, Y.; Yu, L.; Nie, Y.; Zhu, J.; Liu, F.; Guo, F. Integration of Multi-Parametric Fuzzy Analytic Hierarchy Process and GIS along the UNESCO World Heritage: A Flood Hazard Index, Mombasa County, Kenya. Nat. Hazards 2018, 92, 1137–1153. [Google Scholar] [CrossRef]
- Idowu, D.; Zhou, W. Performance Evaluation of a Potential Component of an Early Flood Warning System—A Case Study of the 2012 Flood, Lower Niger River Basin, Nigeria. Remote Sens. 2019, 11, 1970. [Google Scholar] [CrossRef] [Green Version]
- Komi, K.; Neal, J.; Trigg, M.A.; Diekkrüger, B. Modelling of Flood Hazard Extent in Data Sparse Areas: A Case Study of the Oti River Basin, West Africa. J. Hydrol. Reg. Stud. 2017, 10, 122–132. [Google Scholar] [CrossRef] [Green Version]
- Mavhura, E.; Collins, A.; Bongo, P.P. Flood Vulnerability and Relocation Readiness in Zimbabwe. Disaster Prev. Manag. Int. J. 2017, 26, 41–54. [Google Scholar] [CrossRef]
- Allen, Y. Landscape Scale Assessment of Floodplain Inundation Frequency Using Landsat Imagery. River Res. Appl. 2016, 32, 1609–1620. [Google Scholar] [CrossRef]
- Giovannettone, J.; Copenhaver, T.; Burns, M.; Choquette, S. A Statistical Approach to Mapping Flood Susceptibility in the Lower Connecticut River Valley Region. Water Resour. Res. 2018, 54, 7603–7618. [Google Scholar] [CrossRef]
- Slutzman, J.E.; Smith, J.A. Effects of Flood Control Structures on Flood Response for Hurricane Floyd in the Brandywine Creek Watershed, Pennsylvania. J. Hydrol. Eng. 2006, 11, 432–441. [Google Scholar] [CrossRef]
- Golding, B.W. Uncertainty Propagation in a London Flood Simulation. J. Flood Risk Manag. 2009, 2, 2–15. [Google Scholar] [CrossRef]
- Percival, S.; Teeuw, R. A Methodology for Urban Micro-Scale Coastal Flood Vulnerability and Risk Assessment and Mapping. Nat. Hazards 2019, 97, 355–377. [Google Scholar] [CrossRef] [Green Version]
- Vamvakeridou-Lyroudia, L.S.; Chen, A.S.; Khoury, M.; Gibson, M.J.; Kostaridis, A.; Stewart, D.; Wood, M.; Djordjevic, S.; Savic, D.A. Assessing and Visualising Hazard Impacts to Enhance the Resilience of Critical Infrastructures to Urban Flooding. Sci. Total Environ. 2020, 707, 136078. [Google Scholar] [CrossRef]
- Apollonio, C.; Bruno, M.F.; Iemmolo, G.; Molfetta, M.G.; Pellicani, R. Flood Risk Evaluation in Ungauged Coastal Areas: The Case Study of Ippocampo (Southern Italy). Water 2020, 12, 1466. [Google Scholar] [CrossRef]
- Forte, F.; Strobl, R.O.; Pennetta, L. A Methodology Using GIS, Aerial Photos and Remote Sensing for Loss Estimation and Flood Vulnerability Analysis in the Supersano-Ruffano-Nociglia Graben, Southern Italy. Environ. Geol. 2006, 50, 581–594. [Google Scholar] [CrossRef]
- Russo, B.; Sunyer, D.; Velasco, M.; Djordjević, S. Analysis of Extreme Flooding Events through a Calibrated 1D/2D Coupled Model: The Case of Barcelona (Spain). J. Hydroinf. 2014, 17, 473–491. [Google Scholar] [CrossRef]
- Chen, L.; Ye, L.; Singh, V.; Zhou, J.; Guo, S. Determination of Input for Artificial Neural Networks for Flood Forecasting Using the Copula Entropy Method. J. Hydrol. Eng. 2014, 19, 04014021. [Google Scholar] [CrossRef]
- Lu, C.; Zhou, J.; He, Z.; Yuan, S. Evaluating Typical Flood Risks in Yangtze River Economic Belt: Application of a Flood Risk Mapping Framework. Nat. Hazards 2018, 94, 1187–1210. [Google Scholar] [CrossRef]
- Wang, W.; Liu, J.; Li, C.; Yu, F.; Xie, Y.; Qiu, Q.; Jiao, Y.; Zhang, G. Assessing the Applicability of Conceptual Hydrological Models for Design Flood Estimation in Small-Scale Watersheds of Northern China. Nat. Hazards 2020, 102, 1135–1153. [Google Scholar] [CrossRef]
- Dash, P.; Sar, J. Identification and Validation of Potential Flood Hazard Area Using GIS-Based Multi-Criteria Analysis and Satellite Data-Derived Water Index. J. Flood Risk Manag. 2020, 13, e12620. [Google Scholar] [CrossRef]
- Mandal, S.P.; Chakrabarty, A. Flash Flood Risk Assessment for Upper Teesta River Basin: Using the Hydrological Modeling System (HEC-HMS) Software. Model. Earth Syst. Environ. 2016, 2, 59. [Google Scholar] [CrossRef] [Green Version]
- Salunkhe, S.S.; Rao, S.S.; Prabu, I.; Raghu Venkataraman, V.; Krishna Murthy, Y.V.N.; Sadolikar, C.; Deshpande, S. Flood Inundation Hazard Modelling Using CCHE2D Hydrodynamic Model and Geospatial Data for Embankment Breaching Scenario of Brahmaputra River in Assam. J. Indian Soc. Remote Sens. 2018, 46, 915–925. [Google Scholar] [CrossRef]
- Dottori, F.; Kalas, M.; Salamon, P.; Bianchi, A.; Alfieri, L.; Feyen, L. An Operational Procedure for Rapid Flood Risk Assessment in Europe. Nat. Hazards Earth Syst. Sci. 2017, 17, 1111–1126. [Google Scholar] [CrossRef] [Green Version]
- Nka, B.N.; Oudin, L.; Karambiri, H.; Paturel, J.E.; Ribstein, P. Trends in Floods in West Africa: Analysis Based on 11 Catchments in the Region. Hydrol. Earth Syst. Sci. 2015, 19, 4707–4719. [Google Scholar] [CrossRef] [Green Version]
- Sikder, M.S.; Hossain, F. Improving Operational Flood Forecasting in Monsoon Climates with Bias-Corrected Quantitative Forecasting of Precipitation. Int. J. River Basin Manag. 2019, 17, 411–421. [Google Scholar] [CrossRef]
- Dottori, F.; Salamon, P.; Bianchi, A.; Alfieri, L.; Hirpa, F.A.; Feyen, L. Development and Evaluation of a Framework for Global Flood Hazard Mapping. Adv. Water Resour. 2016, 94, 87–102. [Google Scholar] [CrossRef]
- Smith, A.; Sampson, C.; Bates, P. Regional Flood Frequency Analysis at the Global Scale. Water Resour. Res. 2015, 51, 539–553. [Google Scholar] [CrossRef]
- Stein, L.; Pianosi, F.; Woods, R. Event-Based Classification for Global Study of River Flood Generating Processes. Hydrol. Process. 2020, 34, 1514–1529. [Google Scholar] [CrossRef]
- Bermúdez, M.; Neal, J.C.; Bates, P.D.; Coxon, G.; Freer, J.E.; Cea, L.; Puertas, J. Quantifying Local Rainfall Dynamics and Uncertain Boundary Conditions into a Nested Regional-Local Flood Modeling System. Water Resour. Res. 2017, 53, 2770–2785. [Google Scholar] [CrossRef] [Green Version]
- Cameron, D.; Beven, K.; Naden, P. Flood Frequency Estimation by Continuous Simulation under Climate Change (with Uncertainty). Hydrol. Earth Syst. Sci. 2000, 4, 393–405. [Google Scholar] [CrossRef]
- Elfeki, A.; Bahrawi, J. Application of the Random Walk Theory for Simulation of Flood Hazards: Jeddah Flood 25 November 2009. Int. J. Emerg. Manag. 2017, 13, 169. [Google Scholar] [CrossRef]
- Hall, J.W.; Harvey, H.; Manning, L.J. Adaptation Thresholds and Pathways for Tidal Flood Risk Management in London. Clim. Risk Manag. 2019, 24, 42–58. [Google Scholar] [CrossRef]
- Kumar, N.; Kumar, M.; Sherring, A.; Suryavanshi, S.; Ahmad, A.; Lal, D. Applicability of HEC-RAS 2D and GFMS for Flood Extent Mapping: A Case Study of Sangam Area, Prayagraj, India. Model. Earth Syst. Environ. 2020, 6, 397–405. [Google Scholar] [CrossRef]
- Ogras, S.; Onen, F. Flood Analysis with HEC-RAS: A Case Study of Tigris River. Available online: https://www.hindawi.com/journals/ace/2020/6131982/ (accessed on 22 December 2020).
- Barbetta, S.; Coccia, G.; Moramarco, T.; Todini, E. Real-Time Flood Forecasting Downstream River Confluences Using a Bayesian Approach. J. Hydrol. 2018, 565, 516–523. [Google Scholar] [CrossRef]
- Collet, L.; Beevers, L.; Stewart, M.D. Decision-Making and Flood Risk Uncertainty: Statistical Data Set Analysis for Flood Risk Assessment. Water Resour. Res. 2018, 54, 7291–7308. [Google Scholar] [CrossRef] [Green Version]
- Dittes, B.; Špačková, O.; Schoppa, L.; Straub, D. Managing Uncertainty in Flood Protection Planning with Climate Projections. Hydrol. Earth Syst. Sci. 2018, 22, 2511–2526. [Google Scholar] [CrossRef] [Green Version]
- Martina, M.L.V.; Todini, E.; Libralon, A. A Bayesian Decision Approach to Rainfall Thresholds Based Flood Warning. Hydrol. Earth Syst. Sci. 2006, 10, 413–426. [Google Scholar] [CrossRef] [Green Version]
- Salvadori, G.; Durante, F.; De Michele, C.; Bernardi, M. Hazard Assessment under Multivariate Distributional Change-Points: Guidelines and a Flood Case Study. Water 2018, 10, 751. [Google Scholar] [CrossRef] [Green Version]
- Afifi, M.E. Application of GIS for Flood Zoning Hazard in Shiraz. Int. J. Ecol. Dev. 2017, 32, 36–44. [Google Scholar]
- Karamouz, M.; Zahmatkesh, Z.; Goharian, E.; Nazif, S. Combined Impact of Inland and Coastal Floods: Mapping Knowledge Base for Development of Planning Strategies. J. Water Resour. Plan. Manag. 2015, 141, 04014098. [Google Scholar] [CrossRef]
- Kourgialas, N.N.; Karatzas, G.P. Flood Management and a GIS Modelling Method to Assess Flood-Hazard Areas—a Case Study. Hydrol. Sci. J. 2011, 56, 212–225. [Google Scholar] [CrossRef]
- Liu, C.; Li, Y. Measuring Eco-Roof Mitigation on Flash Floods via GIS Simulation. Built Environ. Proj. Asset Manag. 2016, 6, 415–427. [Google Scholar] [CrossRef]
- Yang, B. GIS Based 3-D Landscape Visualization for Promoting Citizen’s Awareness of Coastal Hazard Scenarios in Flood Prone Tourism Towns. Appl. Geogr. 2016, 76, 85–97. [Google Scholar] [CrossRef]
- Yi, C.-S.; Lee, J.-H.; Shim, M.-P. GIS-Based Distributed Technique for Assessing Economic Loss from Flood Damage: Pre-Feasibility Study for the Anyang Stream Basin in Korea. Nat. Hazards 2010, 55, 251–272. [Google Scholar] [CrossRef]
- Abebe, Y.; Kabir, G.; Tesfamariam, S. Assessing Urban Areas Vulnerability to Pluvial Flooding Using GIS Applications and Bayesian Belief Network Model. J. Clean. Prod. 2018, 174, 1629–1641. [Google Scholar] [CrossRef]
- Anees, M.T.; Abdullah, K.; Nawawi, M.N.M.; Rahman, N.N.N.A.; Ismail, A.Z.; Syakir, M.I.; Kadir, M.O.A. Prioritization of Flood Vulnerability Zones Using Remote Sensing and GIS for Hydrological Modelling. Irrig. Drain. 2019, 68, 176–190. [Google Scholar] [CrossRef]
- Conesa-Garcia, C.; Caselles-Miralles, V.; Sanchez Tomas, J.M.; Garcia-Lorenzo, R. Hydraulic Geometry, GIS and Remote Sensing, Techniques against Rainfall-Runoff Models for Estimating Flood Magnitude in Ephemeral Fluvial Systems. Remote Sens. 2010, 2, 2607–2628. [Google Scholar] [CrossRef] [Green Version]
- De Andrade, M.M.N.; Szlafsztein, C.F. Community Participation in Flood Mapping in the Amazon through Interdisciplinary Methods. Nat. Hazards 2015, 78, 1491–1500. [Google Scholar] [CrossRef]
- Martínez-Graña, A.; Gómez, D.; Santos-Francés, F.; Bardají, T.; Goy, J.L.; Zazo, C. Analysis of Flood Risk Due to Sea Level Rise in the Menor Sea (Murcia, Spain). Sustainability 2018, 10, 780. [Google Scholar] [CrossRef] [Green Version]
- Ahamed, A.; Bolten, J.D. A MODIS-Based Automated Flood Monitoring System for Southeast Asia. Int. J. Appl. Earth Obs. Geoinf. 2017, 61, 104–117. [Google Scholar] [CrossRef] [Green Version]
- Martinis, S.; Kersten, J.; Twele, A. A Fully Automated TerraSAR-X Based Flood Service. Isprs J. Photogramm. Remote Sens. 2015, 104, 203–212. [Google Scholar] [CrossRef]
- Ouled Sghaier, M.; Hammami, I.; Foucher, S.; Lepage, R. Flood Extent Mapping from Time-Series SAR Images Based on Texture Analysis and Data Fusion. Remote Sens. 2018, 10, 237. [Google Scholar] [CrossRef] [Green Version]
- Pandey, R.K.; Crétaux, J.-F.; Bergé-Nguyen, M.; Tiwari, V.M.; Drolon, V.; Papa, F.; Calmant, S. Water Level Estimation by Remote Sensing for the 2008 Flooding of the Kosi River. Int. J. Remote Sens. 2014, 35, 424–440. [Google Scholar] [CrossRef]
- Panteras, G.; Cervone, G. Enhancing the Temporal Resolution of Satellite-Based Flood Extent Generation Using Crowdsourced Data for Disaster Monitoring. Int. J. Remote Sens. 2018, 39, 1459–1474. [Google Scholar] [CrossRef]
- Ballesteros, C.; Jiménez, J.A.; Viavattene, C. A Multi-Component Flood Risk Assessment in the Maresme Coast (NW Mediterranean). Nat. Hazards 2018, 90, 265–292. [Google Scholar] [CrossRef] [Green Version]
- Lamond, J.E.; Bhattacharya-Mis, N.; Chan, F.K.S.; Kreibich, H.; Montz, B.; Proverbs, D.G.; Wilkinson, S. Flood Risk Insurance, Mitigation and Commercial Property Valuation. Prop. Manag. 2019, 37, 512–528. [Google Scholar] [CrossRef]
- Meldrum, A.; Mickovski, S.B. Development of an Independent Hydrology Audit Methodology to Support Flood Risk Assessment in the Planning Process in Scotland. Water Environ. J. 2017, 31, 559–571. [Google Scholar] [CrossRef]
- Penning-Rowsell, E.; Floyd, P.; Ramsbottom, D.; Surendran, S. Estimating Injury and Loss of Life in Floods: A Deterministic Framework. Nat. Hazards 2005, 36, 43–64. [Google Scholar] [CrossRef] [Green Version]
- Ali, R.; Kuriqi, A.; Kisi, O. Human-Environment Natural Disasters Interconnection in China: A review. Climate 2020, 8, 48. [Google Scholar]
- Zelenakova, M.; Zvijáková, L.; Singovszka, E. Universal matrix of risk analysis method for flood mitigation measures in Vysna Hutka, Slovakia. Fresenius Environ. Bull. 2017, 26, 1216–1224. [Google Scholar]
- Alipour, A.; Ahmadalipour, A.; Abbaszadeh, P.; Moradkhani, H. Leveraging Machine Learning for Predicting Flash Flood Damage in the Southeast US. Environ. Res. Lett. 2020, 15, 024011. [Google Scholar] [CrossRef]
- Dodangeh, E.; Choubin, B.; Eigdir, A.N.; Nabipour, N.; Panahi, M.; Shamshirband, S.; Mosavi, A. Integrated Machine Learning Methods with Resampling Algorithms for Flood Susceptibility Prediction. Sci. Total Environ. 2020, 705, 135983. [Google Scholar] [CrossRef]
- Doycheva, K.; Horn, G.; Koch, C.; Schumann, A.; König, M. Assessment and Weighting of Meteorological Ensemble Forecast Members Based on Supervised Machine Learning with Application to Runoff Simulations and Flood Warning. Adv. Eng. Inf. 2017, 33, 427–439. [Google Scholar] [CrossRef] [Green Version]
- Razavi, S.; Karamouz, M. Adaptive Neural Networks for Flood Routing in River Systems. Water Int. 2007, 32, 360–375. [Google Scholar] [CrossRef]
- Md Ali, A.; Solomatine, D.P.; Di Baldassarre, G. Assessing the Impact of Different Sources of Topographic Data on 1-D Hydraulic Modelling of Floods. Hydrol. Earth Syst. Sci. 2015, 19, 631–643. [Google Scholar] [CrossRef] [Green Version]
- Popa, M.C.; Peptenatu, D.; Drăghici, C.C.; Diaconu, D.C. Flood Hazard Mapping Using the Flood and Flash-Flood Potential Index in the Buzău River Catchment, Romania. Water 2019, 11, 2116. [Google Scholar] [CrossRef] [Green Version]
- Talukdar, S.; Ghose, B.; Shahfahad; Salam, R.; Mahato, S.; Pham, Q.B.; Linh, N.T.T.; Costache, R.; Avand, M. Flood Susceptibility Modeling in Teesta River Basin, Bangladesh Using Novel Ensembles of Bagging Algorithms. Stoch. Environ. Res. Risk Assess. 2020, 34, 2277–2300. [Google Scholar] [CrossRef]
- Bocanegra, R.A.; Stamm, J. Evaluation of Alternatives to Optimize the Flood Management in the Department of Valle Del Cauca. J. Appl. Water Eng. Res. 2020. [Google Scholar] [CrossRef]
- Kaya, Y.; Stewart, M.; Becker, M. Flood Forecasting and Flood Warning in the Firth of Clyde, UK. Nat. Hazards 2005, 36, 257–271. [Google Scholar] [CrossRef]
- Lekkas, P.T. Estimating Flood Inundation and the Consequent Economic Losses in the Koiliaris River Basin in Crete, Greece. Available online: https://journal.gnest.org/publication/875 (accessed on 22 December 2020).
- Debele, S.E.; Strupczewski, W.G.; Bogdanowicz, E. A Comparison of Three Approaches to Non-Stationary Flood Frequency Analysis. Acta Geophys. 2017, 65, 863–883. [Google Scholar] [CrossRef]
- McAneney, J.; Honert, R.; Van Den Yeo, S. Stationarity of Major Flood Frequencies and Heights on the Ba River, Fiji, over a 122-Year Record. Int. J. Clim. 2017, 37, 171–178. [Google Scholar] [CrossRef] [Green Version]
- Notaro, V.; Fontanazza, C.M.; Loggia, G.L.; Freni, G. Flood Frequency Analysis for an Urban Watershed: Comparison between Several Statistical Methodologies Simulating Synthetic Rainfall Events. J. Flood Risk Manag. 2018, 11, S559–S574. [Google Scholar] [CrossRef]
- Kuriqi, A.; Ali, R.; Pham, Q.C.; Gambini, J.M.; Gupta, V.; Malik, A.; Linh, N.T.T.L.; Joshi, Y.; Ang, D.T.; Nam, V.T.; et al. Seasonality shift and streamflow flow variability trends in central India. Acta Geophys. 2020, 58, 1461–1475. [Google Scholar] [CrossRef]
- Young, P.C. Advances in Real-Time Flood Forecasting. Philos. Trans. Math. Phys. Eng. Sci. 2002, 360, 1433–1450. [Google Scholar] [CrossRef] [PubMed] [Green Version]
- Diaconu, D.; Bretcan, P.; Peptenatu, D.; Dănuţ, T.; Mailat, E. The Importance of the Number of Points, Transect Location and Interpolation Techniques in the Analysis of Bathymetric Measurements. J. Hydrol. 2019, 570, 774–785. [Google Scholar] [CrossRef]
- Ivan Ulloa, N.; Chiang, S.-H.; Yun, S.-H. Flood Proxy Mapping with Normalized Difference Sigma-Naught Index and Shannon’s Entropy. Remote Sens. 2020, 12, 1384. [Google Scholar] [CrossRef]
- Nemni, E.; Bullock, J.; Belabbes, S.; Bromley, L. Fully Convolutional Neural Network for Rapid Flood Segmentation in Synthetic Aperture Radar Imagery. Remote Sens. 2020, 12, 2532. [Google Scholar] [CrossRef]
- Ngo, P.-T.T.; Hoang, N.-D.; Pradhan, B.; Nguyen, Q.K.; Tran, X.T.; Nguyen, Q.M.; Nguyen, V.N.; Samui, P.; Tien Bui, D. A Novel Hybrid Swarm Optimized Multilayer Neural Network for Spatial Prediction of Flash Floods in Tropical Areas Using Sentinel-1 SAR Imagery and Geospatial Data. Sensors 2018, 18, 3704. [Google Scholar] [CrossRef] [PubMed] [Green Version]
- Nones, M.; Pescaroli, G. Implications of cascading effects for the EU Floods Directive. Int. J. River Basin Manag. 2016, 14, 195–204. [Google Scholar] [CrossRef]
- Nones, M.; Caviedes-Voullième, D. Computational advances and innovations in flood risk mapping. J. Flood Risk Manag. 2020, 13, 4. [Google Scholar] [CrossRef]
- Zhang, Y.; Crawford, P. Automated Extraction of Visible Floodwater in Dense Urban Areas from RGB Aerial Photos. Remote Sens. 2020, 12, 2198. [Google Scholar] [CrossRef]
- Alam, A.; Bhat, M.S.; Farooq, H.; Ahmad, B.; Ahmad, S.; Sheikh, A.H. Flood Risk Assessment of Srinagar City in Jammu and Kashmir, India. Int. J. Disaster Resil. Built Environ. 2018, 9, 114–129. [Google Scholar] [CrossRef]
- Duy, P.N.; Chapman, L.; Tight, M.; Linh, P.N.; Thuong, L.V. Increasing Vulnerability to Floods in New Development Areas: Evidence from Ho Chi Minh City. Int. J. Clim. Chang. Strat. Manag. 2018, 10, 197–212. [Google Scholar] [CrossRef]
- Li, M.; Wu, W.; Wang, J.; Che, Z.; Xie, Y. Simulating and Mapping the Risk of Surge Floods in Multiple Typhoon Scenarios: A Case Study of Yuhuan County, Zhejiang Province, China. Stoch. Environ. Res. Risk Assess. 2017, 31, 645–659. [Google Scholar] [CrossRef]
- Ling, L.; Yusop, Z.; Chow, M.F. Urban Flood Depth Estimate with a New Calibrated Curve Number Runoff Prediction Model. IEEE Access 2020, 8, 10915–10923. [Google Scholar] [CrossRef]
- Sarhadi, A.; Soltani, S.; Modarres, R. Probabilistic Flood Inundation Mapping of Ungauged Rivers: Linking GIS Techniques and Frequency Analysis. J. Hydrol. 2012, 458–459, 68–86. [Google Scholar] [CrossRef]
- Wang, Y.; Meng, F.; Liu, H.; Zhang, C.; Fu, G. Assessing Catchment Scale Flood Resilience of Urban Areas Using a Grid Cell Based Metric. Water Res. 2019, 163, 114852. [Google Scholar] [CrossRef]
- Martinis, S.; Plank, S.; Ćwik, K. The Use of Sentinel-1 Time-Series Data to Improve Flood Monitoring in Arid Areas. Remote Sens. 2018, 10, 583. [Google Scholar] [CrossRef] [Green Version]
- Mondlane, A.; Hasson, K.; Popov, O. E-Governance and Natural Hazards in Mozambique: A Challenge for Backasting Method Used for Flood Risk Management Strategies. Available online: www.igi-global.com/chapter/e-governance-and-natural-hazards-in-mozambique/115679 (accessed on 22 December 2020).
- Schaer, C. Condemned to Live with One’s Feet in Water? A Case Study of Community Based Strategies and Urban Maladaptation in Flood Prone Pikine/Dakar, Senegal. Int. J. Clim. Chang. Strat. Manag. 2015, 7, 534–551. [Google Scholar] [CrossRef] [Green Version]
- Tasantab, J.C.; Gajendran, T.; von Meding, J.; Maund, K. Perceptions and Deeply Held Beliefs about Responsibility for Flood Risk Adaptation in Accra Ghana. Int. J. Disaster Resil. Built Environ. 2020, 11, 631–644. [Google Scholar] [CrossRef]
- Wung, G.B.; Aka, F.T. Enhancing Resilience against Floods in the Lower Motowoh Community, Limbe, Southwest Cameroon. Disaster Prev. Manag. Int. J. 2019. [Google Scholar] [CrossRef]
- The Impact of Climate Change on The Dynamics of Agricultural Systems in South-Western Romania—Carpathian Journal of Earth and Environmental Sciences. Available online: http://www.cjees.ro/viewTopic.php?topicId=358 (accessed on 23 January 2021).
Figure 1.
Number of publications per year.

Figure 2.
Spatial distribution of research with the number of publications per continent.

Figure 3.
Number of papers per research category.

Publisher’s Note: MDPI stays neutral with regard to jurisdictional claims in published maps and institutional affiliations. |
© 2021 by the authors. Licensee MDPI, Basel, Switzerland. This article is an open access article distributed under the terms and conditions of the Creative Commons Attribution (CC BY) license (http://creativecommons.org/licenses/by/4.0/).
Share and Cite
MDPI and ACS Style
Diaconu, D.C.; Costache, R.; Popa, M.C. An Overview of Flood Risk Analysis Methods. Water 2021, 13, 474. https://doi.org/10.3390/w13040474
AMA Style
Diaconu DC, Costache R, Popa MC. An Overview of Flood Risk Analysis Methods. Water. 2021; 13(4):474. https://doi.org/10.3390/w13040474
Chicago/Turabian StyleDiaconu, Daniel Constantin, Romulus Costache, and Mihnea Cristian Popa. 2021. "An Overview of Flood Risk Analysis Methods" Water 13, no. 4: 474. https://doi.org/10.3390/w13040474
Note that from the first issue of 2016, this journal uses article numbers instead of page numbers. See further details here.