
Ecotrophic Effects of Fishing across the Mediterranean Sea
by
 , , and
Donna Dimarchopoulou
1,† ,
,
Ioannis Keramidas
1,
Georgios Sylaios
2 and
Athanassios C. Tsikliras
1,* 1
Laboratory of Ichthyology, School of Biology, Aristotle University of Thessaloniki, 541 24 Thessaloniki, Greece
2
Laboratory of Ecological Engineering & Technology, Department of Environmental Engineering, Democritus University of Thrace, 671 00 Xanthi, Greece
*
Author to whom correspondence should be addressed.
†
Current address: Department of Fisheries, Animal and Veterinary Sciences, College of the Environment and Life Sciences, University of Rhode Island, Kingston, RI 02881, USA.
Water 2021, 13(4), 482; https://doi.org/10.3390/w13040482
Submission received: 30 December 2020
/
Revised: 30 January 2021
/
Accepted: 8 February 2021
/
Published: 12 February 2021
(This article belongs to the Special Issue Observations and Models for End-User Services in Coastal Marine Systems)
Abstract
:The status of the Mediterranean Sea fisheries was evaluated across the seven subdivisions of the General Fisheries Commission for the Mediterranean (GFCM), using ecotrophic and catch-based indicators for the period 1970–2017. All indicators confirmed that the fishery resources across the Mediterranean Sea are no longer sustainably exploited and that the structure and function of marine ecosystems has been altered as a result of overexploitation. Although declining catches were a common feature across the Mediterranean Sea, the pattern of exploitation and the state of stocks differed among the subdivisions, with the Levantine Sea and Sardinia having a better status. Although they only include the exploited biological resources of marine ecosystems, catch and ecotrophic indicators can provide insight on ecosystem status and fishing pressure. In the case of southern Mediterranean countries, catch and trophic levels are the only information available, which is extremely valuable in data-poor ecosystems.
1. Introduction
Ecosystem evaluation is very important before and after the implementation of any management measure in order to assess previous ecosystem status and the efficiency of management. Ecosystem and ecological indicators are useful tools in assessing the current and future state of marine ecosystems and in testing management scenarios [1], and can be divided into five types: biomass-based, catch-based, trophic-based (or ecotrophic), size-based and species-based (or biodiversity) indicators [2]. Catch-based and ecotrophic indicators require catch time series and the trophic level of the species/stocks. Biomass-based indicators require the biomass of all species (or functional groups) from scientific surveys or stock assessments that are only sporadically available for most Mediterranean areas and span short periods of time [3]. The same holds for size-based indicators that require field data collections through regular monitoring and sampling programs.
The Mediterranean Sea is a biodiversity hotspot [4] with multi-fleet and multi-species fisheries that are controlled by a large number of European Union (EU) and non-EU countries [5]. Nevertheless, Mediterranean fisheries are not regularly monitored, something that places this region among the most data-poor areas of the world [6]. The types of available data are presented below. The collection of biological data for the exploited fish and invertebrate stocks is based on scientific surveys that have operated around the northern Mediterranean coastline since around 2000 [7]. These data series are often incomplete, seasonal, focused on demersal organisms [8] and on commercially important fishes, such as the European hake Merluccius merluccius and red mullet Mullus barbatus. Thus, the collection of biomass and length frequency distribution time series for all marine populations to evaluate ecosystem structure (size-based indicators) is an impossible task in the Mediterranean Sea. In contrast, catch data are available for most commercial species across all Mediterranean Sea areas and General Fisheries Commission for the Mediterranean (GFCM) subdivisions from 1970. In areas with no or limited biomass data, the official catch (=landings) data can be used to determine catch-based ecosystem indicators.
Excessive fishing generally results in the shrinking of marine food webs and biomass declines of the large predatory fishes [9]. The effects of fishing on marine food webs, marine populations and ecosystem structure and function have been globally examined using ecotrophic indicators, mainly through the temporal variability of the mean weighted trophic level of the catch [10], by approximating fish length with trophic level. These indicators are based on the positive relationship between the two variables [11] and the preferential removal of large individuals by fishing [10], as larger fish attain a higher price both within and among species [12]. The mean weighted trophic level of the catch well serves the purpose of identifying inter-specific declines of large predatory fish [10] that have since been confirmed to occur in many areas of the world [13].
The present work aims to examine the ecosystem status across the Mediterranean Sea using catch and ecotrophic indicators. Catch indicators provide insights on fishery impacts, whereas ecotrophic indicators show whether the mean size of commercial marine fishes and invertebrates is declining across time and whether marine food webs are shrinking, leading to disrupted ecosystem structure and function. These hypotheses were accompanied by a fisheries dataset to test whether any potentially observed food web shrinkage is a consequence of fisheries overexploitation. The Mediterranean Sea fisheries have been previously evaluated with data up to 2010, as a whole [14] and at subarea levels [15] and recently at different spatial resolutions [16]. Here, we present an updated dataset up to 2017 and apply the ecotrophic indicators at a higher resolution, i.e., at the subdivision level (Figure 1).
2. Materials and Methods
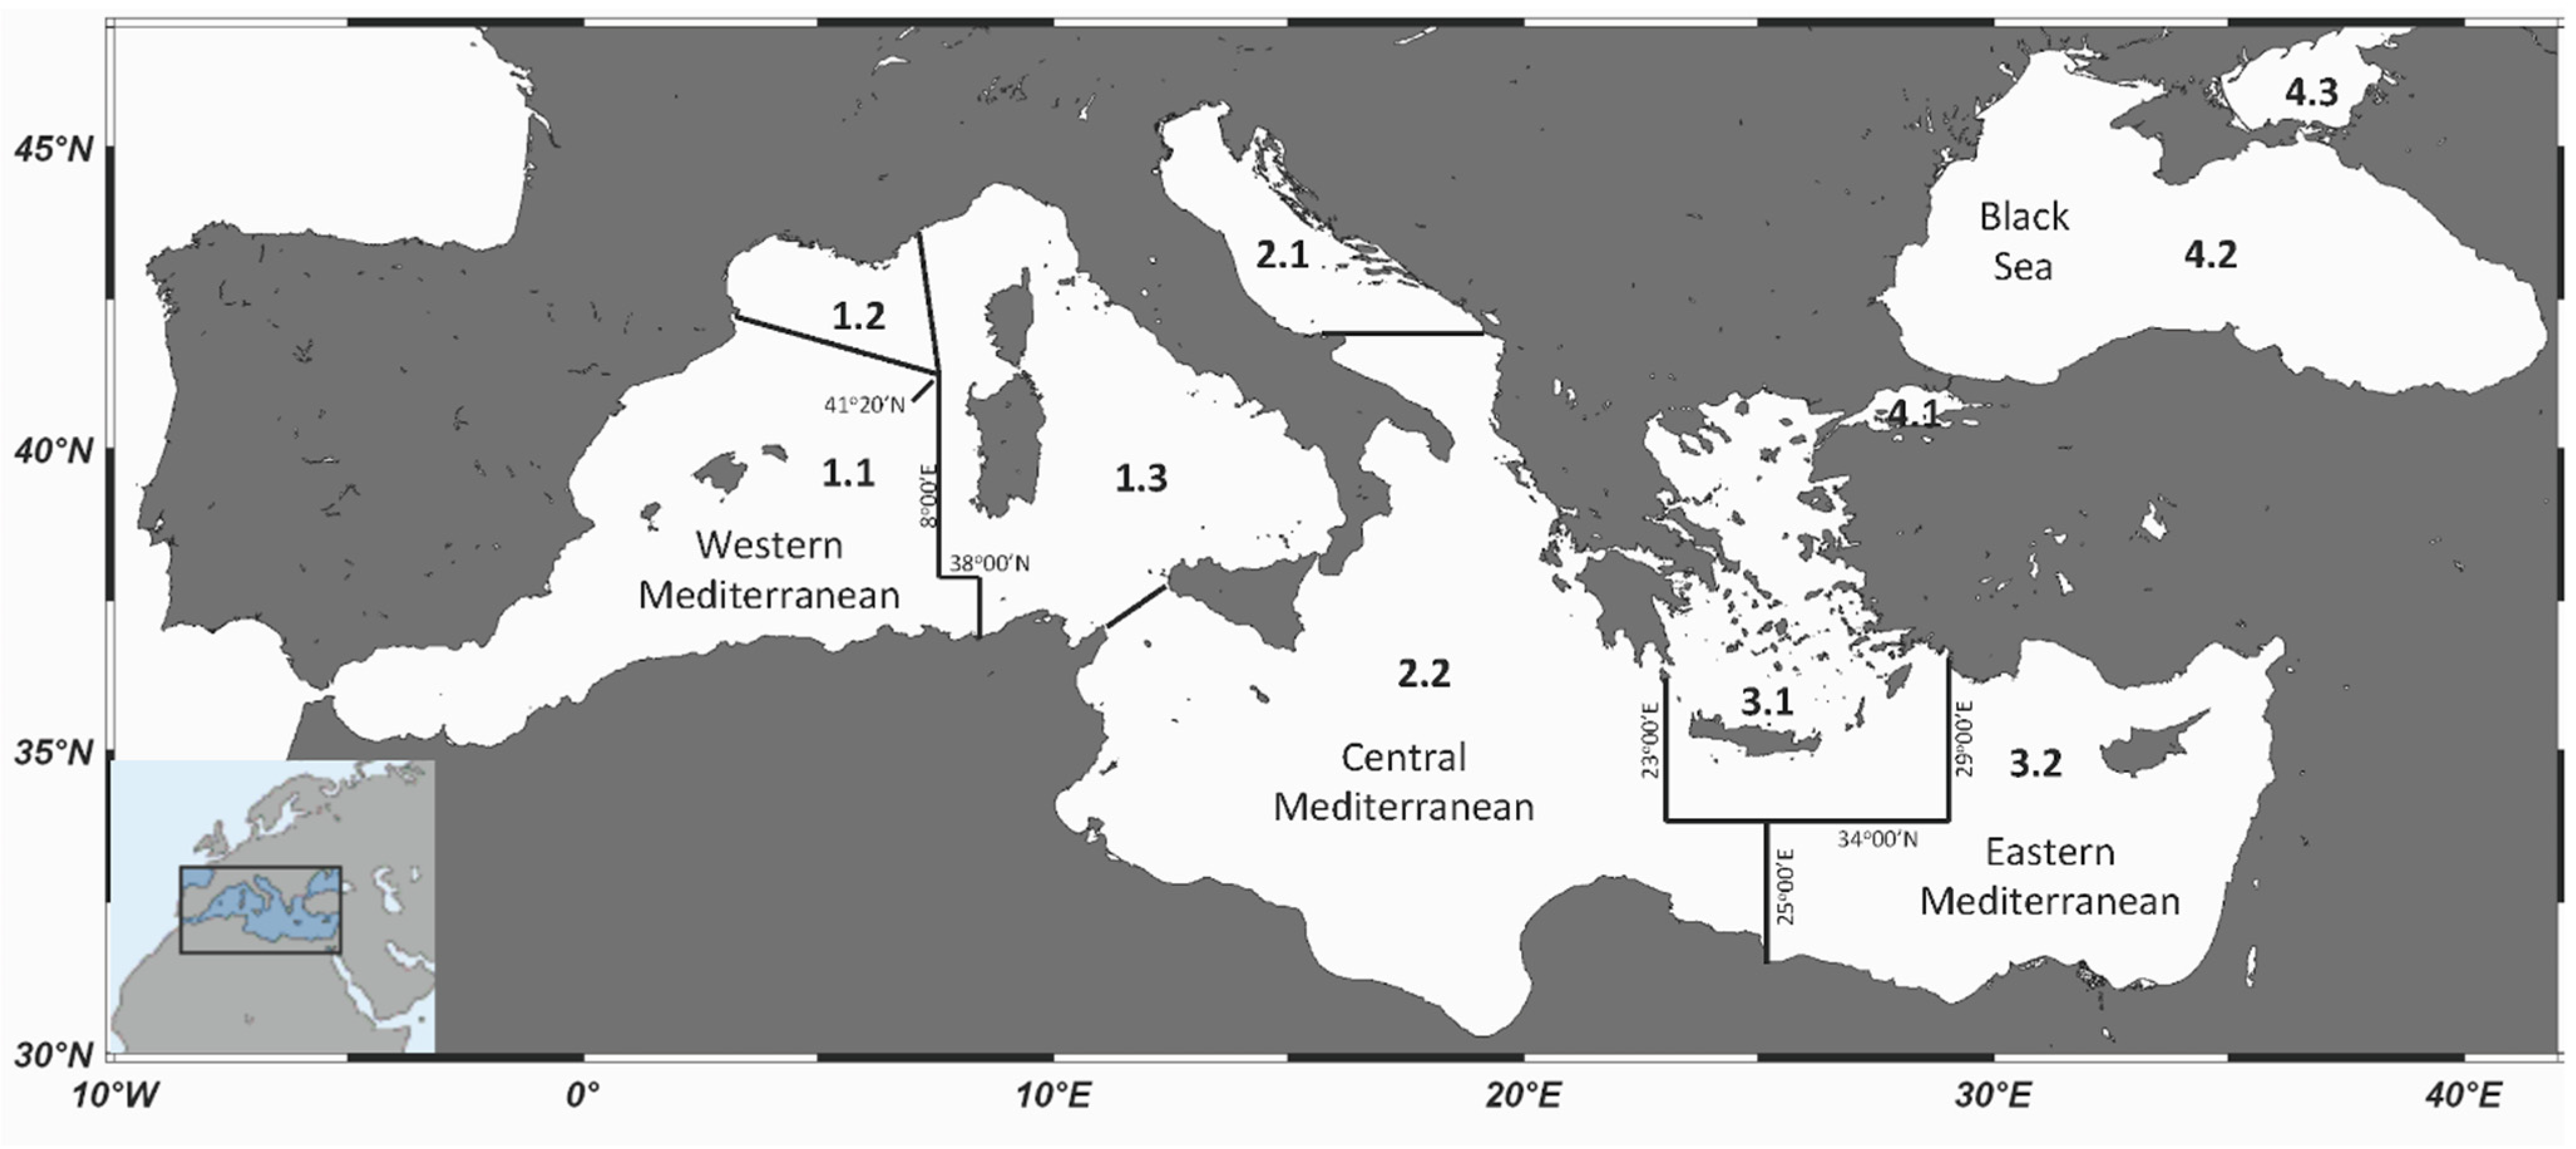
The Mediterranean Sea is typically divided into three subareas (western, central and eastern), which have been further divided by the General Fisheries Commission for the Mediterranean Sea (GFCM) into seven subdivisions for management and fishery purposes (Figure 1). The western part of the Mediterranean Sea is split into three subdivisions (Balearic Islands, Gulf of Lions and Sardinia), the central part into two (Adriatic Sea and Ionian Sea) and the eastern part into two subdivisions (Aegean Sea and Levantine Sea).
The annual disaggregated landings of the fishery stocks per country and subdivision have been recorded since 1970 by the GFCM. They include the legal and officially reported large- and small-scale fishery catches (excluding discarded catch, illegal, unreported, recreational, subsistence and sport fishing) expressed as the live weight equivalent of landings. The landings were extracted for each subdivision from the FAO/GFCM FishStat J database (http://www.fao.org/fishery/statistics/software/fishstatj/en, (accessed on 30 December 2020)). Catch statistics for Greece were corrected to account for the presentist bias [17], as the catches of an additional small-scale coastal fleet are reported together with the existing bottom-trawlers, purse-seiners, boat-seiners and other coastal vessels [18,19] after 2016 [20].
The mean weighted trophic level of the catch (mTLc) that has been used to assess the effect of fisheries on marine ecosystems [21] was explored for the same period (1970–2017) for each subdivision. The mTLc for each year (k) was calculated annually for all species and trophic levels according to the formula [9]:
where Yi refers to the landings of a species (or group of species) i for the year k, TL is the corresponding trophic level of the species i and m is the total number of species in the annual landings. The trophic levels of each species were taken from FishBase [10] and SeaLifeBase [22]. Trophic level indicates the position of a species within a food web based on the number of feeding links between the species and the primary producers [23]. Primary producers (such as phytoplankton and plants) and detritus have a default trophic level of 1, herbivores have a trophic level of 2, carnivores have a trophic level of at least 3. Trophic level may exceed 5 for predators of marine mammals. Non-integer trophic levels result from mixed diets, i.e., feeding at more than one trophic level. For example, a small pelagic species feeding on 50% phytoplankton (trophic level of 1) and 50% phytoplanktivorous zooplankton (trophic level of 2) will have a trophic level of 2.5.
The Fishing in Balance (FiB) index, which complements the mTLc analysis, was calculated for the same period for which catch data were available per year (k) as follows [24]:
where Y is the catch, mTLc is the mean trophic level of the catch in the year k, the subscript 0 refers to the first year in a time series that is used as a baseline and TE is the mean energy-transfer efficiency between trophic levels that is assumed to be 0.1 [24]. The FiB index attains a value of 0 for the first year of the series and does not vary in periods in which the mean weighted trophic level and catches change in opposite directions, unless the effect of catch (or mTLc) is very strong. When the trends of both the catch and the mTLc are increasing (or declining), then the increase (or decline) in the FiB index is stronger. Increasing or decreasing FiB values indicate a geographic expansion or contraction—or collapse—of the fishery in question, respectively [24]. Negative and declining FiB values are indicative of overexploitation.
The geom_smooth function of R (ggplot2) that allows for adding the trend and the confidence interval around it was applied to all time series. LOESS (locally weighted polynomial) smoothing, a non-parametric form of regression that uses a weighted, sliding-window average to calculate a line of best fit, was selected.
The status of each division was assessed by comparing the value and the trend of the catch, and the mTLC and the FiB index in 2017 to the highest historical value. Catch increases and declines of less than 10% were assessed as good status (green colour), declines of 10–30% as intermediate (orange colour) and declines exceeding 30% were assessed as bad status (red colour). Similarly, mTLc increases or declines of less than 0.1 were as assessed good status (green colour), declines of 0.1–0.2 as intermediate (orange colour) and declines exceeding 0.3 were assessed as bad status (red colour). Finally, a positive and increasing FiB index, as well as positive and stable values with no trend, were assessed as good (green colour). Positive and declining values, as well as negative and increasing values, were assessed as intermediate (orange colour) and a negative and declining FiB index, as well as negative and stable values with no trend, were assessed as bad (red colour). The overall status emerged from combining the status of the three indicators.
3. Results
3.1. Catch Trends
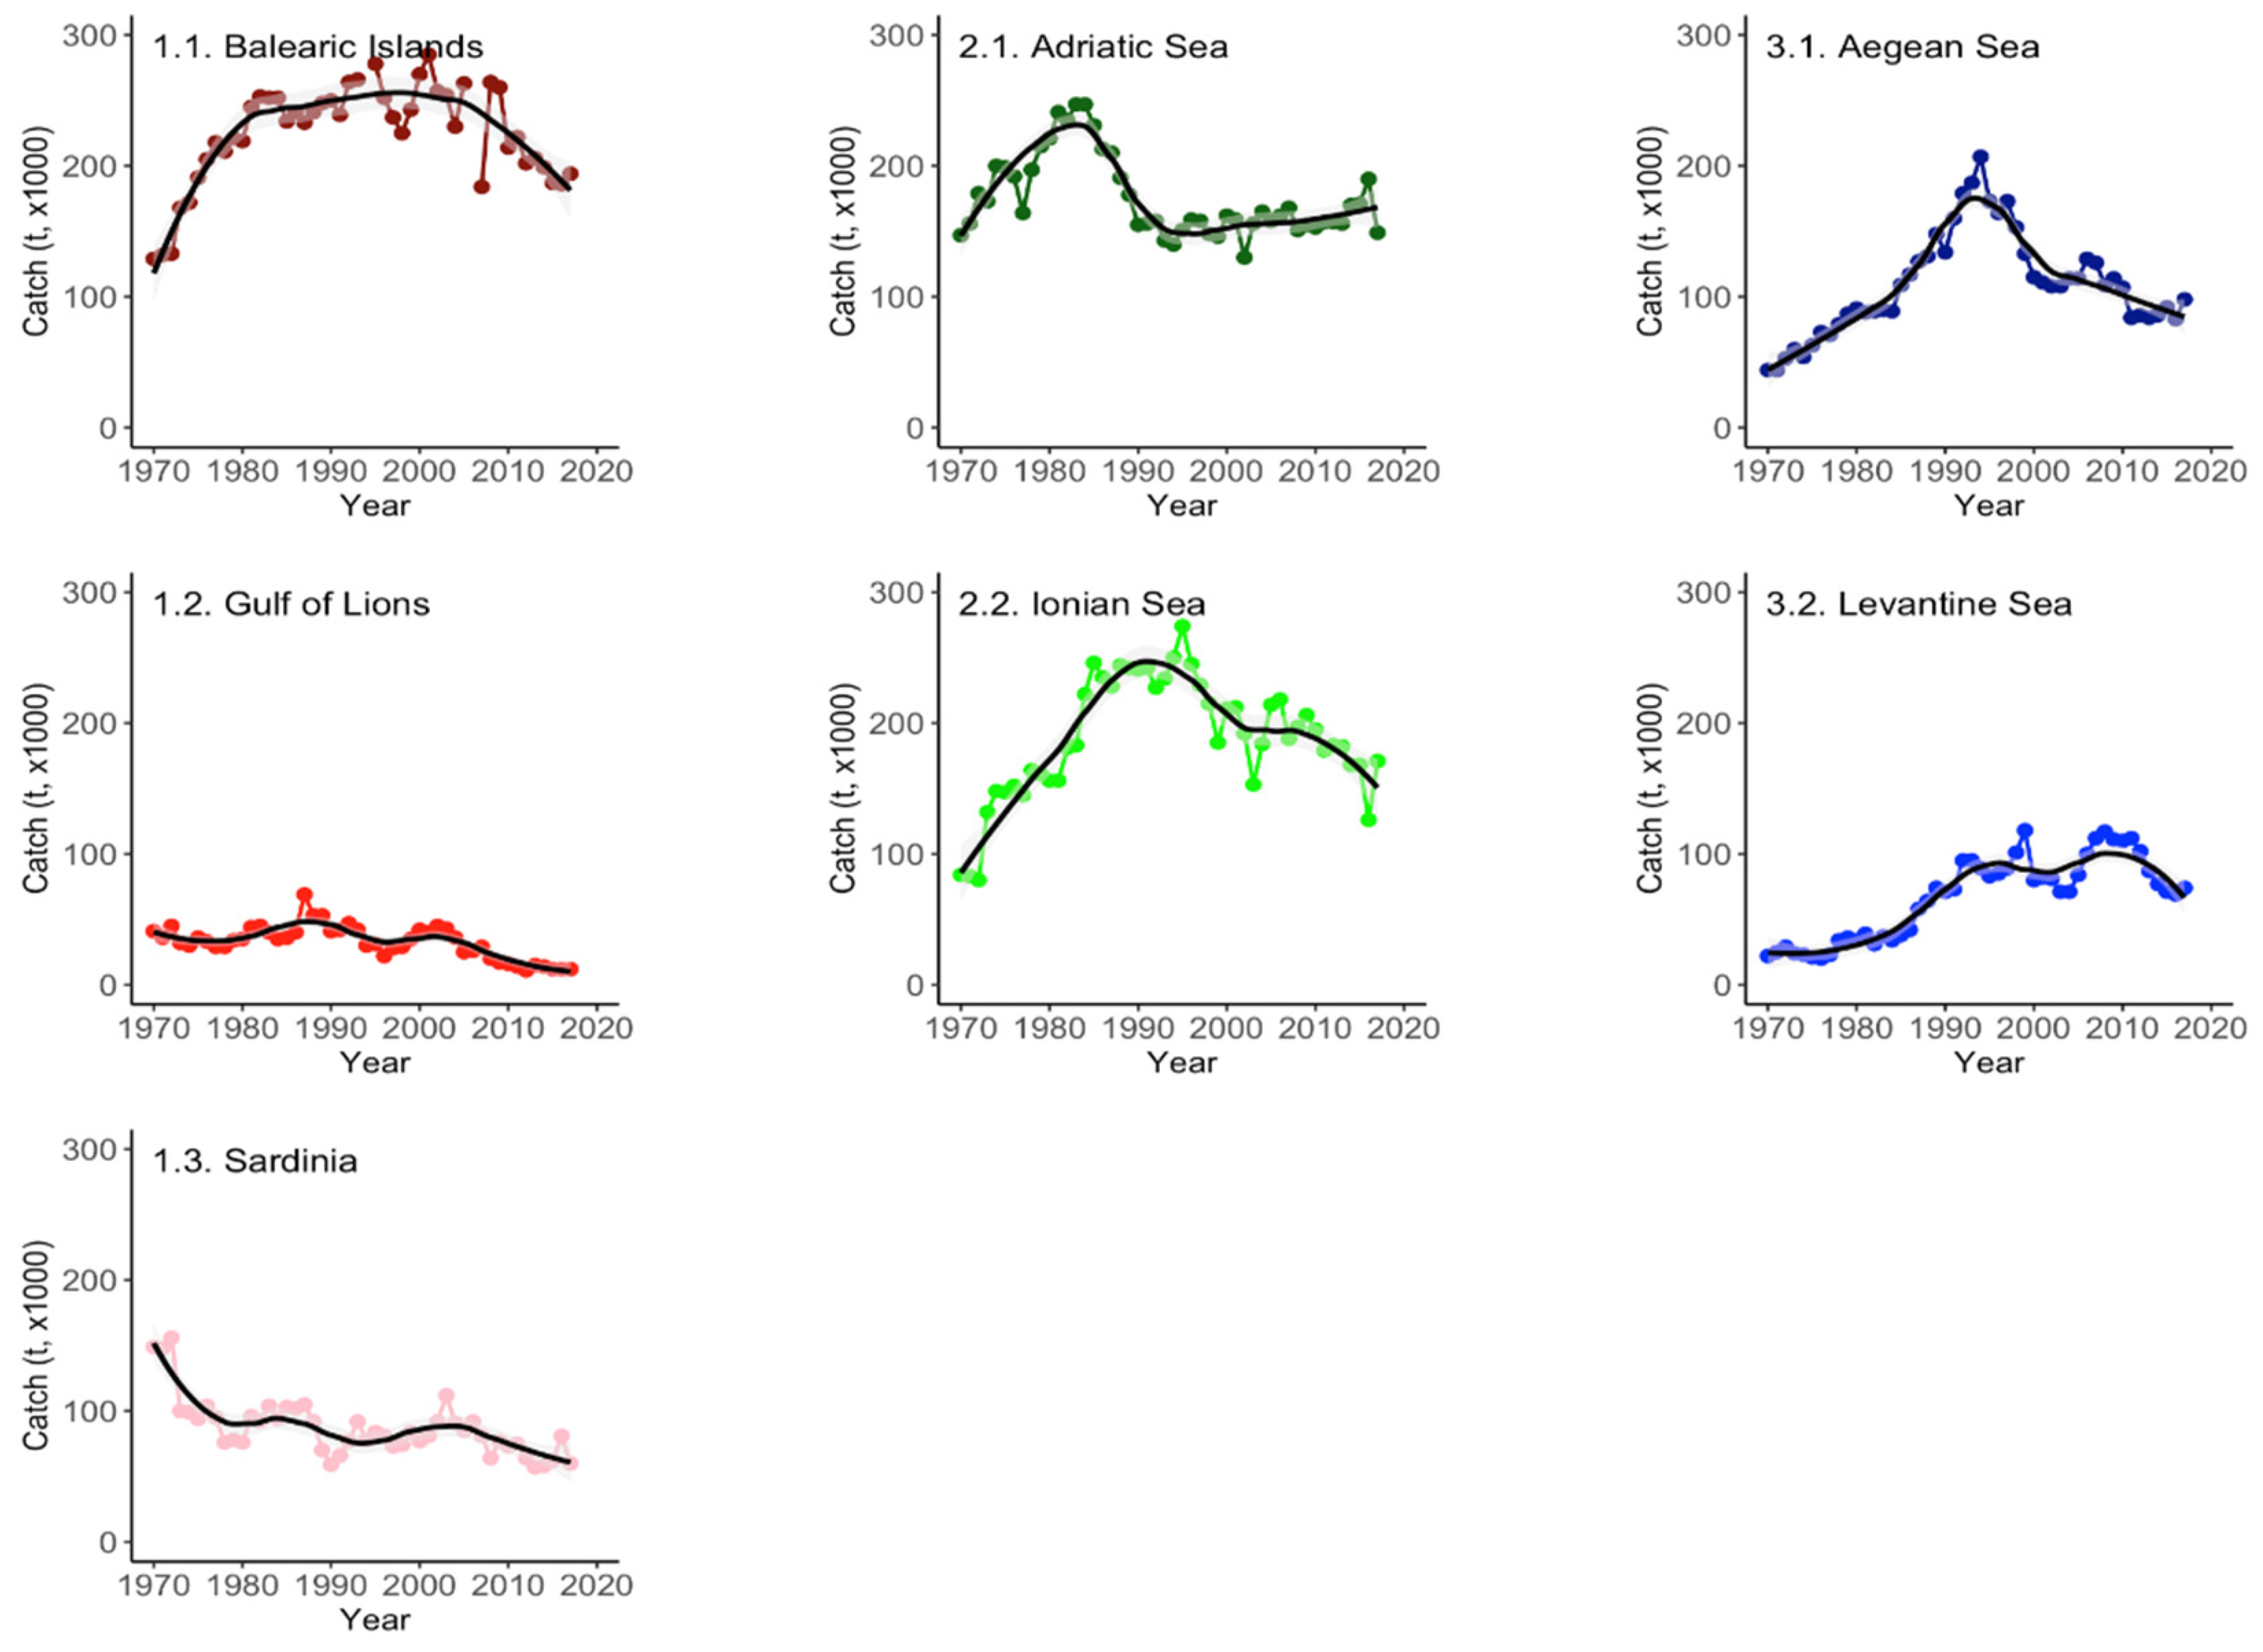
In the western Mediterranean Sea, total catches in the Balearic Islands (1.1) increased between 1970 and 1980, remained rather stable to around the mid-2000s and gradually declined thereafter (Figure 2: top left). In the Gulf of Lions, the total catches presented two maximum modes, one in the late 1980s and one in the early 2000s and a constant decline thereafter (Figure 2: mid-left). The total catches of Sardinia have been gradually declining since 1970, with the lowest catch observed during the last decade (Figure 2: bottom left).
In the central Mediterranean Sea, the total catches of the Adriatic Sea rapidly increased from 1970 to a maximum in the mid-1980s and sharply declined thereafter up to the early 1990s; since then they have shown a tendency to increase at a very slow rate (Figure 2: top centre). In the Ionian Sea, the total catches increased for 25 years to their maximum value and declined thereafter at a slower rate (Figure 2: mid-centre).
In the eastern Mediterranean Sea, the total catches of the Aegean Sea increased from 1970 to a maximum in 1994 and continuously declined thereafter to less than 40% of their historical highest value (Figure 2: top right). In the Levantine Sea, total catches increased to a maximum around 2010 and declined thereafter (Figure 2: mid-right).
3.2. Mean Weighted Trophic Level of the Catch (mTLc)
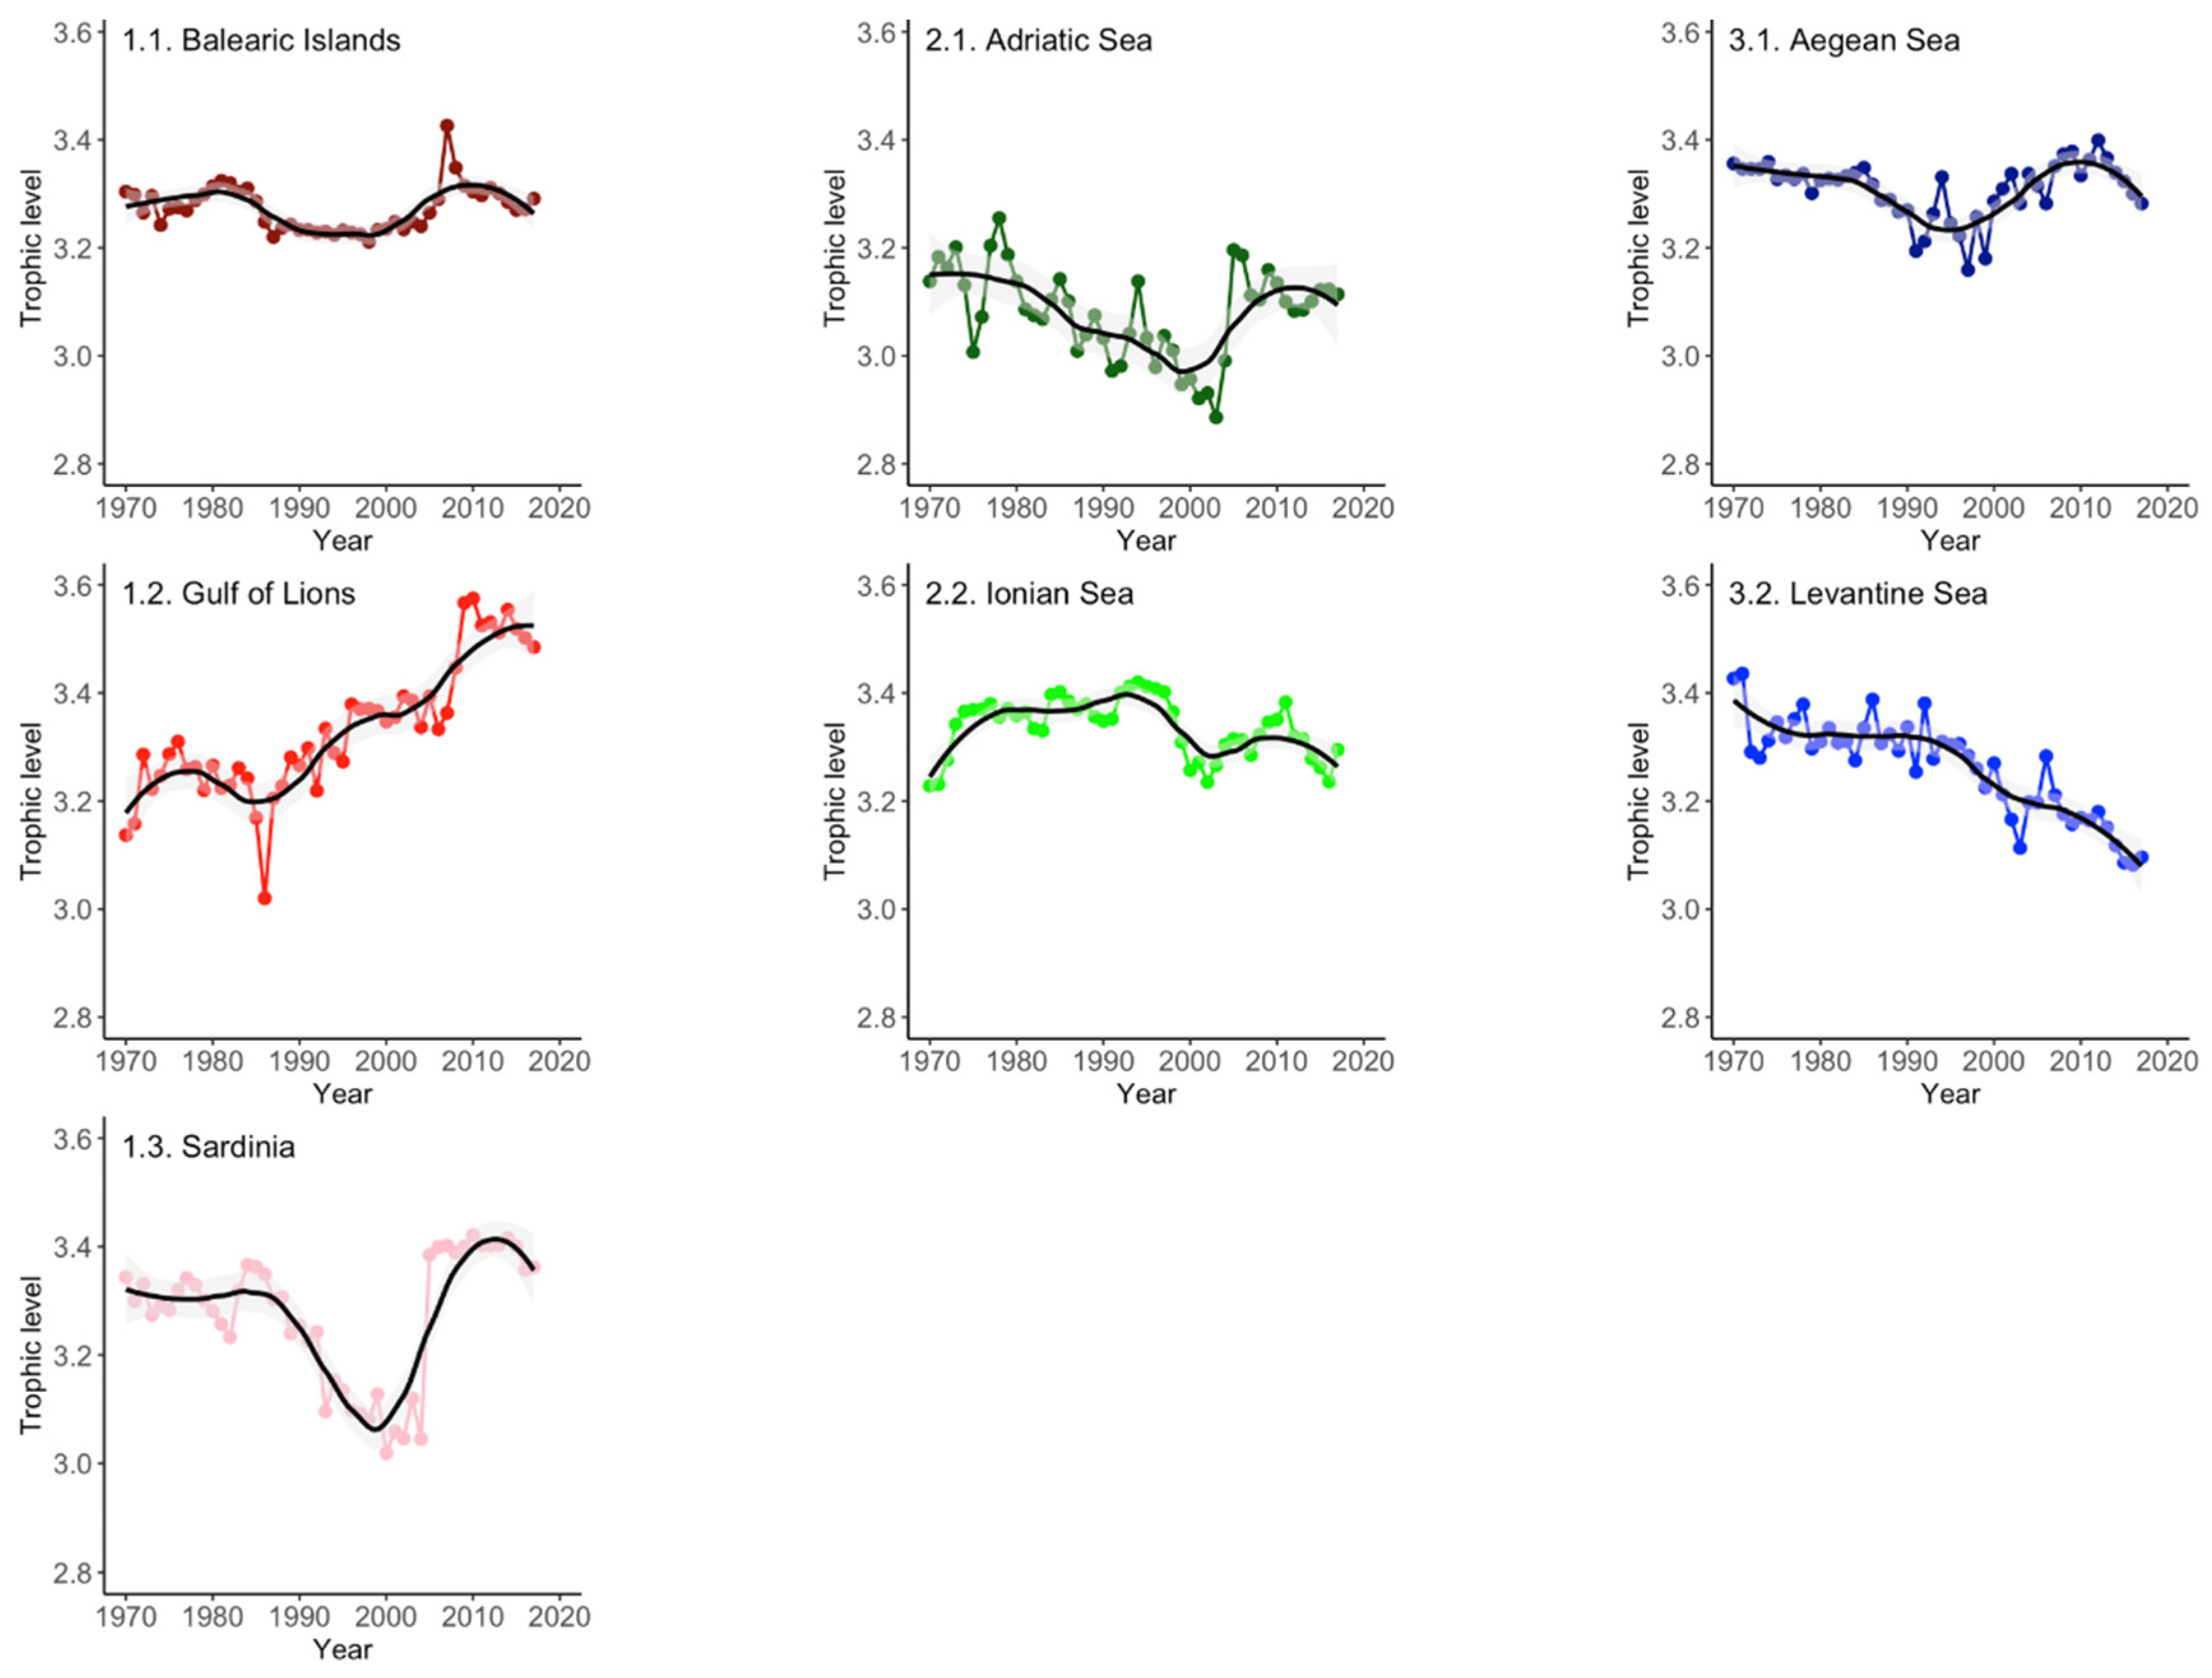
In the western Mediterranean Sea, the mean weighted trophic level of the catch (mTLc) in the Balearic Islands fluctuated around 3.3 for the entire time series with a declining trend after the late 2000s (Figure 3: top left). In the Gulf of Lions, mTLc increased from 1970, reached a maximum in 2010 and declined thereafter (Figure 3: mid-left). In Sardinia, mTLc was initially stable, dropped rapidly to a minimum in the mid-2000s and increased thereafter; it has been rather stable during the last decade (Figure 3: bottom left).
In the central Mediterranean Sea, mTLc in the Adriatic Sea declined from 1970 to a minimum in the early 2000s, sharply increased until 2010 and remained rather stable thereafter (Figure 3: top centre). In the Ionian Sea, mTLc initially increased and remained stable for 20 years and then displayed a decreasing trend, which has been more apparent since 2010 (Figure 3: mid-centre).
In the eastern Mediterranean Sea, the mTLc of the Aegean Sea gradually declined from 1970 to 2000 and then sharply increased up to around 2010. Since then, a continuous decline has been observed (Figure 3: top right). The mTLc of the Levantine Sea displayed a continuous decline from 1970 to a minimum in 2015 (Figure 3: mid-right).
3.3. Fishing in Balance (FiB) Index
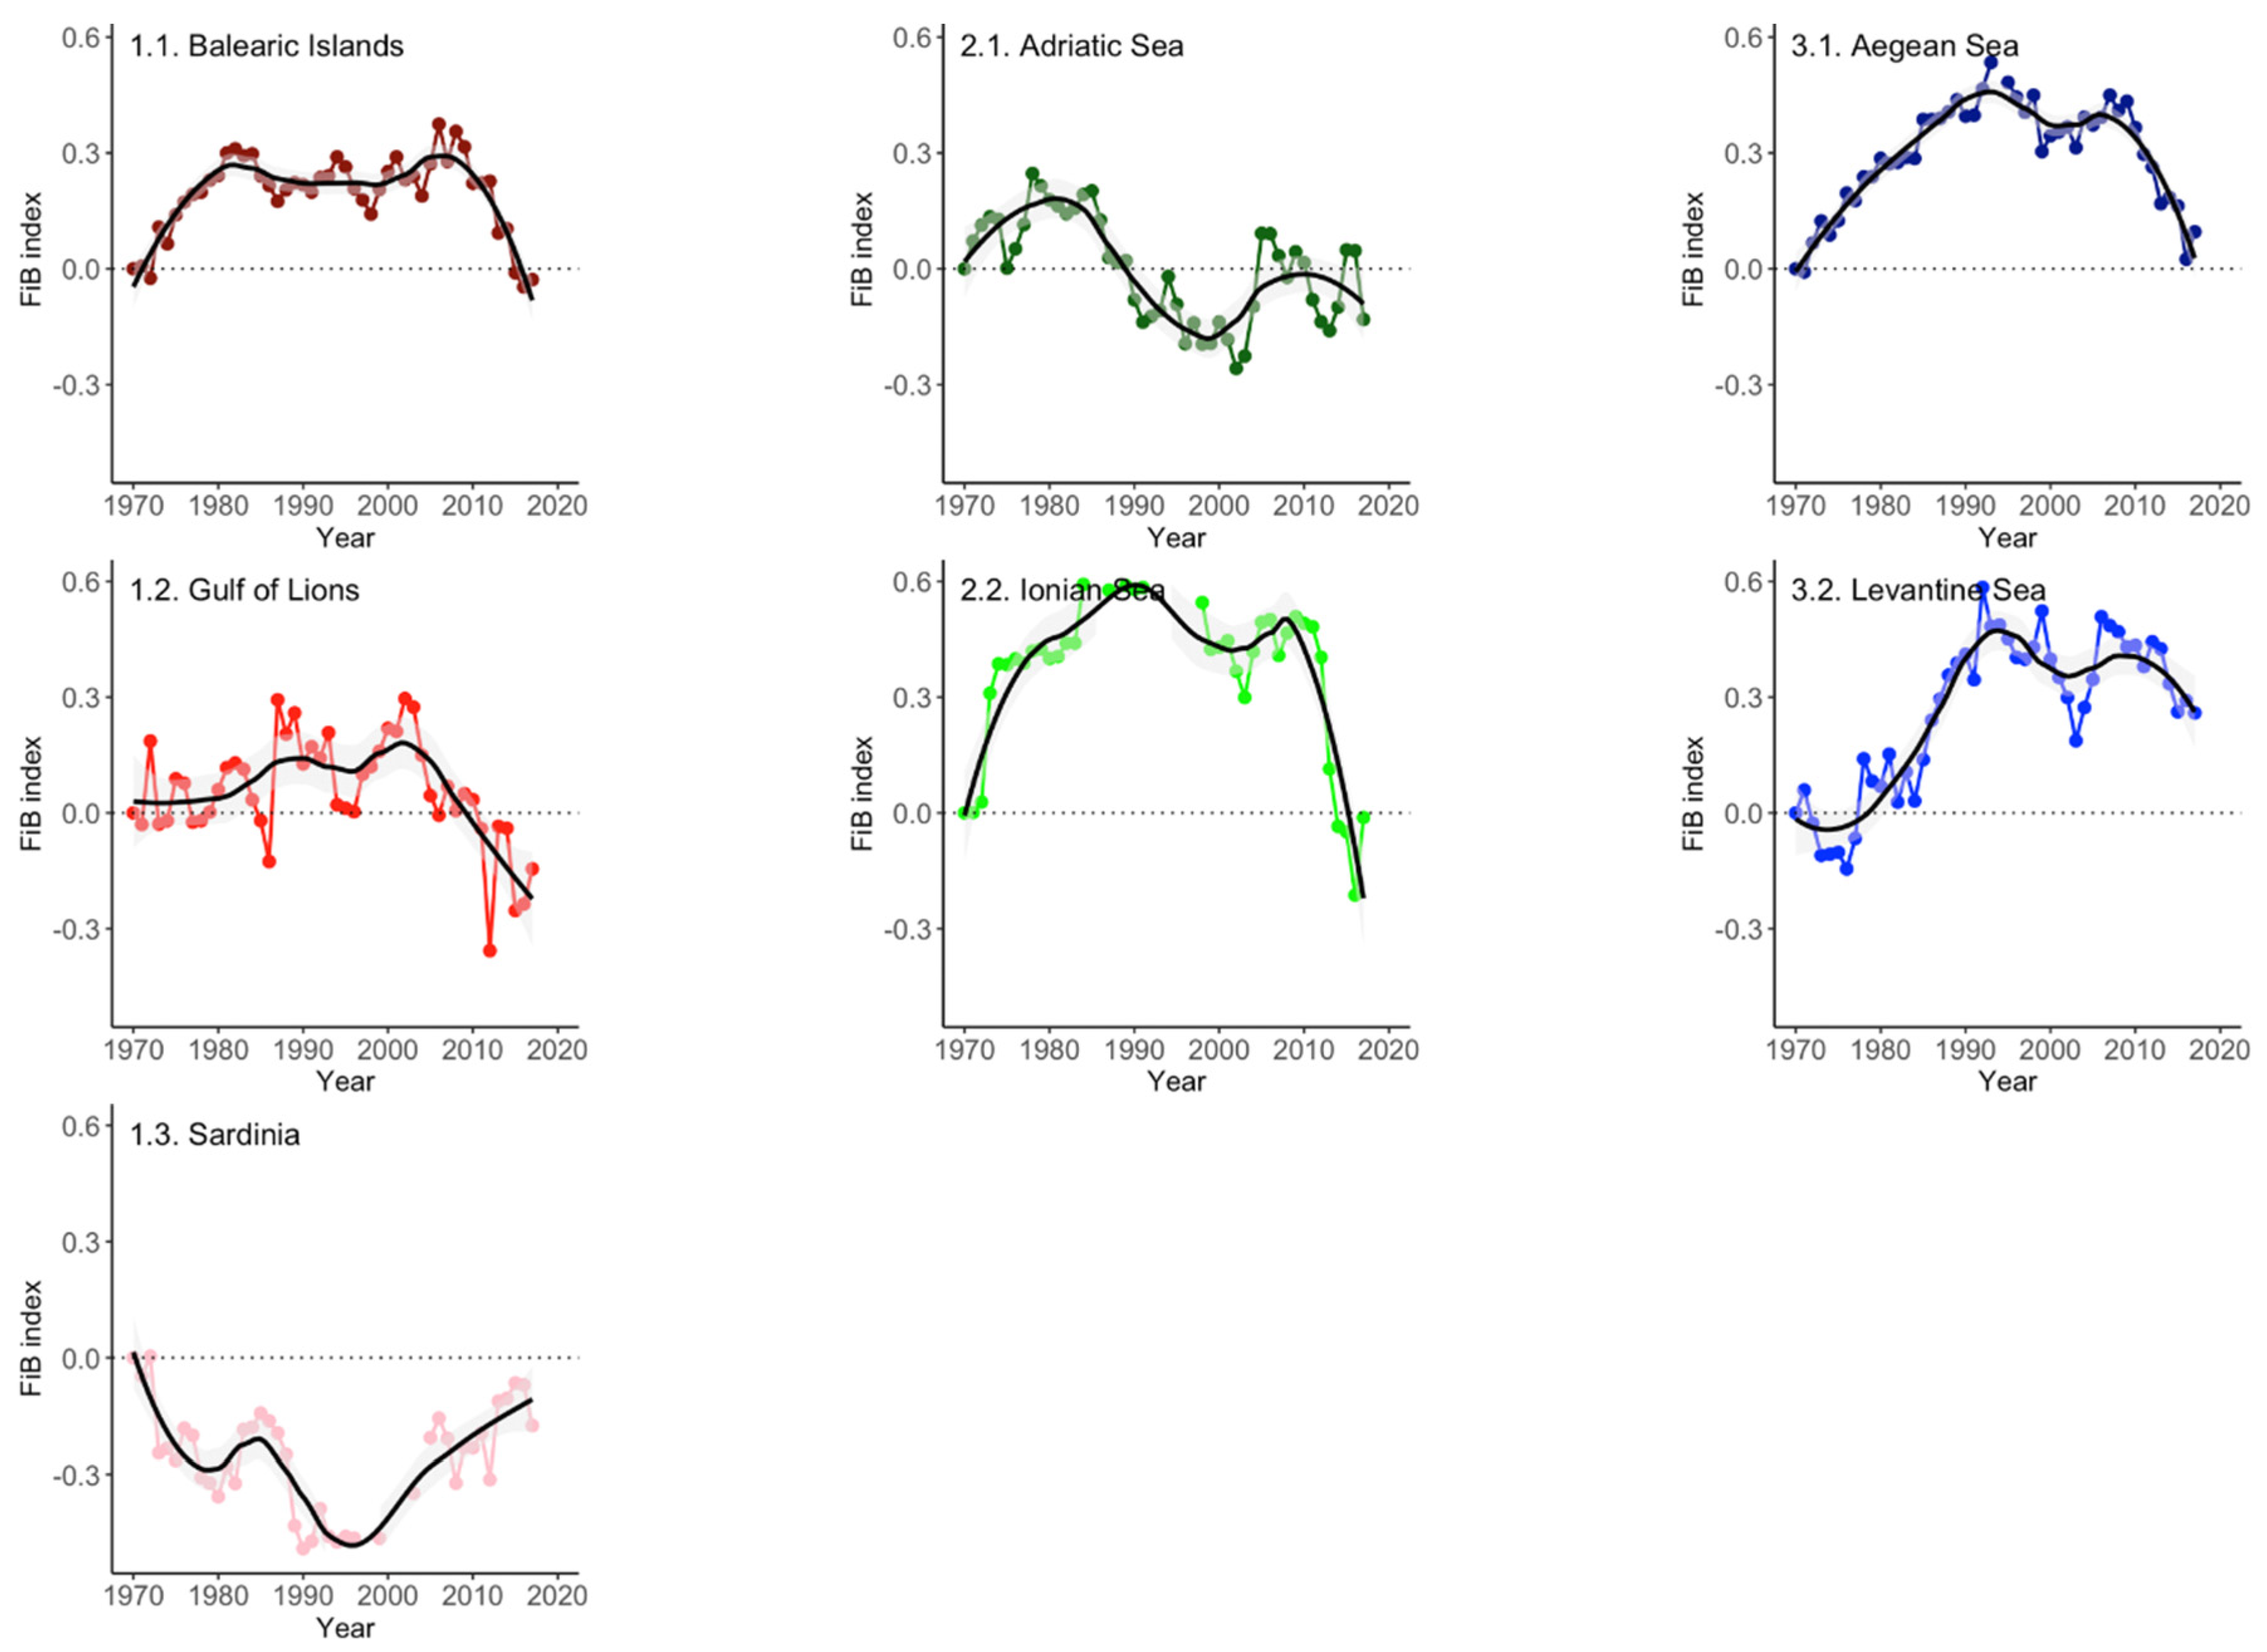
In the western Mediterranean Sea, the FiB index in the Balearic Islands sharply increased from 1970 until 1980, remained stable for around 30 years and has consistently declined since 2010, becoming negative during the last three years (Figure 4: top left). In the Gulf of Lions, the FiB index gradually increased from 1970 to the early 2000s with fluctuations and declined therafter, reaching negative values after 2010 (Figure 4: mid-left). In Sardinia, the FiB index was negative during the entire time series, with a declining trend from 1970 to 2000 and a continuously increasing trend since then (Figure 4: bottom left).
In the central Mediterranean Sea, the FiB index in the Adriatic Sea increased from 1970 to the mid-1980s and thereafter gradually declined to mostly negative values with fluctuations in the last twenty years (Figure 4: top centre). The FiB index in the Ionian Sea sharply increased from 1970 until about the mid-1980s, remained rather stable for thirty years and from 2010 sharply declined to a minimum in 2017 (Figure 4: mid-centre).
In the eastern Mediterranean Sea, the FiB index in the Aegean Sea remained positive during the entire time series and increased from 1970 until about the mid-1990s and then constantly declined to its lowest value in 2017, with the exception of a slight recovery between 2005 and 2012 (Figure 4: top left). In the Levantine Sea, the FiB index sharply increased from 1970 to the mid-1990s and thereafter gradually declined with fluctuations but remained positive for most of the time series (Figure 4: mid-left).
3.4. Overall Assessment
Based on the variation of catches, mTLC and the FiB index, the overall performance of each subdivision was evaluated (Table 1). The catch trends were declining in six out of seven subdivisions, as mTLc was declining in one (3.2. Levantine Sea), increasing in two and remained rather stable in four subdivisions, whereas the FiB index was declining in four and remained stable in two subdivisions. It appears that none of the subdivisions had a good status and three of them (1.3. Sardinia, 3.1. Aegean Sea and 3.2. Levantine Sea) had an intermediate status. The remaining four subdivisions (1.1. Balearic Sea, 1.2. Gulf of Lions, 2.1. Adriatic Sea and 2.2. Ionian Sea) had a bad status, with two out of three indicators being classified as “red” (Table 1).
4. Discussion
During the second half of the 20th century, fishing pressure expanded geographically and bathymetrically in the Mediterranean Sea, exploiting all levels of marine food webs [25]. Several technological advances have been incorporated into fishing vessels and gears, increasing, even more, the pressure on stocks and habitats through technological creep [26]. This expansion of fisheries appears to have a clear effect across the Mediterranean Sea in terms of declining catches (Figure 2) and somatic sizes, as approximated by the mTLc (Figure 3). Indeed, total catches have been declining for at least 20–30 years in all subdivisions except for the Levantine Sea, where the decline has only become apparent in the last five years (Figure 2). Assuming constant or increasing effort through technological creep, declining catches are indicative of unsustainable exploitation and bad stock status. The northern Mediterranean coastline and especially the coasts of Spain, Italy and Greece, which have very large fishing fleets and long fishery traditions, have been among the most heavily exploited ecosystems in the Mediterranean Sea [3], with catches declining for over twenty years [15] and showing no sign of recovery.
A declining trophic level (mTLc) pattern indicates that the percentage of large species in the catches is declining. This pattern has been stronger in the Ionian and the Levantine Seas since 1970 and for the last decade in the Balearic Islands and Adriatic and Aegean Seas (Figure 3). The decrease in large species is related to their preferential removal from the sea because of their higher value [11] and is a clear sign of disruption in ecosystem structure and function, i.e., ecosystem overfishing [27]. A stable trophic level pattern, as in the Balearic Islands throughout the time series and in Sardinia during the last decade (Figure 3), indicates that the proportion of large and small species in the catch was stable and that the structure and function of the ecosystem remained unchanged. Finally, a continuous increase in mTLc, as in the Gulf of Lions, shows that the percentage of large individuals was increasing and/or that of small ones was declining. Indeed, in the Gulf of Lions, the catch of European anchovy Engraulis encrasicolus and European pilchard Sardina pilchardus collapsed in 2008, leading to an expansion of the mTLc [28]. Previous research including the basins of the Mediterranean Sea [15] and the GFCM subdivisions, but focusing on the European Mediterranean countries and fisheries (western Mediterranean: [29]; Adriatic Sea: [30]; Aegean and Ionian Seas: [31]), confirm the results of the present work. An overall ecosystem degradation over time has also been observed across the whole Mediterranean Sea according to model-based indicators, such as community biomass, trophic levels, catch and diversity [32].
The decline of the FiB index in the Balearic Islands and Ionian Sea, with a constant or slightly declining mTLc trend, can be attributed to the decline in catch and indicates unsustainable fisheries (Figure 4). In the last decade, in the Gulf of Lions and Aegean Sea, there was a strong decline in the FiB index due to declines in both the catch and the mTLc. The strong decline in the FiB index to negative values indicates overexploitation of resources and unsustainable fisheries that have affected (or will affect shortly) ecosystem structure and function [24]. The sharp increase in the FiB index from 1970 to 1985 in the Adriatic Sea clearly reflects a geographic and/or bathymetric expansion of local fisheries. The sharp decline in the FiB index after a period of increase in five subdivisions (1.1. Balearic Islands, 1.2. Gulf of Lions, 2.2. Ionian Sea, 3.1. Aegean Sea, 3.2. Levantine Sea) was due to declines in both the catch and the mTLc and indicates that fisheries are no longer efficient. Despite the increasing trend of the mTLc in the Levantine Sea, the signal of catch trends was stronger because the difference from the highest to the lowest values was very wide and led to a decline in the FiB index.
The Levantine Sea, which has a better status compared to other areas, is heavily affected by alien species entering the Mediterranean through the Suez Canal [33]. These alien species have disturbed indigenous marine fauna, may have altered the seabed habitat and have caused significant changes in the entire ecosystem that have in turn affected the local fisheries and their catch [34]. Contrary to the other subdivisions, the catch in the Levantine Sea showed a clear and monotonous increasing trend, which mostly results from an increase in the fishing effort but also from the recovery of productivity to pre-dam levels due to increased nutrient loadings from anthropogenic activities [35]. It is unclear, however, if the declining trend in the mTLc is an indication of a “fishing down” effect [9], given the community changes owing to the alien species reinforced by dam construction activities and climate change.
The ecological effects of trophic-level decline and (intra- and inter-specific) smaller somatic sizes as a consequence of fishery exploitation are apparent in marine ecosystems as the marine food webs are shrinking [9]. If overexploitation of Mediterranean fisheries continues, ecosystems, and hence the catches derived from them, will gradually be dominated by relatively smaller, short-lived, low trophic level invertebrates and planktivorous pelagic fish species and individuals, while long-lived top predators, which are already smaller in size, will decline in abundance [10]. Ending overfishing and reversing the phenomenon of shrinking food webs can increase the ability of fish stocks to withstand the impacts of climate change, thus making ecosystems more resilient to such exogenous pressures [36].
Despite the political pressures that promote overfishing in many European countries and illegal or unregulated fishing activities, there have been some measures and strategies that were adopted to allow the rebuilding of stocks, but their efficiency is still rather low, especially in the Mediterranean Sea [36]. There are cases, however, of dynamic and rapid response of fishery organisations to manage overexploited stocks, such as that of the bluefin tuna (Thunnus thynnus), which resulted in halting overfishing and an observed tendency of the stock to recover [37].
In conclusion, data-based catch and ecotrophic indicators can provide robust insights on ecosystem status and fisheries exploitation and together with length-based indicators may be useful in assessing the status of ecosystems in data-poor areas [38]. In the case of the southern Mediterranean countries, landings and trophic levels are the only data available and provide valuable information on these data-poor ecosystems. The main limitation of this approach is that it includes only the commercial part of the catch and neglects non-commercial species that are also affected by fishing, even if to a lesser extent [39,40]. Future research would have to include by-catch and discarded catch for a more holistic evaluation of the ecotrophic effects of fishing.
Author Contributions
Conceptualisation, A.C.T. and D.D.; methodology, A.C.T. and D.D.; formal analysis, D.D. and I.K.; data curation, D.D. and I.K.; writing—original draft preparation, D.D.; writing—review and editing, A.C.T. and G.S.; funding acquisition, A.C.T. and G.S. All authors have read and agreed to the published version of the manuscript.
Funding
This research was funded by the European Union’s Horizon 2020 Research and Innovation Program (H2020-BG-12-2016-2), grant number No. 727277–ODYSSEA (Towards an Integrated Mediterranean Sea Observing System). The article reflects only the authors’ view and the Commission is not responsible for any use that may be made of the information it contains.
Institutional Review Board Statement
Not applicable.
Informed Consent Statement
Not applicable.
Data Availability Statement
The data presented in this study are openly available in FAO (www.fao.org/gfcm/data/capture-production/en/, (accessed on 30 December 2020)), FishBase (www.fishbase.org, (accessed on 30 December 2020)) and SeaLifeBase (www.sealifebase.org, (accessed on 30 December 2020)).
Acknowledgments
The authors would like to thank three anonymous reviewers for their comments that improved this manuscript.
Conflicts of Interest
The authors declare no conflict of interest. The funders had no role in the design of the study, analyses, or interpretation of data; in the writing of the manuscript, or in the decision to publish the results.
References
- Coll, M.; Shannon, L.J.; Kleisner, K.M.; Juan-Jordá, M.J.; Bundy, A.; Akoglu, A.G.; Banaru, D.; Boldt, J.L.; Borges, M.F.; Cook, A.; et al. Ecological indicators to capture the effects of fishing on biodiversity and conservation status of marine ecosystems. Ecol. Ind. 2016, 60, 947–962. [Google Scholar] [CrossRef] [Green Version]
- Coll, M.; Steenbeek, J. Standardized ecological indicators to assess aquatic food webs: The ECOIND software plug-in for Ecopath with Ecosim models. Environ. Modell. Softw. 2017, 89, 120–130. [Google Scholar] [CrossRef]
- Froese, R.; Winker, H.; Coro, G.; Demirel, N.; Tsikliras, A.C.; Dimarchopoulou, D.; Scarcella, G.; Quaas, M.; Matz-Lück, N. Status and rebuilding of European fisheries. Mar. Pol. 2018, 93, 159–170. [Google Scholar] [CrossRef]
- Coll, M.; Piroddi, C.; Steenbeek, J.; Kaschner, K.; Lasram, F.B.R.; Aguzzi, J.; Ballesteros, E.; Bianchi, C.N.; Corbera, J.; Dailianis, T.; et al. The Biodiversity of the Mediterranean Sea: Estimates, Patterns, and Threats. PLoS ONE 2010, 5, e11842. [Google Scholar] [CrossRef] [PubMed] [Green Version]
- Stergiou, K.I.; Somarakis, S.; Triantafyllou, G.; Tsiaras, K.P.; Giannoulaki, M.; Petihakis, G.; Machias, A.; Tsikliras, A.C. Trends in productivity and biomass yields in the Mediterranean Sea large marine ecosystem during climate change. Environ. Dev. 2016, 17, 57–74. [Google Scholar] [CrossRef]
- Dimarchopoulou, D.; Stergiou, K.I.; Tsikliras, A.C. Gap analysis on the biology of Mediterranean marine fishes. PLoS ONE 2017, 12, e0175949. [Google Scholar] [CrossRef] [Green Version]
- Bertrand, J.A.; Gil De Sola, L.; Papaconstantinou, C.; Relini, G.; Souplet, A. The general specifications of the MEDITS surveys. Sci. Mar. 2002, 66 (Suppl. 2), 9–17. [Google Scholar] [CrossRef] [Green Version]
- Peristeraki, P.; Bitetto, I.; Carbonara, P.; Carlucci, R.; Certain, G.; De Carlo, F.; Gristina, M.; Kamidis, N.; Pesci, P.; Stagioni, M.; et al. Investigation of spatiotemporal patterns in mean temperature and mean trophic level of MEDITS survey catches in the Mediterranean Sea. Sci. Mar. 2019, 83 (Suppl. 1), 165–174. [Google Scholar] [CrossRef]
- Stergiou, K.I.; Tsikliras, A.C. Fishing-down, fishing-through and fishing-up: Fundamental process versus technical details. Mar. Ecol. Progr. Ser. 2011, 441, 295–301. [Google Scholar] [CrossRef] [Green Version]
- Pauly, D.; Christensen, V.; Dalsgaard, J.; Froese, R.; Torres, F. Fishing down marine food webs. Science 1998, 279, 860–863. [Google Scholar] [CrossRef]
- Froese, R.; Pauly, D. FishBase. In World Wide Web Electronic Publication; Froese, R., Pauly, D., Eds.; FishBase: Los Banos, Philippines, 2020; Available online: www.fishbase.org (accessed on 18 March 2020).
- Tsikliras, A.C.; Polymeros, K. Fish market prices drive overfishing of the ‘big ones’. Peer J. 2014, 2, e638. [Google Scholar] [CrossRef] [PubMed] [Green Version]
- Myers, R.; Worm, B. Rapid worldwide depletion of predatory fish communities. Nature 2003, 423, 280–283. [Google Scholar] [CrossRef] [PubMed]
- Tsikliras, A.C.; Dinouli, A.; Tsalkou, E. Exploitation trends of the Mediterranean and Black Sea fisheries. Acta Adriat. 2013, 54, 273–283. [Google Scholar]
- Tsikliras, A.C.; Dinouli, A.; Tsiros, V.-Z.; Tsalkou, E. The Mediterranean and Black Sea fisheries at risk from overexploitation. PLoS ONE 2015, 10, e0121188. [Google Scholar] [CrossRef] [Green Version]
- Piroddi, C.; Colloca, F.; Tsikliras, A.C. The living marine resources in the Mediterranean Sea Large Marine Ecosystem. Environ. Dev. 2021, 36, 100555. [Google Scholar] [CrossRef] [PubMed]
- Zeller, D.; Pauly, D. The ‘presentist bias’ in time-series data: Implications for fisheries science and policy. Mar. Pol. 2018, 90, 14–19. [Google Scholar] [CrossRef]
- Stergiou, K.I.; Moutopoulos, D.K.; Tsikliras, A.C. Spatial and temporal variability in Hellenic marine fisheries landings. In State of Hellenic Fisheries; Papaconstantinou, C., Zenetos, A., Vassilopoulou, V., Tserpes, G., Eds.; Hellenic Centre for Marine Research: Athens, Greece, 2007; pp. 141–150. [Google Scholar]
- Stergiou, K.I.; Moutopoulos, D.K.; Tsikliras, A.C.; Papaconstantinou, C. Hellenic marine fisheries: A general perspective from the National Statistical Service data. In State of Hellenic Fisheries; Papaconstantinou, C., Zenetos, A., Vassilopoulou, V., Tserpes, G., Eds.; Hellenic Centre for Marine Research: Athens, Greece, 2007; pp. 132–140. [Google Scholar]
- Tsikliras, A.C.; Dimarchopoulou, D.; Pardalou, A. Artificial upward trends in Greek marine landings: A case of presentist bias in European fisheries. Mar. Pol. 2020, 117, 103886. [Google Scholar] [CrossRef]
- Cury, P.M.; Shannon, L.J.; Roux, J.-P.; Daskalov, G.M.; Jarre, A.; Moloney, C.L.; Pauly, D. Trophodynamic indicators for an ecosystem approach to fisheries. ICES J. Mar. Sci. 2005, 62, 430–442. [Google Scholar] [CrossRef] [Green Version]
- Palomares, M.L.D.; Pauly, D. SeaLifeBase. In World Wide Web Electronic Publication; Palomares, M.L.D., Pauly, D., Eds.; SeaLifeBase: Los Banos, Philippines, 2020; Available online: www.sealifebase.org (accessed on 18 March 2020).
- Eddy, T.D.; Bernhardt, J.R.; Blanchard, J.L.; Cheung, W.W.L.; Colléter, M.; du Pontavice, E.; Fulton, E.A.; Gascuel, D.; Kearney, K.A.; Petrik, C.M.; et al. Energy flow through marine ecosystems: Confronting transfer efficiency. Trends Ecol. Evol. 2021, 36, 76–86. [Google Scholar] [CrossRef] [PubMed]
- Pauly, D.; Christensen, V.; Walters, C. Ecopath, Ecosim and Ecospace as tools for evaluating ecosystem impact of fisheries. ICES J. Mar. Sci. 2000, 57, 697–706. [Google Scholar] [CrossRef]
- Pauly, D.; Ulman, A.; Piroddi, C.; Bultel, E.; Coll, M. Reported’ versus ‘likely’ fisheries catches of four Mediterranean countries. Sci. Mar. 2014, 78 (Suppl. 1), 11–17. [Google Scholar] [CrossRef]
- Palomares, M.L.D.; Pauly, D. On the creeping increase of vessels’ fishing power. Ecol. Soc. 2019, 24, 31. [Google Scholar] [CrossRef] [Green Version]
- Murawski, S.A. Definitions of overfishing from an ecosystem perspective. ICES J. Mar. Sci. 2000, 57, 649–658. [Google Scholar] [CrossRef]
- Saraux, C.; Van Beveren, E.; Brosset, P.; Queiros, Q.; Bourdeix, J.-H.; Dutto, G.; Gasset, E.; Jac, C.; Bonhommeau, S.; Fromentin, J.-M. Small pelagic fish dynamics: A review of mechanisms in the Gulf of Lions. Deep Sea Res. II 2019, 159, 52–61. [Google Scholar] [CrossRef]
- Pinnegar, J.K.; Polunin, N.V.C.; Badalamenti, F. Long-term changes in the trophic level of western Mediterranean fishery and aquaculture landings. Can. J. Fish. Aquat. Sci. 2003, 60, 222–235. [Google Scholar] [CrossRef]
- Lotze, H.K.; Coll, M.; Dunne, J.A. Historical changes in marine resources, food-web structure and ecosystem functioning in the Adriatic Sea, Mediterranean. Ecosystems 2011, 14, 198–222. [Google Scholar] [CrossRef]
- Tsikliras, A.C.; Tsiros, V.-Z.; Stergiou, K.I. Assessing the state of Greek marine fisheries resources. Fisher. Manag. Ecol. 2013, 20, 34–41. [Google Scholar] [CrossRef]
- Piroddi, C.; Coll, M.; Liquete, C.; Macias, D.; Greer, K.; Buszowski, J.; Steenbeek, J.; Danovaro, R.; Christensen, V. Historical changes of the Mediterranean Sea ecosystem: Modelling the role and impact of primary productivity and fisheries changes over time. Sci. Rep. 2017, 7, 44491. [Google Scholar] [CrossRef] [PubMed] [Green Version]
- Galil, B.S. Loss or gain? Invasive aliens and biodiversity in the Mediterranean Sea. Mar. Pollut. Bull. 2007, 55, 314–322. [Google Scholar] [CrossRef]
- Corrales, X.; Ofir, E.; Coll, M.; Goren, M.; Edelist, D.; Heymans, J.J.; Gal, G. Modeling the role and impact of alien species and fisheries on the Israeli marine continental shelf ecosystem. J. Mar. Sys. 2017, 170, 88–102. [Google Scholar] [CrossRef]
- Oczkowski, A.J.; Nixon, S.W.; Granger, S.L.; El-Sayed, A.-F.M.; McKinney, R.A. Anthropogenic enhancement of Egypt’s Mediterranean fishery. Proc. Natl. Acad. Sci. USA 2009, 106, 1364–1367. [Google Scholar] [CrossRef] [Green Version]
- Sumaila, U.R.; Tai, T.C. Ending Overfishing Can Mitigate Impacts of Climate Change; Working paper #2019-05; Institute for the Oceans and Fisheries, University of British Columbia: Vancouver, BC, Canada, 2019. [Google Scholar]
- Froese, R.; Tsikliras, A.C.; Scarcella, G.; Gascuel, D. Progress towards ending overfishing in the Northeast Atlantic. Mar. Pol. 2021, 104282. [Google Scholar] [CrossRef]
- Galati, A.; Siggia, D.; Giacomarra, M.; Tulone, A.; Franco, C.P.D.; Crescimanno, M. The dynamics of Italian competitive positioning in the Mediterranean Bluefin tuna industry. JGBA 2020, 13, 228–248. [Google Scholar] [CrossRef]
- Dimarchopoulou, D.; Dogrammatzi, A.; Karachle, P.K.; Tsikliras, A.C. Spatial fishing restrictions benefit demersal stocks in the northeastern Mediterranean Sea. Sci. Rep. 2018, 8, 5967. [Google Scholar] [CrossRef] [PubMed] [Green Version]
- Tsikliras, A.C.; Touloumis, K.; Pardalou, A.; Adamidou, A.; Keramidas, I.; Orfanidis, G.; Dimarchopoulou, D.; Koutrakis, M. Status of 74 non-commercial fish and invertebrate stocks in the Aegean Sea using abundance and resilience. Front. Mar. Sci. 2021, 7, 578601. [Google Scholar] [CrossRef]
Figure 1.
Μap of the Mediterranean Sea showing the subareas (western Mediterranean, central Mediterranean, eastern Mediterranean, Black Sea) and their subdivisions (1.1: Balearic Islands; 1.2: Gulf of Lions; 1.3: Sardinia; 2.1: Adriatic Sea; 2.2: Ionian Sea; 3.1: Aegean Sea; 3.2: Levantine Sea). The subdivisions of the Black Sea (4.1: Marmara Sea; 4.2: Black Sea, main; 4.3: Azov Sea) were not included in the present work. Underlying map was created using Ocean Data View Software.

Figure 2.
Variation in the combined marine catches (in metric tons) of fishes, crustaceans and cephalopods per year in the seven General Fisheries Commission for the Mediterranean (GFCM) subdivisions (1.1. Balearic Islands; 1.2. Gulf of Lions, 1.3. Sardinia, 2.1. Adriatic Sea, 2.2. Ionian Sea, 3.1. Aegean Sea, 3.2. Levantine Sea) for 1970 to 2017. A smoothing line with confidence limits was added to the time series to show the overall reported catch trend in each area.

Figure 3.
Variation in the mean trophic level (mTLc) of the catches per year in the seven GFCM subdivisions (1.1. Balearic Islands; 1.2. Gulf of Lions, 1.3. Sardinia, 2.1. Adriatic Sea, 2.2. Ionian Sea, 3.1. Aegean Sea, 3.2. Levantine Sea) for 1970 to 2017. A smoothing line with confidence limits was added to the time series to show the overall reported mTLc trend in each area.

Figure 4.
Variation in the Fishing in Balance (FiB) index per year in the seven GFCM subdivisions (1.1. Balearic Islands; 1.2. Gulf of Lions, 1.3. Sardinia, 2.1. Adriatic Sea, 2.2. Ionian Sea, 3.1. Aegean Sea, 3.2. Levantine Sea) for 1970 to 2017. A smoothing line with confidence limits was added to the time series to show the overall reported FiB index trend in each area.


Table 1.
Comparison of the ecosystem status of all Mediterranean subdivisions based on total catch (Catch), mean weighted trophic level of the catch (Troph), Fishing in Balance (FiB) index and overall performance (green: good; orange: intermediate; red: bad).
Table 1.
Comparison of the ecosystem status of all Mediterranean subdivisions based on total catch (Catch), mean weighted trophic level of the catch (Troph), Fishing in Balance (FiB) index and overall performance (green: good; orange: intermediate; red: bad).
| GFCM Subdivision | Indicators | Overall | ||||
|---|---|---|---|---|---|---|
| Catch | Troph | FiB | ||||
| Mediterranean Sea | Western | 1.1. Balearic Sea | ||||
| 1.2. Gulf of Lions | ||||||
| 1.3. Sardinia | ||||||
| Central | 2.1. Adriatic Sea | |||||
| 2.2. Ionian Sea | ||||||
| Eastern | 3.1. Aegean Sea | |||||
| 3.2. Levantine Sea | ||||||
Publisher’s Note: MDPI stays neutral with regard to jurisdictional claims in published maps and institutional affiliations. |
© 2021 by the authors. Licensee MDPI, Basel, Switzerland. This article is an open access article distributed under the terms and conditions of the Creative Commons Attribution (CC BY) license (http://creativecommons.org/licenses/by/4.0/).
Share and Cite
MDPI and ACS Style
Dimarchopoulou, D.; Keramidas, I.; Sylaios, G.; Tsikliras, A.C. Ecotrophic Effects of Fishing across the Mediterranean Sea. Water 2021, 13, 482. https://doi.org/10.3390/w13040482
AMA Style
Dimarchopoulou D, Keramidas I, Sylaios G, Tsikliras AC. Ecotrophic Effects of Fishing across the Mediterranean Sea. Water. 2021; 13(4):482. https://doi.org/10.3390/w13040482
Chicago/Turabian StyleDimarchopoulou, Donna, Ioannis Keramidas, Georgios Sylaios, and Athanassios C. Tsikliras. 2021. "Ecotrophic Effects of Fishing across the Mediterranean Sea" Water 13, no. 4: 482. https://doi.org/10.3390/w13040482
Note that from the first issue of 2016, this journal uses article numbers instead of page numbers. See further details here.