Article

Semi-Rigid Erosion Control Techniques with Geotextiles Applied to Reservoir Margins in Hydroelectric Power Plants, Brazil

by
Maria Alejandra Aparicio Ardila
1,*,
Ricardo D. dos Santos Junior
1,
Marcelo Kobelnik
1,
Clever Aparecido Valentin
1,
Marlon Silva Schliewe
2,
Arnaldo Teixeira Coelho
3,
Jefferson Lins da Silva
1 and
Marta Pereira da Luz
2,4
1
São Carlos School of Engineering (EESC), University of São Paulo, São Carlos, São Paulo 13566-590, Brazil
2
Eletrobras, Furnas Centrais Elétricas SA, Aparecida de Goiânia, Goiás 74923-650, Brazil
3
Ingá Engenharia e Consultoria, Belo Horizonte 30320-130, Brazil
4
Industrial and Systems Engineering Postgraduate Program (MEPROS), Pontifical Catholic University of Goiás, Goiânia 74605-010, Brazil
*
Author to whom correspondence should be addressed.
Water 2021, 13(4), 500; https://doi.org/10.3390/w13040500
Submission received: 24 December 2020 / Revised: 28 January 2021 / Accepted: 5 February 2021 / Published: 15 February 2021
(This article belongs to the Special Issue Local Erosion of Hydraulic Structures and Flood Protection)

Abstract

:
In Brazil, hydroelectricity represents close to 70% of the energy consumed in the country. However, hydroelectric plant operations may be affected by the deposit of sediments for erosive processes on reservoir margins. This study presents the results of implementing two semi-rigid erosion control techniques installed on reservoir margins of two Brazilian Hydroelectric Power Plants (HPPs). These techniques were the gabion and gabion mattress used as a mixed technique and geogrid mattress technique. This paper highlights the importance of implementing geotextiles in the construction process of these erosion control techniques, taking advantage of their separation properties. The performance of the techniques was evaluated using qualitative performance variables and by differential bathymetry studies performed in 2016 and 2020 in the experimental units installed in each HPP. Moreover, the degradation of the geotextiles in each installation was evaluated through thermal analysis. The erosion control techniques that showed the best results were gabion and gabion mattress. Regarding the exhumed geotextiles, thermal analyses have shown that the commercial geotextiles that were used can withstand temperatures of up to 200 °C leading to no changes to their structure.

1. Introduction

Erosion on slopes and margins of water bodies consists of separating and transporting sediment by water, wind, or gravity. This can be caused by the suppression of the existing vegetation, disturbances in the soil, and the creation of more steep surfaces, among other factors. Regarding water body margins, an additional factor to consider is the effect of waves, in which the forces generated by the impact of waves can exceed the resistance of the margin and vegetation, preventing them from becoming attached to the soil and promoting degradation of the environment [1,2].
According to Biedenharn et al. [3], the margins of water bodies are naturally subjected to erosive processes and mass mobilization of sediments caused by the dynamic environment. The variables that have the most significant influence on the intensity of erosion are the topography, the origin and composition of the soil of the margin and the bed of water bodies, and the qualitative and quantitative aspects of the vegetation associated with the local hydraulic conditions (height of waves and wind speed) [4]. On the other hand, other factors to consider are the hydrological and sediment connectivity of the margin, which indicates the paths followed in the transport of sediments and is mainly influenced by the relationship between the topography of the local and the intensity of the rains [5], as well as the moisture changes in the topsoil layer, which is the layer more susceptible to erosion [6].
The aim of any erosion control project must, therefore, be to stabilize soils and manage erosion economically [7]. Choosing the control method is imperative for the success of erosion control operations. According to USACE (United States Army Corps of Engineers) [8] and the USDA (United States Department of Agriculture) [9], margin protection measures can be grouped into three categories: vegetative systems, rigid or semi-rigid elements, and mixed systems (or soil bioengineering), where these categories are often used together. There are other types of margin protection, such as projects that combine civil engineering with soft soil engineering procedures and revegetation (e.g., [10]).
Due to interest in Hydroelectric Powerplants (HPPs) considering climate change, it is important to evaluate the operations and management of HPPs in combination with the impacts arising [11], such as erosive processes. The problems of the erosion process are the main environmental impacts on the operation stage of most of the reservoirs of Brazilian HPPs, reflected in the loss of agricultural, urban, and forest areas, in water quality, in the abrasion of electromechanical equipment, and in the volume’s reduction and useful life of the reservoirs by silting. Brazil is the second greatest generator of hydroelectric power after China. Furthermore, it is one of the countries that builds the most dams in the world [12]. Today, in Brazil, hydroelectricity represents 68.1% of the country’s electricity [13].
Anthropic occupations (such as agriculture and tourism) in areas close to reservoir margins, often contradict Brazilian legislation in force, Law 12.651/2012 [14], which stipulates the maintenance of a Permanent Preservation Area with a minimum strip of 30 m with riparian vegetation. This occupation promotes the exposure and weakening of the reservoir margins to erosive processes. This is exposure that, from the point of view of planning and management, creates a conflict in the margins’ use of space [15]. The occurrence of severe problems verified by erosion caused by waves and erosion in temporary and permanent channels shows the need for further studies on erosion control techniques for the Brazilian reality.
Geosynthetic materials such as geotextiles and geogrids have been used in different erosion control techniques, for example, in hybrid gabion structures [16], applications where the geotextile was used to wrap the aggregate inside the gabion box, and the geogrid as a reinforcement element at the intersection of the gabions. When installing erosion control techniques, geotextiles are commonly used, mainly in the separation and drainage function. Depending on the application, woven and nonwoven geotextiles can be installed on or inside the ground [17]. Despite the benefits of using geosynthetics in erosion control works, the long-term environmental impacts caused by using it should be considered [18]. It can be observed that the main raw material of geosynthetics comes from non-degradable materials such as thermoplastic polymers, whose degradation is triggered by several environmental influences, which can lead to an accumulation of microplastic particles, causing adverse effects in the surrounding area [17,18,19].
This paper aims to contribute to the study of erosion control techniques applied to reservoir margins, highlighting the importance of monitoring the techniques during the service life and using suitable materials with proven durability. This study presents the implementation of semi-rigid erosion control techniques (gabion, gabion mattress, and geogrid mattress) on the reservoir margins of two Brazilian UHE: Porto Colômbia and Volta Grande. The performance of each technique installed in the different monitored sections was evaluated qualitatively considering different variables: the stream-bank integrity against erosion; vegetative cover growth, structural integrity, need for maintenance, aesthetics and landscape integration, and the regrowth of native vegetation. Differential bathymetry also evaluated the erosion control technique’s performance, based on two bathymetric measurements of the reservoir margins in 2016 and 2020. The degradation of the geotextiles used in the installation of erosion control techniques was also tested using thermo-analytical techniques.

2. Materials and Methods

2.1. Study Area

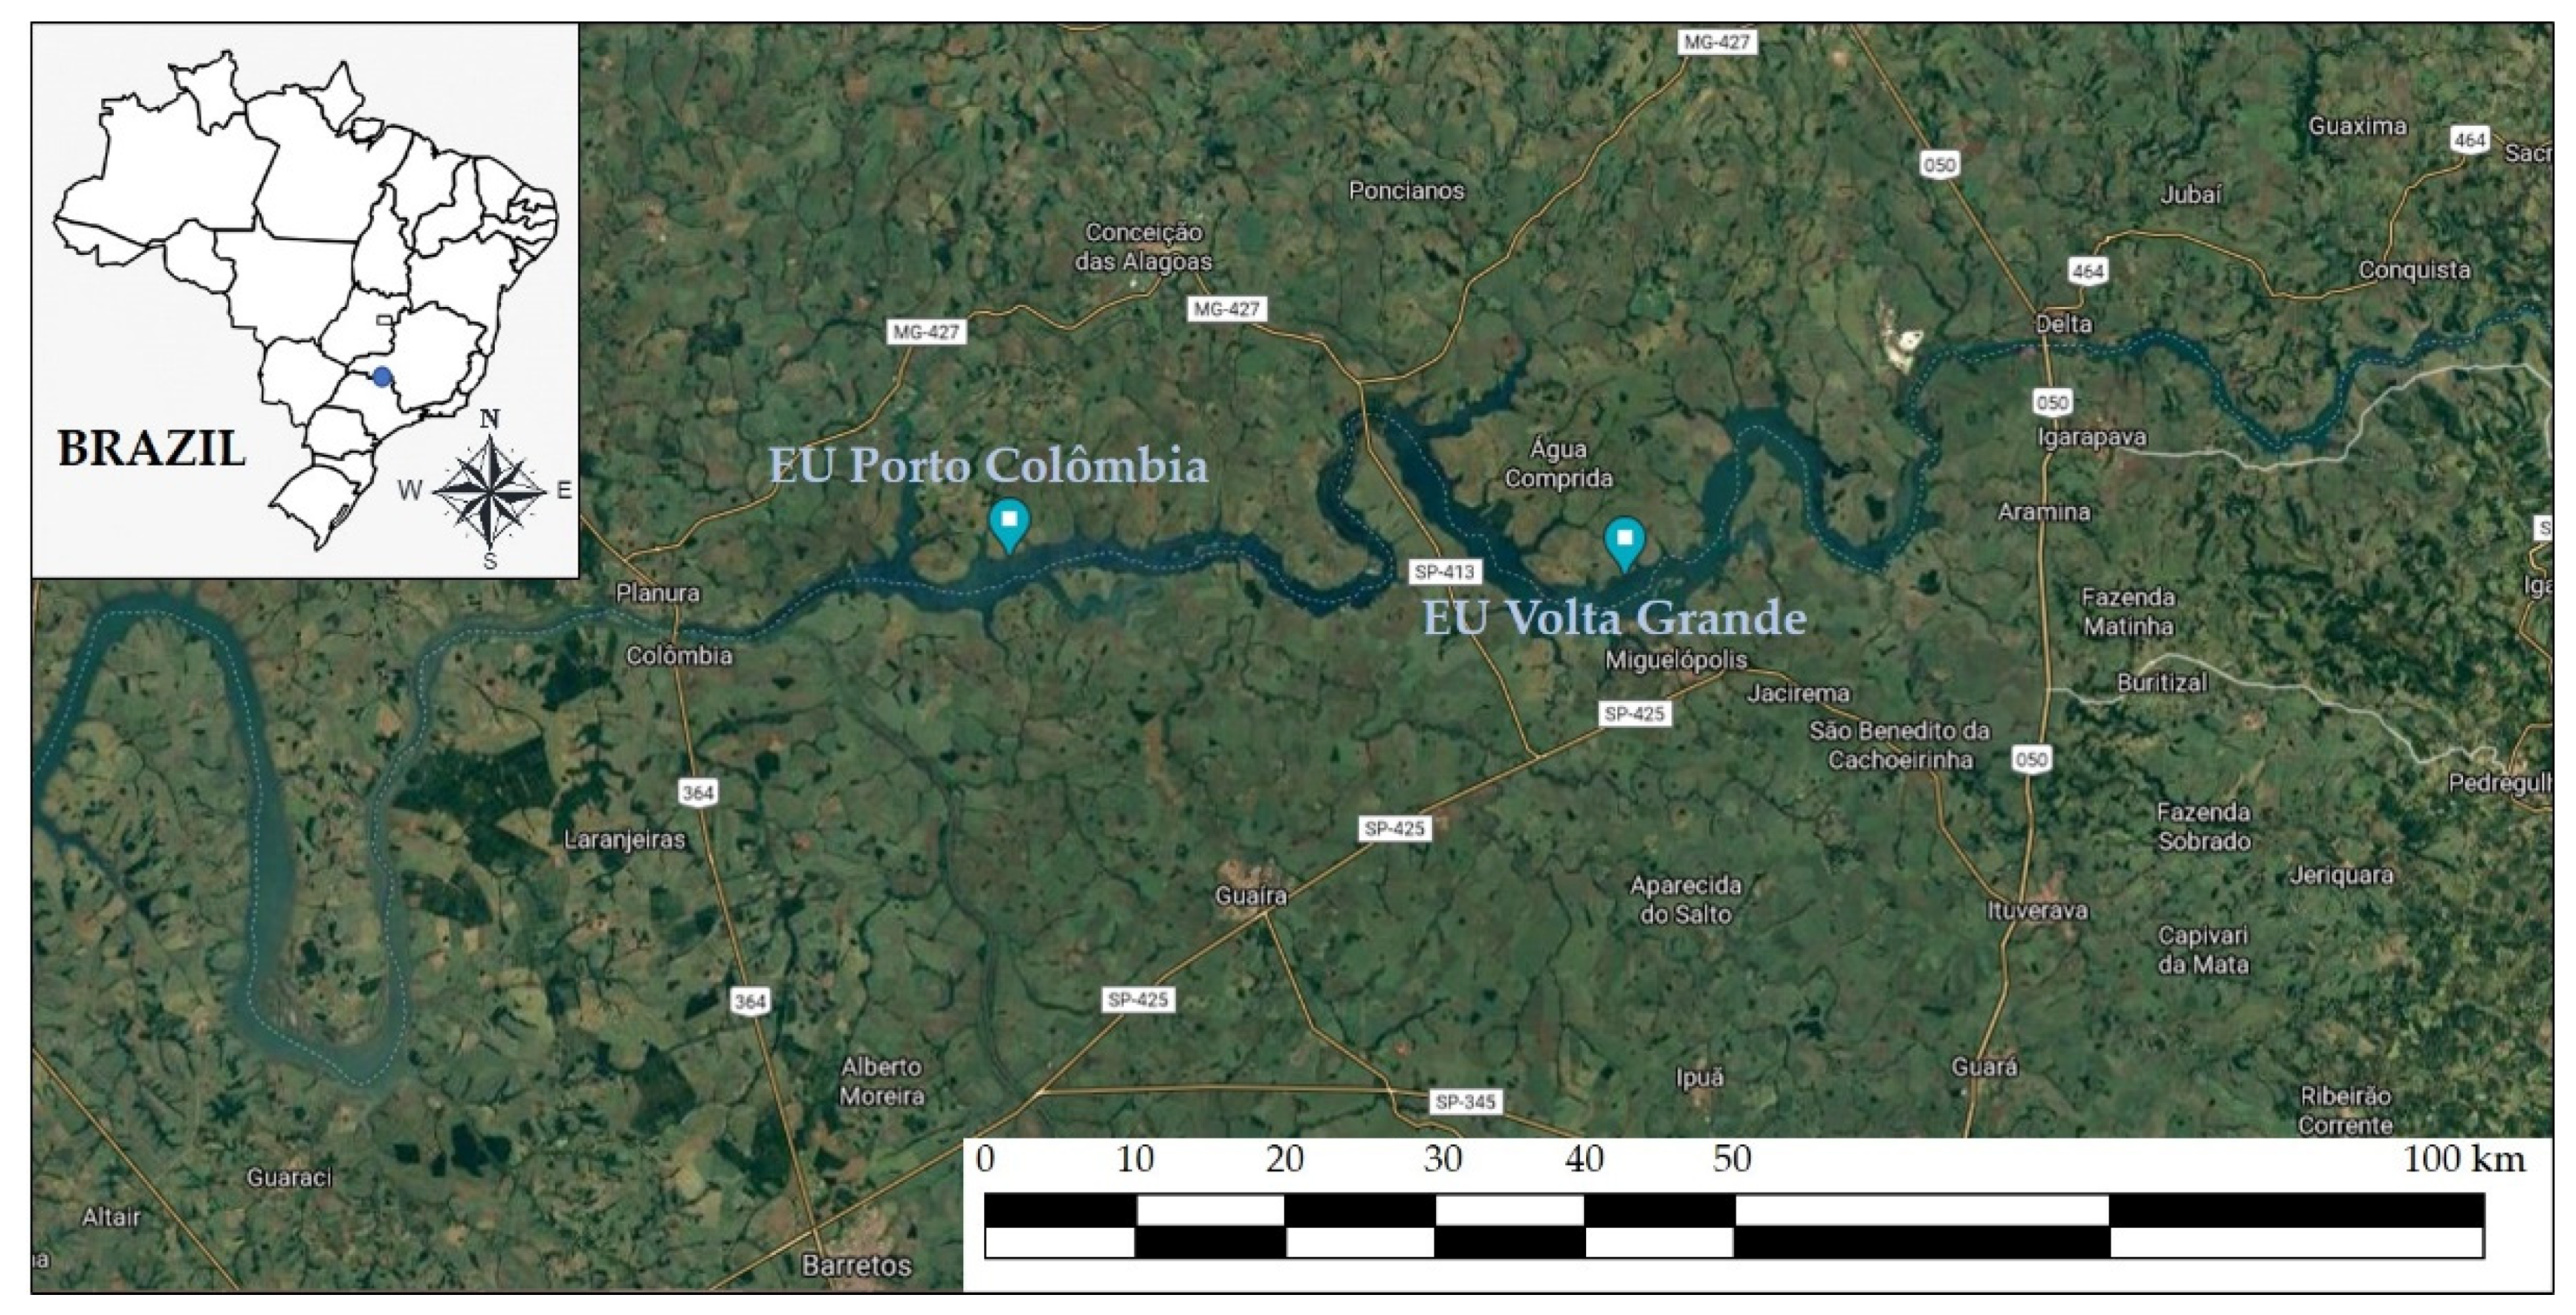
The Porto Colômbia and Volta Grande Hydroelectric Power Plants (HPPs) are located in the hydrographic basin of the Rio Grande, sub-basin of the Paraná River, located on the border of the States of São Paulo and Minas Gerais. The commercial operation of the HPPs began in 1973 and 1974, respectively. Since then, the typical characteristics of the region’s soil, associated with a predominantly flat relief, have enhanced agricultural activities, especially the cultivation of sugar cane [20], as well as tourism and leisure activities [21]. This type of activities carried out in regions close to the banks of the reservoirs benefits erosive processes.
The Porto Colômbia HPP has a dam with a 320 MW power generation capacity, which forms a 143 km2 reservoir with a useful storage volume of 2.355 billion m³ of water. The Volta Grande HPP has a dam with a capacity of 380 MW, which forms a 220 km2 reservoir with a useful storage volume of 7 million m³ of water. The two reservoirs that are the object of this study are reservoirs classified as run-of-river, that is, they generate energy with the flow of the river itself, without water storage as in accumulation reservoirs [22]. Due to this characteristic, the volume of water stored can vary significantly from month to month.
An experimental unit was installed in each HPP for the application of different erosion control techniques on the reservoir banks at the end of 2016 (
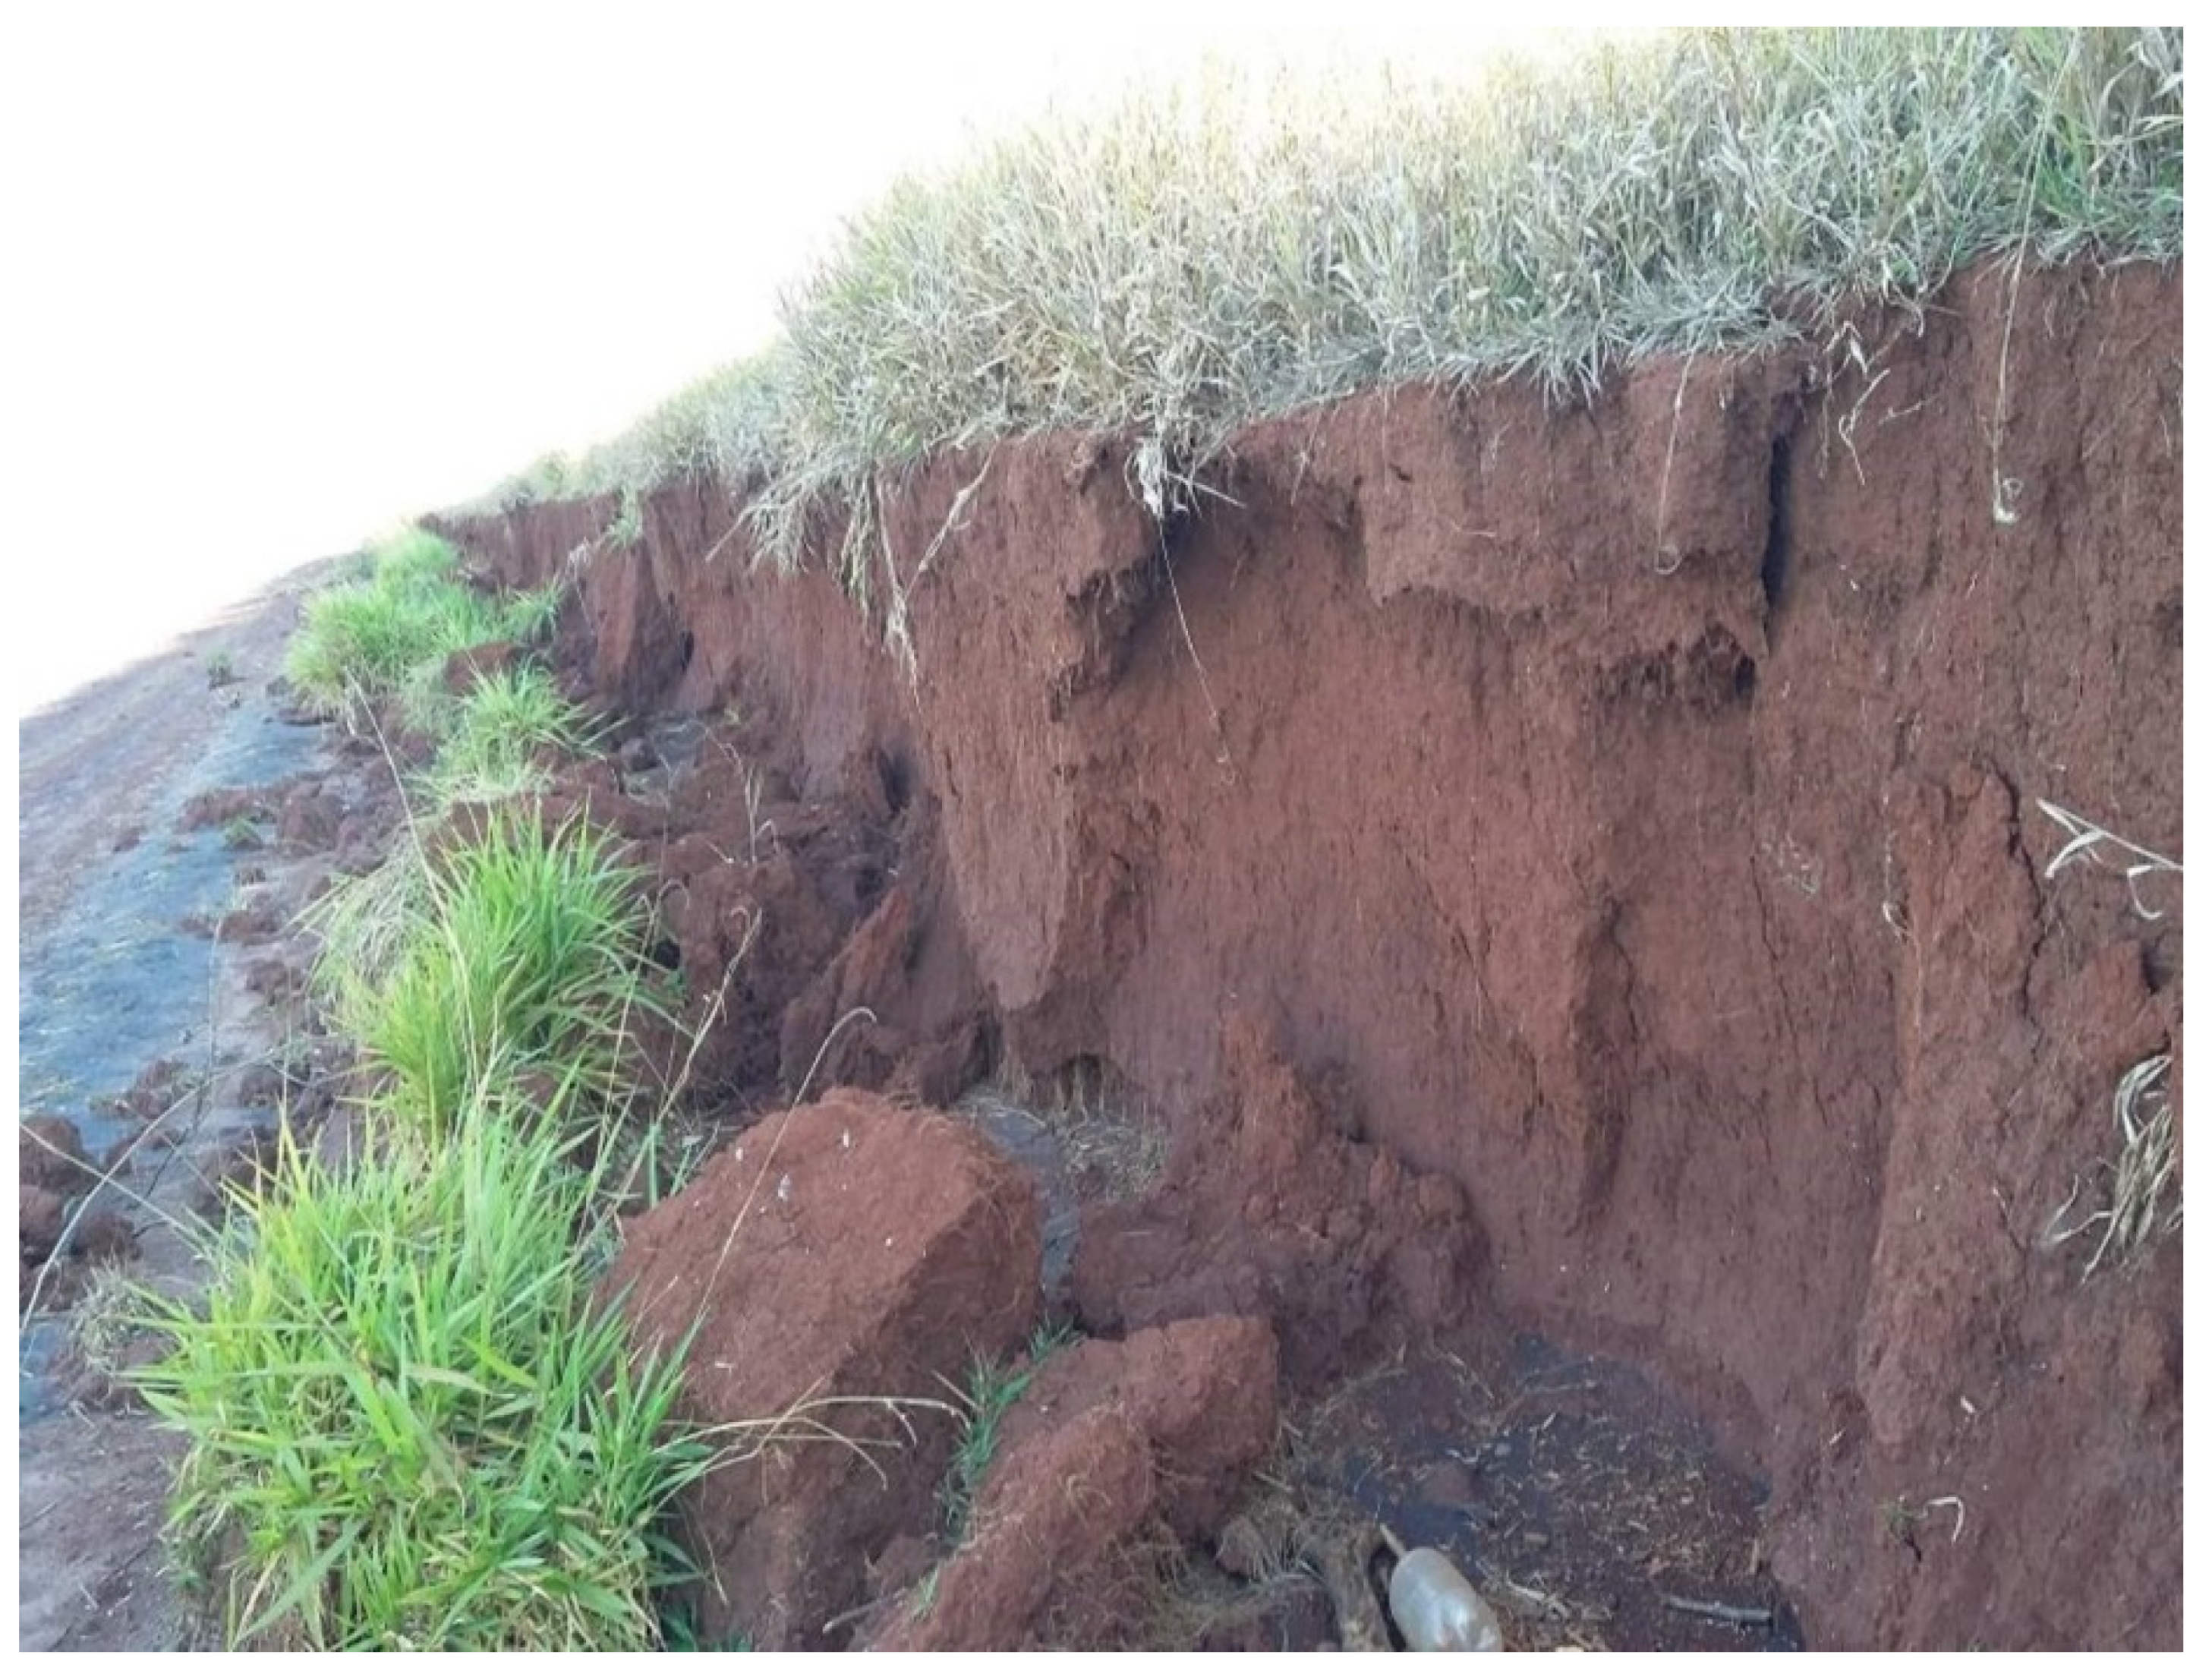
Figure 1). The study areas were selected after field surveys carried out by river transport in June/July 2016. These experimental units were installed in areas with erosive features of margin undermining, as seen in Figure 2, and zones with a greater probability of incidence of waves from the reservoirs, verified in the effective Fetch analyses performed for each reservoir. The maximum wind fetch analysis is used to calculate the potential height of wind waves in the reservoir that may affect the dam or its margins. Fetch analyses were performed according to Marques et al. [23].
The climate of the study areas is classified as Cwa, with dry winters and hot summers, according to the Koppen climate classification [24]. With a dry season from April to September and 80% of the rainy season lasting from October to March [25]. According to data provided by the Brazilian National Meteorological Institute (INMET) of the nearest meteorological station to the experimental units (in the municipality of Conceição das Alagoas with coordinates: 19°59′7.31′′ S, 48° 9′3.36′′ W) at 36.7 km from the experimental unit Porto Colômbia and 18.2 km from the experimental unit Volta Grande, the mean annual region temperature is 23.5 °C, with temperatures ranging between 16.4 °C and 38.6 °C. The annual precipitation for the study area is around 1011 mm.
Table 1 summarizes characterization and soil strength test results for the experimental units in each HPP, performed based on the Brazilian Standard (NBR). According to the Unified Soil Classification System [26], the soil of the two experimental units is sandy silt (ML).

2.2. Experimental Sections with Techniques of Erosion Control

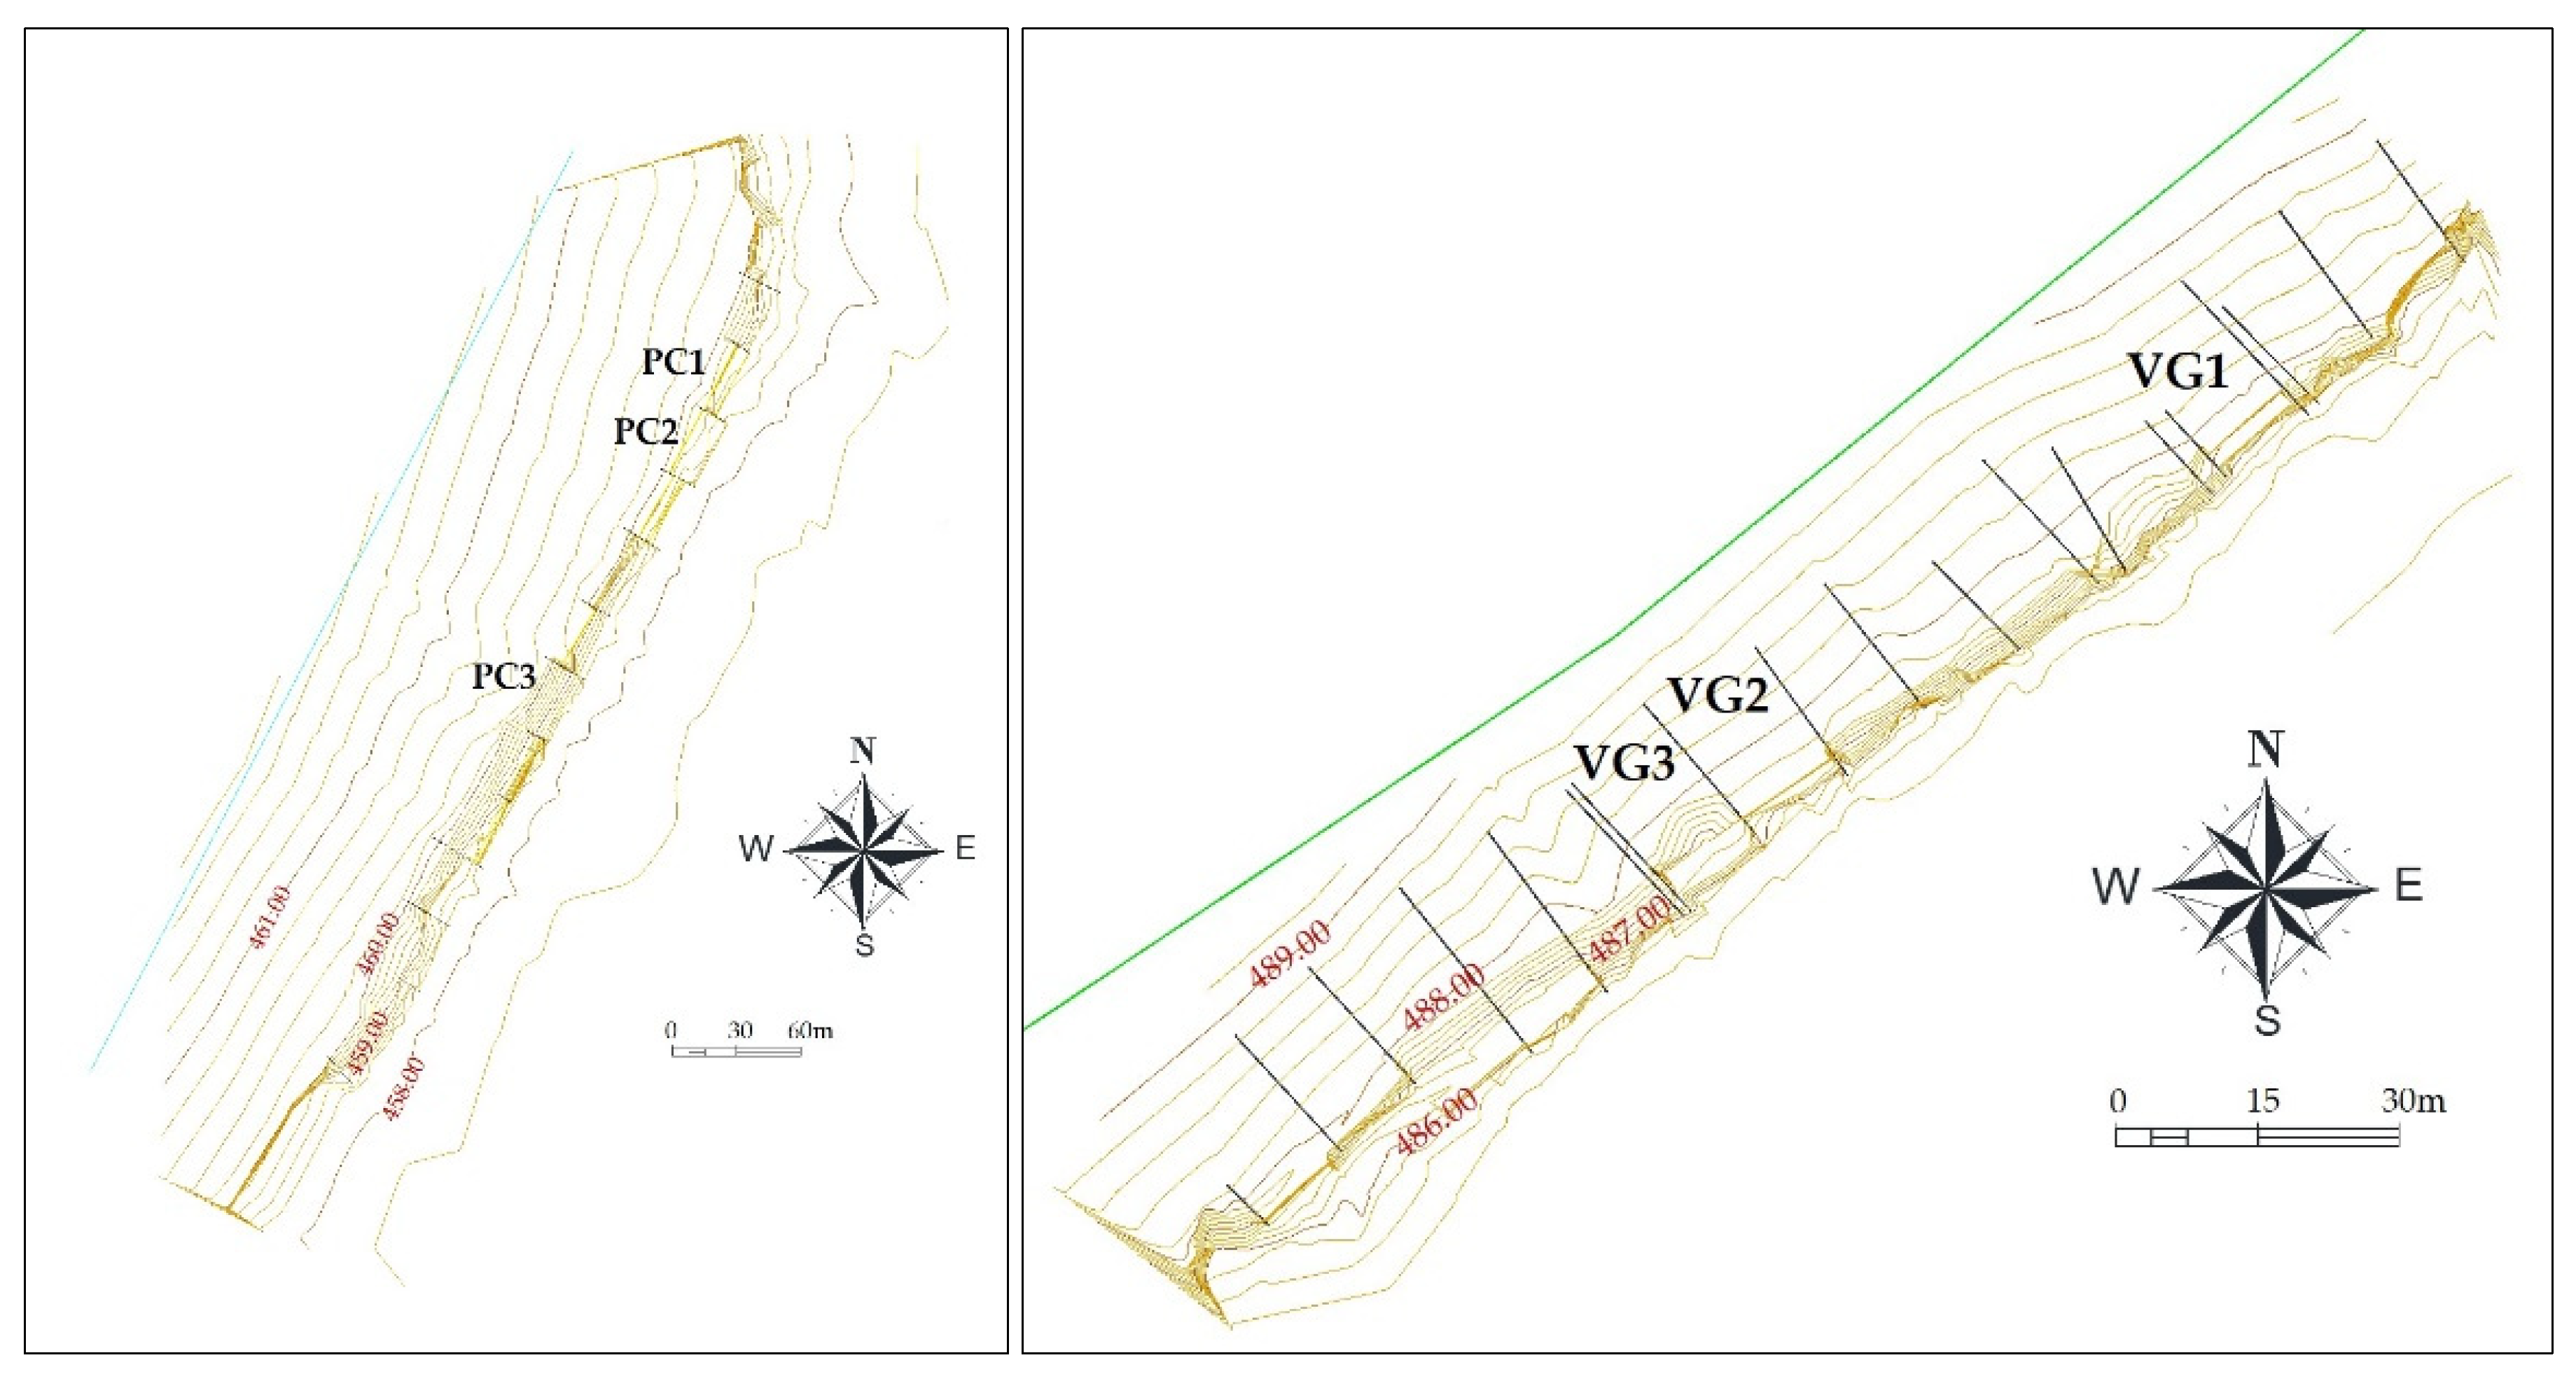
This study assessed two different erosion control techniques, gabion and gabion mattress, using them as a mixed technique and geogrid (or geosynthetic) mattress. The latter has the same concept as traditional gabions and gabion mattresses but are manufactured in high-strength geogrids instead of metal meshes. The experimental units were divided into sections, where several erosion control techniques were implemented, and the sections where the techniques addressed in this work are identified in Figure 3 and described in Table 2. Sections with a height between 1.5 and 2 m and an approximate area of 150 m2 were selected to evaluate the techniques. They are schematized in the profile shown in Figure 4.

2.3. Geotextiles Used in the Erosion Control Techniques

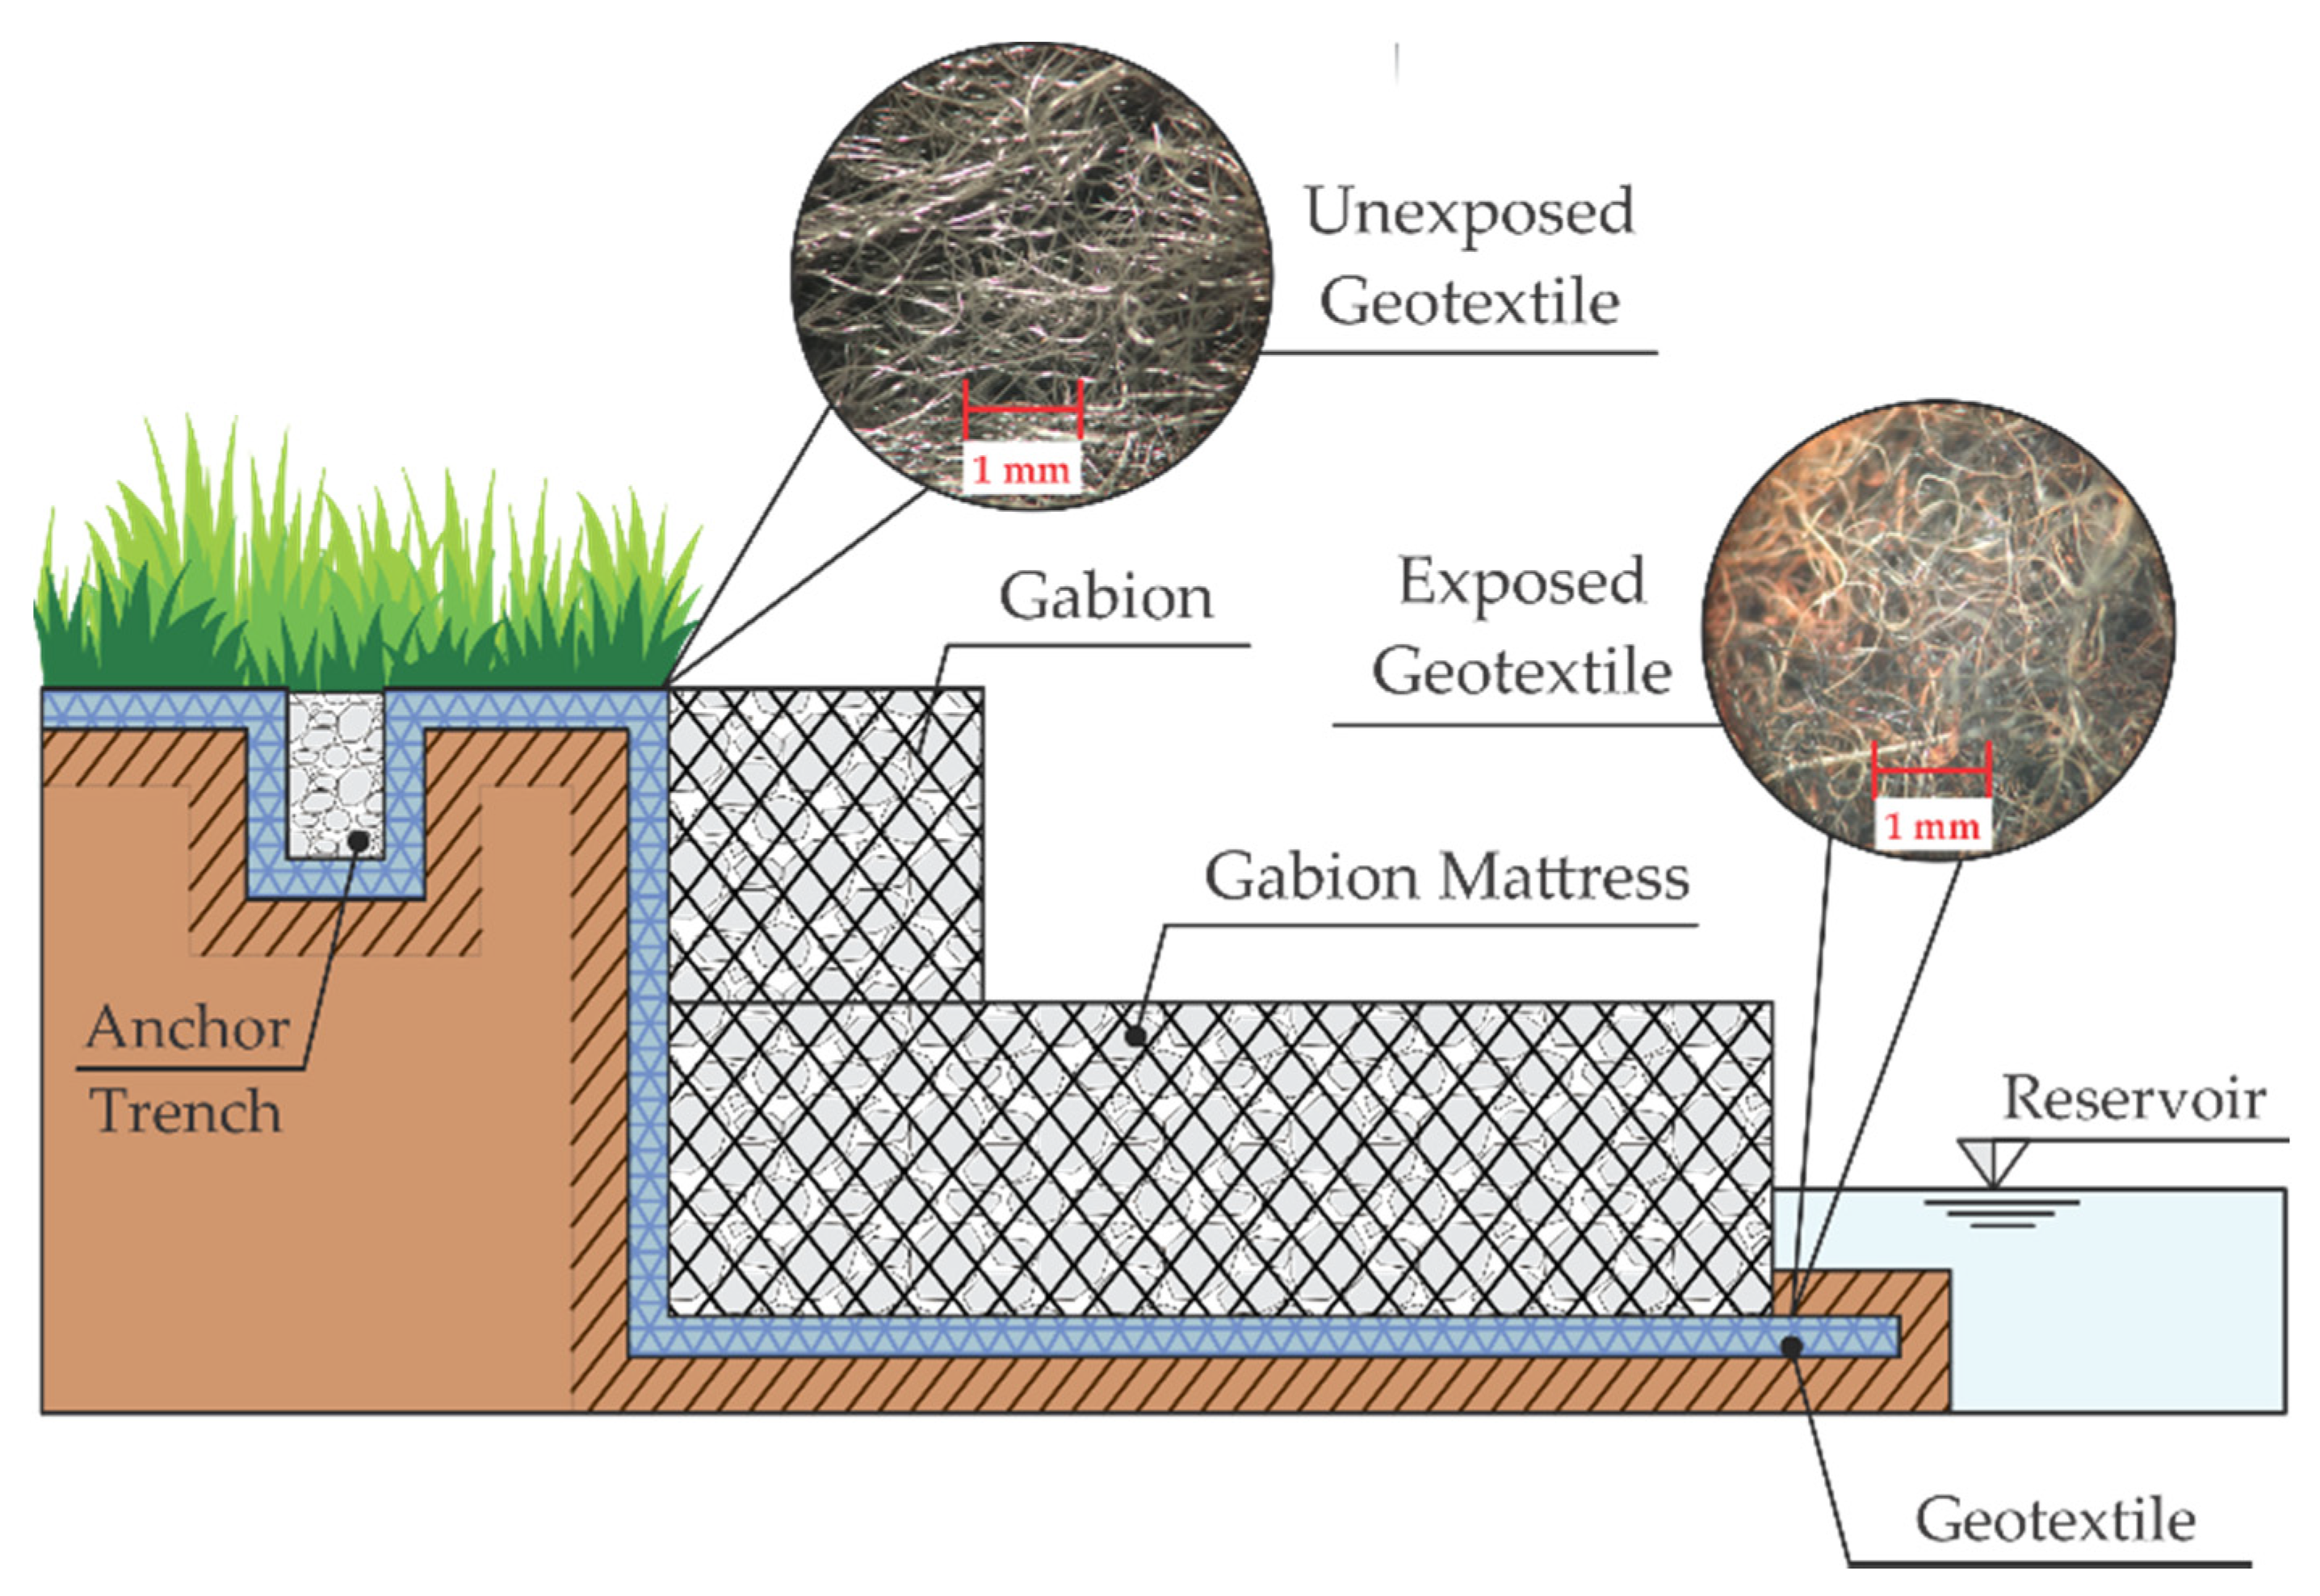
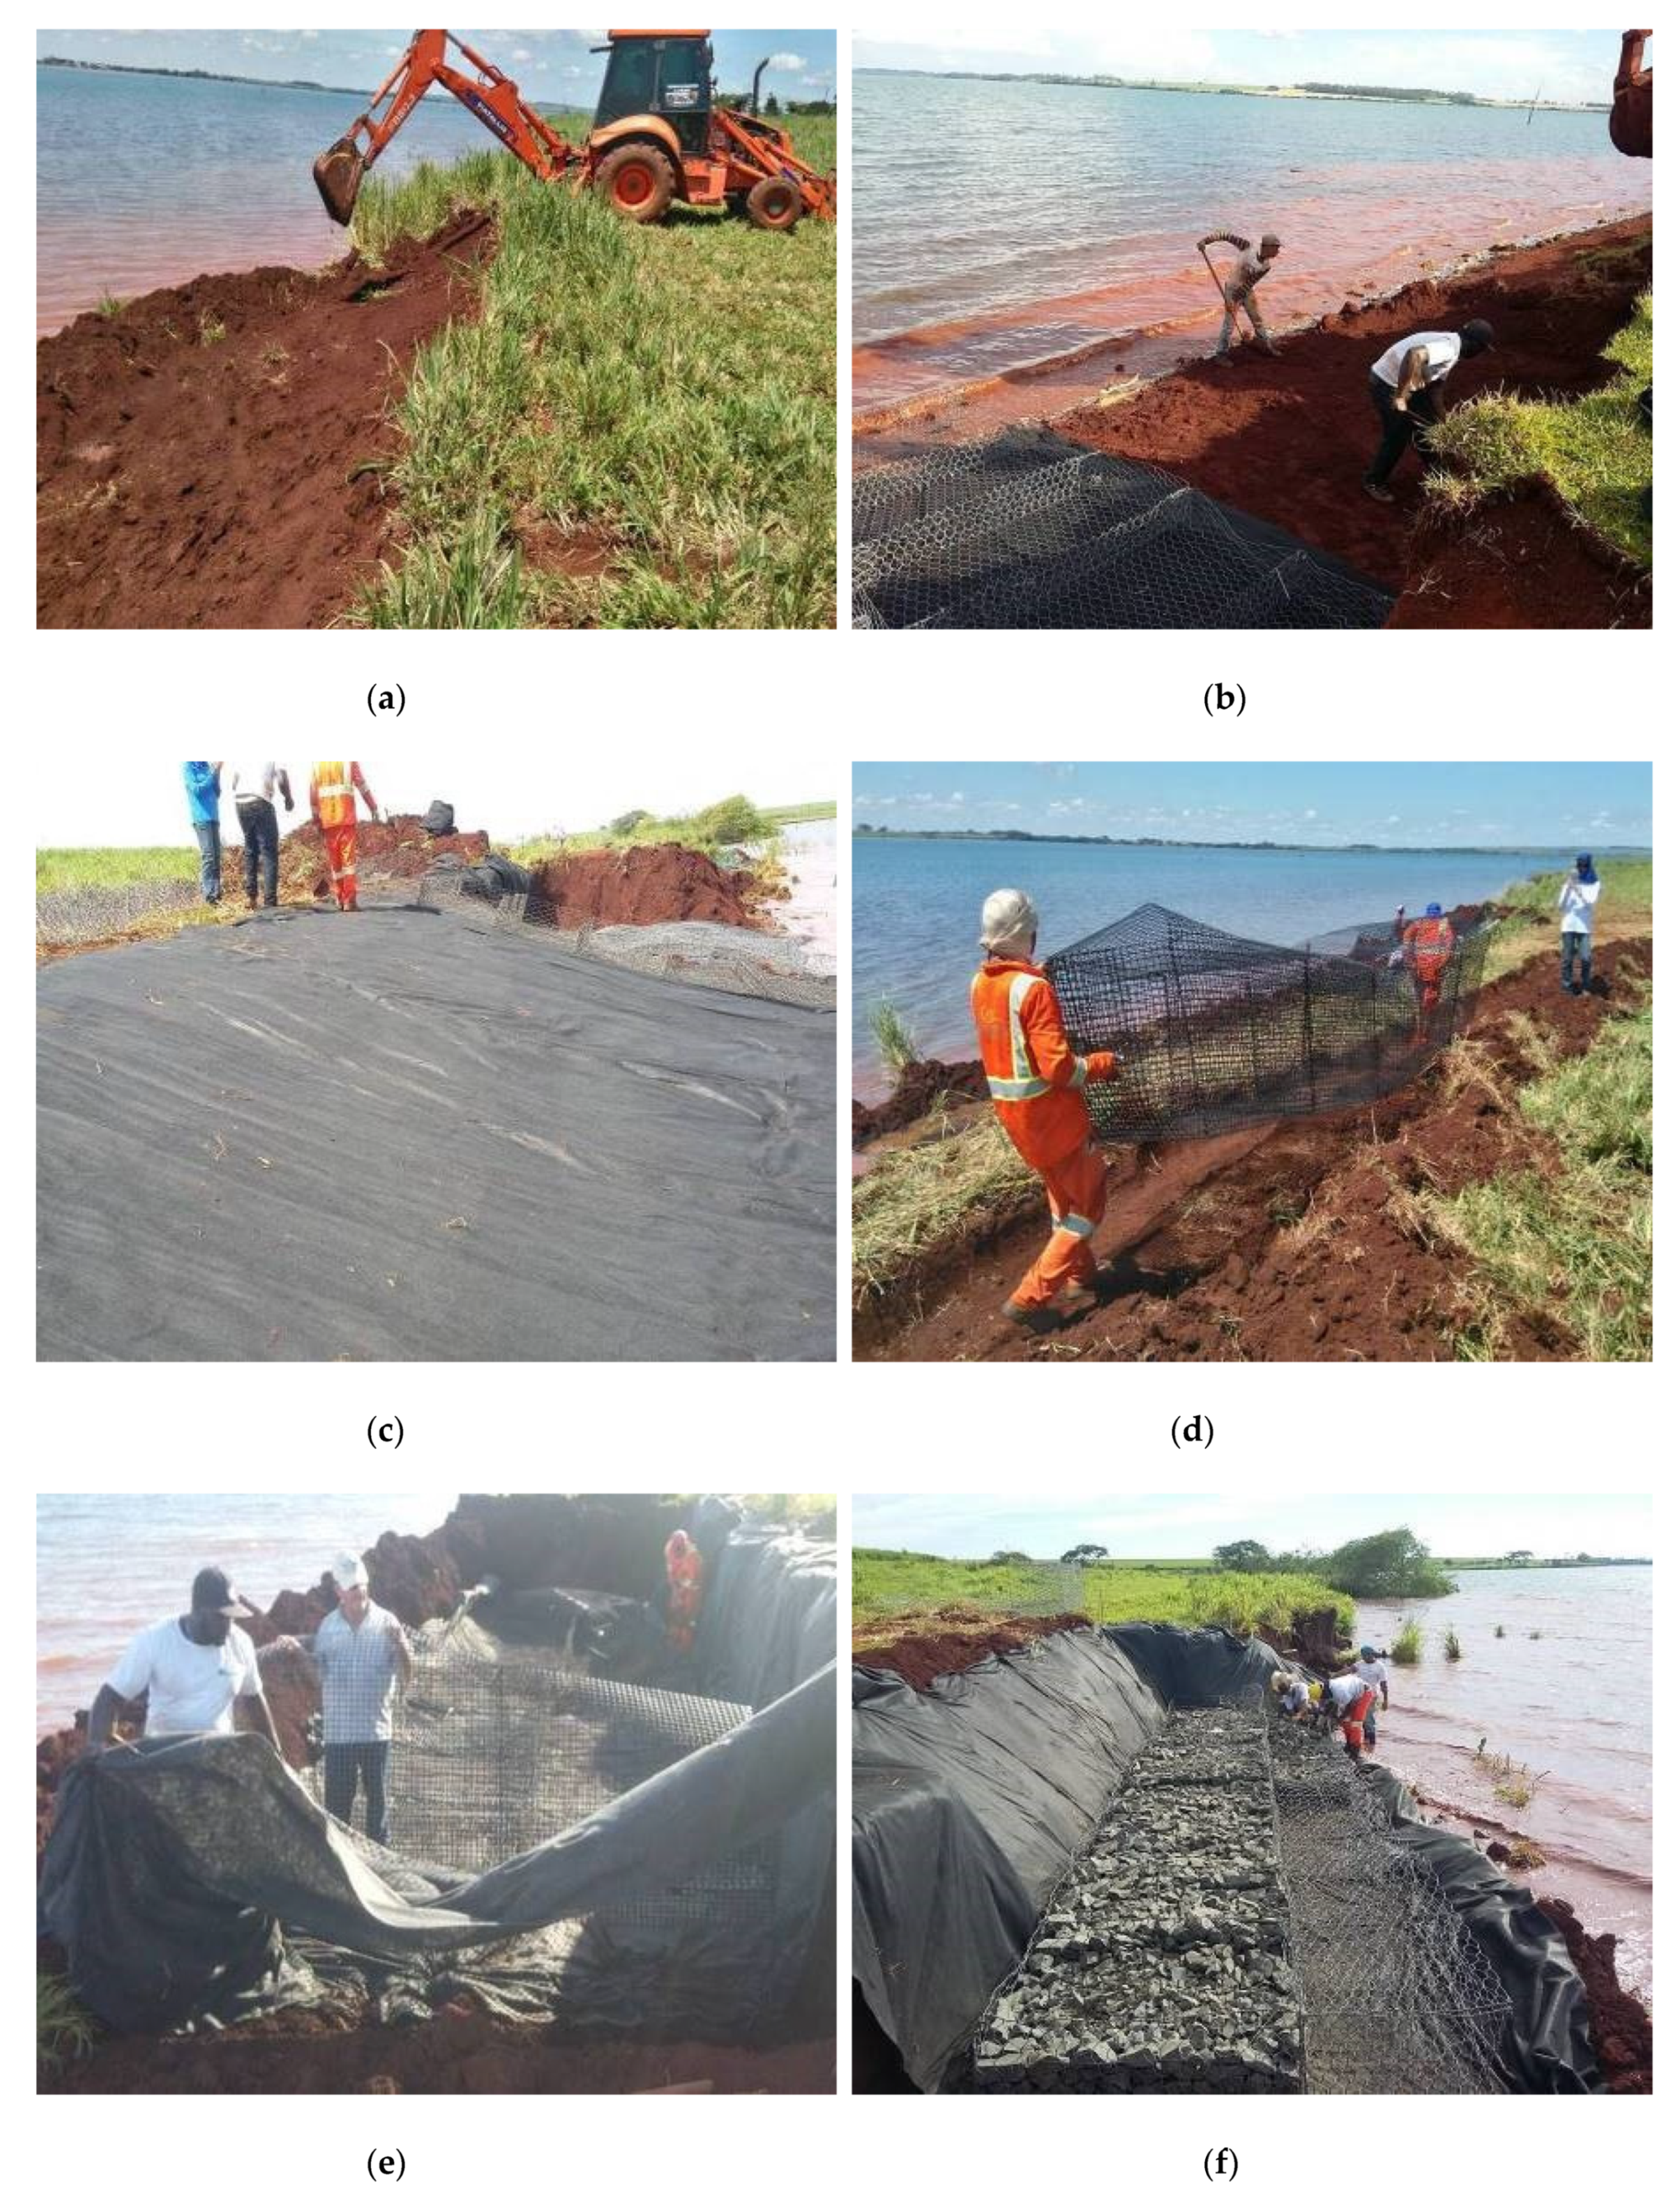
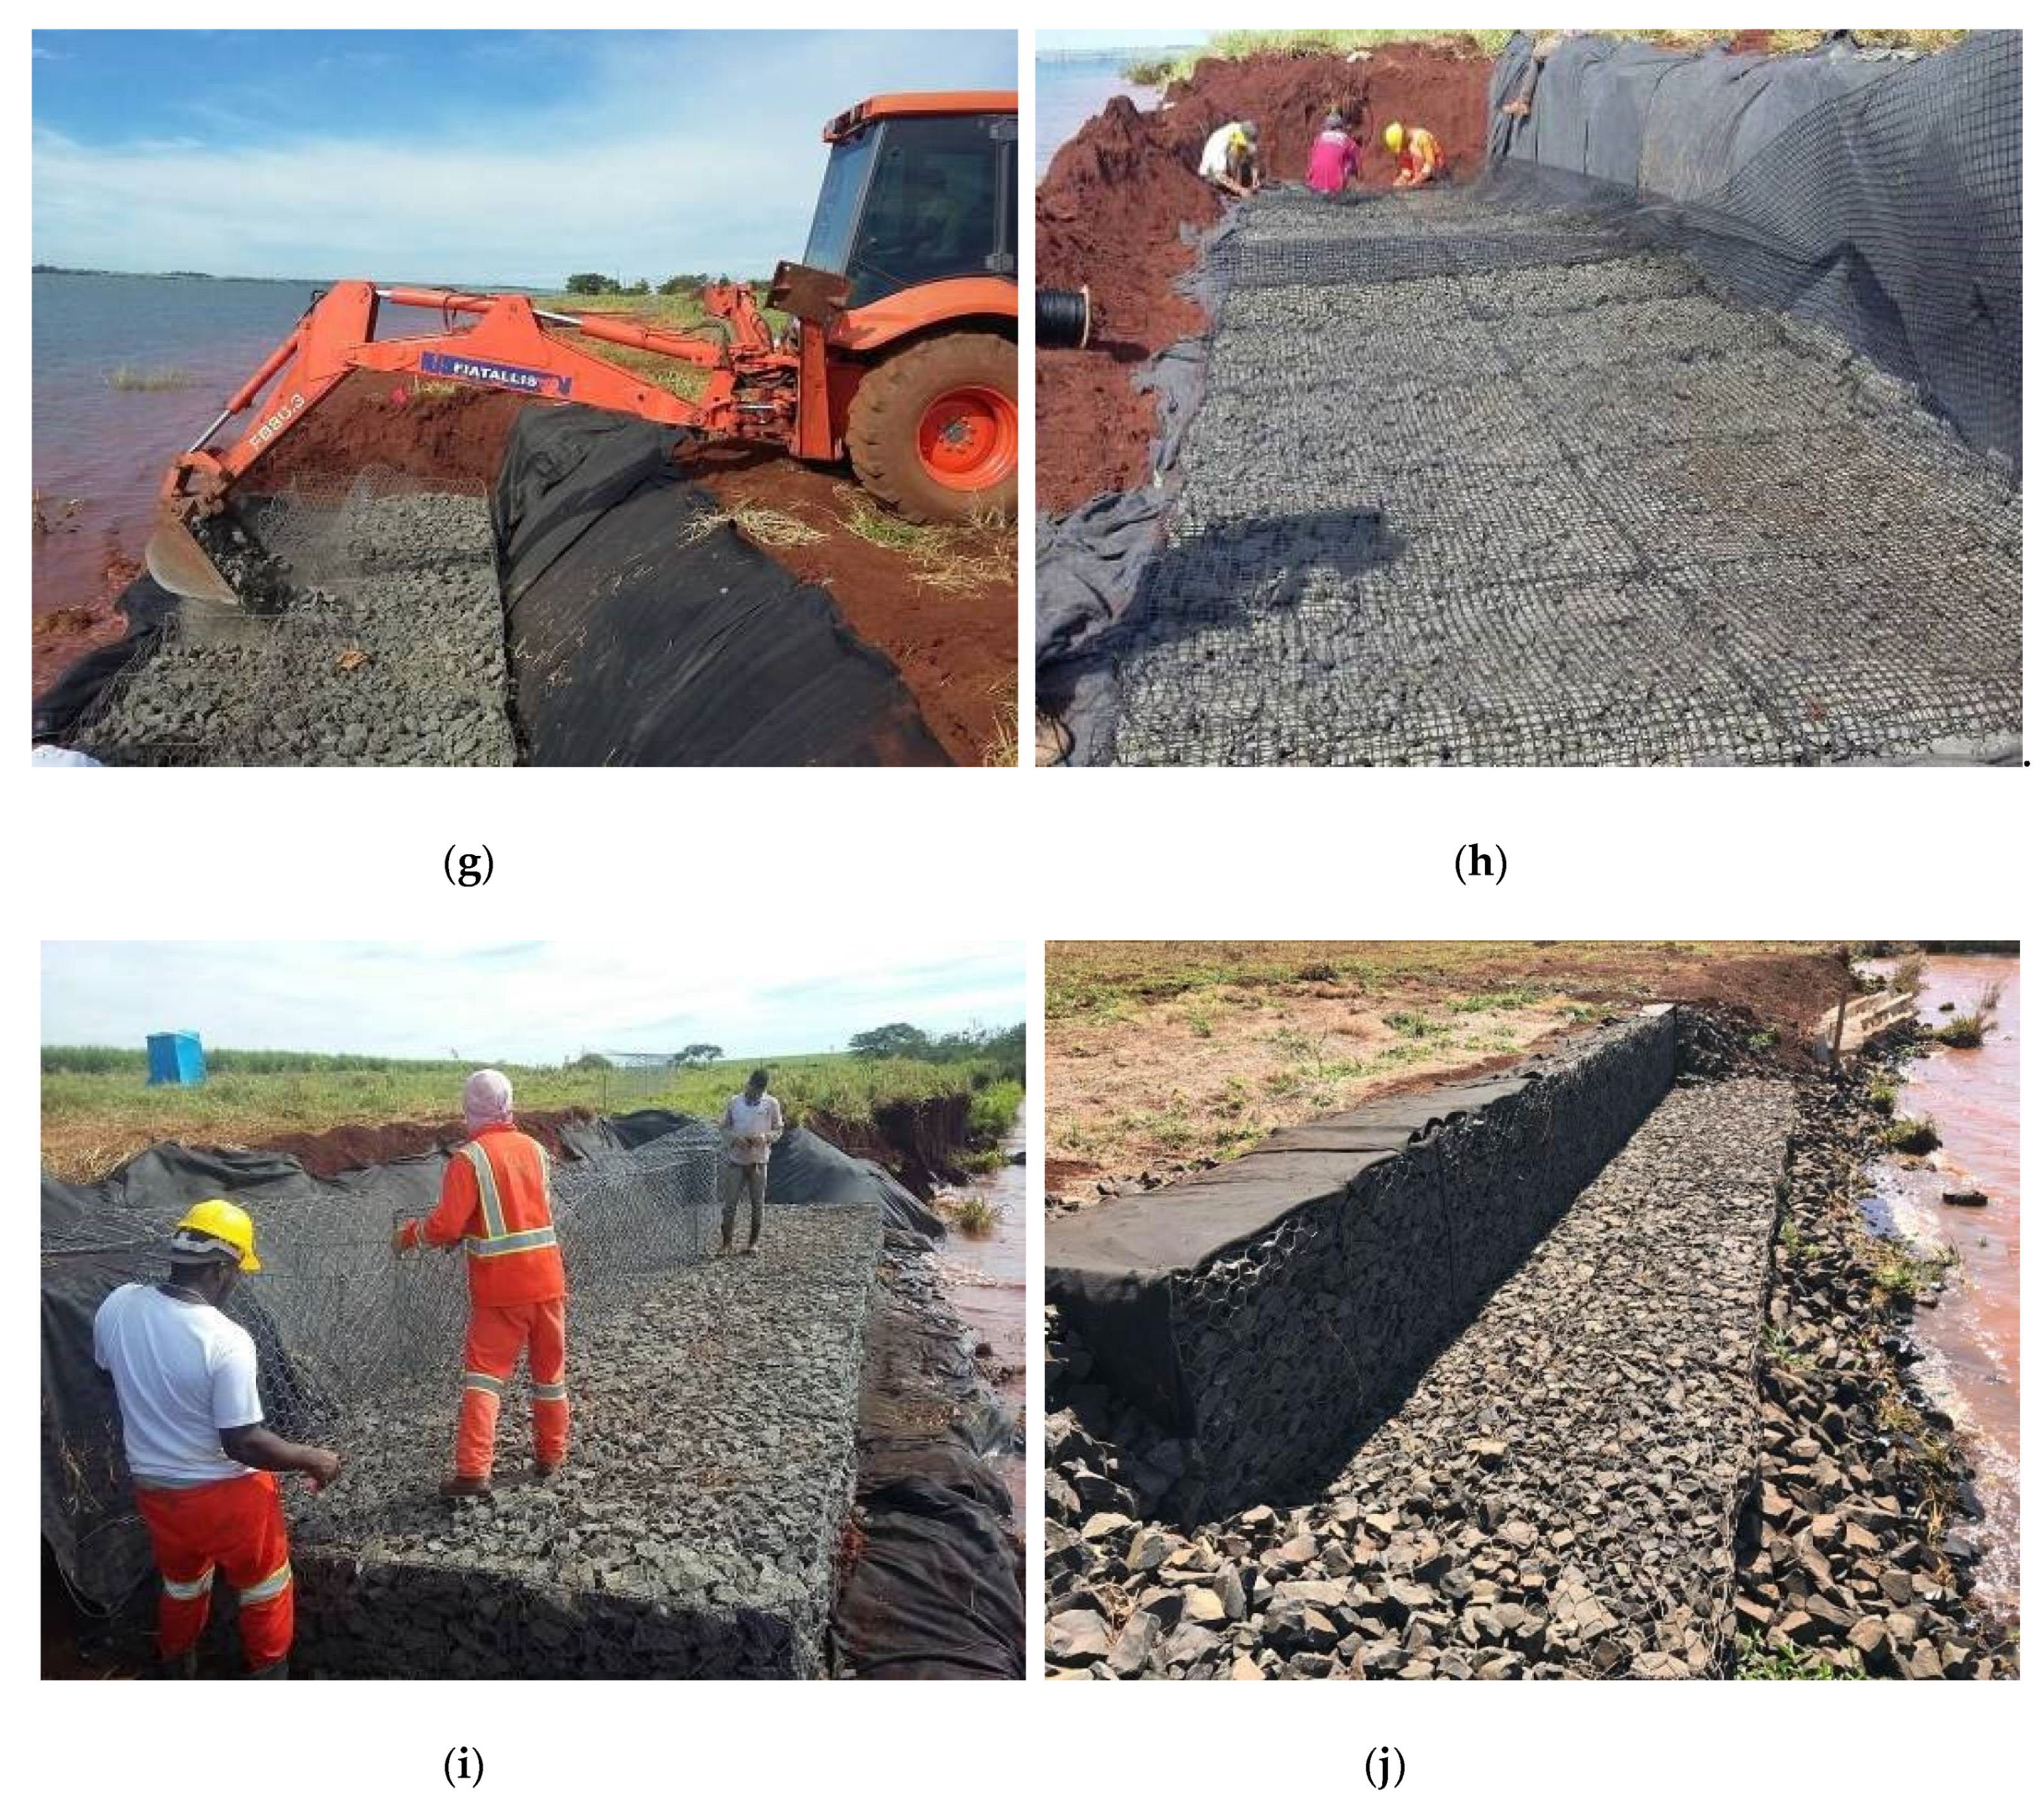
The traditional gabion, gabion mattress, and geogrid mattress systems were installed in a previously prepared subgrade. This subgrade must be lined with a geotextile material [31] that guarantees the separation between the soil particles and reinforcement structure, a prevents the transportation of soil particles inside the rock systems, thus improving the erosion control of the reservoir margin. Exhumed samples of nonwoven polypropylene geotextile were collected in each section to assess their degradation after monitoring the techniques in February 2020. Samples from the unexposed geotextile zone (Figure 4) were collected in all the sections. Concerning the exposed zone, only samples from sections VG1 and VG2 were collected due to the difficulty of collecting the samples from these zones, which are in direct contact with the reservoir water. In this study, the word “Unexposed” relates to samples that were not in contact with the reservoir water; however, these samples were in contact with other environmental factors (soil, radiation, temperature, humidity, rain, etc.) The average values of the physical and mechanical characteristics of the exhumed samples are shown in Table 3. Images of the general installation procedures of the techniques are available in Appendix A.
The physical characteristics (mass per unit area and thickness) and mechanical characteristic (tensile strength) tests presented in Table 3 were carried out in the Geosynthetic Laboratory at the University of São Paulo (USP) in São Carlos, Brazil. There is a difference between all the exhumed samples. When analyzing the properties of the geotextiles, it can be observed that the geotextiles used in the experimental unit PC were the ones that presented the highest values in the different characteristics presented. It shows the use of different geotextile materials in the control techniques of erosion implanted in the two experimental units.

2.4. Performance Evaluation of the Techniques

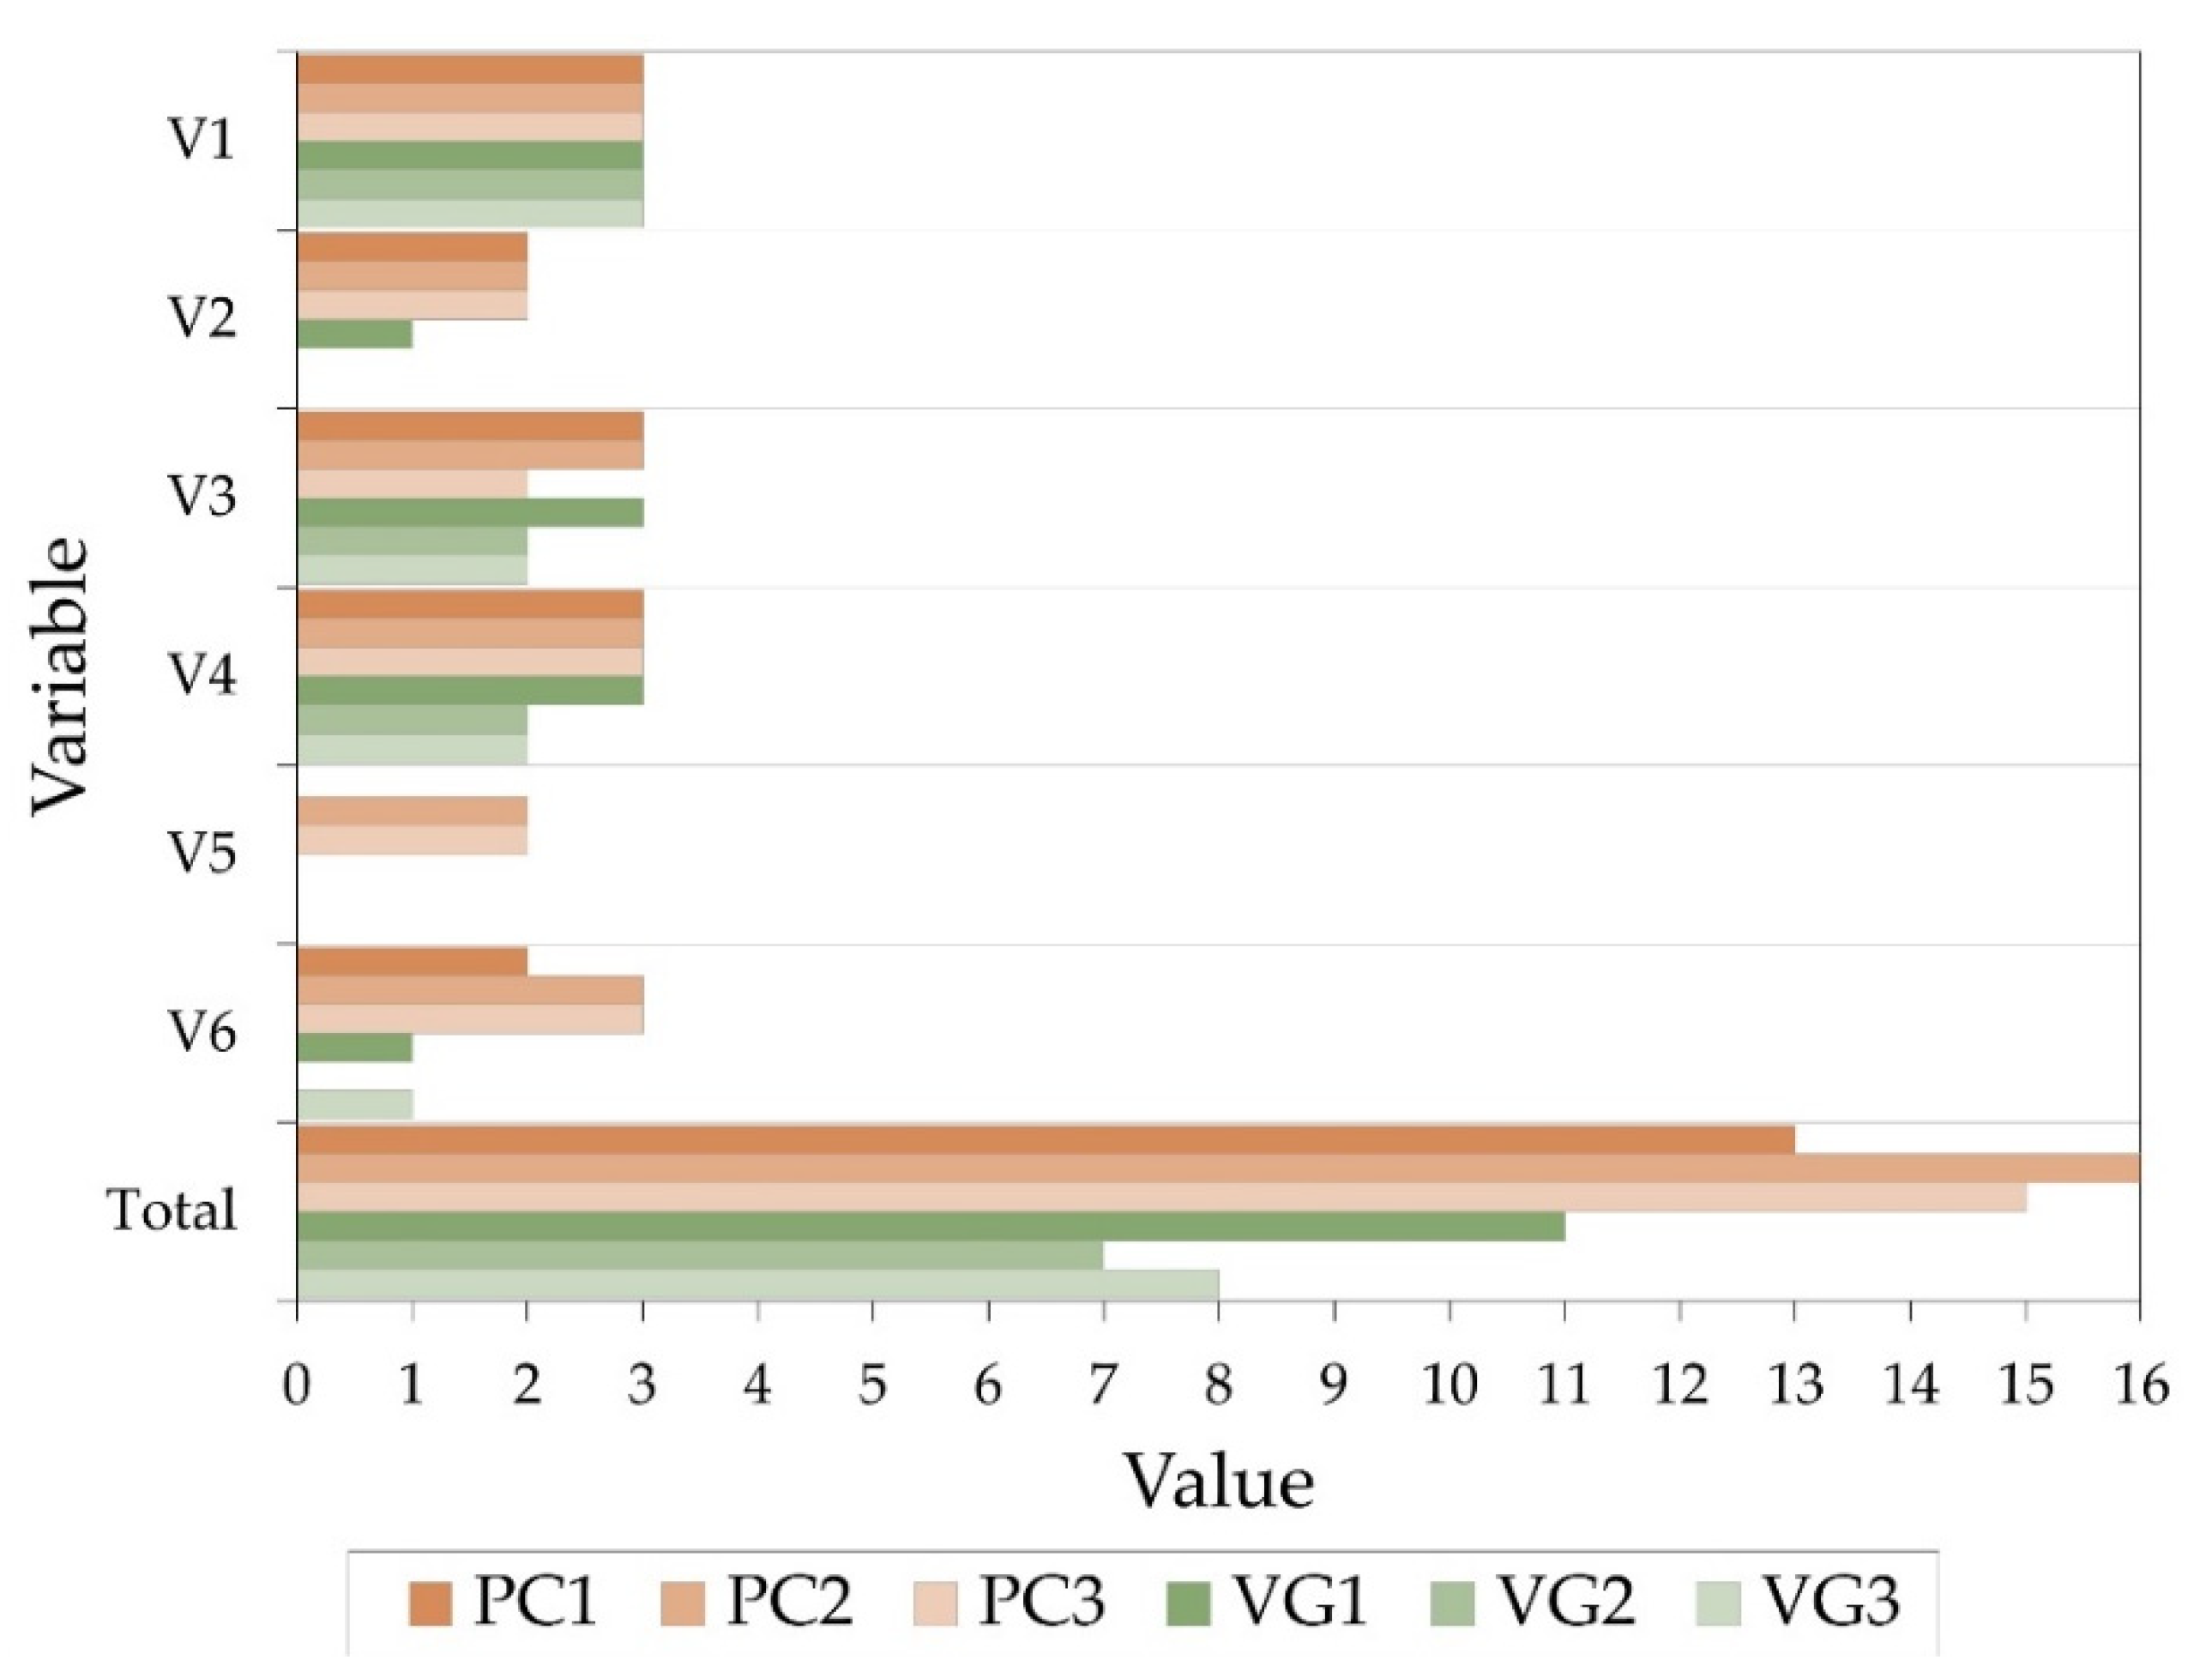
The sections started to be monitored in 2016 after completing the works to implement the techniques. Monitoring occurred periodically, with monthly visits up to 2020. The performance of the techniques was analyzed qualitatively, adopting the performance matrix used by Galvão et al. [25]. The variables shown in Table 4 were considered where each variable has a weight (from 0 to 3). The treatment that presented an optimal performance would consequently have a total weight of 18 points.
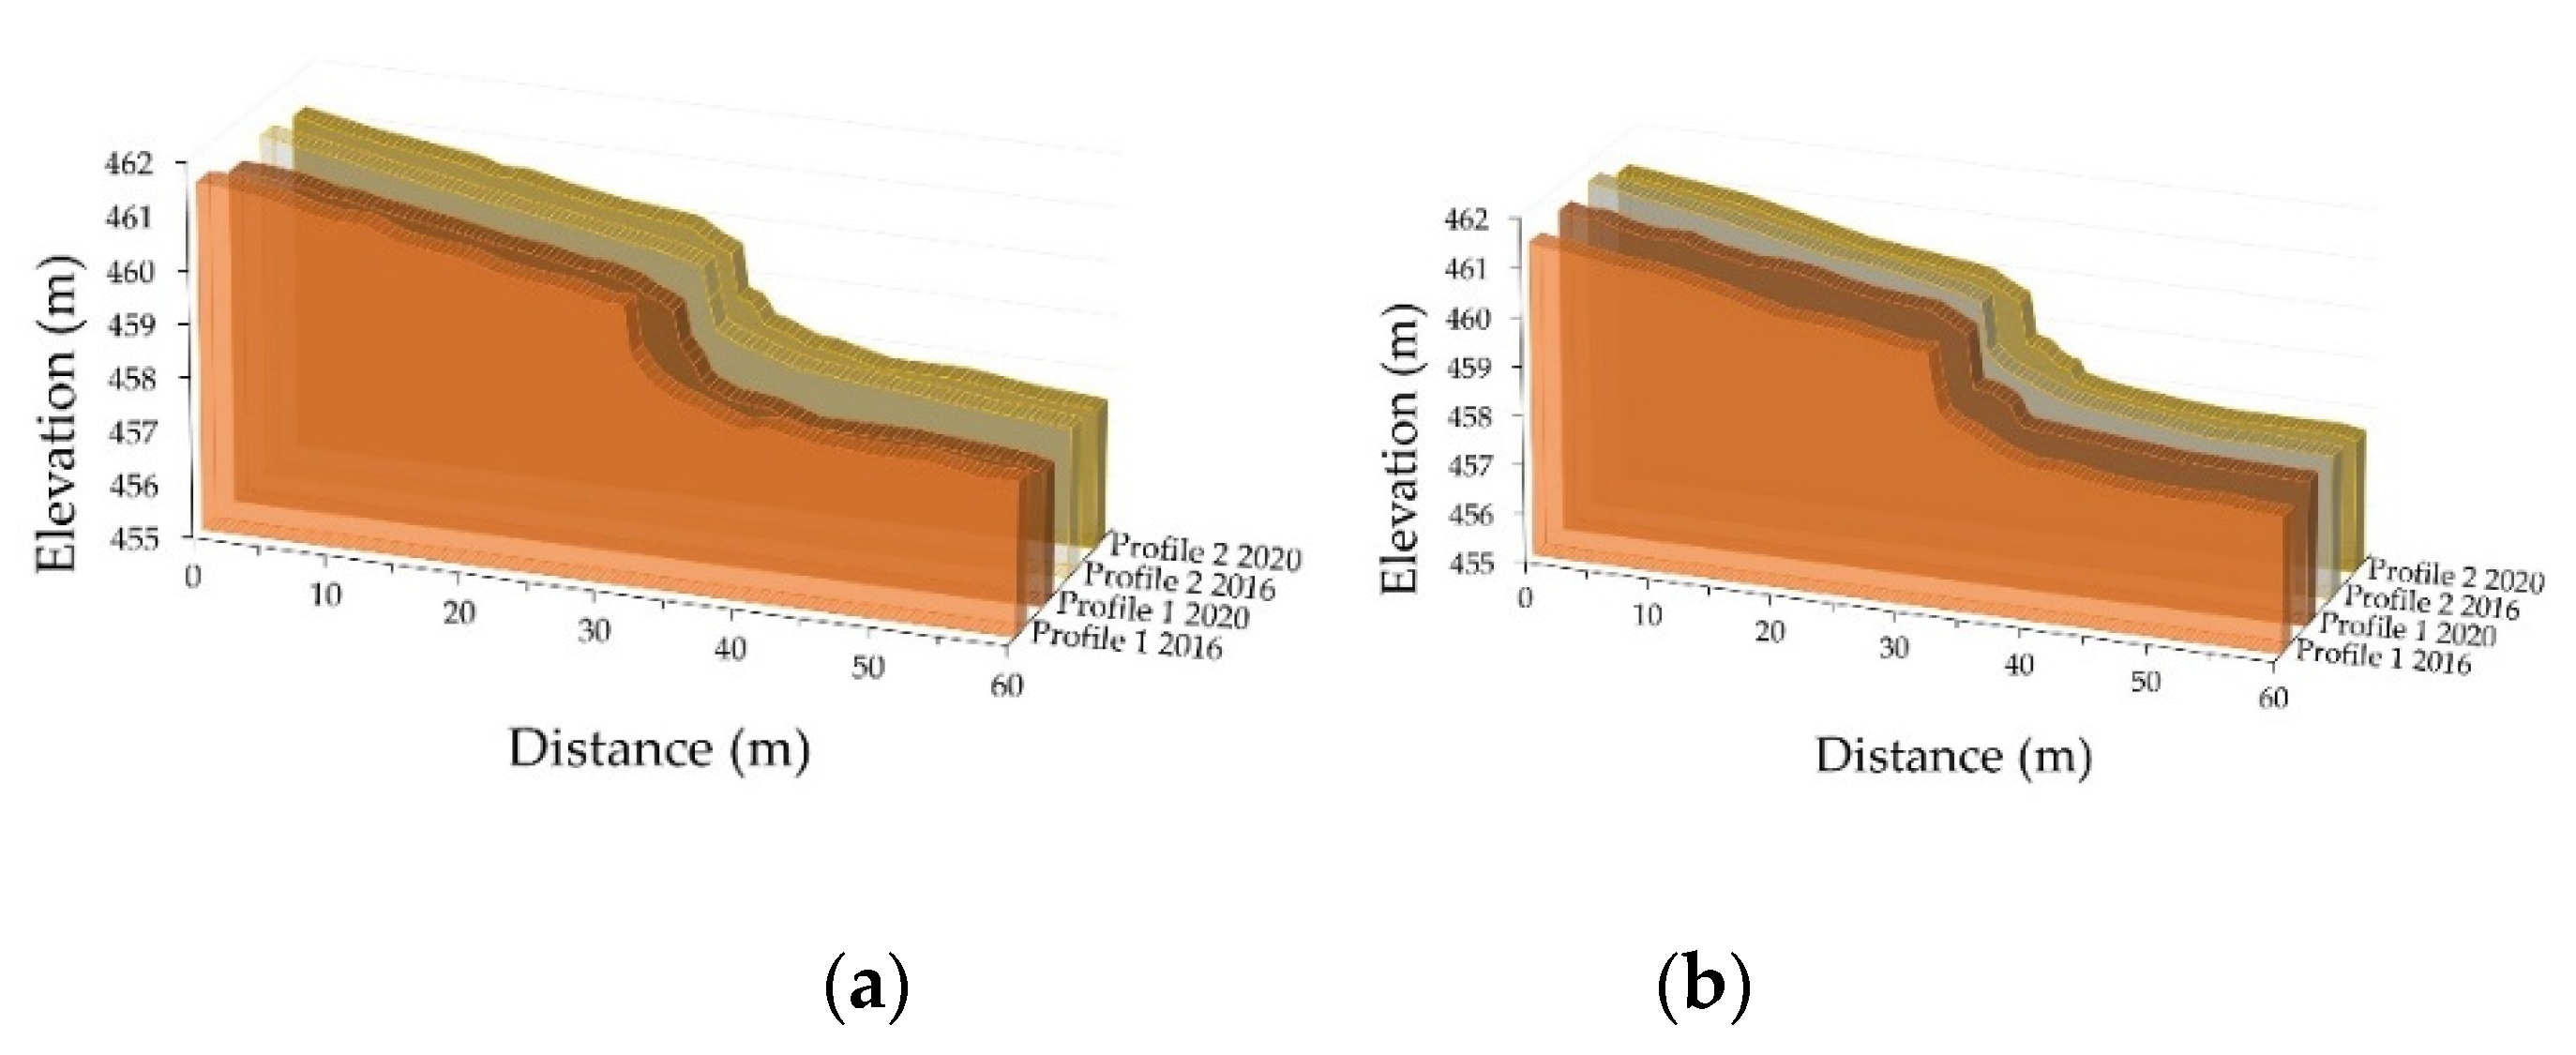
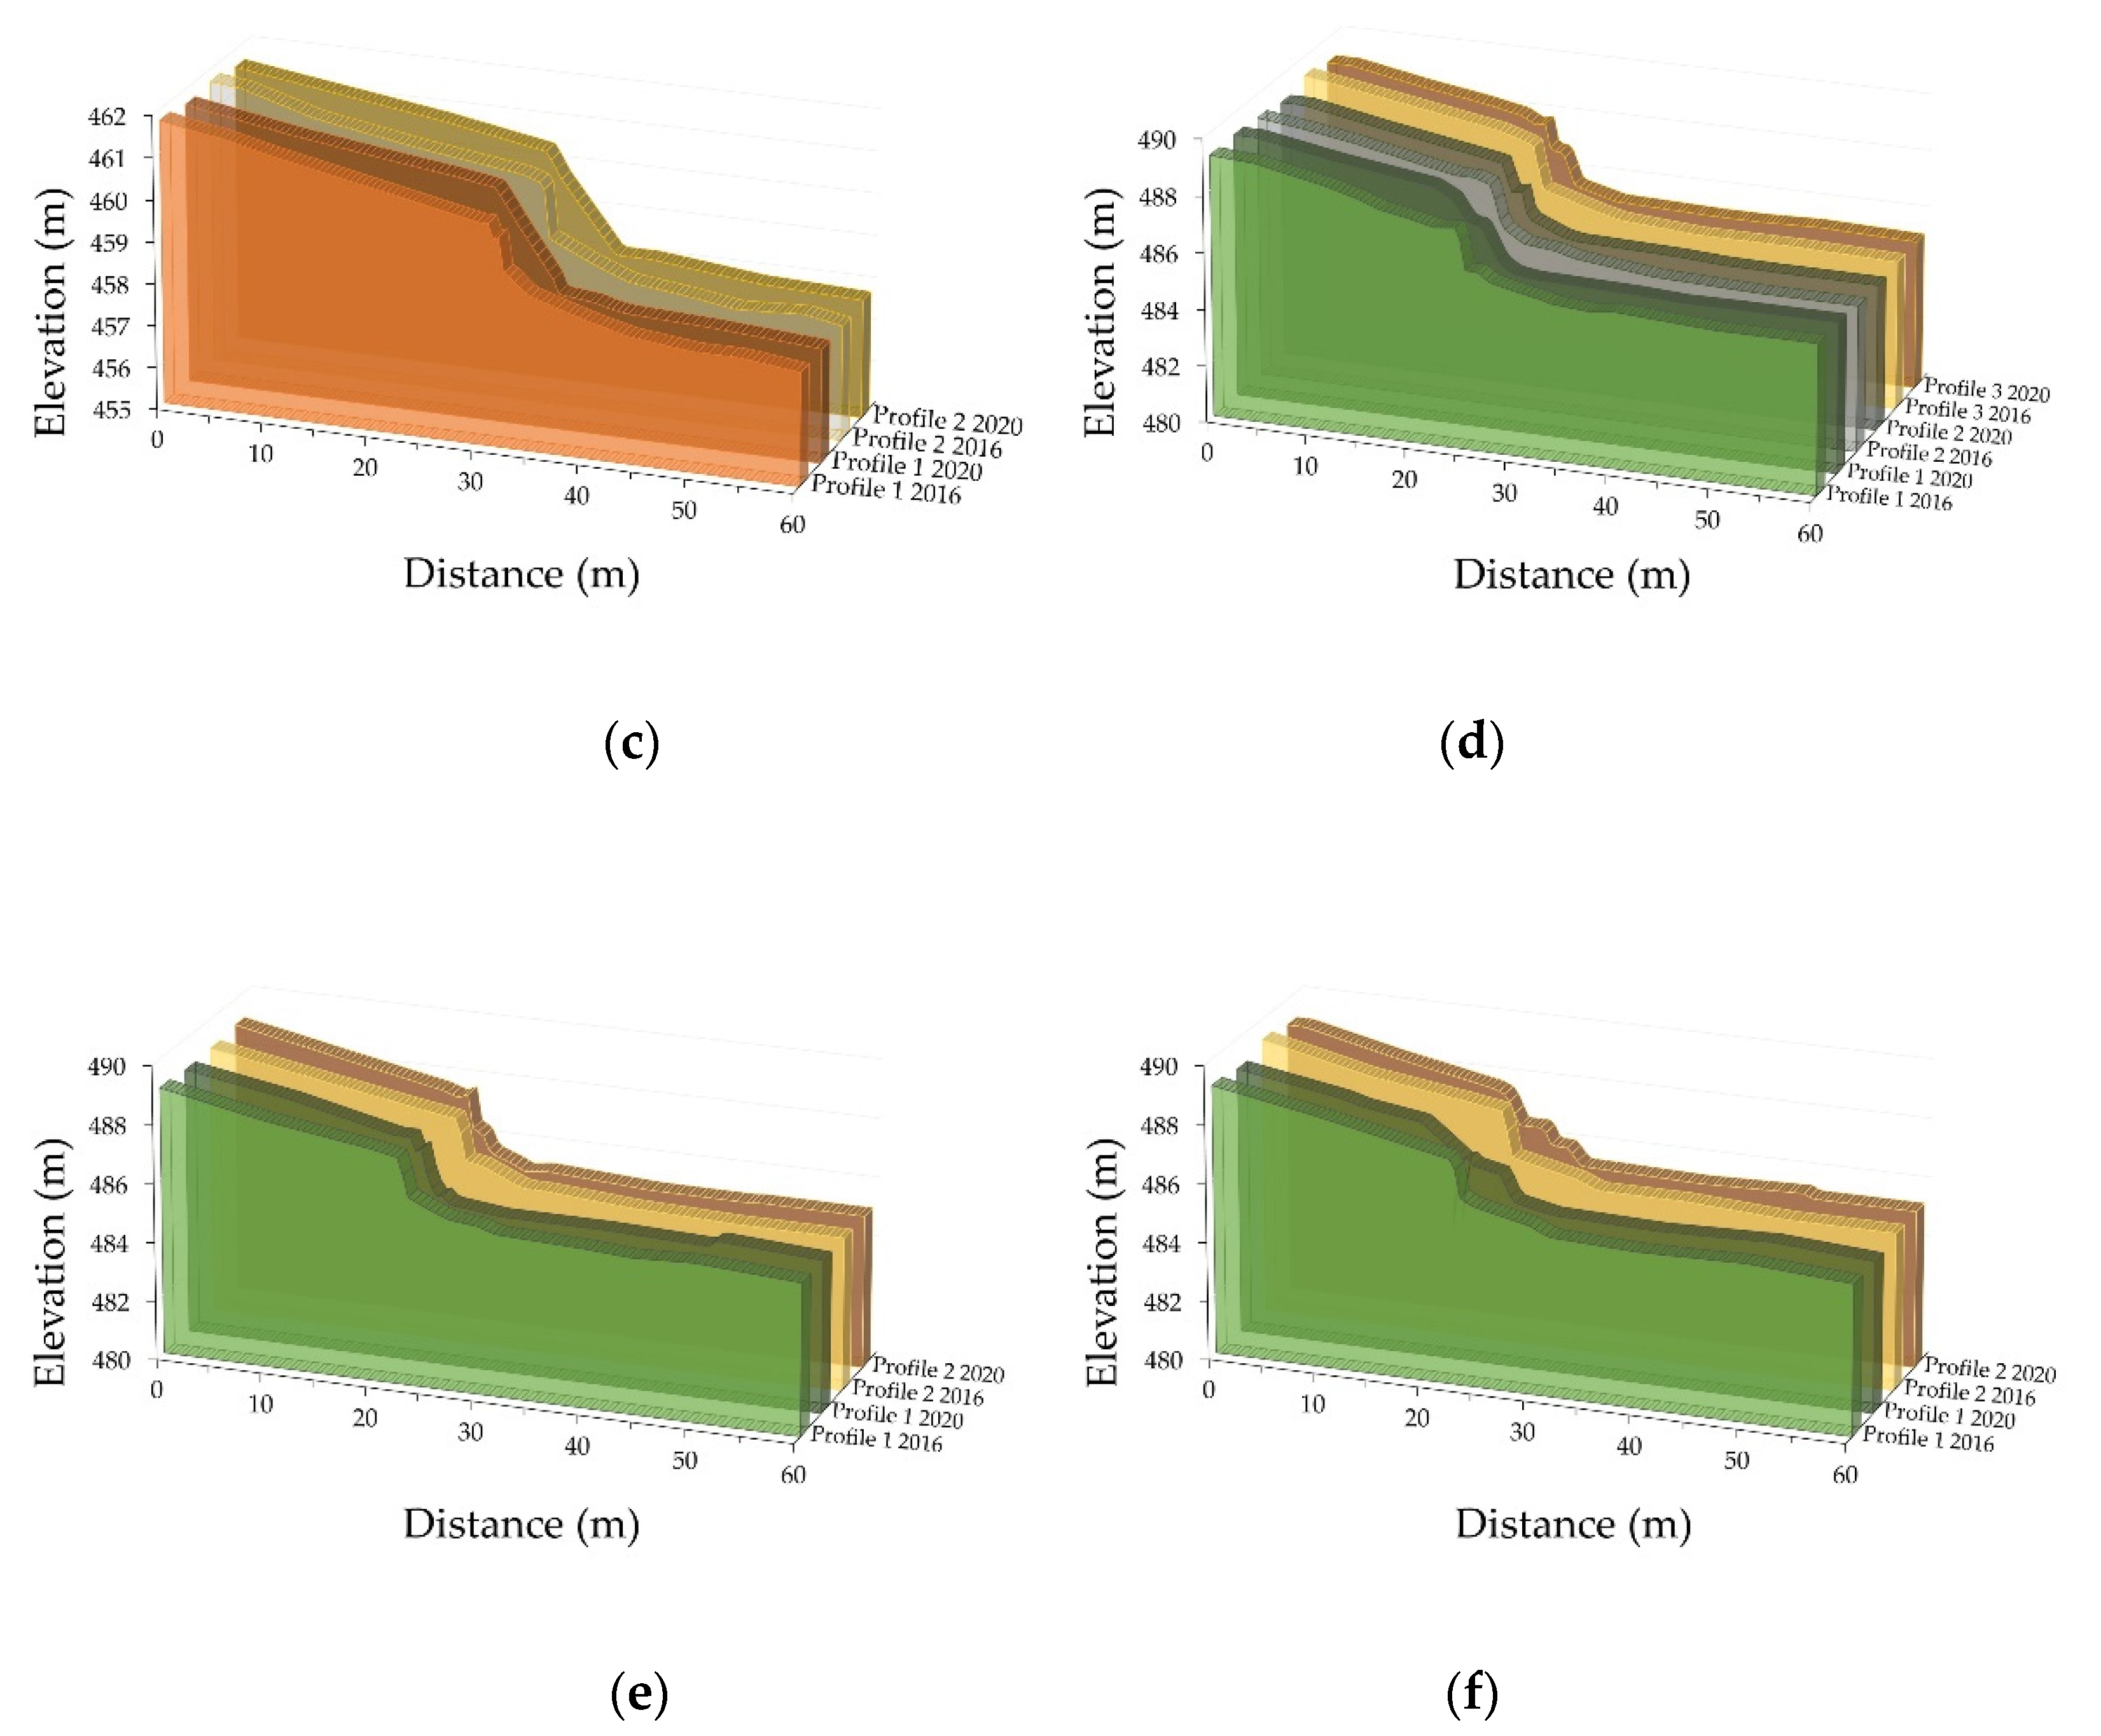
An initial bathymetry study was also carried out in each experimental unit after applying the techniques (in 2016) and at the end of monitoring (in 2020) to analyze the differential bathymetry. Two bathymetric profiles spaced 5 m apart were obtained in each section: one at the beginning of the section (profile 1) and one at the end of the section (profile 2). The topobatimetric survey services were performed following the regulations of ANA (Brazilian National Water Agency), ANEEL (Brazilian Electricity Regulatory Agency) and the Law 12.334/2010 [35]. The activities involved were: (i) Geo-referenced Planialtimetric Survey Topobatimetry, (ii) Recognition of the area, (iii) Geo-referenced demarcation, (iv) Altimetric determination, (v) Preliminary design of the project, and (vi) Topobatimetric survey in the margin areas and topographic survey in the slope protection areas. Longitudinal and transversal surveys were carried out at the reservoir margins and in the areas where the techniques were implemented using the RTK (Real Time Kinematic) system for comparison and evaluation purposes.
For the planialtimetry of the margin areas, the following was used: Total Station, RTK, Topographic level, DGPS (Differential GPS), Topographic GPS, motorized vessel, generator, ultrasonic measuring tape; ballast (20 kg), graduated rods, laptop, voltage transformers, GNSS (Global Navigation Satellite System) RTK system, communication system (radio), Portable GPS, photographic equipment, support and transport vehicles (4X4 pickup), and other tools.

2.5. Geotextile Degradation Evaluation

In order to assess the degradation of the exhumed geotextile samples (
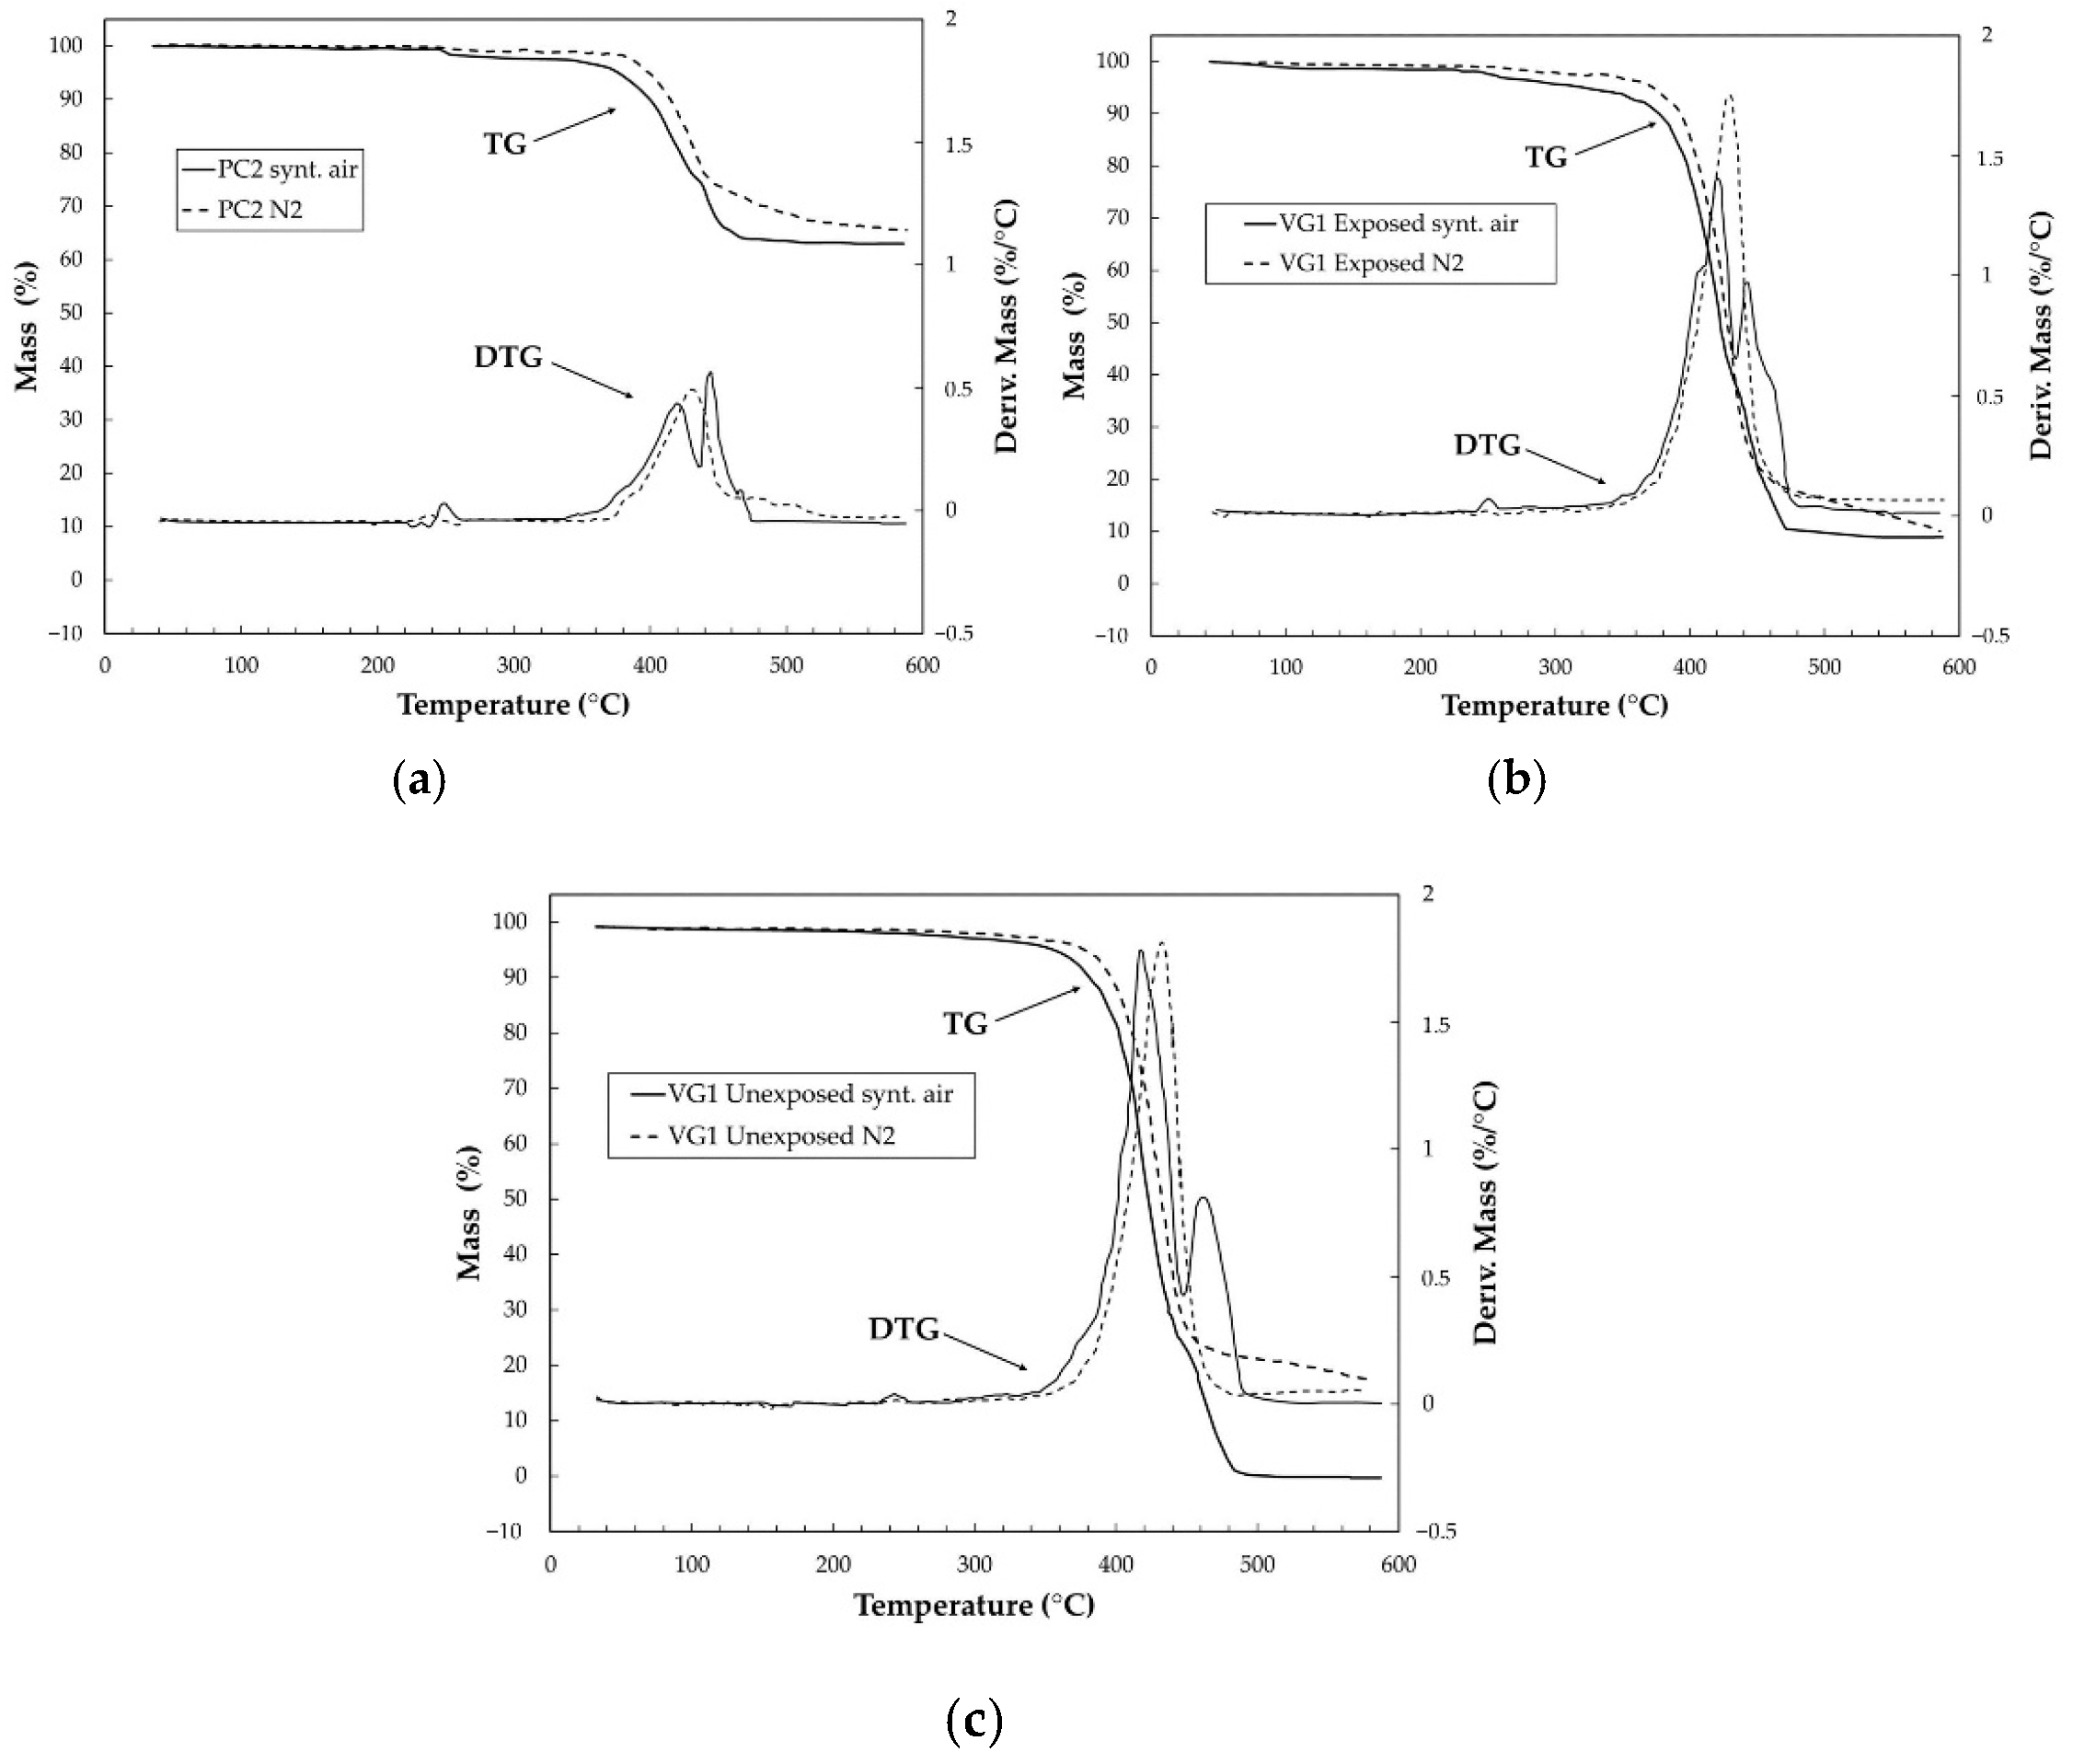
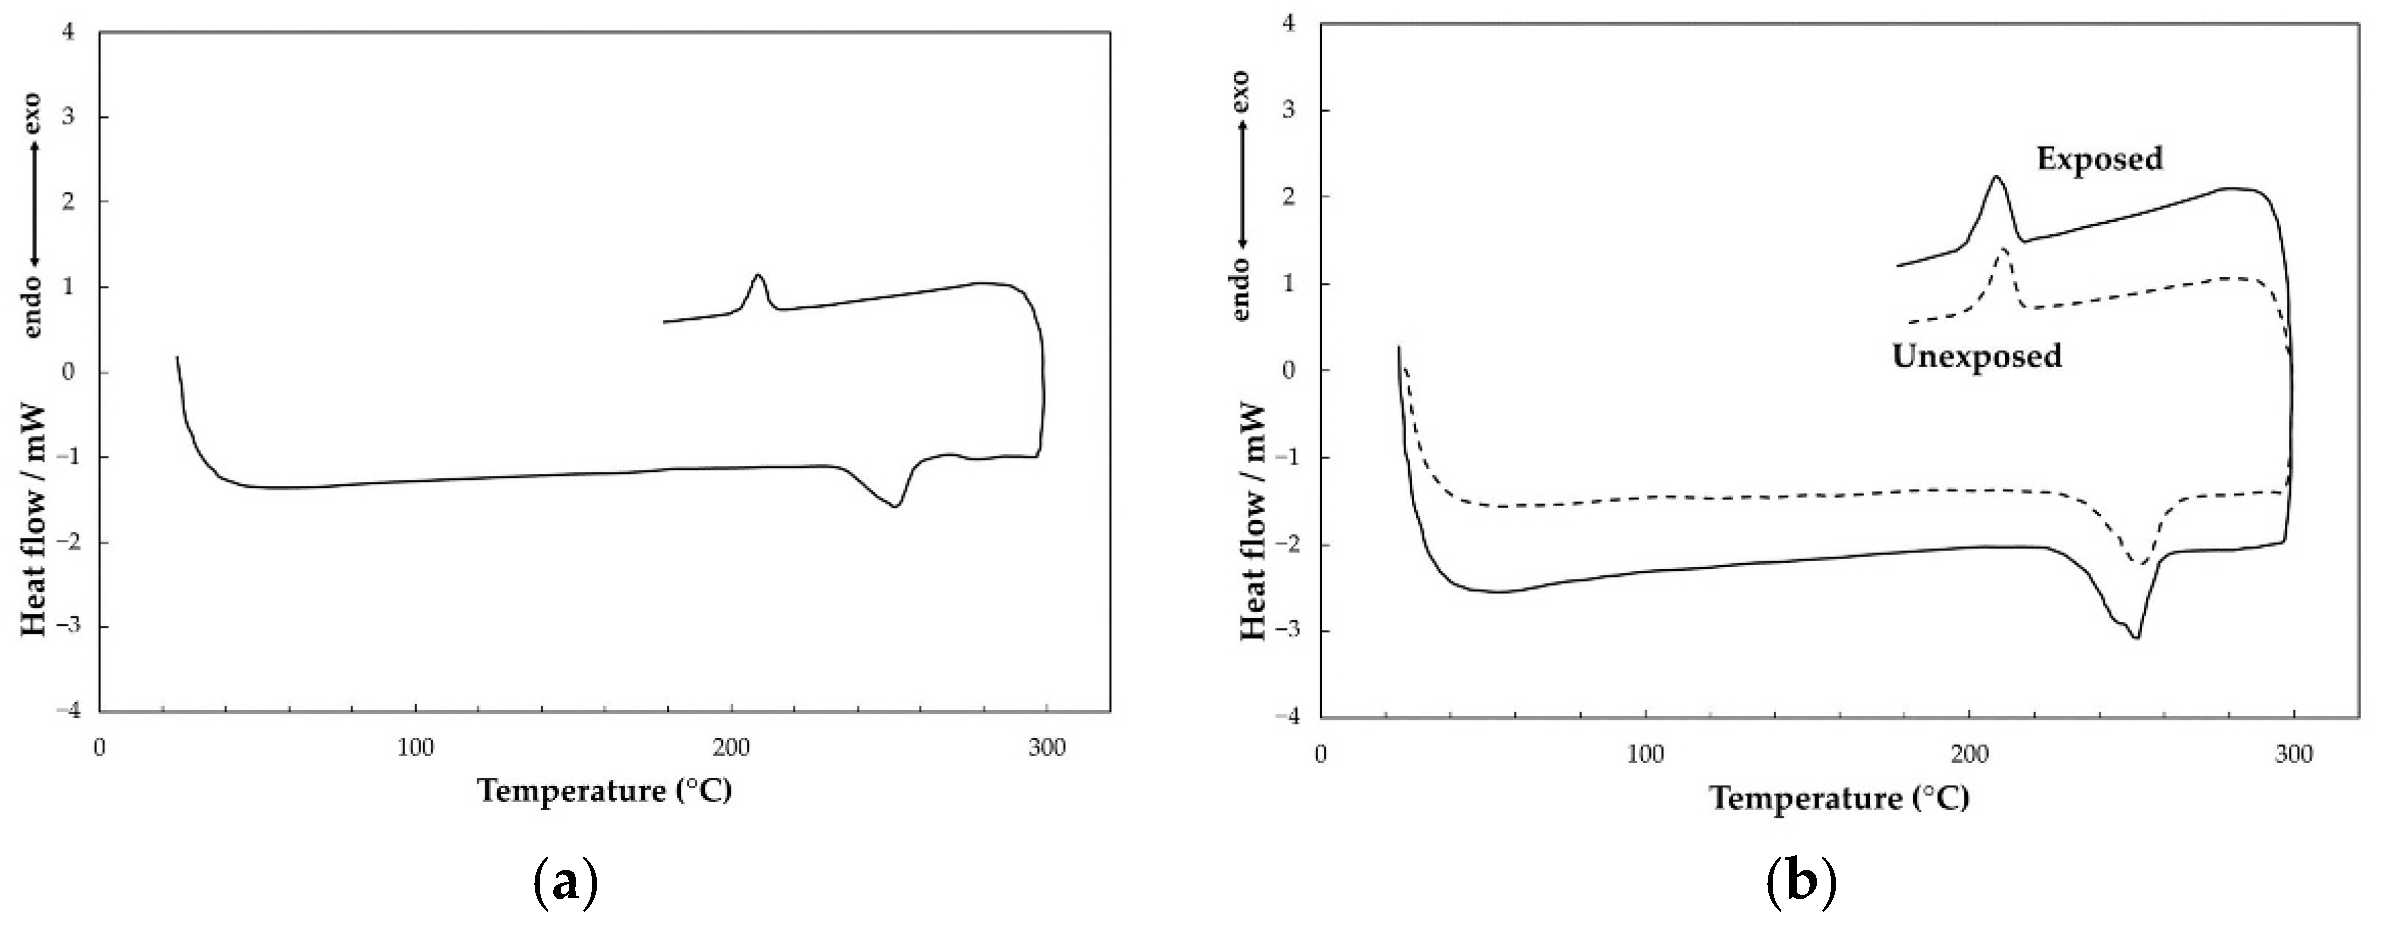
Table 3), thermal analyses were performed, which comprised thermogravimetry (TG), and Differential Scanning Calorimetry (DSC) analyses.
The evaluations performed by TG and DSC analyses aimed to evaluate the conditions of the samples under the action of temperature (thermal stability) comparing each one to verify the differences between them. The DSC curves enabled us to test the glass transition temperatures (Tg) and crystallization (Tcryst.), as well as the melting point of each sample. The TG curves made it possible to test the effects of nitrogen purge gases and synthetic air, which enabled us to compare the thermal decomposition of the samples.
The thermogravimetry (TG/DTG) was performed using an SDT 2960 (TA Instruments, USA) with a heating rate of 10 °C min−1 under nitrogen and synthetic air purge gases, with a flow of 100 mL min−1. These polymers were evaluated in an α-alumina crucible in a temperature range of 30 to 600 °C.
DSC curves were used to measure the changes in both materials. The measurements were conducted using a DSC Q20 model (TA Instruments, USA) with sample masses around 5 mg. These samples were performed in an aluminum crucible in the temperature range of 25 to 300 °C. The first step was to heat them from 25 °C to 300 °C. Then in the second step, the samples were cooled from 300 °C to 25 °C. In the last scan, the samples were heated again starting from 25 °C to 300 °C. The heating and cooling rates were 10 °C min−1 under nitrogen purge gas (flow of 50 mL min−1).

3. Results and Discussion

3.1. Performance Matrix

Figure 5 presents the results of the performance matrix for each section. The results are presented by an assessed variable (defined in Table 4) and by total performance value. It is observed that none of the sections had an optimal performance (18 points). The section that had the best performance was the PC2 (16 points) section, and the section with the worst performance was the VG2 section (7 points). It is noteworthy that the sections with the geogrid mattress technique showed a lower performance in the two experimental units compared with the mixed gabion and gabion mattress techniques. In general, the variable V5 (landscape integration) was the one with the lowest performance in the sections, a reason that may be associated with the difficulty in incorporating the aesthetics of the rigid techniques applied with the green surroundings of the margin.

3.2. Differential Bathymetry

Differential bathymetry has been used in different analyses in water bodies, such as in the margins of reservoirs, river slopes, and coastal areas (for example, [36,37,38,39,40]). It is noteworthy that most of the analyses are performed with extensive bathymetric databases. However, due to the limited number of historical records in the analyzed region, we have only the bathymetric records corresponding to the initial and final monitoring of the techniques. Another important observation is that vertical errors can be induced at the time of bathymetric occurrences, for waves at the margins, which may be responsible for some random elevation variations [39].
The initial and final cross profiles of the bathymetry performed in the years 2016 and 2020 for each section (profile 1 and profile 2) are shown in Figure 6. Section VG1 (Figure 6d) is the only one that presented three transversal profiles, in which case profile 2 is an intermediate profile and profile 3 is the final profile of the section. The values of the differential bathymetry by profile and section are shown in Table 5.
In the differential bathymetry analysis, the negative values (lower) show that in the analyzed section, there was an accumulation of sediments, and consequently less soil deposition in the reservoir. Higher values show loss of material at the margin, which shows more significant soil deposition in the reservoir.
Analyzing the maximum values of the bathymetric difference by section (Table 5), it can be observed that the experimental unit that had less soil deposition was PC, the section with less soil deposition was the PC3 (0.15 m) and the section with the highest deposition was PC1 (0.46 m). There was more significant soil deposition or material loss in the tested period (2016 to 2020) in section VG2.

3.3. Thermogravimetry (TG) and Differential Scanning Calorimetry (DSC)

TG and DSC curves were performed at a heating rate of 10 °C min−1. The results obtained from the geotextile samples are shown in Figure 7; Figure 8. For the thermal analyses, samples from each exhumed geotextile in the sections of the experimental units were collected.
Figure 7a shows the TG/DTG curves for the unexposed sample of PC2 section in synthetic and nitrogen purge gas. The other curves of the PC experimental unit were not shown, considering that the thermal behavior is similar, but they present different variations of the mass losses. It was found that the first mass variation of the three samples (unexposed PC1, PC2, and PC3) goes up to a temperature of 233 °C for both purging gases. This mass variation was attributed to a sample fusion process, in which the loss of material that was trapped in the molecular structure occurs due to the rearrangement of the polymer molecules. The melting point of this material is observed in the analysis made by DSC (Figure 8a). The values of this mass variation, the other decomposition steps, and the temperature ranges, are shown in Table 6. The fact that there is a mass variation process during the melting point is very common in different polymers, considering the rearrangement of the polymer molecules after the melting process [41]. However, it shows only variations in mass, which were attributed to the difficulty of cleaning to remove soil from the samples to carry out the analyses.
Figure 7b,c show the thermogravimetric analyses of the samples from the VG2 section (exposed and unexposed, respectively). During the material collection, it was possible to collect samples of material exposed directly to the water in the reservoir (Figure 7b), as well as material that was not in contact with water (unexposed). The unexposed material was only in contact with the soil and exposed to environmental factors (Figure 7c). It should be noted that in the experimental unit VG, it was only not possible to collect exposed geotextile from section VG3, which was not in favorable safety conditions for collection. In Figure 7b, it can be observed that the two TG curves of the exposed sample in section VG1 have similarities in the thermal decomposition behavior for both purge gases (synthetic air and nitrogen). The first stage for both samples shows that the first decomposition occurs between temperatures of 200 to 260 °C, while the second stage occurs between 300 and 480 °C. The mass variation information is presented in Table 6. The behavior of the TG curves of the unexposed material in section VG1 (Figure 7c) showed that the first mass variation occurs during the material melting process and the main thermal decomposition only has a single step for analysis in nitrogen and two steps for analysis in synthetic air. In both analyses, they occur between 330 and 510 °C. After analyzing the TG curves (Figure 7), it was observed that there was always the presence of carbonaceous residue impregnating the crucible, associated with the presence of mineral residues, coming from the soil.
The DSC analyses are shown in Figure 8, where Figure 8a shows the analysis of the PC1 section sample. In Figure 8b,c, the analyses of the VG1 section (exposed and unexposed, respectively) are shown. The melting point and crystallization intervals, and the peak temperatures are shown in Figure 8. As seen in Figure 8a, the melting process occurs in a single stage and during the cooling process, the material crystallizes. This information is essential as it shows that the material remains in the crystalline condition because if there were no fusion/crystallization, there would be an amorphous material, which would show that the material would lose its original characteristics [42,43,44]. The data regarding the melting and crystallization peaks are shown in Table 6.

4. Conclusions

Several factors can affect the performance of an erosion control technique. The present study evaluated these macro-structurally factors through a qualitative analysis resulting from monitoring different variables and the bathymetric difference of the study sections, as well as microstructurally through thermal analysis that showed the degradation of a component (the geotextile) of the semi-rigid techniques implemented on the reservoir margins.
The performance matrix and differential bathymetry showed that the sections in the Porto Colômbia experimental unit where the mixed technique of gabion with mattress gabion was applied were the ones that presented the best performance among the compared sections. It can be highlighted that the mixed technique of a gabion and gabion mattress had a better performance compared to the geogrid mattress technique. This behavior may be linked to the rigidity of the material used to manufacture the boxes that contain the aggregate, which in traditional gabions is in metallic mesh, a material with fewer deformations compared to geogrids.
Commercial geotextiles were tested by DSC and TG/DTG analyses. TG/DTG analyses showed the thermal behavior under purge gas conditions, which allowed us to consider that the behavior of these materials up to a temperature of around 200 °C has the same thermal behavior, which shows that they do not change when submitted to heating. Naturally, the degradation behavior is different, considering that they are oxidizing and inert gases. Besides, the DSC curves showed that the exposed and unexposed samples behave similarly, with little change between them. However, the results of the exposed samples show a tendency of detachment and the appearance of new reactions during the fusion process, which shows that this sample is changing the molecular structure. The effect caused in the long term in geotextile samples is the constant decrease of crystallization, which leads to brittle materials and makes them unsuitable for use.
The work showed the importance of monitoring erosion control techniques to estimate their performance and the durability of the materials used.

Author Contributions

The individual contributions of each authors are highlighted as follows: conceptualization: M.P.d.L.; data curation: M.A.A.A., R.D.d.S.J., M.K. and C.A.V.; formal analysis: M.A.A.A. and M.K.; funding acquisition: M.P.d.L.; investigation: M.A.A.A., C.A.V., M.S.S. and A.T.C.; methodology: M.A.A.A. and A.T.C.; project administration: M.P.d.L.; software: A.T.C.; supervision: J.L.d.S.; validation: M.A.A.A.; visualization: R.D.d.S.J.; writing—original draft: M.A.A.A.; writing—review & editing: M.S.S. and J.L.d.S. All authors have read and agreed to the published version of the manuscript.

Funding

This research was funded by the Agência Nacional de Energia Elétrica (ANEEL; PD-0394-1603/2016) and the Coordenação de Aperfeiçoamento de Pessoal de Nível Superior (CAPES; 001).

Data Availability Statement

Data sharing is not applicable to this article.

Acknowledgments

The authors would like to thank the University of São Paulo and the Eletrobras FURNAS community for the support provided to the research activities reported in this paper and Agência Nacional de Energia Elétrica (ANEEL; National Agency of Electric Energy) for promoting this research (PD-ANEEL number 0394-1603/2016). This study was financed in part (support granted to the first author) by the Brazilian Federal Agency for Support and Evaluation of Graduate Education (Coordenação de Aperfeiçoamento de Pessoal de Nível; CAPES)-Finance Code 001.

Conflicts of Interest

The authors declare that they have no known competing financial interests or personal relationships that could have appeared to influence the work reported in this paper. Thus, the authors declare no conflict of interest. Moreover, the funders had no role in the design of the study; in the collection, analyses, or interpretation of data; in the writing of the manuscript; or in the decision to publish the results.

Appendix A

Figure A1. General installation procedures of the techniques: (a) mechanical reshaping of the margins, (b) manual reshaping of the margins, (c) installation of the geotextile, (d) transportation of boxes to make the mattress, (e) installation of the metallic mesh/geogrid on the geotextile, (f) installation of the mattress boxes (g) mattress box filling, (h) closing the mattress covers, (i) installation of the gabion on the mattress and (j) final installation.
Water 13 00500 g0a1aWater 13 00500 g0a1b

References

  1. Lewis, L. Soil Bioengineering—An Alternative for Roadside Management; San Dimas Technology & Development Center: San Dimas, CA, USA, 2000. [Google Scholar]
  2. Simon, K.; Steinemann, A. Soil Bioengineering: Challenges for Planning and Engineering. J. Urban Plan. Dev. 2000, 126, 89–102. [Google Scholar] [CrossRef]
  3. Biedenharn, D.S.; Charles, M.E.; Watson, C.C. The WES Stream Investigation and Streambank Stabilization Handbook; US Army Engineer Waterways Experiment Station, U.S. Army Engineer: Vicksburg, MS, USA, 1997. [Google Scholar]
  4. Fischenich, J.C.; Allen, H. Stream Management; Wetlands Research & Technology Center, Environmental Laboratory, U.S. Army Engineer Research and Development Cente: Vicksburg, MS, USA, 2000. [Google Scholar]
  5. Martínez-Murillo, J.F.; Hueso-González, P.; Ruiz-Sinoga, J.D. Impact of low pressure grazing on the hydrological and sediment connectivity in hillslopes under contrasted Mediterranean climatic conditions (South of Spain). Land Degrad. Dev. 2018, 29, 1130–1140. [Google Scholar] [CrossRef]
  6. Martínez-Murillo, J.F.; Hueso-González, P.; Ruiz-Sinoga, J.D. Topsoil moisture mapping using geostatistical techniques under different Mediterranean climatic conditions. Sci. Total Environ. 2017, 595, 400–412. [Google Scholar] [CrossRef] [PubMed]
  7. Theisen, M.S. The role of geosynthetics in erosion and sediment control: An overview. Geotext. Geomembr. 1992, 11, 535–550. [Google Scholar] [CrossRef]
  8. United States Army Corps of Engineers (USACE). Shoreline and Channel Erosion Protection: Overview of Alternatives. WRP Technical Note HS-RS-4.1; Wetlands Research & Technology Center, Environmental Laboratory, U.S. Army Engineer Research and Development Center: Vicksburg, MS, USA, 1998. [Google Scholar]
  9. United States Department of Agriculture (USDA). Engineering Field Handbook Part 650 Engineering Field Handbook. In National Engineering Handbook; US Soil Conservation Service: Washington, DC, USA, 2016. [Google Scholar]
  10. Sanches Fernandes, L.F.; Sampaio Pinto, A.A.; Salgado Terencio, D.P.; Leal Pacheco, F.A.; Vitor Cortes, R.M. Combination of ecological engineering procedures applied to morphological stabilization of estuarine banks after dredging. Water 2020, 12, 391. [Google Scholar] [CrossRef] [Green Version]
  11. Annys, S.; Ghebreyohannes, T.; Nyssen, J. Impact of hydropower dam operation and management on downstream hydrogeomorphology in semi-arid environments (Tekeze, Northern Ethiopia). Water 2020, 12, 2237. [Google Scholar] [CrossRef]
  12. Oliveira, N.C.C. The great acceleration and hydroelectric dam building in Brazil. Varia Hist. 2018, 34, 315–346. [Google Scholar] [CrossRef] [Green Version]
  13. Empresa de Pesquisa Energética (EPE). Balanço Energético Nacional 2017: Ano base 2016; Rio de Janeiro: Empresa de Pesquisa Energética, Brazil, 2017. [Google Scholar]
  14. LAW, on the Protection of Native Forests; Brazilian Law 12651/2012.2012. Available online: https://www.planalto.gov.br/ccivil_03/_ato2011-2014/2012/lei/l12651.htm (accessed on 8 February 2021).
  15. Koerner, K.F.; Oliveira, U.R.; Gonçalves, G. Efeito de estruturas de contenção à erosão costeira sobre a linha de costa: Balneário Hermenegildo, Rio Grande do Sul, Brasil. Integr. Coast. Zone Manag. 2013, 13, 457–471. [Google Scholar] [CrossRef]
  16. Simac, M.R.; Bathurst, R.J.; Fennessey, T.W. Case study of a hybrid gabion basket geosynthetic reinforced soil wall. Proc. Inst. Civ. Eng. Ground Improv. 1997, 1, 9–17. [Google Scholar] [CrossRef]
  17. Prambauer, M.; Wendeler, C.; Weitzenböck, J.; Burgstaller, C. Geotextiles and Geomembranes Biodegradable geotextiles—An overview of existing and potential materials. Geotext. Geomembr. 2019, 47, 48–59. [Google Scholar] [CrossRef]
  18. Vianna, V.F.; Fleury, M.P.; Menezes, G.B.; Coelho, A.T.; Bueno, C.; Lins da Silva, J.; Luz, M.P. Bioengineering Techniques Adopted for Controlling Riverbanks’ Superficial Erosion of the Simplício Hydroelectric Power Plant, Brazil. Sustainability 2020, 12, 7886. [Google Scholar] [CrossRef]
  19. Wiewel, B.V.; Lamoree, M. Geotextile composition, application and ecotoxicology—A review. J. Hazard. Mater 2016, 317, 640–655. [Google Scholar] [CrossRef]
  20. Silva, P.O. Avaliação da Efetividade dos Projetos de Recuperação de Mata Ciliar Contra a Atuação das Ondas nos Processos Erosivos das Margens do Reservatório Volta Grande (MG/SP). Master Thesis, Universidade Federal de Ouro Preto, Ouro Preto, MG, Brazil, 2020. [Google Scholar]
  21. Larrabure, S.P. O fenômeno da segunda residência: O caso do rio Grande entre os estados de São Paulo e Minas Gerais. GEOUSP Espaço Tempo 2009, 26, 93–106. [Google Scholar] [CrossRef]
  22. Agência Nacional de Energia Elétrica—ANEEL. Resolução Normativa Nº 425, de 1º de Fevereiro de 2011. Available online: https://www.aneel.gov.br/documents/656877/14486448/bren2011425.pdf/7202b615-7335-48a2-bd44-ed68d9020e5a?version=1.0 (accessed on 8 February 2021).
  23. Marques, M.; de Andrade, F.O.; Vital, E.P.A.; Guetter, A.K. Método Rápido para a Determinação do Fetch Máximo. XX Simpósio Bras. Recur. Hídricos 2013, 9, 17–22. [Google Scholar]
  24. Alvares, C.A.; Stape, J.L.; Sentelhas, P.C.; Gonçalves, J.D.M.; Sparovek, G. Köppen’s climate classification map for Brazil. Meteorol. Z. 2013, 22, 711–728. [Google Scholar] [CrossRef]
  25. Galvão, T.C.D.B.; Coelho, A.T.; De Menezes, G.B.; De Fonseca, Ê.M.B. Study of Erosion Control Techniques Applied to Hydroelectric Power Plants Reservoir Margins. Athens. J. Sci. 2018, 5, 329–342. [Google Scholar] [CrossRef]
  26. ASTM D 2487-17: Standard Practice for Classification of Soils for Engineering Purposes (Unified Soil Classification System); ASTM International: West Conshohocken, PA, USA, 2017.
  27. Brazilian Association of Technical Standards. NBR 6458: Gravel Grains Retained on the 4,8 mm Mesh Sieve—Determination of the Bulk Specific Gravity, of the Apparent Specific Gravity and of Water Absorption; ABNT: Rio de Janeiro, Brazil, 2016; p. 14. [Google Scholar]
  28. Brazilian Association of Technical Standards. NBR 7181: Soil—Grain Size Analysis; ABNT: Rio de Janeiro, Brazil, 2016; p. 16. [Google Scholar]
  29. Brazilian Association of Technical Standards. NBR 6459: Soil—Liquid Limit Determination; ABNT: Rio de Janeiro, Brazil, 2016; p. 9. [Google Scholar]
  30. Brazilian Association of Technical Standards. NBR7180: Soil—Plasticity Limit Determination; ABNT: Rio de Janeiro, Brazil, 2016; p. 7. [Google Scholar]
  31. Heselden, J. Gabion. U.S. Patent No. 8,206,065, 26 June 2012. [Google Scholar]
  32. Brazilian Association of Technical Standards. ABNT NBR ISO 9863-1: Geossintéticos: Método de Ensaio Para Determinação da Massa Por Unidade de Área de Geotêxteis e Produtos Correlatos; ABNT: Rio de Janeiro, Brazil, 2013. [Google Scholar]
  33. Brazilian Association of Technical Standards. ABNT NBR ISO 9864: Geossintéticos: Determinação da Espessura a Pressões Especificadas Parte 1: Camada Única; ABNT: Rio de Janeiro, Brazil, 2013. [Google Scholar]
  34. ASTM D 5035: Standard Test Method for Breaking Force and Elongation of Textile Fabrics (Strip Method); ASTM International: West Conshohocken, PA, USA, 2011.
  35. LAW, National Dam Safety Policy; Brazilian Law 12334/2010. Available online: http://www.planalto.gov.br/ccivil_03/_ato2007-2010/2010/lei/l12334.htm (accessed on 8 February 2021).
  36. Brasington, J.; Langham, J.; Rumsby, B. Methodological sensitivity of morphometric estimates of coarse fluvial sediment transport. Geomorphology 2003, 53, 299–316. [Google Scholar] [CrossRef]
  37. Li, M.Z.; King, E.L. Multibeam bathymetric investigations of the morphology of sand ridges and associated bedforms and their relation to storm processes, Sable Island Bank, Scotian Shelf. Mar. Geol. 2007, 243, 200–228. [Google Scholar] [CrossRef]
  38. Bures, L.; Sychova, P.; Maca, P.; Roub, R.; Marval, S. River Bathymetry Model Based on Floodplain Topography. Water 2019, 11, 1287. [Google Scholar] [CrossRef] [Green Version]
  39. Latapy, A.; Héquette, A.; Pouvreau, N.; Weber, N.; Robin-Chanteloup, J.B. Mesoscale morphological changes of nearshore sand banks since the early 19th century, and their influence on coastal dynamics, Northern France. J. Mar. Sci. Eng. 2019, 7, 73. [Google Scholar] [CrossRef] [Green Version]
  40. Hu, Y.; Cao, M.; Ma, A.; Dou, X.; Wen, Y. An Analysis of the Periodic Evolution of the Jingjiang Sandbank in the Tidal Reach of the Yangtze River. Water 2020, 12, 1652. [Google Scholar] [CrossRef]
  41. Dias, D.S.; Crespi, M.S.; Ribeiro, C.A.; Kobelnik, M. Evaluation of the thermal decomposition of blends prepared with poly(3-hydroxybutyrate) (PHB) and recyclable ethylene poly-terephthalate (RPET). J. Therm. Anal. Calorim. 2020, 1–11. [Google Scholar] [CrossRef]
  42. Valentin, C.A.; Silva, J.L.; Kobelnik, M.; Ribeiro, C.A. Thermoanalytical and dynamic mechanical analysis of commercial geomembranes used for fluid retention of leaching in sanitary landfills. J. Therm. Anal. Calorim. 2018, 136, 471–481. [Google Scholar] [CrossRef] [Green Version]
  43. Lavoie, F.L.; Kobelnik, M.; Valentin, C.A.; Lins da Silva, J.; Lopes, M.L.C. Study of exhumed HDPE geomembrane applied in an industrial water pond: Physical and thermoanalytical characterisations. Results Mater. 2020, 8, 100131. [Google Scholar] [CrossRef]
  44. Lavoie, F.L.; Valentin, C.A.; Kobelnik, M.; Lins da Silva, J.; Lopes, M.L.C. HDPE Geomembranes for environmental protection: Two case studies. Sustainability 2020, 12, 8682. [Google Scholar] [CrossRef]
Figure 1. Location of the Experimental Units (EU) in the Hydroelectric Power Plants: Porto Colômbia (20°6′55.82′′ S; 48°28′9.07′′ W) and Volta Grande (20°7′38.86′′ S; 48°3′51.21′′ W).
Water 13 00500 g001
Figure 2. Erosion by the impact of waves on the margin of the Porto Colômbia Hydroelectric Power Plant (HPP) reservoir (July 2016).
Water 13 00500 g002
Figure 3. Identification of the sections installed in the HPP experimental units. Porto Colômbia (PC) (left panel) and Volta Grande (VG) (right panel).
Water 13 00500 g003
Figure 4. Schematic configuration profile of erosion control techniques, gabion and gabion mattress or geogrid mattress.
Water 13 00500 g004
Figure 5. Performance of each section.
Water 13 00500 g005
Figure 6. Differential Bathymetry: (a) PC1, (b) PC2, (c) PC3, (d) VG1, (e) VG2, and (f) VG3.
Water 13 00500 g006aWater 13 00500 g006b
Figure 7. TG/DTG curves for: (a) unexposed sample of PC1 section, (b) exposed sample of VG1 section and (c) unexposed sample of VG1 section. The analyses were carried out under synthetic air and nitrogen gas purge, with mass samples around 3.5 mg (all analyses were conducted with a heating rate of 10 °C min−1 with flow of 110 mL min−1 in α-alumina crucible).
Water 13 00500 g007
Figure 8. Differential Scanning Calorimetry (DSC) curves for: (a) unexposed sample of PC1 section and (b) exposed and unexposed samples of VG1 section in nitrogen gas purge, with mass samples around 5 mg. The analyses were conducted with heating rates of 10 °C min−1 with a flow of 50 mL min−1 in the aluminum crucible.
Water 13 00500 g008
Table 1. Geotechnical characteristics of the experimental units.
CharacteristicValueStandard
UE Porto ColômbiaUE Volta Grande
Specific gravity of soil solids (ρs)2.896 g/cm³2.865 g/cm3NBR 6458 [27]
Soil classificationSandy silt (ML)Sandy silt (ML)NBR 7181 [28]
ASTM D 2487-17 [26]
Liquid limit (LL)43%47%NBR 6459 [29]
Plastic limit (PL)34%38%NBR 7180 [30]
Plasticity index (PI)9%9%-
Table 2. Erosion control techniques evaluated and respective installation site.
Erosion Control TechniqueSection Installed
PCVG
Geogrid Mattress PC1VG2
Gabion and Gabion Mattress PC2, PC3VG1, VG3
Table 3. Physical and mechanical characteristics of the exhumed geotextiles.
Properties and Test Method
SampleMass per Unit Area (g/m2)Thickness (mm)Tensile Strength per Unit/Machine Direction (kN/m)
ABNT NBR ISO 9864 [32]ABNT NBR ISO 9863-1 [33]ASTM D5035 [34]
Unexposed PC1572.582.745.41
Unexposed PC2571.793.397.70
Unexposed PC3419.252.464.08
Unexposed VG1191.081.851.64
Exposed VG1147.251.390.90
Unexposed VG2129.751.370.55
Exposed VG2248.921.560.67
Unexposed VG3174.251.621.94
Table 4. Performance matrix of the evaluation.
VariableWeight
V1 (Erosive spots/toe integrity on reservoir bank)0High
1Intermediate
2Low
3Inexistent
V2 (Vegetative cover growth)0Bare (<30%)
1Low vegetative cover (30 to ≤ 50%)
2Average vegetative cover (>50–≤ 70%)
3High vegetative cover (>70–100%)
V3 (Final Structural Integrity)0Serious damage (> 30% of the total)
1Average damage (10–30% of the total)
2Low level of damage (<10% of the total)
3No damage
V4 (Need for maintenance)0High (>than 5 times)
1Average (3 to 5 times)
2Low (1–2 times)
3No need
V5 (Landscape Integration/aesthetics)0No integration with local landscape
1Integration with local landscape after 2 years
2Integration with local landscape after 4 years
3Integration since the startup
V6 (Regrowth Native vegetation top of the section)0Absence of native flora
1Presence of 1–3 native species
2Presence of 3–5 species
3Presence of more than 5 native species
Table 5. Maximum and minimum values of differential bathymetry in each section.
ProfileBathymetric Difference (m)SectionBathymetric Difference (m)
Profile 1 PC1−0.66 to 0.42PC1−0.66 to 0.46
Profile 2 PC1−0.07 to 0.46
Profile 1 PC2−1.12 to −0.02PC2−1.12 to 0.34
Profile 2 PC2−0.67 to 0.34
Profile 1 PC3−0.19 to 0.11PC3−0.19 to 0.15
Profile 2 PC3−0.17 to 0.15
Profile 1 VG1−0.43 to 0.62VG1−0.46 to 0.97
Profile 2 VG1−0.30 to 0.97
Profile 3 VG1−0.46 to 0.84
Profile 1 VG2−0.03 to 0.65VG2−0.13 to 1.15
Profile 2 VG2−0.13 to 1.15
Profile 1 VG30.03 to 0.86VG30.03 to 0.86
Profile 2 VG30.04 to 0.51
Table 6. Temperature intervals (°C) obtained from TG curves in synthetic air and nitrogen and DSC in synthetic air, with a heat flow rate of 10 °C.min−1.
SampleTG (Synthetic Air)TG (Nitrogen)DSC (Melting)DSC (Crystallization)
Unexposed PC1230–269 °C269–454 °C---233–269 °C269–454 °C454–560 °C252 °C209 °C
1.38%60.05%---1.19%52.67%9.08%
Residueresidue
38.57%37.06%
Unexposed PC2233–269 °C269–438 °C438–477 °C233–269 °C269–461 °C461–580 °C252 °C209 °C
0.95%20.94%9.80%0.45%23.60%6.13 °C
Residue Residue
68.31%69.82%
Unexposed PC3223–265 °C265–488 °C---220–260 °C260–456 °C456–590 °C252 °C209 °C
0.85%75.05%---1.07%48.49%11.27%
Residue Residue
24.10%39.17%
Exposed VG1227–270 °C270–511 °C---220–260 °C260–580 °C---252 °C209 °C
1.36%79.88%---0.41%80.16%---
Residue Residue
18.76%19.53%
Exposed VG2195–242 °C242–429 °C429–500 °C205–260 °C---2604–589 °C252 °C207 °C
2.71%49.15%22.36%1.92%---48.08%
Residue Residue
25.78%50.00%
Unexposed VG1225–255 °C255–505 °C---220–260 °C260–574 °C---253 °C211 °C
0.57%99.03---0.40%81.53%---
Residue Residue
0.40%18.07%
Unexposed VG2212–260 °C260–454 °C454–510 °C---315–580 °C---250 °C205 °C
0.80%75.78%5.06%---85.15%---
Residue Residue
18.36%14.85%
Unexposed VG3197–245 °C245–442 °C442–489 °C333–586 °C------253 °C208 °C
2.36%72.92%23.91%87.73%------
Residue Residue
0.81%12.27%
Publisher’s Note: MDPI stays neutral with regard to jurisdictional claims in published maps and institutional affiliations.

