
Can Irrigation Conditions Improve Farmers’ Subjective Well-being? An Investigation in Rural Pakistan


1
Department of Economics, Government College University, Faisalabad 38000, Pakistan
2
School of Economics and Management, Jiangxi Agricultural University, Nanchang 330045, China
3
Beijing Business Management College, Beijing 100028, China
4
Beijing Key Lab of Study on Sci-Tech Strategy for Urban Green Development, School of Economics and Resource Management, Beijing Normal University, Beijing 100875, China
5
Centre for Economic Research, Shandong University, Ji’nan 250000, China
*
Authors to whom correspondence should be addressed.
Water 2021, 13(4), 505; https://doi.org/10.3390/w13040505
Submission received: 23 November 2020
/
Revised: 8 February 2021
/
Accepted: 11 February 2021
/
Published: 16 February 2021
(This article belongs to the Special Issue Water Conservation in Irrigated Agricultural Systems)
Abstract
:In many developing countries, including Pakistan, the enormous water losses due to outdated irrigation infrastructure threaten livelihoods and food security, while investment in the development of efficiency improvements can help the countries to cope with water scarcity and improve farmers’ wellbeing. This study evaluates how rural farmers’ decisions regarding improving irrigation watercourses and other irrigation conditions affect their wellbeing. We employ hypothesis testing and an ordered logit model on field survey data of 300 farming households from rural Pakistan. The mean test results suggest that farmers on lined watercourses are happier than those on unlined and partially lined watercourses. The regression results suggest that farmers on a fully lined watercourse have higher wellbeing than those on a partially lined watercourse. The time taken by canal water and groundwater to reach farmers’ land reduces their wellbeing. Irrigation quotas, the return of stolen water and the distance of groundwater sources from land have positive effects on farmers’ wellbeing. The study establishes a strong correlation between irrigation conditions, improved irrigation network and farmers’ wellbeing.
1. Introduction
Human wellbeing refers to the ability of individuals to live the kinds of lives that they value and enjoy the opportunities to achieve that potential [1]. Improving human wellbeing is the central objective of development. A significant body of literature has studied the correlations between respondents’ stated subjective wellbeing (SWB) and other attributes, such as the amount of air pollution in a respondent’s vicinity [2,3]. Access to drinking water has also been associated with an improved SWB [4,5,6,7,8]. However, a research gap still exists regarding the links between irrigation conditions, farmers’ decision-making regarding irrigation infrastructure improvement and their SWB, which they derive from irrigation water availability.
Due to a limited supply, water resources are facing increasing pressure from competing agents. Accounting for over 70% of the world’s freshwater use, the agricultural sector is the biggest consumer of water [9]. However, only 40% of the delivered water is used productively by the crops. Among the main reasons for the low water use efficiency is the use of an inefficient, outdated and poorly maintained canal command irrigation system with less than 60% conveyance and an overall below 50% water application efficiency at some basin levels [10,11,12]. Water application efficiency is considered as the ratio of beneficial crop evapotranspiration to total water delivered to the field. Conveyance efficiency is calculated as the ratio of irrigation water withdrawal from a river or other water supply node to water actually delivered to the farm gate. Overall irrigation efficiency is thus the product of water application and conveyance efficiency [13]. Therefore, this sector seems to be a critical place for investment that could significantly improve irrigation water use efficiency. In order to mitigate the effects of water shortages, many countries are investing in better irrigation infrastructure to increase both water flow as well as to reduce conveyance losses from existing traditional agricultural irrigation systems since the improvements in irrigation efficiency alone may fulfill about 50% of the increased water demand by 2025 [13,14].
Water is increasingly becoming a priority policy issue for sustainable resource management goals. In line with the current accelerated pace of technological development and the relatively slow pace of social development, the most significant constraint on water management is human behavior. Humans are responsible for altering the quantity and quality of freshwater resources. The best solution for the thorny issue of water management is the development of a particular adaptation and the improvement of adaptive capacity by modernizing water policy and providing adequate training to farmers [15].
Climate change will aggravate Pakistan’s water stress situation because it has a significant agricultural sector, with a share of around 19% of GDP and accounting for ~42% of the labor force ([16], p. 17). The concerned public and private stakeholders should focus more on raising awareness among farmers to get their watercourses lined as soon as possible to ensure an equal distribution of water between up and down-stream farmers. Unfortunately, the irrigation department lacks the necessary incentive to coordinate with farmers and often ignores small farmers, which has widened the inequality among farmers [17,18].
As people in rural areas of most developing nations, including Pakistan, depend on agriculture for their livelihoods, any improvement in water availability, delivery and conservation would have multiple implications for water sustainability and the wellbeing of the people [13,19]. Pakistan’s existing water irrigation system, the Indus Basin Irrigation System, supplies water to irrigated agriculture through a vast network of rivers, canals, distributaries, minors and watercourses. The irrigation system’s hierarchy in terms of size (in descending order) is rivers, the main canal, the branch canal, the distributary, the minor and the watercourse. To ensure more efficient use of canal water, the improvement of the existing infrastructure at the farm level was given priority in Pakistan through the Government’s Revised Action Program (RAP) for irrigated agriculture introduced in 1979. The key focus was to save surface water by reducing water conveyance losses at the field level by improving water management practices such as watercourse improvement [20,21].
Many studies have focused on benefiting from the potential benefits of water resource management and irrigation efficiency improvement [13,19,22,23,24,25]. The need for long-term solutions to water management issues through more investments in the irrigation system to enhance the adaptation at regional and household levels is well known [26]. According to Sullivan et al. [27], a significant proportion of water used by humans goes to the agricultural sector, thus having profound implications, directly or indirectly, for rural households’ wellbeing depending on farm activities [28].
However, most of these studies were conducted at the basin level under various scenarios, thus leaving a research gap regarding how this works at a small scale. The difference in reaping benefits from lined, unlined and partially lined watercourses lends ample support to the concept of evaluating the impacts of the erratic behaviors of farmers on their utility derived from water use. The seasonal variation in water supply and demand reinforced by climate change extends our research problem further and provides a sound base for comparing water users’ wellbeing derived from different watercourse types and other irrigation conditions. Wellbeing, happiness, life satisfaction and derived utility are interchangeably used in the article.
A study by Nadeem et al. [8] applied the ordinary least square (OLS) and ordered probit techniques to data from 300 farming households to assess the impact of overall water access (drinking and irrigation) and socio-economic conditions on self-reported subjective wellbeing. The findings show that the quality of drinking water, access to irrigation water and the percentage of the crop water requirement fulfilled by canal water have positive effects on wellbeing, while drinking water from groundwater has an adverse effect. The study still leaves a research gap regarding the detailed analysis of irrigation-related conditions that may affect farmers’ wellbeing.
The research gaps can be generalized in the following ways. The improvement of irrigation infrastructure is a collective decision-making process, and it may create three types of irrigation watercourses at the tertiary canal command irrigation system (i.e., fully lined, fully unlined and partially lined). The resulting heterogeneous nature of irrigation infrastructure may affect irrigation access and wellbeing differently for farmers located at different watercourse types. Moreover, an upstream/downstream land location may affect irrigation water access on different types of watercourses, and other irrigation-related factors such as water theft, the distance between the source of water and the place of use may affect farmer’s wellbeing differently. Keeping this research gap in mind, the current study performs a detailed analysis of how irrigation conditions affect farmers’ wellbeing.
The overall aim of this study is to understand how the investment of financial capital in the watercourse lining affects farmers’ wellbeing across different irrigation channels and other irrigation-related factors. For that, we use mean and ordered logit model tests based on survey data. This study’s novelty is that we establish a link between irrigation conditions in general, farmers’ investment choices in irrigation infrastructure and their wellbeing.
2. Literature Review and a Short Description of the Watercourse System
According to Black and Hall [29], the water-poor category comprises all farmers whose livelihood is threatened by water shortage, who are constrained by lack of access to water and who are unable to improve their agricultural productivity. Thus, reducing water-related poverty and agricultural water management by modifying infrastructure can improve access to water resources.
In the existing literature, the lack of access to drinking water is accepted as an indicator of poverty affecting human wellbeing, but this association is more complicated than only access to drinking water [30]. Agricultural water management is vital for livelihood generation in this sector through its ability to improve wellbeing and reduce water poverty by ensuring its availability and usage [31]. The adoption of innovative agriculture technologies requires investments in water management [32]. A tradeoff for myopic farmers who might forego spending money on improving their watercourses to direct their monetary resources into other areas may provide higher utility in the short run at the expense of better irrigation systems for agriculture and possibly lowering agricultural yields [33].
Sustainable water management (SWM) is crucial to mitigating the negative impacts of climate change on agriculture. SWM focuses on a balanced interaction between water availability and its usage through investments into the capacity extension of water access. It can ensure the existing water system’s efficient and equitable operation [34].
Several studies have investigated the relationship between human wellbeing and water services. For example, Gimelli et al. [7] analyzed the relationship between water services and multiple dimensions of human wellbeing using Max-Neef’s Fundamental Human Needs (FHN) [35] framework in the water sector in selected informal settlements in India. The authors argued that water services should be linked to people’s aspirations and basic physical needs. They also maintained that cultivating wellbeing has intrinsic and instrumental benefits that enable individuals to become more resilient and that water services should be better linked with other development sectors. Moreover, non-traditional water service arrangements should be re-evaluated according to their capacity to contribute to people’s wellbeing.
In terms of water infrastructure, James et al. [36] found that a proper water supply infrastructure has multidimensional impacts on human life. It saves time, improves income generation activities and women’s empowerment, especially in rural areas. According to Bookwalter and Dalenberg [4], water infrastructure in South Africa significantly affects subjective wellbeing. Due to the poor existing infrastructure, poor access to the networks causes inadequate water supply access. An expansion in water and sanitation infrastructure by the government will improve the community’s subjective wellbeing at large.
Del Saz-Salazar et al. [37] used the life satisfaction approach to estimate the monetary value of water supply infrastructure improvements in Spain. Their results show that efficient investment in public water supply infrastructure generates a meaningful monetary value of non-market benefits, significantly affecting life satisfaction. Water valuation can be used for the efficient and sustainable utilization of irrigation water to enhance agricultural productivity. Chipfupa and Wale [38] used the willingness to pay (WTP) methodology and suggested that water pricing reflects irrigation intensity and significantly contributes to enhancing agricultural productivity. The focus of irrigation infrastructure should be on integrating multiple water prices to enhance WTP for sustainable water use in the irrigation system. Another study by Nadeem et al. [8] found that access to irrigation water, crop-water requirements being fulfilled and water expenses on the purchase of groundwater, in addition to the canal water available to farmers, significantly affect farmers’ wellbeing in rural areas of Pakistan.
The water distribution system adopted in Pakistan divides the available canal water among the farmers based on their landholding without considering conveyance losses along the watercourse. This system results in an inequitable distribution and inefficiency in the water supply to the upstream and downstream farmers, thus adversely affecting agricultural production, farm income and farmers’ wellbeing in one of several ways [32,39,40,41]. The irrigation system in the Punjab province has three types of watercourses in terms of its structure, i.e., lined, unlined and partially lined. A lined watercourse has bricked walls and a bed, in contrast to an unlined watercourse (with walls and beds made of mud), while the partially-lined watercourse is only partially lined with bricks (see Appendix A for a more detailed description of the irrigation system). A lower water conveyance efficiency is attributed to poorly managed century-old watercourses [42,43].
Water users who operate lands at the head, middle and tail of lined and unlined watercourses face inequality in water supply, affecting the cropping pattern, production and farm income [44]. The watercourse lining improves the conveyance efficiency and flow rate by reducing the seepage and leakage losses and improves its management due to the reduced time needed to maintain it. A lined watercourse has a higher water flow, where only 12 to 14 min are required to bring water to the tail users in a one-kilometer long watercourse, in contrast to an unlined watercourse, where this might need up to three hours [18].
Water losses due to unlined watercourses have been widely studied to establish the conveyance losses in unlined watercourses, which range between 35% to 57% and increase with the increase in watercourse length, mainly due to seepage, leakage and seasonal variation [45,46,47,48]. Physical obstructions such as a leaky water entrance cut (an authorized cut by the irrigation department on the watercourse to allow water to enter a farmer’s field) at farms and silt deposition due to lack of regular and proper cleaning of unlined watercourses deteriorate the physical condition of watercourses. They have resulted in the submergence of canal water outlets with a reduced designed discharge from these outlets. Water distribution efficiency varies between 93–46% for the first and last farmers on an unlined watercourse, as opposed to 100–61% along the partially lined watercourse. This establishes a linearly decreasing distribution efficiency pattern from upstream to downstream farmers [49]. The upstream farmers have almost double the water efficiency than downstream farmers along these watercourses (farmers with land close to the head or towards the tail of a watercourse, respectively). The conservative estimate is that about 30% of water losses can be saved by adaptation measures such as regular cleaning and vegetation removal, repair and maintenance and earthen improvements in this type of infrastructure, although the benefits are of limited duration [45,46,49,50,51,52,53].
The lined watercourse is a rectangular-shaped water channel with double bricked masonry walls and beds plastered inside and on top of the walls. The watercourse lining prevents conveyance losses from seepage, leakage and can even eliminate the entire watercourse losses. The cleaning and maintenance of these watercourses are more manageable and less time consuming [52,53]. A partially lined watercourse has some portion that is lined, and the rest is unlined. The water delivery efficiency at the tail is one-third of the efficiency at the head along a partially lined watercourse, which is higher than the efficiency in an unlined watercourse [49].
We can conclude from the above-cited literature that, although some adaptation measures can maximize the utility from water for a shorter period, the lining is the best strategy to achieve more extended benefits. Although Nadeem et al. [8] evaluated the effects of irrigation water access on wellbeing, a research gap still exists regarding how broader irrigation conditions and water access through three types of irrigation watercourse differently affect wellbeing.
3. Material and Methods
3.1. Econometric Procedure
3.1.1. Hypothesis Construction and Testing
We hypothesize that “on average, the farmers with lined and partially lined watercourse are happier than those with an unlined watercourse.” The hypotheses are described as follows:
Null Hypothesis 1:
Null Hypothesis 2:
Null Hypothesis 3:
where µ1, µ2, and µ3 are the means of farmers’ self-reported wellbeing with lined, unlined and partially lined watercourses, respectively.
We tested the hypothesis using the test of means approach to compare the mean value of wellbeing among three heterogenous farmer groups. The standardized sample average, also known as the t-statistics or t-ratio, is central to statistical hypothesis testing [54]. The t-test is a typical test used to compare the means of two groups. This technique was developed by William Sealy Gosset in 1908 [55] and is known as the Student’s t-test. We apply an independent t-test (correlation coefficient should be zero) since our groups are independent of each other to compare the mean value of wellbeing. Applying more tests is necessary if there is no difference in the two sample means to verify whether the difference is equal to zero [56]. This test has the statistical power to be applied even if sample and population distributions do not follow a normal distribution [57].
3.1.2. Multiple Regression Analysis
We further expand our hypothesis as “the difference in canal water time (the fetching time) in unlined, lined and partially lined watercourse results in wellbeing heterogeneity among the rural farmers” since the strain on water-associated wellbeing highly depends on the watercourse length, water delivery and conveyance efficiency along the watercourse, the farmer’s land location and the distance between the water resource and the farm [28,49]. We used multiple regression analysis to test this hypothesis and the effects of other irrigation-related factors.
We developed the following regression model to estimate the association between our dependent variable (wellbeing) and explanatory and control variables:
where .
The coefficients of each variable are represented by , and the error term is captured by . The above model is estimated for three groups of farmers using two dummies; i.e., is the dummy variable for farmers with a fully lined watercourse and the dummy variable represents farmers with a fully unlined watercourse. The base group is farmers with a partially lined watercourse. is the time (in minutes) taken by irrigation water to reach farmers’ fields from the canal; is the interaction term between the time taken by irrigation water to reach farmers’ fields from the canal and the dummy variable for farmers with fully lined watercourse; is the interaction term between the time taken by irrigation water to reach farmers’ fields from the canal and the dummy variable for farmers with a fully unlined watercourse. is a farmer’s share in the total cost of the watercourse lining; refer to the knowledge and adoption of water-saving technologies by farmers; is the dummy showing if a farmer’s field is located upstream (within 1000 m of the canal); is the interaction term between the dummy showing if the farmer’s field is located upstream and the dummy variable for farmers with a fully lined watercourse; is the interaction term between the dummy showing if a farmer’s field is located upstream and the dummy variable for farmers with a fully unlined watercourse; is the total cultivated land by the farmer; is the total time allocated to each farmer for canal water (minutes per week); indicates how often a water user’s associate decides that the canal water stolen by other farmers is returned to the rightful owner; shows the distance between a farmer’s land and the place where the tube well is installed for extracting groundwater (km); is the number of minutes taken by groundwater to reach a farmer’s land from the source of extraction; shows the total price of canal water that a farmer pays in a year; indicates the perception of the farmer about the relevance of crop yields losses due to water-related issues in their area; is the total amount of water that is consumed (drinking only) by household livestock (in liters); is the age of the head of the household; is the education level (years of schooling) of the head of the household; refers to whether the farmer has an additional source of income in addition to agriculture; is a farmer’s relative income compared to other members of their community; is a variable describing if the family has a patient with chronic disease (including chronic cough, eye disease, kidney stone, diabetes, tuberculosis, hepatitis, heart problem, cancer and physical abnormality). These family diseases were assigned appropriate weights based on the years lost due to disability (YLD) measure of the World Health Organization [58]. refers to a farmer’s level of trust in community members; indicates if a farmer wants to move to another locality for safety reasons; and is experience in agriculture (years).
The model was estimated using two methods: OLS and the ordered logit (ologit). Our main variables of interest were irrigation-related factors and their interaction terms.
3.2. Survey Design for Data Collection and Variables Description
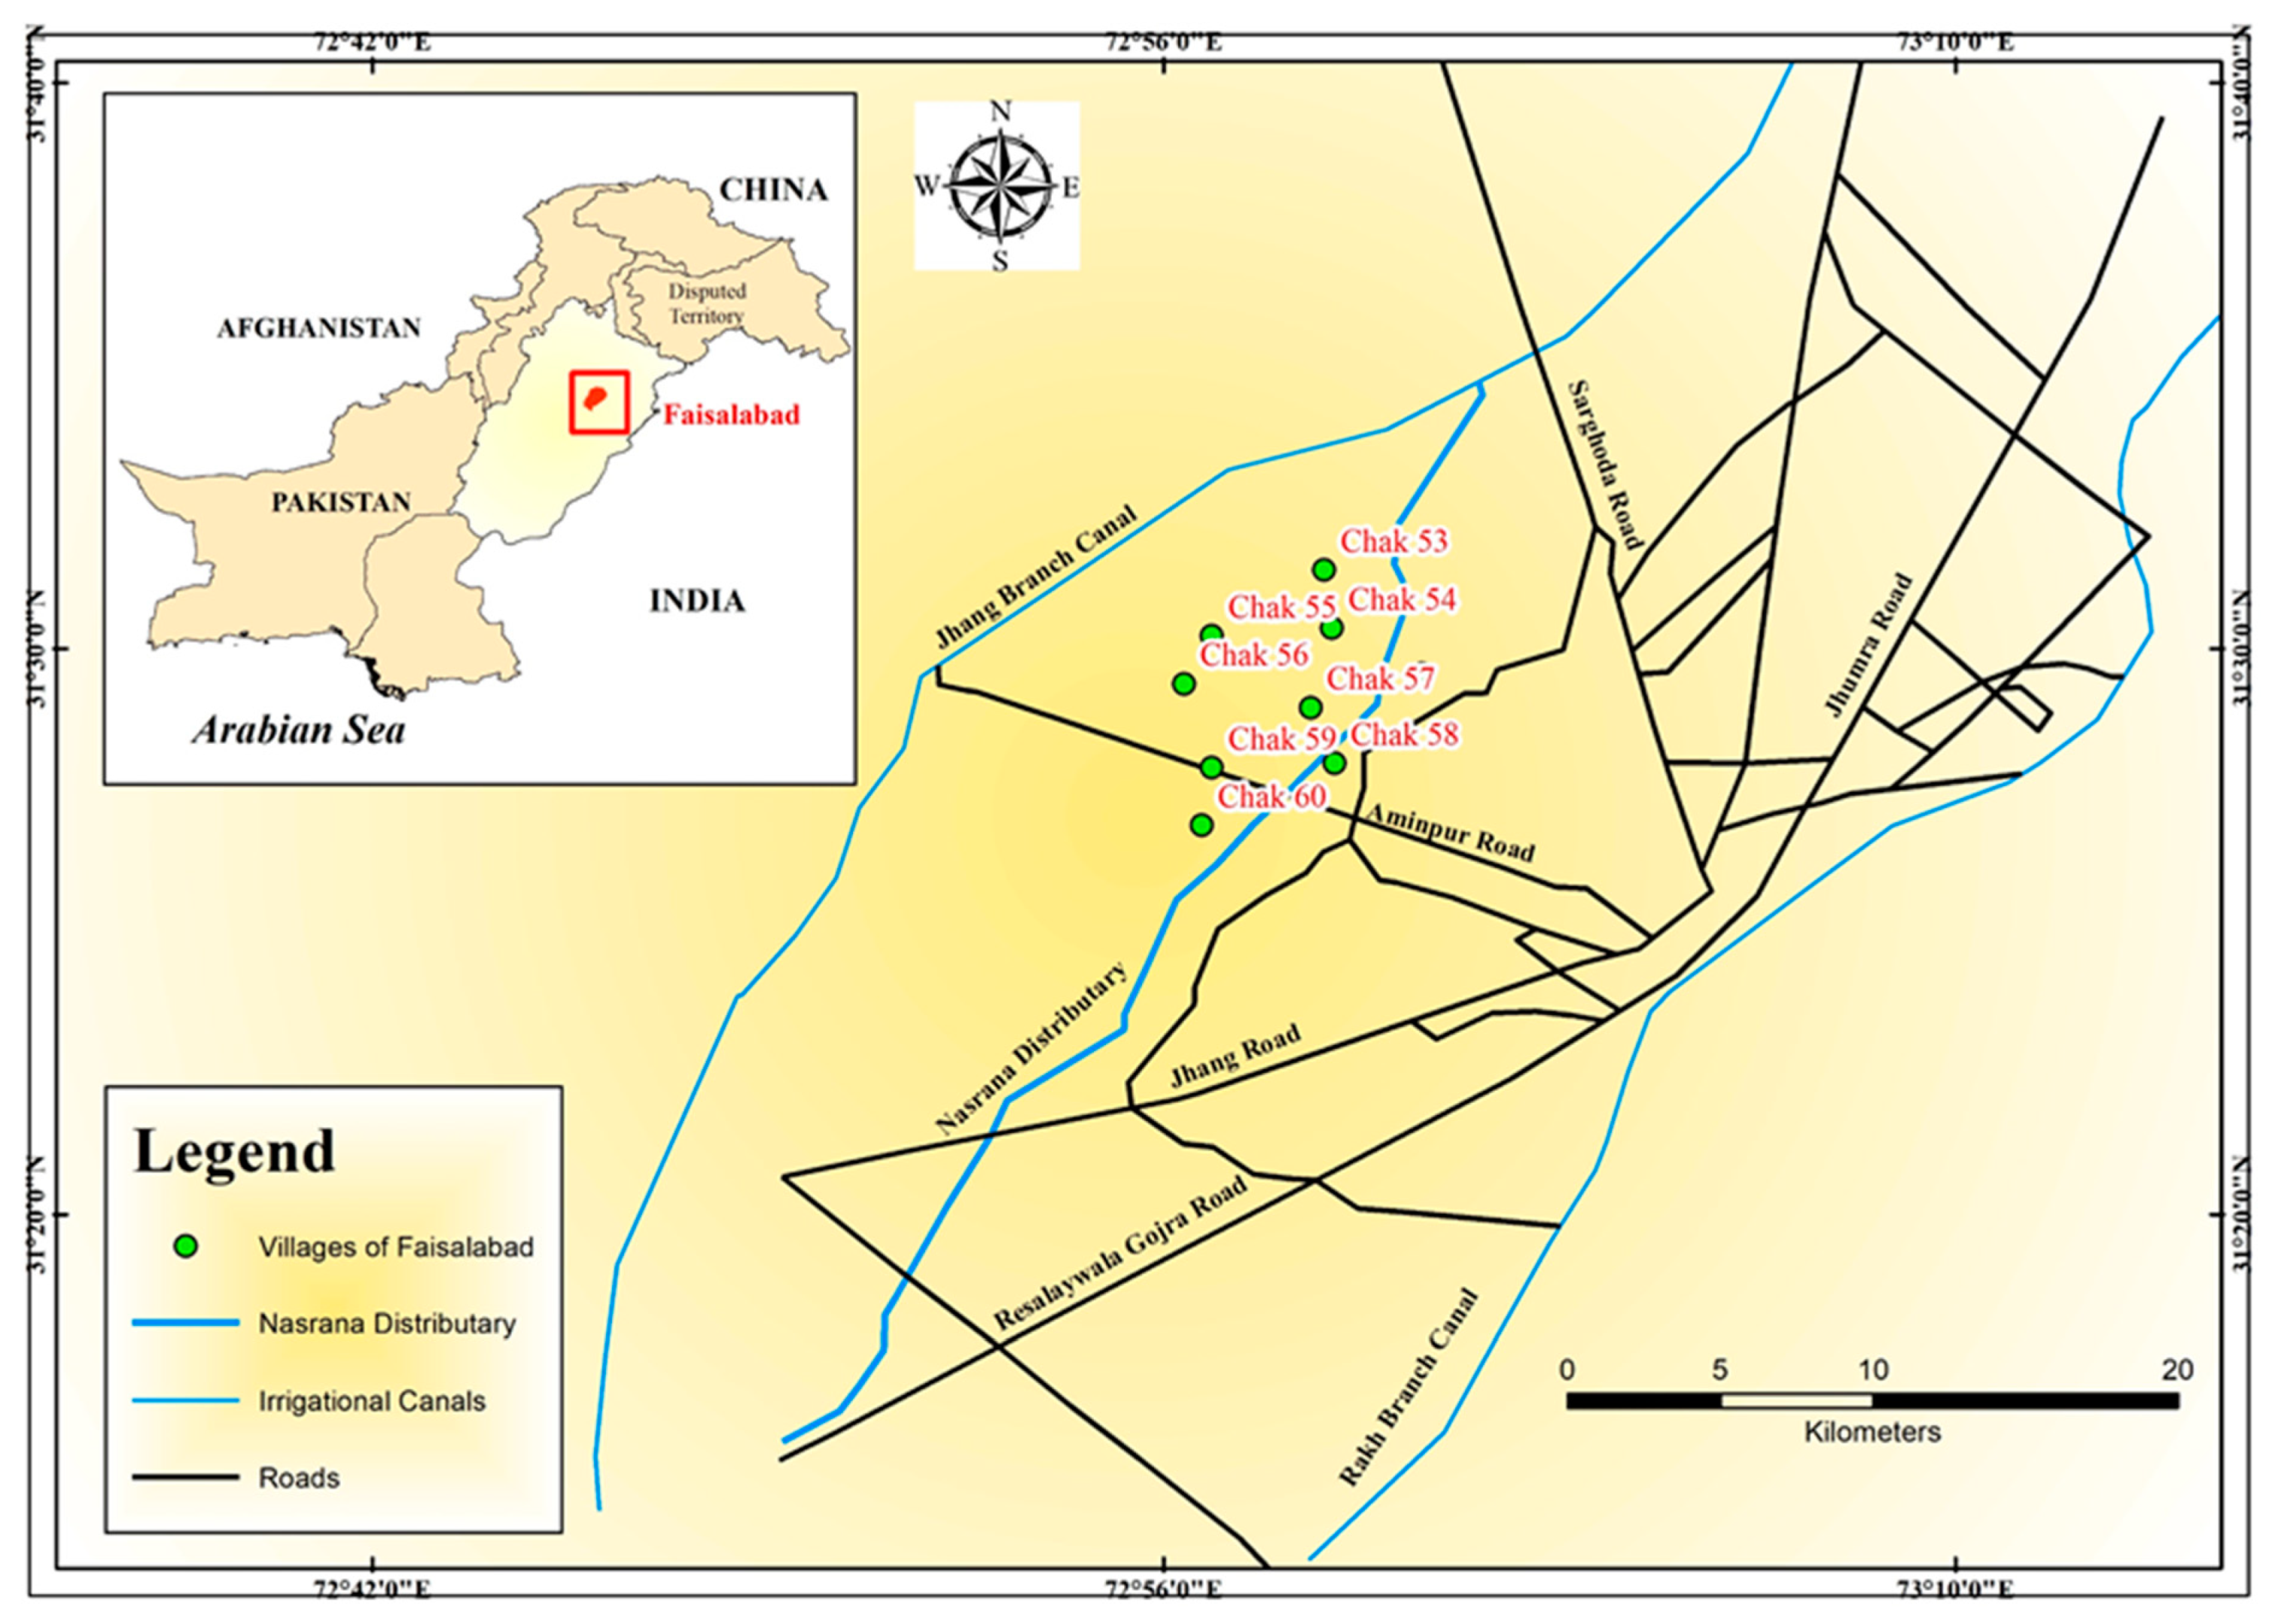
This study used data collected in 2016 via a field survey from 10 selected villages of Faisalabad, Pakistan (Figure A1 in Appendix A shows the area’s map). The dataset was also used by Nadeem et al. [8]. The data were collected via a structured questionnaire, initially developed in English, then translated into the local language of Urdu to overcome any information bias from the farmers. The primary source of livelihood for this area is agriculture, which heavily depends on irrigation water from the canal. We selected villages located at different locations from canal water resources: the Nasrana Distributary, originating from the Jhang Branch Canal of the Faisalabad irrigation zone. For data collection, 300 households were randomly selected from these villages based on a water user list provided by the Irrigation Department, Government of Punjab, Pakistan.
Respondents were asked to rank their wellbeing level on a scale of one to seven, with 1 being very unhappy, 2 mostly unhappy, 3 somewhat unhappy, 4 neither happy nor unhappy, 5 somewhat happy, 6 mostly happy and 7 very happy. Based on the literature, we used several irrigation-related variables that could affect farmers’ wellbeing, including watercourse type as one of the main explanatory variables. Other important socio-economic and demographic determinants of wellbeing were used as control variables to avoid any bias in measuring the relationship between the irrigation conditions and farmers’ wellbeing.
4. Results and Discussion
4.1. Descriptive Statistics
Table 1 shows the descriptive statistics of the variables of interest. The mean value of 5.46 for wellbeing, measured on a scale of 1–7, shows that the farmers were mostly happy on average. Out of the total 300 farmers, 18% were located on fully lined, 22% on fully unlined and 59% on partially lined watercourses. The average water fetching time was between 11 and 30 min (3.7 average value). For the three heterogeneous groups—i.e., unlined, lined and partially lined watercourses—these values were 4.09, 3.39, and 3.69, respectively. The average share of farmers in the watercourse lining was 28,223 Pakistan Rupees. On average, farmers did not know about but wanted to adopt water-saving technologies (with an average score of 4). We found that 55% of the farms were located downstream (>1000 m from the canal outlet). The survey area mostly included small farmers with an average cultivated land area of ~6.7 acres.
The average farmer had about two hours and 18 minutes of canal water time allotment per week, i.e., ~21 min per acre. The survey data showed that the water user association sometimes decided (with an average value of 2.93, which was sometimes close to 3) that the stolen canal water should be returned to the rightful owner. The average value for the farmer’s annual price of canal water was 1498 Pakistan Rupees. For the groundwater, most extraction points were located within 1 km of a farmer’s land, showing that the farmers usually buy groundwater from other farmers when needed. The average time for groundwater to reach a farmer’s land was shorter (2.85) than the time taken by canal water (3.7), suggesting that either the groundwater extraction point was located closer to land than the canal outlet or the private water channel used for groundwater irrigation was better than the government watercourse. On average, farmers thought that water-related issues had some relevance to their crop yield reduction. The livestock raised by these households consumed about 273 L of water for drinking.
Among other socio-economic variables, the farmers’ (respondents) average age was ~54 years, showing that the sampled farmers were middle-aged or above middle-age. The farmers’ average years of education were just under five years, indicating that they only had primary education. With a mean value of 16% for the variable of the employment of the household head, most (84%) of the respondents depended on agriculture as their source of income. On average, the respondents’ relative income level was almost the same as other community members (with an average score of 2.84). Although most of the respondents’ families had no chronic disease, some had multiple diseases in their families, with an average disease burden of ~26 years lost due to disability (YLD) by cause. On average, the farmers had moderate trust in their community members (with a mean of 4.45). Farmers, on average, did not want to move away from their current areas. The mean experience in agriculture (water management) of farmers was 29 years.
4.2. Results of the T-Test
Table 2 shows the hypothesis testing results, where the first model compares the mean value of happiness among farmers with lined vs. unlined watercourses. The second model compares the mean value of happiness among respondents with lined vs. partially lined watercourses. In contrast, the third model compares the happiness of farmers with partially lined vs. unlined watercourse. From the results of the two models, we can conclude that, on average, the respondents with lined water channels (5.73) were happier than those with a partially lined (5.40) watercourse, and we can accept our second null hypotheses at a 5% significance level [54].
The third model showed that the farmer group with a partially lined watercourse on average was less happy than farmers with the unlined watercourse, so we reject our third null hypothesis at a 10% level. This peculiar observation can be explained as follows: a majority (60 of 300) of the respondents from the partially lined watercourse group were downstream farmers. Since the water conveyance losses, water delivery and efficiency were attributed to the watercourse’s length, the farmer’s land location and the distance between the water source and the farmer’s field, the water losses had already taken place before the water reached these farmers’ fields. Despite their decision to invest in their part of the watercourse being lined, these distributional losses may reduce their happiness level compared to farmers with an unlined watercourse. However, most farmers on unlined watercourses (72%) were downstream but were still happier because they either did not spend any money or did not know the benefits of watercourse lining. For the first model, the farmers with a lined watercourse had a higher average happiness level (5.73) than the farmer group on the unlined watercourse (5.65); however, the t-test results were insignificant at the 10% level. Most of the results of the t-test were according to our expectation; however, they were not the most suitable model choices for these relationships as there were no control variables. We, therefore, resort to regression analysis in the following section.
The above analysis does not show us why this difference exists among the three groups of farmers. How can the watercourse lining create a heterogeneity of wellbeing among water users, and what other irrigation-related factors can affect farmers’ wellbeing? To confirm our accepted hypothesis as true and avoid any statistical errors such as type I and type II errors [60], we performed further analysis to confirm this relationship, and the results are reported in Table 3.
4.3. Results for Regression Analysis
4.3.1. OLS Regression Results
The base group for our analysis comprised farmers whose land was located on the partially lined watercourse. Our results for the OLS regression showed that, although the farmers who realized the value of having their watercourse lined and made the collective decision to invest in watercourse lining felt happier than the farmers who could only have a partial agreement on getting their watercourse lined; i.e., the partially lined group. The results, however, were not statistically significant (β 0.555, Table 3). The negative and statistically significant coefficient (−0.119 *) for the time taken by irrigation water to reach the farmer’s field from the canal showed that a longer time for water to reach their fields made the farmers unhappy. Compared to the base group (partially lined watercourse), the farmers on a fully unlined watercourse felt happier (β 0.236 **) when the time taken by irrigation water to reach the farmer’s field from the canal increased. This is another way of saying that the same increase in water fetching time made farmers on a partially lined watercourse less happy than the farmers on a fully unlined watercourse. One possible explanation for this is that some of the farmers on the partially lined watercourse invested in the watercourse lining, making them unhappier due to delays in fetching time than the farmers who decided not to invest in the watercourse lining.
The positive and significant coefficient (0.0005 *) with the time allocated for canal irrigation to each farmer showed that farmers were happier as more irrigation water became available. Farmers also felt happier (β 0.203 ***) when the water user association decides that the water stolen from their time should be returned. A longer distance between the farmer’s land and the groundwater extraction point made the farmer happier (β 0.149 **) because groundwater was brackish in the area and unsuitable for irrigation. The longer distance usually meant that the extraction point was located closer to the canal, where groundwater quality was much better than the on-farm extraction point. The relative income (β 0.279 ***) and societal trust (β 0.147 ***) had positive effects on farmers’ well-being.
4.3.2. Ordered Logit Regression Results
As the dependent variable was categorical, we performed an ordered logit analysis as we considered this to be a more suitable choice for our data. Once again, our base group comprised the farmers whose land was located on a partially lined watercourse. The results indicated that farmers with a fully lined watercourse were happier than the farmers with a partially lined watercourse (Table 3). In contrast, the farmers whose farms were located on a fully unlined watercourse did not have statistically different happiness levels than those located on a partially lined watercourse. Specifically, the coefficient of 1.827 *** for the fully-line watercourse binary variable was highly significant and showed that the odds of a farmer’s happiness level with a fully lined watercourse being at a higher level were 1.827 times larger than those with a partially lined watercourse. The time taken by irrigation water to reach farmers’ fields from the canal had a highly significant coefficient (−0.195 ***) and affected a farmer’s happiness, meaning that a longer time was associated with lower levels of happiness. Practically, this outcome was usually observed: a longer time for irrigation water to reach a farmer’s field would produce more significant losses in the conveyance and makes the user relatively unhappy.
The farmer’s share in the watercourse lining cost had a negative but statistically insignificant effect on their wellbeing. Our data indicated that the average lining cost was 8% of a farmer’s average annual income; however, there were substantial long-term benefits of the watercourse lining—e.g., a reduction in conveyance losses (39%), saving in irrigation time (28%), expansion in the irrigated area (21%), enhancement in farm incomes (15%) and the overall economic rate of return (ERR) of 28% (over 25 years) ([61], p. 9)—and these benefits are significantly great compared to the cost to the farmers’ of a one-time payment for 25 years of the watercourse’s working life. Therefore, our results show that the cost was not a significant factor for the farmers.
The interaction term between the time taken by irrigation water to reach a farmer’s field from the canal and farmers with a fully unlined watercourse had a positive (β 0.327 **) and a statistically significant effect on farmers’ happiness. The explanation was the same as shown in the OLS model above: a similar delay in water fetching time made the farmers on a partially lined watercourse unhappier because they invested in the partial lining of a watercourse. This outcome’s practical implication is that farmers with a positive attitude toward irrigation management practices expect fewer conveyance losses and delays than farmers who could not invest in watercourse lining.
With few exceptions, most of the other logit model results were similar to those we saw in the OLS model. A longer irrigation quota made the farmers happy (β 0.001 ***), although this effect was stronger than the one in the OLS model, both in terms of magnitude and statistical significance. Farmers felt happier when someone was penalized for stealing irrigation canal water (β 0.344 ***). A longer distance between the groundwater source and the farmer’s land made them happier (β 0.19 ***) as the groundwater source moved closer to the canal and water quality improved. A higher irrigation water cost made the farmers unhappy (β −0.0001 **). The farmers who thought that water-related issues did not reduce their crop yields were less happy (β −0.192 **) than the farmers who did think this. One plausible explanation for this outcome is that although most farmers face low yields, the farmers who can pinpoint these yield reductions to water-related issues feel happier than those who cannot find any specific reasons. The former group is happy because they can rectify their yield losses through different measures, whereas the latter do not know how to overcome these problems.
Among the control variables, a higher relative income made a farmer happier than their peers (β 0.455 ***). This outcome shows that farmers try to compare their incomes to other community members when reporting their subjective wellbeing. A higher disease burden made farmers unhappier (β −0.002 ***). The higher societal trust made the farmer happier (β 0.238 ***). Finally, the farmers were happier (β 0.102 **) when they thought that they did not need to migrate to other areas due to safety reasons.
We found some specific reasons for farmers’ behavior regarding keeping the watercourses unlined through the qualitative interviews and group discussions during our field survey. Firstly, either all the farmers on a specific watercourse faced financial difficulties. They were not able/willing to spend any portion of their savings on improving traditional watercourses or were not well aware of the benefits either in the form of the prevention of water theft by upstream farmers or the reduction of water conveyance losses and increased water use efficiency. Secondly, although some farmers on the same watercourse were willing and able to spend their money (or contribute in the form of labor), they still had access to an unlined watercourse due to the decisions made by other farmers who were neither willing nor able to spend their income. Thirdly, the upstream farmers willfully did have their watercourse lined to steal water from downstream farmers’ canal water allocation, which is easier from unlined watercourses. Fourthly, even if all the farmers were willing, a lack of social networking or political strength in getting the work done from government departments kept them from having the watercourse lined.
The farmers also described the following possible reasons for having a partially lined watercourse: some farmers on the watercourse were willing and able to spend their money, whereas the rest were not willing or able to have the watercourse lined completely; for example, a farmer could have a piece of land on the tail of the watercourse but could not afford to pay 20% of the total cost of the entire watercourse lining at one time (or contribute in the form of labor), and so they pay a share of some portion of the watercourse lining while the rest of it remains unlined. The following reasons were commonly found among the farmers for the complete lining of the watercourse: the farmers had enough financial resources and were willing to spend their savings on the improvement of traditional water channels, and they were well aware of the benefits and had a better social network and political access to the relevant government offices to get the work done on a priority basis.
5. Conclusions and Policy Recommendations
Irrigated agriculture in Pakistan is confronted with high conveyance losses due to the outdated and poorly managed irrigation infrastructure. The issue is more acute at the tertiary canal command system (watercourse-level) than the main canals, branch canals, or distributaries. In this study, we applied the mean test and regression analysis to determine whether general irrigation conditions and farmers’ decisions to invest in irrigation infrastructure improvement affected their happiness. We contribute to the literature in terms of our approach’s novelty, as no other study has attempted to delineate the effects of irrigation-related factors and farmers’ decisions to improve irrigation infrastructure on their happiness.
We found that watercourse lining improves farmers’ self-reported “happiness” level from our mean testing analysis. As a result of investments in improving irrigation networks, these farmers were happier than others as the lining of irrigation channels improved water flow, reduced leakage and seepage losses and illegal water theft by upstream water users and increased water delivery at the tail end. Water fetching time had more negative effects (heterogeneously) on farmers’ happiness if they were located on a partially lined watercourse than when located on a fully unlined watercourse. In general, it was found that a farmer likes to penalize other farmers for stealing irrigation canal water. In the absence of an improved watercourse, this is perhaps the best solution for farmers to reduce their water conveyance losses. Farmers reported a higher SWB when they had more canal water time and when they had access to groundwater sourced farther away from their land (which is usually closer to the canal and has better quality). Higher prices for irrigation canal water made the farmers less happy. Due to a relatively low share in the watercourse lining cost, farmers’ wellbeing was not affected by their share in the cost.
Our results have some important policy implications. First, the differential watercourse infrastructure creates inequality in water access, which affects the wellbeing of farmers. Policymakers should try to convey to farmers that investing in irrigation infrastructure improves water efficiency and enhances their life satisfaction. For the farmers, if they realize the potential improvement of their happiness, they might be willing to contribute more to irrigation infrastructure improvement.
The irrigation department and water user associations should make more efforts to convince myopic farmers who have not invested in a partially lined watercourse to do so for farmers who have invested in this watercourse not to be let down by the poor outcome of their investment decisions. Otherwise, such farmers will be discouraged from spending their money on lining the watercourse and may undermine other farmers’ positive mindset who are willing to invest. As most farmers want higher water quotas and use groundwater for irrigation, the extension department should demonstrate the benefits of on-farm water use efficiency to ensure higher yields per drop of water even though the total irrigation water volume would not be increased. The water user associations should further strengthen their vigilance against water theft and increase theft penalties so that the upstream farmers are barred from stealing water and consequently will show more willingness to invest in irrigation improvement projects.
The government should provide credit facilities to the farmers who cannot afford to invest in watercourse lining. Future studies can expand the data set to cover more expansive areas so that more heterogeneous groups of farmers can be included in the data.
This study also has some shortcomings, which should be overcome in future studies in the field. Future studies should include larger samples and would also benefit from advanced analysis methods. Additional variables can also be added to the survey design, and a cost-benefit analysis should also be added in future work. A more comprehensive dataset should be used in future studies to explain the farmers’ overall wellbeing more thoroughly.
Author Contributions
Conceptualization, A.M.N. and S.H.; methodology, T.A., A.M.N., Q.C.; software, T.A. and Q.C.; validation, A.M.N., W.W. and T.A.; formal analysis, T.A. and A.M.N.; investigation, A.M.N. and S.H.; resources, S.H., Q.C., T.A., A.M.N.; writing—original draft preparation, A.M.N. and T.A.; writing—review and editing, T.A., A.M.N., W.W.; supervision, S.H.; funding acquisition, Q.C. and W.W. All authors have read and agreed to the published version of the manuscript.
Funding
This research was funded by the National Natural Science Foundation of China (Grant No. 71934003 and 71903014).
Institutional Review Board Statement
Not applicable.
Informed Consent Statement
Not applicable.
Data Availability Statement
The data presented in this study are available on request from the corresponding author.
Conflicts of Interest
The authors declare no conflict of interest.
Appendix A. Description of the Tertiary-Canal Irrigation System of Punjab
The tertiary canal command irrigation system in the Punjab Province of Pakistan comprises 58,500 watercourses, providing an irrigation supply to 77.4% of Pakistan’s total irrigated area. During the last few decades, the improvement of community watercourses at the farm level has been increasingly prioritized in Pakistan. In the recent past, the Government of Pakistan has initiated a major project called “Optimizing Watercourse Conveyance Efficiency through Enhancing lining length” for the Punjab Province from 2015 to 2020 [62]. Under this watercourse lining project, the Government of Pakistan financed up to 80% of the total costs and required farming communities to provide the remaining 20%, either in cash or in the form of labor contributions. The Water User Associations (WUA), comprising all the farmers who own land on a specific watercourse, ensure that every landholder contributes their share according to their landholding ([61], p. 37).
The Water Management Wing of the Provincial Agriculture Department is responsible for implementing the on-farm water management projects, whereas the Punjab Irrigation and Drainage Authority (PIDA) through the Water User Associations (WUA) control the watercourse network for water distribution. WUAs engage in the improvement, rehabilitation, operation and maintenance of watercourses, water allocation, distribution scheduling and ensure the proper implementation and the participation of farmers in the system’s overall functioning. The watercourse lining depends on the farmers’ willingness through their active involvement in forming water user associations at the village level and contributing to the cost as per the agreed terms and conditions. The formation and registration of a water user association are the foremost steps leading to a watercourse lining. In short, the WUA is a critical institution for implementing any watercourse improvement project, and its proper functioning depends highly on the farmers’ behaviors. Different farmers behave differently depending on their socio-economic conditions and political environment, and as a result of this, three types of watercourse exist simultaneously in Pakistan, i.e., fully lined, partially lined and fully unlined.
Figure A1.
Map of the study area.

References
- UNEP (United Nations Environment Programme). GEO (Global Environment Outlook-4); Environment for Development: Nairobi, Kenya, 2007. [Google Scholar]
- Adler, M.D. Happiness Surveys and Public Policy: What’s the Use? Duke Law J. 2013, 62, 1509–1601. Available online: https://scholarship.law.duke.edu/dlj/vol62/iss8/2 (accessed on 12 November 2019).
- Graham, C. Subjective Well-Being in Economics. In The Oxford Handbook of Well-Being and Public Policy; Adler, M.D., Fleurbaey, M., Eds.; Oxford University Press: New York, NY, USA; pp. 424–450. [CrossRef]
- Bookwalter, J.T.; Dalenberg, D. Subjective Well-Being and Household Factors in South Africa. Soc. Indic. Res. 2004, 65, 333–353. [Google Scholar] [CrossRef]
- Guardiola, J.; García-Rubio, M.A.; Guidi-Gutiérrez, E. Water Access and Subjective Well-Being: The Case of Sucre, Bolivia. Appl. Res. Qual. Life 2013, 9, 367–385. [Google Scholar] [CrossRef]
- Guardiola, J.; González-Gómez, F.; Grajales, Á.L. The Influence of Water Access in Subjective Well-Being: Some Evidence in Yucatan, Mexico. Soc. Indic. Res. 2011, 110, 207–218. [Google Scholar] [CrossRef]
- Gimelli, F.M.; Rogers, B.C.; Bos, J.J. Linking water services and human wellbeing through the fundamental human needs’ framework: The case of India. Water Altern. 2019, 12, 715–733. [Google Scholar]
- Nadeem, A.M.; Rafique, M.Z.; Bakhsh, K.; Makhdum, M.S.A.; Huang, S. Impact of socio-economic and water access conditions on life satisfaction of rural farmers in Faisalabad district of Pakistan. Water Policy 2020, 22, 686–701. [Google Scholar] [CrossRef]
- Barker, R.; Molle, F. Evolution of irrigation in South and Southeast Asia; Comprehensive Assessment Research Report 5; International Water Management Institute (IWMI): Colombo, Sri Lanka, 2005; p. 1. [Google Scholar]
- Micklin, P. The Aral Sea Disaster. Annu. Rev. Earth Planet. Sci. 2007, 35, 47–72. [Google Scholar] [CrossRef] [Green Version]
- Bekchanov, M.; Lamers, J.P.; Martius, C. Pros and Cons of Adopting Water-Wise Approaches in the Lower Reaches of the Amu Darya: A Socio-Economic View. Water 2010, 2, 200–216. [Google Scholar] [CrossRef]
- Bekchanov, M.; Bhaduri, A.; Lenzen, M.; Lamers, J.P.A. Integrating Input-Output Modeling with Multi-criteria Analysis to Assess Options for Sustainable Economic Transformation: The Case of Uzbekistan. In The Global Water System in the Anthropocene; Springer International Publishing: Cham, Switzerland, 2014; pp. 229–245. [Google Scholar]
- Bekchanov, M.; Ringler, C.; Bhaduri, A.; Jeuland, M. Optimizing irrigation efficiency improvements in the Aral Sea Basin. Water Resour. Econ. 2016, 13, 30–45. [Google Scholar] [CrossRef]
- Seckler, D.; Amarasinghe, U.; Molden, D.; De Silva, R.; Barker, R. World Water Demand and Supply, 1990 to 2025: Scenarios and Issues. Water Manag. 1998, 19. [Google Scholar] [CrossRef]
- Iglesias, A.; Garrote, L. Adaptation strategies for agricultural water management under climate change in Europe. Agric. Water Manag. 2015, 155, 113–124. [Google Scholar] [CrossRef] [Green Version]
- GOP (Government of Pakistan). Pakistan Economic Survey, 2019–2020. 2020. Available online: http://www.finance.gov.pk/survey_1920.html (accessed on 18 August 2020).
- Khan, F. Water, governance, and corruption in Pakistan. Run. Empty 2009, 2003, 2025. [Google Scholar]
- Khan, T.H. Water scarcity and its impact on agriculture—A Case study of Layyah, Pakistan. Master–s Thesis, Department of Rural and Urban Development, Swedish University of Agriculture Sciences, Uppsala, Sweden, 2014. [Google Scholar]
- Bhaduri, A.; Manna, U. Impacts of water supply uncertainty and storage on efficient irrigation technology adoption. Nat. Resour. Model. 2014, 27, 1–24. [Google Scholar] [CrossRef] [Green Version]
- Ahmed, N. Water Resources of Pakistan, 1st ed.; Miraj Uddin Press: Lahore, Pakistan, 1993; p. 15. [Google Scholar]
- Ashfaq, M.; Griffith, G.; Hussain, I. Economics of Water Resources in Pakistan: Water and Poverty, 1st ed.; Pak. TM Printers: Lahore, Pakistan, 2009; pp. 1–13. [Google Scholar]
- Rosegrant, M.; Ringler, C.; McKinney, D.; Cai, X.; Keller, A.; Donoso, G. Integrated economic-hydrologic water modeling at the basin scale: The Maipo river basin. Agric. Econ. 2000, 24, 33–46. [Google Scholar] [CrossRef]
- Cai, X.; McKinney, D.C.; Lasdon, L.S. Integrated Hydrologic-Agronomic-Economic Model for River Basin Management. J. Water Resour. Plan. Manag. 2003, 129, 4–17. [Google Scholar] [CrossRef] [Green Version]
- Cai, X.; Rosegrant, M. Irrigation technology choices under hydrologic uncertainty: A case study from Maipo River Basin, Chile. Water Resour. Res. 2004, 40. [Google Scholar] [CrossRef] [Green Version]
- Ward, F.A.; Pulido-Velazquez, M. Water conservation in irrigation can increase water use. Proc. Natl. Acad. Sci. USA 2008, 105, 18215–18220. [Google Scholar] [CrossRef] [Green Version]
- Cosgrove, W.J.; Loucks, D.P. Water management: Current and future challenges and research directions. Water Resour. Res. 2015, 51, 4823–4839. [Google Scholar] [CrossRef] [Green Version]
- Sullivan, C.; Meigh, J.; Lawrence, P. Application of the Water Poverty Index at Different Scales: A Cautionary Tale: In memory of Jeremy Meigh, who gave his life’s work to the improvement of people’s lives. Water Int. 2006, 31, 412–426. [Google Scholar]
- Forouzani, M.; Karami, E. Agricultural water poverty index and sustainability. Agron. Sustain. Dev. 2010, 31, 415–431. [Google Scholar] [CrossRef] [Green Version]
- Black, M.; Hall, A. Pro-Poor Water Governance. Thematic paper produced by the Global Water Partnership for the Water and Poverty Initiative; Asian Development Bank: Mandaluyong, Philippines, 2003; pp. 11–20. [Google Scholar]
- Cook, S.E.; Gichuki, F.; Turral, H.; Fisher, M.J. Analyzing Water Poverty: Water, Agriculture and Poverty in Basins, Basin Focal Project Working Paper, No. 3. 2006; 1–18. [Google Scholar]
- Castillo, G.; Namara, R.; Hussein, M.H.; Ravnborg, H.; Smith, L. Reversing the flow: Agricultural water management pathways for poverty reduction. In Comprehensive Assessment for Water in Agriculture; IWMI Report No. H040197; International Water Management Institute (IWMI): Colombo, Sri Lanka, 2006; pp. 149–199. [Google Scholar]
- Cosgrove, E.C.; Cosgrove, W.J. Foresight as a Tool in Water Resource Development. Development 2013, 56, 484–490. [Google Scholar] [CrossRef]
- Saeed, T.U.; Khan, T.A. Impact of Water Losses and Maintenance of Canal Irrigation System on Agriculture (Case Study: Urmar Minor of Warsak Gravity Canal Pakistan). Am. J. Exp. Agric. 2014, 4, 550–562. [Google Scholar] [CrossRef]
- Nyamwanza, A.M.; Kujinga, K.K. Climate change, sustainable water management and institutional adaptation in rural sub-Saharan Africa. Environ. Dev. Sustain. 2016, 19, 693–706. [Google Scholar] [CrossRef]
- Max-Neef, M. Development and human needs. In Real-life Economics: Understanding Wealth Creation; Ekins, P., Max-Neef, M., Eds.; Routledge: London, UK; New York, NY, USA, 1992. [Google Scholar]
- James, A.; Verhagen, J.; Van Wijk, C.; Nanavaty, R.; Parikh, M.; Bhatt, M. Transforming time into money using water: A participatory study of economics and gender in rural India. Nat. Resour. Forum 2002, 26, 205–217. [Google Scholar] [CrossRef]
- Salazar, S.D.S.; González-Gómez, F.; Guardiola, J. Valuing water supply infrastructure improvements using life satisfaction data as a complement to contingent valuation. Water Environ. J. 2020, 34, 401–413. [Google Scholar] [CrossRef]
- Chipfupa, U.; Wale, E. Smallholder willingness to pay and preferences in the way irrigation water should be managed: A choice experiment application in KwaZulu-Natal, South Africa. Water S.A. 2019, 45, 383–392. [Google Scholar] [CrossRef] [Green Version]
- Malhotra, S.P. The Warabandi System and its Infrastructure; Central Board of Irrigation and Power: New Delhi, India, 1982. [Google Scholar]
- Gorantiwar, S.D.; Smout, I.K. Performance assessment of irrigation water management of heterogeneous irrigation schemes: 1. A framework for evaluation. Irrig. Drain. Syst. 2005, 19, 1–36. [Google Scholar] [CrossRef] [Green Version]
- Ahmad, M.; Turral, H.; Nazeer, A. Diagnosing irrigation performance and water productivity through satellite remote sensing and secondary data in a large irrigation system of Pakistan. Agric. Water Manag. 2009, 96, 551–564. [Google Scholar] [CrossRef]
- Clyma, W.; Ali, A.; Ashraf, M. Irrigation Efficiency in Pakistan; Water and Power Development Authority publication no. 36; Directorate of Mona Reclamation Experimental Project: Bhalwal, Pakistan, 1975; p. 33. [Google Scholar]
- Early, S.; James, K.; Andrew, S. Watercourse Command Surveys in Punjab and Sindh Pakistan; Technical Report. 45; International Irrigation Management Institute (IWMI): Lahore, Pakistan, 1977. [Google Scholar]
- Asghar, S. Farming System Analysis of Irrigated Farms in Faisalabad, Pakistan. Master–s Thesis, Asian Institute of Technology, Pathum Thani, Thailand, 2014. [Google Scholar]
- Trout, T.J.; Bowers, S.A. Operational Irrigation Evaluation of Pakistan Watercourse Conveyance Systems; Water Management Research Project, Engineering Research Center, Colorado State University: Fort Collins, CO, USA, 1979. [Google Scholar]
- Qurban, A.; Arshad, A. Estimation of Delivery Losses of Sample Watercourses on Shahkot Distributary. Report No. PAKARS-52/FH-Pa-76. Pakistan Agriculture Research Council: Islamabad, Pakistan, 1982; 103–106. [Google Scholar]
- Hashmi, Z. Irrigation Conveyance losses on three Minor Irrigation Schemes in Baluchistan. Master–s Thesis, Department of Water Management, NWFP Agricultural University, Peshawar, Pakistan, 1995. [Google Scholar]
- Alam, F. Irrigation Conveyance Losses of Watercourses at Five Low Water duty Tertiary Units in the Kabul River Canal Command Area. Master–s Thesis, NWFP Agriculture University, Peshawar, Pakistan, 1996. [Google Scholar]
- Latif, M.; Sarwar, S. Proposal for equitable water allocation for rotational irrigation in Pakistan. Irrig. Drain. Syst. 1994, 8, 35–48. [Google Scholar] [CrossRef]
- Ashraf, C.; Munir, M. Potential in Watercourse Improvement; Bulletin of Irrigation; Drainage and Flood Control Research Council (IDFCR): Lahore, Pakistan, 1981; Volume II, Nos. 1 and 2; pp. 5–10. [Google Scholar]
- Ali, A.; Shakoor, A. Watercourse Design Manual, Water Management Research Project (WMRP), Publication. No.4 (Unpublished); University of Agriculture: Faisalabad, Pakistan, 1989. [Google Scholar]
- Ali, A.; Chaudhary, M.R. Water conveyance and distribution at watercourse level. In Tertiary Sub-System Management; Khalid, R., Robina, W., Eds.; International Irrigation Management Institute (IWMI): Lahore, Pakistan, 1996; pp. 12–23. [Google Scholar]
- Terpstra, A. Tenancy and Irrigation Water Management in South-Eastern Punjab, Pakistan; IWMI: Lahore, Pakistan, 1998. [Google Scholar]
- Stock, J.H.; Watson, M.W. Experiments and Quasi-Experiments. In Introduction to Econometrics, 2nd ed.; Pearson: Boston, MA, USA, 2007. [Google Scholar]
- Gosset, W.G. The Probable Error of a Mean. Biometrika, 1908; 6, 1–25. [Google Scholar] [CrossRef]
- Kim, T.K. T-test as a parametric statistic. Korean J. Anesthesiol. 2015, 68, 540–546. [Google Scholar] [CrossRef] [Green Version]
- Lumley, T.; Diehr, P.; Emerson, S.; Chen, L. The Importance of the Normality Assumption in Large Public Health Data Sets. Annu. Rev. Public Health 2002, 23, 151–169. [Google Scholar] [CrossRef]
- WHO. Global Health Estimates 2016: Disease burden by Cause, Age, Sex, by Country and by Region, 2000–2016. World Health Organization, Geneva. Available online: http://www.who.int/healthinfo/global_burden_disease/en/ (accessed on 22 May 2020).
- FAOSTAT. FAO’s Corporate Database. 2020. Available online: http://www.fao.org/faostat/en/#data (accessed on 23 May 2020).
- Dekking, M.; Kraaikamp, C.; Lopuhaä, H.P.; Meester, L.E. A Modern Introduction to Probability and Statistics: Understanding Why and How, 1st ed.; Springer Texts in Statistics 1431-875X; Springer-Verlag: London, UK, 2005; p. 337. [Google Scholar] [CrossRef]
- Government of Punjab. Optimizing Watercourse Conveyance Efficiency through Enhancing Lining Length, PC-I Form (Revised 2005), Production Sectors, (Agriculture Production); Directorate General Agriculture, (Water Management): Lahore, Pakistan, 2015. [Google Scholar]
- Ashraf, C.M. Watercourse Improvement. Technical Brief.1; Water Management Wing, Agriculture Department, Government of Punjab: Pakistan, 2015. Available online: http://www.ofwm.agripunjab.gov.pk/system/files/briefing2jan15 (accessed on 8 November 2019).

Table 1.
Description of the variables and summary statistics.
| Variables | Variables Description | Mean | SD | Min | Max |
|---|---|---|---|---|---|
| Wellbeing | Happiness level | 5.52 | 1.33 | 1 | 7 |
| Fully lined watercourse | 1 if farm is located on fully lined watercourse, 0 otherwise | 0.18 | 0.39 | 0 | 1 |
| Fully unlined watercourse | 1 if the farm is located on fully unlined watercourse, 0 otherwise | 0.22 | 0.42 | 0 | 1 |
| Partially lined watercourse | 1 if the farm is located on a partially lined watercourse, 0 otherwise | 0.59 | 0.49 | 0 | 1 |
| Time taken by irrigation water to reach a farmer’s field from the canal outlet | Water fetching time from source to the farmer’s field (minutes) where 1 = Less than 1 min 2 = 2–10 min 3 = 11–20 min 4 = 21–30 min 5 = above 30 min | 3.70 | 1.54 | 1 | 5 |
| Farmer’s share in total cost of watercourse lining | Pakistan Rupees * | 28,223 | 37,088 | 1714 | 422,100 |
| Knowledge and adoption of water-saving technologies | 1 = Know and is using technologies, 2 = Know but not using, 3 = Know and want to adopt, 4 = Do not know but want to adopt, 5 = Neither know nor want to adopt, 6 = Know but do not want to adopt | 4.06 | 1 | 1 | 6 |
| Upstream | 1 if farm is located within 1000 m of canal outlet, 0 otherwise | 0.45 | 0.5 | 0 | 1 |
| Total cultivated land by farmer | No. of acres of land cultivated by a farmer during the last year | 12.95 | 16.45 | 1 | 180 |
| Total quota of canal water per week | Minutes | 138.7 | 182.9 | 0 | 2350 |
| How often the water user association decides if stolen water is given back to the owner | 1 = not at all, 2 = a little, 3 = sometimes, 4 = most of the time, 5 = all the time | 2.93 | 1.41 | 1 | 5 |
| Distance of ground water source from canal | 1 = in-house, 2 = 0–1 km, 3 = 1–2 km, 4 = 2–3 km, 5 = more than 3 km | 1.93 | 1.13 | 1 | 5 |
| Time taken by ground water to reach land | 1 = no time, 2 = 1–10 minutes, 3 = 11–20 minutes, 4 = 21–30 minutes, 5 = more than 30-Minutes | 2.85 | 1.75 | 1 | 5 |
| Total price of canal water paid per year | Pakistan Rupees | 1498 | 2889 | 100 | 41,200 |
| Ranking/ level of crop yield reduction due to water related issues | 1 = most relevant, 2 = relevant, 3 = somewhat Relevant, 4 = irrelevant, 5 = most irrelevant | 2.88 | 1.57 | 1 | 5 |
| Household’s water used by animals for drinking per day | Liter | 272.6 | 326.0 | 0 | 2000 |
| Age of household head | No. of years | 53.67 | 12.35 | 25 | 87 |
| Education of household head | No. of years of education completed | 4.82 | 4.61 | 0 | 16 |
| Employment of the household head | 1 if farmer has an additional source of income in addition to agriculture, 0 otherwise | 0.16 | 0.37 | 0 | 1 |
| Relative income (income level compared to community members) | 1 = very low, 2 = low, 3 = same, 4 = better, 5 = much better | 2.84 | 0.86 | 1 | 5 |
| Family chronic disease | Disease burden on family in terms of years lost due to disability (YLD) by cause | 25.76 | 100.38 | 0 | 1117.8 |
| Societal trust (level of trust in community members) | 1 = not at all, 2 = little, 3 = somewhat, 4 = indifferent, 5 = trusted, 6 = highly trusted, 7 = fully trusted | 4.45 | 1.85 | 1 | 7 |
| Migration to other locality for safety reasons | 1 = strongly want to go to other areas, 2 = happy to go to other areas, 3 = neutral, 4 = happy to remain in this area, 5 = strongly want to remain in this area | 3.93 | 1.12 | 1 | 5 |
| Water management experience | No. of years having experience in agriculture | 29.18 | 16.62 | 1 | 75 |
* The average exchange rate during 2015–2019 was 1 US$ = 116.4 Pakistan Rupee [59].
Table 2.
Mean test results for comparing the happiness level among the three groups of farmers. SE: standard error; CI: confidence interval.
Table 2.
Mean test results for comparing the happiness level among the three groups of farmers. SE: standard error; CI: confidence interval.
| Models | Mean | SE | N | 95 % CI for Mean | Mean | SE | N | 95 % CI for Mean | Test Statistic | p-Value |
|---|---|---|---|---|---|---|---|---|---|---|
| Lined | Unlined | |||||||||
| Lined vs. unlined | 5.73 | 0.15 | 67 | 5.43–6.04 | 5.65 | 0.20 | 55 | 5.26–6.05 | 0.31 | 0.38 |
| Lined | Partially lined | |||||||||
| Lined vs. partially lined | 5.73 | 0.15 | 67 | 5.43–6.04 | 5.40 | 0.10 | 178 | 5.20–5.59 | 1.82 ** | 0.03 |
| Partially lined | Unlined | |||||||||
| Partially lined vs. unlined | 5.40 | 0.10 | 178 | 5.20–5.59 | 5.65 | 0.20 | 55 | 5.26–6.05 | −1.25 * | 0.10 |
Note: *** Significant at 1%, ** Significant at 5%, * Significant at 10%.
Table 3.
Multiple regression results. OLS: ordinary least square.
| Dependent Variable (Happiness Level) | ||
|---|---|---|
| Variables | (OLS) | (Ordered Logit) α |
| Dummy for farmers with a fully lined watercourse | 0.555 (0.94) | 1.827 *** (2.79) |
| Dummy for farmers with a fully non-lined watercourse | −0.332 (−0.75) | −0.146 (−0.24) |
| Time taken by irrigation water to reach farmers’ fields from the canal | −0.119 * (−1.84) | −0.195 *** (−3.53) |
| Time taken by irrigation water to reach farmers’ fields from canal × farmers with a fully lined watercourse | −0.117 (−0.72) | −0.343 (−1.54) |
| Time taken by irrigation water to reach farmers’ fields from canal × farmers with a fully unlined watercourse | 0.236 ** (2.08) | 0.327 ** (2.58) |
| Farmer’s share in total cost of watercourse lining | −0.000003 (−0.84) | −0.000005 (−1.15) |
| Knowledge and adoption of water-saving technologies | −0.033 (−0.47) | −0.066 (−0.53) |
| Dummy if farmer’s field is located upstream | −0.145 (−0.81) | −0.254 (−0.86) |
| Dummy if farmer’s field is located upstream × dummy for farmers with a fully lined watercourse | 0.066 (0.72) | 0.065 (0.55) |
| Dummy if farmer’s field is located upstream × dummy for farmers with a fully unlined watercourse | −0.117 (−1.44) | −0.238 * (−1.78) |
| Total cultivated land by farmer | 0.003 (0.39) | 0.007 (0.65) |
| Total quota of canal water per week | 0.0005 * (1.85) | 0.001 *** (2.61) |
| How often the water user association decides if stolen water is given back to the owner | 0.203 *** (3.83) | 0.344 *** (5.95) |
| Distance of groundwater source from land | 0.149 ** (2.32) | 0.19 *** (3.48) |
| Time taken by groundwater to reach land | −0.069 (−1.38) | −0.095 (−1.5) |
| Total price of canal water paid per year | −0.00003 * (−1.66) | −0.0001 ** (−2.15) |
| Ranking/level of crop yield reduction due to water-related issues | −0.078 (−1.56) | −0.192 ** (−2.18) |
| Household water used by animals for drinking per day | 0.0004 ** (2.03) | 0.001 ** (2.4) |
| Age of head of the household | 0.01 (1.5) | 0.011 (1.42) |
| Education of head of the household | −0.017 (−1.16) | −0.024 (−1.05) |
| Employment status of head of the household | 0.025 (0.12) | 0.146 (0.55) |
| Relative income | 0.279 *** (3.04) | 0.455 *** (2.9) |
| Family chronic disease | −0.001 * (−1.83) | −0.002 *** (−3.32) |
| Societal trust | 0.147 *** (3.66) | 0.238 *** (6.9) |
| Migration to other locality for safety reasons | 0.086 (1.15) | 0.102 ** (1.95) |
| Water management experience | −0.008 (−1.39) | −0.01 (−1.03) |
| Constant | 3.508 *** (4.66) | − |
| Number of observations | 300 | 300 |
| R2 | 0.2606 | 0.104 |
| Adj. R2 | 0.1901 | - |
Note: *** Significant at 1%, ** Significant at 5%, * Significant at 10%. t-values in parenthesis. Robust Std. Err. are used for both models. α Std. Err. are adjusted for 10 clusters in village for the ologit model.
Publisher’s Note: MDPI stays neutral with regard to jurisdictional claims in published maps and institutional affiliations. |
© 2021 by the authors. Licensee MDPI, Basel, Switzerland. This article is an open access article distributed under the terms and conditions of the Creative Commons Attribution (CC BY) license (http://creativecommons.org/licenses/by/4.0/).
Share and Cite
MDPI and ACS Style
Nadeem, A.M.; Ali, T.; Wei, W.; Cui, Q.; Huang, S. Can Irrigation Conditions Improve Farmers’ Subjective Well-being? An Investigation in Rural Pakistan. Water 2021, 13, 505. https://doi.org/10.3390/w13040505
AMA Style
Nadeem AM, Ali T, Wei W, Cui Q, Huang S. Can Irrigation Conditions Improve Farmers’ Subjective Well-being? An Investigation in Rural Pakistan. Water. 2021; 13(4):505. https://doi.org/10.3390/w13040505
Chicago/Turabian StyleNadeem, Abdul Majeed, Tariq Ali, Wei Wei, Qi Cui, and Shaoan Huang. 2021. "Can Irrigation Conditions Improve Farmers’ Subjective Well-being? An Investigation in Rural Pakistan" Water 13, no. 4: 505. https://doi.org/10.3390/w13040505
Note that from the first issue of 2016, this journal uses article numbers instead of page numbers. See further details here.