
The First Insight into the Patterns of Size and Shape Variation of a Microcerberid Isopod


1
Department of Life Science, Hanyang University, Wangsimni-ro 222, Sungdong-gu, Seoul 04763, Korea
2
Institute for Marine and Antarctic Studies, University of Tasmania, Hobart, Tasmania 7001, Australia
*
Authors to whom correspondence should be addressed.
Water 2021, 13(4), 515; https://doi.org/10.3390/w13040515
Submission received: 10 January 2021
/
Revised: 4 February 2021
/
Accepted: 12 February 2021
/
Published: 17 February 2021
(This article belongs to the Special Issue Species Richness and Diversity of Aquatic Ecosystems)
Abstract
:Cryptic species are a biological phenomenon only recently recognized due to progress in molecular studies. They pose a significant challenge to conventional taxonomic work since these species manifest low morphological differences, but considerable genetic disparity. New taxonomic methods are in development but have yet to be tested for many animal groups. Isopods belonging to the suborder Microcerberidea are one such group. The Asian microcerberid isopod, Coxicerberus fukudai (Ito, 1974), is a major component of marine interstitial fauna with suspected cryptic species inhabiting Japan and Korea. We chose six Korean populations with high molecular interpopulations divergence and applied 2D landmark-based geometric morphometrics to cephalic sensilla, pleonal points, and male pleopod II. This quantitative approach allowed us to study interpopulation size and shape variations, morphospace structure, and whether the morphological pattern mirrored the genetic species. We determined that a high degree of interpopulation size variation significantly influences shape changes. Once we removed the allometric effect, the size-corrected male pleopod II shape variations yielded a new species, C. jangsaensis sp. nov. At the same time, we were able to resolve the C. fukadai species complex.
1. Introduction
The body shape of a species often reflects the accumulation of historical contingencies naturally selected by the environment [1]. Certain environmental conditions can impose morphological stability resulting in population lineages, living in allopatry, with no apparent morphological differences [2]. This phenomenon, called “cryptic species”, refers to a group of closely related genetic species morphologically indistinguishable and erroneously classified as a single nominal species [3,4]. This unexpected genetic diversity has greatly altered not only global species diversity estimates, but conventional taxonomy as well [5,6]. An integrative approach combining morphology and molecular data might resolve these taxonomic problems [7,8,9,10,11,12,13]. This is because applying multiple lines of evidence is more likely to better define species boundaries [8]. Quantitative analysis is a complementary approach for providing objective data along with traditional taxonomic work. Landmark-based geometric morphometrics (LBGM) and an outline contour, for instance, can analyze complex biological structures using landmark sets, which are located on every specimen [11]. This technique analyzes shape data defined by a superimposed landmark configuration with size, rotation, and translation effects removed [14]. Shape variations are presented as statistical components describing landmark shifts. These can be visualized using a wire frame [15]. Landmark-based geometric morphometrics can detect subtle variations, providing insight into the asymmetry [16,17,18,19], intrapopulation shape variations [20,21,22], as well as ontogenetic variation [23,24].
Applying LBGM techniques with respect to cryptic species is an emerging taxonomic field, especially in microcrustaceans. Several morphological structures have been used for this purpose: carapace outline in ostracods [25,26], cuticular pores in copepods [27,28], epimera in amphipods [29], and body surface in cladocerans [30]. Only a few terrestrial oniscidean species have been studied in the order Isopoda, and those were to discern morphological and genetic diversity. Results showed that allopatric populations of the common sea slater, Ligia Fabricius, 1798, display a high level of genetic divergence but no morphological differences between coastal populations [31,32]. Subsequent geometric morphometrics studies detected significant morphological variation between geographical lineages in lateral tergite tips of each body segment [33,34].
Members of the isopod suborder Microcerberidea are small animals (less than 1 mm) inhabiting marine and freshwater interstitial habitats [35]. Since Karaman (1933) [36] described the first microcerberid species, nearly 30 species have been recognized so far [37]. The group is morphologically homogenous, lacking pigmentation and having an elongated body, adapted to interstitial water environmental conditions [38]. Despite recent phylogenetic and ecological studies [39,40], there are many biological aspects that remain largely unknown. For example, intraspecific morphological variation studies are almost absent even though some microcerberid species are widely distributed geographically [41,42,43,44]. Most taxonomic studies use a small number of individuals, which makes variability detection difficult. Kim et al. (2018) [40] studied variability within the East Asian species, Coxicerberus fukudai (Ito, 1974), originally described from northern Hokkaido’s sand beach and later found in Korea. Molecular analyses revealed two divergent Korean lineages, one distributed in the northern part of South Korea, and forming a monophyletic clade with C. fukadai, and the other, separate lineage, to the southern part. Kim et al. (2018) [40] observed morphological abnormalities in antenna among southern population individuals, but detected no consistent morphological disparity between the two lineages. A high genetic divergence (mtCOI: 10.5%; Cytb: 9.5%) and absence of consistent morphological differences indicates the presence of cryptic species. Male genitalia morphology in microcerberid isopods is a major diagnostic characteristic [38,44], so the lack of a difference between genetically distinct populations is unusual and may indicate a new impediment to traditional microcerberid taxonomy.
In this study, we used LBGM to evaluate morphological variability between two genetically divergent Korean populations. We chose three structures: cuticular sensilla on the dorsal surface of the cephalothorax, the pleon’s anatomical points along each pleonite, and the male’s pleopod II. Sensilla [45,46] refer to minute cuticular sensory receptor organs covering a vast area of the crustacean body [47]. Due to their variability in size, shape, number, and position, many studies have investigated their taxonomic importance in various crustacean taxa [48,49,50,51,52,53,54]. The pleon’s anatomical points along each pleonite and pleotelson boundary are used to estimate segment length ratio changes, which is considered important in the taxonomy of isopods [33,34]. The male pleopod II endopodite displays a particularly modified morphology, so-called “arm and hammer”. This is a synapomorphy of Asellota and Microcerberidea, phylogenetically closely related groups, and supposedly it has a constrained evolution due to interlinked parts and its role as a continuous sperm conduit [55]. The endopodite of the male’s pleopod II is specialized for conveying sperm packets to female genitalia and has a variety of forms that have been generally sufficient for species identification. Our initial study could not detect differences in the anatomy of male’s pleopod II between the two lineages of the Korean populations of C. fukudai. Nevertheless, we chose this structure for our quantitative analysis based on the fact that mismatch in the genitalia has long been posited as a mechanism of reproductive isolation [56]. The primary aim of our study is to resolve the C. fukadai species complex with LBGM, as a novel approach in the microcerberid and isopod studies in general.
2. Materials and Methods
2.1. Sample Collection
We collected samples from Gazin, Sokcho, Dongho (lineage A), Detan, Jangsa, and Imrang (lineage B) beaches in Korea for our two genetic lineages comparative analysis study [40]. We collected samples on two occasions in September and October 2020 by filtering the water with a hand net (mesh size 46 μm) and immediately preserved the samples in 99% ethanol. We kept all collected animals in three plastic bottles (200 mL) separately from each beach and preserved them in the portable refrigerator until reaching the laboratory. All newly collected animals with geographical information were deposited in the collection of the National Institute of Biological Resources (NIBR), Incheon, Korea (Table S1).
2.2. Genetic and SEM Analyses
To confirm the population’s previously established genetic identity, we randomly selected 1–3 individuals from each sample and extracted their DNA. We amplified the mitochondrial cytochrome b sequences following the same procedure as Kim et al. (2018) [40]. We confirmed all obtained sequences with BLAST search [57], which were deposited in GenBank (Table S2) [58]. We performed sequence alignment using the MAFFT v7.313 [59] with those of C. fukudai already published and publicly available. We used the TCS algorithm implemented in PopART [60] to visualize the haplotype network for the aligned sequence dataset. We evaluated the best substitution model (TIM1) as well as maximum likelihood (ML) trees using the iqtree version 1.6.9 [61] with 1000 ultrafast bootstrap replicates. We constructed an ML phylogram with iqtree default parameters. We transferred specimens for the observation under the scanning electron microscope (SEM) to isoamyl acetate for 20 min and dried them in a critical-point dryer (Hitachi E-1010; Hitachi, Tokyo, Japan). We mounted dried specimens on an SEM stub coated with gold using a sputter coater to a thickness of 15–30 nm. We then photographed the coated specimens with a Hitachi S-3400 scanning electron microscope at Chungang University, Seoul, Korea.
2.3. Morphological Data Acquisition
We confirmed individual maturity using a combination of the following characteristics: (1) length of the pereonite VII (longer in adults vs. much shorter in juveniles); (2) length of the pereopod VII (incompletely developed in juveniles); (3) length of the male pleopod II (absent in juveniles); (4) whole body length (adults generally exceed 0.8 mm). We confirmed individual sex using a combination of the following characteristics: (1) pereonite VII penial papillae (present in males vs. absents in female); (2) male pleopod II (present in males vs. absent in females); (3) whole body length (males measure less than 1 mm vs. females longer than 1 mm). Information on individual animals is summarized in Table S2. We dissected the animals using a stereo dissecting microscope, Olympus BX51 (Olympus, Tokyo, Japan). We separated the cephalothorax and pleon from the body and mounted them immediately on microscope slides with lactophenol and two coverslips. We made line drawings of cephalothorax, pleon, and male’s pleopod II endopodite using a compound microscope, Olympus BX51 (Olympus, Tokyo, Japan), equipped with a camera lucida. To make a dorsal perspective angle perpendicular to the microscope objective, we manipulated the coverslip by hand, and focused on the symmetrical view [28]. After each specimen was adequately positioned consistently, we made pencil drawings of the cephalothorax, pleon, and pleopod II endopodite. We scanned the images and generated a TPS file using tpsUtil software (File S1) [62]. We digitized the chosen landmark (LM), all Type I [63], twice using tpsDig2 software [64] to estimate digitization-related errors [65]. We analyzed the sensilla distribution (SD) on cephalothorax, pleonal points (PP), and pleopod II endopodite (PE) as separate datasets. We selected eight sensilla (Figure 1A): two located above a pair of incisions on the dorsoposterior margin (LMs 1 and 2), two along the posterolateral margins (LMs 3 and 4), two on the medial margin (LMs 5 and 6), and two along the anterolateral margin (LMs 7 and 8). We selected eight anatomical points of pleon (Figure 1B): two on the right and left vertex of the pleonite I anteriorly (LMs 1 and 2), two on the right and left vertex of the pleonite II anteriorly (LMs 3 and 4), two on the right and left vertex of the pleotelson anteriorly (LMs 5 and 6), and two points on the pleotelson’s posterior end (LMs 7 and 8). The endopodite is an asymmetric object with overall shape out curved, its distal end is bifurcated, of which the lateral projection is elongate and distally pointed. We noticed from the preliminary observation that the location of lateral projection seems to vary across the populations, which was previously unreported. We, therefore, selected six anatomical points at the distal end of right PE at the ventral position (Figure 1C,D) to evaluate the relative position of lateral projection against tip of medial body: one on the distal tip of medial body (LM 1), one on the proximal groove’s vertex between the body and the projection (LM 2), one on the medial side of the projection symmetrically in the same position as the distal tip of the body (LM 3), one on the distal tip of projection (LM 4), one on the lateral side of the projection symmetrically in the same position as the distal tip of the body (LM 5), and one on the proximal end of the projection symmetrically in the same position as the LM 2 (LM 5). The SD, PP, and PE datasets included 360, 370, and 182 digitized images (from the original 180, 185, and 91 pencil drawings), respectively. We summarized the image numbers generated according to the classifier (lineage and population, and sex) in Table 1. Except when performing the Procrustes analysis of variance (ANOVA) to test measurement error, we used only the first digitization for the subsequent LBGM analyses.
2.4. Geometric Morphometric Analyses
We used algorithms implemented in Morpho J package software version 1.07a [66] for all LBGM analyses. We aligned and superimposed all landmark configurations with generalized Procrustes analysis (GPA) to remove the effects of non-shape variation [14]. Of SD, PP, and PE datasets, the former two ones were object symmetry [65], with the axis of plane passing through the LM configuration; each LM has a corresponding pair on the opposite side (Figure 1A,B). The GPA also detects directional and fluctuating asymmetry and shape differences. For this study, however, we considered the symmetric component only, which represents average shape changes between the left and right sides. Because the potential discrepancies in angle can be induced by specimen positioning on the microscope that has significant effects on the asymmetric component [28,67], we converted the Procrustes shape coordinates into a covariance matrix [68]. As a size proxy, we estimated the centroid size (CS) for each individual from the raw LM coordinates (Table S3) [15]. We calculated the CS as the square root of the sum of squared distances for a set of centroid LMs [69]. Descriptive statistical values of CS such as means, standard deviation, and standard errors were calculated and displayed with box plots generated by a web-tool for generation of box plots, “BoxPlotR” [70].
We analyzed the SD, PP, and PE covariance matrices independently (File S2). We used Procrustes ANOVA to test group structuring evidence in the overall dataset with lineage and sex as classifiers as well as the digitizing errors [71]. We performed regressions of shape onto size to test allometry using regression scores and CS. [72,73]. The null hypothesis states that shape develops isometrically; thus, a statistically significant result demonstrates that shape changes with increasing size according to a predictable model [74]. We applied a permutation test [75] to assess the statistical significance against the null hypothesis. The number of shape variations determined by the regression was expressed as a percentage of the total variation percentage around the mean [24]. We calculated the SD, PP, and PE datasets residual components to subtract the portion of shape variation predicted by the regression for further analyses. We analyzed the residual shape component using principal component analysis (PCA), which is the most efficient method for examining the variation of multiple variables within a single sample. This analysis is often used as the first exploratory analysis of a large dataset composed of several samples to provide a visual impression of overall shape variation. [69]. We performed the PCA twice on the entire dataset and then on datasets of females and males separately with the wire frame to visualize SD, PP, and PE’s average shape variation along major PCA axes. We used the LM displacement described in the PCA to establish the new species’ taxonomic diagnosis. We employed PE dataset residual components for discriminant function analysis (DFA) and canonical variate analysis (CVA). Both are multivariate LBGM methods that produce a criterion for reliably distinguishing two lineages and among multiple populations, respectively. DFA and CVA results indicate the separation among groups by maximizing distances between group means relative to the variation within groups [76]. For the result of DFA, we applied cross-validation to test the reliability of groups separation [76]. We used multivariate statistics as Mahalanobis distances [77] to estimate the difference between groups. The permutation test assessed the statistical significance against the equal group means’ null hypothesis. We finally used the cross-validation score of DFA and the Mahalanobis distances of CVA to evaluate the availability of pleopod II endopodite for delimiting the groups.
3. Results
3.1. Confirmation of Genetic Indentity
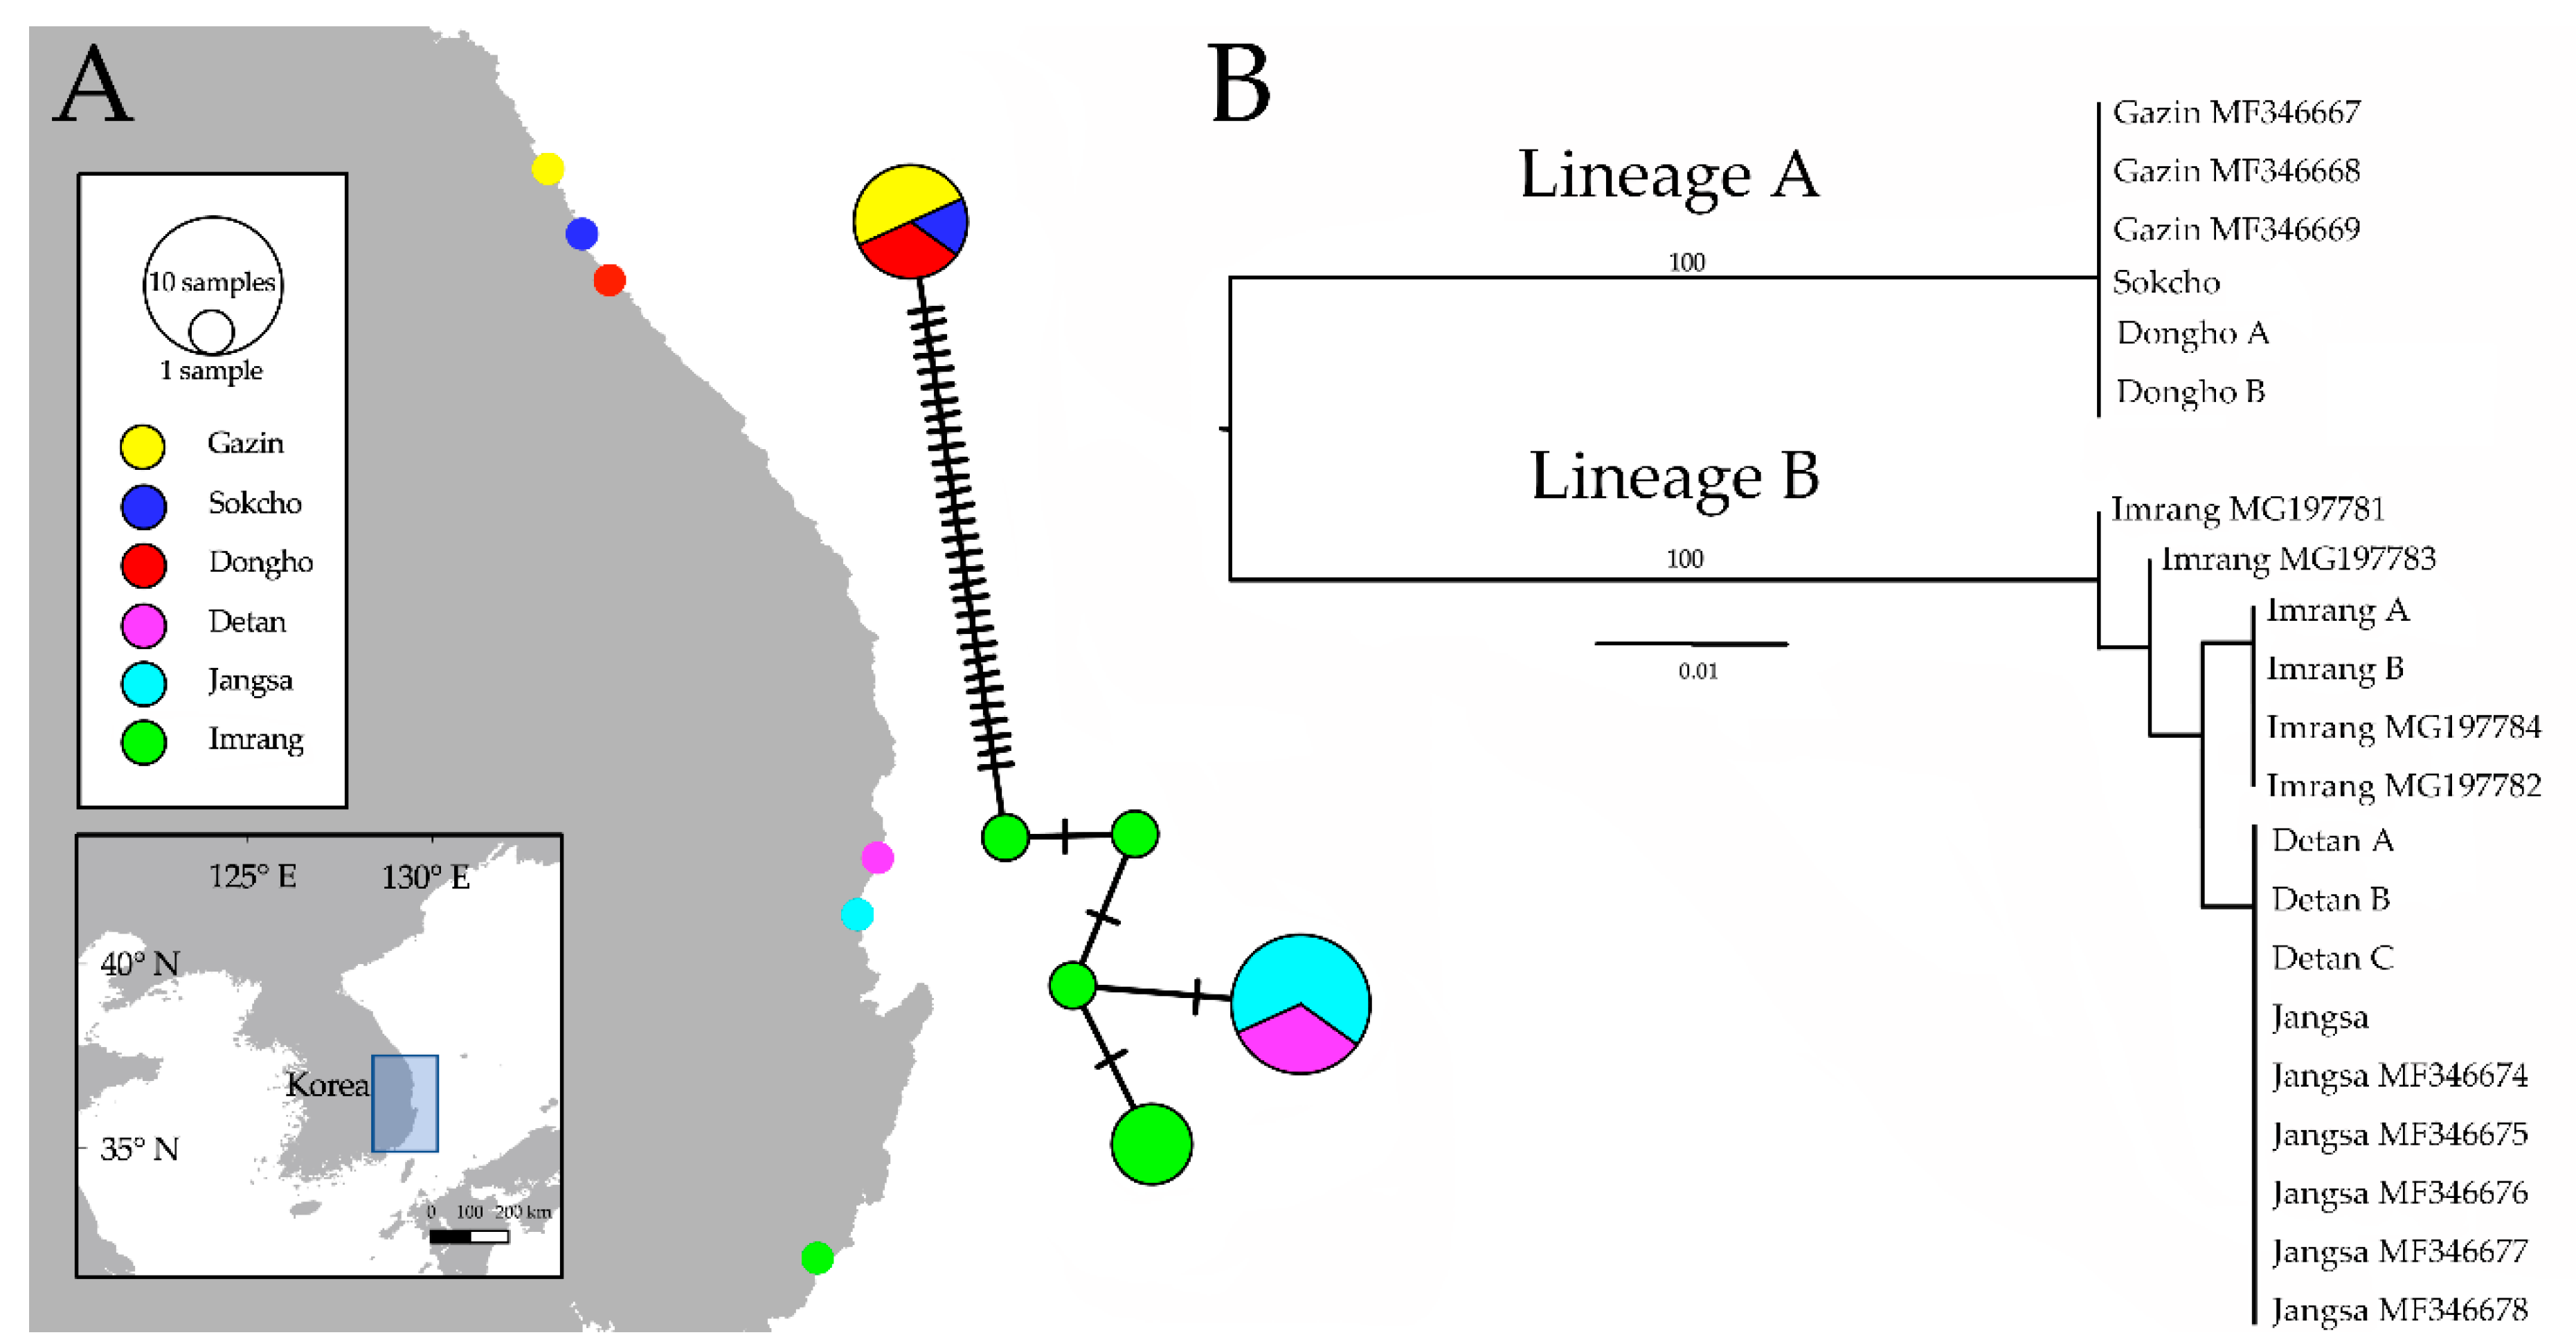
The haplotype network (Figure 2A) detected six haplotypes, with the Gazin, Sokcho, and Dongho populations (lineage A) sharing a haplotype separated from the lineage B’s ones with over 30 mutational substitutions. The Imarang population showed four haplotypes; each of them is separated by one mutational substitution. The Imrang one was the only location where multiple haplotypes exist. The Detan, and Jangsa, populations shared a haplotype distinguished by one substitution from the Imrang’s one. The ML phylogram (Figure 2B) revealed two distinct clades with absolute certainty. The Gazin, Sokcho, and Dongho sequences formed a distinct clade representing a diverged lineage from that of Detan, Jangsa, and Imrang’s clades. All Imrang sequences formed separated clades from the Detan and Jangsa ones.
3.2. Testing Variations in Size and Shape
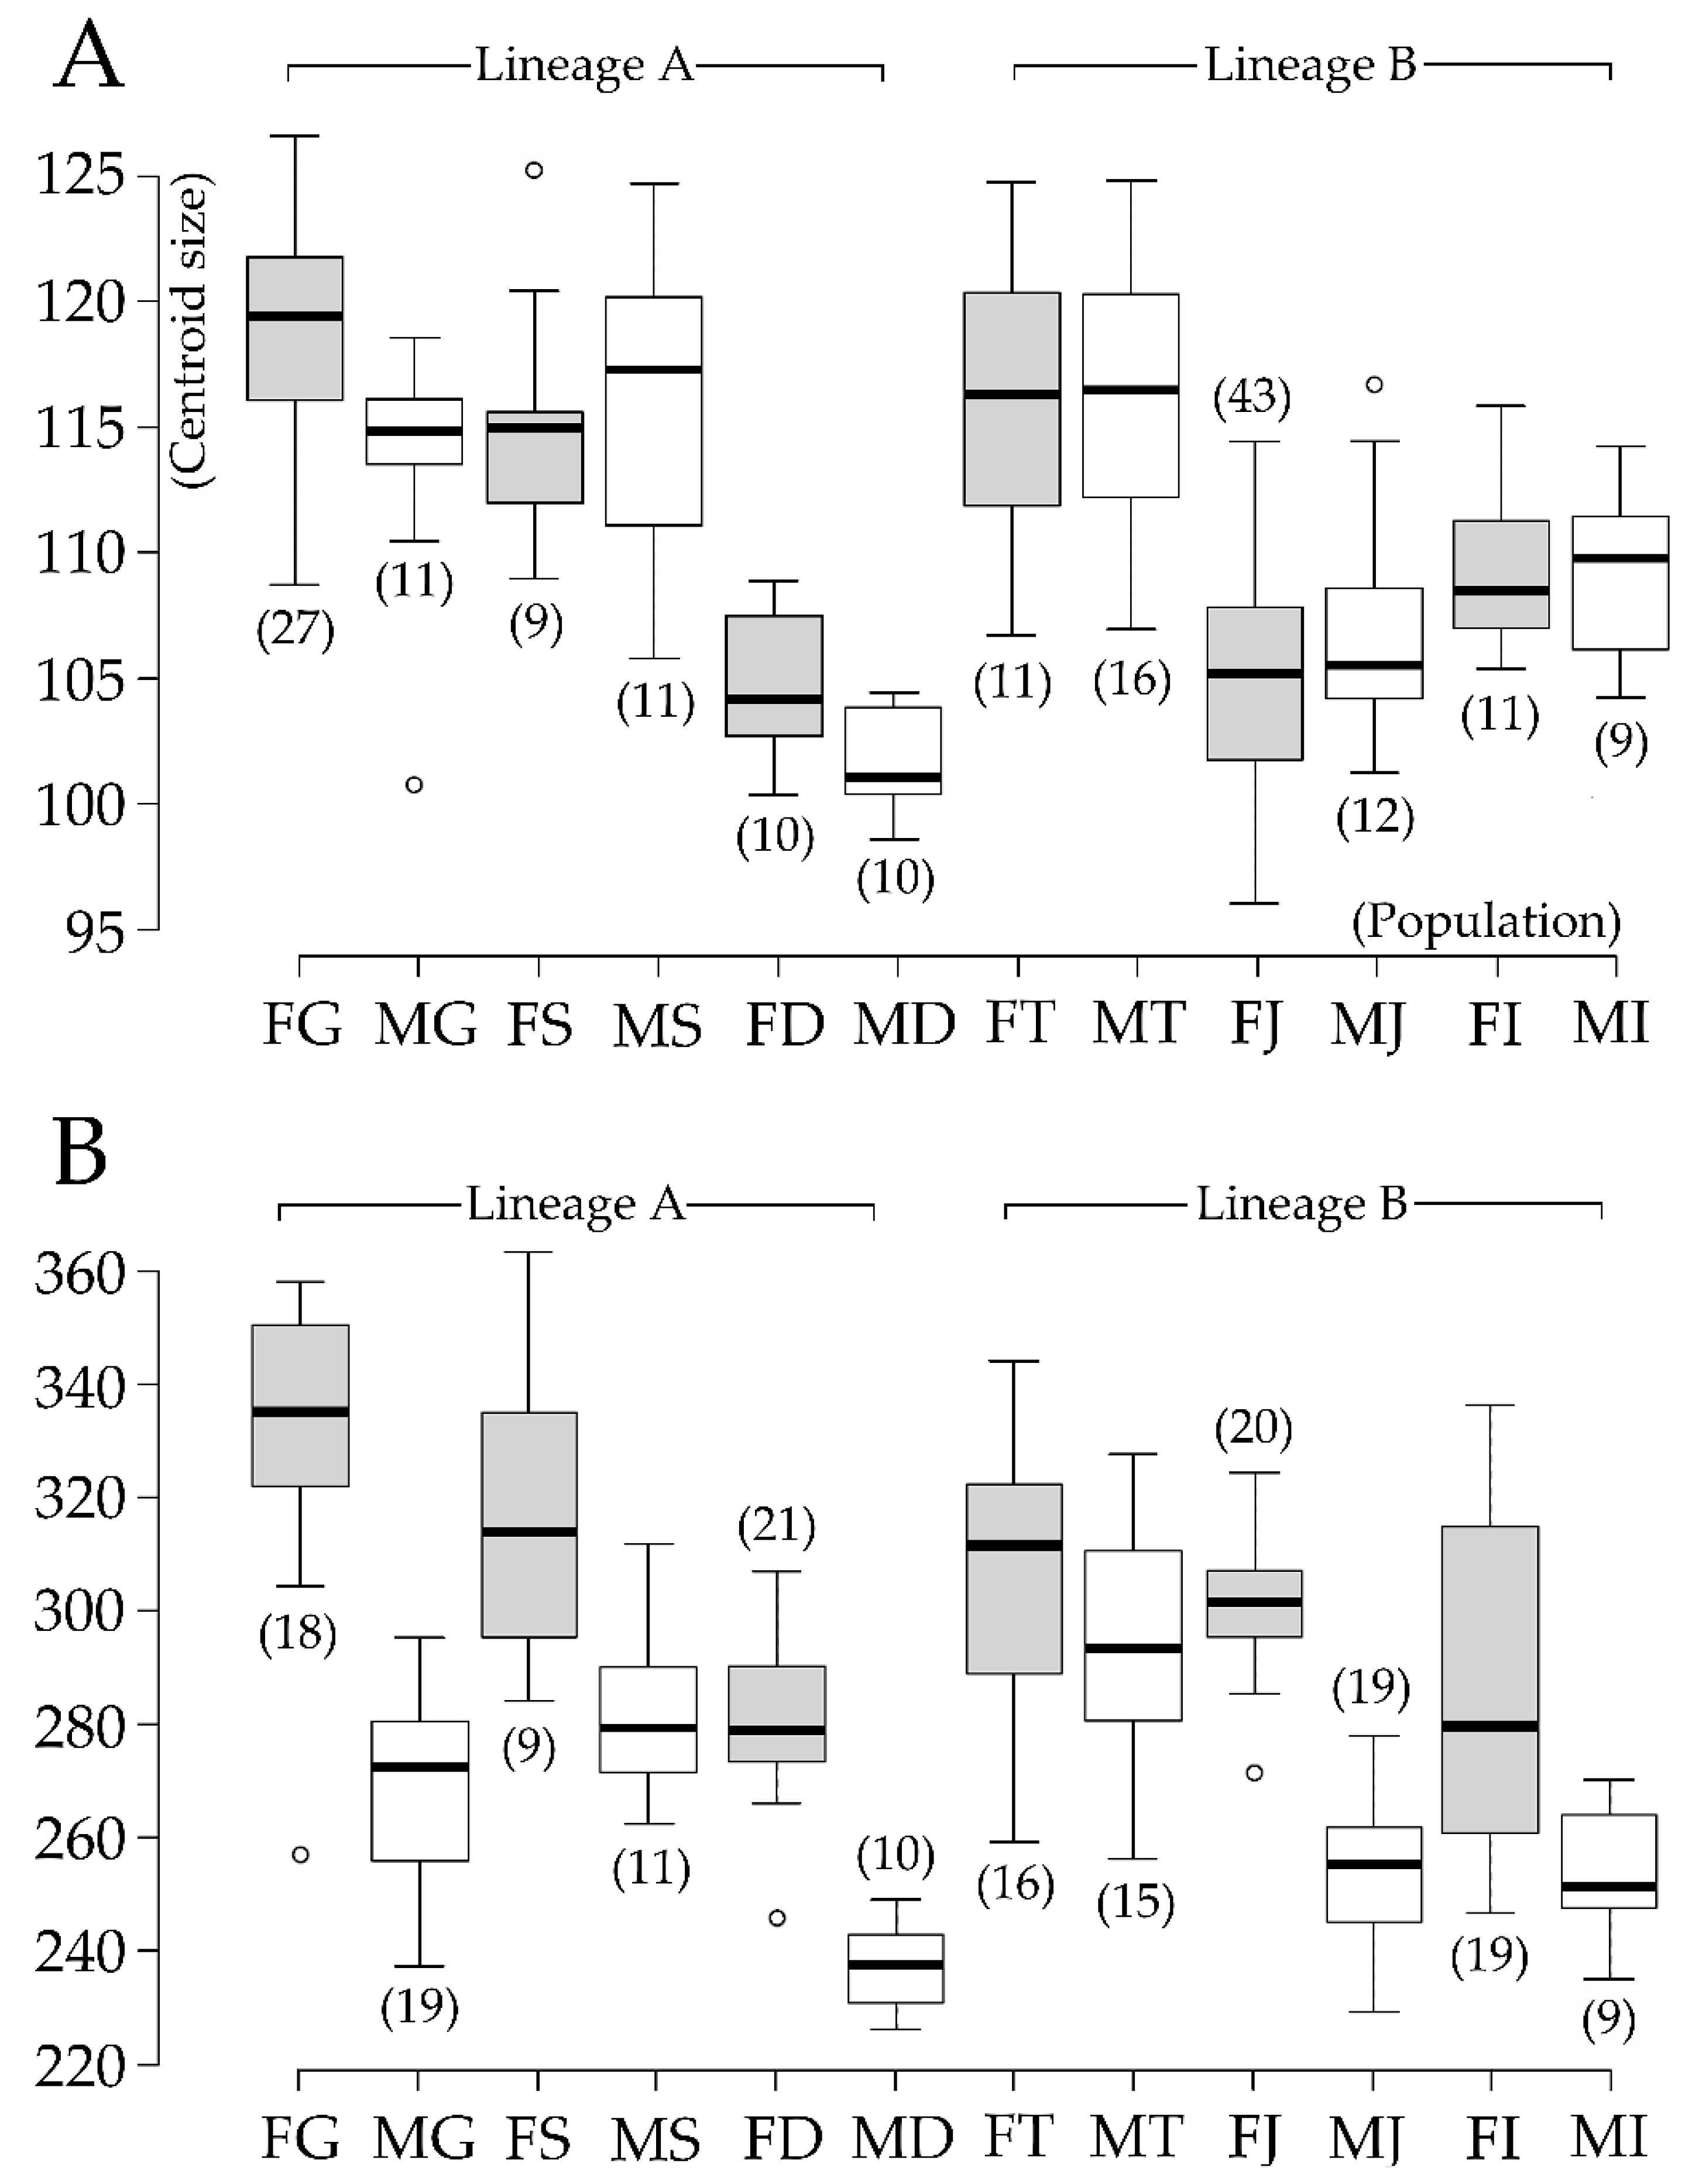
ANOVA results (Table 2) yielded a negligible digitizing error for all datasets with the individual variability mean squares (MS) and F values by far exceeding the error values. Lineage was a significant contributor to overall shape and size variations for SD and PE datasets. It was highest in the PE shape component dataset (F = 29.16, p < 0.0001), followed by the PE size dataset (F = 13.48, p < 0.0001), SD size (F = 11.96, p = 0.0007), and shape dataset (F = 5.18, p < 0.0001). The lineage did not contribute to the size and shape in the PP datasets (size F = 0.65, p = 0.4217; shape F = 1.5, p = 0.1746), while the sex contributed significantly to the PP dataset (size F = 89.17, p < 0.0001; shape F = 54.2, p < 0.0001), and the SD shape dataset (F = 4.03, p = 0.0005). In the SD dataset, sex has not contributed to the size component of variability. The box plots summarize differences in the CS in detail and emphasize substantial sexual size dimorphism. In the SD dataset (Figure 3A), the largest individual was in the Gazin females and the smallest one was in the Jangsa females. The Gazin, Sokcho, and Detan individuals generally showed larger CS indicated by interquartile ranges than the Jangsa, Dongho, and Imrang ones. Sexual dimorphism was, however, not much comparable as most populations displayed similar interquartile ranges between sexes, with some exceptions from the Gazin and Dongho showing larger female CS. On the other hand, the PP dataset (Figure 3B) showed the Gazin females and Dongho males comprising the largest and smallest individuals. The sexual dimorphism was a general trend in all populations, but it was more pronounced in the Dongho, Gazin, and Jangsa populations than others in terms of the absence of the overlapped ranges. PE dataset (not presented) displayed the CS variation ranging from four to nine across the populations. Sokcho and Imrang individuals included the largest and smallest individuals, respectively.
3.3. Allometry and Size-Corrected Shape Variation
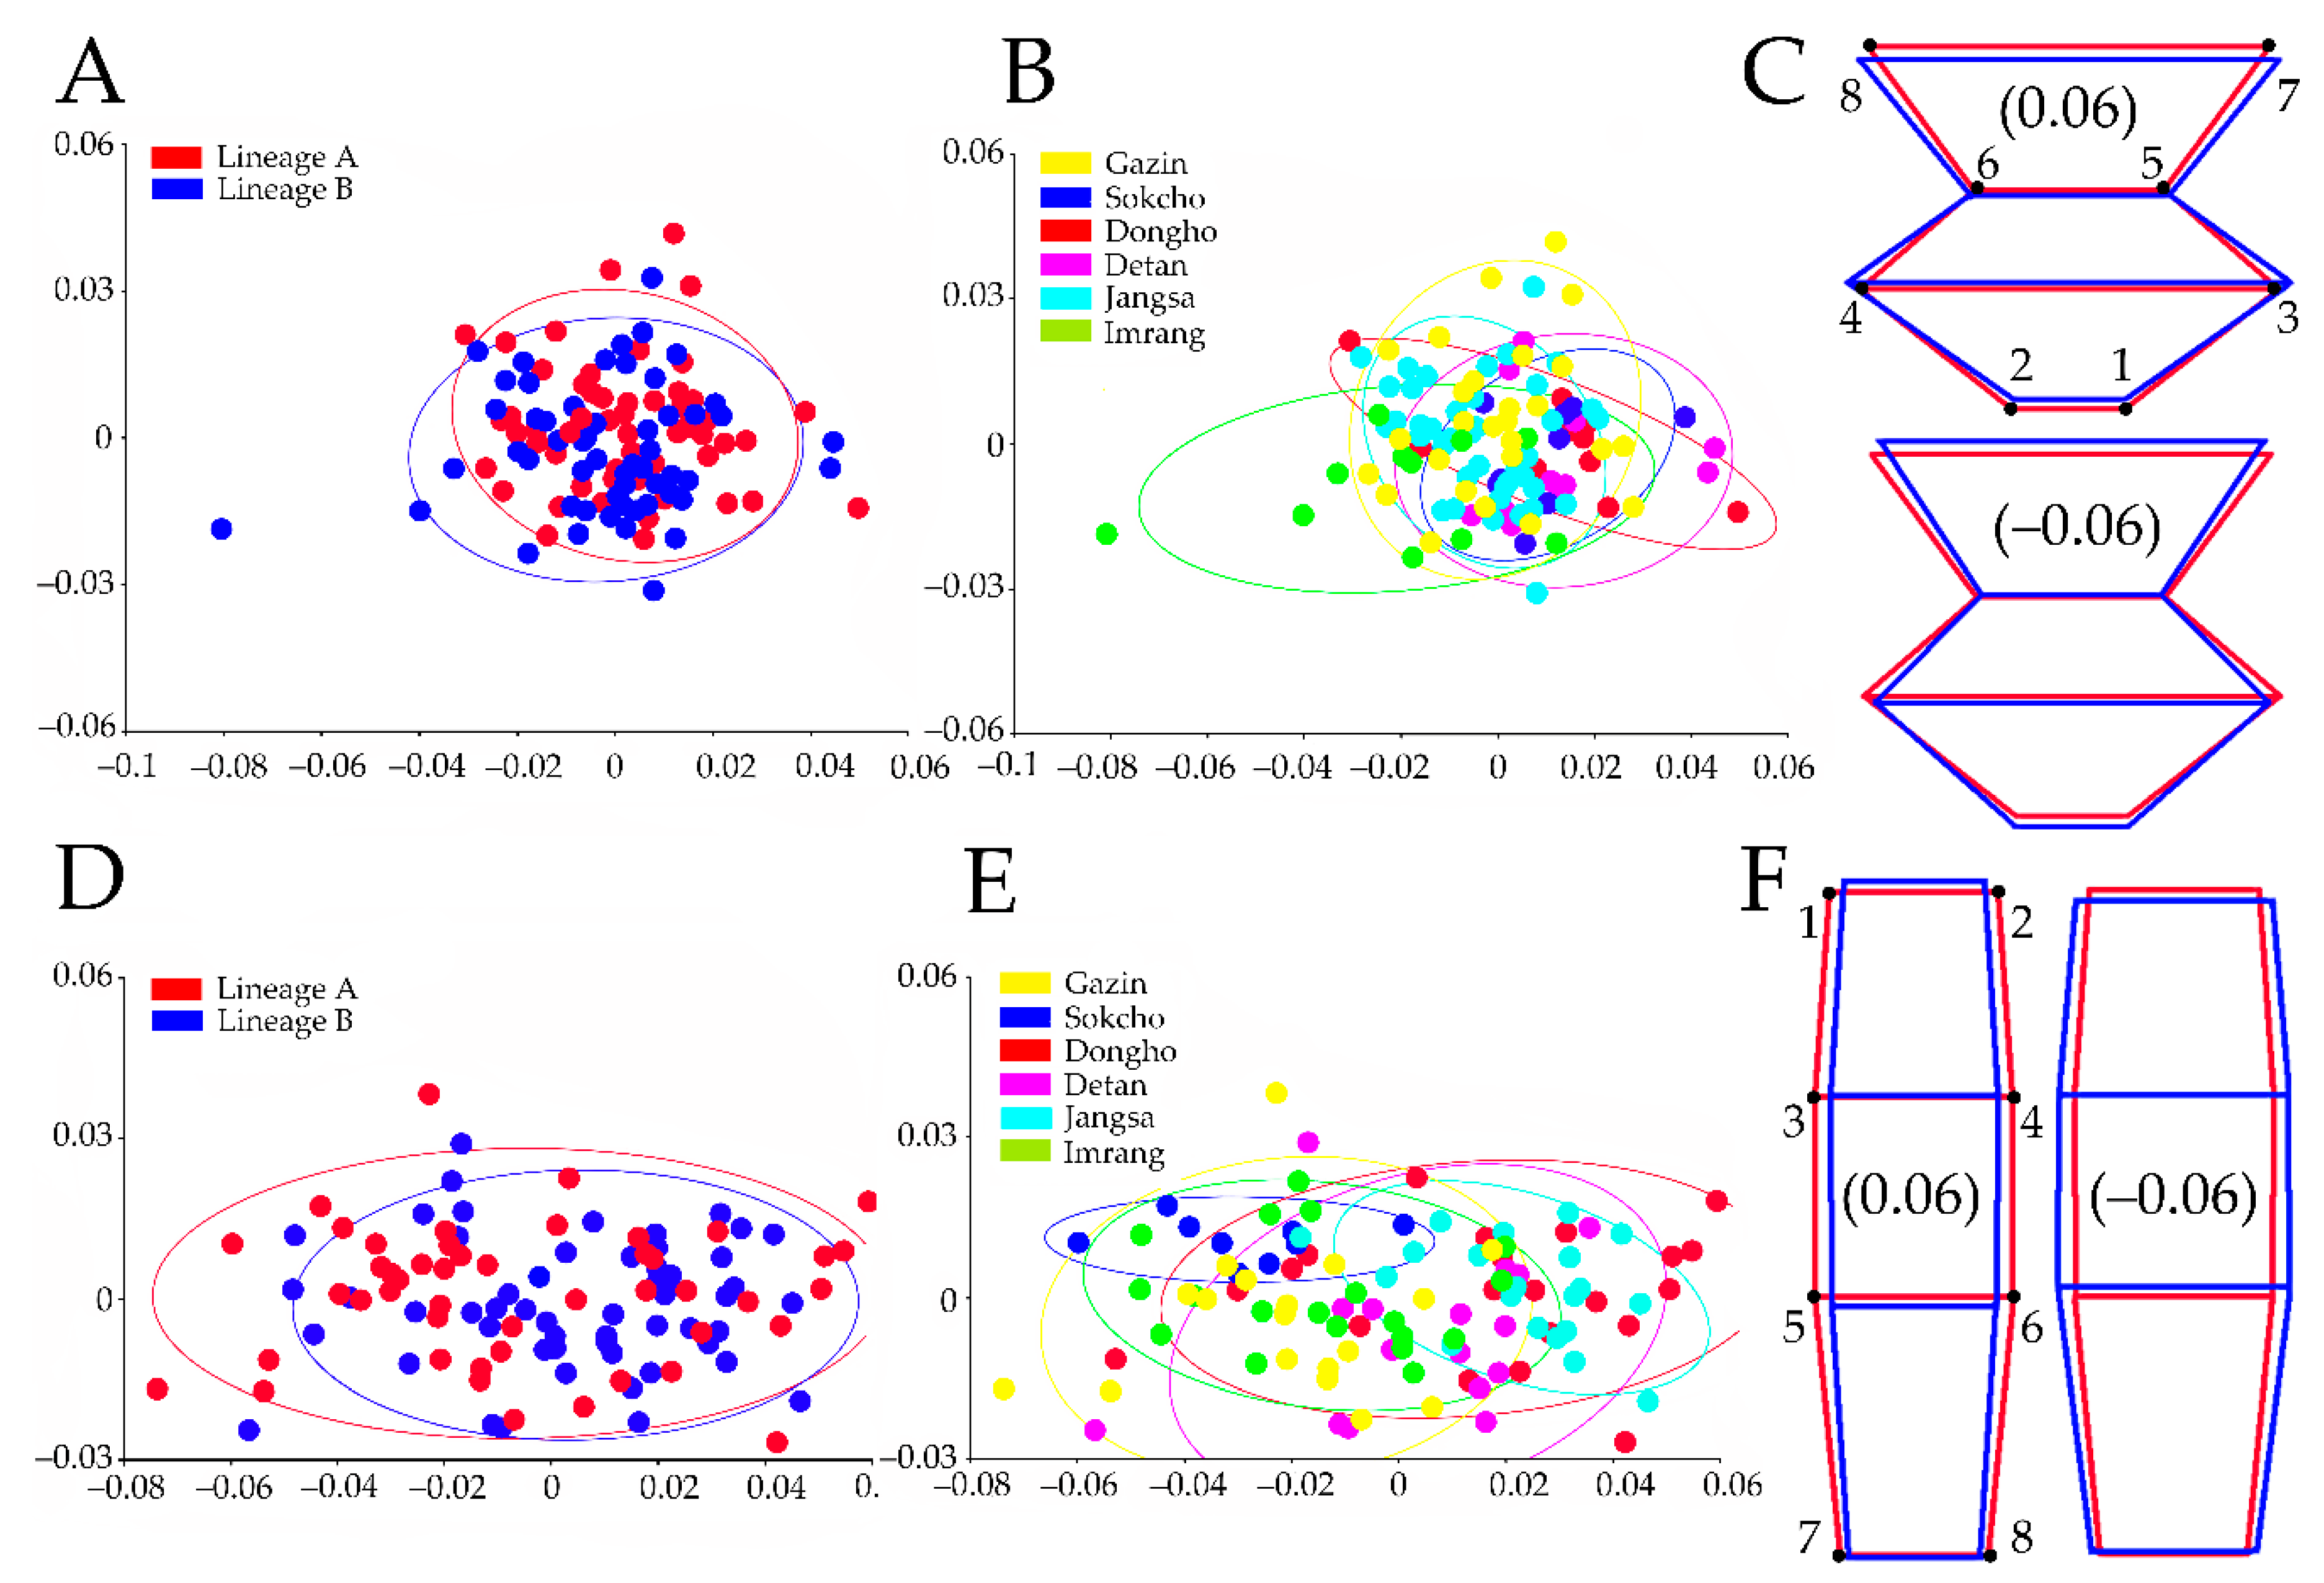
The SD entire dataset regression for isometric shape development estimated a significant allometric effect (16.76%, p < 0.0001), so the null hypothesis was rejected. The PCA based on the residuals described the major shape variations of overall dataset with the first two axes carrying 57.4% (PC1 = 36.8%; PC2 = 20.6%) of the total variance. Despite a high individual variability, the PCA did not describe any difference between lineages. The sex-specific PCA using the residuals explained the major male (not presented) and female (Figure 4A,B) shape changes, with the first two axes accounting for 63.15% (PC1 = 40.35%; PC2 = 22.8%) and 57.27% (PC1 = 37.26%; PC2 = 20.01%) of the total variance, respectively. The PCA of female, however, did not show any difference in the shape between lineages (Figure 4A) and between populations (Figure 4B). The wire frame demonstrated that some Sokcho, Dongho, and Detan individuals showed the wider and shorter SD than average due to LM1 and LM2 shifted antero-medially, LM3 and LM4 shifted antero-laterally, and LM5, LM6, LM7, and LM8 shifted postero-laterally (Figure 4C upper panel). About three Imrang individuals displayed the SD narrower and longer than mean shape due to LM1 and LM2 shifted postero-laterally, LM3 and LM4 shifted postero-medially, and LM5, LM6, LM7, and LM8 shifted antero-medially (Figure 4C lower panel).
The regression of the PP overall dataset estimated a significant allometric effect (10.63%, p < 0.0001), rejecting the null hypothesis of isometric shape variation. The first two PCA axes based on the residuals accounted for 81.7% (PC1 = 70.2%; PC2 = 11.5%) of the total shape variation. However, lineages did not show any meaningful clustering in the morphospace. The first two PCA axes of the male (not presented) and female residuals analyses (Figure 4D,E) carried 81.91% (PC1 = 68.07%; PC2 = 13.85%) and 79.02% (PC1 = 67.06%; PC2 = 11.97%) of the total variability, respectively. The PCA of both sexes showed hardly any distinguishable clustering among populations. Nevertheless, the PCA of the female dataset showed the morphospace clustering of Jangsa, Dongho, and Detan populations on one side (with the center of gravity in the positive part of the PC1) and the one of Gazin, Sokcho, and Imrang on the other (with the center of gravity in the negative part of the PC1). The wire frame of PC1 (Figure 4F, upper panel) showed a narrow and elongated PP shape for the Jangsa, Dongho, and Detan populations due to LM1 and LM2 shifted antero-medially, LM3, LM4, LM5, and LM6 shifted postero-medially, and LM7 and LM8 shifted antero-medially. The wire frame of PC1 for the Gazin, Sokcho, and Imrang ones (Figure 4F lower panel) differed from the former group by having LM3 and LM4 shifted antero-medially, and LM7 and LM8 postero-medially.
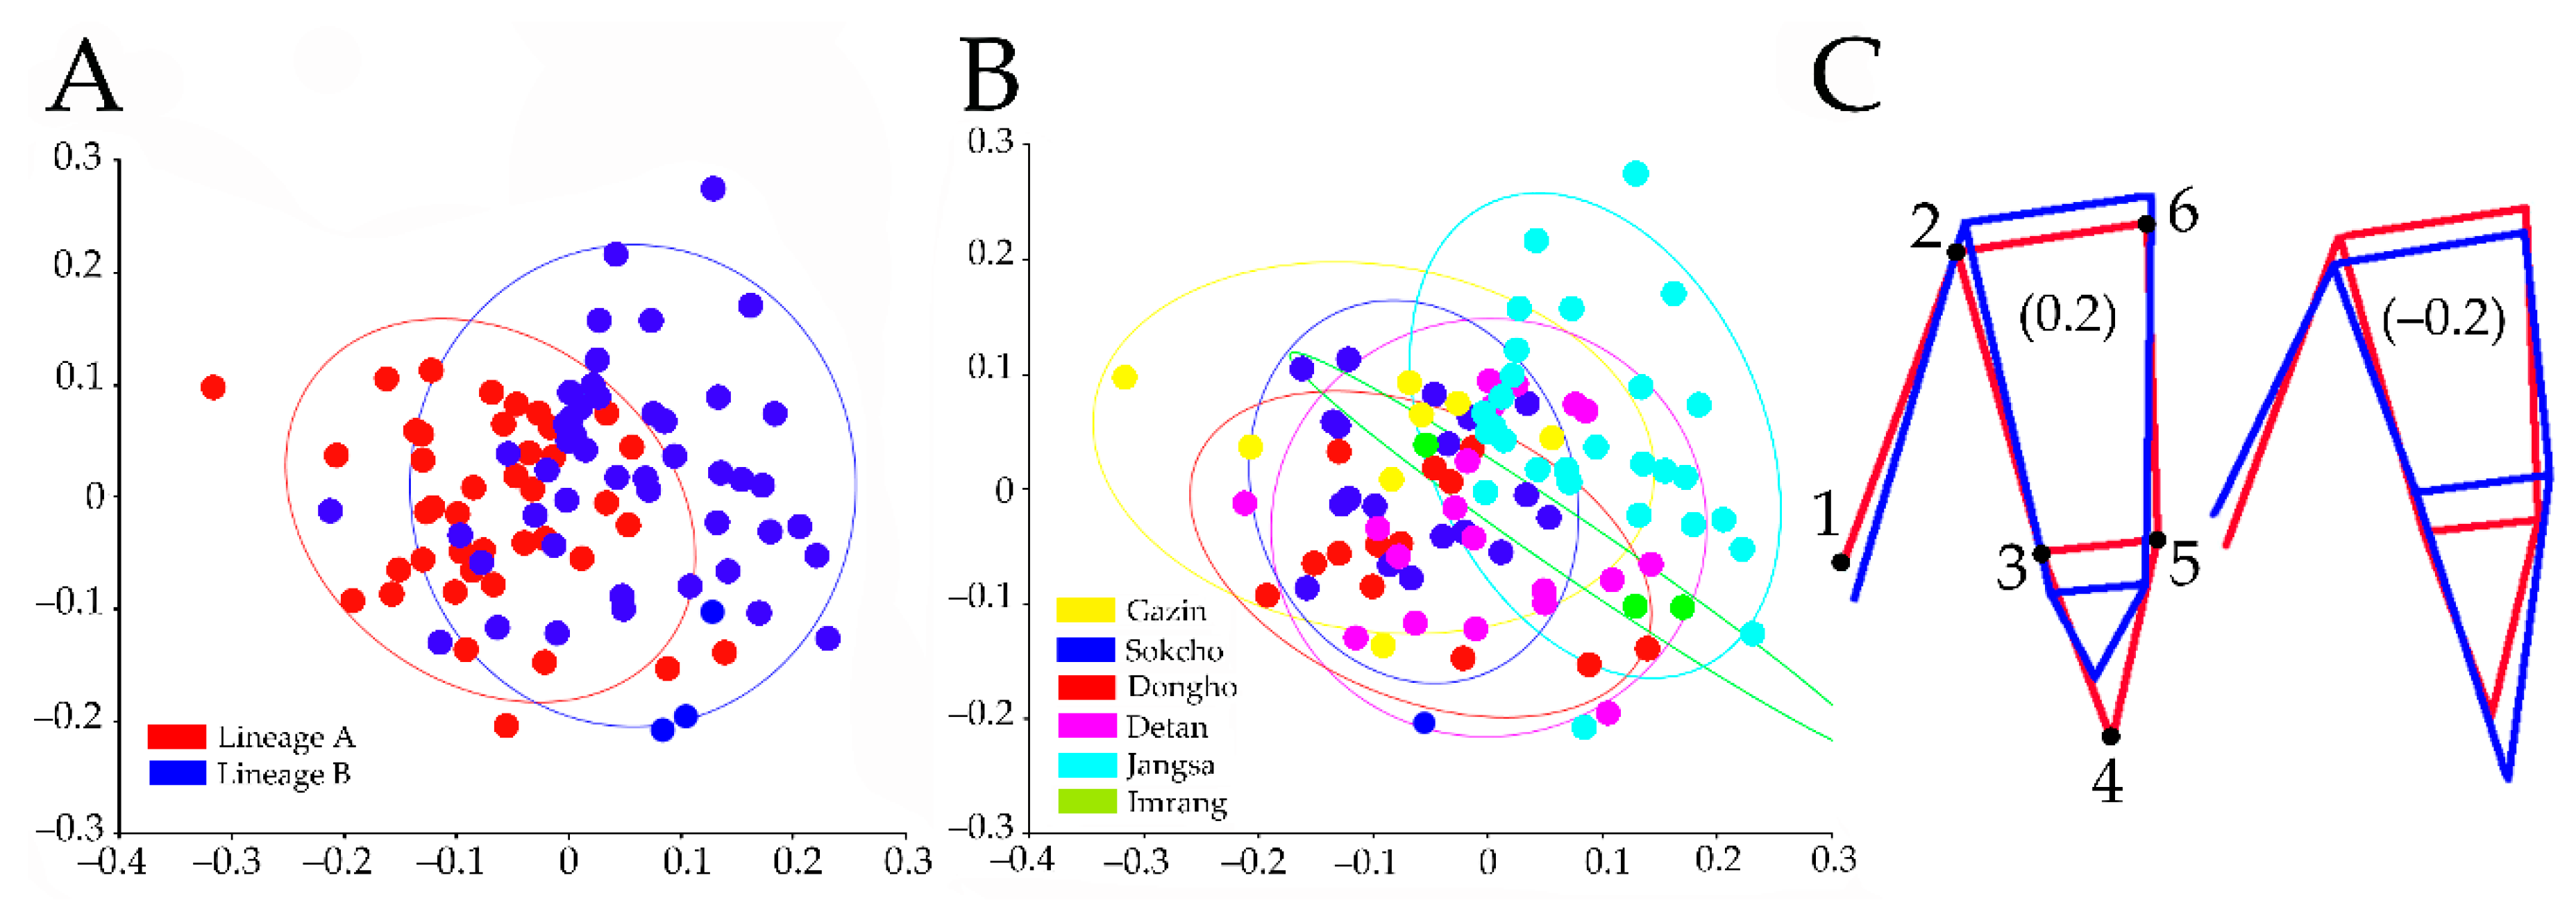
The PE dataset regression analysis estimated a significant allometric effect (6.02%, p = 0.002) so the null hypothesis of isometric shape development was also rejected. The PCA based on the residuals from the regression analysis showed the major shape changes occurring in the first two PCs, accounting for 83.7% (PC1 = 49.1%; PC2 = 34.6%) of the total variance. The PC1 emphasized morphological differences between lineages (Figure 5A), with the lineage A having the center of gravity on the negative part of the axis, and lineage B on the positive. When populations were used as determinant of the PC1 morphospace clustering (Figure 5B), Gazin, Sokcho, and Dongho individuals mostly occupied the negative space between −0.4 and 0. The Jangsa and Imrang individuals had variations ranging between −0.1 and 0.3 clearly with a positive center of gravity, while the Detan individuals had a relatively wider variation, ranging between −0.3 and 0.2 with a center of gravity near 0. The PC1 described the wire frame for the Gazin, Sokcho, and Dongho individuals (Figure 5C, right panel), which differed from that of the latter group (Figure 5C, left panel) by the following LMs displacement: LM1 and LM3 shifted proximo-medially, LM2 and LM6 shifted disto-medially, LM4 shifted disto-laterally, and LM5 shifted proximo-laterally.
3.4. Lineage Differentiation and Morphological Distances
The permutation test of the cross-validation of DFA and CVA rejected the PE null hypothesis for equal group means between lineages (p < 0.0001) and between populations (p < 0.0001). The Mahalanobis distances between lineage A and B was 2.2277 (p < 0.0001). The cross-validation of DFA based on residuals (Table 3) relatively well classified individuals according to the lineage (lineage A 82.9%; lineage B 99%). The CVA analysis of the PE residuals showed that the first two axes carried 85.4% (CV1 = 61.7%; CV2 = 23.7%). The Mahalanobis distances comparison (Table 4) revealed that the Jangsa population was the most distantly related to lineage A, followed by the Imrang and the Detan ones. Lineage B showed a high intraspecific variation—the Jangsa individuals were accurately distinguished from the Detan ones (2.38, p < 0.0001), while those from Imrang were barely separated from the Jangsa (3.17, p = 0.005) and Detan (2.66, p = 0.04) ones.
3.5. Taxonomy
Order: Isopoda, Latreille, 1817
Suborder: Microcerberidea, Lang, 1961
Family: Microcerberidae, Karaman, 1933
Genus: Coxicerberus, Wägele, Voelz and McArthur, 1995
Coxicerberus jangsaensis, sp. nov.
Material examined. Holotype: South Korea, Gyeongsangbuk-do, Yeongdeok-gun, Jangsa Beach (36°16′39.26” N 129°22′43.07” E), 1♂ dissected on one slide (NIBRIV0000880991); Paratypes: 27♂♂ from Jangsa Beach, mounted on one slide each (NIBRIV0000881023‒0000881049), 11♂♂ from Detan Beach (36°26′24.0” N 129°25′58.6” E), mounted on one slide each (NIBRIV0000880945‒0000880955), and 2♂♂ from Imrang Beach (35°19′00.2” N 129°15′46.5” E), mounted on one slide each (NIBRIV0000881132‒0000881133).
Etymology. The new species is named after the type locality.
Diagnosis. General characteristics including habitus, appendages segmentation, and appendage setal formula as given by Kim et al. (2018) [40] in redescription of C. fukudai. Jangsa and Detan individuals, with pleopod II endopodite PC1 shape variation based on the following LM displacements: LM1 displaced disto-medially, LM2 proximo-laterally, LM3 disto-medially, LM4 proximo-medially, LM5 disto-medially, and LM6 proximo-laterally.
Remarks. One of the major differences between C.fukudai and C.jangsaensis sp. nov. includes the relative distance between LM1, LM3, LM4, and LM5. The Jangsa, the Imrang, and over half of the Detan individuals representing C. jangsaensis sp. nov. displayed a shape change with decreased distance between those landmarks, resulting in the proximity of the projection’s distal tip and the medial body’s one (see Figure 5C Right). The Dongho, the Gazin, and the Sokcho individuals of C. fukudai showed the shape change with increased distance between the landmarks, representing the remoteness of the projection’s distal tip and the medial body’s one (Figure 5C, left). In addition, the relative movement of LM1, LM2, LM3, LM5, and LM6 described another distinct shape change between two species. The lengthen distance among those landmarks in C. jangsaensis sp. nov. showed overall a deep proximal rut represented by LM1–3, while those of C. fukudai showed the shortest distance, forming a relatively shallow groove. As a result, overall LM displacements indicates that C. jangsaensis sp. nov. tends to display the PE’s lateral projection less developed distally than C. fukudai’s one.
4. Discussion
One of the most significant results of the LBGM analysis is a high degree of CS differences in SD, PP, and PE datasets. The grouping factors play a dominant role in the overall size variations. In the SD and PE datasets, lineages A and B differed significantly from each other in size, while the PP dataset showed hardly any statistical differences. Sex was a significant factor accounting for the overall size variation in the PP dataset, but not in SD. Such size variation consequently yielded a significant allometric association, which is the main cause of the disparity or similarity between lineages and sexes. This is particularly obvious when comparing the shape variation in SD and PP datasets with and without allometry. The shape variation produced by a continuation of allometric association is not an independent morphological criterion and is invalid for the species delineation [78], but our discovery provides the first insight into the size variation in the microcerberid isopods. Initially, Kim et al. (2018) [40] reported sexual dimorphism in body size in all studied Korean populations of C. fukudai: the overall body length of adult females lies between 1 and 1.5 mm and is less than 1 mm for males, which is a common trend in other congeners [42,45,79,80,81,82]. Given such interspecific variation in size, overall body length and sexual size dimorphism discrepancies in the sensilla distribution are prominent features of lineage A and lineage B. Secondly, the genetic lineages did not correspond to the similarity in CS given that all populations showed a significant difference in the intrapopulation variation. Since size difference can either be a result of sympatric speciation [83] or a temporary response to the ecological constraints [84,85,86], we need to explore the cause further. Potential associations between size variation and seasonal changes in temperature, nutrient levels, pH, salinity, and predation [87] would benefit from sampling over an extended period of time; microcerberid ecology is poorly known other than salinity and temperature tolerance ranges for one species [39].
The PCA analysis of regression residuals in the sensilla dataset revealed that lineages A and B have a similar intrapopulational variability ranges, resulting in indistinguishable morphospace clustering. This is interesting because results from other microcrustacean studies indicate that cuticular organs are important in taxonomy [27,53,88,89,90,91]. Considering a deep genetic divergence between two lineages with a split likely occurring between 3.6 and 2.1 million years ago [40], the absence of shape differences among the populations cannot be explained by a lack of genetic variation. Instead, it is the result of stabilizing selections of cuticular pore distribution patterns. Selection of this sort is known to constrain populations to relatively constant and high-fitness phenotypes and thus limits the frequency of directional or disruptive evolutionary changes [92]. The genus Coxicerberus is a marine interstitial group, displaying morphological characteristics associated with the life in narrow, dark spaces [38]. Eyes are absent, forcing them to rely strongly on other sensory organs [93]. The cephalothorax’s dorsal surface sensilla are assumed to play a prominent role in transmitting mechanical information to the central nervous system for efficient food sourcing and predator avoidance [94,95,96]. Despite their functional importance, we do not know to what extent these sensilla are species-specific since only a few Coxicerberus studies mention the number of sensilla along the cephalothorax’s lateral margin [42,43,44,82,93]. More sensilla studies are necessary in order to more accurately address their evolutionary stability and interspecific differences. A recent LBGM copepod study describes how cuticular pores and sensilla distribution patterns can be used to distinguish between closely related species [97].
The PCA analysis of the pleon dataset regression residuals showed a significant individual variability in the pleonite I, II, and pleotelson, altering their L/W ratio. However, there is no morphological evidence to distinguish two lineages in both sexes. Instead, we detected a distinct population clustering, but only in the female dataset. Accordingly, Gazin and Sokcho populations clustered together (lineage A) and are separated from the Jangsa (lineage B), the former groups showing much broader and shorten pleons than the latter one. The majority of Detan clustered with the Jangsa population with high similarity in the pleon shape, corresponding to the genetic membership. The Imrang and Dongho individuals did not follow this pattern and displayed a broad and elongated pleon, respectively. This phenomenon may indicate that the female pleon underwent a local adaptation across the populations in a different direction from the male. The female-specific variation is worth studying further, as the microcerberid taxonomy has mostly relied on male features. Female morphology is generally homogenous across taxa, with the overall shape lacking distinct qualitative traits, consequently being neglected in previous studies. Given that the geometric trends can differ between sexes, it is essential to test a strong sexual dimorphism with molecular markers in order to confirm con-specificity. Marine isopod populations show a strong female-biased sex ratio [98,99,100], from just over 50% to 14:1 in some Jaera Leach, 1814 species [101]. We also observed a similar phenomenon for C. fukudai complex, which was problematic when comparing male specimens as they are morphologically indistinguishable or are not easily available [40]. Therefore, extrapolating our results regarding the importance of female characteristics to other taxa would be beneficial for more reliable species delineation.
PCA, the cross-validation, and CVA analyses of the pleopod II dataset residuals showed a distinct separation of lineages A and B leading to a new species description. Coxicerberus jangsaensis sp. nov. displayed the shape variation of pleopod II endopodite’s distal tip, which is apparently opposite to that of C. fukudai. Such variation in the genital parts is occasionally associated with the copulation success rate, resulting in the reproductive isolation among morphologically diverged individuals [56,102]. Wilson (1991) [55] described that the copulation of Asellota is mainly controlled by exopod holding the pleopod II and forcing it into the female’s genitalia when sperm packets are conveyed. Coxicerberus jangsaensis sp. nov. shows the lateral projection of endopodite is structurally flexible and located near the opening where the appendix masculina is developed. Given the phylogenetic closeness and synapomorphy of the pleopod morphology between Asellota and Microcerberidea [35], we assume this body part interacts with the proximal part of the appendix masculina during the insemination. Indeed, the male pleopod II endopodite’s distal tip is one of the most variable characters across the species that has been used to determine a morphological boundary or phylogenetic relatedness. According to the species grouping by Baldari and Argano (1984) [44], C. fukudai has a strong morphological affinity with C. abbotti Lang, 1961 and C. kiiensis Nunomura, 1973 in terms of sharing the overall shape of pleopod I endopodite, which is out curved, covered by rows of setule medially, and tapering distally. One of the most notable differences between those species is the morphology of the endopodite’s distal tip, which is rounded/pointed without any projection in the latter two species. Based on this observation, we speculate that the geometric variability in the PE’s distal tip is a significant morphological evidence accounting for the divergence and reproductive isolation between C. fukudai and C. jangsaensis sp. nov.
With a reverse taxonomy concept [103], we employed a quantitative LBGM approach using three morphological characters, pleon, sensilla, and pleopod II endopodite, to resolve a C. fukudai species complex initially detected using molecular tools. These characters showed significant size and shape variations across the geographically separated populations, of which the pleopod II endopodite displays a high taxonomic potential for yielding the new species establishment. Our pioneering attempt consequently provided the first insight into the fine-scale diversity challenging the subsequent cryptic species problem in the microcerbrid taxonomy. Coxicerberus anfidicus Messana, Argano, and Baldari, 1978 complex exhibiting the morphological inconsistency between specimens from Somalian and Maledive populations [44], for instance, would be the next case study of cryptic diversity. Finally, we expect the possible methodological application to the taxonomic impediment in other interstitial fauna as the homogenous morphology resulted from convergent evolution is a well-known phenomenon across the distant areas [104].
Supplementary Materials
The following are available online at https://www.mdpi.com/2073-4441/13/4/515/s1, Table S1: Specimens information examined in this study with accession numbers as well as GPS addresses; Table S2: Accession numbers of sequences used in this study’s genetic analyses; Table S3: Centroid size of character employed for Figure 3; File S1: TPS files containing landmarks digitization of characters; File S2: Morpho J save files of the entire morphometric analyses.
Author Contributions
All authors contributed to the study conception and design. Conceptualization, J.K. (Jeongho Kim); methodology, J.K. (Jeongho Kim) and J.K. (Jaehyun Kim); software, J.K. (Jeongho Kim) and J.K. (Jaehyun Kim); validation, J.K. (Jeongho Kim) and J.K. (Jaehyun Kim); formal analysis, J.K. (Jeongho Kim) and J.K. (Jaehyun Kim); investigation, J.K. (Jeongho Kim) and J.K. (Jaehyun Kim); resources, W.L. and I.K.; data curation, J.K. (Jeongho Kim) and J.K. (Jaehyun Kim); writing—original draft preparation, J.K. (Jeongho Kim); writing—review and editing, W.L. and I.K.; visualization, J.K. (Jeongho Kim) and J.K. (Jaehyun Kim); supervision, W.L. and I.K.; project administration, W.L. and I.K.; funding acquisition, W.L. and I.K. All authors have read and agreed to the published version of the manuscript.
Funding
The study was supported by four grants: “2018 Graduate Program of Undiscovered Taxa” from the National Institute of Biological Resources (NIBR), funded by the Ministry of Environment (MOE) of the Republic of Korea (NIBR201839201), National Research Foundation of Korea (NRF) grant (2016R1D1A1B01009806), the Marine Biotechnology Program of the Korea Institute of Marine Science and Technology Promotion (KIMST, No. 20170431), funded by the Ministry of Oceans and Fisheries (MOF) to the Marine Biodiversity Institute of Korea (MABIK), and National Research Foundation of Korea (NRF) grant (2018R1D1A1B07050117).
Institutional Review Board Statement
Not applicable.
Informed Consent Statement
Not applicable.
Data Availability Statement
The data presented in this study are the part of this article and are available in the Supplementary Materials.
Acknowledgments
We would like to thank Tomislav Karanovic (Hanyang University) for providing valuable comments on designing the geometric morphometric analysis. We are thankful to Angelika Brandt (Senckenberg Research Institute and Natural History Museum) and Marina Malyutina (A.V. Zhirmunsky National Scientific Center of Marine Biology) for their isopod taxonomy guidance.
Conflicts of Interest
The authors declare no conflict of interest. The funders had no role in the design of the study; in the collection, analyses, or interpretation of data; in the writing of the manuscript, or in the decision to publish the results.
References
- Carroll, S.B. Chance and necessity: The evolution of morphological complexity and diversity. Nature 2001, 409, 1102–1109. [Google Scholar] [CrossRef] [PubMed]
- Whitman, D.W.; Agrawal, A.A.B. What is phenotypic plasticity and why is it important. In Phenotypic Plasticity of Insects: Mechanisms and Consequences, 1st ed.; Whitman, D.W., Ananthakrishnan, T.N., Eds.; CRC Press: Boca Raton, FL, USA, 2009; pp. 1–63. [Google Scholar]
- Hebert, P.D.; Penton, E.H.; Burns, J.M.; Janzen, D.H.; Hallwachs, W. Ten species in one: DNA barcoding reveals cryptic species in the neotropical skipper butterfly Astraptes fulgerator. Proc. Natl. Acad. Sci. USA 2004, 101, 14812–14817. [Google Scholar] [CrossRef] [PubMed] [Green Version]
- Bickford, D.; Lohman, D.J.; Sodhi, N.S.; Ng, P.K.; Meier, R.; Winker, K. Cryptic species as a window on diversity and conservation. Trends. Ecol. Evol. 2007, 22, 148–155. [Google Scholar] [CrossRef]
- Sáez, A.G.; Lozano, E. Body doubles. Nature 2005, 433, 111. [Google Scholar] [CrossRef] [PubMed]
- Pfenninger, M.; Schwenk, K. Cryptic animal species are homogeneously distributed among taxa and biogeographical regions. BMC. Evol. Biol. 2007, 7, 121. [Google Scholar] [CrossRef] [Green Version]
- Dayrat, B.; Gosliner, T.M. Species names and metaphyly: A case study in Discodorididae (Mollusca, Gastropoda, Euthyneura, Nudibranchia, Doridina). Zool. Scr. 2005, 34, 199–224. [Google Scholar] [CrossRef]
- Padial, J.M.; Miralles, A.; De la Riva, I.; Vences, M. The integrative future of taxonomy. Front. Zool. 2010, 7, 16. [Google Scholar] [CrossRef]
- Schlick-Steiner, B.C.; Steiner, F.M.; Seifert, B.; Stauffer, C.; Christian, E.; Crozier, R.H. Integrative taxonomy: A multisource approach to exploring biodiversity. Annu. Rev. Entomol. 2010, 55, 421–438. [Google Scholar] [CrossRef]
- Goldstein, P.Z.; DeSalle, R. Integrating DNA barcode data and taxonomic practice: Determination, discovery, and description. Bioessays 2011, 33, 135–147. [Google Scholar] [CrossRef]
- Riedel, A.; Sagata, K.; Suhardjono, Y.R.; Tänzler, R.; Balke, M. Integrative taxonomy on the fast track-towards more sustainability in biodiversity research. Front. Zool. 2013, 10, 15. [Google Scholar] [CrossRef] [Green Version]
- Pante, E.; Schoelinck, C.; Puillandre, N. From integrative taxonomy to species description: One step beyond. Syst. Biol. 2014, 64, 152–160. [Google Scholar] [CrossRef] [Green Version]
- Klingenberg, C.P. Evolution and development of shape: Integrating quantitative approaches. Nat. Rev. Genet. 2010, 11, 623–635. [Google Scholar] [CrossRef]
- Rohlf, F.J.; Slice, D. Extensions of the Procrustes method for the optimal superimposition of landmarks. Syst. Biol. 1990, 39, 40–59. [Google Scholar] [CrossRef] [Green Version]
- Bookstein, F.L. “Size and shape”: A comment on semantics. Syst. Zool. 1989, 38, 173–180. [Google Scholar] [CrossRef]
- Klingenberg, C.P. Morphometrics and the role of the phenotype in studies of the evolution of developmental mechanisms. Gene 2002, 287, 3–10. [Google Scholar] [CrossRef]
- Savriama, Y.; Gómez, J.M.; Perfectti, F.; Klingenberg, C.P. Geometric morphometrics of corolla shape: Dissecting components of symmetric and asymmetric variation in Erysimum mediohispanicum (Brassicaceae). New Phytol. 2012, 196, 945–954. [Google Scholar] [CrossRef]
- Klingenberg, C.P. Analyzing fluctuating asymmetry with geometric morphometrics: Concepts, methods, and applications. Symmetry 2015, 7, 843–934. [Google Scholar] [CrossRef] [Green Version]
- Benítez, H.A.; Lemic, D.; Püschel, T.A.; Gašparić, H.V.; Kos, T.; Barić, B.; Bažok, R.; Živković, I.P. Fluctuating asymmetry indicates levels of disturbance between agricultural productions: An example in Croatian population of Pterostichus melas melas (Coleptera: Carabidae). Zool. Anz. 2018, 276, 42–49. [Google Scholar] [CrossRef]
- Rufino, M.M.; Gaspar, M.B.; Pereira, A.M.; Vasconcelos, P. Use of shape to distinguish Chamelea gallina and Chamelea striatula (Bivalvia: Veneridae): Linear and geometric morphometric methods. J. Morphol. 2006, 267, 1433–1440. [Google Scholar] [CrossRef] [PubMed]
- Konan, K.M.; Adépo-Gourène, A.B.; Ouattara, A.; Nyingy, W.D.; Gourène, G. Morphometric variation among male populations of freshwater shrimp Macrobrachium vollenhovenii Herklots, 1851 from Côte d’Ivoire Rivers. Fish. Res. 2010, 103, 1–8. [Google Scholar] [CrossRef]
- Silva, I.C.; Alves, M.J.; Paula, J.; Hawkins, S.J. Population differentiation of the shore crab Carcinus maenas (Brachyura: Portunidae) on the southwest English coast based on genetic and morphometric analyses. Sci. Mar. 2010, 74, 435–444. [Google Scholar] [CrossRef]
- Loy, A.; Bertelletti, M.; Costa, C.; Ferlin, L.; Cataudella, S. Shape changes and growth trajectories in the early stages of three species of the genus Diplodus (Perciformes, Sparidae). J. Morphol. 2001, 250, 24–33. [Google Scholar] [CrossRef]
- Rodríguez-Mendoza, R.; Muñoz, M.; Saborido-Rey, F. Ontogenetic allometry of the bluemouth, Helicolenus dactylopterus dactylopterus (Teleostei: Scorpaenidae), in the Northeast Atlantic and Mediterranean based on geometric morphometrics. Hydrobiologia 2011, 670, 5–22. [Google Scholar] [CrossRef] [Green Version]
- Karanovic, I.; Lavtižar, V.; Djurakic, M. A complete survey of normal pores on a smooth shell ostracod (Crustacea): Landmark-based versus outline geometric morphometrics. J. Morphol. 2017, 278, 1091–1104. [Google Scholar] [CrossRef]
- Wrozyna, C.; Meyer, J.; Gross, M.; Ramos, M.I.F.; Piller, W.E. Definition of regional ostracod (Cytheridella) morphotypes by use of landmark-based morphometrics. Freshw. Sci. 2018, 37, 573–592. [Google Scholar] [CrossRef]
- Karanovic, T.; Djurakic, M.; Eberhard, S.M. Cryptic species or inadequate taxonomy? Implementation of 2D geometric morphometrics based on integumental organs as landmarks for delimitation and description of copepod taxa. Syst. Biol. 2016, 65, 304–327. [Google Scholar] [CrossRef] [Green Version]
- Karanovic, T.; Lee, S.; Lee, W. Instant taxonomy: Choosing adequate characters for species delimitation and description through congruence between molecular data and quantitative shape analysis. Invertebr. Syst. 2018, 32, 551–580. [Google Scholar] [CrossRef]
- Curatolo, T.; Calvaruso, C.; Galil, B.S.; Brutto, S.L. Geometric morphometry supports a taxonomic revision of the Mediterranean Bathyporeia guilliamsoniana (Spence Bate, 1857) (Amphipoda, Bathyporeiidae). Crustaceana 2013, 86, 820–828. [Google Scholar] [CrossRef] [Green Version]
- Zuykova, E.I.; Simonov, E.P.; Bochkarev, N.A. Comparative morphological and genetic analysis of populations and species of the genus Daphnia OF Müller, 1785 (Crustacea; Daphniidae) from Lake Glubokoe and Lake Chany. Biol. Bull. 2017, 44, 277–289. [Google Scholar] [CrossRef]
- Hurtado, L.A.; Mateos, M.; Santamaria, C.A. Phylogeography of supralittoral rocky intertidal Ligia isopods in the Pacific region from central California to central Mexico. PLoS ONE 2010, 5, e11633. [Google Scholar] [CrossRef] [PubMed]
- Eberl, R.; Mateos, M.; Grosberg, R.K.; Santamaria, C.A.; Hurtado, L.A. Phylogeography of the supralittoral isopod Ligia occidentalis around the Point Conception marine biogeographical boundary. J. Biogeogr. 2013, 40, 2361–2372. [Google Scholar] [CrossRef]
- Santamaria, C.A.; Mateos, M.; Taiti, S.; DeWitt, T.J.; Hurtado, L.A. A complex evolutionary history in a remote archipelago: Phylogeography and morphometrics of the Hawaiian endemic Ligia isopods. PLoS ONE 2013, 8, e85199. [Google Scholar] [CrossRef] [PubMed] [Green Version]
- Santamaria, C.A.; Mateos, M.; DeWitt, T.J.; Hurtado, L.A. Constrained body shape among highly genetically divergent allopatric lineages of the supralittoral isopod Ligia occidentalis (Oniscidea). Ecol. Evol. 2016, 6, 1537–1554. [Google Scholar] [CrossRef]
- Wägele, J.W. On the origin of the Microcerberidae (Crustacea: Isopoda). J. Zool. Syst. Evol. Res. 1983, 21, 249–262. [Google Scholar] [CrossRef]
- Karaman, S. Microcerberus stygius, der dritte Isopod aus dem Grundwasser von Skoplje, Jugoslavien. Zool. Anz. 1933, 102, 165–169. [Google Scholar]
- World Marine, Freshwater and Terrestrial Isopod Crustaceans Database. Available online: http://www.marinespecies.org/isopoda/ (accessed on 20 September 2020).
- Wägele, J.W.; Voelz, N.J.; McArthur, J. Older than the Atlantic Ocean: Discovery of a fresh water Microcerberus (Isopoda) in North America and erection of Coxicerberus, new genus. J. Crustacean Biol. 1995, 15, 733–745. [Google Scholar] [CrossRef]
- Albuquerque, E.F.; Meurer, B.; Netto, G.D.C.G. Effects of temperature and salinity on the survival rates of Coxicerberus ramosae (Albuquerque, 1978), an interstitial isopod of a Sandy Beach on the coast of Brazil. Braz. Arch. Biol. Technol. 2009, 52, 1179–1187. [Google Scholar] [CrossRef] [Green Version]
- Kim, J.; Malyutina, M.; Lee, W.; Karanovic, I. Incongruence between morphological and molecular diversity in Coxicerberus fukudai (Ito, 1974) (Isopoda: Microcerberidea) from East Asia. J. Crustacean. Biol. 2018, 38, 315–328. [Google Scholar] [CrossRef] [Green Version]
- Chappuis, P.A. Un nouvel isopode psammique du Maroc: Microcerberus remyi. Vie et Milieu 1953, 4, 659–663. [Google Scholar]
- Lang, K. Contributions to the knowledge of the genus Microcerberus Karaman (Crustacea, Isopoda) with a description of a new species from the central California coast. Ark. Zool. 1961, 13, 493–510. [Google Scholar]
- Messana, G.; Argano, R.; Baldari, F. Microcerberus (Crustacea Isopoda Microcerberidea) from the Indian Ocean. Monit. Zool. Ital. Suppl. 1978, 10, 69–79. [Google Scholar] [CrossRef]
- Baldari, F.; Argano, R. Description of a new species of Microcerberus from the South China Sea and a proposal for a revised classification of the Microcerberoidea (Isopoda). Crustaceana 1984, 46, 113–126. [Google Scholar] [CrossRef]
- Fish, S. The setae of Eurydice pulchra (Crustacea: Isopoda). J. Zool. 1972, 166, 163–177. [Google Scholar] [CrossRef]
- Oshel, P.E.; Steele, V.J.; Steele, D.H. Comparative SEM morphology of amphipod microtrich sensilla. Crustaceana. Suppl. 1988, 13, 100–106. [Google Scholar]
- Derby, C.D. Physiology of sensory neurons in morphologically identified cuticular sensilla of crustaceans. In Functional Morphology of Feeding and Grooming in Crustacea, 1st ed.; Felgenhauer, B.E., Watling, L., Thistle, A.B., Eds.; CRC Press: Boca Raton, FL, USA, 1989; pp. 27–47. [Google Scholar]
- Mauchline, J. The integumental sensilla and glands of pelagic Crustacea. J. Mar. Biol. Assoc. UK 1977, 57, 973–994. [Google Scholar] [CrossRef]
- Elofsson, R.; Hessler, R.R. Sensory structures associated with the body cuticle of Hutchinsoniella macracantha (Cephalocarida). J. Crustacean. Biol. 1994, 14, 454–462. [Google Scholar] [CrossRef]
- Boundrias, M.A.; Pires, J. Unusual sensory setae of the raptorial Branchinecta gigas (Branchiopoda: Anostraca). Hydrobiologia 2002, 486, 19–27. [Google Scholar] [CrossRef]
- Meisch, C.; Wouters, K. Valve surface structure of Candona neglecta Sars, 1887 (Crustacea, Ostracoda). Studia Quat. 2004, 21, 15–18. [Google Scholar]
- Zimmer, A.R.; Araujo, P.B.; Buckup, G.B. Diversity and arrangement of the cuticular structures of Hyalella (Crustacea: Amphipoda: Dogielinotidae) and their use in taxonomy. Zoologia 2009, 26, 127–142. [Google Scholar] [CrossRef] [Green Version]
- Karanovic, T.; Kim, K. Suitability of cuticular pores and sensilla for harpacticoid copepod species delineation and phylogenetic reconstruction. Arthropod. Struct. Dev. 2014, 43, 615–665. [Google Scholar] [CrossRef]
- Khalaji-Pirbalouty, V. The morphology, arrangement, and ultrastructure of a new type of microtrich sensilla in marine isopods (Crustacea, Isopoda). Zool. Stud. 2014, 53, 7. [Google Scholar] [CrossRef] [Green Version]
- Wilson, G.D.F. Functional morphology and evolution of isopod genitalia. In Crustacean Sexual Biology, 1st ed.; Raymond, T.B., Joel, W.M., Eds.; Columbia University Press: New York, NY, USA, 1991; pp. 228–245. [Google Scholar]
- Masly, J.P. 170 years of “lock-and-key”: Genital morphology and reproductive isolation. Int. J. Evol. Biol. 2012, 247352, 1–10. [Google Scholar] [CrossRef] [Green Version]
- Altschul, S.F.; Gish, W.; Miller, W.; Myers, E.W.; Lipman, D.J. Basic local alignment search tool. J. Mol. Biol. 1990, 215, 403–410. [Google Scholar] [CrossRef]
- GenBank. Nucleic Acids Research 36(Database):D25–D30. Available online: https://doi.org/10.1093/nar/gkm929 (accessed on 21 September 2020).
- Katoh, K.; Standley, D.M. MAFFT multiple sequence alignment software version 7: Improvements in performance and usability. Mol. Biol. Evol. 2013, 30, 772–780. [Google Scholar] [CrossRef] [Green Version]
- Leigh, J.W.; Bryant, D. POPART: Full-feature software for haplotype network construction. Methods Ecol. Evol. 2015, 6, 1110–1116. [Google Scholar] [CrossRef]
- Trifinopoulos, J.; Nguyen, L.T.; von Haeseler, A.; Minh, B.Q. W-IQ-TREE: A fast online phylogenetic tool for maximum likelihood analysis. Nucleic Acids Res. 2016, 44, W232–W235. [Google Scholar] [CrossRef] [PubMed] [Green Version]
- Rohlf, F.J. The tps series of software. Hystrix 2015, 26. [Google Scholar] [CrossRef]
- Bookstein, F.L. Morphometric Tools for Landmark Data: Geometry and Biology, 1st ed.; Cambridge University Press: Cambridge, UK, 1991. [Google Scholar]
- Rohlf, F.J. tpsDig Version 2.16; Department of Ecology and Evolution, State University of New York Stony Brook: New York, NY, USA, 2010. [Google Scholar]
- Klingenberg, C.P.; Barluenga, M.; Meyer, A. Shape analysis of symmetric structures: Quantifying variation among individuals and asymmetry. Evolution 2002, 56, 1909–1920. [Google Scholar] [CrossRef] [PubMed] [Green Version]
- Klingenberg, C.P. MorphoJ: An integrated software package for geometric morphometrics. Mol. Ecol. Resour. 2011, 11, 353–357. [Google Scholar] [CrossRef] [PubMed]
- Cardini, A. Lost in the other half: Improving accuracy in geometric morphometric analyses of one side of bilaterally symmetric structures. Syst. Biol. 2016, 65, 1096–1106. [Google Scholar] [CrossRef]
- Brusatte, S.L.; Sakamoto, M.; Montanari, S.; Harcourt-Smith, W.E.H. The evolution of cranial form and function in theropod dinosaurs: Insights from geometric morphometrics. J. Evol. Biol. 2012, 25, 365–377. [Google Scholar] [CrossRef] [PubMed] [Green Version]
- Mitteroecker, P.; Gunz, P.; Windhager, S.; Schaefer, K. A brief review of shape, form, and allometry in geometric morphometrics, with applications to human facial morphology. Hystrix 2013, 24, 59–66. [Google Scholar] [CrossRef]
- Spitzer, M.; Wildenhain, J.; Rappsilber, J.; Tyers, M. BoxPlotR: A web tool for generation of box plots. Nat. Methods 2014, 11, 121. [Google Scholar] [CrossRef] [PubMed]
- Klingenberg, C.P.; McIntyre, G.S. Geometric morphometrics of developmental instability: Analyzing patterns of fluctuating asymmetry with Procrustes methods. Evolution 1998, 52, 1363–1375. [Google Scholar] [CrossRef] [PubMed]
- Monteiro, L.R. Multivariate regression models and geometric morphometrics: The search for causal factors in the analysis of shape. Syst Biol. 1999, 48, 192–199. [Google Scholar] [CrossRef] [Green Version]
- Klingenberg, C.P. Size, shape, and form: Concepts of allometry in geometric morphometrics. Dev. Genes Evol. 2016, 226, 113–137. [Google Scholar] [CrossRef]
- Ponssa, M.L.; Candioti, M.F.V. Patterns of skull development in anurans: Size and shape relationship during postmetamorphic cranial ontogeny in five species of the Leptodactylus fuscus Group (Anura: Leptodactylidae). Zoomorphology 2012, 131, 349–362. [Google Scholar] [CrossRef]
- Good, P. Permutation Tests: A Practical Guide to Resampling Methods for Testing Hypotheses, 2nd ed.; Springer: Berlin, Germany, 2013. [Google Scholar]
- Klingenberg, C.P.; Monteiro, L.R. Distances and directions in multidimensional shape spaces: Implications for morphometric applications. Syst. Biol. 2005, 54, 678–688. [Google Scholar] [CrossRef] [Green Version]
- Timm, N.H. Applied Multivariate Analysis, 1st ed.; Springer: Berlin, Germany, 2002. [Google Scholar]
- Gould, S.J. Allometry and size in ontogeny and phylogeny. Biol. Rev. 1966, 41, 587–638. [Google Scholar] [CrossRef]
- Karaman, S.L. Über eine neue Microcerberus-art aus dem Küstengrundwasser der Adria. Fragm. Balc. 1955, 141–148. [Google Scholar]
- Pennak, R.W. A new micro-isopod from a Mexican marine beach. Trans. Am. Microsc. Soc. 1958, 77, 298–303. [Google Scholar] [CrossRef]
- Ito, T. A new species of marine interstitial isopod of the genus Microcerberus from Hokkaido. J. Fac. Sci. Hokkaido Univ. Ser. VI. Zool. 1974, 19, 338–348. [Google Scholar]
- Ito, T. A new species of marine interstitial isopod of the genus Microcerberus from the Bonin Island. Annot. Zool. Jpn. 1975, 48, 119–128. [Google Scholar]
- Martin, C.H. Strong assortative mating by diet, color, size, and morphology but limited progress toward sympatric speciation in a classic example: Cameroon crater lake cichlids. Evolution 2013, 67, 2114–2123. [Google Scholar] [CrossRef]
- Swaileh, K.M.; Adelung, D. Effect of body size and season on the concentrations of Cu, Cd, Pb and Zn in Diastylis rathkei (kröyer)(Crustacea: Cumacea) from Kiel Bay, Western Baltic. Mar. Pollut. Bull. 1995, 31, 103–107. [Google Scholar] [CrossRef]
- Panov, V.E.; McQueen, D.J. Effects of temperature on individual growth rate and body size of a freshwater amphipod. Can. J. Zool. 1998, 76, 1107–1116. [Google Scholar] [CrossRef]
- Hanamura, Y.; Siow, R.; Chee, P.E.; Kassim, F.M. Seasonality and biological characteristics of the shallow-water mysid Mesopodopsis orientalis (Crustacea: Mysida) on a tropical sandy beach, Malaysia. Plankton. Benthos. Res. 2009, 4, 53–61. [Google Scholar] [CrossRef]
- Hart, R.C.; Bychek, E.A. Body size in freshwater planktonic crustaceans: An overview of extrinsic determinants and modifying influences of biotic interactions. Hydrobiologia 2011, 668, 61–108. [Google Scholar] [CrossRef]
- Puri, H.S. Normal pores and the phylogeny of Ostracoda. Geosci. Man. 1974, 6, 137–151. [Google Scholar]
- Mauchline, J. Taxonomic value of pore pattern in the integument of calanoid copepods (Crustacea). J. Zool. 1988, 214, 697–749. [Google Scholar] [CrossRef]
- Tsukagoshi, A. Ontogenetic change of distributional patterns of pore systems in Cythere species and its phylogenetic significance. Lethaia 1990, 23, 225–241. [Google Scholar] [CrossRef]
- Olesen, J. External morphology and phylogenetic significance of the dorsal/neck organ in the Conchostraca and the head pores of the cladoceran family Chydoridae (Crustacea, Branchiopoda). Hydrobiologia 1996, 330, 213–226. [Google Scholar] [CrossRef]
- Haller, B.C.; Hendry, A.P. Solving the paradox of stasis: Squashed stabilizing selection and the limits of detection. Evolution 2014, 68, 483–500. [Google Scholar] [CrossRef] [PubMed]
- Wägele, J.W. On a new Microcerberus from the Red Sea and the relationship of the Microcerberidea to the Anthuridea (Crustacea, Isopoda). Zool. Scr. 1982, 11, 281–286. [Google Scholar] [CrossRef]
- Platvoet, D. Slide-line organ in gammarid (Crustacea: Amphipoda). Beaufortia 1985, 35, 129–133. Available online: http://www.repository.naturalis.nl/record/505044 (accessed on 10 January 2021).
- Brandt, A. Morphology and ultrastructure of the sensory spine, a presumed mechanoreceptor of Sphaeroma hookeri (Crustacea, Isopoda), and remarks on similar spines in other peracarids. J. Morphol. 1988, 198, 219–229. [Google Scholar] [CrossRef] [PubMed]
- Escobar, E.; Oseguera, L.; Nin, G.H.V.; Alcocer, J. The external micro-anatomy of the cephalon of the asellotan isopod Craseriella anops. Hydrobiologia 2002, 467, 57–62. [Google Scholar] [CrossRef]
- Karanovic, T.; Bláha, M. Taming extreme morphological variability through coupling of molecular phylogeny and quantitative phenotype analysis as a new avenue for taxonomy. Sci. Rep. 2019, 9, 1–15. [Google Scholar] [CrossRef] [PubMed]
- Holdich, D.M. Reproduction, growth and bionomics of Dynamene bidentata (Crustacea: Isopoda). J. Zool. 1968, 156, 137–153. [Google Scholar] [CrossRef]
- Jones, M.B.; Naylor, E. Breeding and bionomics of the British members of the Jaera albifrons group of species (Isopoda: Asellota). J. Zool. 1971, 165, 183–199. [Google Scholar] [CrossRef]
- Heath, D.J.; Khazaeli, A.A. Population dynamics of the estuarine isopod Sphaeroma rugicauda. Estuar. Coast. Shelf. Sci. 1985, 20, 105–116. [Google Scholar] [CrossRef]
- Steele, D.H.; Steele, V.J. The biology of Jaera spp. (Crustacea, Isopoda) in the northwestern Atlantic. 1. Jaera ischiosetosa. Can. J. Zool. 1972, 50, 205–211. [Google Scholar] [CrossRef]
- Sota, T.; Kubota, K. Genital lock-and-key as a selective agent against hybridization. Evolution 1998, 52, 1507–1513. [Google Scholar] [CrossRef]
- Markmann, M.; Tautz, D. Reverse taxonomy: An approach towards determining the diversity of meiobenthic organisms based on ribosomal RNA signature sequences. Philos. Trans. R. Soc. B 2005, 360, 1917–1924. [Google Scholar] [CrossRef] [PubMed] [Green Version]
- Cerca, J.; Purschke, G.; Struck, T.H. Marine connectivity dynamics: Clarifying cosmopolitan distributions of marine interstitial invertebrates and the meiofauna paradox. Mar. Biol. 2018, 165, 1–21. [Google Scholar] [CrossRef] [Green Version]
Figure 1.
Coxicerberus fukudai digitized pencil drawings. Left panel shows an adult male habitus (NIBRIV0000000000), scale bar: 100 µm. (A) Dorsal view of cephalothorax, sensilla distributions are marked with red circles, scale bar: 50 µm; (B) dorsal view of pleon, pleonal points are marked with red circles, scale bar: 50 µm; (C) scanning electron microscope image of pleon, white arrow indicates pleopod II endopodite; (D) pleopod II endopodite excluding appendix masculina pencil image, right panel shows close up image of digitizing points with red marks.

Figure 2.
Map of Korea displaying the spatial distribution of C. fukudai complex individuals employed in the study. (A) The relationship between the Cytb haplotypes of C. fukudai is shown, vertical parallel lines of network represent the number of substitutions; (B) maximum-likelihood (ML) phylogram using Cytb sequences; scale shows substitutions per site, bootstrap values of terminal nodes are excluded, and the locality names with accession code indicate the GenBank sequences hired for the analysis.

Figure 3.
Box plot based on centroid size of sensilla distribution and pleonal points. (A) Box plot of sensilla distribution; (B) box plot of pleonal points. The numbers along the vertical axis indicate the centroid size. The initials along the horizontal axis indicate the group examined; FG: females Gazin, MG: males Gazin, FS: females Sokcho, MS: males Sokcho, FD: females Dongho, MD: males Dongho, FT: females Detan, MT: males Detan, FJ: female Jangsa, MJ: males Jangsa, FI: females Imrang, and MI: males Imrang. The numbers in parentheses indicate the numbers of individuals from each population. Center lines in the boxes show the medians, box limits indicate the 25th and 75th percentiles, whiskers extend 1.5 times the interquartile range from the 25th and 75th percentiles, and outliers are represented by dots.

Figure 4.
Principal component analysis on the residuals of sensilla distribution (SD) and pleonal points (PP) shape coordinates and wire frame images. (A) Scatter plot classified by lineage on the female SD dataset, both axes indicate principal component I and II, respectively; (B) scatter plot classified by population on the female SD dataset; (C) SD shape change (blue line) against mean shape (red line) according to the corresponded shape scores, the digitized landmarks are indicated by the numbers; (D) scatter plot classified by lineage on the female PP; (E) scatter plot classified by population on the female PP; (F) PP shape change (blue line) against mean shape (red line) according to the corresponding shape scores.

Figure 5.
Principal component analysis on the residuals of pleopod II endopodite (PE) shape coordinates and wire frame images. Confidence ellipses represent 0.9 probability. (A) Scatter plot of PE dataset classified by lineage, both axes indicate principal component I and II, respectively; (B) scatter plot of PE dataset classified by population; (C) pattern of PC1 shape changes in wire frame corresponding to the shape scores (right: −0.2, lineage A; left: 0.2, lineage B).


Table 1.
Summary of image numbers included in the landmark-based geometric morphometrics (LBGM) analyses. The alphabets represent classifiers as (A) lineage A; (B) lineage B; (F) female; (M) male.
Table 1.
Summary of image numbers included in the landmark-based geometric morphometrics (LBGM) analyses. The alphabets represent classifiers as (A) lineage A; (B) lineage B; (F) female; (M) male.
| Sensilla Distribution (SD) | Pleonal Points (PP) | Pleopod II Endopodite (PE) | |||
|---|---|---|---|---|---|
| Gazin | A | F | 27 | 18 | – |
| M | 11 | 19 | 8 | ||
| Sokcho | A | F | 9 | 9 | – |
| M | 11 | 11 | 20 | ||
| Dongho | A | F | 10 | 21 | – |
| M | 10 | 10 | 13 | ||
| Detan | B | F | 11 | 16 | – |
| M | 16 | 14 | 19 | ||
| Jangsa | B | F | 43 | 20 | – |
| M | 12 | 19 | 28 | ||
| Imrang | B | F | 11 | 19 | – |
| M | 9 | 9 | 3 | ||
| Total | 180 | 185 | 91 |
Table 2.
Size and shape variation of sensilla distribution, pleonal points, and pleopod II endopodite inferred by Procrustes ANOVA where a randomized permutation procedure was applied (10,000 iterations). F: Goodall’s F critical value, p: probability of finding a randm value larger than the observed value.
| Sensilla Distribution (SD) | Pleonal Points (PP) | Pleopod II Endopodite (PE) | ||
|---|---|---|---|---|
| F/p | F/p | F/p | ||
| Size | Sex | 0.17/0.6849 | 89.17/0.0001 | n/a |
| Lineage | 11.96/0.0007 | 0.65/0.4217 | 13.48/0.0001 | |
| Individual | 92,695.9/0.0001 | 2,833,490.9/0.0001 | 1118.6/0.0001 | |
| Digitizing | n/a | n/a | n/a | |
| Shape | Sex | 4.03/0.0005 | 54.2/0.0001 | n/a |
| Lineage | 5.18/0.0001 | 1.5/0.1746 | 29.16/0.0001 | |
| Individual | 2.43/0.0001 | 5.06/0.0001 | 232.52/0.0001 | |
| Digitizing | n/a | n/a | n/a | |
Table 3.
Classification of individuals based on the PE mean shape comparison. The percentage indicates the correct classification rate of each group based on the cross-validation scores from discriminant function analysis (DFA).
Table 3.
Classification of individuals based on the PE mean shape comparison. The percentage indicates the correct classification rate of each group based on the cross-validation scores from discriminant function analysis (DFA).
| Lineage A | Lineage B | Classification Rate | |
|---|---|---|---|
| Lineage A | 34 | 7 | 82.9%, p < 0.0001 |
| Lineage B | 6 | 44 | 88%, p < 0.0001 |
Table 4.
Comparison of PE mean shape variation between populations from canonical variate analysis (CVA). Left score: Mahalanobis distance; right score: probability of finding a random value larger than the observed value.
Table 4.
Comparison of PE mean shape variation between populations from canonical variate analysis (CVA). Left score: Mahalanobis distance; right score: probability of finding a random value larger than the observed value.
| Gazin | Sokcho | Dongho | Detan | Jangsa | |
|---|---|---|---|---|---|
| Sokcho | 1.6155/0.0555 | ||||
| Dongho | 1.5967/0.0593 | 1.0404/0.2352 | |||
| Detan | 3.0128/0.0001 | 2.2330/0.0001 | 2.2255/0.0003 | ||
| Jangsa | 3.4647/0.0001 | 2.6135/0.0001 | 3.1110/0.0001 | 2.3830/0.0001 | |
| Imrang | 3.3354/0.0432 | 2.7549/0.0178 | 2.5354/0.0296 | 2.6591/0.0451 | 3.1664/0.0053 |
Publisher’s Note: MDPI stays neutral with regard to jurisdictional claims in published maps and institutional affiliations. |
© 2021 by the authors. Licensee MDPI, Basel, Switzerland. This article is an open access article distributed under the terms and conditions of the Creative Commons Attribution (CC BY) license (http://creativecommons.org/licenses/by/4.0/).
Share and Cite
MDPI and ACS Style
Kim, J.; Kim, J.; Lee, W.; Karanovic, I. The First Insight into the Patterns of Size and Shape Variation of a Microcerberid Isopod. Water 2021, 13, 515. https://doi.org/10.3390/w13040515
AMA Style
Kim J, Kim J, Lee W, Karanovic I. The First Insight into the Patterns of Size and Shape Variation of a Microcerberid Isopod. Water. 2021; 13(4):515. https://doi.org/10.3390/w13040515
Chicago/Turabian StyleKim, Jeongho, Jaehyun Kim, Wonchoel Lee, and Ivana Karanovic. 2021. "The First Insight into the Patterns of Size and Shape Variation of a Microcerberid Isopod" Water 13, no. 4: 515. https://doi.org/10.3390/w13040515
Note that from the first issue of 2016, this journal uses article numbers instead of page numbers. See further details here.