
Identifying the Mechanisms behind the Positive Feedback Loop between Nitrogen Cycling and Algal Blooms in a Shallow Eutrophic Lake


1
School of Environment, Nanjing Normal University, Nanjing 210023, China
2
Jiangsu Center for Collaborative Innovation in Geographical Information Resource Development and Application, Nanjing 210023, China
3
Green Economy Development Institute, Nanjing University of Finance and Economics, Nanjing 210023, China
4
Jiangsu Engineering Lab of Water and Soil Eco-Remediation, Nanjing Normal University, Nanjing 210023, China
*
Author to whom correspondence should be addressed.
Water 2021, 13(4), 524; https://doi.org/10.3390/w13040524
Submission received: 25 December 2020
/
Revised: 9 February 2021
/
Accepted: 13 February 2021
/
Published: 18 February 2021
(This article belongs to the Special Issue The Impact of Climate Change and Human Activities on Aquatic Environments)
Abstract
:Algal blooms have increased in frequency, intensity, and duration in response to nitrogen (N) cycling in freshwater ecosystems. We conducted a high-resolution sedimentary study of N transformation and its associated microbial activity in Lake Taihu to assess the accumulation rates of the different N fractions in response to algal blooms, aiming to understand the mechanisms of N cycling in lacustrine environments. Downcore nitrification and denitrification processes were measured simultaneously in situ via diffusive gradients in thin-films technique, peeper, and microelectrode devices in a region of intensified algal blooms of shallow lake. The decomposition of different biomasses of algal blooms did not change the main controlling factor on different N fractions in profundal sediment. However, the decomposition of different algal biomasses led to significant differences in the nitrification and denitrification processes at the sediment–water interface (SWI). Low algal biomasses facilitated the classic process of N cycling, with the balanced interaction between nitrification and denitrification. However, the extreme hypoxia under high algal biomasses significantly limited nitrification at the SWI, which in turn, restricted denitrification due to the lack of available substrates. Our high-resolution results combined with estimates of apparent diffusion fluxes of the different N fractions inferred that the lack of substrates for denitrification was the main factor influencing the positive feedback loop between N and eutrophication in freshwater ecosystems. Moreover, this positive feedback can become irreversible without technological intervention.
1. Introduction
During the last few centuries, the over-enrichment of anthropogenic nutrients has enhanced eutrophication and increased the magnitude and frequency of algal blooms in aquatic ecosystems. Algal blooms have directly affected drinking water supplies, which has further impacted aquaculture and tourism development [1,2,3]. Lake eutrophication and algal blooms occur in response to overloaded nutrient concentrations in the water column—particularly nitrogen (N) [4,5]. Continuous N accumulation in lakes alters sediment functioning from its sink to source, which further influences the occurrence of algal blooms [6,7]. Therefore, understanding the N loads and its sediment distribution are vital for managing freshwater eutrophication.
Several investigations have identified the “positive feedback cycle” between the labile N fractions, microhabitat, dissolved organic matter (DOM), and algal blooms [8,9]. Increasing N concentration promotes a surge in algal growth (algal bloom), which alters the physicochemical properties, e.g., dissolved oxygen (DO), pH, mechanical composition, and electrical conductivity (Eh) at the sediment water interface (SWI); this subsequently influences the content of N fractions and the composition and activity of microbial communities [10]. Following the collapse of algal blooms, intensive sedimentation and microbial decomposition rapidly exhaust the DO concentrations from the SWI to the profundal sediment, resulting in a highly anoxic microenvironment. These anaerobic conditions at the SWI facilitate the growth of algal blooms in the overlying water, which also shifts the balance between nitrification and denitrification [11,12]. Microorganisms play a significant role in the N biogeochemical cycles of freshwater systems. The combination of ubiquitous nitrification and denitrification processes facilitates both N deposition and removal [13]. Nitrification includes the biological oxidation of ammonium (NH4+-N) to nitrite (NO2−-N) as well as the oxidation of nitrite (NO2−-N) to nitrate (NO3−-N); it also provides the substrates for denitrification. Denitrification is an essential process, as it manipulates and transforms almost all N fractions and directly influences N accumulation rates [14]. Moreover, microorganisms prefer to utilize exogenous nitrate and, therefore, reduce N removal rates in freshwater ecosystems [15]. Additionally, algal residues diffuse into the SWI and largely impact DOM components in the sediment and overlying water [16]. DOM is an important index that indicates the conversion percentage of dissolved organic nitrogen (DON) to inorganic N [17]. Algal decomposition also supplies significant amounts of DOM for heterotrophic denitrifiers [18]. Moreover, previous investigations have demonstrated that the bacterial community composition and functional varied during algae-derived organic matter degradation [19]. Subsequently, the released DOM from algal blooms can positively and negatively impact on nitrification and denitrification processes [20]. It is, therefore, necessary to investigate the variations in N deposition and removal rates, microhabitats, and the distribution of DOM components in sediment profiles to quantify the relationship between N transformation and its associated microbial activity during algal blooms.
The SWI controls the distribution, migration, transformation, and regression of contaminants in freshwater systems [21]. A series of complex chemical and biological reactions at the SWI influences the concentration gradients, diffusion, and deposition of N. The SWI connects the sediment with the overlying water and can provide insights into the N biogeochemical cycle in eutrophic freshwater ecosystems. Algal decomposition releases labile N fractions, leading to the heterogenous distribution of concentrated N in the SWI [22]. This concentrated mass of N then diffuses to the profundal sediment and seasonally migrates to the overlying water under appropriate conditions, further stimulating algal bloom events. However, traditional ex situ sampling techniques are unable to accurately reflect the variability of the different labile N fraction concentrations as well as the nitrification and denitrification processes at different sediment depths (from the SWI to the profundal sediment). Therefore, in situ sampling techniques are necessary to assess N migration and transformation at the SWI during the decomposition of algal blooms. Subsequently, the diffusive gradients in thin-films technique (DGT), high-resolution dialysis (HR-peeper), and microsensor systems were applied to obtain high-resolution contamination information of the different N fractions [23,24].
Different studies have focused on algal blooms formation, nutrient cycling, water quality degradation, and compound identification through tastes and odors [25,26,27]. However, high-resolution studies on the different N fractions in sediment profiles for determining nitrification and denitrification processes are scarce—especially during algal decomposition. Furthermore, studies have observed the increasing frequency of freshwater eutrophication events in response to the unprecedented rates of climate warming [28]. However, it is still unclear whether the increasing N accumulation rates occurred in response to global warming or the microbial degradation of freshwater DOM. In this study, we assessed N transformation (nitrification and denitrification) and associated microbial activity in Lake Taihu—a typical shallow and eutrophic freshwater lake in China—to identify the mechanisms of N deposition and removal rates influenced by algal blooms. AMP-TH DGT (EasySensor Ltd., Nanjing, China) simultaneously measured the sediment nitrification and denitrification rates in an area of high-frequency algal blooms occurrence during summer. The objectives of this study were to (1) produce sedimentary profiles of the different N fractions under the decomposition of different algal biomasses, (2) determine the nitrification and denitrification variability with sediment depth and identify the dominant environmental factors controlling these processes, and (3) understand the interactive mechanisms between algal decomposition and N accumulation and removal in shallow eutrophic lakes. Our results contribute to understand the main factors influencing the frequency, intensity, and duration of algal blooms, which is necessary for preventing severe eutrophication in freshwater ecosystems.
2. Materials and Methods
2.1. Study Area and Field Surveys
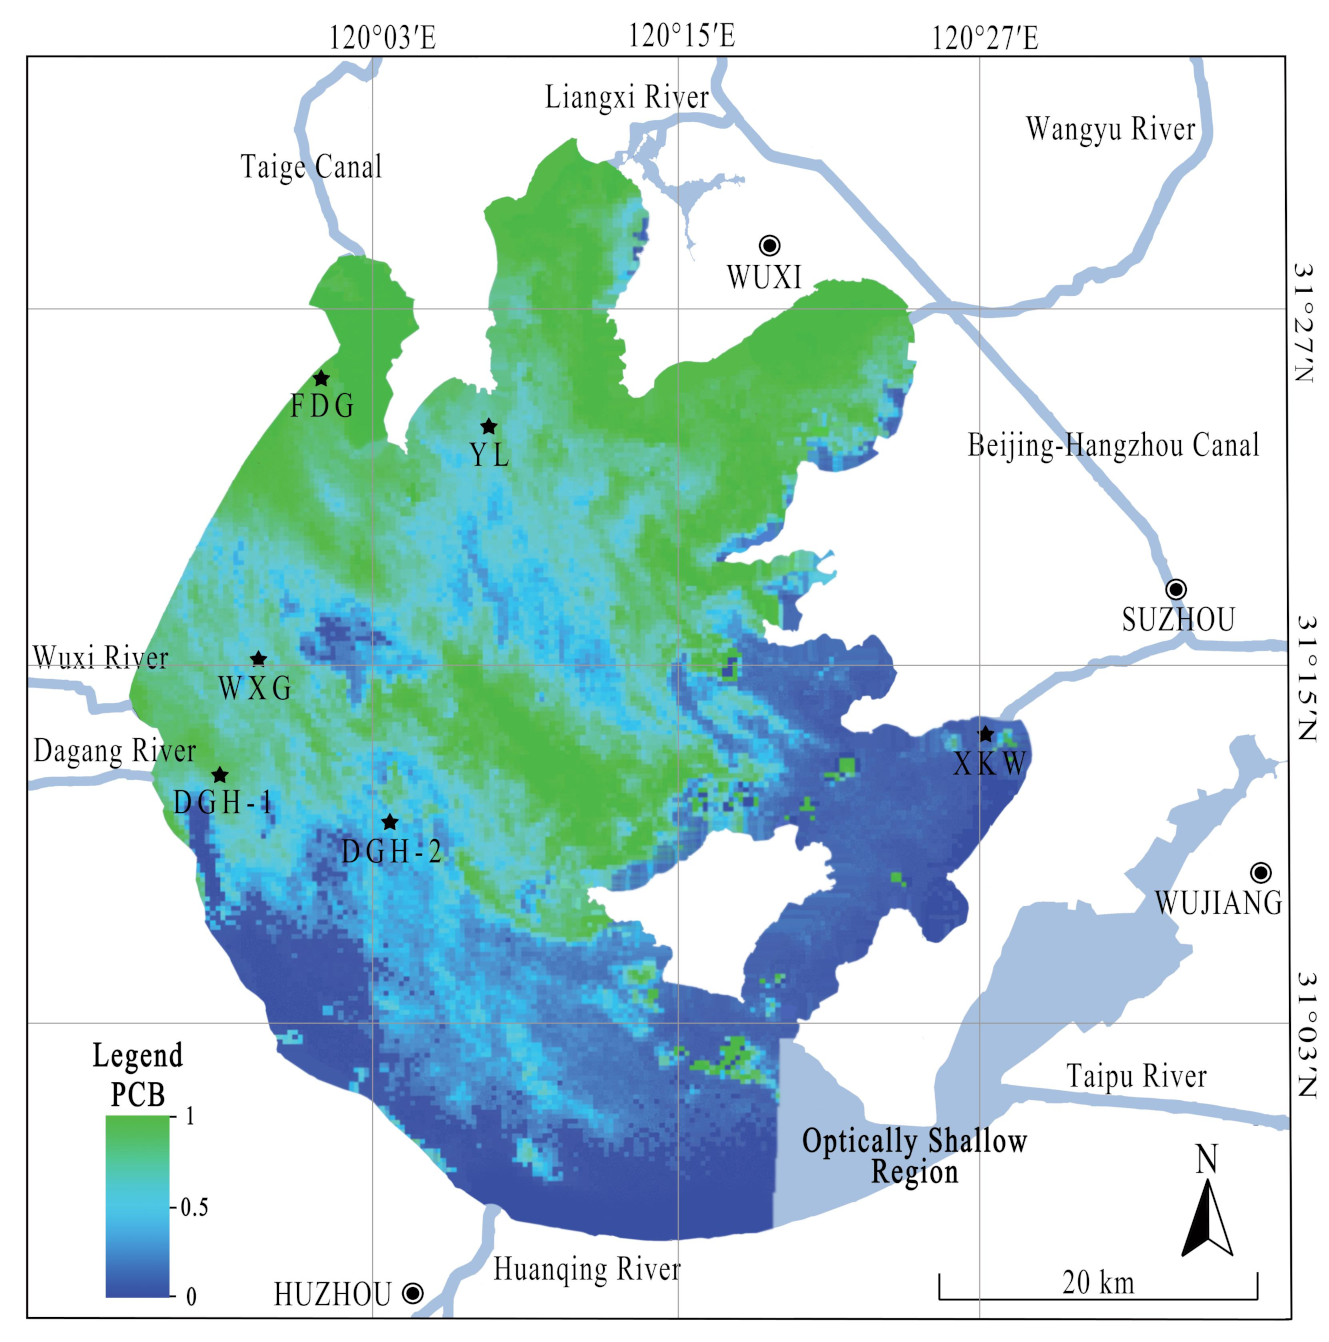
Lake Taihu, the third largest freshwater lake in China, is a typical shallow lake with an area of 2338 km2. The lake is both the main source of drinking water for the local population (~10 million people) and a repository for agricultural and industrial waste due to recent rapid economic growth [2]. Therefore, Lake Taihu is a prime location for investigating the impacts of algal blooms on labile N deposition and removal in freshwater systems. Lake Taihu has experienced numerous ecological problems since the 1960s, particularly from eutrophication and algal blooms events [29]. Consequently, this research focused on the effects of algal blooms on N-transforming microorganisms in Lake Taihu sediments. Accordingly, five representative sampling sites in the lake were selected and combined with that of our previous studies [30]. The five sampling sites were evenly distributed across the western side of Lake Taihu (Table S1). Wind-driven currents are dominant and ubiquitous hydrodynamic characteristics of shallow lakes; therefore, sites FDG and YL were located in the north of the lake (Figure 1). Wind-driven currents control algal distribution in lentic areas by the horizontal movement of surface waves. Thus, algal blooms are typically concentrated at the downwind shore. Sampling sites WXG, DGH-1, and DGH-2 were located in the western lake, which was dominated by both grass and algal blooms. Site XKW was located in the eastern lake, which had high abundances of submerged macrophytes and low abundances of cyanobacteria. Chlorophyll-a (Chl-a) was determined spectrophotometrically after extraction in 90% acetone (24 h in the dark at 4 ℃). The labile sediment profile concentrations of NH4+-N and NO3−-N were obtained by the in situ application of AMP-TH DGT. The DGT and HR-Peeper deployment device are shown in the Supplementary Information (Figure S1).
2.2. Experimental Setup
Sediment cores (SWI—15 cm depth) were collected from a flat gradient with a customized gravity corer (8 cm inner diameter). The samples were transported to the laboratory within 4 h of collection in a vertical position to minimize the disturbance of the SWI. The cores from each site were then transferred into an annular flume (Figure S2) at the laboratory. We simulated the natural conditions by continually aerating the overlying water with blowers to maintain oxygen saturation and water circulation. The cores were incubated in a greenhouse at room temperature and stabilized overnight (14 h).
2.3. Sediment Profile Measurements
2.3.1. In Situ Measurements
pH and oxidation-reduction potential (ORP) values of the sediment samples were measured using a miniaturized Clark-type microsensor (Unisense, Aarhus, Denmark). The output current was measured using a picoampere meter (PA2000, Unisense), which simultaneously maintained the polarization of the cathode against the internal reference. The sensors had a tip diameter of 100 μm and a 90% response time of less than 10 s. The responses of the pH and ORP sensors were calibrated at the experimental temperature (25 °C) using the output current in three different pH buffers and redox potential buffers, respectively.
DO, nitrous oxide (N2O), and nitric oxide (NO) concentrations were measured using amperometric microsensors. Clark-type microsensors were equipped with an internal reference and a guard cathode [32,33]. Driven by the external pressure, DO and N2O from the environment penetrates through the sensor tip membrane and is reduced at the cathode surface. Correspondingly, NO from the environment penetrates the sensor tip membrane and reaches the anode surface where it is oxidized. O2, N2O, and NO sensors were calibrated with aqueous solutions of gases with a gradient concentration of 0–257.8, 0–19, and 0–5 μM for O2, N2O, and NO, respectively. The slope of the oxygen profile steadily increased to a maximum within the first millimeter below the initial concentration decrease; the position of this maximum gradient is considered the SWI according to Rabouille et al. [34]. All microelectrode sensors were prepolarized and adjusted to a suitable state prior to measurement. All sensor profile measurements were conducted at depth intervals of less than the diameter of the corresponding penetrating sensors, and the measurements were controlled using the μ-Profiler software. The detailed procedures are in accordance with the published methods [35,36].
2.3.2. DGT Probe Measurements of Ammonium, Nitrate, and Fe (II)
In this study, AMP-TH DGTs were used to simultaneously measure NH4+-N and NO3−-N concentrations. Chelex-100 DGTs were applied to assess the variations in Fe (II) concentrations, which may reflect changes in the redox environment [37,38]. The components of each technique were prepared and assembled according to the methods published by Xu et al. [39]. The Chelex-100 DGTs were stored under nitrogen conditions for more than 16 h and then placed in 0.03 M NaNO3 solution until device deployment to avoid the target accumulation of resin gels in the sediment probes. This deoxygenated process was not conducted for the AMP-TH DGTs to prevent the interference effect of nitrogen. Furthermore, the diffusion gels in the AMP-TH DGTs and Chelex-100 DGTs were elliptical to reduce the lateral diffusion of target elements and increase the vertical resolution during the DGT measurements. A thinner diffusive layer facilitates the accumulation rate of DGT during the deployment. The AMP-TH DGT and Chelex-100 DGT analysis procedure followed the process published by Chen et al. [40] and Ding et al. [41]. To select the diffusion coefficients for the accumulated mass calculation, the water temperature of the different sampling sites was measured every 2 h. After retrieval, the resin gels were separated at 2 mm intervals, and each strip was sequentially placed into the centrifuge tubes with the addition of the corresponding extractants. Each of the 15 standard Chelex-100 DGT and AMP-TH DGT devices were immersed in 4 L 0.01 M NaNO3 solution to obtain the background masses of Fe (II) and NO3−-N and NH4+-N in the corresponding resin blanks, respectively. The corresponding resin gels were then eluted with the extractants, and the average masses of Fe (II), NO3−-N, and NH4+-N in the blank gels were determined as 20.58 ± 0.77, 28.07 ± 2.36, and 28.49 ± 2.14 ng cm−2, respectively. Consequently, the measurement detection limit (MDL) of the corresponding target elements was three times the standard deviation of the background concentration of the blank gels; this was equivalent to 0.73, 1.11, and 1.01 ng mL−1, respectively. The concentrations of NO3−-N and NH4+-N in the AMP-TH DGT eluents were determined using the ultraviolet spectrophotometric method and indophenol method, respectively. The labile Fe (II) concentrations were measured using the enzyme standard instrument [41].
2.3.3. HR-Peeper Probes for Nitrite and DOM Measurements
HR-Peeper probes were applied to obtain information on porewater contamination at different sampling sites. The labile fractions of NO2−-N and DOM were collected at a high resolution of 5 mm. The method was slightly modified from the standard constrained diffusive equilibration in the thin-films (DET) assembly [42]. As shown in Figure S3, the HR-Peeper has an exposed length of 20 cm with 36 chambers (40 × 4 × 2.5 mm3, length × width × height) on a base plate, and a maximum porewater volume of 400 μL can be collected in one chamber. The assembled HR-Peeper was soaked in deionized water and deoxygenated with nitrogen for at least 16 h. The probes were stored in containers filled with deoxygenated water prior to deployment.
HR-Peeper probes were inserted into the sediment cores (SWI–12 cm depth) for 48 h for diffusive equilibration. The adhered particles on the surface and bottom of the HR-Peepers were rapidly removed using clean tissues and Milli-Q water. After retrieval, a plastic membrane was placed on the surface of the probe filter membrane to prevent the oxidation of the porewater samplers. However, the samplers corresponding to the overlying water was uncovered with the plastic membrane. The cellulose nitrate membrane covering the chamber was first pierced with a plastic micropipette tip (200 μL) to release the negative internal pressure. The collected porewater was then withdrawn by piercing the filter membrane a second time, and the water was sequentially injected into a 1.5 mL centrifuge tube. The NO2−-N and DOM concentrations of porewater were determined by microplate spectrophotometry and fluorescence scanning, respectively.
2.4. Ex Situ Measurements of Denitrifier Abundance and Microbial Composition
Following the in situ measurements, the sediment cores were stratified at 3 cm intervals and frozen at −80 °C in an ultra-low temperature freezer. E.Z.N.A. Soil DNA Kit (Omega Bio-Tek, Norcross, GA, USA) was used to extract the total genomic DNA from each soil sample according to the manufacturer’s instructions. Nucleic acid quality and concentration were determined by 1% agarose gel electrophoresis and NanoDrop 2000 UV spectrophotometer (Thermo Scientific, Waltham, MA, USA), respectively.
Denitrifiers in sediments were quantified using the quantitative polymerase chain reaction (qPCR) method. NosZ is a gene marker of denitrifiers and was specifically chosen in this study. The qPCR with primer sets targeting nosZ2F and nosZ2R were used for the nosZ genes [43]. The primers and conditions for the qPCR are provided in Table S2 and Table S3. The q-PCR experiments were performed on a ABI7300 qPCR instrument (Applied Biosystems, Foster City, CA, USA) using ChamQ SYBR Color qPCR Master Mix as the signal dye. Each 20 μL reaction mixture contained 2 μL of the template DNA and 16.5 μL of ChamQ SYBR Color qPCR Master Mix. Standard curves for each gene were obtained by the tenfold serial dilution of standard plasmids containing the target functional gene. All operations were followed the MIQE guidelines.
The universal primers 515F [5′-GTGCCAGCMGCCGCGG-3′] and 907R [5′-CCGTCAATTCMTTTRAGTTT-3′] were used to amplify bacterial 16S rRNA genes in V3-V4 hypervariable regions for the analysis of microbial community composition and diversity. MiSeq sequencing was conducted on an Illumina® MiSeq sequencer (Illumina, San Diego, CA, USA) by the free online platform of Majorbio Cloud Platform (www.majorbio.com). Operational taxonomic units (OTUs) were clustered with 97% similarity cutoff using UCHIME (version 7.0.1090, http://www.drive5.com/uparse/), which also identified and removed chimeric sequences.
2.5. Statistical Analysis
All statistical analyses were performed using the SPSS statistical package (Version 18.0 for Windows, Stanford University, San Francisco, CA, USA), and some were conducted using R packages (The University of Auckland, Auckland Region, New Zealand). Specifically, SPSS was applied for normality testing of the physiochemical properties, while the R package g plot was used to cluster the DGT-measured labile concentrations at different depths of specific lineages in the different sampling sites; the F and t tests were also applied to verify the relative abundances of the dominant lineages between the different sampling sites. Furthermore, we determined the community dissimilarities between the different sampling sites in Lake Taihu based on Bray–Curtis distances. Abiotic factors influencing the microbial community were evaluated using the BioENV procedure, and a canonical correspondence analysis (CCA) was used to identify the dominant environmental variables influencing the microbial communities across all sampling sites in Lake Taihu.
3. Results
3.1. Water and Sediment Physicochemical Profiles
The basic water quality characteristics are outlined in Table 1.The diffusion coefficients of labile fractions were selected to ensure the accurate evaluation of the DGT technique according to the temperature of the sampling sites. As shown in Table 1, total nitrogen (TN) and total phosphorus (TP) concentrations of the overlying water at site XKW were significantly different to those of the other sampling sites. Site XKW was located in the east of the lake and was characterized by the significant growth of submerged macrophytes and the absence of algal blooms. In contrast, N and P concentrations were notably higher at sites FDG and YL, which is likely due to their high algal biomass.
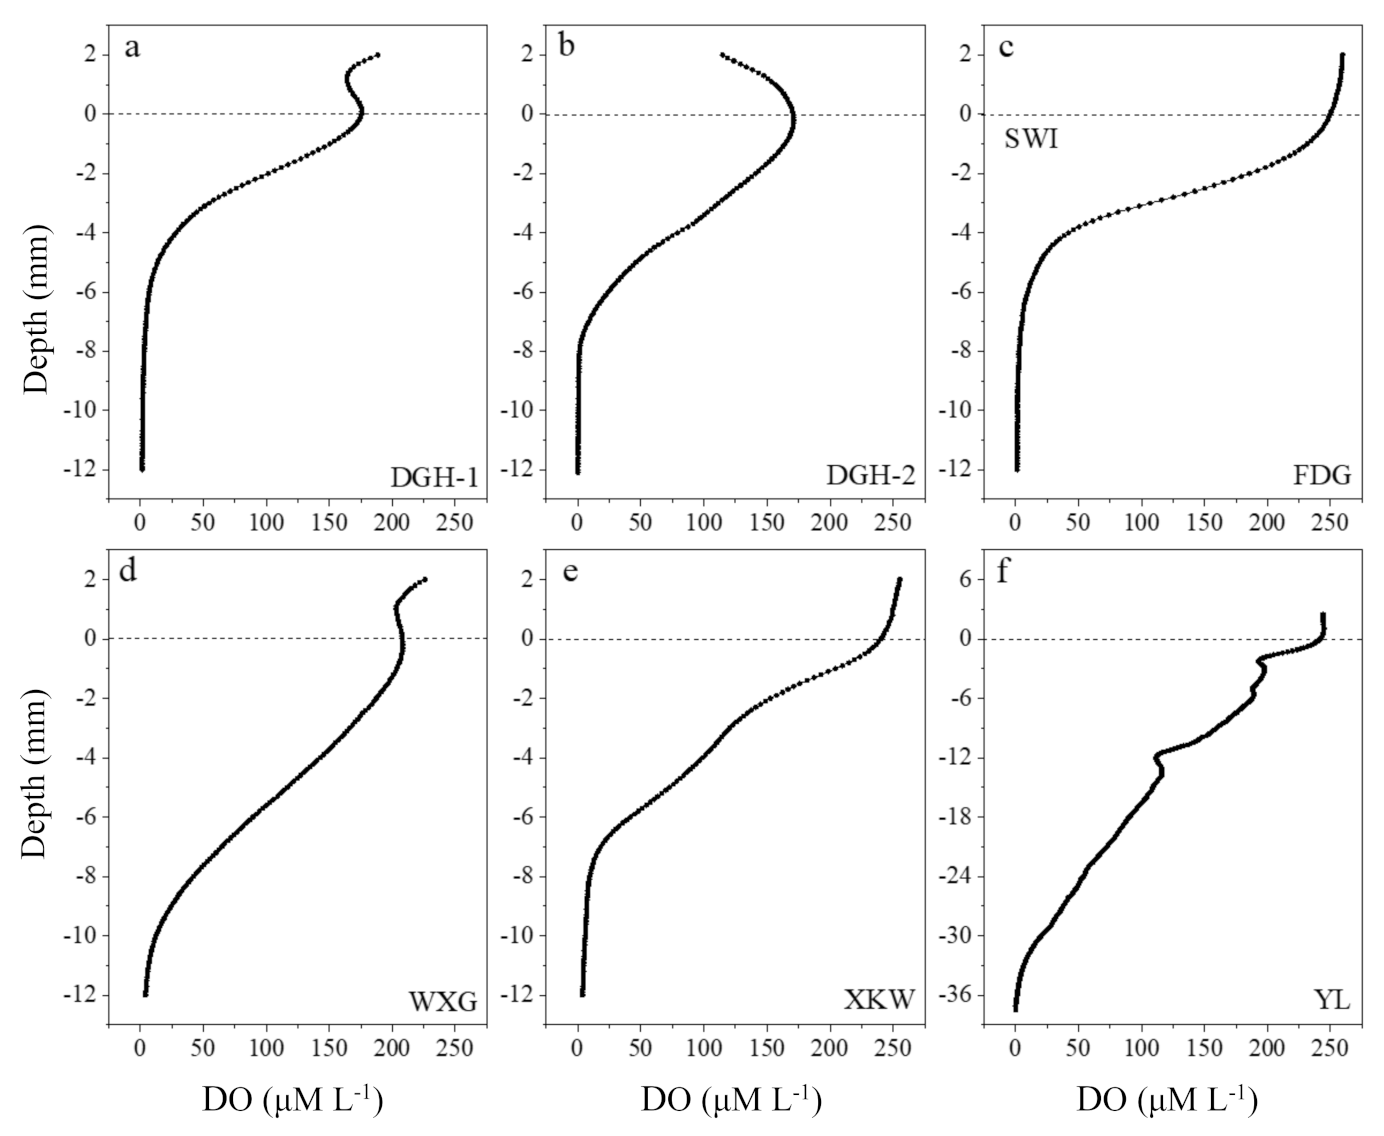
DO penetration depth is defined as the sediment region between the SWI and to the depth of zero DO concentration. Except for site YL (DO penetration depth of almost 34.6 mm), DO penetration depth in the sediment profiles of all six sampling sites ranged from 8.0 to 12.7 mm over the 14 h stable period (Figure 2). The significant differences in the eutrophication degree, algal biomass, sediment granular composition, and wind velocity between each site accounted for the discrepancy in the DO penetration depth and concentration [16]. We observed higher biomass accumulations of algal blooms at sites DGH-1 and FDG, resulting in a sharp DO decrease and a notably thinner SWI. Site YL located in Moon Bay, is influenced by prevailing southeasterly winds in summer, which causes severe water column disturbance; this stimulates the suspension of sediments and increases the oxygen penetration depth [44]. The sediments of the sampling sites were generally weakly alkaline, with pH values ranging from 6.68 to 8.05 (Figure S4A). The maximum pH value occurred in in YL (range: 6.60–8.05), while the minimum pH value occurred in DGH-2 (range: 7.55–7.82). The overlying water at sites DGT-2, FDG, WXG, XKW, and YL showed lower pH values, which coincided with a significant decreasing trend in sediment pH with depth. In contrast, pH in DGH-1 showed the opposite trend with sediment depth. Finally, Eh values ranged from 91.81 to 478.97 mV and markedly decreased with increasing sediment depth (Figure S4B)
3.2. Sediment NO and N2O Profiles
NO is the signaling compound in eukaryotes and prokaryotes and is, therefore, ubiquitous in the environment. In addition, NO also constrains the conversion, transformation, and biogeochemical cycling of nitrogen, including denitrification, nitrification, and the anaerobic oxidation of ammonium (ANAMMOX) [13]. NO concentrations of the six sampling sites were relatively stable throughout the sediment profile, except for the slight increases at the sediment surface at sites DGH-1 and XKW (Figure S5A). Furthermore, the sedimentary NO profile at site FDG showed significant variability at the SWI (0–2 cm), and the highest NO concentration was observed at site FDG (3.12 μM L−1) at a depth of −4.8 mm. However, the NO concentrations at site DGH-2 showed a significant increasing trend with depth caused by the increasing contribution of denitrification processes.
We measured N2O concentrations of the sediment profiles to further investigate the denitrification processes. We were unable to obtain N2O concentrations of the XKW and YL sediment cores due to damage to the microelectrode. We did not observe sharp variability in N2O concentrations throughout the sedimentary profiles of FDG and DGH-1. N2O concentrations in the WXG core were also relatively stable throughout the profile, despite notable increases at the SWI. As with NO variability, N2O concentration in the DGH-2 profile also showed a significant increasing trend with depth (0–60 mm), ranging from 0 to 148.4 nM L−1 (Figure S5B). The high ORP value at site DGH-2 likely accelerated the denitrification process (2NO+2e−+2H+→N2O+H2O and NO2−+e−+2H+→NO+H2O), resulting in the highest concentrations of both NO and N2O. However, the extremely high NO concentrations at the SWI at site FDG did not promote the increase in N2O concentration. Therefore, other vital N fractions should be measured via high-resolution sampling to further understand the denitrification process at this site.
3.3. Sediment NH4+-N, NO3−-N, and NO2−-N Profiles
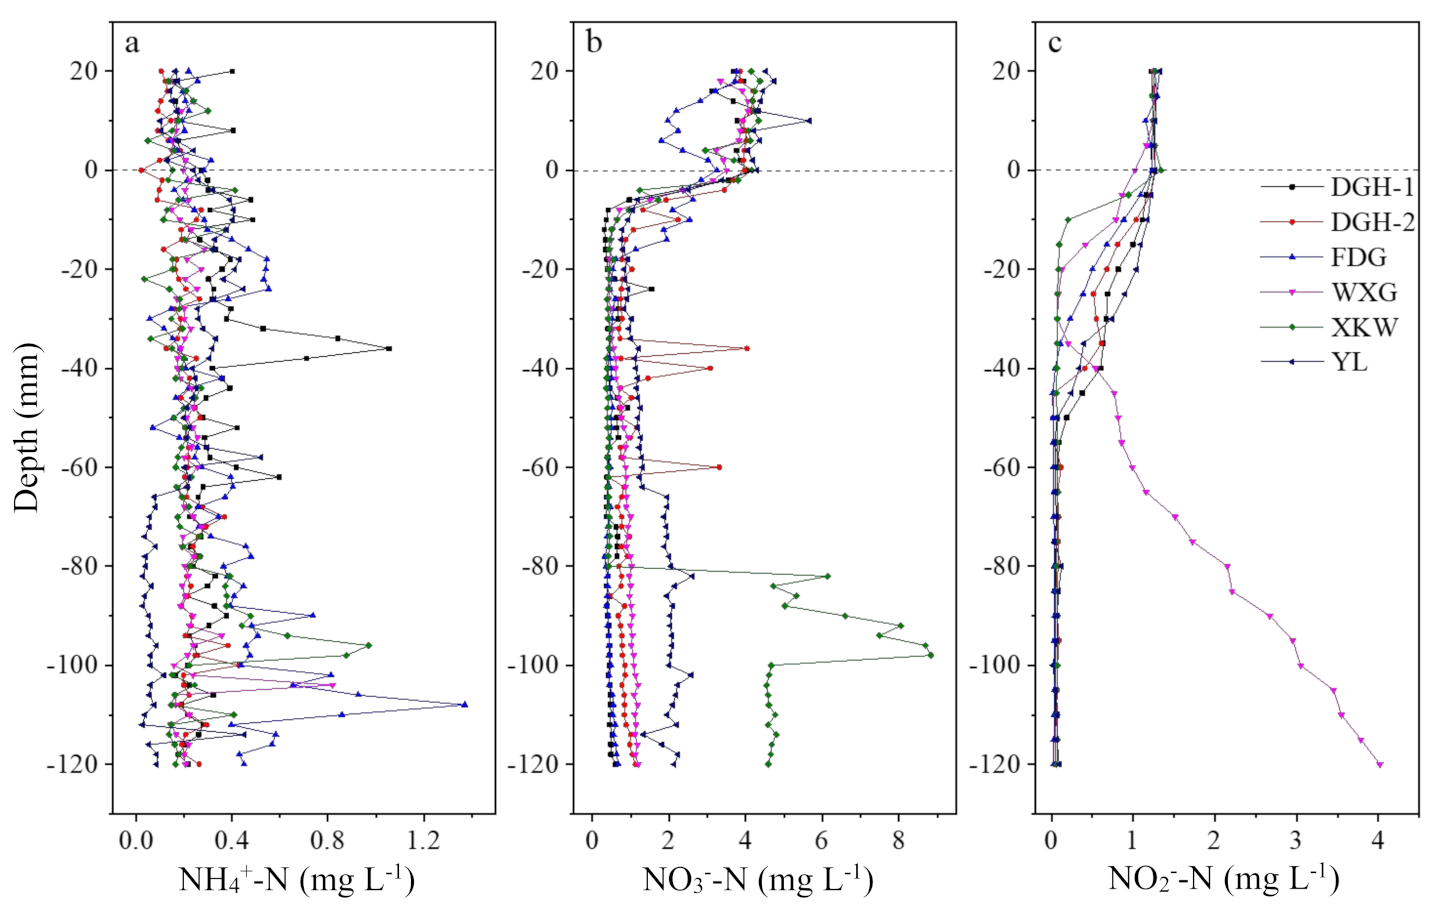
According to Figure 3a, the mean concentration of NH4+-N in each sediment profile ranged from 0.19 to 0.39 mg L−1. NH4+-N concentrations showed no obvious trends throughout the sediment profiles, except in sites YL and FDG. NH4+-N concentrations at YL varied from 0.30 to 0.07 mg L−1 and showed a decreasing trend with sediment depth. In contrast, NH4+-N at site FDG increased with depth and ranged from 0.16 to 1.37 mg L−1. However, extremely high concentrations of NH4+-N occurred at a depth of −36 mm in DGH-1 (1.06 mg L−1) and −96 mm in XKW (0.97 mg L−1), indicating the high heterogeneity between the different profiles.
NO3−-N concentrations at all the sampling sites displayed a clear diffusion gradient at the SWI, which suggested that the sediment is a sink for this nitrate fraction (Figure 3b). NO3−-N penetration depth in the sediment cores occurred at 8–18 mm, which was highly similar to the range of DO penetration depth. For the YL site, the concentration of NO3−-N remained relatively low (0.78 mg L−1) and then sharply increased to a concentration of 2 mg L−1 at −66 mm depth. In contrast, NH4+-N concentration showed the opposite trend with depth. Similar to the YL site, NO3−-N concentrations at the XKW site also showed relatively stable and low concentrations in the upper profile and then sharply increased at a depth of −82 mm. Overall, NO3−-N trends corresponded with the change in NH4+-N concentration with depth.
Except for site WXG, NO2−-N concentrations of the other sampling sites all showed similar downcore trends with highest concentrations at the SWI; NO2−-N penetration depth generally ranged from 15 to 55 mm, which was then followed by low and stable concentrations toward the bottom of the profiles (Figure 3c). In contrast, NO2−-N concentrations of the WXG site showed a notable increase from −46 mm depth to the bottom of profile. The decomposition of algal organic matter (AOM) may have enhanced the functional microbial biomass and promoted their activity, which accelerated the denitrification process. It is, therefore, necessary to further analyze the AOM as well as the diversity and spatial characteristics of the microbial community in the sediment.
3.4. Sediment Taxonomic Composition of Microbial Communities
We obtained raw sequences at 3 cm sediment depth intervals via high-throughput sequencing. After removing low-quality reads and subsamples, a total of 27,832 valid sequences were produced. After further filtering, a total of 6013 operational taxonomic units (OTUs) were clustered. The relationships between the OTUs of the different samples are illustrated in Figure S6. The bacterial alpha diversity indices indicate both taxon richness and evenness and includes Sobs, Shannon, Simpson, Ace, Chao1, and Coverage. The Chao1 and Ace estimators were the highest in XKW-1 and the lowest in DGH-1-3, inferring highest and lowest community richness, respectively (Table S5). We also identified a decreasing trend in community richness with sediment depth. We conducted an non-metric multidimensional scaling (NMDS) analysis of the community composition at the genus level to quantify the differences and similarities between the six sample sites. We observed higher similarity in the microbial community structure between sites WXG and YL, DGH-1 and DGH-2, and XKW and FDG (Figure S7).
At the phylum level, Proteobacteria (average 50.0%) was the most abundant, followed by Acidobacteria (average 10.2%), Firmicutes (average 8.9%), Chloroflexi (average 7.3%), Bacteroidetes (average 5.7%), Cyanobacteria (average 3.4%), Actinobacteria (average 2.7%), Gemmatimonadetes (average 2.4%), Planctomycetes (average 2.2%), Nitrospirae (average 1.4%), and Armatimonadetes (average 0.8%) (Figure S8).
3.5. Sediment DOM Profiles
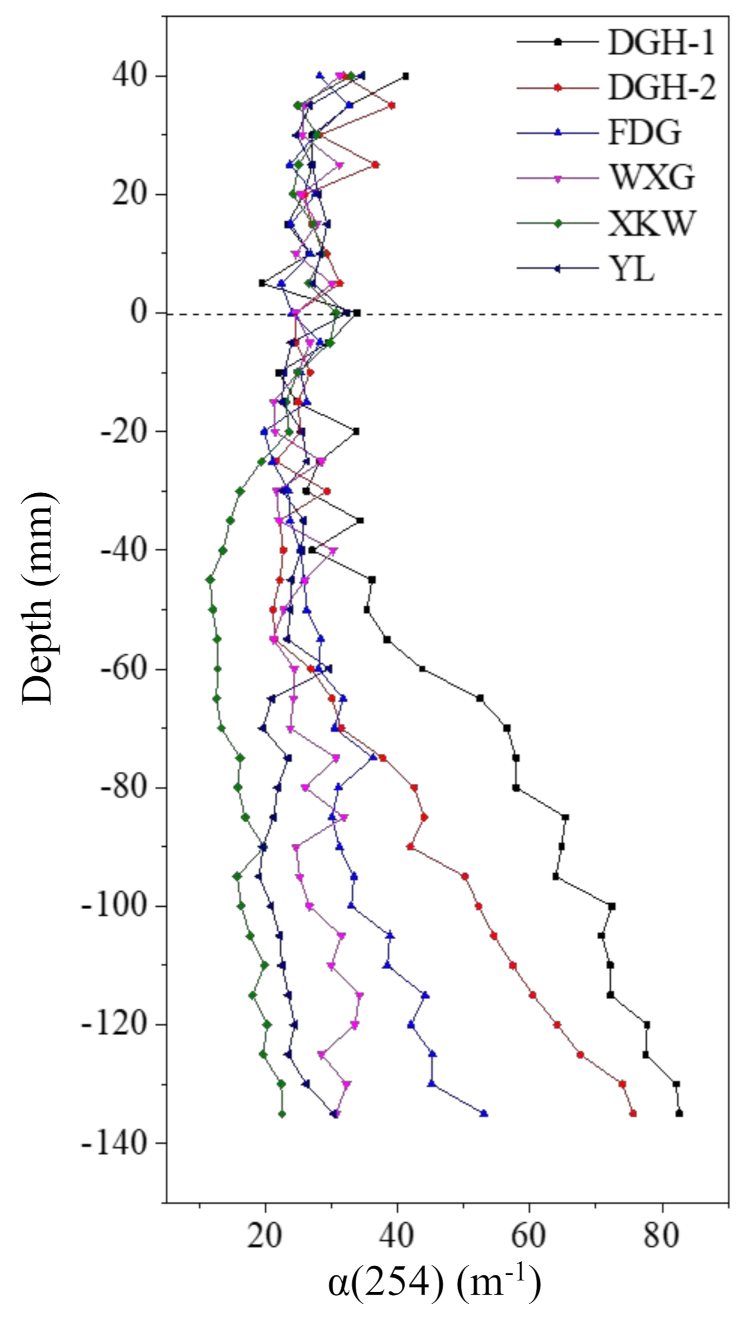
DOM plays a vital role in carbon biogeochemical cycling as well as the fate of contaminants. DOM is an important environmental parameter and represents the variability in both aquatic and terrestrial environments [45]. Contaminants diffuse from profundal sediments to porewaters by dissolution, desorption, and the biological decomposition of DOM. Consequently, the decomposition of algal blooms likely controls the concentration of DOM [46]. Thus, in situ measurements of DOM in the overlying water and sediment can further determine the impacts of DOM structures on N accumulation/release and denitrification in freshwater ecosystems. The peeper was applied to collect the DOM, and the porewater DOM determined from the UV-vis spectra is shown in Figure 4. The porewater DOMs showed highly variable UV-vis spectra. The α(254) value reflects the relative content of DOM and was found to increase from the SWI to the bottom of the profiles at sites DGH-1, DGH-2, and FDG; this suggests that the macromolecules of DOM preferentially accumulated with depth in the sediment profiles [47]. In contrast, the α(254) values of the sediment profiles remained stable in the other sample sites. We used the fluorescence index (FI) to further analyze the dominant sources of DOM, and the FI values of terrigenous and indigenous DOM are 1.4 and 1.9, respectively [48]. Accordingly, the average DOM FI ranged from 1.54 to 1.60, inferring a dominance of terrestrial sourced DOM (data not shown). Based on fluorescence regional integration-Simpson’s rule (FRI-SR) [49,50], the fluorescence regional integration was divided into five intervals to distinguish DOM compositions. According to Figure S9, the DOM extracted at DGH-1 from −60 to −135 mm, DGH-2 from −105 to −135 mm, and XKW at −100 mm strongly peaked at the wavelength pair of Ex 340 nm/Em 420–480 nm. The DOM extracted at DGH-1 from −80 to −135 mm and XKW at −100 mm also showed strong peaks at the wavelength pair of Ex370 nm/Em 450–500 nm. These results suggest that humic-acid-like compounds were the dominant components in the profundal sediment. The comparisons of the main identified fluorescent groups are shown in Table S6.
4. Discussion
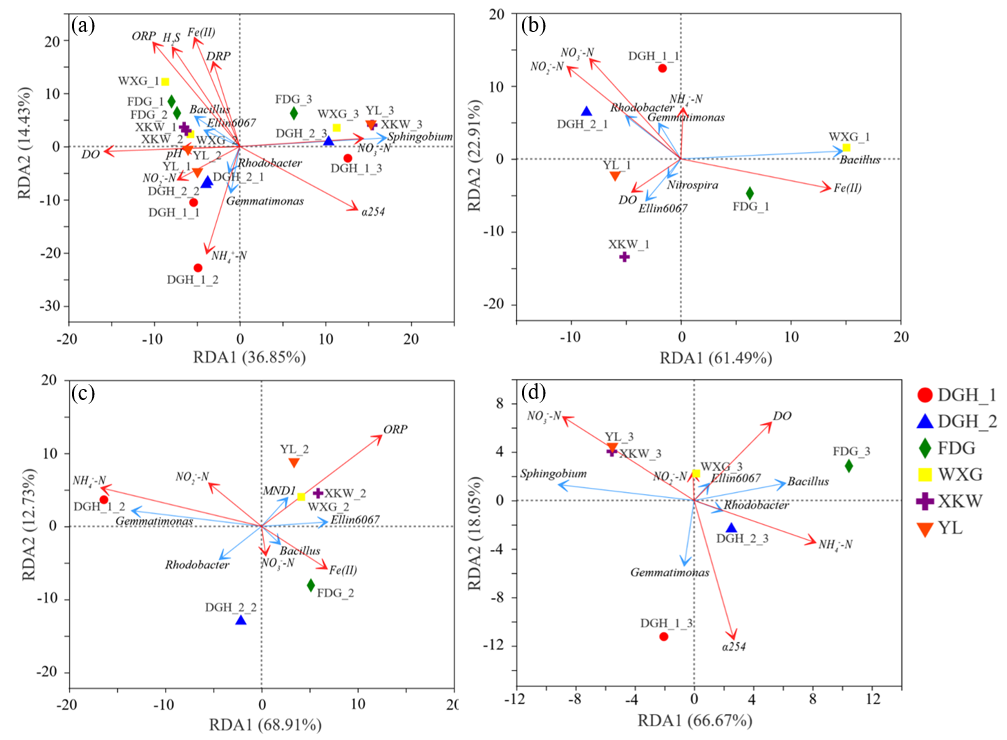
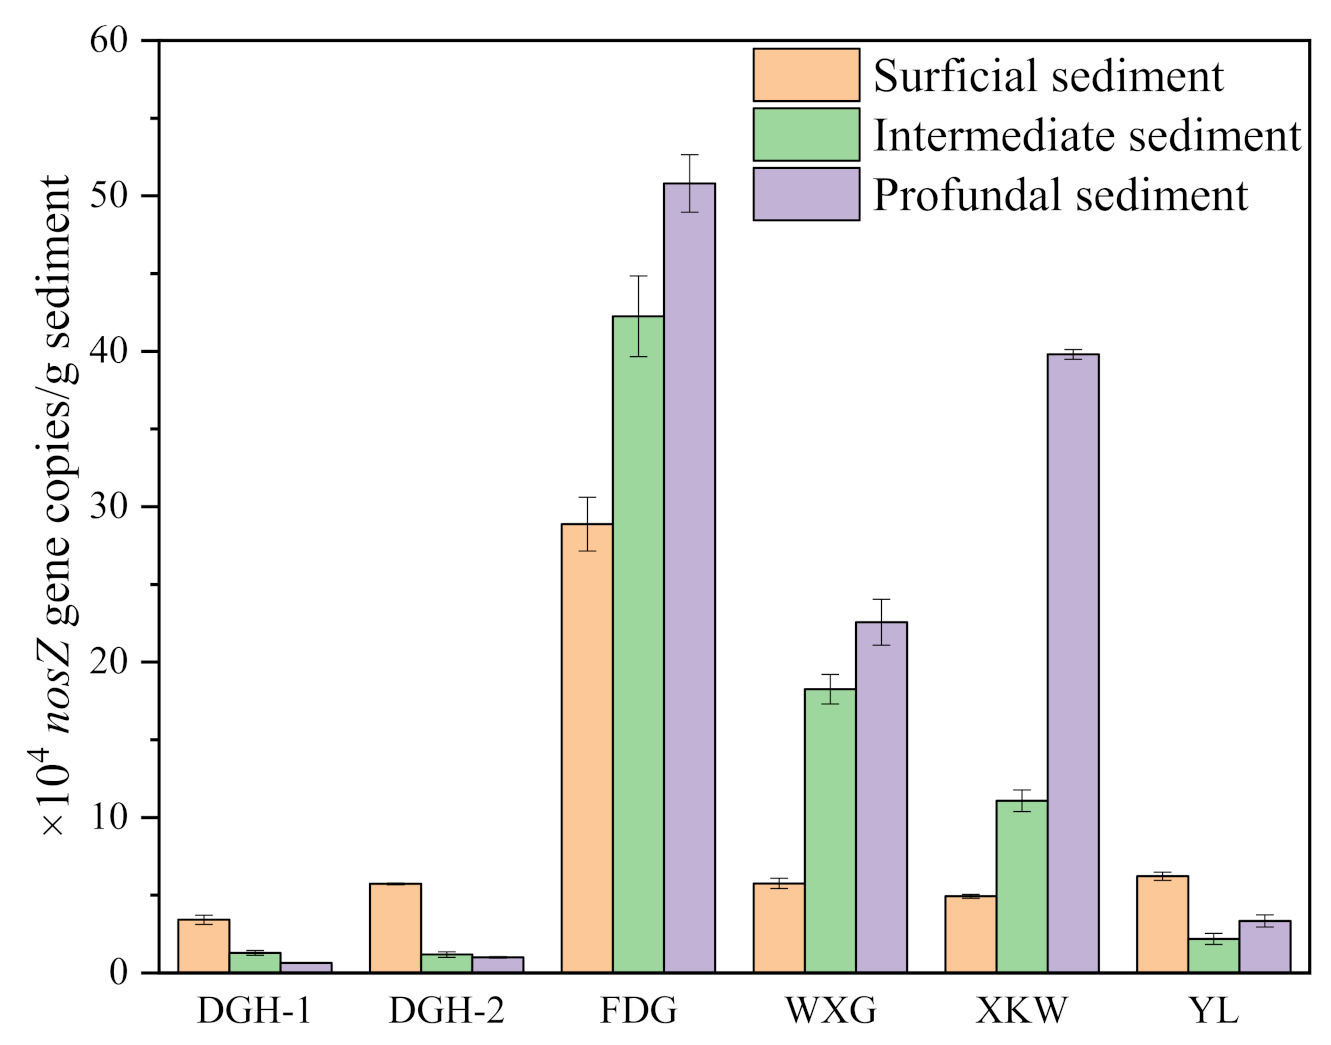
We conducted a redundancy analysis (RDA) to further assess the relationships between the different N fractions and microbial and environmental factors (Figure 5). All sampling sites were divided into three vertical intervals: 0–3, 3–6, and 6–9 cm. An angle of <90° indicates a positive correlation, and a smaller angle represents a stronger positive correlation. Conversely, an angle of >90° infers a negative relationship. Moreover, the arrow length reflects the importance of the parameter, and the orientation represents the association between the parameter and the axis [51]. According to Figure 5, the sampling sites showed significant differences in the surficial sediment layer (0–3 cm) and intermediate sediment layer (3–6 cm). However, sphingobium and NO3−-N dominated the profundal sediment layer (6–9 cm) in all sampling sites (Figure 5d). Additionally, we observed a significant correlation between the typical denitrifier sphingobium and NO3−-N fractions (Figure S10). The similar influencing factors of the profundal sediments indicate homogenization and similar N concentration rates under different algal biomasses. Consequently, the results of the detailed RDA analysis to assess the vertical differences of all the sampling sites are shown in Figure 5a. NO3−-N, NO2−-N, Bacillus, and Fe(II) were the main controlling factors in the surficial sediment (Figure 5b). The important roles of both NO3−-N and NO2−-N indicate the predominance of denitrification relative to nitrification in the surficial layer. NH4+-N, ORP, and Gemmatimonas were the dominant influencing factors in the intermediate sediment layer (Figure 5c), while α(254), sphingobium, and NO3−-N were the dominant controlling factors in the profundal sediment layer (Figure 5d). As the typical denitrifiers (sphingobium, Bradyrhizobium, Gemmatimonas) were the main factors controlling the variability in the sediment profile, we measured the abundance of the nosZ gene via qPCR. According to Figure 6, the abundance of the nosZ gene at sites FDG, WXG, and XKW increased with sediment depth. In contrast, nosZ gene abundance showed a slight decreasing trend with depth at sites DGH-1, DGH-2, and YL. The extremely high biomass of algal blooms at sites FDG, YL, and DGH had not significantly influenced the nosZ gene abundance. This finding highlights the role of sediments on the different N fractions at each sampling site.
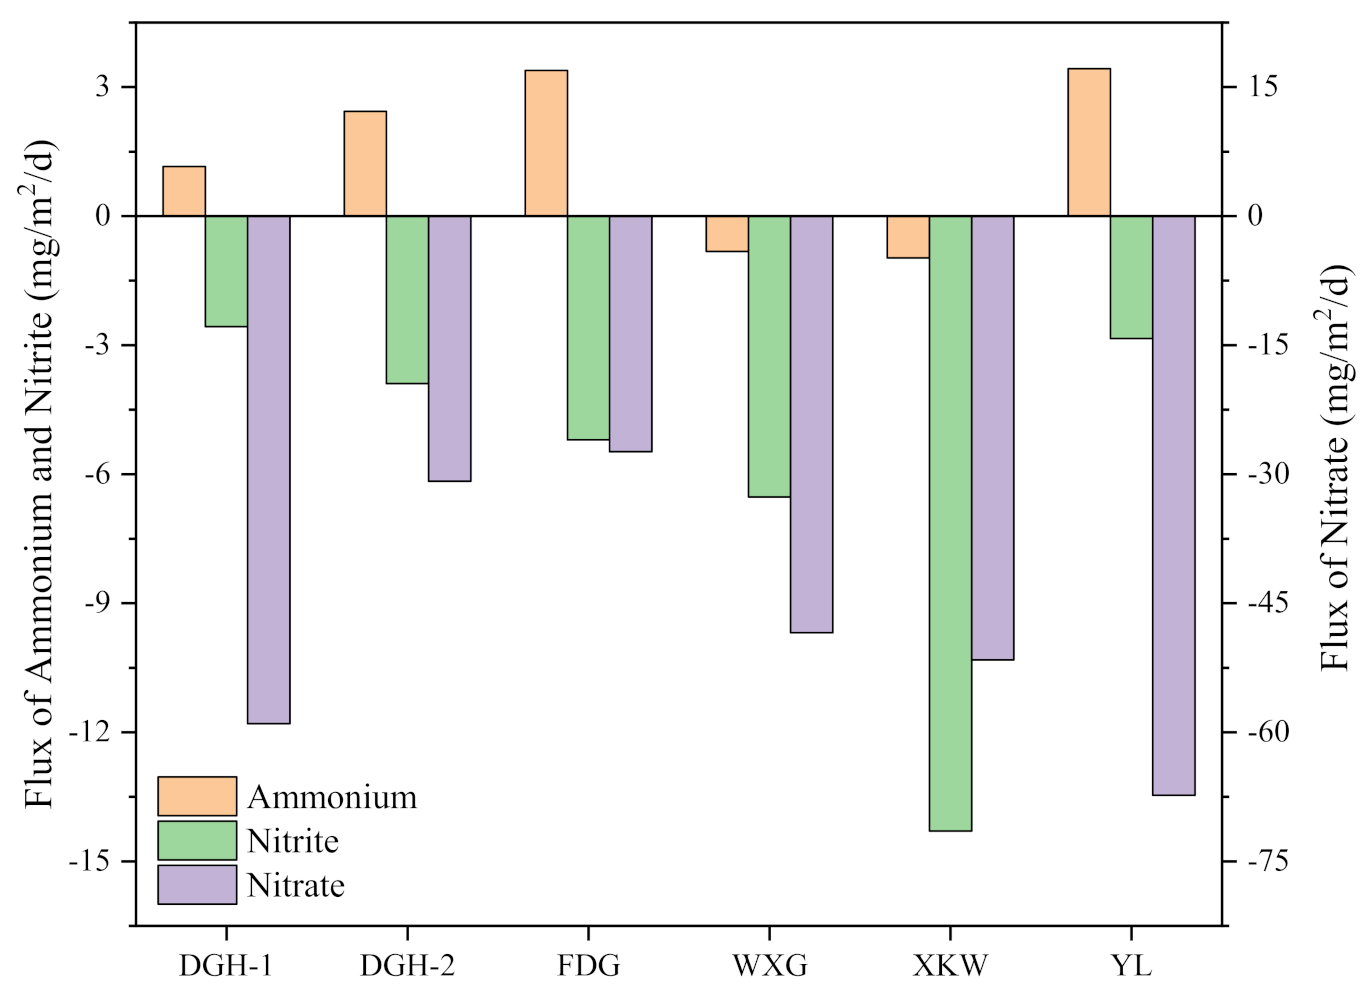
The apparent diffusion fluxes of dissolved inorganic N (DIN) at the SWI were also measured. As shown in Figure 7, the positive value represents the diffusion direction from the sediment to the overlying water, and the negative value represents the diffusion direction from the overlying water to the profundal sediment. The apparent diffusion fluxes of NH4+-N at the SWI ranged from -0.97 to 3.43 mg m−2 d−1. Sites WXG and XKW showed negative values, and we observed an increase in the activity of nitrifying bacteria. In contrast, NH4+-N in the other sites was released from the sediment to the overlying water, which likely provided substrates for algal propagation. The apparent diffusion fluxes of NO3−-N and NO2−-N were all negative, with values at the SWI ranging from −67.31 to −27.38 mg m−2 d−1 and -14.30 to −2.57 mg m−2 d−1, respectively. NH4+-N flux values were higher and NO3−-N and NO2−-N flux values were lower at sites DGH-2 and FDG compared with the other sample sites. The decomposition of algal blooms at the SWI rapidly depleted DO, which would significantly inhibit denitrification in sediment.
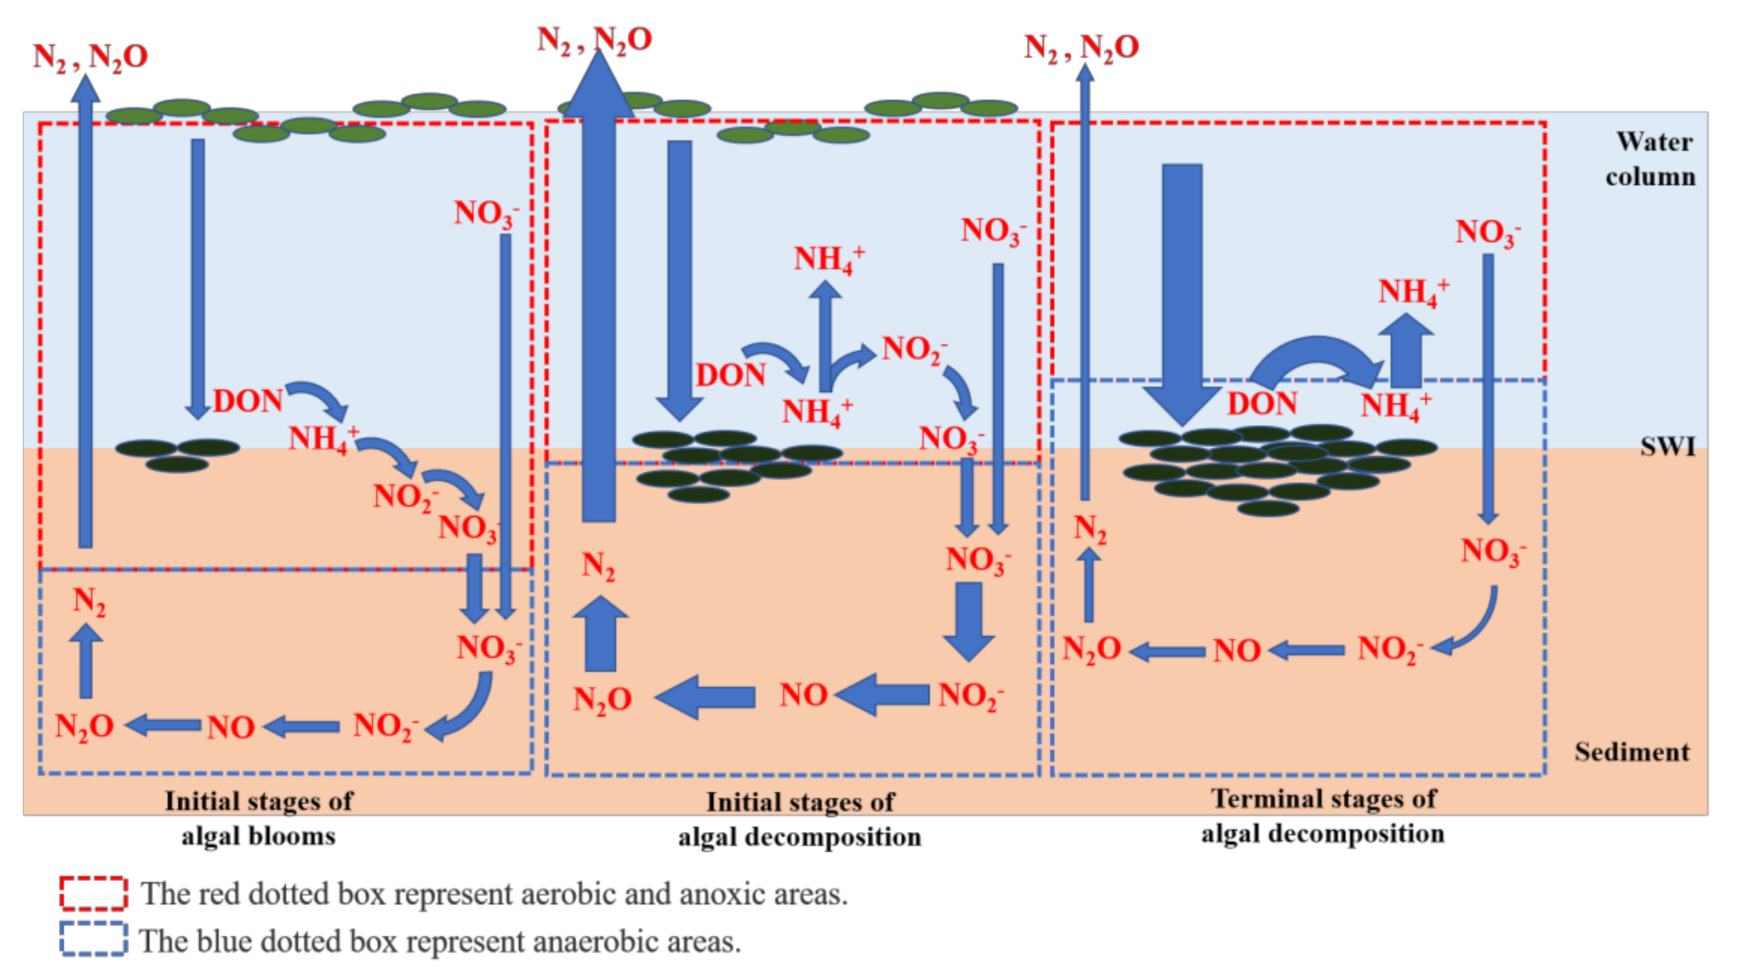
The algal biomass, physicochemical indexes, diversity and abundance of microbial communities, and apparent DIN diffusion fluxes inferred significant differences in the nitrification and denitrification processes. As shown in Figure 8, at sites with low algal biomasses, the high production of DON from the decomposition of algal blooms diffused and transformed into ammonium fractions at the SWI. Under aerobic conditions, most ammonium fractions in the sediments were microbially transformed into NH4+-N, NO2−-N, and NO3−-N via nitrification and denitrification, which then diffused toward the overlying water. At sites with high algal biomasses, the SWI was extremely anaerobic due to the constant accumulation of algal blooms. The algal blooms decomposed superfluous DON, leading to excess NH4+-N, which could not be completely transformed to NO3−-N due to the limited DO concentration. As a result, the sediments became a source rather than a sink of NH4+-N. Denitrification is promoted under anaerobic environments and abundant DOM [52]. If the algal biomass does not increase, the DOM will be rapidly consumed and the SWI conditions will be relieved. In addition, the rapid consumption of NO3−-N promotes the conversion of NH4+-N into NO3−-N, which reduces the diffusion of NH4+-N into the overlying water. Furthermore, the continued increase in algal biomass may alter the biogeochemical cycling of N. In an irreversible situation, the decomposition of large amounts of algal blooms will enhance the anaerobic conditions at the SWI, and the DON-generated NH4+-N is unable to further transform via nitrification. As a result, denitrification is restrained due to the limited availability of NO3−-N fraction. The rate of N cycling will eventually reduce and increase the risk of DON and NH4+-N at the SWI; this would further promote the large-scale occurrence of algal blooms. Zhu et al. [20] also found that DO concentrations (controlled by the concentration of cyanobacteria) at the SWI was the dominant influence on nitrification and denitrification in sediments, which significantly influenced the deposition rates of the different N fractions. Overall, previous studies have identified extremely high N2O release rates under the intensified eutrophication of freshwater ecosystems. Previous investigations found significantly higher N2O emissions in sampling sites with high algal biomasses, which is similar to the findings of this study [53].
5. Conclusions
We investigated the impacts of sediment algal decomposition on the variation of physicochemical properties (i.e., hypoxia and ORP reduction) in the overlying water of Lake Taihu. The decomposition of different biomasses of algal blooms did not change the main controlling factor on the different N fractions in the profundal sediment. However, the decomposition of the different algal biomasses led to significantly different nitrification and denitrification processes in sediment. Low algal biomasses facilitated the classic process of N cycling, with the balanced interaction between nitrification and denitrification. However, extreme hypoxia in response to high algal biomasses significantly limited nitrification, which in turn, limited denitrification due to the lack of available substrates. The collapse of algal blooms significantly inhibited denitrification rates, leading to high N accumulation in the sediment; this further increased the risk of DON and NH4+-N release to the overlying water and promoted the widespread occurrence of algal blooms. Our findings highlight the mechanisms behind the feedback loop linking N and eutrophication in freshwater ecosystems, which can become irreversible without technological intervention. However, severe freshwater eutrophication can also reduce the greenhouse gas emissions of N2O, which infers the absence of a positive feedback between greenhouse gas emissions and freshwater eutrophication.
Supplementary Materials
The following are available online at https://www.mdpi.com/2073-4441/13/4/524/s1. Figure S1: In-situ deployment device of DGT and HR-Peeper. Figure S2: Schematic of the annular flume. (a) shows the plan form; (b) shows profiles of annular flume; (c) is a schematic of sediment cores. The present study examined 6 sediment cores. To avoid the excessive crosswise disturbance of the wind, the sediment cores were deployed in the annular flume which on the opposite side of the blower equipment. Figure S3: The structure of the HR-Peeper. a. the HR-Peeper was assembled by base plate (1), plastic window (2), outer frame (3) and inter frame (4), in the assembly of the HR-Peeper, the chambers were filled with deionized water and covered with a cellulose nitrate membrane (i.e., dialysis membrane; Whatman, 0.45 μm pore size), all the components were bound together using plastic fastener. b. the lateral view and elevation view of HR-Peeper). Figure S4: pH (A) and oxidation-reduction potential (ORP) (B) microprofiles of Lake Taihu sediment, from June 2019 to July 2019. Dashed lines indicated approximate positions of the sediment-water interface (SWI). Figure S5: Vertical NO (A) and N2O (B) microprofiles measured in Lake Taihu sediment using NO and N2O microsensors, respectively. The N2O concentration of XKW and YL were not measured because of damage to the N2O microsensor during the measurement. Dashed lines represented approximate positions of the sediment-water interface (SWI). Note the different x-axis scaling in each of microprofiles. Figure S6: Venn diagram showing unique and shared operational taxonomic units (OTUs) among the sampling sites. Figure S7: Non-metric multidimensional scaling (NMDS) analysis of microbial communities in Lake Taihu. Figure S8: Relative abundances of sequences at the phylum level. Groups with <5% abundance were summarized as “Other”. XXX-1 mean the sediment at the surface layer of the sample sites from 0 to 3 cm, XXX-2 mean the sediment at the middle layer of the sample sites from 3 to 6 cm, and XXX-3 mean the sediment at the profundal layer of the sample sites from 6 to 9 cm. Figure S9: The comparison of the main fluorescent. The excitation (Ex) and emission (Em) wavelengths are A. Ex/Em = 250/(380~480), B. Ex/Em = 340/(420~480), C. Ex/Em = 370/(450~500), D. Ex/Em = 380/(310~435), E. Ex/Em = 270/(320~350), F. Ex/Em = 270/(300~320), respectively. In the group A, group C, group D and group F, the X-axis represents the wavelength range of emission, the Y-axis represents the sediments depth and the Z-axis represents the fluorescence intensity. In the group B and group E, the X-axis represents the sediments depth, the Y-axis represents the wavelength range of emission and the Z-axis represents the fluorescence intensity. Figure S10: Concentration of NO3--N with OTU values of Sphingobium genus in profundal sediment (6–9 cm). Table S1:Geographic information of the sampling sites. Table S2: NosZ primer base sequences and reaction compounds. Table S3: qPCR conditions for nosZ gene regions. Table S4: Vertical distribution characteristics of the DIN profiles as shown in Figure 3. Table S5: Number of valid sequences, richness, and diversity of 6 sapling sites in Lake Taihu. XXX-1 mean the sediment at the surface layer of the sample sites from 0 to 3 cm, XXX-2 mean the sediment at the middle layer of the sample sites from 3 to 6cm, and XXX-3 mean the sediment at the profundal layer of the sample sites from 6 to 9 cm. Table S6: Fluorescence components of DOM in sediments as shown in Figure S9. Table S7: Environmental parameters of sediments of different depths in sample sites, and the value of the environment parameters is the average of the average of the measured value in the corresponding depth range. XXX-1 mean the sediment at the surface layer of the sample sites from 0 to 3 cm, XXX-2 mean the sediment at the middle layer of the sample sites from 3 to 6 cm, and XXX-3 mean the sediment at the profundal layer of the sample sites from 6 to 9 cm.
Author Contributions
Conceptualization, Y.Y.; methodology, Y.Y. and H.L.; formal analysis, H.L.; investigation, H.L. and D.L.; resources, R.H.; data curation, Y.Y.; writing—original draft preparation, H.L.; writing—review and editing, Y.Y. and R.H.; visualization, H.L.; supervision, R.H.; project administration, R.H. and L.Z.; funding acquisition, R.H. and L.Z. All authors have read and agreed to the published version of the manuscript.
Funding
This research was funded by the National Natural Science Foundation of China, grant number 41773081, 42007333 and 41877336, the Startup Research Foundation for High-level Professionals of Nanjing Normal University, grant number 184080H202B228.
Institutional Review Board Statement
Not applicable.
Informed Consent Statement
Not applicable.
Data Availability Statement
The data of this research is available in the paper and Supplementary Materials.
Acknowledgments
The authors are grateful to Xu Xiaoguang for their valuable help in field investigation and sampling. This work is financially supported by the National Natural Science Foundation of China and by the Startup Research Foundation for High-level Professionals, NNU.
Conflicts of Interest
The authors declare no conflict of interest.
References
- Le Moal, M.; Gascuel-Odoux, C.; Ménesguen, A.; Souchon, Y.; Étrillard, C.; Levain, A.; Moatar, F.; Pannard, A.; Souchu, P.; Lefebvre, A.; et al. Eutrophication: A new wine in an old bottle? Sci. Total. Environ. 2019, 651, 1–11. [Google Scholar] [CrossRef] [PubMed] [Green Version]
- Qin, B.; Zhu, G.; Gao, G.; Zhang, Y.; Li, W.; Paerl, H.W.; Carmichael, W.W. A Drinking Water Crisis in Lake Taihu, China: Linkage to Climatic Variability and Lake Management. Environ. Manag. 2010, 45, 105–112. [Google Scholar] [CrossRef]
- Vinçon-Leite, B.; Casenave, C. Modelling eutrophication in lake ecosystems: A review. Sci. Total. Environ. 2019, 651, 2985–3001. [Google Scholar] [CrossRef] [PubMed]
- Kim, K.; Mun, H.; Shin, H.; Park, S.; Yu, C.; Lee, J.; Yoon, Y.; Chung, H.; Yun, H.; Lee, K.; et al. Nitrogen Stimulates Microcystis-Dominated Blooms More than Phosphorus in River Conditions That Favor Non-Nitrogen-Fixing Genera. Environ. Sci. Technol. 2020, 54, 7185–7193. [Google Scholar] [CrossRef] [PubMed]
- Horst, G.P.; Sarnelle, O.; White, J.D.; Hamilton, S.K.; Kaul, R.B.; Bressie, J.D. Nitrogen availability increases the toxin quota of a harmful cyanobacterium, Microcystis aeruginosa. Water Res. 2014, 54, 188–198. [Google Scholar] [CrossRef] [PubMed]
- Salk, K.R.; Bullerjahn, G.S.; McKay, R.M.L.; Chaffin, J.D.; Ostrom, N.E. Nitrogen cycling in Sandusky Bay, Lake Erie: Oscillations between strong and weak export and implications for harmful algal blooms. Biogeosciences 2018, 15, 2891–2907. [Google Scholar] [CrossRef] [Green Version]
- Shatwell, T.; Köhler, J. Decreased nitrogen loading controls summer cyanobacterial blooms without promoting nitrogen-fixing taxa: Long-term response of a shallow lake. Limnol. Oceanogr. 2018, 64, S166–S178. [Google Scholar] [CrossRef] [Green Version]
- Yang, J.; Gao, H.; Glibert, P.M.; Wang, Y.; Tong, M. Rates of nitrogen uptake by cyanobacterially-dominated assemblages in Lake Taihu, China, during late summer. Harmful Algae 2017, 65, 71–84. [Google Scholar] [CrossRef]
- Yao, X.; Zhang, Y.; Zhang, L.; Zhu, G.; Qin, B.; Zhou, Y.; Xue, J. Emerging role of dissolved organic nitrogen in supporting algal bloom persistence in Lake Taihu, China: Emphasis on internal transformations. Sci. Total Environ. 2020, 736, 11. [Google Scholar] [CrossRef] [PubMed]
- Ma, J.; Brookes, J.D.; Qin, B.; Paerl, H.W.; Gao, G.; Wu, P.; Zhang, W.; Deng, J.; Zhu, G.; Zhang, Y.; et al. Environmental factors controlling colony formation in blooms of the cyanobacteria Microcystis spp. in Lake Taihu, China. Harmful Algae 2014, 31, 136–142. [Google Scholar] [CrossRef] [PubMed]
- Könneke, M.; Bernhard, A.E.; De La Torre, J.R.; Walker, C.B.; Waterbury, J.B.; Stahl, D.A. Isolation of an autotrophic ammonia-oxidizing marine archaeon. Nat. Cell Biol. 2005, 437, 543–546. [Google Scholar] [CrossRef] [PubMed]
- Seitzinger, S.P. Denitrification in freshwater and coastal marine ecosystems: Ecological and geochemical significance. Limnology Oceanography 1988, 33, 702–724. [Google Scholar] [CrossRef]
- Kuypers, M.M.M.; Marchant, H.K.; Kartal, B. The microbial nitrogen-cycling network. Nat. Rev. Genet. 2018, 16, 263–276. [Google Scholar] [CrossRef]
- Liu, S.; Wang, C.; Hou, J.; Wang, P.; Miao, L.; Fan, X.; You, G.; Xu, Y. Effects of Ag and Ag2S nanoparticles on denitrification in sediments. Water Res. 2018, 137, 28–36. [Google Scholar] [CrossRef] [PubMed]
- Valett, H.M.; Thomas, S.A.; Mulholland, P.J.; Webster, J.R.; Dahm, C.N.; Fellows, C.S.; Crenshaw, C.L.; Peterson, C.G. Endogenous and exogenous control of ecosystem function: N cycling in headwater streams. Ecology 2008, 89, 3515–3527. [Google Scholar] [CrossRef] [PubMed] [Green Version]
- Wu, T.; Qin, B.; Brookes, J.D.; Yan, W.; Ji, X.; Feng, J. Spatial distribution of sediment nitrogen and phosphorus in Lake Taihu from a hydrodynamics-induced transport perspective. Sci. Total. Environ. 2019, 650, 1554–1565. [Google Scholar] [CrossRef]
- Xu, H.; Guo, L. Molecular size-dependent abundance and composition of dissolved organic matter in river, lake and sea waters. Water Res. 2017, 117, 115–126. [Google Scholar] [CrossRef]
- Jiang, X.; Gao, G.; Zhang, L.; Tang, X.; Shao, K.; Hu, Y. Denitrification and dissimilatory nitrate reduction to ammonium in freshwater lakes of the Eastern Plain, China: Influences of organic carbon and algal bloom. Sci. Total. Environ. 2020, 710, 136303. [Google Scholar] [CrossRef] [PubMed]
- Shi, L.; Huang, Y.; Zhang, M.; Yu, Y.; Lu, Y.; Kong, F. Bacterial community dynamics and functional variation during the long-term decomposition of cyanobacterial blooms in-vitro. Sci. Total Environ. 2017, 598, 77–86. [Google Scholar] [CrossRef]
- Zhu, L.; Shi, W.; Van Dam, B.; Kong, L.; Yu, J.; Qin, B. Algal Accumulation Decreases Sediment Nitrogen Removal by Uncoupling Nitrification-Denitrification in Shallow Eutrophic Lakes. Environ. Sci. Technol. 2020, 54, 6194–6201. [Google Scholar] [CrossRef]
- Trolle, D.; Zhu, G.; Hamilton, D.; Luo, L.; McBride, C.; Zhang, L. The influence of water quality and sediment geochemistry on the horizontal and vertical distribution of phosphorus and nitrogen in sediments of a large, shallow lake. Hydrobiologia 2009, 627, 31–44. [Google Scholar] [CrossRef]
- Li, H.; Hollstein, M.; Podder, A.; Gupta, V.; Barber, M.; Goel, R. Cyanotoxin impact on microbial-mediated nitrogen trans-formations at the interface of sediment-water column in surface water bodies. Environ. Pollut. 2020, 266, 115283. [Google Scholar] [CrossRef]
- Li, C.; Ding, S.; Yang, L.; Wang, Y.; Ren, M.; Chen, M.; Fan, X.; Lichtfouse, E. Diffusive gradients in thin films: Devices, materials and applications. Environ. Chem. Lett. 2019, 17, 801–831. [Google Scholar] [CrossRef]
- Warnken, K.W.; Zhang, H.; Davison, W. Accuracy of the Diffusive Gradients in Thin-Films Technique: Diffusive Boundary Layer and Effective Sampling Area Considerations. Anal. Chem. 2006, 78, 3780–3787. [Google Scholar] [CrossRef] [PubMed]
- Qi, C.; Zhang, L.; Fang, J.; Lei, B.; Tang, X.C.; Huang, H.X.; Wang, Z.S.; Si, Z.J.; Wang, G.X. Benthic cyanobacterial detritus mats in lacustrine sediment: Characterization and odorant producing potential. Environ. Pollut. 2020, 256, 11. [Google Scholar] [CrossRef] [PubMed]
- Sima, W.; Hu, M.; He, Q.; Qiu, Y.; Lv, Y.; Dai, L.; Shao, Q.; Zhou, T.; Li, H.; Zhou, M.; et al. Regulation of nitrogen dynamics at the sediment-water interface during HAB degradation and subsequent reoccurrence. RSC Adv. 2020, 10, 13480–13488. [Google Scholar] [CrossRef]
- Zhu, M.; Zhu, G.; Zhao, L.; Yao, X.; Zhang, Y.; Gao, G.; Qin, B. Influence of algal bloom degradation on nutrient release at the sediment–water interface in Lake Taihu, China. Environ. Sci. Pollut. Res. 2013, 20, 1803–1811. [Google Scholar] [CrossRef]
- Davidson, T.A.; Audet, J.; Svenning, J.-C.; Lauridsen, T.L.; Søndergaard, M.; Landkildehus, F.; Larsen, S.E.; Jeppesen, E. Eutrophication effects on greenhouse gas fluxes from shallow-lake mesocosms override those of climate warming. Glob. Chang. Biol. 2015, 21, 4449–4463. [Google Scholar] [CrossRef]
- Qin, B.; Xu, P.; Wu, Q.; Luo, L.; Zhang, Y. Environmental issues of Lake Taihu, China. Hydrobiologia 2007, 581, 3–14. [Google Scholar] [CrossRef]
- Li, Z.; Li, X.; Wang, X.; Ma, J.; Xu, J.; Xu, X.; Han, R.; Zhou, Y.; Yan, X.; Wang, G. Isotopic evidence revealing spatial heterogeneity for source and composition of sedimentary organic matters in Taihu Lake, China. Ecol. Indic. 2020, 109, 105854. [Google Scholar] [CrossRef]
- Miao, S.; Li, Y.; Wu, Z.; Lyu, H.; Li, Y.; Bi, S.; Xu, J.; Lei, S.; Mu, M.; Wang, Q. A Semianalytical Algorithm for Mapping Proportion of Cyanobacterial Biomass in Eutrophic Inland Lakes Based on OLCI Data. IEEE Trans. Geosci. Remote. Sens. 2020, 58, 5148–5161. [Google Scholar] [CrossRef]
- Andersen, K.; Kjær, T.; Revsbech, N.P. An oxygen insensitive microsensor for nitrous oxide. Sens. Actuators B Chem. 2001, 81, 42–48. [Google Scholar] [CrossRef]
- Liss, P.; Nygren, A.; Revsbech, N.P.; Ulfendahl, H.R. Measurements of oxygen tension in the rat kidney after contrast media using an oxygen microelectrode with a guard cathode. Adv. Exp. Med. Biol. 1997, 411, 569–576. [Google Scholar] [PubMed]
- Rabouille, C.; Denis, L.; Dedieu, K.; Stora, G.; Lansard, B.; Grenz, C. Oxygen demand in coastal marine sediments: Comparing in situ microelectrodes and laboratory core incubations. J. Exp. Mar. Biol. Ecol. 2003, 285, 49–69. [Google Scholar] [CrossRef]
- Cook, P.L.M.; Revill, A.T.; Butler, E.C.V.; Eyre, B.D. Carbon and nitrogen cycling on intertidal mudflats of a temperate Australian estuary. II. Nitrogen cycling. Mar. Ecol. Prog. Ser. 2004, 280, 39–54. [Google Scholar] [CrossRef]
- Elberling, B.; Christiansen, H.H.; Hansen, B.U. High nitrous oxide production from thawing permafrost. Nat. Geosci. 2010, 3, 332–335. [Google Scholar] [CrossRef]
- Chen, M.; Ding, S.; Liu, L.; Xu, D.; Han, C.; Zhang, C. Iron-coupled inactivation of phosphorus in sediments by macrozoobenthos (chironomid larvae) bioturbation: Evidences from high-resolution dynamic measurements. Environ. Pollut. 2015, 204, 241–247. [Google Scholar] [CrossRef] [PubMed]
- Chen, M.S.; Ding, S.M.; Wu, Y.X.; Fan, X.F.; Jin, Z.F.; Tsang, D.C.W.; Wang, Y.; Zhang, C.S. Phosphorus mobilization in lake sediments: Experimental evidence of strong control by iron and negligible influences of manganese redox reactions. Environ. Pollut. 2019, 246, 472–481. [Google Scholar] [CrossRef] [PubMed]
- Xu, D.; Chen, Y.; Ding, S.; Sun, Q.; Wang, Y.; Zhang, C.; Ding, D. Diffusive Gradients in Thin Films Technique Equipped with a Mixed Binding Gel for Simultaneous Measurements of Dissolved Reactive Phosphorus and Dissolved Iron. Environ. Sci. Technol. 2013, 47, 10477–10484. [Google Scholar] [CrossRef] [PubMed]
- Chen, M.; Ding, S.; Gao, S.; Fu, Z.; Tang, W.; Wu, Y.; Gong, M.; Wang, D.; Wang, Y. Efficacy of dredging engineering as a means to remove heavy metals from lake sediments. Sci. Total Environ. 2019, 665, 181–190. [Google Scholar] [CrossRef]
- Ding, S.; Sun, Q.; Chen, X.; Liu, Q.; Wang, D.; Lin, J.; Zhang, C.; Tsang, D.C.W. Synergistic adsorption of phosphorus by iron in lanthanum modified bentonite (Phoslock (R)): New insight into sediment phosphorus immobilization. Water Res. 2018, 134, 32–43. [Google Scholar] [CrossRef] [PubMed]
- Xu, D.; Wu, W.; Ding, S.; Sun, Q.; Zhang, C. A high-resolution dialysis technique for rapid determination of dissolved reactive phosphate and ferrous iron in pore water of sediments. Sci. Total. Environ. 2012, 422, 245–252. [Google Scholar] [CrossRef]
- Henry, S.; Bru, D.; Stres, B.; Hallet, S.; Philippot, L. Quantitative Detection of the nosZ Gene, Encoding Nitrous Oxide Reductase, and Comparison of the Abundances of 16S rRNA, narG, nirK, and nosZ Genes in Soils. Appl. Environ. Microbiol. 2006, 72, 5181–5189. [Google Scholar] [CrossRef] [PubMed] [Green Version]
- You, B.; Zhong, J.; Fan, C.; Wang, T.; Zhang, L.; Ding, S. Effects of hydrodynamics processes on phosphorus fluxes from sediment in large, shallow Taihu Lake. J. Environ. Sci. 2007, 19, 1055–1060. [Google Scholar] [CrossRef]
- Lee, M.H.; Osburn, C.L.; Shin, K.H.; Hur, J. New insight into the applicability of spectroscopic indices for dissolved organic matter (DOM) source discrimination in aquatic systems affected by biogeochemical processes. Water Res. 2018, 147, 164–176. [Google Scholar] [CrossRef] [PubMed]
- Bittar, T.B.; Stubbins, A.; Vieira, A.A.H.; Mopper, K. Characterization and photodegradation of dissolved organic matter (DOM) from a tropical lake and its dominant primary producer, the cyanobacteria Microcystis aeruginosa. Mar. Chem. 2015, 177, 205–217. [Google Scholar] [CrossRef] [Green Version]
- Li, P.H.; Hur, J. Utilization of UV-Vis spectroscopy and related data analyses for dissolved organic matter (DOM) studies: A review. Crit. Rev. Environ. Sci. Technol. 2017, 47, 131–154. [Google Scholar] [CrossRef]
- Derrien, M.; Yang, L.; Hur, J. Lipid biomarkers and spectroscopic indices for identifying organic matter sources in aquatic environments: A review. Water Res. 2017, 112, 58–71. [Google Scholar] [CrossRef] [PubMed]
- Lv, J.; Han, R.; Huang, Z.; Luo, L.; Cao, D.; Zhang, S. Relationship between Molecular Components and Reducing Capacities of Humic Substances. ACS Earth Space Chem. 2018, 2, 330–339. [Google Scholar] [CrossRef]
- Zhou, J.; Wang, J.; Baudon, A.; Chow, A. Improved Fluorescence Excitation-Emission Matrix Regional Integration to Quantify Spectra for Fluorescent Dissolved Organic Matter. J. Environ. Qual. 2013, 42, 925–930. [Google Scholar] [CrossRef] [PubMed] [Green Version]
- Zhang, L.; Zhang, J.; Zeng, G.; Dong, H.; Chen, Y.; Huang, C.; Zhu, Y.; Xu, R.; Cheng, Y.; Hou, K.; et al. Multivariate relationships between microbial communities and environmental variables during co-composting of sewage sludge and agricultural waste in the presence of PVP-AgNPs. Bioresour. Technol. 2018, 261, 10–18. [Google Scholar] [CrossRef] [PubMed]
- Peng, Y.; Liu, L.; Jiang, L.; Xiao, L. The roles of cyanobacterial bloom in nitrogen removal. Sci. Total. Environ. 2017, 609, 297–303. [Google Scholar] [CrossRef] [PubMed]
- Wang, H.; Wang, W.; Yin, C.; Wang, Y.; Lu, J. Littoral zones as the “hotspots” of nitrous oxide (N2O) emission in a hyper-eutrophic lake in China. Atmos. Environ. 2006, 40, 5522–5527. [Google Scholar]
Figure 1.
Study area and sampling sites in Lake Taihu, China. The black stars (★) represent the sample sites. Color pattern represents distribution of proportion of cyanobacterial biomass (PCB) in Lake Taihu on 18 May 2017, which were referred to by Miao et al. [31].
Figure 1.
Study area and sampling sites in Lake Taihu, China. The black stars (★) represent the sample sites. Color pattern represents distribution of proportion of cyanobacterial biomass (PCB) in Lake Taihu on 18 May 2017, which were referred to by Miao et al. [31].

Figure 2.
Dissolved oxygen concentration variation in sediment profiles of sampling sites, from June 2019. Dashed lines indicated approximate positions of sediment–water interface (SWI). Note the different Y-axis scaling in YL. (a) DGH-1 (b) DGH-2 (c) FDG (d) WXG (e) XKW (f) YL.
Figure 2.
Dissolved oxygen concentration variation in sediment profiles of sampling sites, from June 2019. Dashed lines indicated approximate positions of sediment–water interface (SWI). Note the different Y-axis scaling in YL. (a) DGH-1 (b) DGH-2 (c) FDG (d) WXG (e) XKW (f) YL.

Figure 3.
Vertical distribution of dissolved inorganic nitrogen (DIN) concentration in sediment profiles of sampling sites. NH4+-N (a) and NO3−-N (b) concentration were measured by AMP-TH DGT with 2 mm intervals and NO2−-N (c) concentrations were measured by HR-Peeper with 5 mm intervals. Dashed lines indicated approximated positions of sediment–water interface (SWI).

Figure 4.
Vertical distribution of UV-Vis spectroscopy absorption coefficient α(254) of sediment pore water in sampling sites. Dashed lines indicated approximated positions of sediment–water interface (SWI).
Figure 4.
Vertical distribution of UV-Vis spectroscopy absorption coefficient α(254) of sediment pore water in sampling sites. Dashed lines indicated approximated positions of sediment–water interface (SWI).

Figure 5.
Redundancy analysis plot of the relationship among the nitrogen transform bacteria and dominant environmental parameters in sediment cores at 0–9 cm (a), surficial sediment at 0–3 cm (b), intermediate sediment at 3–6 cm (c) and profundal sediment at 6–9 cm (d). Red solid lines indicate major environmental variables. Blue solid lines show the top five bacteria in relative abundance at genus level. Geometric graphs represent the sampling location. (For interpretation of the references to color in this figure legend, the reader is referred to the Web version of this article.).

Figure 6.
Average nosZ gene abundance in each sediment of different depths.

Figure 7.
Apparent diffusion fluxes of DIN across the sediment–water interface of different sampling sites, from Jun 2019. Positive values represented upward flux and negative values represented downward flux.
Figure 7.
Apparent diffusion fluxes of DIN across the sediment–water interface of different sampling sites, from Jun 2019. Positive values represented upward flux and negative values represented downward flux.

Figure 8.
Conceptual diagram of the effect of different cyanobacteria biomass decomposition on sediment nitrogen cycling at the sediment–water interface (SWI) in eutrophic freshwater lake ecosystem.
Figure 8.
Conceptual diagram of the effect of different cyanobacteria biomass decomposition on sediment nitrogen cycling at the sediment–water interface (SWI) in eutrophic freshwater lake ecosystem.


Table 1.
The extent of algal bloom hazard, mean values of physicochemical characteristics of overlying water.
Table 1.
The extent of algal bloom hazard, mean values of physicochemical characteristics of overlying water.
| Sample Sites | pH | ORP (mV) | DO (µM L−1) | NH4+-N (mg L−1) | NO3−-N (mg L−1) | NO2−-N (mg L−1) | SRP (mg L−1) | Chl-a (μg L−1) |
|---|---|---|---|---|---|---|---|---|
| XKW | 6.95 | 464.28 | 252.76 | 0.20 | 3.78 | 1.29 | 2.63 | 8.23 |
| WXG | 7.73 | 491.38 | 245.48 | 0.18 | 3.71 | 1.24 | 5.63 | 53.04 |
| DGH-1 | 6.65 | 141.01 | 230.25 | 0.23 | 3.83 | 1.25 | 1.21 | 61.63 |
| DGH-2 | 7.74 | 140.12 | 210.56 | 0.11 | 3.84 | 1.26 | 1.78 | 38.22 |
| FDG | 7.3 | 219.10 | 260.58 | 0.22 | 2.84 | 1.26 | 1.31 | 64.98 |
| YL | 7.91 | 382.43 | 244.13 | 0.16 | 4.34 | 1.30 | 0.99 | 43.21 |
Publisher’s Note: MDPI stays neutral with regard to jurisdictional claims in published maps and institutional affiliations. |
© 2021 by the authors. Licensee MDPI, Basel, Switzerland. This article is an open access article distributed under the terms and conditions of the Creative Commons Attribution (CC BY) license (http://creativecommons.org/licenses/by/4.0/).
Share and Cite
MDPI and ACS Style
Yao, Y.; Liu, H.; Han, R.; Li, D.; Zhang, L. Identifying the Mechanisms behind the Positive Feedback Loop between Nitrogen Cycling and Algal Blooms in a Shallow Eutrophic Lake. Water 2021, 13, 524. https://doi.org/10.3390/w13040524
AMA Style
Yao Y, Liu H, Han R, Li D, Zhang L. Identifying the Mechanisms behind the Positive Feedback Loop between Nitrogen Cycling and Algal Blooms in a Shallow Eutrophic Lake. Water. 2021; 13(4):524. https://doi.org/10.3390/w13040524
Chicago/Turabian StyleYao, Yu, Huaji Liu, Ruiming Han, Dujun Li, and Limin Zhang. 2021. "Identifying the Mechanisms behind the Positive Feedback Loop between Nitrogen Cycling and Algal Blooms in a Shallow Eutrophic Lake" Water 13, no. 4: 524. https://doi.org/10.3390/w13040524
Note that from the first issue of 2016, this journal uses article numbers instead of page numbers. See further details here.