
Distribution of Groundwater Arsenic in Uruguay Using Hybrid Machine Learning and Expert System Approaches


1
Department of Earth and Environmental Sciences, School of Natural Sciences and Williamson Research Centre for Molecular Environmental Sciences, University of Manchester, Manchester M13 9PL, UK
2
Departamento del Agua, Centro Universitario Regional Litoral Norte, Universidad de la República, Gral. Rivera 1350, Salto 50000, Uruguay
3
PDU Geología y Recursos Minerales, Centro Universitario Regional Este, Universidad de la República, Ruta 8 km 282, Treinta y Tres 33000, Uruguay
*
Authors to whom correspondence should be addressed.
Water 2021, 13(4), 527; https://doi.org/10.3390/w13040527
Submission received: 20 December 2020
/
Revised: 9 February 2021
/
Accepted: 10 February 2021
/
Published: 18 February 2021
Abstract
:Groundwater arsenic in Uruguay is an important environmental hazard, hence, predicting its distribution is important to inform stakeholders. Furthermore, occurrences in Uruguay are known to variably show dependence on depth and geology, arguably reflecting different processes controlling groundwater arsenic concentrations. Here, we present the distribution of groundwater arsenic in Uruguay modelled by a variety of machine learning, basic expert systems, and hybrid approaches. A pure random forest approach, using 26 potential predictor variables, gave rise to a groundwater arsenic distribution model with a very high degree of accuracy (AUC = 0.92), which is consistent with known high groundwater arsenic hazard areas. These areas are mainly in southwest Uruguay, including the Paysandú, Río Negro, Soriano, Colonia, Flores, San José, Florida, Montevideo, and Canelones departments, where the Mercedes, Cuaternario Oeste, Raigón, and Cretácico main aquifers occur. A hybrid approach separating the country into sedimentary and crystalline aquifer domains resulted in slight material improvement in a high arsenic hazard distribution. However, a further hybrid approach separately modelling shallow (<50 m) and deep aquifers (>50 m) resulted in the identification of more high hazard areas in Flores, Durazno, and the northwest corner of Florida departments in shallow aquifers than the pure model. Both hybrid models considering depth (AUC = 0.95) and geology (AUC = 0.97) produced improved accuracy. Hybrid machine learning models with expert selection of important environmental parameters may sometimes be a better choice than pure machine learning models, particularly where there are incomplete datasets, but perhaps, counterintuitively, this is not always the case.
1. Introduction
Arsenic in groundwater utilized as drinking water constitutes a major public health hazard in many parts of the world [1], most notably in Asia [2,3,4,5,6], but also in South America [7,8]. While the countries most impacted in South America have been reported as Argentina [9,10] and Chile [11], groundwater arsenic has also been identified as a public health concern in Uruguay since 2007 [12,13]. High groundwater arsenic occurrences in Uruguay have been documented in the Raigón and Mercedes aquifers in southwest Uruguay [12,14]. Strong positive correlations were reported between arsenic, vanadium, fluoride, and sodium in shallow wells up to 50 m in depth [15,16]. Quaternary ash deposits were regarded as a possible primary source of geogenic arsenic in aquifers in the southern part of the country [14,17,18].
The utilization of groundwater resources has increased rapidly since the 1950s. In Uruguay, domestic drinking water demands in urban areas are mainly satisfied by the Obras Sanitarias del Estado (OSE), Uruguay’s national water supply company. OSE has approximately 600 water outlets all around the country. For two cities in the northern part of the country, Rivera and Artigas, such groundwater represents 100% and 80%, respectively, of drinking water supplies. The main challenge OSE faces in relation to groundwater quality is high levels of arsenic, followed by high concentrations of nitrate and fluoride in some areas. Arsenic represents a water quality concern both in urban areas, largely supplied by OSE, and in rural areas, where many householders rely on private wells for drinking water.
Epidemiological studies have demonstrated that long-term exposure to arsenic can lead to various skin diseases, cancers, and cardiovascular diseases [1]. Drinking arsenic-contaminated groundwater or consuming crops, notably rice, grown in high-arsenic soils and irrigated with arsenic-contaminated groundwater are the main intake pathways. The provisional guideline value of arsenic in drinking water recommended by the World Health Organization (WHO) is 10 μg/L [1]. It is expected that the Uruguayan regulations for arsenic in drinking water could be reduced from 20 μg/L to 10 μg/L in 2021 [19].
Spatial geostatistical models have been used to predict the distribution of groundwater arsenic at a global scale [20,21], at a regional scale [22,23], for individual countries (India [24], Pakistan [25], Bangladesh [26], Cambodia [27], China [28], USA [29], and Burkina Faso [30]), or for individual states [31]. Notwithstanding recent compilations of groundwater arsenic data for Uruguay, a country-wide and country-specific groundwater arsenic distribution model has not yet been developed. Recent global models [20] did not utilize groundwater arsenic concentration data from Uruguay. Advances in the monitoring, collation, and public availability of groundwater arsenic data by the OSE provide the opportunity for much more comprehensive models of groundwater arsenic distribution in Uruguay to be constructed.
Machine learning approaches (e.g., random forest) can and have been used to predict the distribution of arsenic contamination in groundwater effectively [20,23,24,26,32]. To date, most of the machine learning prediction models for the distribution of arsenic in groundwater have been pure machine learning models. However, hybrid machine learning models using expert selection for important factors, such as groundwater depth and geology, are worthy of being studied to determine whether they have better predictive performance than pure machine learning models.
The aim of this work was to develop and render detailed models of groundwater arsenic distribution in Uruguay by both a pure machine learning method and a hybrid machine learning method with expert selection for groundwater depth and geology, using a comprehensive dataset of groundwater arsenic concentrations combined with various environmental parameters. We also aimed to compare prediction performance between pure and hybrid machine learning models (Table 1), and to explore potential differences in groundwater arsenic distribution: (a) between shallow and deeper aquifers, and (b) between sedimentary and crystalline aquifers in Uruguay.
2. Materials and Methods
2.1. Study Area
Uruguay is a country in the southeast part of South America, bordered by Argentina to the west, Brazil to the east and north, the Río de la Plata estuary to the south, and the Atlantic Ocean to the southeast. Uruguay has a population of around 3.3 million, of which 1.8 million live in its capital and largest city, Montevideo [33].
In Uruguay, the geological environments of the major aquifers used for water supply reveal a great deal of variability, ranging from a sedimentary basin fill with good matrix porosity and permeability to a crystalline basement with permeability largely related to interconnected faults and fractures [17,34].
The country consists of three hydrogeological systems: the Paranaense, Meridional, and Costero systems [35]. The Paranaense system, located in the northcentral and northeast parts of the country, includes the Arapey fissured basaltic aquifer and the Guaraní, Mercedes, and Salto sedimentary aquifers. The Guaraní aquifer is one of the largest freshwater reservoirs in the world, and one of the most important aquifers in the country. The Guaraní aquifer contains approximately 37,000 km3 of water, covering 1.2 million km2 in Argentina, Brazil, Paraguay, and Uruguay [16]. The Meridional system underlies most of the country’s area, and is comprised largely of fissured aquifers of the Uruguayan Precambrian cratons [34,36,37]. The Costero system is formed by: (i) the Raigón sedimentary aquifer of the Santa Lucía Basin, which is the largest reserve of groundwater in the southern part of the country; (ii) quaternary sediments of the Merín Basin; and (iii) the Chuy aquifer, located on the eastern Uruguayan coast [17,34,35].
Groundwater arsenic, in general, may be associated with some possible anthropogenic sources, such as fertilizer and pesticides, mining activities, and industrial/urban pollution of large population centers [38]. However, to date, there has been little if any definite evidence for anthropogenic arsenic in Uruguayan aquifers; rather, the natural origins of groundwater arsenic have received widespread attention in Uruguay. The bulk concentration of arsenic in the upper continental crust is between 1.5 to 2 mg/kg [39], although it can be much higher in certain igneous and metamorphic rocks, as well as some types of sedimentary rocks, such as mudstones [40]. In Uruguay, high arsenic concentrations have been found in the following geological units: (i) Precambrian basement rocks related to sulfur-bearing minerals, notably pyrite and arsenopyrite; (ii) sedimentary aquifers (e.g., Raigón and Salto Aquifers) from the Tertiary Period to the present impacted by ash-fall deposits from Andes volcanic activities [41]; arsenic occurs within a large variety of minerals, as well as being absorbed into clay and oxide-hydroxide minerals; and (iii) the Guaraní aquifer, inferred from high arsenic concentrations detected in some water wells [16] and suspected to be related to the alteration of sulfur minerals.
Dissolved arsenic species in Uruguay aquifers are dominated by inorganic As(III) and As(V), but with contrasting As(III)/As(V) ratios in different aquifer types [15]. As(V) has been found to be the predominant species in the majority of the aquifers, particularly those with elevated arsenic concentrations; low As(III)/As(V) ratios are typically associated with elevated pH, possibly reflecting pH-dependent desorption processes as a major mechanism for arsenic mobilization. As(III) has been found to be the predominant species in groundwater from the Guaraní aquifer, while groundwater from the Mercedes aquifer typically has been found to have intermediate As(III)/As(v) ratios [15].
2.2. Dataset Compilation
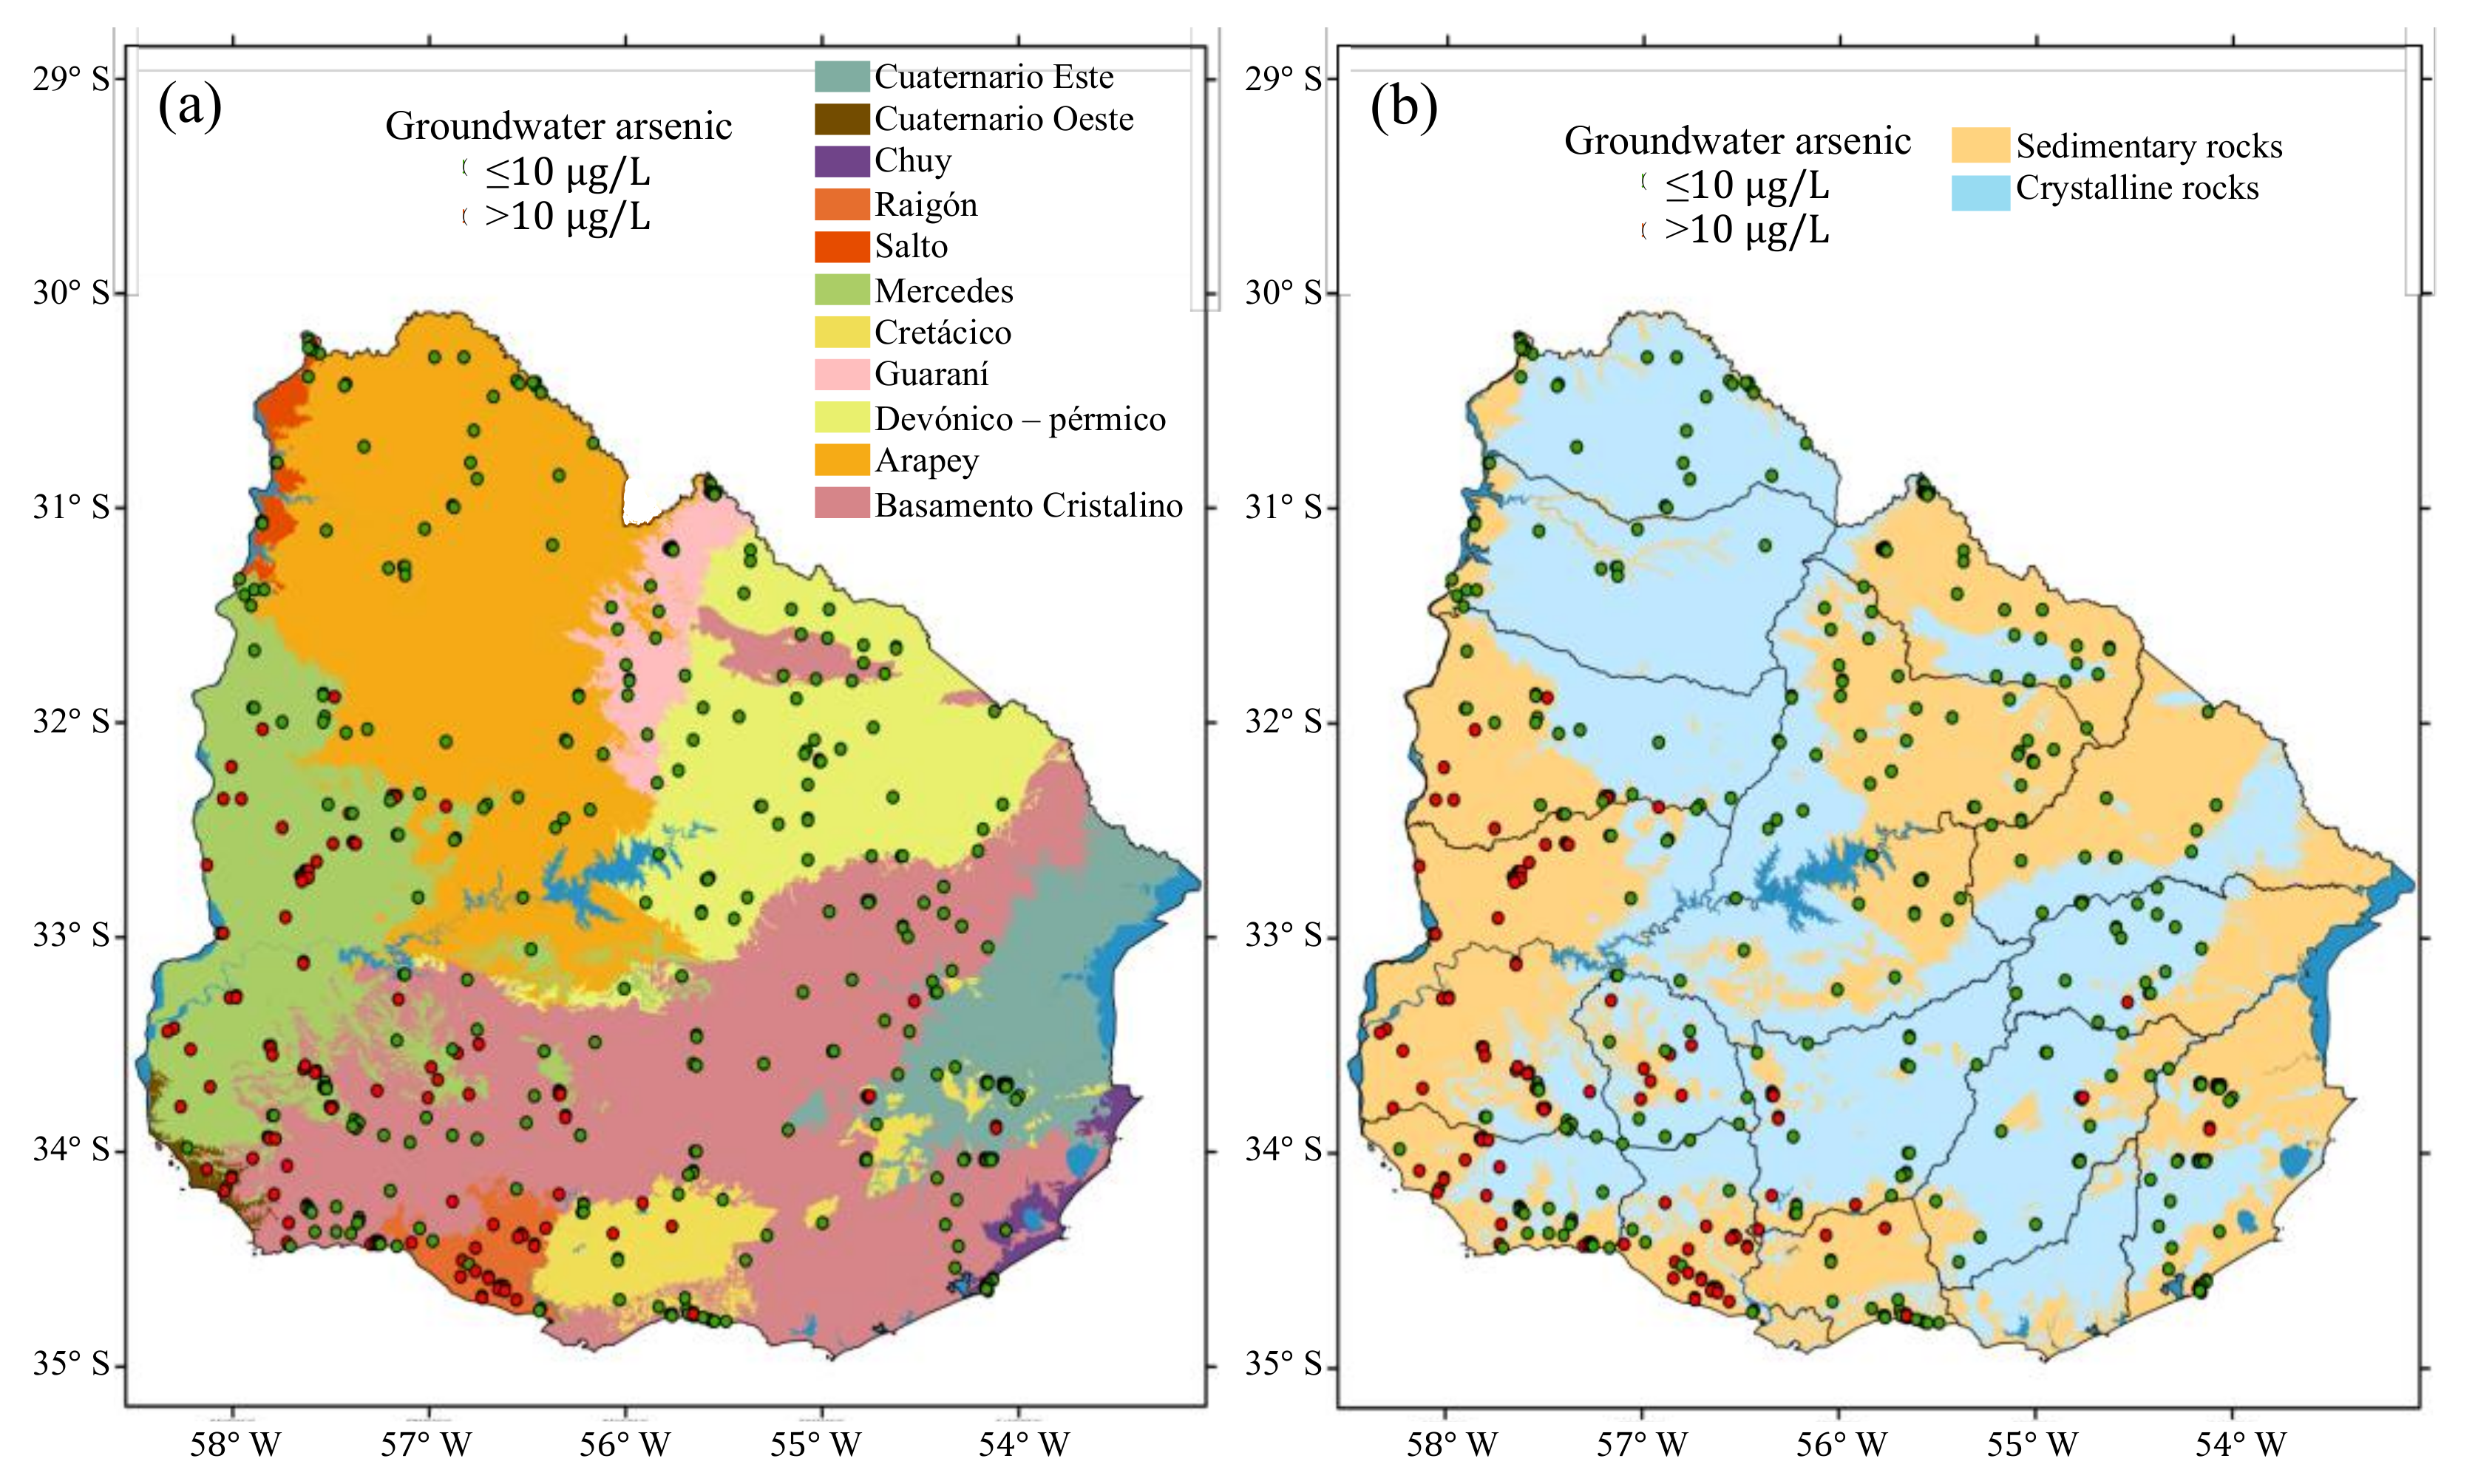
Geolocated (longitude/latitude) (Figure 1) groundwater total arsenic concentration (tAs) data (n = 504), mostly (n = 432) accompanied by depth data, were kindly provided by the Uruguay public water supply company, Obras Sanitarias del Estado (OSE). For each well, the average of the arsenic concentrations from sampling carried out in 2018 and 2019 was used, although no systematic substantial variations in arsenic concentration with the year of sampling were noted: (i) 140 arsenic data points exceeded a concentration of 10 μg/L; and (ii) 347 data points were located in the sedimentary aquifers and 157 data points were located in the crystalline aquifers. Figure S1 shows the frequency of groundwater arsenic concentrations.
In total, 26 potential predictors, selected based on established and proposed relationships with models of the release and enrichment of groundwater arsenic [2,42,43], were used to produce models. The potential predictors were related to: (i) climate: actual evapotranspiration [44], aridity [45], potential evapotranspiration [45], precipitation [44], the Priestley–Taylor alpha coefficient [44], and temperature [45]; (ii) soil: calcisols [46], clay [46], coarse fragments [46], fluvisols [46], gleysols [46], sand [46], silt [46], soil cation exchange capacity [46], soil pH [46], soil organic carbon density [46], soil organic carbon content [46], soil organic carbon stock [46], soil and sedimentary deposit thickness [47], solonchaks [46], and water wilting points [46]; (iii) topography: elevation [48], slope [49], landform [49], and topographic wetness index [49]; and (iv) lithology [49]. The detailed descriptions of the predictors are shown in Table S1.
2.3. Dataset Preparation
Prior to modelling, 504 arsenic concentrations were assigned to one square kilometer pixels. Where more than one data point was available within a pixel, the geometric mean of those values was taken to represent the groundwater arsenic concentration of the pixel, resulting in a reduction of the number of groundwater arsenic data to 434. Of these, 26% (115) groundwater arsenic concentrations exceeded 10 μg/L. The prediction of a binary dependent variable can avoid some related uncertainties, therefore improving the accuracy and effectiveness of models. The averaged arsenic concentrations were therefore converted into a binary variable (0 or 1) according to whether the arsenic concentration was less than or equal to 10 μg/L or greater than 10 μg/L. The proportions of arsenic concentrations by pixel exceeding 10 μg/L in each department (administrative division) and the whole of the country are listed in Table 2.
The above dataset was used to develop a pure overall model to predict the distribution of groundwater arsenic in the whole country. For comparison to hybrid models with expert parameter selection and robust accounting for potential differences in groundwater arsenic distribution between shallow and deep and between sedimentary and crystalline aquifers in Uruguay, four other subsets of the data were prepared and modelled: (i) shallow aquifers (≤50 m, 234 arsenic concentrations); (ii) deep aquifers (>50 m, 153 arsenic concentrations); (iii) sedimentary aquifers (300 arsenic concentrations); and (iv) crystalline aquifers (134 arsenic concentrations). Then, the five datasets were randomly split into training (80%) and testing (20%) datasets, maintaining the same ratio of low to high values in the entire set and the subsets [24,31].
2.4. Machine Learning (Random Forest) Modelling
A random forest model is an ensemble of decision trees, and is a classification model that can be used to predict binary target variables. In a random forest model, the binary dependent variable (groundwater arsenic concentration in this study) is split based on both independent variables at each branch and their cutoff values. In a random forest, randomness is introduced into the growth of each individual decision tree by: (i) only two or three data rows in the training dataset being used to grow an individual tree (some of which are selected multiple times due to random selection with replacement of data rows); and (ii) a restricted number of predictors and randomly chosen predictor combinations at each branch, leading to trees developing differently. Introduced randomness and taking the classification average of the class prediction results of all trees as the final result effectively eliminates multicollinearity amongst predictor variables, producing a more robust model. [50,51]
In order to comprehensively understand the distribution of arsenic in groundwater, compare the prediction performance between pure and hybrid machine learning models, and discover differences in groundwater arsenic distribution between shallow and deep and between sedimentary and crystalline aquifers in Uruguay, we first established five models (Table 1): (i) pure overall (1A-ML-Pure) (Figure 2) hybrid, (ii) shallow (2A-HML-Shal), and (iii) deep (2B-HML-Deep) models with expert selection for groundwater depth (Figure 3); and hybrid (iv) sedimentary (3A-HML-Sed) and (v) crystalline (3B-HML-Cry) models with expert selection for surface geology (Figure 4).
The optimal number of predictors at each branch of the trees grown in a random forest was determined by trying values between 1 and 26 (the total number of potential predictors) and comparing the out-of-bag (OOB) error results. The number with the smallest OOB error, which produced the most accurate model, was then used as the optimal number [24]. The random forest models produced in this study encompassed 1001 trees. These models were applied to create the probability maps of groundwater arsenic concentrations exceeding 10 µg/L in Uruguay.
Then, the probability maps were converted into occurrence maps of groundwater arsenic concentrations exceeding 10 µg/L by using two approaches: (i) a default probability cutoff value of 0.5, and (ii) the cutoff where sensitivity was equal to specificity [24,31], representing a model that arguably classifies high and low arsenic values equally well.
The accuracy of each random forest model was evaluated by the area (AUC) under the receiver operating characteristic (ROC) curve calculated on its testing dataset, which is produced in turn by plotting sensitivity and specificity against the probability cutoff from 0 to 1. The area under the ROC curve (AUC) in general varies between 0.5 (for a random model) and 1 (for a perfect model) [52]. An AUC < 0.5 can theoretically be achieved for a model that is worse than random.
2.5. The Importance of the Predictors
The importance of the predictors in the random forest models were assessed by two statistical indices: (i) the decrease in accuracy, and (ii) the decrease in Gini node impurity. Both decreases in the two indexes were normalized by their largest values, respectively. Higher positive values of the decreases in accuracy and Gini node impurity indicated a greater relative importance of the predictor. Nevertheless, predictors with a negative decrease in value do not benefit the model, and were therefore removed from the models.
2.6. The Comparison of Prediction Performance between Pure and Hybrid Machine Learning Models
Hybrid machine learning models using expert selection for important factors, in this case depth and geology, are worthy of being studied to determine whether they have better predictive performance than pure ones. We combined shallow with deep and sedimentary with crystalline testing datasets to calculate AUC values of hybrid depth (2C-HML-Depth) and geology (3C-HML-Geol) models, respectively, and then compared with the AUC value of the pure overall model (1A-ML-Pure). Furthermore, another pure overall model with sedimentary or crystalline as the new predictor (1B-ML-Pure with Geol) was created to compare with the hybrid geology (sedimentary and crystalline; 3C-HML-Geol) models, so that the impact of expert selection of groundwater geology (sedimentary and crystalline) could be evaluated intuitively and effectively. Hybrid machine learning models were also compared with a simple expert system aquifer model (4-ES-Aqui), which consisted of the percentage (%) of OSE arsenic concentrations by pixel exceeding 10 μg/L in each aquifer in Uruguay (Table 1).
3. Results and Discussion
3.1. Pure Overall Machine Learning Model
A total of 434 averaged groundwater arsenic concentrations (26% > 10 μg/L) and their matching potential predictors were used to develop the pure overall model (1A-ML-Pure) for the whole of Uruguay. The optimal number (producing the lowest out-of-bag (OOB) error) of predictors at each branch of the trees grown in the pure overall random forest was 19. The comparison of the OOB error results by varying the branch predictor number between 1 to 26 is shown in Table S2. Two potential predictors, calcisols and fluvisols, with negative mean decreases in accuracy and/or Gini node impurity did not contribute to the model, hence, they were removed from the model (1A-ML-Pure).
The cross-validation results of the pure overall model (1A-ML-Pure) as applied to its testing dataset are plotted in Figure S2a. The area under the ROC (receiver operator characteristic) curve (AUC) was 0.92. This was somewhat better than that (AUC = 0.89) for a recent global groundwater arsenic random forest model, the dataset of which does not contain any arsenic concentration from Uruguay [20]. The pure overall model (1A-ML-Pure) presented here, therefore, provided a better prediction result at the country-specific scale for Uruguay. This is perhaps not a surprising result, given the global diversity of processes leading to elevated groundwater arsenic concentrations.
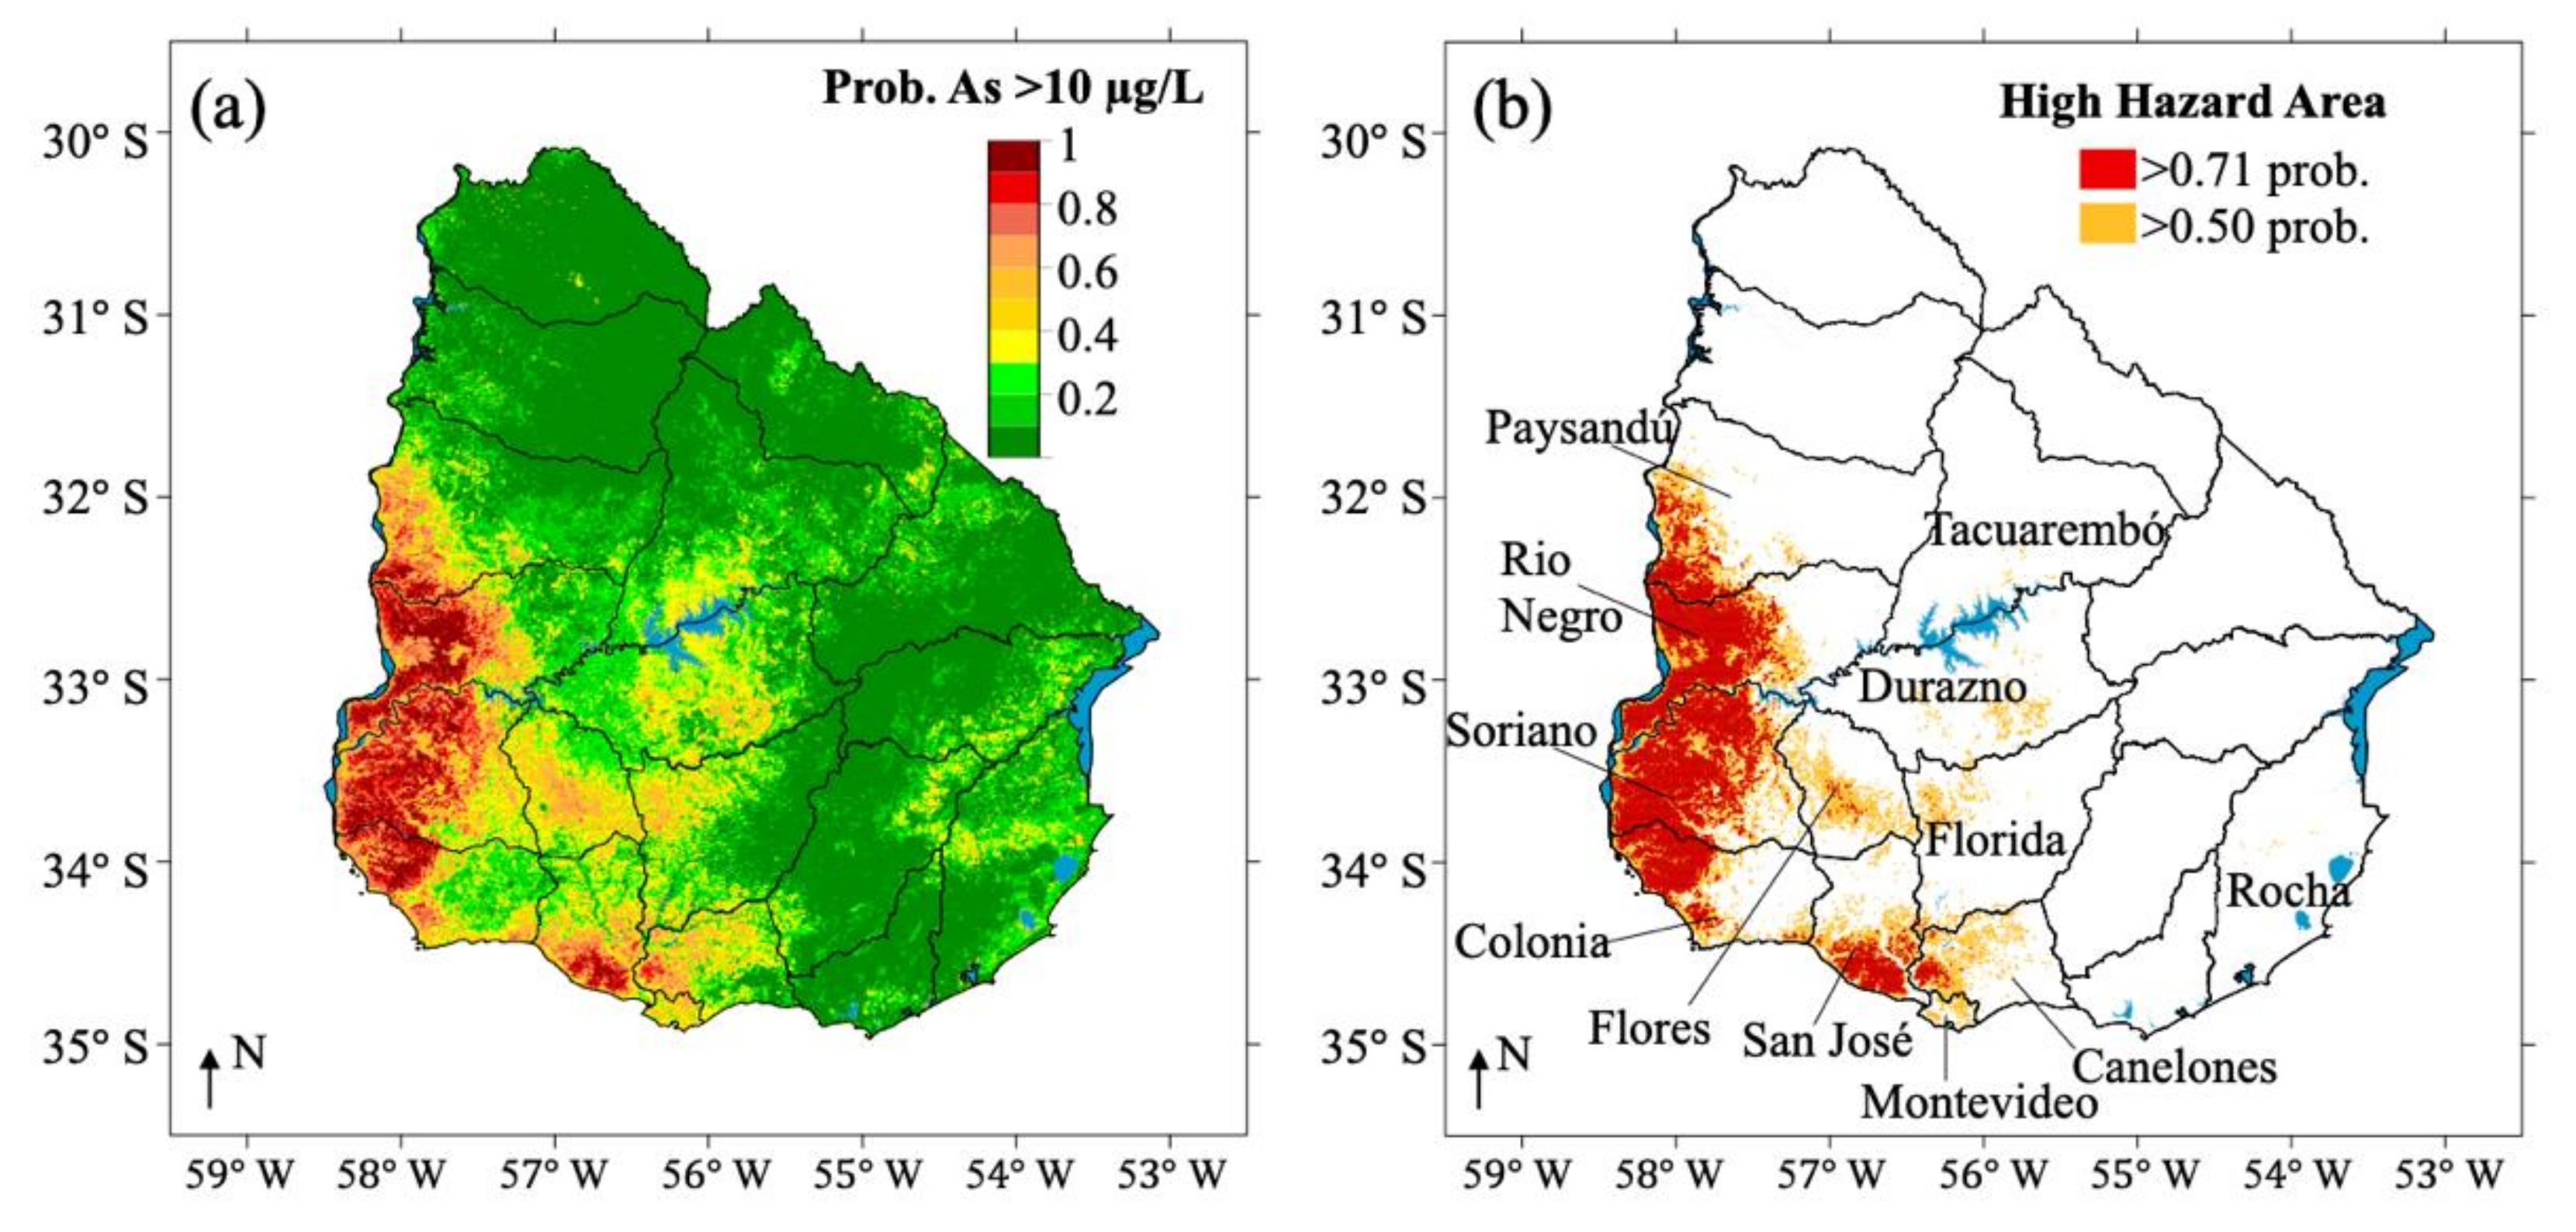
The prediction model (Figure 2) using cutoff values of 0.5 and 0.71 (Figure S3a) captured a markedly large area of high hazard levels of groundwater arsenic in southwest Uruguay, including the Paysandú, Río Negro, Soriano, Colonia, Flores, San José, Florida, Montevideo, and Canelones departments, where the Mercedes, Cuaternario Oeste, Raigón, and Cretácico main aquifers exist (Figure 1). About 35–60% of Mercedes, 53–88% of Cuaternario Oeste, 25–57% of Raigón, and 2–15% of Cretácico aquifer areas were modelled as high groundwater arsenic (>10 μg/L) hazard areas (Table 3). Meanwhile, relatively small areas of high groundwater arsenic hazard were also indicated in the Tacuarembó, Durazno, and Rocha departments. The Raigón aquifer, located in the San José department, is the most exploited groundwater resource in the country. The areas exposed to arsenic concentrations greater than 10 µg/L in the departments/country and aquifers generated by the pure overall model (1A-ML-Pure) are listed in Table 2 and Table 3, respectively.
The high groundwater arsenic occurrence in southwestern Uruguay is likely related to continental sediments containing volcanic ashes, as in the Puelche aquifer in Argentina. This is consistent with positive correlations between arsenic and chemical elements, such as vanadium, typically encountered in volcanic ashes [18,53].
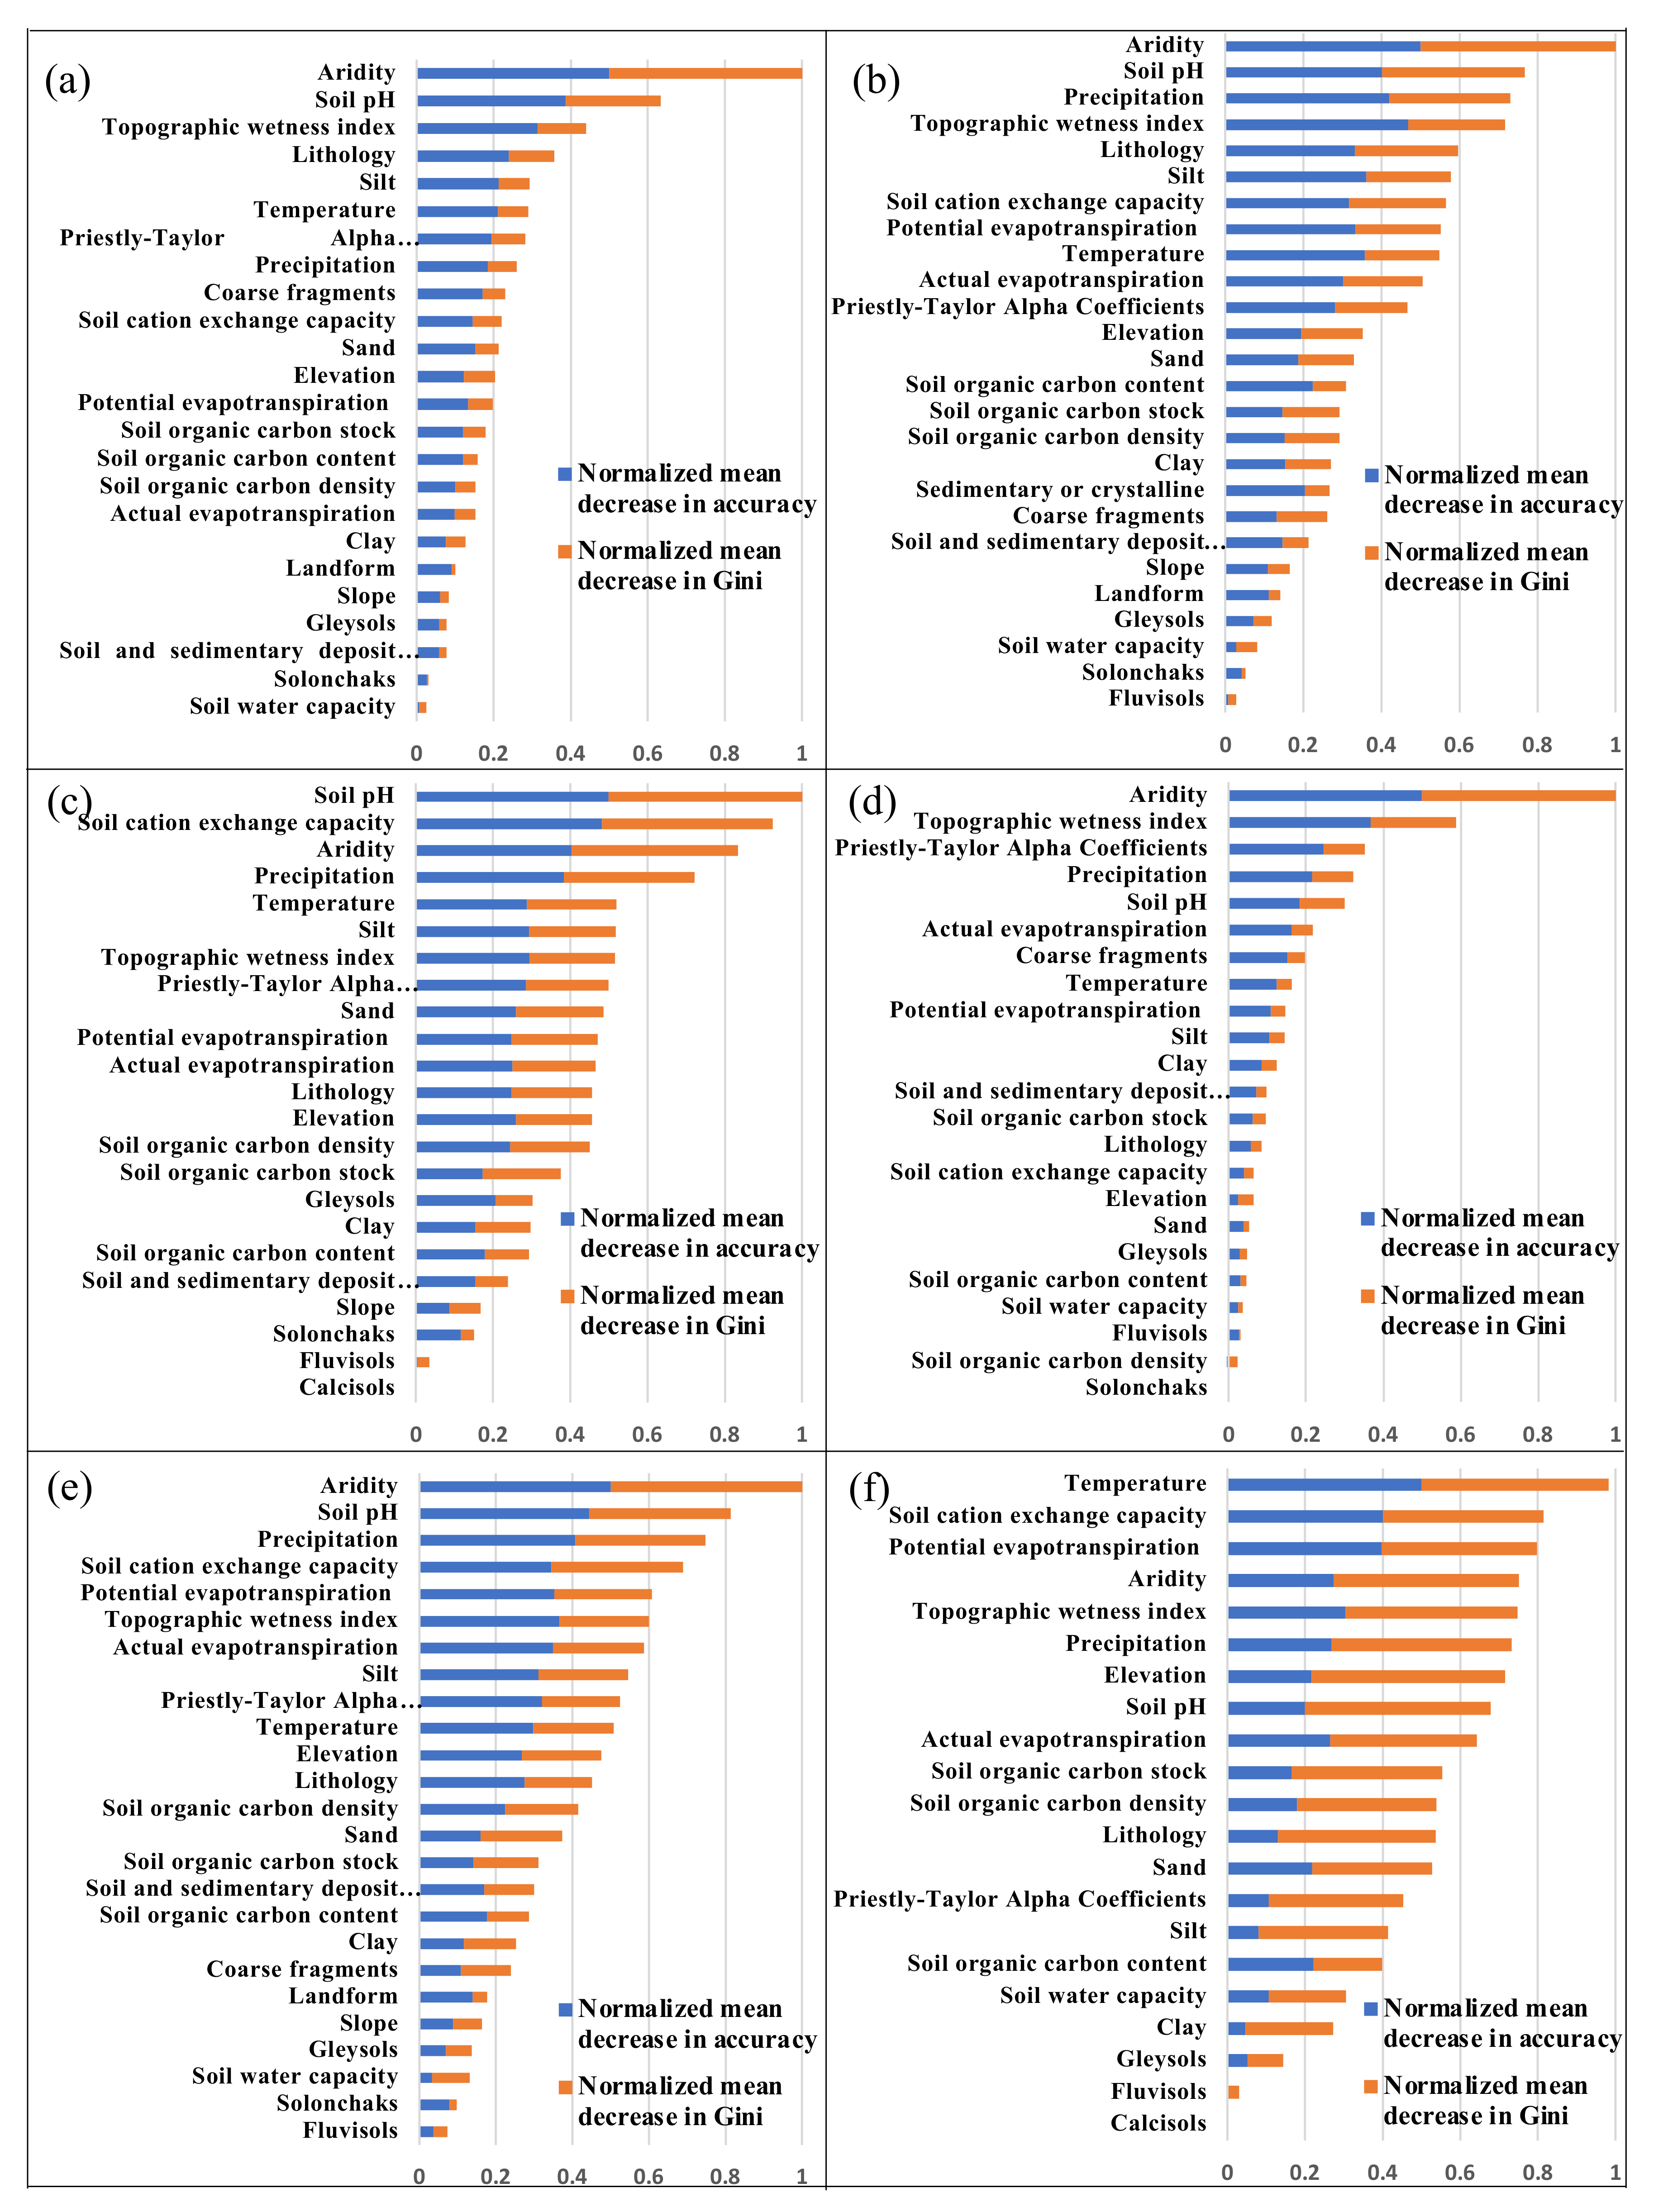
The importance of the predictors in the pure overall model (1A-ML-Pure) was assessed by the normalized mean decreases in accuracy, as well as Gini node impurity, which are displayed together in Figure 5a. The importance of aridity significantly ranks above the others, followed by the soil pH and topographic wetness index. However, the least important predictors of those included for consideration were soil water capacity and solonchaks. Aridity may accelerate the evaporation of surface waters, and, therefore, increase arsenic concentrations in groundwater recharge. In general, large-scale geogenic groundwater, particularly those related to oxidizing conditions, tend to occur in inland or closed basins in arid or semi-arid areas. Soil pH can impact the desorption of arsenic from mineral oxides, especially Fe oxides [42].
3.2. Hybrid Machine Learning Model with Expert Selection of Depth (Shallow and Deep)
In Uruguay, high arsenic concentrations (defined here as >10 µg/L) were more likely to be observed in shallow (31%; n = 72 of 234) than deep (24%; n = 36 of 153) aquifers. For some aquifers, notably the Basamento Cristalino, Raigón, and Devónico-pérmico, 50 m might be able to be used as a reasonably effective single depth cutoff to distinguish whether high arsenic is likely to occur (Figure S4). Two datasets, 234 averaged arsenic concentrations with depths ≤ 50 m and 153 averaged arsenic concentrations with depths > 50 m, were therefore used to produce the hybrid shallow (2A-HML-Shal; ≤50 m) and deep (2B-HML-Deep; >50 m) aquifer machine learning models.
For the hybrid shallow model (2A-HML-Shal), the number of predictors at each branch of the decision trees was three, which produced the most accurate model (for the comparison, see Table S2). The predictors—coarse fragments, soil water capacity, and landform—with negative mean decreases in accuracy and/or Gini node impurity did not benefit the model and were removed. However, for the hybrid deep model (2B-HML-Deep), the number of predictors at each branch was 15, and the predictors—calcisols, slope, and landform—were excluded from the model due to their negative mean decreases in accuracy and/or Gini node impurity. The AUC values of hybrid shallow (2A-HML-Shal; ≤50 m) and deep (2B-HML-Deep; >50 m) aquifer models were 0.92 (Figure S2d) and 0.96 (Figure S2e), respectively. These values are close to 1 (perfect predictive model), reflecting that both of these models have an excellent predictive ability, even better than the pure machine learning overall model (1A-ML-Pure).
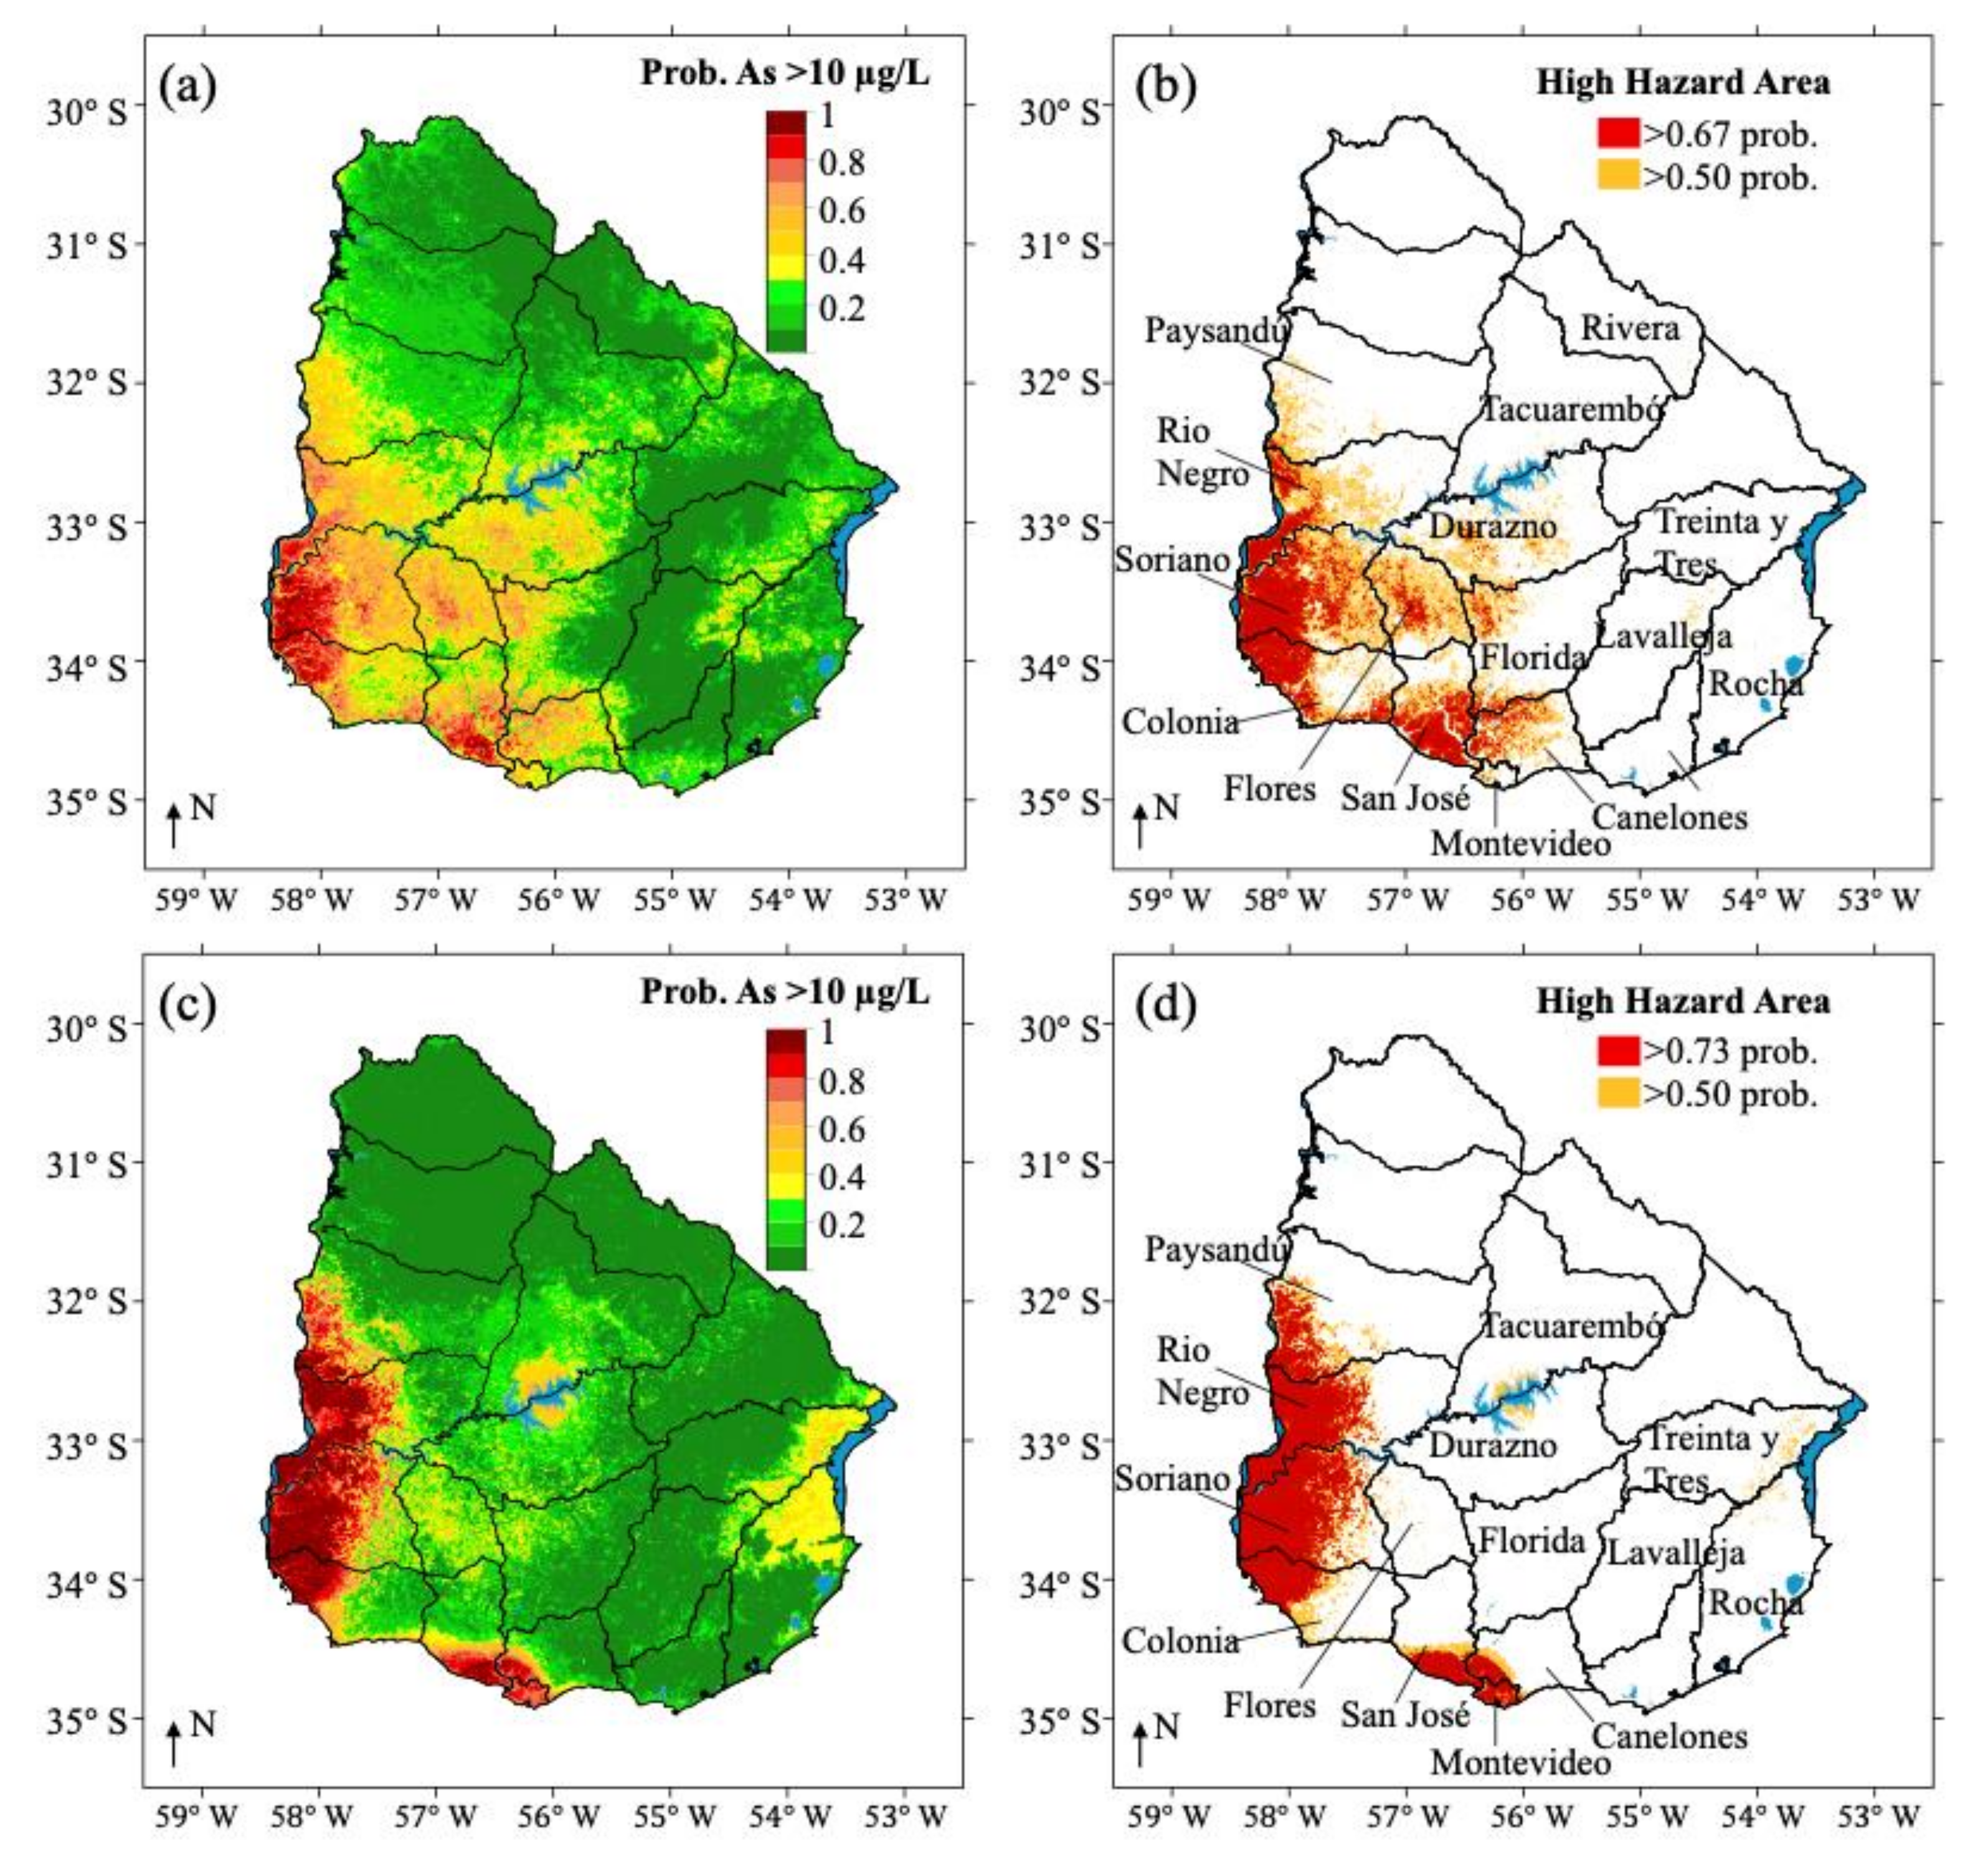
The arsenic probability and occurrence maps using cutoffs of 0.50 or 0.67 (Figure S3c) for shallow aquifers and 0.50 or 0.73 (Figure S3d) for deep aquifers, developed by the hybrid shallow (2A-HML-Shal) and deep (2B-HML-Deep) models, are displayed in Figure 3. Both shallow and deep aquifers possessed similar distributions of high arsenic groundwater in the four departments in southwestern Uruguay: Paysandú, Río Negro, Soriano, and Colonia, which are provided for by the Mercedes and Cuaternario Oeste aquifers. Furthermore, high arsenic occurs more in shallow groundwater in the San José (where the Raigón aquifer is located), Canelones (cf. Cretácico aquifer), the northwest corner of Florida, west Durazno, and Flores departments. On the contrary, the junction of the Treinta y Tres and Rocha departments, which is underlain by the Cuaternario Este aquifer, and the junction of the Tacuarembó and Durazno departments, underlain by the Arapey aquifer, tended to be characterized by higher arsenic in the deep aquifers. The areas exposed to groundwater arsenic concentrations greater than 10 µg/L in the departments/country and aquifers generated by hybrid shallow (2A-HML-Shal) and deep (2B-HML-Deep) models are listed in Table 2 and Table 3, respectively.
High hazard areas generated by the hybrid deep aquifer model (2B-HML-Deep) were almost completely overlapped by high hazard areas predicted by the pure overall model (1A-ML-Pure), however, high hazard areas of the hybrid shallow model (2A-HML-Shal) far exceeded those of the pure overall model (1A-ML-Pure), especially in the Flores, Durazno, and the northwest corner of Florida departments. The hybrid shallow model (2A-HML-Shal) had better utility in identifying potential high hazard areas, which was also one of the purposes of modelling at different depths. Moreover, the AUC value (0.95) of hybrid depth models (2C-HML-Depth; Figure S2c), using combined testing datasets, was greater than that of the pure overall model (1A-ML-Pure; Figure S2a), showing a better accuracy of the hybrid models, with expert selection of depth as a key variable.
The normalized mean decreases in accuracy and Gini node impurity of predictors reflecting their importance for both hybrid shallow (2A-HML-Shal) and deep (2B-HML-Deep) models are shown together in Figure 5c,d. Aridity, precipitation, soil pH, and the topographic wetness index were of relatively high importance in both models. Meanwhile, the ranks of importance of soil cation exchange capacity, sand, soil organic carbon density, clay, and soil and sedimentary deposit thickness in the two models were obviously different (rank difference >5).
3.3. Hybrid Machine Learning Model with Expert Selection of Geology (Sedimentary and Crystalline)
High arsenic groundwater tended to appear more in sedimentary (36%; n = 108 of 300) than crystalline (5%; n = 7 of 134) aquifers, this potentially being related to different predominant processes of mobilization. Separate datasets of averaged arsenic concentrations in sedimentary aquifers and in crystalline aquifers were therefore used to develop hybrid sedimentary (3A-HML-Sed) and crystalline (3B-HML-Cry) models, respectively.
The hybrid sedimentary model (3A-HML-Sed) performing most accurately was an ensemble of decision trees with two predictors at each branch (Table S2). Calcisols with negative importance indexes (mean decreases in accuracy and/or Gini node impurity) were removed from the hybrid sedimentary model (3A-HML-Sed). For the hybrid crystalline model (3B-HML-Cry), the number of predictors at each branch of the decision trees was three, which produced the most accurate model (Table S2). The predictors soil and sedimentary deposit thickness, coarse fragments, slope, solonchaks, and landform were excluded from the hybrid crystalline model (3B-HML-Cry) because of their negative importance values. The AUC values of the two models were 0.91 (Figure S2g) and 0.98 (Figure S2h), respectively, indicating good classification ability (close to 1).
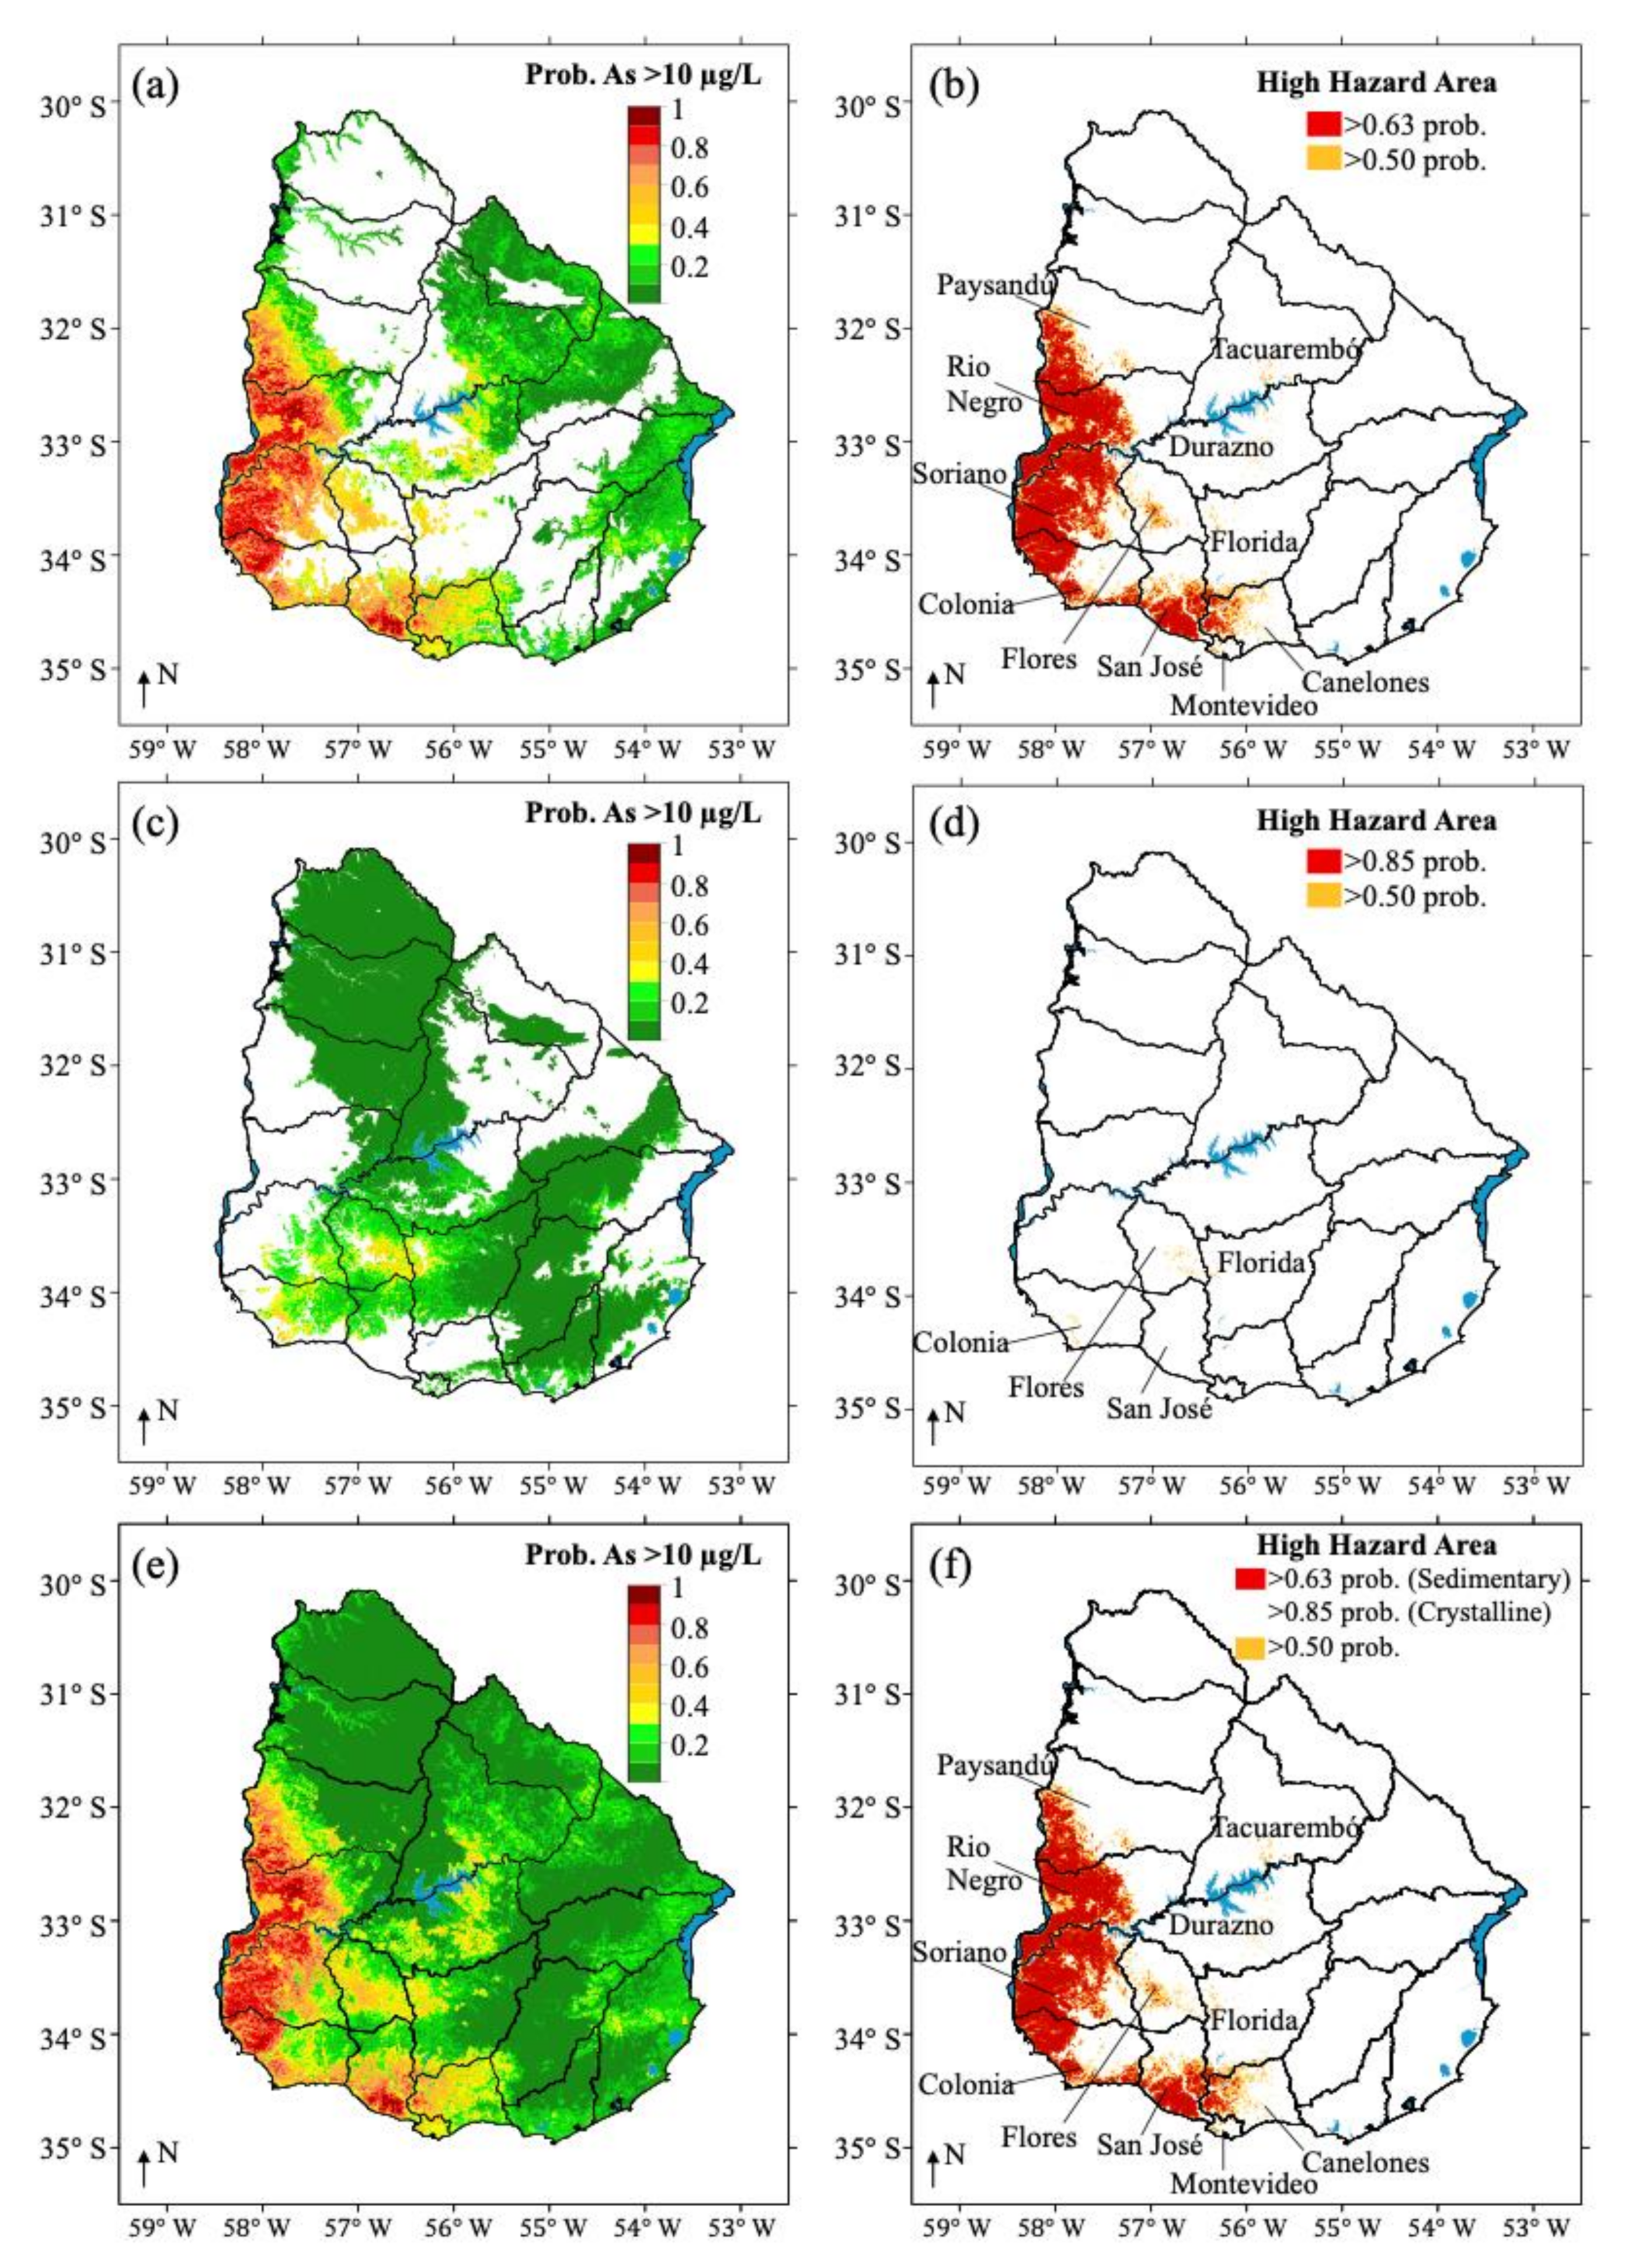
The probability and occurrence maps, defined by cutoffs of 0.5 or 0.63 (Figure S3e) for sedimentary aquifers and 0.5 or 0.85 (Figure S3f) for crystalline aquifers, of groundwater arsenic exceeding 10 μg/L in the sedimentary and crystalline aquifers are plotted in Figure 4. Comparing the results of the hybrid sedimentary (3A-HML-Sed) and crystalline (3B-HML-Cry) models, almost all (>99%) high arsenic hazard areas were in sedimentary aquifers. Only limited areas of high groundwater arsenic were modelled in crystalline aquifers in the southwest corner of the Colonia department and the junction of Florida and Flores departments. The two prediction maps of the hybrid sedimentary (3A-HML-Sed) and crystalline (3B-HML-Cry) aquifer models were also combined to form a complete prediction for the whole of Uruguay (Figure 4e,f). The distribution of high arsenic hazard areas of the combined maps was similar to that of the pure overall model (1A-ML-Pure). From the occurrence maps (Figure 4f vs. Figure 2b), only slight differences existed in the Durazno, Flores, and northwest corner of Florida departments. The so-derived hybrid model (3C-HML-Geol) made a more accurate prediction than the pure overall model (1A-ML-Pure), as indicated by its great AUC value of 0.97 (Figure S2f). The areas exposed to arsenic concentrations greater than 10 µg/L in the departments/country and aquifers generated by hybrid sedimentary (3A-HML-Sed) and crystalline (3B-HML-Cry) models are listed in Table 2 and Table 3, respectively.
The concentrations of arsenic in sedimentary rocks typically ranged between 5 and 10 mg/kg [54], slightly above average terrestrial abundance. Arsenic in sedimentary rocks can be released into groundwater through water–rock interactions in the aquifers. Under the arid conditions in South America, both silicate and carbonate reactions are prominent, and the pH of groundwater often tends to be high. In such oxidizing groundwater, arsenic predominantly exists as As(V) [55]. Metal oxides in the sediments, particularly Fe and Mn oxides and hydroxides, are regarded as the main sources of dissolved arsenic as a result of desorption in the high pH groundwater environment [42].
The importance of the various predictors in the hybrid sedimentary (3A-HML-Sed) and crystalline (3B-HML-Cry) models were assessed by the normalized mean decrease in accuracy, as well as in Gini node impurity (Figure 5e,f). Aridity, precipitation, soil cation exchange capacity, potential evapotranspiration, and the topographic wetness index were of relatively high importance in both models. Meanwhile, the ranks of importance of silt, temperature, and soil water capacity in the two models were obviously different (rank difference >5).
3.4. Comparison of Prediction Performance between Pure and Hybrid Machine Learning Models
A simple expert system model (4-ES-Aqui) based upon aquifer type indicated the following probabilities of high (>10 µg/L) groundwater arsenic concentrations being found in the following aquifers: Basamento Cristalino (6%), Cretácico (33%), Cuaternario Este (4%), Cuaternario Oeste (100%), Devónico-pérmico (2%), Mercedes (66%), and Raigón (85%) aquifers (Figure S6). Even though this model has a good performance (AUC = 0.90, calculated on the entire dataset), spatial geostatistical models can better reflect the spatial variability of groundwater arsenic within aquifers.
In order to effectively evaluate the impact of expert selection of groundwater geology (sedimentary and crystalline) in the hybrid models, another pure overall model with sedimentary or crystalline as the new predictor (1B-ML-Pure with Geol) was created to compare with the hybrid geology (sedimentary and crystalline; 3C-HML-Geol) models. The probability and occurrence maps of this new pure overall model (1B-ML-Pure with Geol) are shown in Figure S5. These are very similar to those of the previous pure overall model (1A-ML-Pure; Figure 2), and this may be mainly because the importance of sedimentary or crystalline is relatively low in the new pure overall model (1B-ML-Pure with Geol), ranking as the ninth least important of the predictor variables considered (Figure 5b). However, we found that high groundwater arsenic was obviously more likely to occur in sedimentary (36%; n = 108 of 300) than crystalline (5%; n = 7 of 134) aquifers (Figure 1b). Sedimentary or crystalline as a predictor in the pure model (1B-ML-Pure with Geol) could not reflect its actual individual importance, so hybrid models with expert selection for sedimentary and crystalline as a categorical variable may be a better model choice.
Two pure overall (with (1B-ML-Pure with Geol)/without (1A-ML-Pure) sedimentary or crystalline as the new predictor), hybrid depth (2C-HML-Depth), and hybrid geology (3C-HML-Geol) models were validated based on their combined testing datasets. Their AUC values are shown in Table 4 and Figure S2. The AUC values of hybrid models were slightly higher than that of the pure models. Although the differences in AUC values were not large, the hybrid machine learning models had slightly better accuracy and predictive performance than the pure models. Therefore, hybrid machine learning models with expert selection of important environmental parameters warrant further study and use for predicting groundwater contaminants, such as arsenic.
4. Conclusions and Limitations
Geostatistical models of the distribution of groundwater arsenic in Uruguay were generated by a variety of basic expert system and machine learning approaches in order to provide an overview of high arsenic hazard areas in Uruguay. A pure random forest model (1A-ML-Pure) using 26 potential predictor variables gave rise to a groundwater arsenic distribution model with a very high degree of accuracy (AUC = 0.92), and was consistent with known high groundwater arsenic hazard areas and with the higher prevalence of high arsenic groundwater in sedimentary rather than crystalline aquifers. Obvious differences in high groundwater arsenic hazard areas were also modelled between shallow and deep aquifers. The modelled distribution of groundwater arsenic concentrations was more accurate, and gave rise to a more detailed spatial resolution of groundwater arsenic hazard areas than simple expert system models, based upon aquifer classification alone.
A hybrid approach (3C-HML-Geol model), separating the country into sedimentary and crystalline aquifer domains, resulted in improved accuracy (AUC = 0.97) and a slight material improvement in the modelled distribution of high arsenic hazard areas compared to the pure machine learning model (1A-ML-Pure). A further hybrid approach (2C-HML-Depth model) separately modelling shallow (≤50 m) and deep (>50 m) aquifers also resulted in marginally improved accuracy (AUC = 0.95).
Hybrid machine learning models with expert selection for sedimentary and crystalline (3C-HML-Geol) with higher AUC values (0.97) was a better choice than the pure overall model with sedimentary or crystalline as the new predictor (1B-ML-Pure with Geol; AUC = 0.92). Moreover, hybrid models take the dependence of groundwater arsenic on depth and geology into account more substantially and comprehensively.
Therefore, hybrid machine learning models with expert selection of important environmental parameters may sometimes be a better choice than pure machine learning models, particularly where there are incomplete datasets, and where the processes controlling (and, hence, the predictors better modelling) groundwater arsenic concentrations are materially different for different areas and/or depths. Perhaps, counterintuitively, this is not always the case. Hybrid geospatial models deserve to be further studied and used for predicting groundwater contaminants, such as arsenic.
Although this study is based on arsenic concentration data widely distributed across the country, aquifer heterogeneity can cause material changes in the concentration of arsenic in groundwater within a short distance, limiting the small-scale predictive accuracy of the models, therefore, targeted testing is still needed to determine whether a particular well is highly contaminated with arsenic.
While the data available have supported the development of country-wide models, it is noted that the dataset is dominated by shallow wells, with some areas of the country having very limited deep well data. Obtaining further data from deeper wells in these areas would help to improve the model in these areas, although it is recognized that there will be required costs and inputs in terms of money, time, human resources, and technical support to achieve this.
Supplementary Materials
The following are available online at https://www.mdpi.com/2073-4441/13/4/527/s1, Figure S1: Frequency distribution of groundwater arsenic concentrations in the entire OSE dataset for Uruguay, Figure S2: The cross-validation results. ROC curves and AUC values of: (a) pure overall (1A-ML-Pure); (b) pure overall with sedimentary or crystalline as a predictor (1B-ML-Pure with Geol); (d) hybrid shallow (2A-HML-Shal); (e) hybrid deep (2B-HML-Deep); (g) hybrid sedimentary (3A-HML-Sed); (h) hybrid crystalline (3B-HML-Cry) machine learning models calculated on their testing datasets. The AUC values of (c) hybrid depth (2C-HML-Depth), and (f) hybrid geology (3C-HML-Geol) machine learning models calculated on their combined (i.e., deep and shallow for depth; sedimentary and crystalline for geology) testing datasets, Figure S3: Performance of: (a) pure overall (1A-ML-Pure); (b) pure overall with sedimentary or crystalline as a predictor (1B-ML-Pure with Geol); (c) hybrid shallow (2A-HML-Shal); (d) hybrid deep (2B-HML-Deep); (e) hybrid sedimentary (3A-HML-Sed); (f) hybrid crystalline (3B-HML-Cry) models using entire modelling dataset, Figure S4: Depth vs. arsenic concentration for the main aquifers in Uruguay. Data from OSE, Figure S5: Pure overall model with sedimentary or crystalline as a predictor (1B-ML-Pure with Geol) of Uruguay groundwater arsenic concentrations: (a) map of probability of groundwater arsenic concentration exceeding 10 µg/L; (b) map of high groundwater arsenic hazard areas (defined here by a probability exceeding cutoff values of 0.50 or 0.71), Figure S6: Proportion of areas in each aquifer of Uruguay with high groundwater arsenic hazard: comparison of: (a) simple expert selection aquifer model (4-ES-Aqui; observed value); and (b) pure overall (1A-ML-Pure); (c) hybrid geology (sedimentary and crystalline; 3C-HML-Geol); (d) hybrid shallow (2A-HML-Shal); and (e) hybrid deep (2B-HML-Deep) models. Simple expert selection model (observed value) based on the percentage of high arsenic (>10 µg/L) in the aquifers, and geometric mean of arsenic concentrations was taken within a pixel (1 km2). Modelled high groundwater hazard areas defined as those with a probability of arsenic concentration being than 10 µg/L exceeding a cutoff value of 0.5 and a specific cutoff value where sensitivity is equal to specificity (overall: 0.71; shallow: 0.67; deep: 0.73; sedimentary: 0.63; crystalline: 0.85). The mean of modelled high groundwater hazard areas defined by two cutoffs were used to produce the (b–e) and been shown in Table S3, Table S1: Potential predictors used in the machine learning models. Descriptions and data sources are listed. Predictors are grouped into 4 categories: climate, soil, topography, and lithology, Table S2: Comparison of number of available predictors at each branch in random forest models from 1 to 26 (the total number of potential predictors). The number shown in grey shadow is the optimum number of predictors at each branch in the model, Table S3: Proportion of areas of each aquifer of Uruguay with high groundwater arsenic hazard: comparison of: (a) simple expert selection model (4-ES-Aqui; observed values); and ((b) pure overall (1A-ML-Pure); (c) hybrid geology (sedimentary and crystalline; 3C-HML-Geol); (d) hybrid shallow (2A-HML-Shal); and (e) hybrid deep (2B-HML-Deep) models. Simple expert selection aquifer model (observed value) based on the percentage of high arsenic (>10 µg/L) in the aquifers, and geometric mean of arsenic concentrations was taken within individual 1 km2 pixels. Modelled high groundwater hazard areas defined as those with a probability of arsenic concentration being than 10 µg/L exceeding a cutoff value of 0.5 and a specific cutoff value where sensitivity is equal to specificity (overall: 0.71; shallow: 0.67; deep: 0.73; sedimentary: 0.63; crystalline: 0.85). Mean of modelled high groundwater hazard areas defined by the two cutoffs are shown.
Author Contributions
Conceptualization, E.M.A., D.A.P., and P.G.; methodology, software, validation, formal analysis, R.W.; data curation, R.W., E.M.A., P.G., and D.A.P.; writing—original draft preparation, R.W.; writing—review and editing D.A.P., P.G., G.B., and E.M.A.; supervision and project administration, D.A.P. and E.M.A.; funding acquisition, D.A.P. and E.M.A. All authors have read and agreed to the published version of the manuscript.
Funding
This research was funded by EPSRC (IAA Impact award via University of Manchester to D.P.)
Institutional Review Board Statement
Not applicable.
Informed Consent Statement
Not applicable.
Data Availability Statement
Data presented in this study not otherwise available from the references and organisations indicated in the text may be available on request from the corresponding authors.
Acknowledgments
We thank and acknowledge the Obras Sanitarias del Estado (OSE) for the provision of collated groundwater arsenic data for Uruguay. Also, our thanks to Comisión Sectorial de Investigación Científica (CSIC) from UdelaR. For various discussions, either long or short, over the years, about groundwater arsenic, and particularly in relation to that in South America, we thank Prosun Bhattacharya, Jochen Bundschuh, Nelly Mañay, Marta Litter and the late Hugo Nicolli, all of whom have contributed so much to the development of this area of research. We thank Gianfranco Pincetti Zuñiga, Laura Richards, Lingqian Xu and Joel Podgorski for further support. This work would never have started without the kind invitation of Sebastian Dietrich and Leonardo Sierra separately to D.A.P. and to E.M.A. to the highly successful IHLLA-hosted British Council funded groundwater arsenic stakeholder workshop in Azul in 2019—we thank them and the funders for that opportunity.
Conflicts of Interest
The authors declare no conflict of interest. The funders had no role in the design of the study; in the collection, analyses, or interpretation of data; in the writing of the manuscript, or in the decision to publish the results.
References
- WHO/UNICEF. Arsenic Primer—Guidance on the Investigation & Mitigation of Arsenic Contamination; UNICEF: New York, NY, USA, 2018; Available online: https://www.unicef.org/wash/files/UNICEF_WHO_Arsenic_Primer.pdf (accessed on 11 March 2020).
- Polya, D.; Charlet, L. Rising arsenic risk? Nat. Geosci. 2009, 2, 383–384. [Google Scholar] [CrossRef]
- Fendorf, S.; Michael, H.A.; Van Geen, A. Spatial and temporal variations of groundwater arsenic in South and Southeast Asia. Science 2010, 328, 1123–1127. [Google Scholar] [CrossRef] [Green Version]
- Argos, M.; Kalra, T.; Rathouz, P.J.; Chen, Y.; Pierce, B.; Parvez, F.; Islam, T.; Ahmed, A.; Rakibuz-Zaman, M.; Hasan, R.; et al. Arsenic exposure from drinking water, and all-cause and chronic-disease mortalities in Bangladesh (HEALS): A prospective cohort study. Lancet 2008, 376, 252–258. [Google Scholar] [CrossRef] [Green Version]
- Flanagan, S.V.; Johnston, R.B.; Zheng, Y. Arsenic in tube well water in Bangladesh: Health and economic impacts and implications for arsenic mitigation. Bull. World Health Organ. 2012, 90, 839–846. [Google Scholar] [CrossRef] [PubMed]
- Chakraborti, D.; Rahman, M.M.; Das, B.; Chatterjee, A.; Das, D.; Nayak, B.; Pal, A.; Chowdhury, U.K.; Ahmed, S.; Biswas, B.K. Groundwater arsenic contamination and its health effects in India. Hydrogeol. J. 2017, 25, 1165–1181. [Google Scholar] [CrossRef]
- Pérez-Carrera, A.; Cirelli, A.F. Arsenic and Water Quality Challenges in South America. In Water and Sustainability in Arid Regions; Springer: Dordrecht, Germany, 2010; pp. 275–293. [Google Scholar]
- Bundschuh, J.; Armienta, M.A.; Morales-Simfors, N.; Alam, M.A.; López, D.L.; Delgado Quezada, V.; Dietrich, S.; Schneider, J.; Tapia, J.; Sracek, O.; et al. Arsenic in Latin America: New findings on source, mobilization and mobility in human environments in 20 countries based on decadal research 2010–2020. Crit. Rev. Environ. Sci. Technol. 2020, 1–139. Available online: https://www.tandfonline.com/doi/full/10.1080/10643389.2020.1770527 (accessed on 15 December 2020). [CrossRef]
- Bundschuh, J.; Farias, B.; Martin, R.; Storniolo, A.; Bhattacharya, P.; Cortes, J.; Bonorino, G.; Albouy, R. Groundwater arsenic in the Chaco-Pampean plain, Argentina: Case study from Robles county, Santiago del Estero province. Appl. Geochem. 2004, 19, 231–243. [Google Scholar] [CrossRef]
- Mariño, E.E.; Ávila, G.T.; Bhattacharya, P.; Schulz, C.J. The occurrence of arsenic and other trace elements in groundwaters of the southwestern Chaco-Pampean plain. Argent. J. S. Am. Earth Sci. 2020, 100, 102547. [Google Scholar] [CrossRef]
- Ravenscroft, P.; Brammer, H.; Richards, K. Arsenic Pollution: A Global Synthesis; Wiley-Blackwell: Chichester, UK, 2009. [Google Scholar]
- Manganelli, A.; Goso, C.; Guerequiz, R.; Turiel, J.F.; Vallès, M.G.; Gimeno, D.; Pérez, C. Groundwater arsenic distribution in South-Western Uruguay. Environ. Geol. 2007, 53, 827–834. [Google Scholar] [CrossRef]
- Khan, K.M.; Chakraborty, R.; Bundschuh, J.; Bhattacharya, P.; Parvez, F. Health effects of arsenic exposure in Latin America: An overview of the past eight years of research. Sci. Total Environ. 2020, 710, 136071. [Google Scholar] [CrossRef]
- Mañay, N.; Goso, C.; Pistón, M.; Fernández-Turiel, J.L.; García-Vallés, M.; Rejas, M.; Guerequiz, R. Groundwater Arsenic Content in Raigón Aquifer System (San José, Uruguay). Revista SUG 2013, 20–38. Available online: http://hdl.handle.net/10261/89153 (accessed on 5 September 2020).
- Machado, I.; Bühl, V.; Mañay, N. Total arsenic and inorganic arsenic speciation in groundwater intended for human consumption in Uruguay: Correlation with fluoride, iron, manganese and sulfate. Sci. Total Environ. 2019, 681, 497–502. [Google Scholar] [CrossRef] [PubMed]
- Machado, I.; Falchi, L.; Bühl, V.; Mañay, N. Arsenic levels in groundwater and its correlation with relevant inorganic parameters in Uruguay: A medical geology perspective. Sci. Total Environ. 2020, 721, 137787. [Google Scholar] [CrossRef]
- Montaño, X.J.; Gagliardi, S.; Montañ, M. Recursos hídricos subterráneos del Uruguay. Bol. Geol. Min. Esp. 2006, 117, 201–222. [Google Scholar]
- Guerequiz, A.R.; Mañay, N.; Goso Aguilar, C.; Bundschuh, J.; Fernández-Turiel, J.L.; García-Vallés, M.; Pérez, C. Hidrogeoquímica de Metales Tóxicos: Riesgo Ambiental por Presencia de Arsénico en el Acuífero Raigón, San José (Uruguay). In Proceedings of the Congresso Brasileiro de Geoquímica, Atibaia, Brazil, 21–26 October 2007; Available online: http://uenf.br/posgraduacao/ecologia-recursosnaturais/wp-content/uploads/sites/7/2018/06/Tese-Annaliza-Carvalho-Meneguelli-com-ficha.pdf (accessed on 15 December 2020).
- Mañay, N.; Pistón, M.; Cáceres, M.; Pizzorno, P.; Bühl, V. An overview of environmental arsenic issues and exposure risks in Uruguay. Sci. Total Environ. 2019, 686, 590–598. [Google Scholar] [CrossRef] [PubMed]
- Podgorski, J.; Berg, M. Global threat of arsenic in groundwater. Science 2020, 368, 845–850. [Google Scholar] [CrossRef]
- Amini, M.; Abbaspour, K.C.; Berg, M.; Winkel, L.; Hug, S.J.; Hoehn, E.; Yang, H.; Johnson, C.A. Statistical modeling of global geogenic arsenic contamination in groundwater. Environ. Sci. Technol. 2008, 42, 3669–3675. [Google Scholar] [CrossRef]
- Winkel, L.; Berg, M.; Amini, M.; Hug, S.J.; Johnson, C.A. Predicting groundwater arsenic contamination in Southeast Asia from surface parameters. Nat. Geosci. 2008, 1, 536–542. [Google Scholar] [CrossRef] [Green Version]
- Chakraborty, M.; Sarkar, S.; Mukherjee, A.; Shamsudduha, M.; Ahmed, K.M.; Bhattacharya, A.; Mitra, A. Modeling regional-scale groundwater arsenic hazard in the transboundary Ganges River Delta, India and Bangladesh: Infusing physically-based model with machine learning. Sci. Total Environ. 2020, 748, 141107. [Google Scholar] [CrossRef]
- Podgorski, J.E.; Wu, R.; Chakravorty, B.; Polya, D.A. Groundwater Arsenic Distribution in India by Machine Learning Geospatial Modeling. Int. J. Environ. Res. Public Health 2020, 17, 7119. [Google Scholar] [CrossRef]
- Podgorski, J.E.; Eqani, S.A.M.A.S.; Khanam, T.; Ullah, R.; Shen, H.; Berg, M. Extensive arsenic contamination in high-pH unconfined aquifers in the Indus Valley. Sci. Adv. 2017, 3, e1700935. [Google Scholar] [CrossRef] [PubMed] [Green Version]
- Tan, Z.; Yang, Q.; Zheng, Y. Machine Learning Models of Groundwater Arsenic Spatial Distribution in Bangladesh: Influence of Holocene Sediment Depositional History. Environ. Sci. Technol. 2020, 54, 9454–9463. [Google Scholar] [CrossRef]
- Sovann, C.; Polya, D. Improved groundwater geogenic arsenic hazard map for Cambodia. Environ. Chem. 2014, 11, 595–607. [Google Scholar] [CrossRef]
- Rodríguez-Lado, L.; Sun, G.; Berg, M.; Zhang, Q.; Xue, H.; Zheng, Q.; Johnson, C.A. Groundwater arsenic contamination throughout China. Science 2013, 341, 866–868. [Google Scholar] [CrossRef]
- Ayotte, J.D.; Medalie, L.; Qi, S.L.; Backer, L.C.; Nolan, B.T. Estimating the high-arsenic domestic-well population in the conterminous United States. Environ. Sci. Technol. 2017, 51, 12443–12454. [Google Scholar] [CrossRef] [PubMed]
- Bretzler, A.; Lalanne, F.; Nikiema, J.; Podgorski, J.; Pfenninger, N.; Berg, M.; Schirmer, M. Groundwater arsenic contamination in Burkina Faso, West Africa: Predicting and verifying regions at risk. Sci. Total Environ. 2017, 584, 958–970. [Google Scholar] [CrossRef] [PubMed]
- Wu, R.; Podgorski, J.; Berg, M.; Polya, D.A. Geostatistical model of the spatial distribution of arsenic in groundwaters in Gujarat State, India. Environ. Geochem. Health 2020, 1–16. [Google Scholar] [CrossRef]
- Podgorski, J.E.; Labhasetwar, P.; Saha, D.; Berg, M. Prediction modeling and mapping of groundwater fluoride contamination throughout India. Environ. Sci. Technol. 2018, 52, 9889–9898. [Google Scholar] [CrossRef] [Green Version]
- INE. Results of 2011 Uruguayan Population Census: Population, Growth and Structure by Sex and Age. 2011. Available online: http://www.ine.gub.uy/documents/10181/35289/analisispais.pdf (accessed on 11 September 2020).
- Bossi, J.; Ferrando, L. Carta Geológica del Uruguay Versión Digital a Escala 1:500.000 [CD-ROM]; Geoeditores SRL: Montevideo, Uruguay, 2001; Available online: https://www.gub.uy/ministerio-industria-energia-mineria/comunicacion/publicaciones/carta-geologica-del-uruguay-escala-1500000 (accessed on 5 September 2020).
- Collazo, M.P.; Montaño, J. Manual de Agua Subterránea; Ministerio de Ganadería Agricultura y Pesca: Montevideo, Uruguay, 2012; Available online: http://aquabook.agua.gob.ar/files/upload/contenidos/10_2/Manual-de-agua-subterranea-Uruguay.pdf (accessed on 20 September 2020).
- Bossi, J.; Cingolani, C. Extension and general evolution of the Río de la Plata Craton. Dev. Precambrian Geol. 2009, 16, 73–85. [Google Scholar]
- Gaucher, C.; Bossi, J.; Blanco, G. Palaeogeography. Neoproterozoic-Cambrianevolution of the Río de la Plata Palaeocontinent. In Neoproterozoic-Cambrian Tectonics, Global Change and Evolution: A Focus on Southwestern Gondwana. Developments in Precambrian Geology; Elsevier: Amsterdam, The Netherlands, 2009; pp. 131–141. [Google Scholar]
- Garracelas, G.; Hornbuckle, J.; Verger, M.; Huertas, R.; Riccetto, S.; Campos, F.; Roel, A. Irrigation management and variety effects on rice grain arsenic levels in Uruguay. J. Sci. Food Agric. 2020, 1, 100008. [Google Scholar] [CrossRef]
- Matschullat, J. Arsenic in the geosphere—A review. Sci. Total Environ. 2000, 249, 297–312. [Google Scholar] [CrossRef]
- Meharg, A.A.; Zhao, F.J. Arsenic & Rice, 1st ed.; Springer Science & Business Media: Cham, Switzerland, 2012; pp. 51–66. [Google Scholar]
- Blanco, G.; Abre, P.; Ferrizo, H.; Gaye, M.; Gamazo, P.; Ramos, J.; Alvareda, E.; Saracho, A. Revealing weathering, diagenetic and provenance evolution using petrography and geochemistry: A case of study from the Cretaceous to Cenozoic sedimentary record of the SE Chaco-Paraná basin in Uruguay. J. S. Am. Earth Sci. 2021, 105, 102974. [Google Scholar] [CrossRef]
- Smedley, P.; Kinniburgh, D. A review of the source, behaviour and distribution of arsenic in natural waters. Appl. Geochem. 2002, 17, 517–568. [Google Scholar] [CrossRef] [Green Version]
- Charlet, L.; Polya, D.A. Arsenic in shallow, reducing groundwaters in southern Asia: An environmental health disaster. Elements 2006, 2, 91–96. [Google Scholar] [CrossRef]
- Trabucco, A.; Zomer, R. Global Soil Water Balance Geospatial Database. CGIAR Consortium for Spatial Information, 2010. CGIAR-CSI GeoPortal. Available online: https://cgiarcsi.community/ (accessed on 22 March 2019).
- Trabucco, A.; Zomer, R.J. Global Aridity Index (Global-Aridity) and Global Potential Evapo-Transpiration (Global-PET) Geospatial Database. CGIAR Consortium for Spatial Information, 2009. CGIAR-CSI GeoPortal. Available online: https://cgiarcsi.community/ (accessed on 18 February 2019).
- Hengl, T.; De Jesus, J.M.; Heuvelink, G.B.; Gonzalez, M.R.; Kilibarda, M.; Blagotić, A.; Shangguan, W.; Wright, M.N.; Geng, X.; Bauer-Marschallinger, B. SoilGrids250m: Global gridded soil information based on machine learning. PLoS ONE 2017, 12, e0169748. [Google Scholar] [CrossRef] [PubMed] [Green Version]
- Pelletier, J.D.; Broxton, P.D.; Hazenberg, P.; Zeng, X.; Troch, P.A.; Niu, G.; Williams, Z.C.; Brunke, M.A.; Gochis, D. Global 1-km Gridded Thickness of Soil. Regolith, and Sedimentary Deposit Layers, 2016. Available online: https://doi.org/10.3334/ORNLDAAC/1304 (accessed on 5 September 2019).
- USGS. USGS EROS Archive. Digital Elevation. Global 30 Arc-Second Elevation (GTOPO30), 1996. Available online: http://doi.org/10.5066/F7DF6PQS (accessed on 1 October 2019).
- Hengl, T. Global Landform and Lithology Class at 250 m Based on the USGS Global Ecosystem Map; Version 1.0; Lithology; Zenodo: Geneva, Switzerland, 2018. [Google Scholar] [CrossRef]
- Breiman, L. Random forests. Mach. Learn. 2001, 45, 5–32. [Google Scholar] [CrossRef] [Green Version]
- Ho, T.K. Random Decision Forests. In Proceedings of the 3rd International Conference on Document Analysis and Recognition, Montreal, QC, Canada, 14–16 August 1995; IEEE Xplore: Piscataway, NJ, USA, 1995; Volume 1, pp. 278–282. [Google Scholar] [CrossRef]
- Fawcett, T. An Introduction to ROC Analysis. In Pattern Recognition Letter; Elservier: Amsterdam, The Netherlands, 2006; Volume 27, pp. 861–874. [Google Scholar]
- Bundschuh, J.; Litter, M.I.; Parvez, F.; Román-Ross, G.; Nicolli, H.B.; Jean, J.S.; Liu, C.W.; López, D.; Armirnta, M.A.; Guilherme, L.R.G.; et al. One century of arsenic exposure in Latin America: A review of history and occurrence from 14 countries. Sci. Total Environ. 2012, 429, 2–35. [Google Scholar] [CrossRef]
- Webster, J.G. Arsenic. In Encyclopedia of Geochemistry; Chapman Hall: London, UK, 1999; pp. 21–22. [Google Scholar]
- Smedley, P.L.; Nicolli, H.B.; Barros, A.J.; Tullio, J.O. Origin and Mobility of Arsenic in Groundwater from the Pampean Plain, Argentina. In Proceedings of the 9th International Symposium on Water-Rock Interaction (WRI-9), Taupo, New Zealand, 3 March–3 April 1998; Balkema: Rotterdam, The Netherlands, 1998; pp. 275–278. [Google Scholar]
Figure 1.
Location of groundwater with arsenic concentration data used in this study and the distribution with respect to (a) main aquifers and (b) sedimentary and crystalline rocks in Uruguay [34]. Note that the Cretácico Arapey Formation is composed of basalts, with vacuolar porosity and some interbedded sandstones. Although arguably ambiguous, we classify these here as crystalline. Groundwater arsenic data are from OSE. Aquifer map (a) modified from [17].

Figure 2.
Pure overall model (1A-ML-Pure) of Uruguay groundwater arsenic concentrations: (a) map of probability of groundwater arsenic concentrations exceeding 10 µg/L; (b) map of high groundwater arsenic hazard areas (defined here by a probability exceeding cutoff values of 0.50 or 0.71).
Figure 2.
Pure overall model (1A-ML-Pure) of Uruguay groundwater arsenic concentrations: (a) map of probability of groundwater arsenic concentrations exceeding 10 µg/L; (b) map of high groundwater arsenic hazard areas (defined here by a probability exceeding cutoff values of 0.50 or 0.71).

Figure 3.
Hybrid machine learning models of Uruguay groundwater arsenic concentrations in shallow (2A-HML-Shal; ≤50 m) and deep (2B-HML-Deep; >50 m) aquifers. Shallow aquifers: (a) map of probability of groundwater arsenic concentrations exceeding 10 µg/L; (b) map of high groundwater arsenic hazard areas (defined here by a probability exceeding cutoff values of 0.50 or 0.67); deep aquifers: (c) map of probability of groundwater arsenic concentrations exceeding 10 µg/L; (d) map of high groundwater arsenic hazard areas (defined here by a probability exceeding cutoff values of 0.50 or 0.73).

Figure 4.
Hybrid machine learning models of Uruguay groundwater arsenic concentrations in sedimentary (3A-HML-Sed) and crystalline (3B-HML-Cry) aquifers. Sedimentary aquifers: (a) map of probability of groundwater arsenic concentrations exceeding 10 µg/L; (b) map of high groundwater arsenic hazard areas (defined here by a probability exceeding cutoff values of 0.50 or 0.63); crystalline aquifers: (c) map of probability of groundwater arsenic concentrations exceeding 10 µg/L; (d) map of high groundwater arsenic hazard areas (defined here by a probability exceeding cutoff values of 0.50 or 0.85); hybrid machine learning and expert system model for all aquifers (3C-HML-Geol): (e) map of probability of groundwater arsenic concentrations exceeding 10 µg/L; (f) map of high groundwater arsenic hazard areas; (e) was obtained by combining (a,c); (f) was obtained by combining (b,d).

Figure 5.
Normalized importance of predictors in terms of mean decrease values in accuracy and in Gini node impurity in the (a) pure overall model (1A-ML-Pure); (b) pure overall model with sedimentary or crystalline as the predictor (1B-ML-Pure with Geol); (c) hybrid shallow model (2A-HML-Shal); (d) hybrid deep model (2B-HML-Deep); (e) hybrid sedimentary model (3A-HML-Sed); and (f) hybrid crystalline model (3B-HML-Cry). Decreases in both the mean values in accuracy and in Gini node impurity were normalized by their largest value, respectively.


Table 1.
Names, types, and descriptions of the models generated in this study.
| No. | Model Code | Name of Model | Pure/Hybrid | Expert System | Description |
|---|---|---|---|---|---|
| 1 | 1A-ML-Pure | Pure overall model | Pure | No | Random forest model of groundwater arsenic > 10 µg/L in the whole of Uruguay |
| 2 | 1B-ML-Pure with Geol | Pure overall model with sedimentary or crystalline as a predictor | Pure | No | Random forest model with one more predictor, sedimentary or crystalline, of groundwater arsenic > 10 µg/L in the whole of Uruguay |
| 3 | 2A-HML-Shal | Hybrid shallow model | Hybrid | Yes | Random forest model of groundwater arsenic > 10 µg/L in shallow aquifers (≤50 m) in Uruguay |
| 4 | 2B-HML-Deep | Hybrid deep model | Hybrid | Yes | Random forest model of groundwater arsenic > 10 µg/L in deep aquifers (>50 m) in Uruguay |
| 5 | 2C-HML-Depth | Hybrid depth model | Hybrid | Yes | Combination of hybrid shallow and deep models |
| 6 | 3A-HML-Sed | Hybrid sedimentary model | Hybrid | Yes | Random forest model of groundwater arsenic > 10 µg/L in sedimentary aquifers in Uruguay |
| 7 | 3B-HML-Cry | Hybrid crystalline model | Hybrid | Yes | Random forest model of groundwater arsenic > 10 µg/L in crystalline aquifers in Uruguay |
| 8 | 3C-HML-Geol | Hybrid geology model | Hybrid | Yes | Combination of hybrid sedimentary and crystalline models |
| 9 | 4-ES-Aqui | Simple expert system aquifer model | Pure | Yes | Combination of the percentage (%) of OSE arsenic concentrations by pixel > 10 μg/L in each aquifer in Uruguay, used to compared with the above models |
Table 2.
Proportion of areas in each department of Uruguay with a high groundwater arsenic hazard: comparison of modelled and observed values. Modelled high groundwater hazard areas were defined as those with a probability of arsenic concentration greater than 10 µg/L, exceeding a cutoff value of 0.5 and a specific cutoff value where sensitivity is equal to specificity (overall: 0.71; shallow: 0.67; deep: 0.73; sedimentary: 0.63; crystalline: 0.85). Observed values were based on the proportion of high arsenic (>10 µg/L) in the departments, and the geometric mean of arsenic concentrations was taken within a pixel (1 km2).
| Country/Department | Areas Exposed to Arsenic Concentrations Greater than 10 µg/L | Percentage of Averaged Arsenic Concentrations Exceeding 10 μg/L (%) | |||
|---|---|---|---|---|---|
| Pure Overall Model (%) | Hybrid Shallow Model (%) | Hybrid Deep Model (%) | Hybrid Sedimentary and Crystalline Models (%) (Fraction Area with Crystalline Aquifers) | ||
| Artigas | 0.00 | 0.00 | 0.00 | 0.00 | 0.00 (n = 0) |
| Canelones | 3.34−21.70 | 9.48−34.57 | 9.12−17.00 | 6.32−20.39 | 20.83 (n = 5) |
| Cerro Largo | 0.00−0.01 | 0.00−0.01 | 0.00 | 0.00 | 0.00 (n = 0) |
| Colonia | 24.22−42.16 | 30.81−51.17 | 29.98−41.95 | 30.44−40.88 (0.00−0.42) | 45.24 (n = 19) |
| Durazno | 0.00−2.97 | 0.74−13.41 | 0.00−1.08 | 0.00−0.65 | 0.00 (n = 0) |
| Flores | 0.82−20.87 | 8.70−49.27 | 0.08−1.66 | 0.77−8.36 (0.00−1.12) | 46.67 (n = 7) |
| Florida | 0.12−4.24 | 2.35−13.17 | 0.00−0.08 | 0.36−2.09 (0.00−0.15) | 37.50 (n = 9) |
| Lavalleja | 0.00−0.01 | 0.00−0.54 | 0.00−0.02 | 0.00−0.01 | 5.00 (n = 1) |
| Maldonado | 0.00 | 0.00−0.09 | 0.00−0.44 | 0.00 | n.a. |
| Montevideo | 0.00−29.55 | 0.94−14.57 | 69.23−99.73 | 0.81−6.88 | n.a. |
| Paysandú | 6.65−17.24 | 0.19−5.82 | 11.11−19.56 | 11.31−18.33 | 36.84 (n = 7) |
| Rivera | 0.00 | 0.00−0.09 | 0.00 | 0.00 | 3.57 (n = 1) |
| Rocha | 0.00−0.11 | 0.00−0.15 | 0.00−0.86 | 0.00 | 2.38 (n = 1) |
| Río Negro | 31.43−51.04 | 11.94−35.09 | 42.63−49.27 | 37.38−49.17 | 60.00 (n = 18) |
| Salto | 0.00 | 0.00 | 0.00 | 0.00 | 0.00 (n = 0) |
| San José | 14.54−33.84 | 29.49−50.88 | 16.70−25.87 | 24.38−38.64 | 67.65 (n = 23) |
| Soriano | 45.63−72.13 | 38.86−75.96 | 59.15−72.41 | 50.06−64.35 (0.00−0.02) | 69.70 (n = 23) |
| Tacuarembó | 0.00−0.23 | 0.00−0.31 | 0.00−1.02 | 0.00−0.41 | 0.00 (n = 0) |
| Treinta y Tres | 0.00 | 0.00−0.04 | 0.00−1.67 | 0.00−0.01 (0.00−0.01) | 5.56 (n = 1) |
| Uruguay | 6−12 | 5−14 | 8−11 | 8−11 | 26 (n = 115) |
Table 3.
Proportion of areas in each aquifer of Uruguay with a high (>10 µg/L) groundwater arsenic hazard: comparison of modelled and observed values. Modelled high groundwater hazard areas were defined as those with a probability of arsenic concentration greater than 10 µg/L, exceeding a cutoff value of 0.5 and a specific cutoff value where sensitivity is equal to specificity (overall: 0.71; shallow: 0.67; deep: 0.73; sedimentary: 0.63; crystalline: 0.85). Observed values were based on the proportion of high arsenic (>10 µg/L) in the aquifers, and the geometric mean of arsenic concentrations was taken within a pixel (1 km2).
| Aquifer | Areas Exposed to Arsenic Concentrations Greater than 10 µg/L | Percentage (Number) of Averaged OSE Arsenic Concentrations Exceeding 10 μg/L (%) | |||
|---|---|---|---|---|---|
| Pure Overall Model (%) | Hybrid Shallow Model (%) | Hybrid Deep Model (%) | Hybrid Sedimentary and Crystalline Models (%) (Fraction Area with Crystalline Aquifers) | ||
| Arapey | 0.01−0.16 | 0.02−0.96 | 0.01−0.65 | 0.01−0.04 | 0.00 (n = 0) |
| Basamento Cristalino | 1.20−5.45 | 2.14−11.83 | 2.32−4.69 | 1.07−2.30 (0.00−0.19) | 5.93 (n = 7) |
| Chuy | 0.00 | 0.00 | 0.00−1.97 | 0.00 | 0.00 (n = 0) |
| Cretácico | 2.23−14.96 | 7.20−26.11 | 5.59−9.88 | 4.29−14.90 | 33.33 (n = 6) |
| Cuaternario Este | 0.00−0.08 | 0.00−0.56 | 0.00−1.73 | 0.00 | 4.00 (n = 1) |
| Cuaternario Oeste | 53.16−88.45 | 69.09−90.48 | 79.25−97.43 | 68.34−85.67 | 100.00 (n = 4) |
| Devónico-pérmico | 0.00−0.53 | 0.04−1.45 | 0.00−0.38 | 0.00−0.39 | 2.22 (n = 1) |
| Guaraní | 0.00−0.04 | 0.00 | 0.00−0.03 | 0.01−0.13 | 0.00 (n = 0) |
| Mercedes | 35.10−60.24 | 23.19−50.35 | 46.46−57.19 | 43.04−58.73 | 65.69 (n = 67) |
| Raigón | 25.12−56.52 | 50.64−73.28 | 29.17−45.40 | 43.24−66.63 | 85.29 (n = 29) |
| Salto | 0.00 | 0.00 | 0.00 | 0.00 | 0.00 (n = 0) |
Table 4.
Comparison of the AUC values of two pure overall and two hybrid depth and geology models based on their combined testing datasets.
Table 4.
Comparison of the AUC values of two pure overall and two hybrid depth and geology models based on their combined testing datasets.
| Pure/Hybrid Model | Machine Learning Models | AUC Values |
|---|---|---|
| Pure | Overall model without sedimentary or crystalline as the new predictor (1A-ML-Pure) | 0.92 |
| Pure | Overall model with sedimentary or crystalline as the new predictor (1B-ML-Pure with Geol) | 0.92 |
| Hybrid | Depth (shallow and deep aquifer) model (2C-HML-Depth) | 0.95 |
| Hybrid | Geology (sedimentary and crystalline aquifer) model (3C-HML-Geol) | 0.97 |
Publisher’s Note: MDPI stays neutral with regard to jurisdictional claims in published maps and institutional affiliations. |
© 2021 by the authors. Licensee MDPI, Basel, Switzerland. This article is an open access article distributed under the terms and conditions of the Creative Commons Attribution (CC BY) license (http://creativecommons.org/licenses/by/4.0/).
Share and Cite
MDPI and ACS Style
Wu, R.; Alvareda, E.M.; Polya, D.A.; Blanco, G.; Gamazo, P. Distribution of Groundwater Arsenic in Uruguay Using Hybrid Machine Learning and Expert System Approaches. Water 2021, 13, 527. https://doi.org/10.3390/w13040527
AMA Style
Wu R, Alvareda EM, Polya DA, Blanco G, Gamazo P. Distribution of Groundwater Arsenic in Uruguay Using Hybrid Machine Learning and Expert System Approaches. Water. 2021; 13(4):527. https://doi.org/10.3390/w13040527
Chicago/Turabian StyleWu, Ruohan, Elena M. Alvareda, David A. Polya, Gonzalo Blanco, and Pablo Gamazo. 2021. "Distribution of Groundwater Arsenic in Uruguay Using Hybrid Machine Learning and Expert System Approaches" Water 13, no. 4: 527. https://doi.org/10.3390/w13040527
Note that from the first issue of 2016, this journal uses article numbers instead of page numbers. See further details here.