
Operational Implementation of Satellite-Rain Gauge Data Merging for Hydrological Modeling


1
Department of Fluid Mechanics and Environmental Engineering (IMFIA), School of Engineering, Universidad de la República, 11300 Montevideo, Uruguay
2
MotionSoft Consulting S.R.L., 11200 Montevideo, Uruguay
*
Author to whom correspondence should be addressed.
Water 2021, 13(4), 533; https://doi.org/10.3390/w13040533
Submission received: 22 January 2021
/
Revised: 10 February 2021
/
Accepted: 13 February 2021
/
Published: 18 February 2021
(This article belongs to the Special Issue Hydrometeorological Observation and Modeling)
Abstract
:Systems exposed to hydroclimatic variability, such as the integrated electric system in Uruguay, increasingly require real-time multiscale information to optimize management. Monitoring of the precipitation field is key to inform the future hydroelectric energy availability. We present an operational implementation of an algorithm that merges satellite precipitation estimates with rain gauge data, based on a 3-step technique: (i) Regression of station data on the satellite estimate using a Generalized Linear Model; (ii) Interpolation of the regression residuals at station locations to the entire grid using Ordinary Kriging and (iii) Application of a rain/no rain mask. The operational implementation follows five steps: (i) Data download and daily accumulation; (ii) Data quality control; (iii) Merging technique; (iv) Hydrological modeling and (v) Electricity-system simulation. The hydrological modeling is carried with the GR4J rainfall-runoff model applied to 17 sub-catchments of the G. Terra basin with routing up to the reservoir. The implementation became operational at the Electricity Market Administration (ADME) on June 2020. The performance of the merged precipitation estimate was evaluated through comparison with an independent, dense and uniformly distributed rain gauge network using several relevant statistics. Further validation is presented comparing the simulated inflow to the estimate derived from a reservoir mass budget. Results confirm that the estimation that incorporates the satellite information in addition to the surface observations has a higher performance than the one that only uses rain gauge data, both in the rainfall statistical evaluation and hydrological simulation.
1. Introduction
The renewable contribution of the electric energy matrix in Uruguay has been increasing steadily during the last decades, with hydroelectric, wind and solar components that have different inherent variability and predictability. This poses both a challenge and an opportunity to optimize planning at different embedded timescales and, ultimately, dispatch. The interconnected Electric System Simulator (SimSEE [1]) is used for these purposes [2], from the management of the spot market to long-term analysis of the evolution of the generation capacity, with intermediate seasonal and nested weekly planning. Particularly, in the case of the hydroelectric generation, we used a coupled hydrological and electric system modeling approach in order to generate and process a hydrological ensemble forecast for the largest reservoir of the system [3]. The ability to forecast the hydrological inflow contributes to the optimal use of each energy source, with the corresponding economic and environmental benefits.
In most applications that use operational hydrological models, the spatial and temporal variability of precipitation constitutes one of the dominant factors and with greater associated uncertainty. In this context, remote sensing products are ideal instruments to be used in real-time hydrological modeling, embedded in operational systems for flood warnings, drought monitoring and water resource management [4,5]. These products are especially useful in data-sparse, ungauged or large-scale catchments. Several satellite-based precipitation estimates, with high spatial and temporal resolution, are currently available in near-real-time (NRT): the Climate Prediction Center (CPC) MORPHing algorithm (CMORPH) [6], the CPC Quick MORPHing technique (QMORPH) [7], the Tropical Rainfall Measuring Mission (TRMM) Multi-satellite Precipitation Analysis (TMPA) 3B42 [8], the Precipitation Estimation from Remotely Sensed Information using Artificial Neural Networks and a Cloud Classification System (PERSIANN-CCS) [9], the Global Satellite Mapping of Precipitation (GSMaP) [10,11] and the Integrated Multi-satellite Retrievals for Global Precipitation Measurement (IMERG-GPM) [12]. Information from a large number of rain gauges, which are more accurate but generally sparsely distributed, is already assimilated as part of these global/regional satellite algorithms. However, since they are indirect estimates derived by algorithms from satellite images, they require validation in each region and climate and eventually calibration against local ground-based precipitation measurements. Additionally, it is well known that the NRT versions of these products are less accurate (as compared with the final or research-quality products) but provide quick precipitation estimates suitable for NRT monitoring and operational modeling activities [13].
Several validation studies evaluated the utility of the satellite precipitation products as input for hydrologic models [4,14,15,16,17,18,19]. Particularly, Jiang et al. (2019) [5] provided a comprehensive review about the role of satellite-based remote sensing products in improving simulated streamflow. They highlighted that, in general, the capability and feasibility of satellite rainfall estimates in driving hydrological models vary widely due to differences in topography, season, climate, basin scale, selected hydrological model and satellite product type. Moreover, prior to their implementation in the hydrological model, the estimates require thorough validation; bias correction based on rain gauge data is commonly needed. Nerini et al. (2015) [20] and Beck et al. (2017) [16] emphasized that careful data merging can exploit the complementary strengths of each source of precipitation data. Considering this, several merging methods have been developed based on the early efforts of the radar research community: mean-field bias correction, inverse-error-weighted averaging methods, interpolations by inverse distance weighting, double-kernel smoothing, nearest neighbor method, correction through regression analysis, correction using probability distributions and geostatistical methods (cokriging, kriging with external drift, regression kriging, Bayesian combination, among others) [20,21]. In general, identifying the spatial correlation in the error (residual) structure model is the most important step in the merging process.
Previous experience with this type of products (CMORPH) in the study area, the Rio Negro basin in northeastern Uruguay, confirms the need to implement a bias removal scheme based on available surface observations prior to any application [22,23]. Their results indicated that quantile matching method produces an unbiased estimate whose skill, as measured by the probability of detection (POD), is better than that obtained from surface observations for average distances among stations larger than approximately 50 km. Adjustment of satellite estimates using spatial interpolation of CMORPH residuals evaluated at nearby points eliminates biases to a large degree. Moreover, it shows higher skill than using only surface data for the entire range of distances and daily precipitation thresholds considered and for both seasons (cold and warm).
In this study, we present the operational implementation of a methodology for the combination of rain gauge observations and satellite-rainfall estimates at daily time step to improve the rainfall monitoring in NRT over the Rio Negro Basin. The interpolated precipitation field obtained with the proposed methodology is then used as initial condition for the hydrological modeling of the basin, coupled with an electric system modeling, in order to obtain the optimal dispatch of the system for the following seven days [3]. The performance of the proposed merged precipitation estimate was statistically evaluated through comparison with an independent historic rain gauge dataset. Furthermore, a hydrological application was implemented using the GR4J model [24] at daily time step and compared to the estimated “theoretical” inflow to the hydroelectric reservoir. We expect that this work will contribute to the understanding of the reliability of the latest NRT satellite-based precipitation products and provide a reference for their applications in operational hydrological simulation and water resource management.
2. Study Area
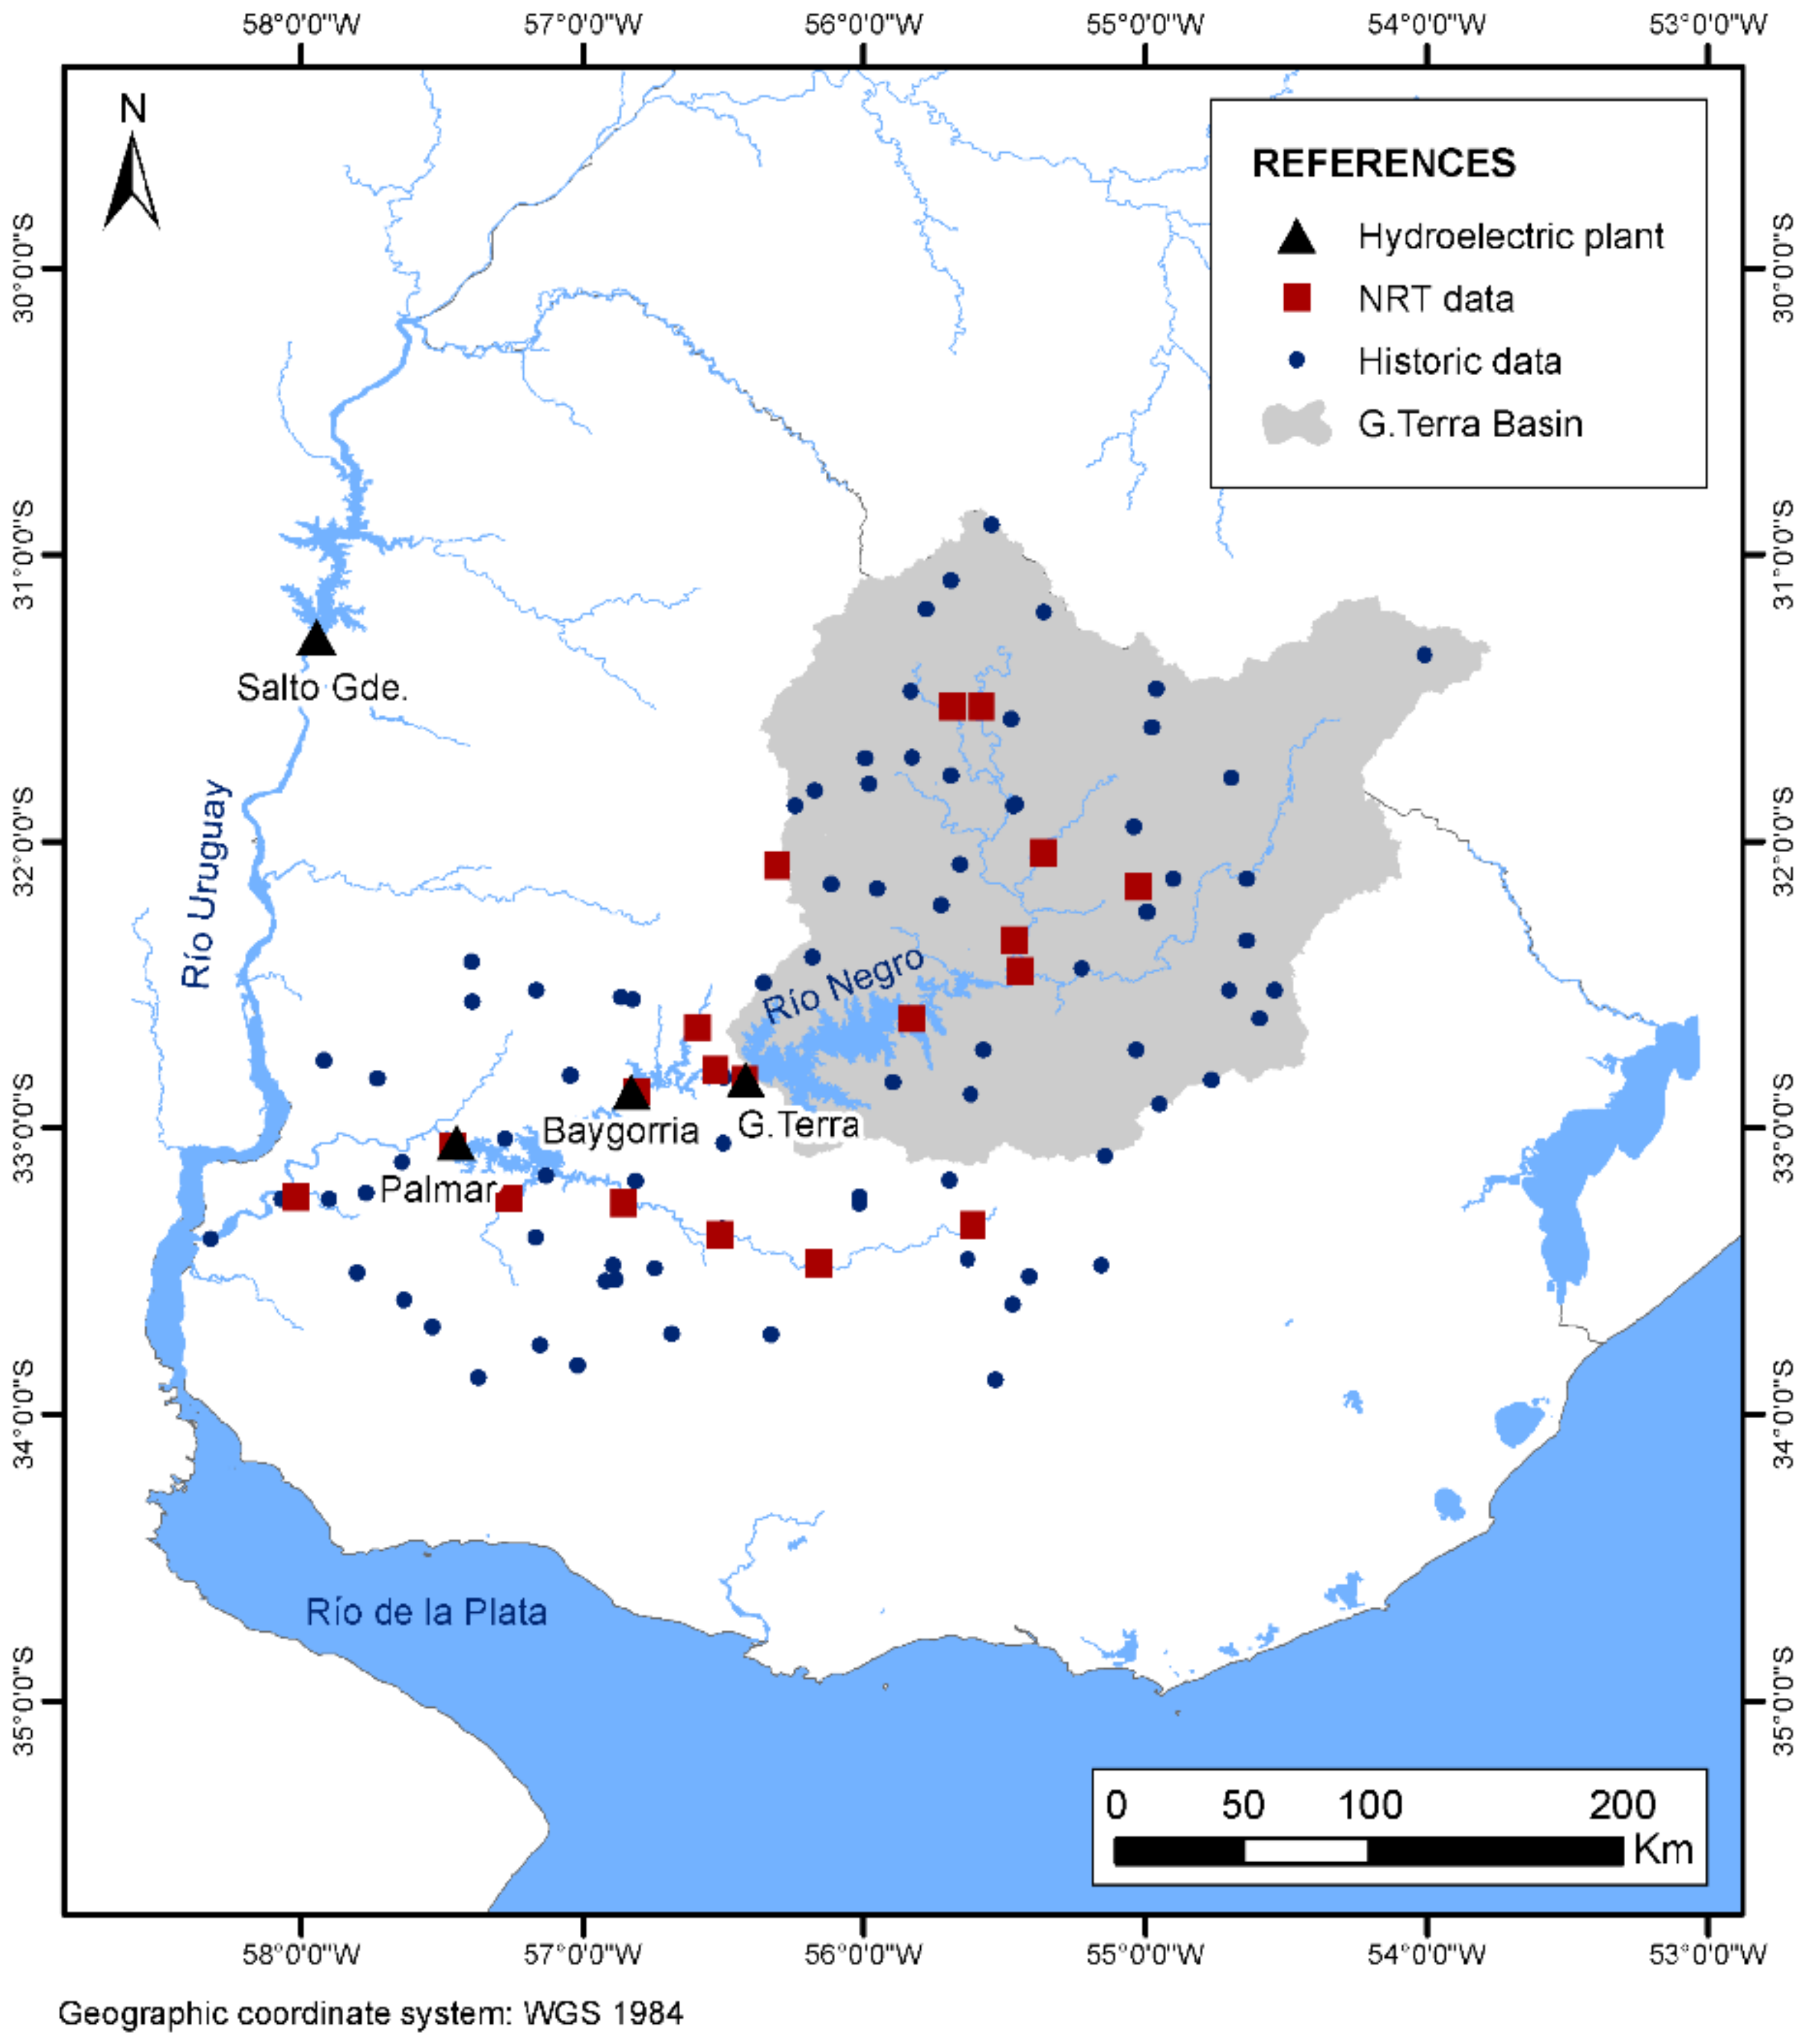
The upper Rio Negro basin, in northeastern Uruguay, has a surface area of about 40,000 km2 (Table 1), taking Gabriel Terra hydroelectric plant (G. Terra) as its closure point.
Downstream G. Terra in the Rio Negro, we find Baygorria and Constitución hydroelectric plants. The binational (Argentina-Uruguay) hydroelectric plant Salto Grande, in the Uruguay River, completes the total hydroelectric capacity that collectively represents a third of the current installed power in the country’s electric system and contribute with more than the 50% of the mean total generated electricity [25] with large interannual variability. In the Uruguayan system, the main storable resource is the water in the hydropower reservoirs, particularly in G. Terra, since it has the highest storage capacity (Table 2). Considering the growing pressure for water demand from both agricultural and forestry expansion, together with the continuous increase of electric energy demand, this highlights the need for adequate tools for the management of water resources in the Rio Negro basin [26].
Figure 1 shows the location of existing hydroelectric plants (black triangle) and the delimitation of G. Terra basin. We also included the location of the rain gauges available at NRT (red square), used for the operational implementation of the merging approach and the historic rain gauge data (blue dot) used for validation purposes. Both datasets are presented in Section 3.
3. Datasets
3.1. Rain Gauge Data Available in Near-Real-Time
Precipitation data available in NRT, used for the operational implementation of the merging technique, comes from the public electric utility (UTE) network. After a data quality control, we selected 19 automatic stations within the Rio Negro basin. The data quality control included the identification of missing data and outlier values, the implementation of plausibility checks based on Scherrer et al. (2011) [27], as well as the evaluation of the accumulated and mean annual rainfall, the average number of wet days (having nonzero rainfall) and the length of the longest dry spell. The period analyzed is 31 January 2010 to 31 May 2020. Daily rainfall totals are taken at 1000 UTC. Figure 1 shows the location of the selected pluviometric stations (symbolized with red squares). It highlights that they are not uniformly distributed, which surely influences the performance of the merging technique to be implemented.
3.2. Historic Rain Gauge Data for Validation Purposes
The historic reference data used to evaluate the proposed methodology comes from a relatively dense and uniformly distributed network of 95 stations provided by UTE, the National Institute of Meteorology (INUMET), the National Institute of Agricultural Research (INIA) and the National Water Agency (ANA) of Brazil. Figure 1 presents the spatial distribution of these stations (blue dots) in comparison with the location of the automatic stations selected for the operational implementation of the merging approach (red squares).
The validation period is 1 February 2017 to 31 May 2020, during which the satellite rainfall estimates selected (presented in Section 3.3) are also available. Daily rainfall totals are taken at 1000 UTC.
3.3. Satellite Rainfall Estimates
In view of the new generation of global precipitation satellite products, which integrate multiple platforms and previously existing algorithms, with high spatial and temporal resolution and better performance than the predecessor products [17,28], the following products were selected:
GSMaP: Global Satellite Mapping of Precipitation [10,11] of the Japan Aerospace Exploration Agency (JAXA), version GSMaP-Gauge-NRT v7 (https://sharaku.eorc.jaxa.jp/GSMaP/).
IMERG: Integrated Multi-satellitE Retrievals for GPM, Global Precipitation Measurement [12] of the National Aeronautics and Space Administration (NASA), version Level 3 V06, NRT Late Run (https://pmm.nasa.gov/data-access/downloads/gpm).
We also took into account in the selection the data latency and accuracy of the different available products. Table 3 presents the main characteristics of the selected datasets (spatial and temporal resolution, data latency and period of availability). Although both products are available on an hourly frequency, the present study is limited to daily precipitation totals since this is the information needed for the hydrological modeling (presented in Section 4.2).
Exploratory Analysis
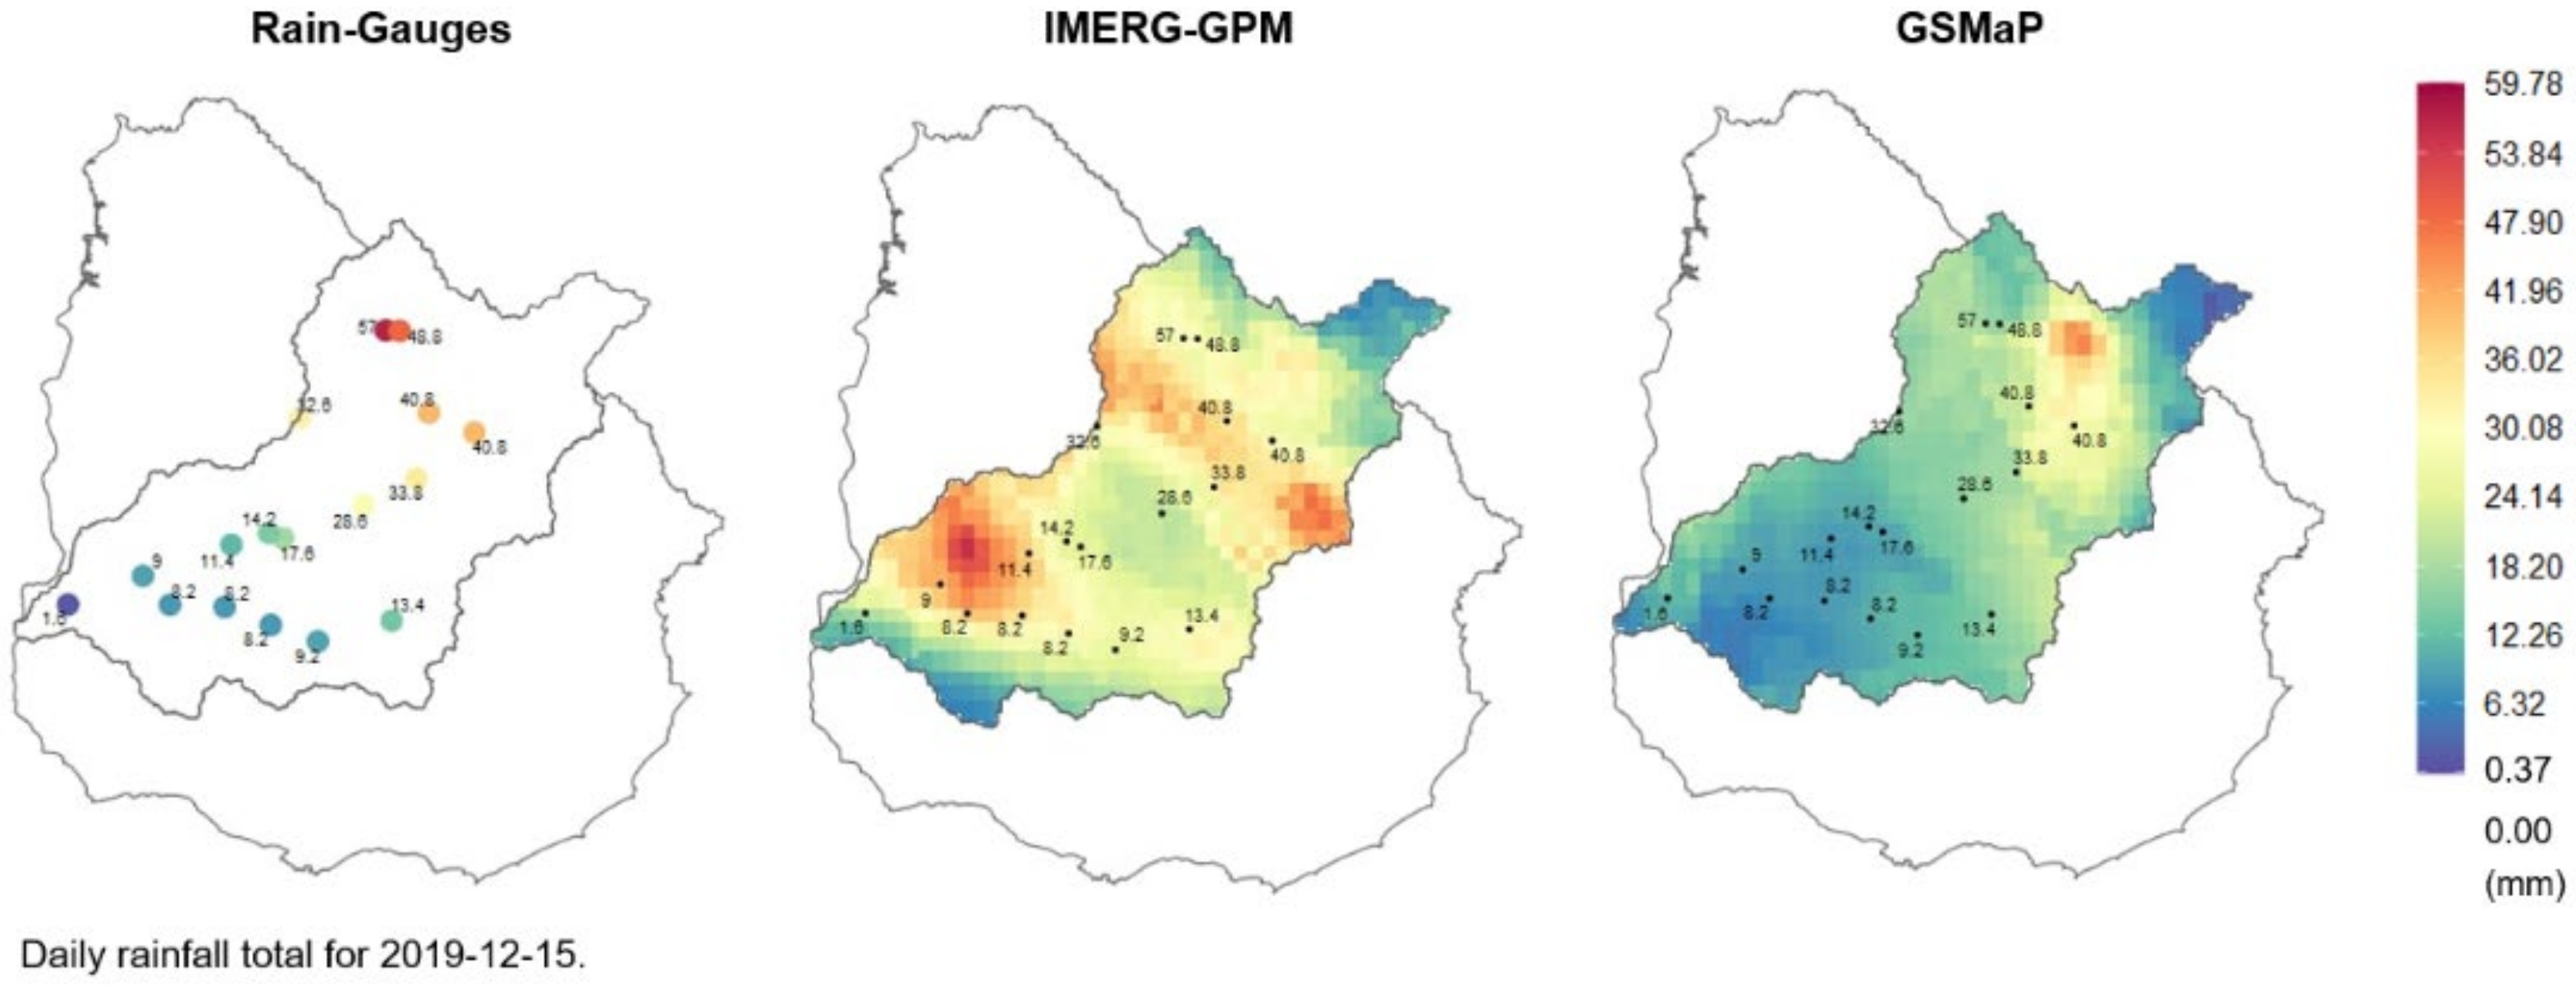
As a first exploration to evaluate the satellite-rainfall estimates at daily time step, the root mean squared error (RMSE) and the probability of detection (POD) for a precipitation threshold of 5 mm were calculated for both, GSMaP and IMERG, against the observed records. To this end, we only considered those grid boxes of the satellite grid that contained at least one gauge observation for the specific day (collocated gauge-satellite data pairs). Table 4 presents the results obtained for the period 1 February 2017 to 31 May 2020. Additionally, the coverage of each satellite product for the entire period is included, as expressed as the percentage of pixels × day of available data.
It shows that, in both cases, the satellite estimates present a satisfactory performance. Both products have a very good coverage in the analyzed period (close to 100%).
However, as mentioned earlier, previous experience with this type of products in the study area [22,23] confirms the need to implement a bias removal scheme based on available surface observations prior to any application.
As an example, Figure 2 shows the comparison of the rain gauge observations and satellite-rainfall estimates for a particular day (15 December 2019).
3.4. Other Data
The following datasets are used for the hydrological modeling (presented in Section 4.2):
Precipitation forecast: a 14-day ensemble precipitation forecast is obtained from the Global Ensemble Forecast System (GEFS v11.0) produced by the National Centers for Environmental Prediction (NCEP-NOAA). The ensemble is composed of the control run and 20 perturbed members and has a spatial resolution of 1° × 1° [29].
Potential evapotranspiration (PET): the mean annual cycle of PET was calculated from the records of 9 meteorological stations belonging to INUMET and INIA for the period 1991–2015, using the Penman-Monteith method.
Amount of water storage capacity (SC) in the soils present in the G. Terra basin: the SC for each soil type was obtained from the CONEAT soil map at scale 1:40.000 [30] of the Office of Natural Resources of the Ministry of Livestock, Agriculture and Fisheries of Uruguay (DGRN-MGAP). Then, it is weighted by area to obtain a representative value for each sub-basin.
A digital elevation model (DEM) of the Shuttle Radar Topography Mission (SRTM-NASA) with a resolution of 90 m was used to perform watersheds delineation and characterization.
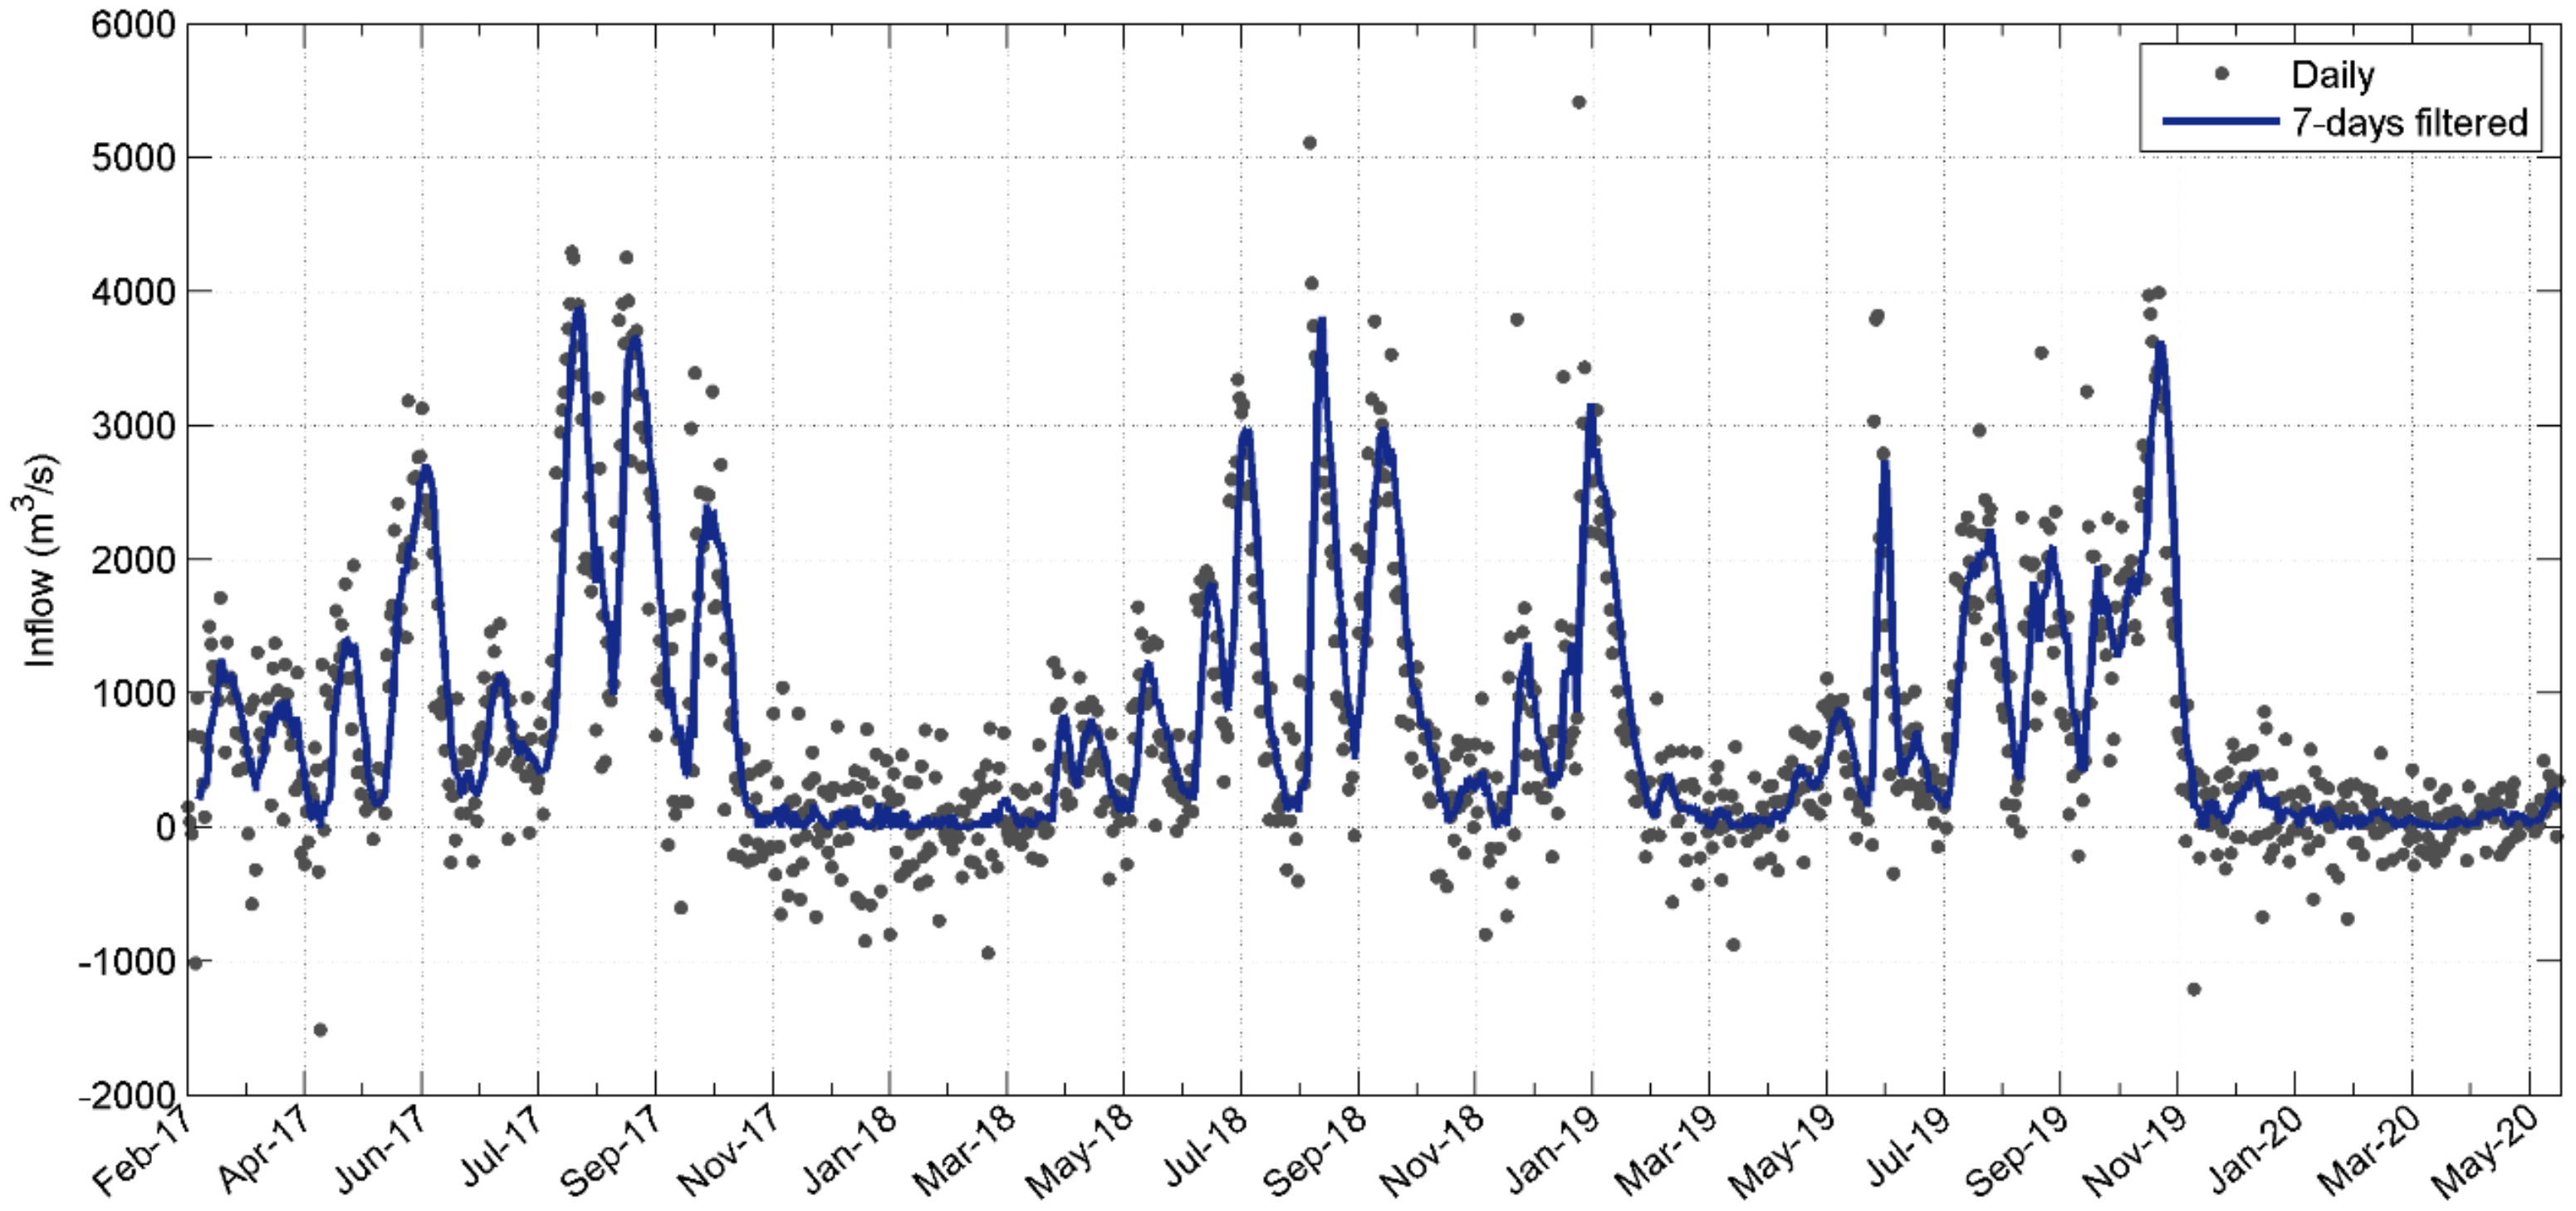
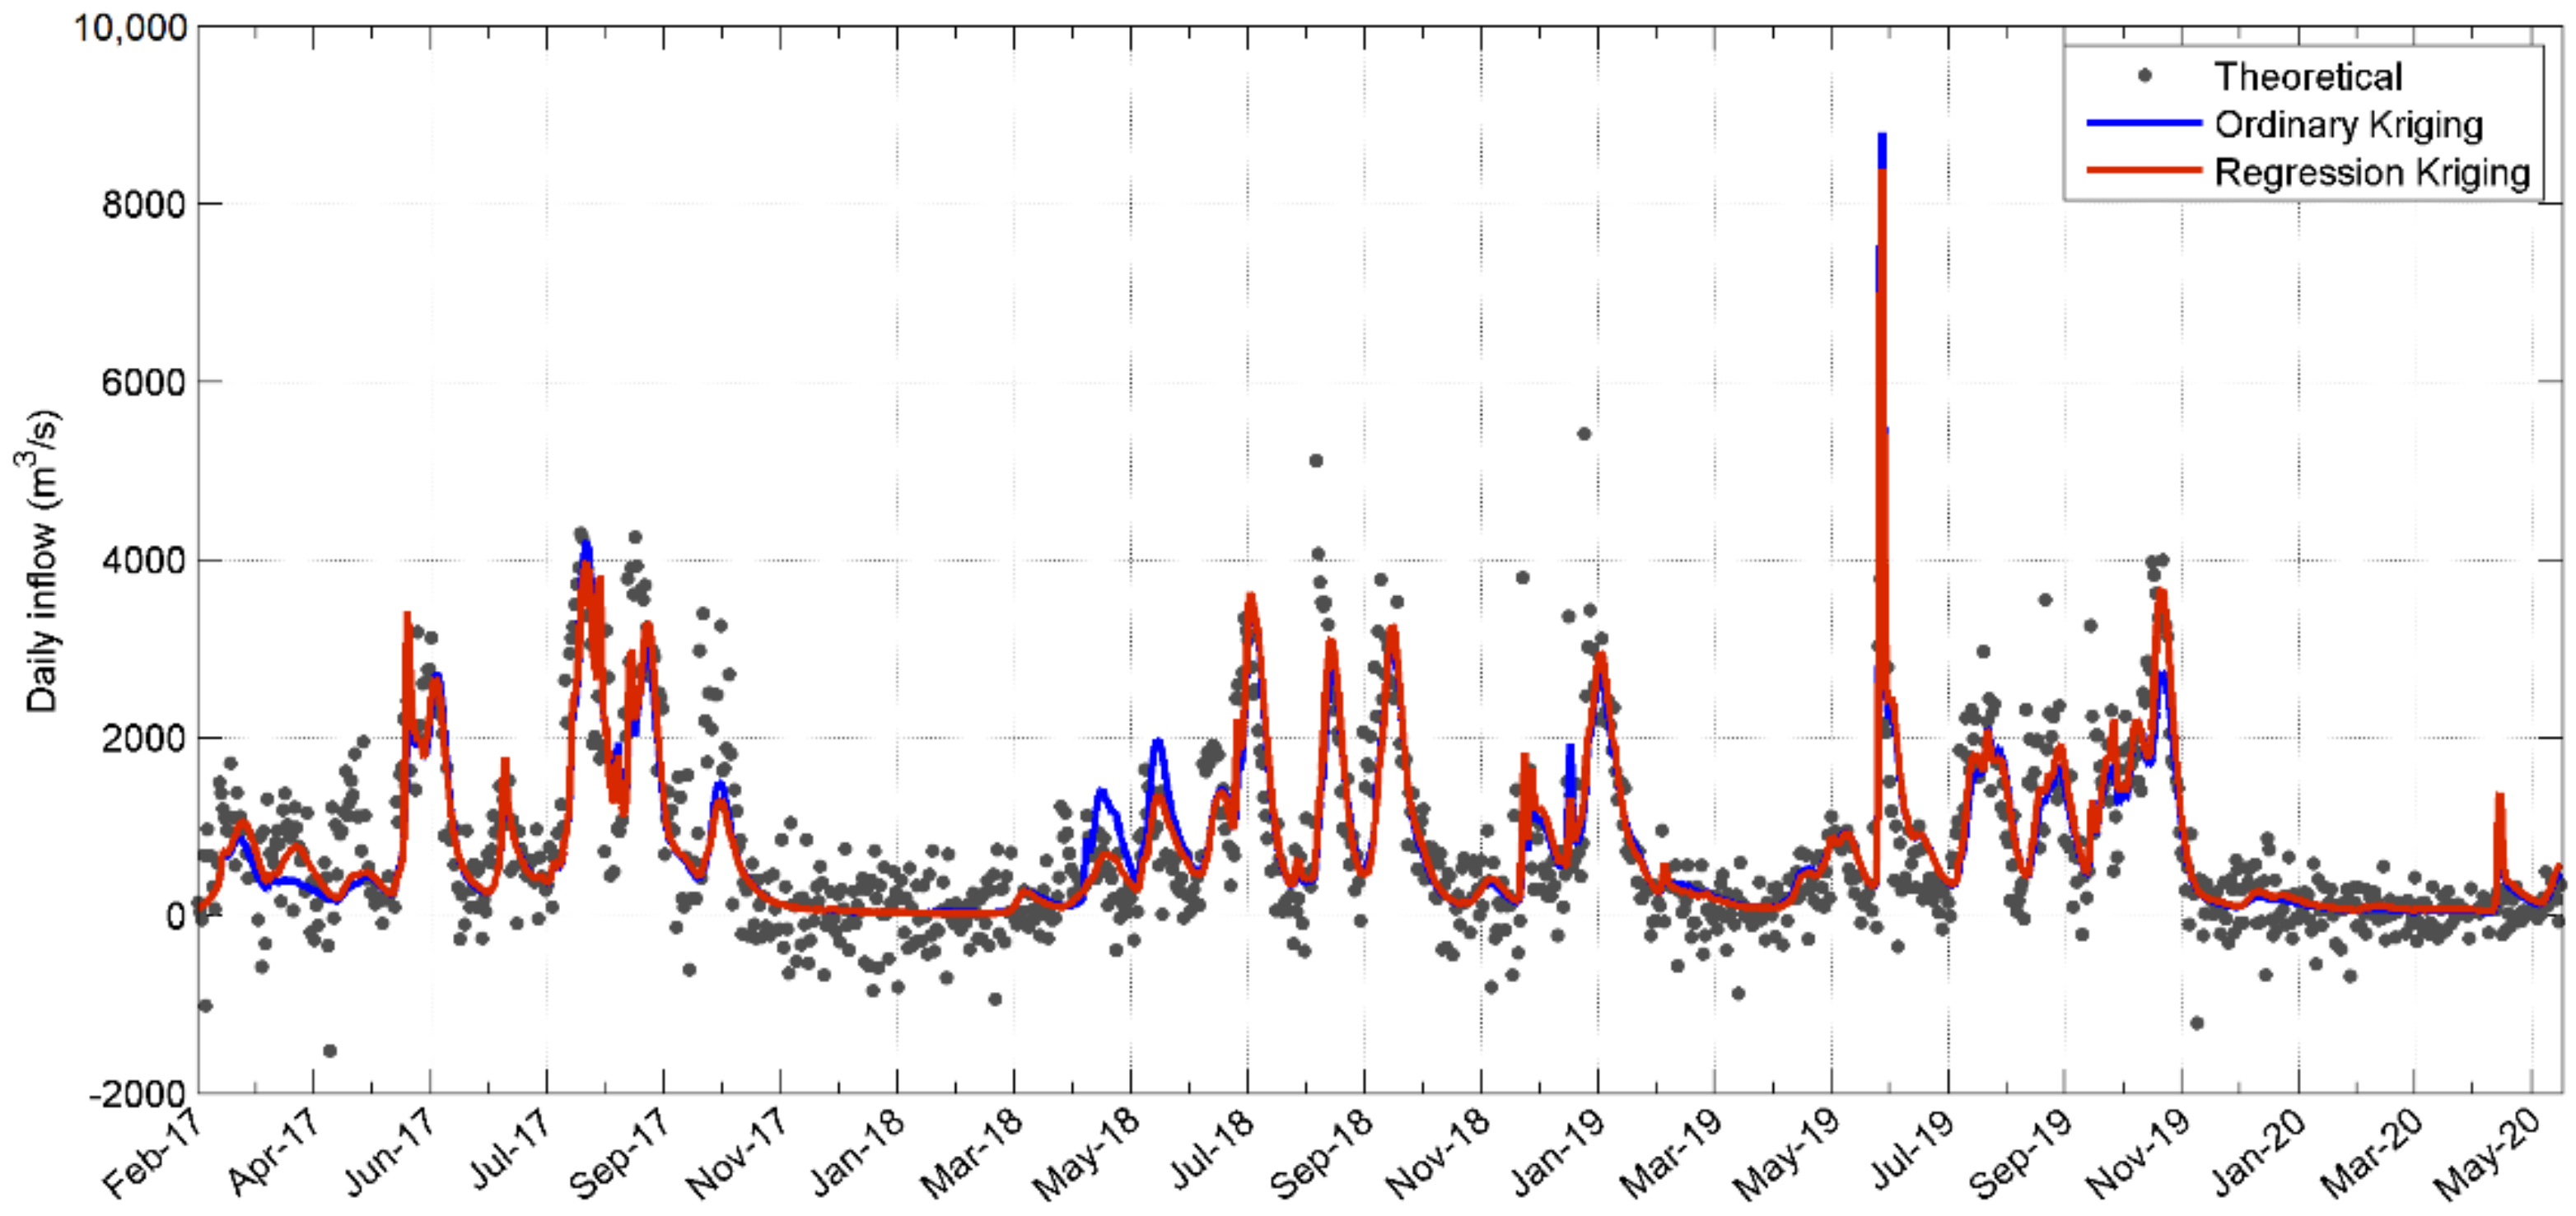
Additionally, for the evaluation of the hydrological model, we used the daily series of estimated inflow to G. Terra reservoir provided by UTE (represented with grey dots in Figure 3). This series is called “theoretical” since it consists of an estimation based on a water balance in the reservoir and it is not a direct observation. Specifically, the estimated “theoretical” inflow is obtained (indirectly) from the water surface elevation at the dam and the turbinated and discharged flows. Therefore, this estimation is sensitive to the representation of the reservoir and the effect of the wind on its surface. Indeed, Figure 3 shows negative inflow values, which may be due to the compensation effect of excessively high values particular of the methodology (possibly associated with the action of the wind in the reservoir). Figure 3 also includes the time series of the 7-days filtered estimated “theoretical” inflow (blue line), considering that the model is used as a tool to support the decision-making of the weekly dispatch.
4. Methodology
4.1. Merging Approach
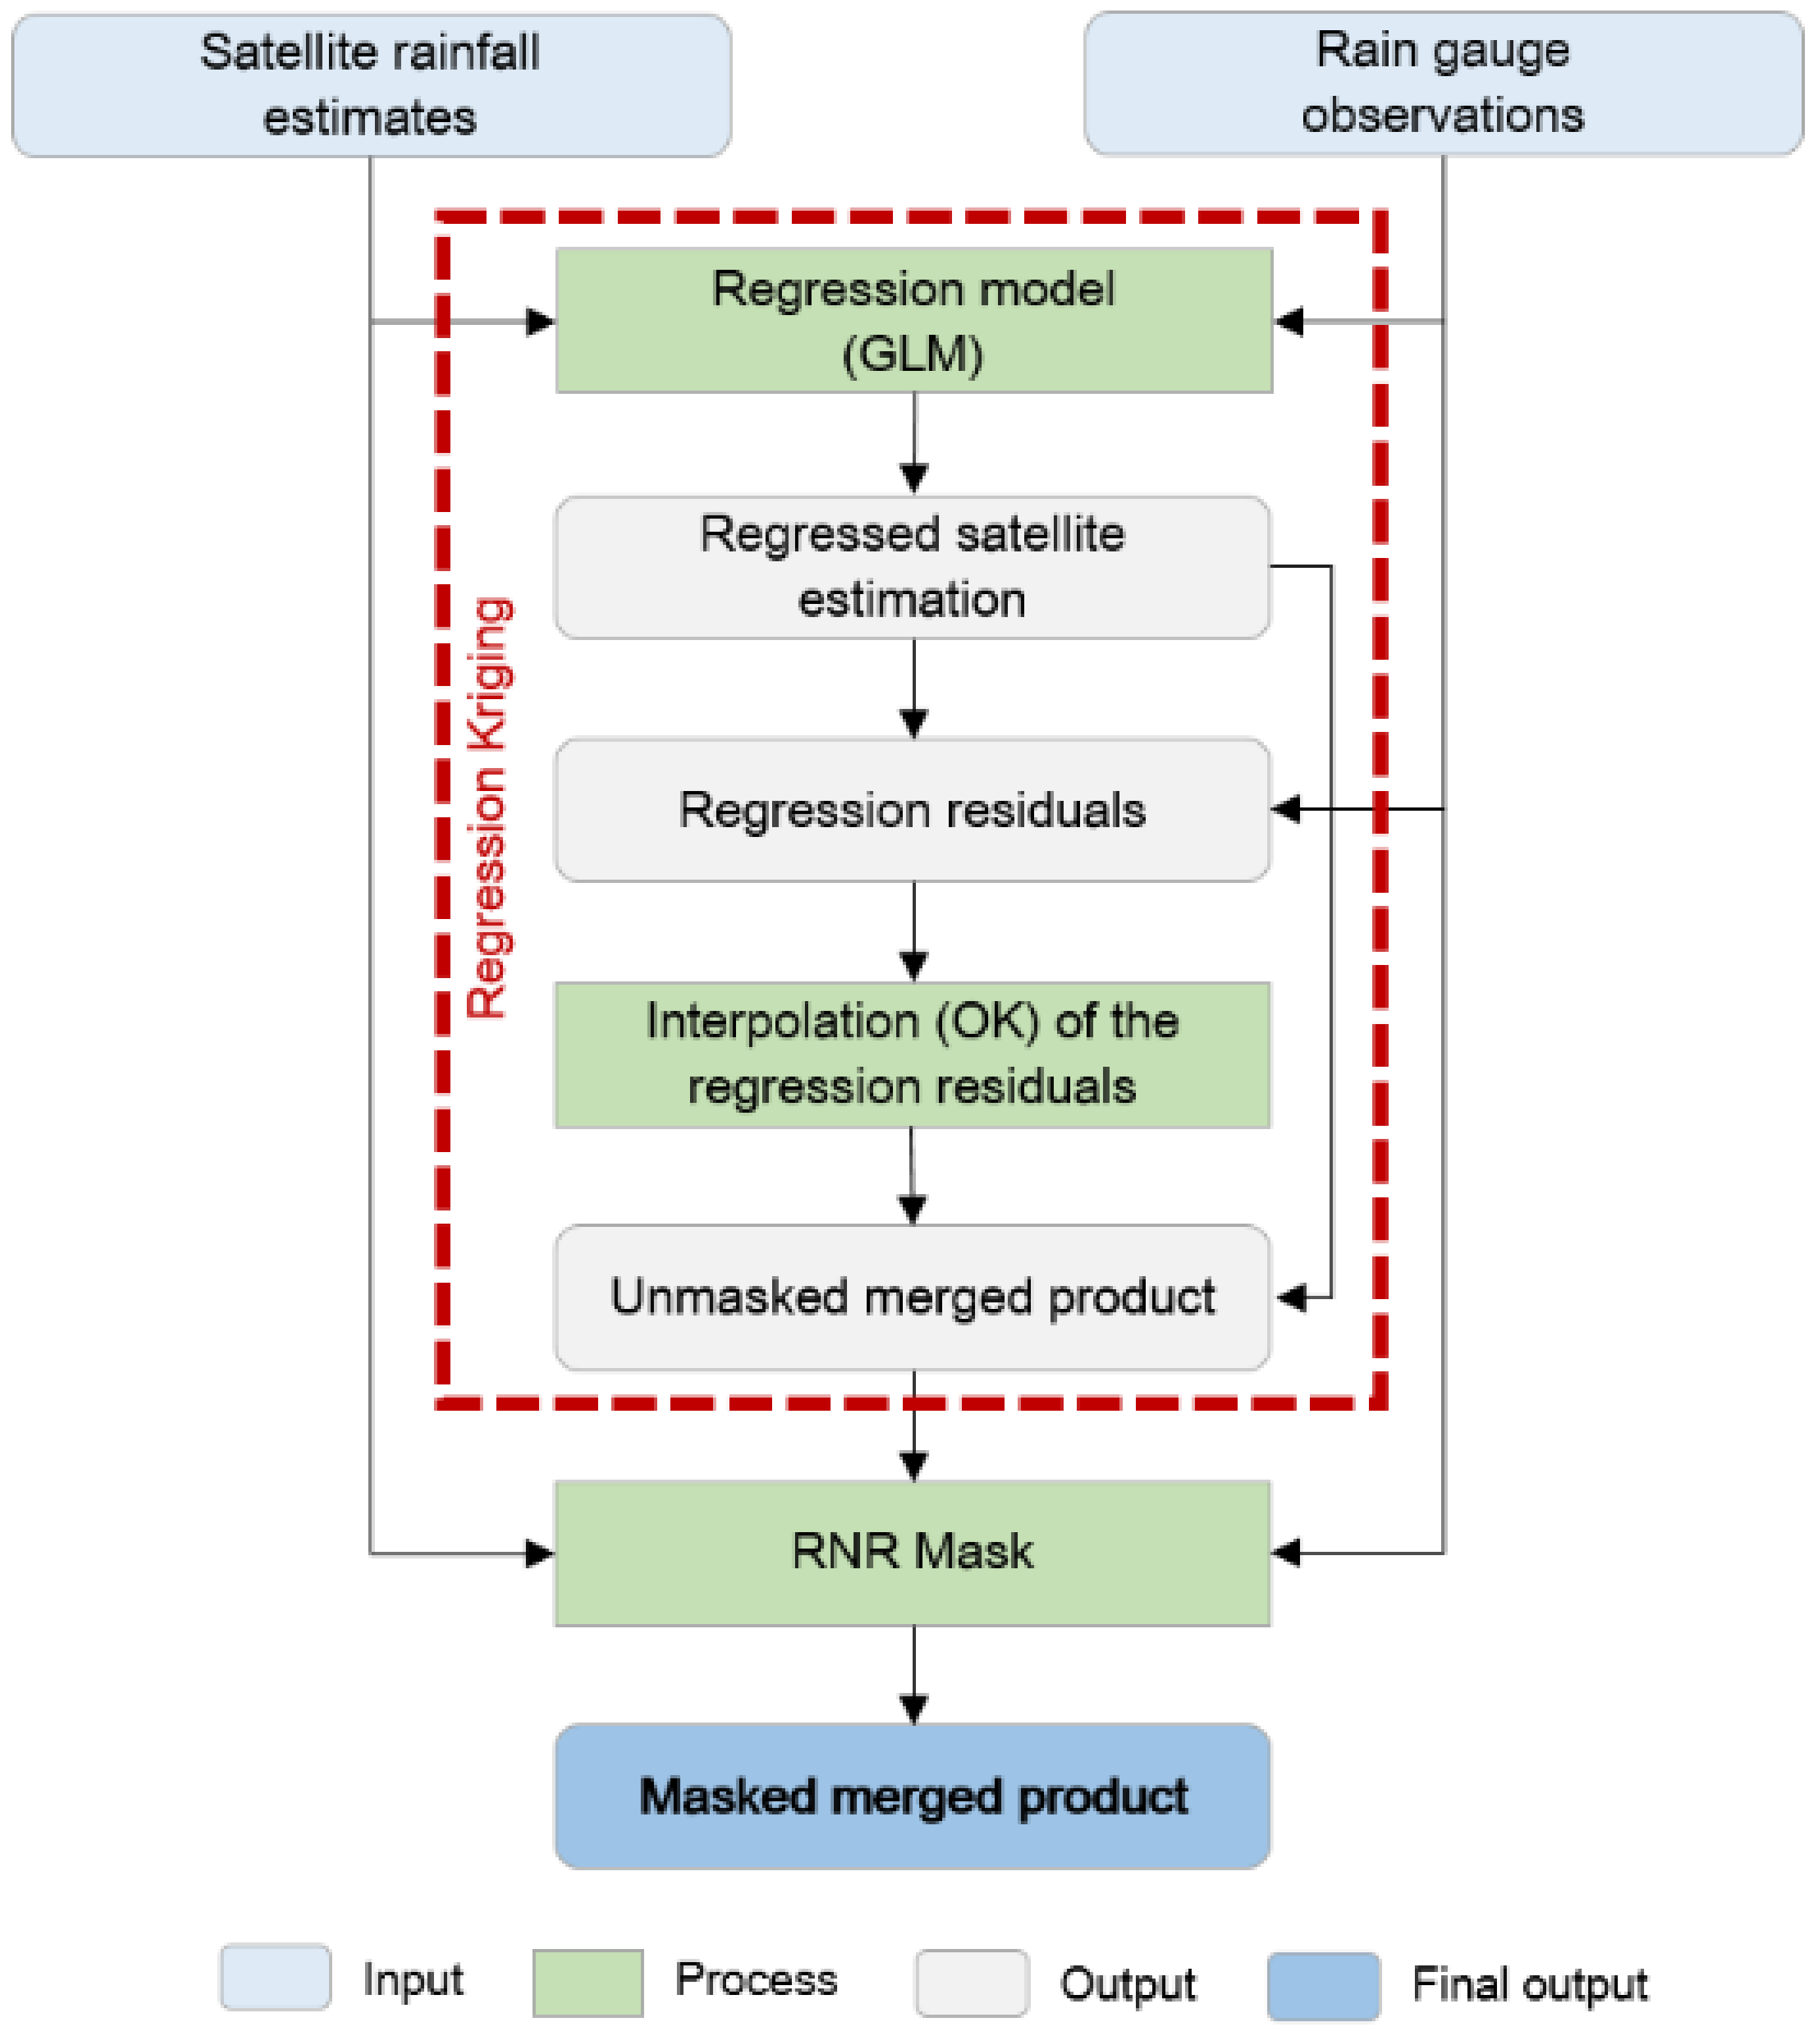
The satellite-rain gauge data merging technique considered is based on the universal model of spatial variation [31,32]. As one of the hybrid geostatistical models, Regression Kriging (RK) is a spatial interpolation technique that combines a deterministic model (regression) with a statistical model (Ordinary Kriging of the regression residuals). It uses a deterministic model to estimate a value of the variable (precipitation) by using actual ground measurements to calibrate a model for the satellite estimates and then refines the estimate analyzing the residuals for spatial correlation; finally, it combines the statistical fitting and deterministic modeling [33].
The 3-step proposed model is summarized as follows (Figure 4).
Regression of the station data on the satellite data using a Generalized Linear Model (GLM). A GLM model is implemented in order to fit the satellite estimates to the rainfall observations at station locations. For the GLM, we use a spatially correlated residual structure that is fit to the available data. For each day, we calculate both exponential and spherical spatial correlations and choose the one with the highest Akaike information criterion (AIC). Several regressors alternatives were tested, including both satellite products and each one separately. Based on the performance statistics obtained (not shown), we decided to use, for each day the individual satellite product, either IMERG or GSMaP, with the highest Pearson correlation between the rain gauge observations and the collocated satellite values.
Interpolation of the regression residuals at station locations to the entire grid using Ordinary Kriging. Once the regressed satellite estimation is obtained, we calculate the error (residual) between it and the observations at the station locations. Then, the interpolation of the regression residuals to the entire grid is done through Ordinary Kriging [34], which exploits the spatial correlation in the residuals and this is added to the regressed satellite estimation in order to obtain the “unmasked” merged product.
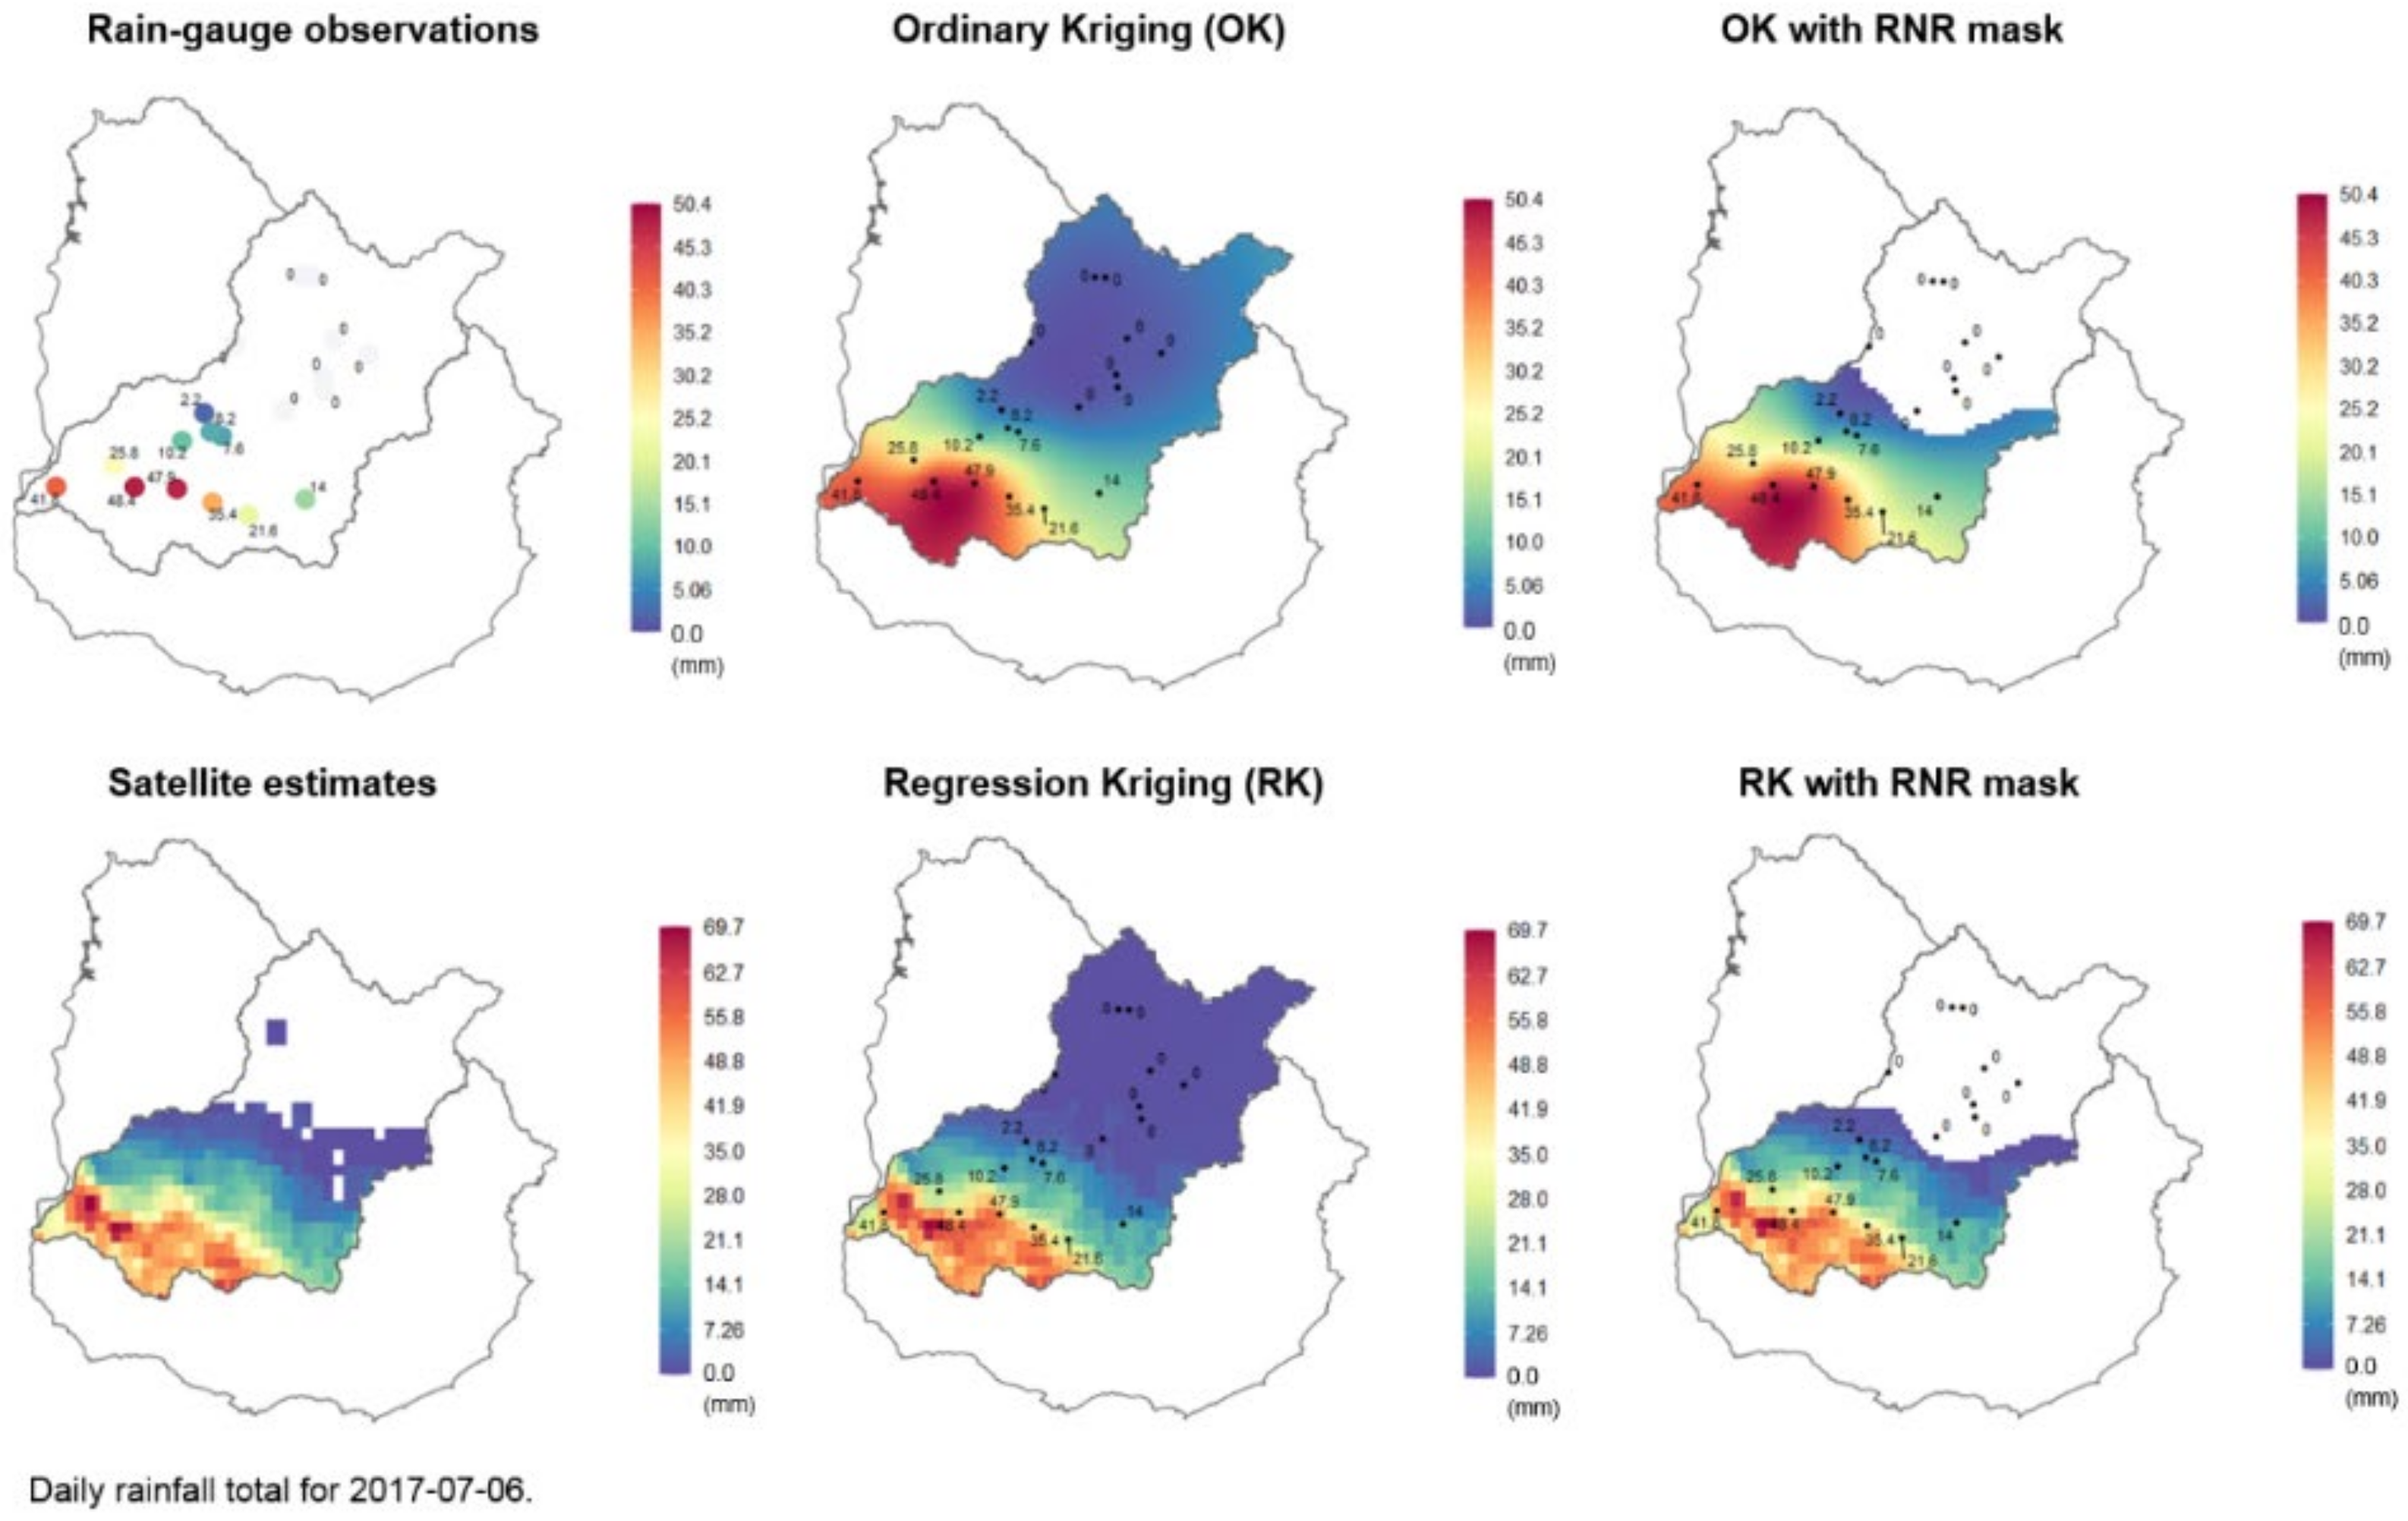
Application of a rain/no rain mask (RNR mask). We apply an RNR mask to the merged product to prevent overestimation of the occurrence of rainfall in the interpolated field. The mask is obtained using the same merged precipitation estimate (RK) technique but switching the target observations to binary rain/no rain observations. Satellite estimates are used as regressors to forecast this binary field with the same RK technique described in 1 and 2. We use a threshold of 0.3 in the output of RK, a continuous field, to delimitate rainy region for the mask. Finally, the unmasked product is multiplied by the RNR mask to obtain the final masked merged product. Figure 5 shows an example of the application of the RNR mask for a given day (6 July 2017). The middle column corresponds to the unmasked OK and RK products while the rightmost column shows the masked versions. As can be seen, there is a large purple region of slightly positive values (zeros are transparent) in the unmasked product, while in the masked products this region is forced to zero.
4.2. Rainfall-Runoff Model
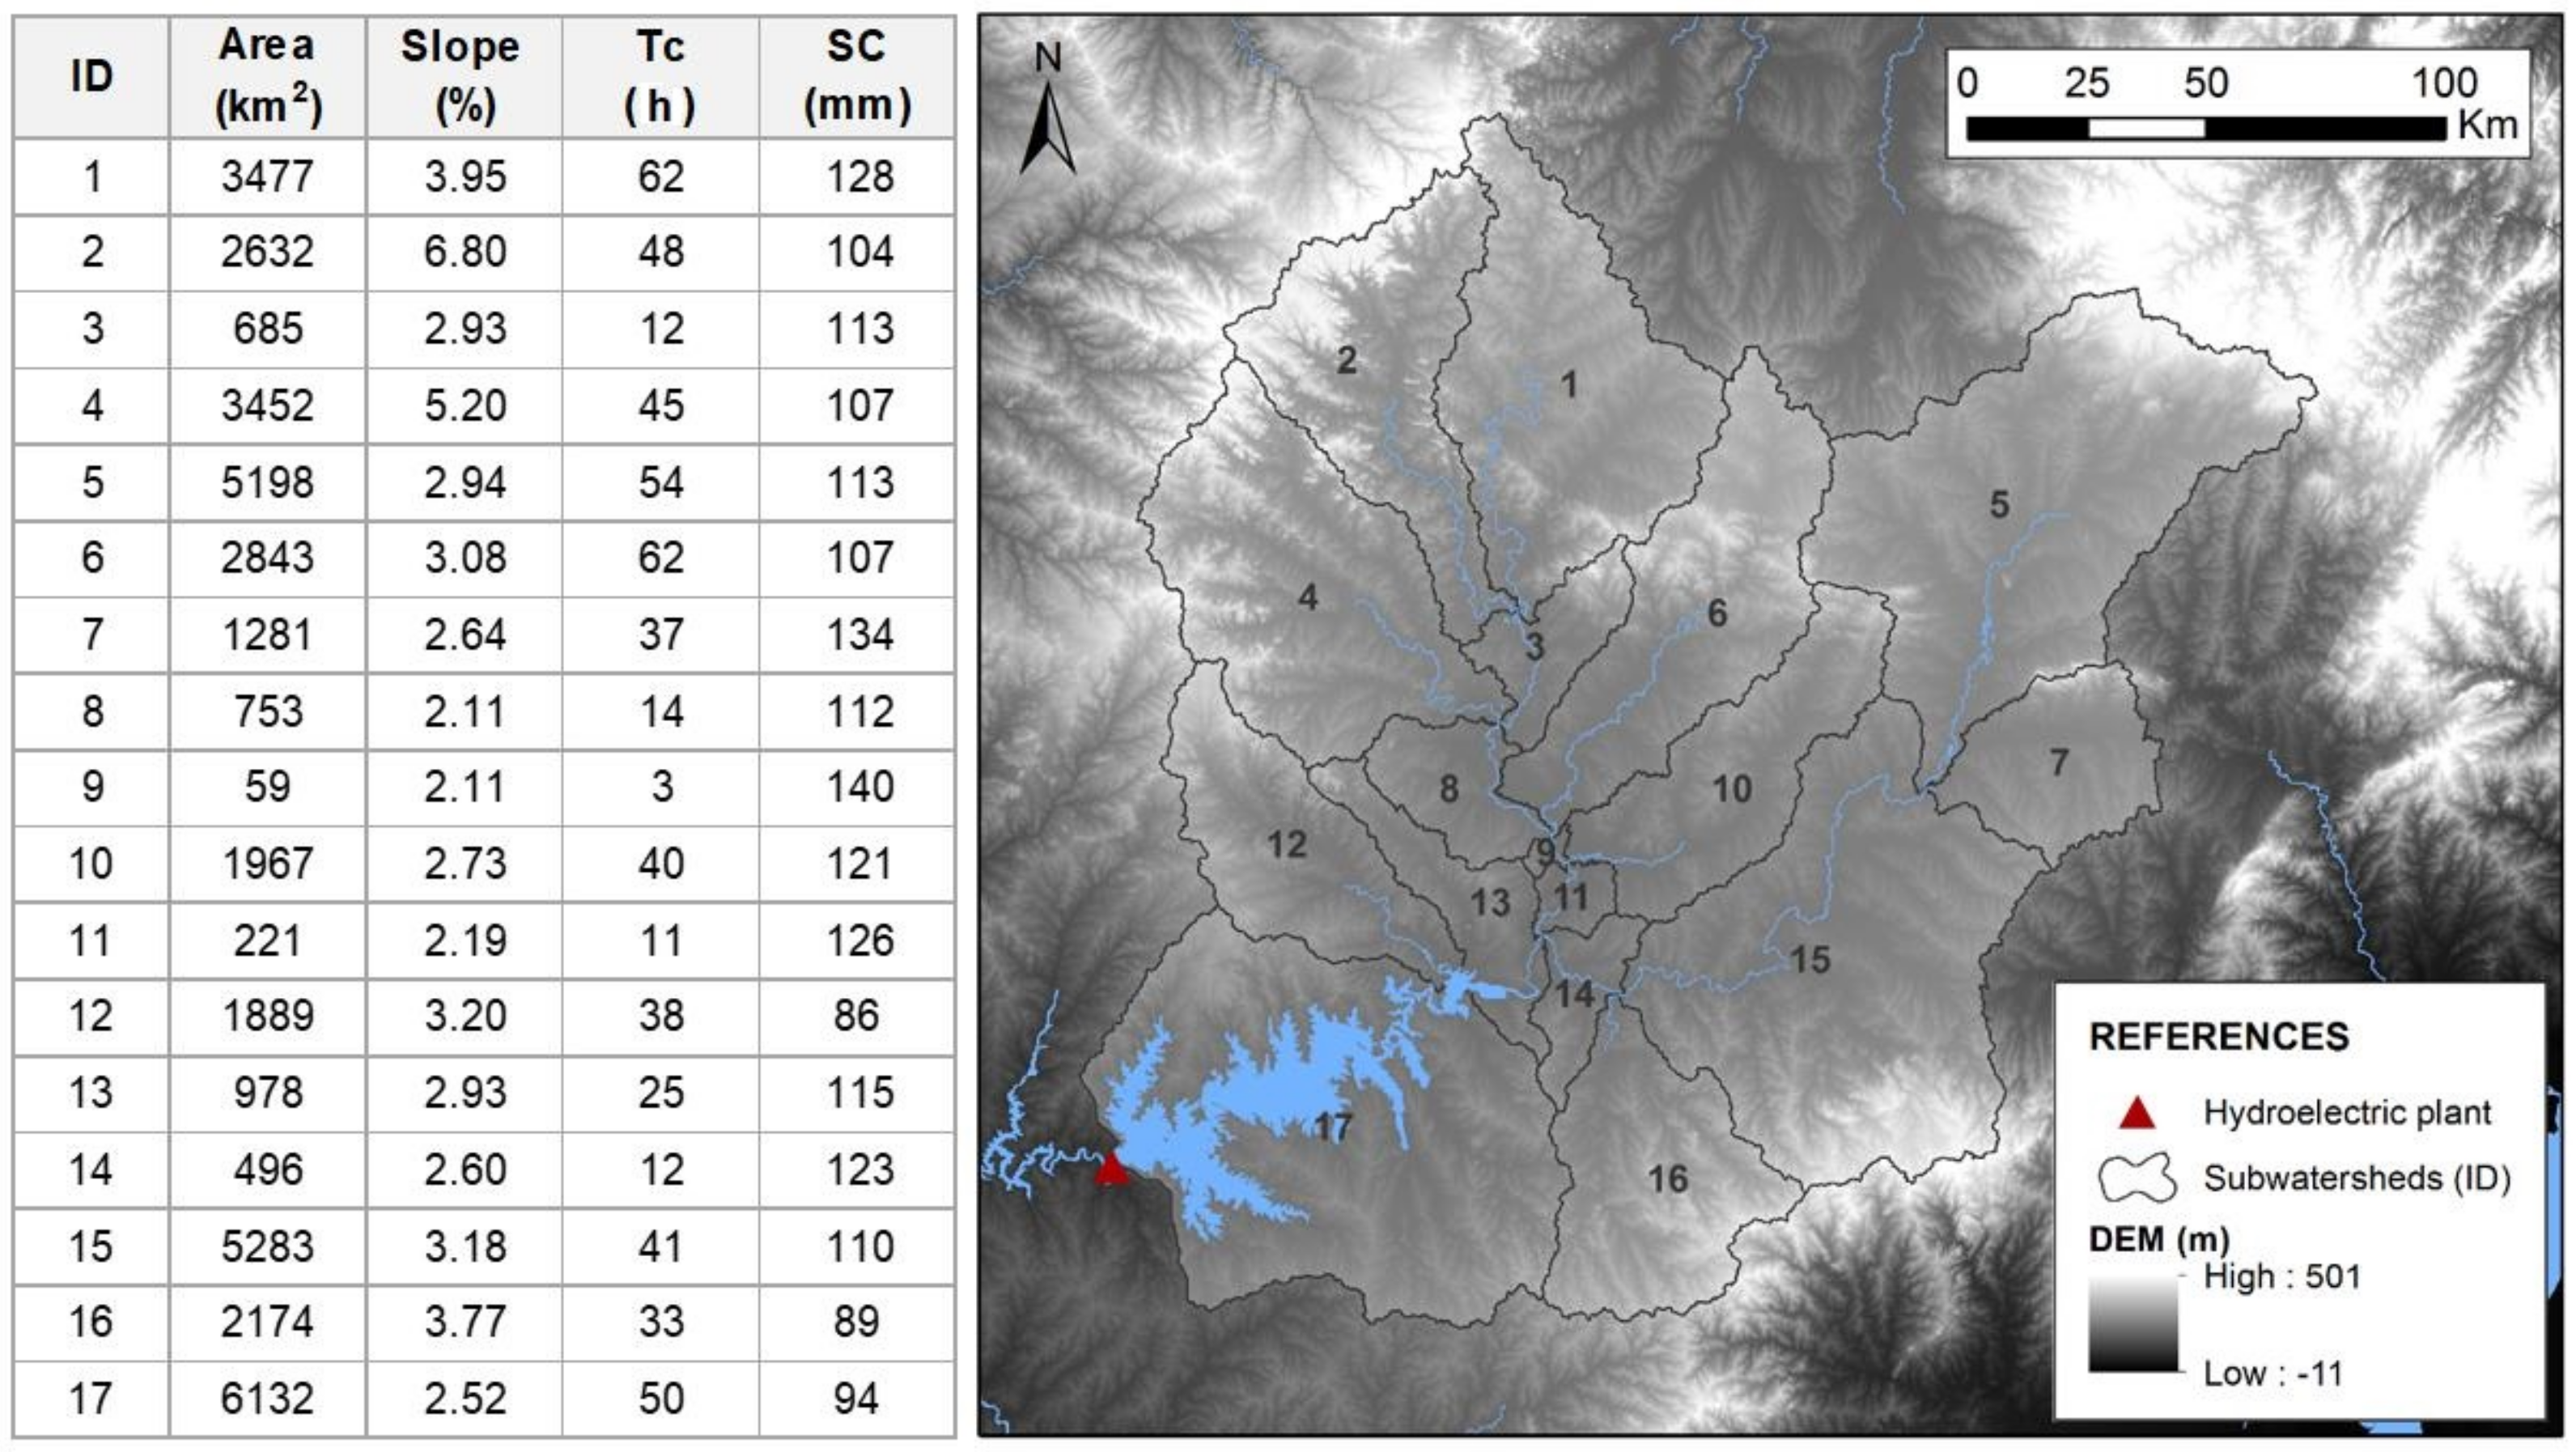
The G. Terra basin (39,500 km2) was discretized into 17 sub-basins with areas smaller than 7000 km2. Figure 6 presents the delimited catchments and their characteristics including: basin area (km2), slope (%), concentration-time (Tc) (h) and SC (mm).
To simulate the hydrological inflows to G. Terra reservoir we use a daily hydrological model (GR4J) coupled with a hydrological transit model (Muskingum). The GR4J model is a daily lumped four-parameter rainfall-runoff model developed by Perrin et al. (2003) [24]. The Muskingum model [37] is a two-parameter hydrologic flood routing method, based on the storage continuity equation.
In a previous study, Narbondo et al. (2020) [38] present a successful application of the GR4J daily rainfall-runoff model at 13 watersheds of Uruguay. They proposed an improved regionalization approach to predict runoff time series in ungauged catchments at country scale. Particularly, they found the optimal set of parameters of the GR4J model and, in addition, they found the relationships between them and watershed-physiographic factors. Table 5 shows the description of the “GR4J-Muskingum” model parameters and the values adopted in each case following these recommendations.
4.3. Goodness-of-Fit Indicators
The performance of the merged precipitation estimate (RK) was statistically evaluated through comparison with an independent rain gauge network, relatively dense and uniformly distributed (referred to as “historic data” in Figure 1). We also included in the evaluation the estimation based on the Ordinary Kriging interpolation from NRT rain gauge observations (OK) at the same grid as the satellite data (0.1° × 0.1°), which serves as the baseline for comparison with the merged product. Both estimates (RK and OK) were compared with the rain gauge observations belonging to the historic reference dataset. The performance statistics used for the comparison are the mean error (ME), the RMSE, the frequency bias (FBS), the POD and the false alarm ratio (FAR) for a precipitation threshold of 5 mm [39,40].
Furthermore, several verification indices were used to quantitatively assess the hydrological utility of the precipitation estimates based on the estimated “theoretical” inflow to G. Terra reservoir (Figure 3), including the difference of total accumulated inflow (∆V), the Nash–Sutcliffe efficiency (NSE), the Kling-Gupta efficiency (KGE), the coefficient of determination (R2) and RMSE [41]. Additionally, we also conducted a first-level catchment water balance using the runoff ratio (RR), defined as the ratio of the precipitation that contributes to runoff [20]. The RR values calculated using the different outputs from both estimates (RK and OK) were compared to known values from the literature [42].
In all cases, the period analyzed is from 1 February 2017 to 31 May 2020.
4.4. Operational Implementation
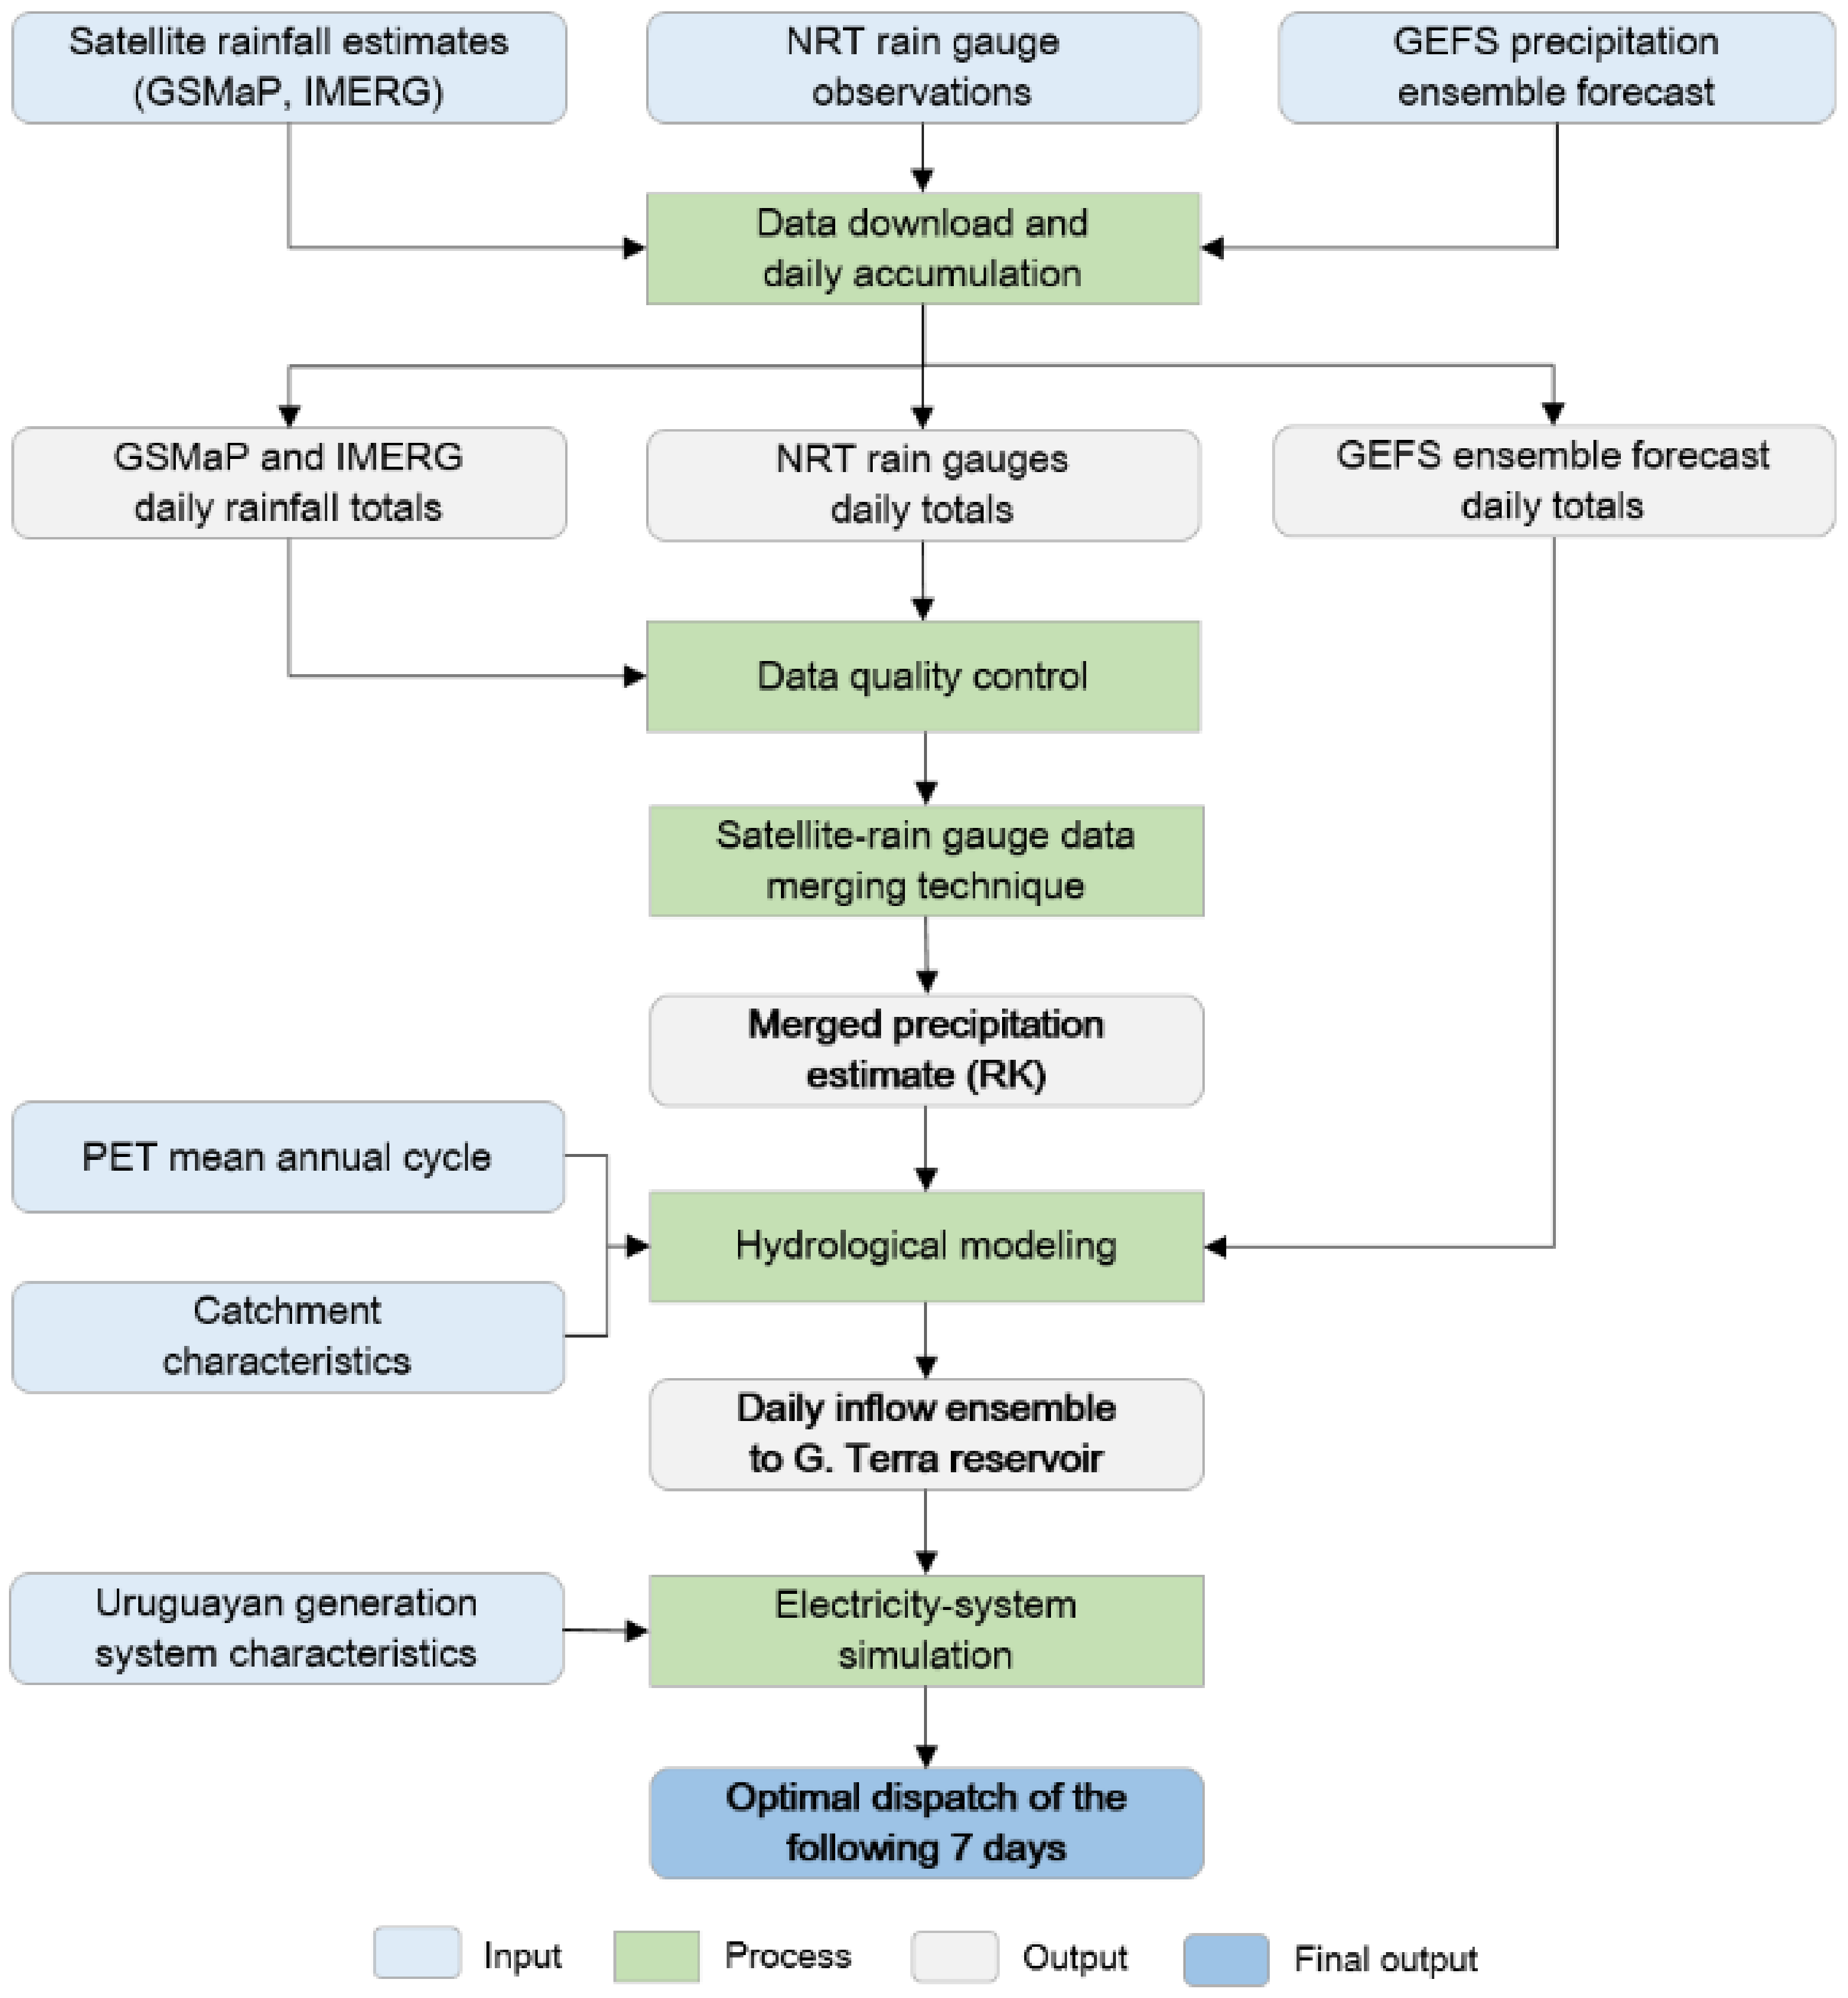
The 5-step operational implementation of the coupled hydrological and electric system modeling approach is presented next (Figure 7).
Data download and daily accumulation. The required precipitation input data are adequately collected: records of NRT stations, GSMaP-NRT, IMERG-NRT Late Run and GEFS ensemble forecast. Daily rainfall totals are accumulated at 1000 UTC.
Data quality control. Prior to the merging algorithm, a data quality control from both NRT rain gauges and satellite estimates is performed based on the Climate Data Tools (CDT-IRI) [43]. Data quality control focuses on outlier detection for the purpose of elimination of data contamination, including the implementation of spatial-plausibility checks based on Scherrer et al. (2011) [27]. The threshold values used in the controls were adjusted manually, looking to eliminate the most obvious suspicious values in the available historical data set.
Merging technique. The satellite-rain gauge data merging technique is implemented in order to obtain the RK precipitation estimate over the Rio Negro basin.
Hydrological modeling. Based on the RK estimate and the GEFS precipitation ensemble forecast, the GR4J rainfall-runoff model is implemented at the 17 sub-catchments of the G. Terra basin. The runoff output is then routed along the river network using the Muskingum model to simulate the daily inflow ensemble to G. Terra reservoir.
Electricity-system simulation. The simulated inflow ensemble is integrated to the existing model of the interconnected electric system (SimSEE), particularly into the synthesizer model (CEGH), through biases and noise attenuators per time step adjusted through maximum likelihood [44].
The implemented model was integrated into SimSEE’s on June 2020 and has since run under the responsibility of the Electricity Market Administration (ADME) of Uruguay. The application (called VATES) is continuously updating and executing a SimSEE Room with the representation of the Uruguayan generation system, in order to obtain the dispatch of the following seven days with hourly detail. The results and information relevant to the operation are published automatically on ADME’s website [45]. They also provide the required statistical information for the design of exchange offers with neighboring countries and the energy spot market.
5. Results and Discussion
5.1. Rainfall Model Performance
Table 6 presents the comparison of the performance metrics for the OK (stations only) and the RK (merged product) precipitation estimates. The results obtained are global values, integrated both spatially (among the 95 stations in the Rio Negro basin) and temporally (averaged over the analyzed period). Overall, both estimates have a good performance but RK performs slightly better. This indicates an improvement in the accuracy of the precipitation estimation by the incorporation of satellite data.
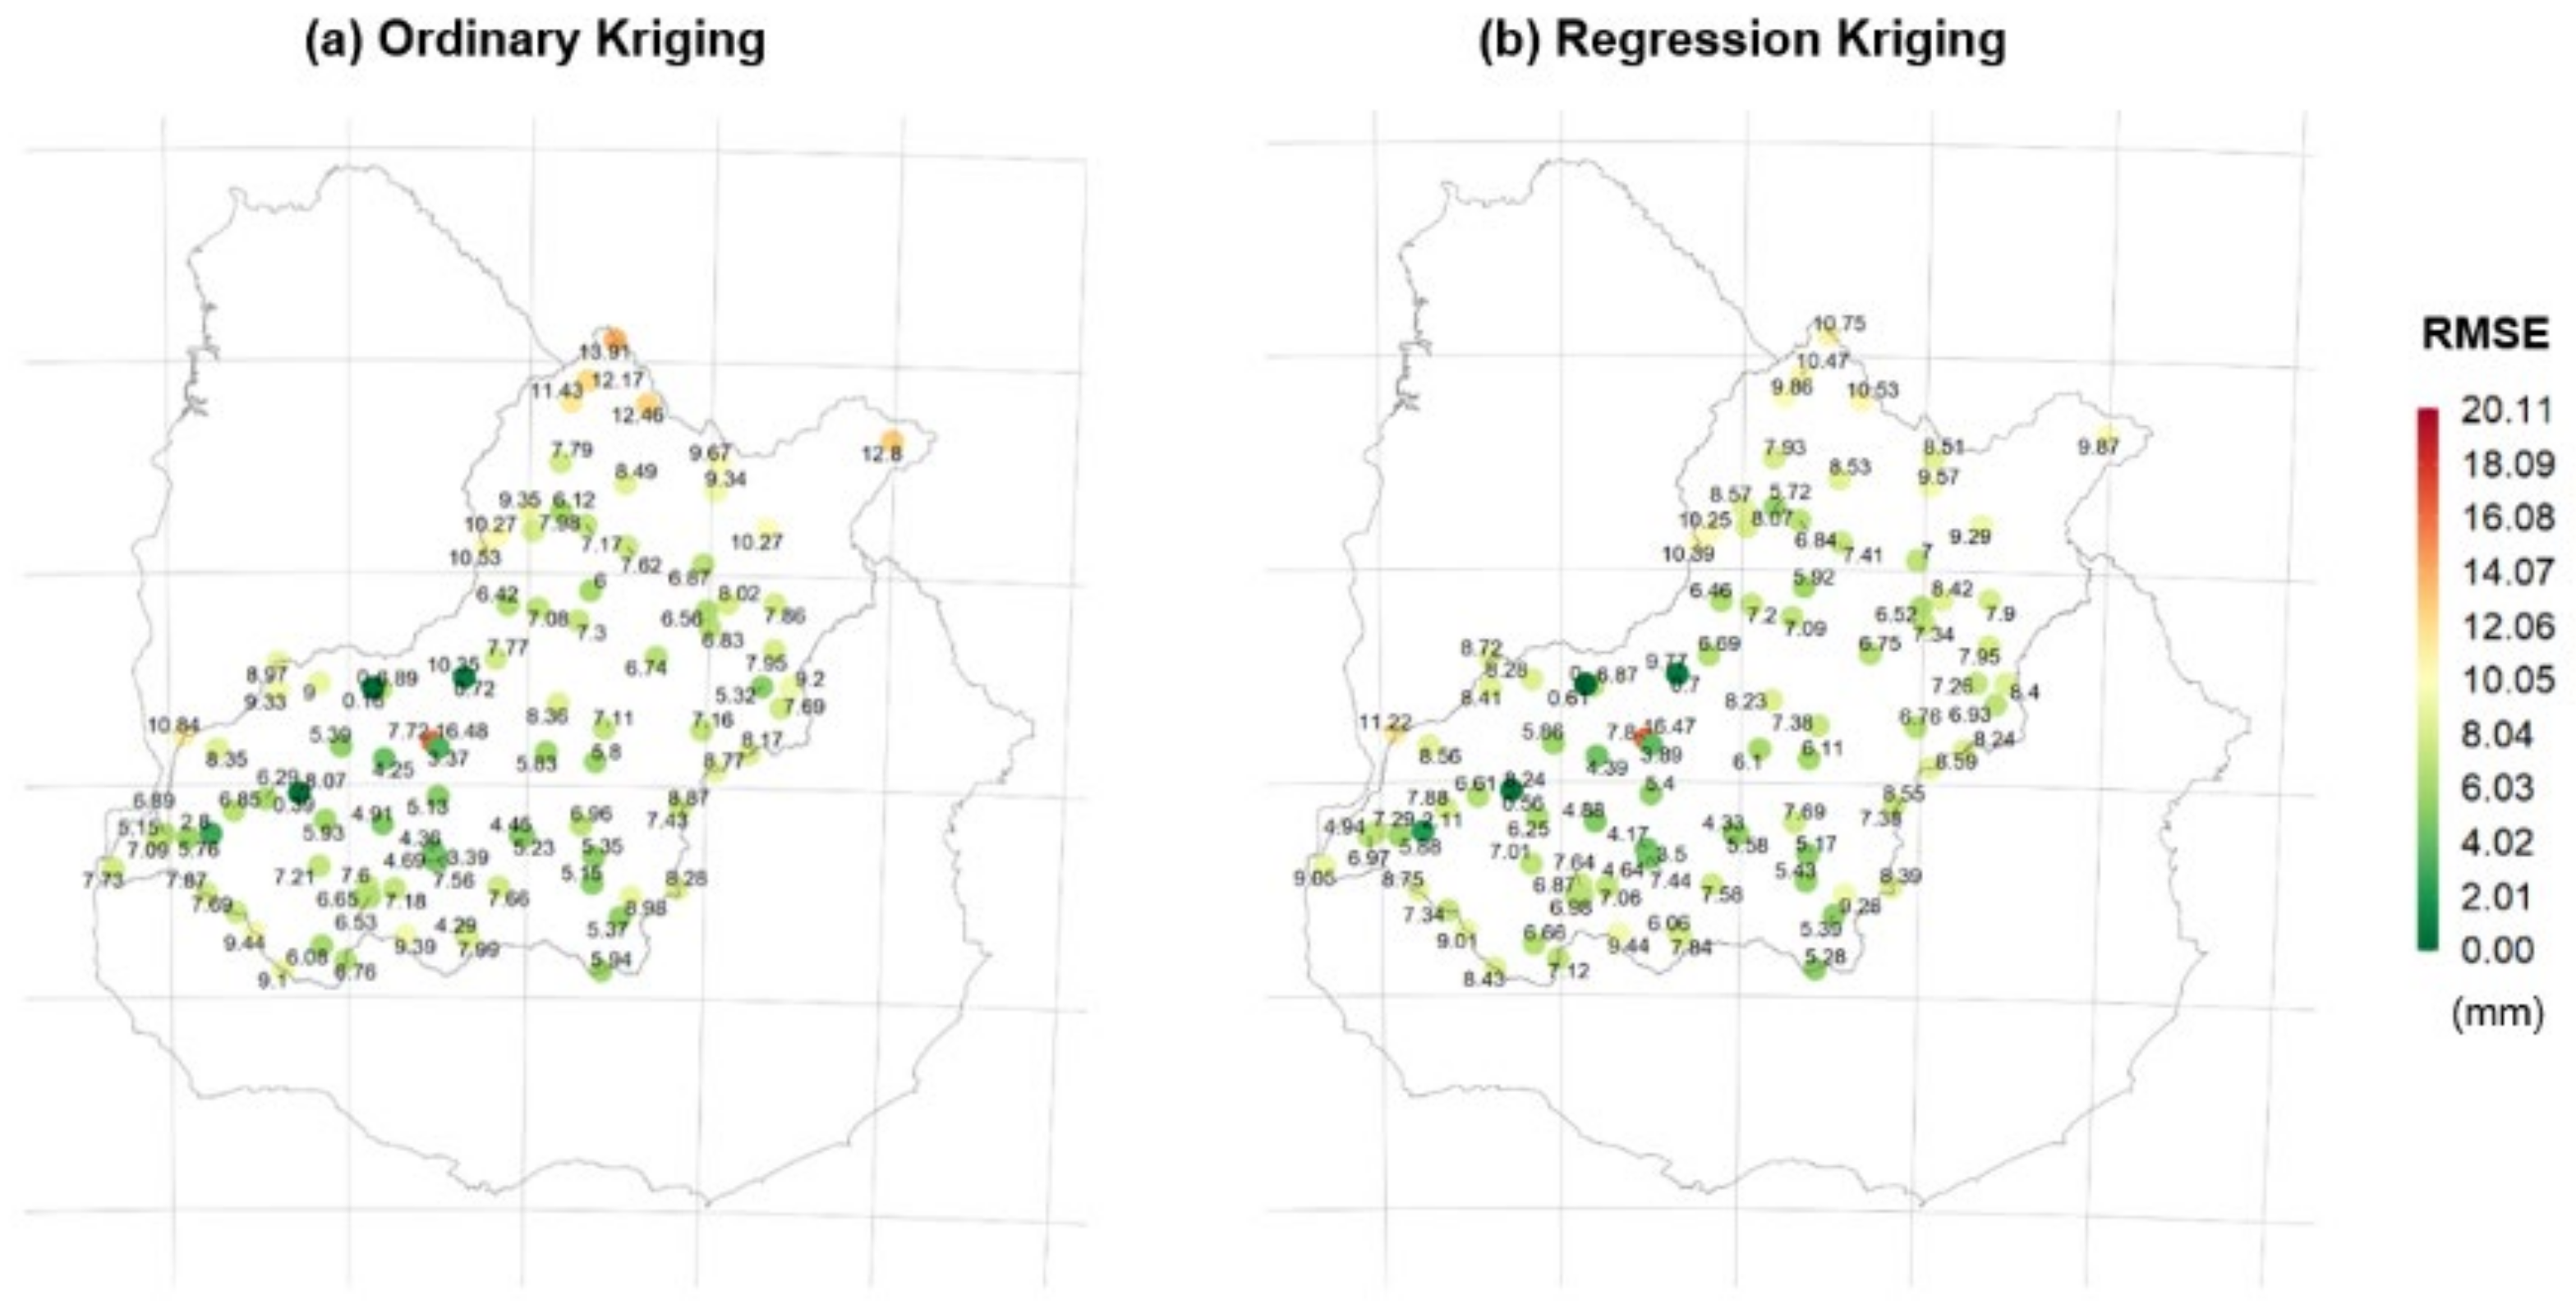
Figure 8 shows the spatial distribution of RMSE at the reference data locations obtained with both estimates, OK and RK, averaged over the analyzed period. As can be seen, both maps exhibit similar distribution patterns but there are some differences on the border with Brazil, where there are practically no NRT stations (see Figure 1). The RK estimate in that region has a better performance than OK with differences in RMSE between 10% and 20%.
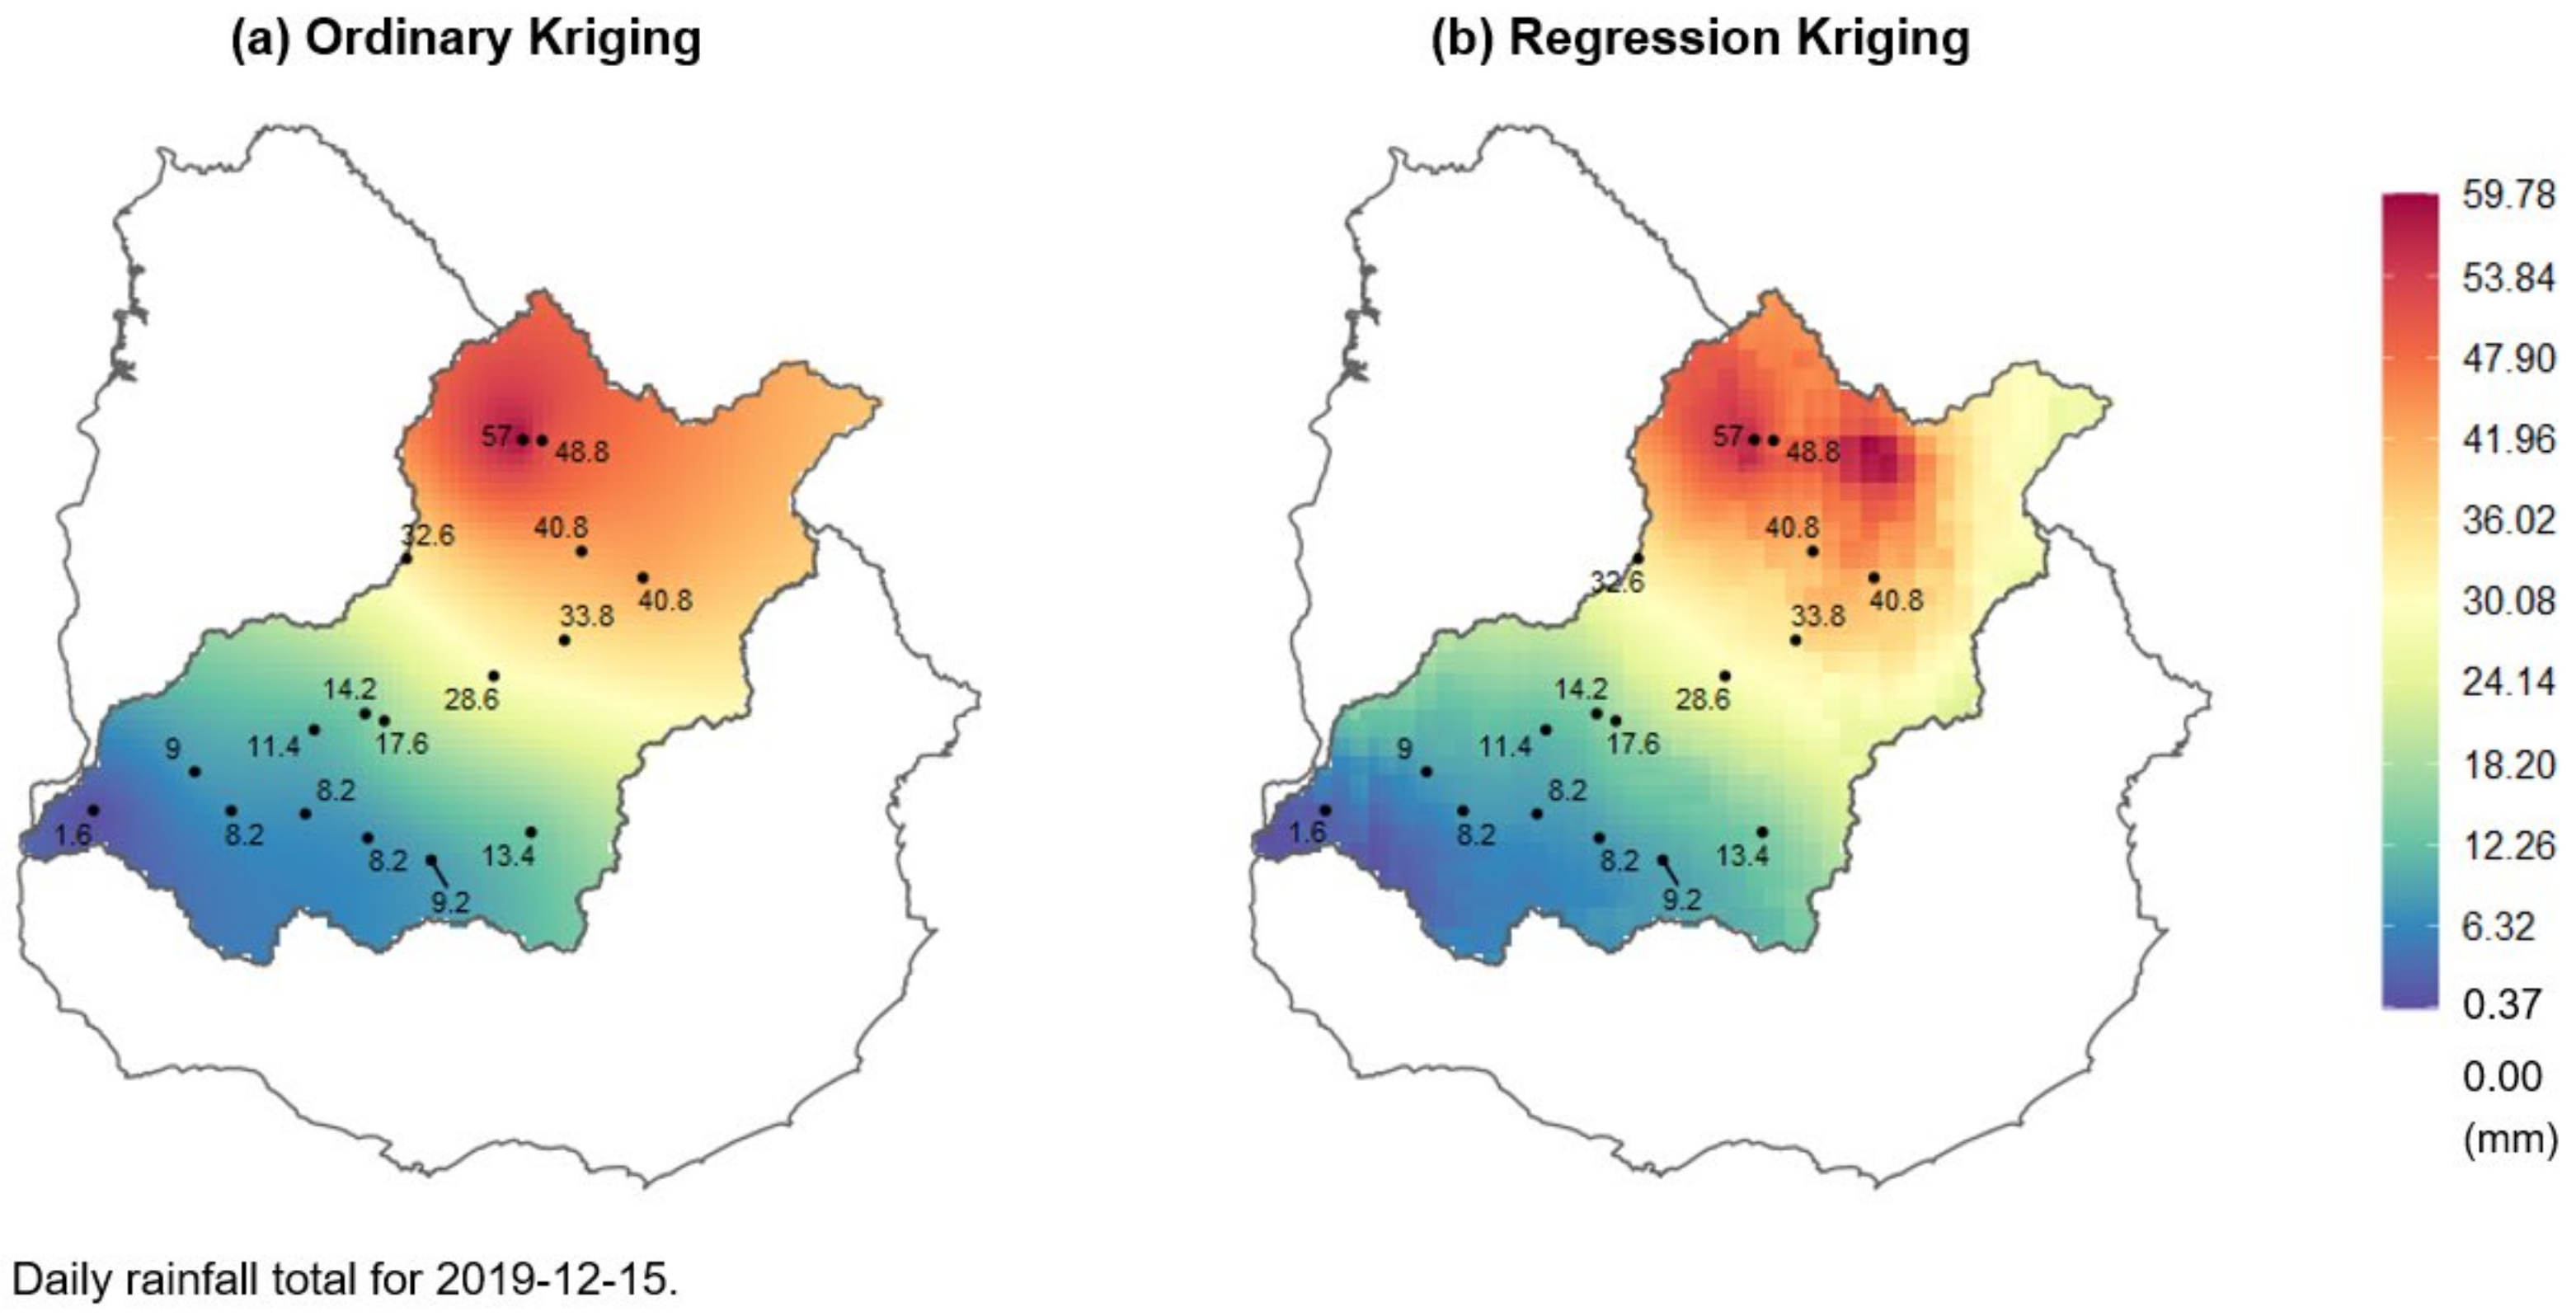
As an example, Figure 9 compares the interpolated precipitation fields obtained with OK (stations only) and RK (stations and satellite) for a given day (15 December 2019). Black dots represent the NRT rainfall observations used for the interpolation. As expected, both maps present a similar spatial distribution of daily precipitation but, particularly in the region towards Rio Grande Do Sul (Brazil), the two estimates show significantly different values, with OK showing amounts of the order of 40 mm and RK of 25–30 mm. In this region, the OK estimate does not appear to be natural, with uniform high values in a smooth zone that gradually fades, as a result of the weighted sum estimation, rather than irregular zones with intensely high peaks as observed in the RK estimate. This highlights the advantage of satellite data in the representation of spatial rainfall variability, particularly in data-sparse regions, as is the case here.
5.2. Rainfall-Runoff Model Performance
In this section, the precipitation estimates are incorporated into the hydrological model that runs operationally in ADME (see Section 4.2) and the performance is assessed as compared to the estimated “theoretical” inflow to the hydroelectric reservoir (Figure 3). The “GR4J-Muskingum” model was forced by the two precipitation estimates (OK and RK) using the model parameters presented in Table 5 to simulate the daily inflows to G. Terra reservoir for the period 1 February 2017 to 31 May 2020.
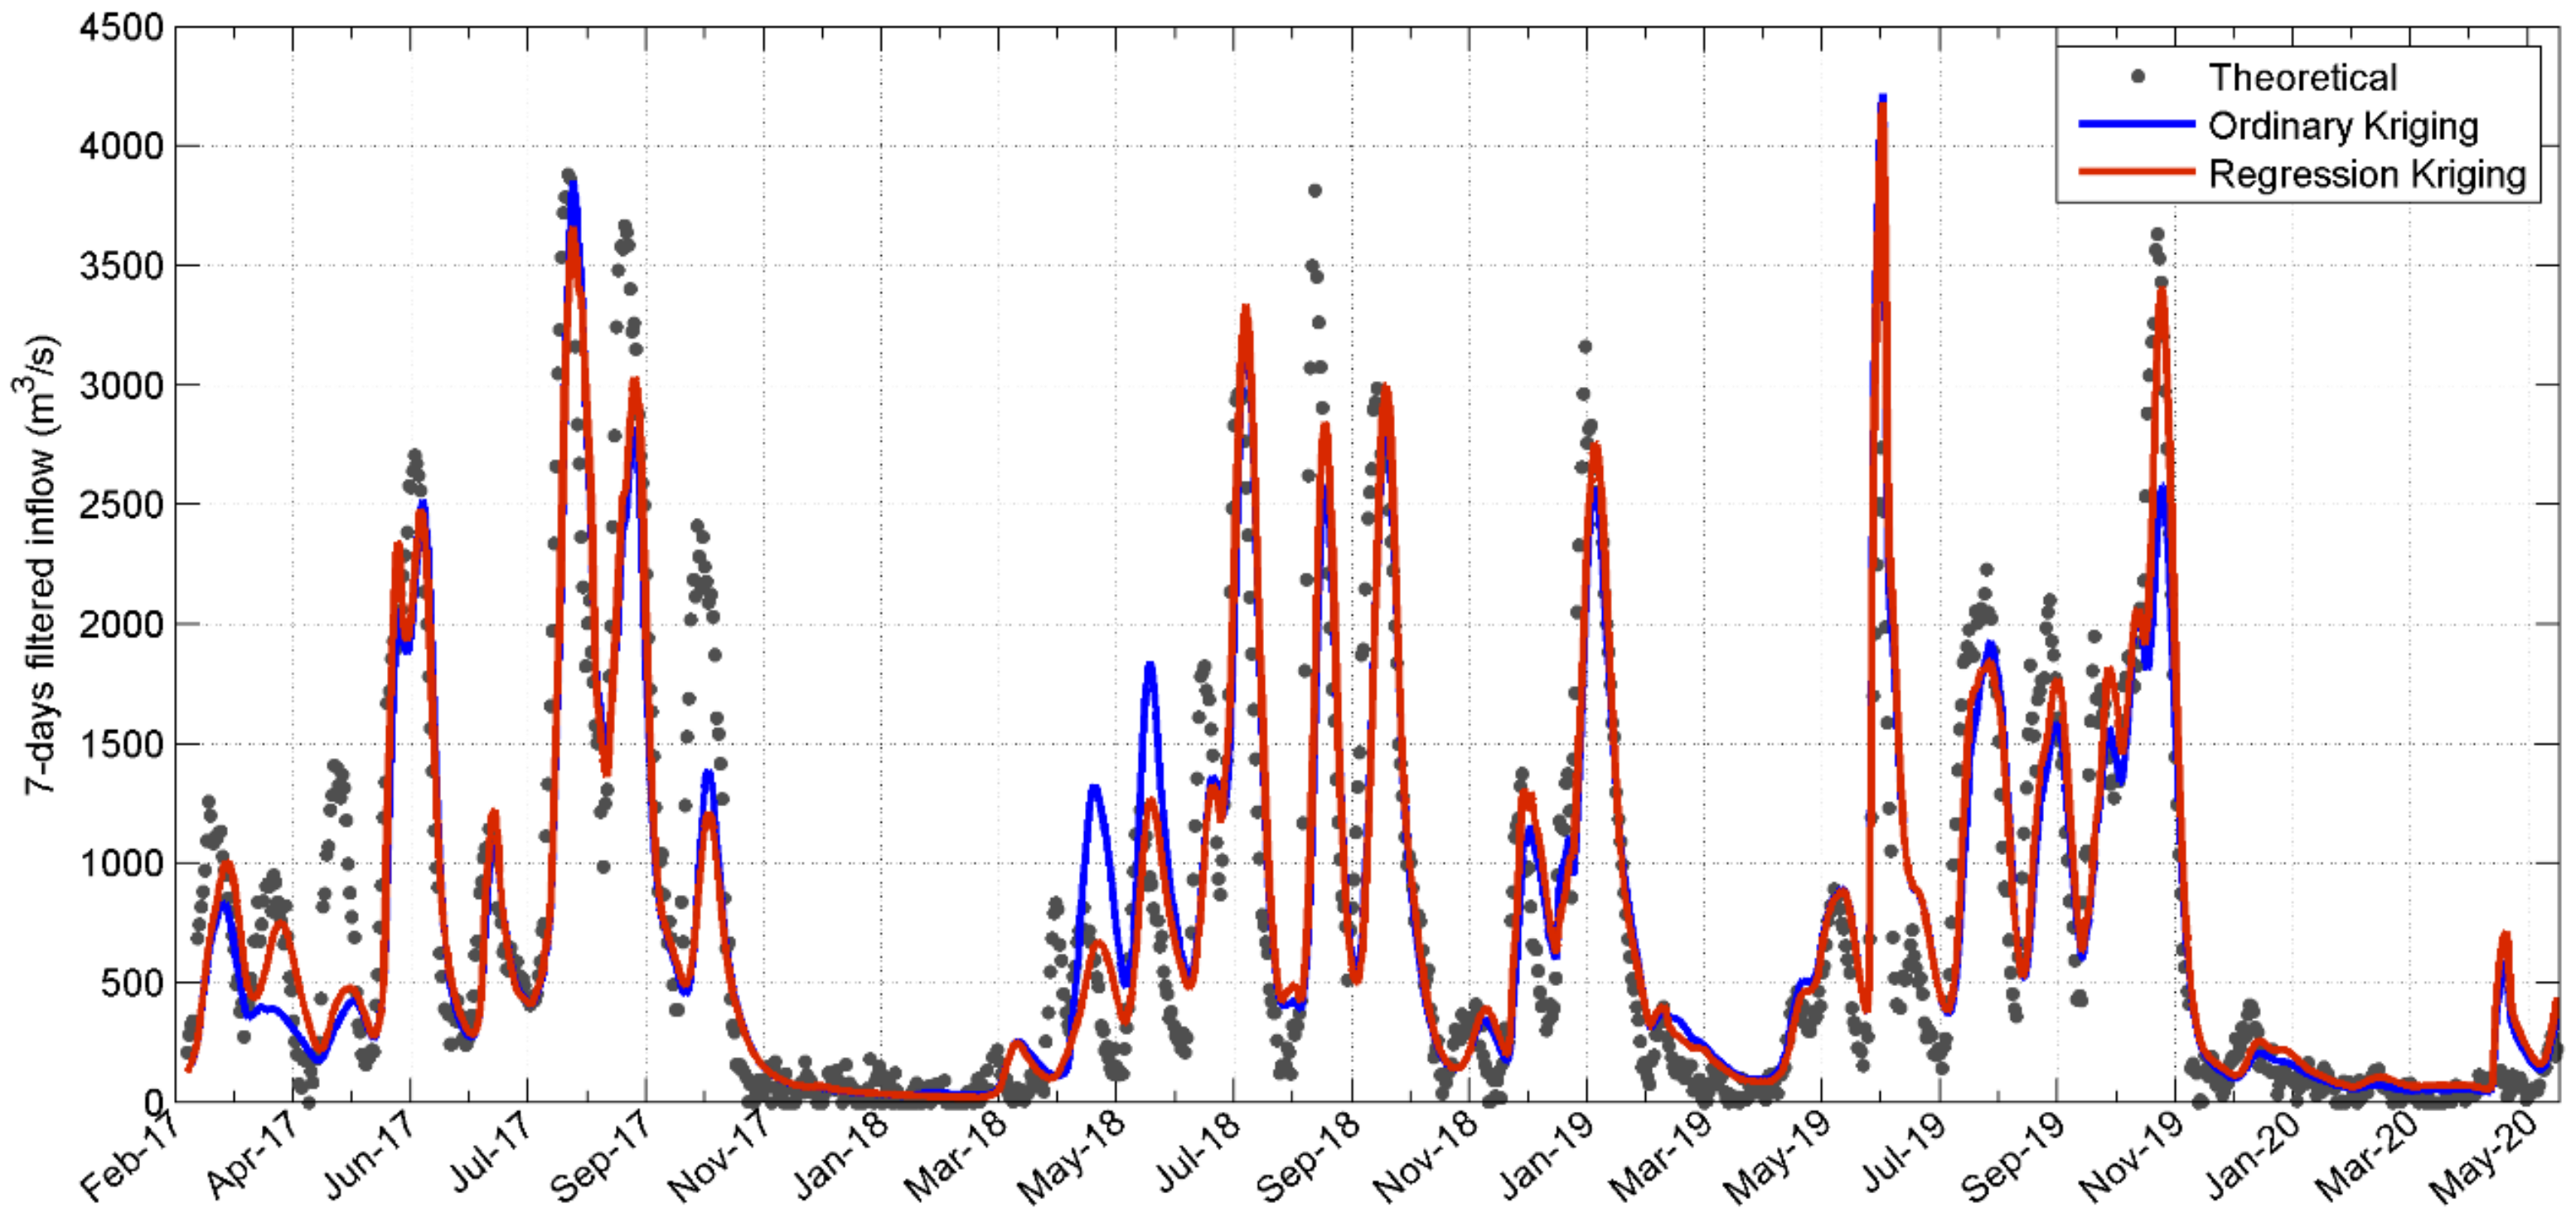
The simulated and “theoretical” hydrographs are shown in Figure 10 and the statistical comparisons are summarized in Table 7 and Table 8. Considering that the model is used as a tool to support the decision-making of the weekly dispatch, we also included the comparison of the 7-days moving average inflows (Figure 11).
As shown in Figure 10 and Figure 11, both simulations have generally good agreement with the “theoretical” streamflow both at daily and weekly time step, although overestimation and underestimation of the peaks are evident in some cases.
Both estimates present a slight underestimation of total accumulated inflow, with a difference of −5.3% and −2.5% for OK (station only) and RK (merged product) output respectively (Table 7); which correspond to a very good performance according to Moriasi et al. (2015) [41].
DINAGUA [42] reports an annual runoff ratio (RR) between 0.37 and 0.43. This reference value is very close to those obtained with the OK and RK estimates from both the estimated “theoretical” inflow (RR Est) and the simulated inflow (RR Sim) (Table 7). On the one hand, when using the “theoretical” inflows to calculate the RR, we verified that the performance of the precipitation estimates is satisfactory. On the other hand, when considering the simulated inflows series, we confirmed that the hydrological model achieves a good representation of the rainfall-runoff transformation process, regardless of the precipitation estimate considered.
As context, we present the general performance ratings for the adopted statistics recommended by Moriasi et al. (2015) [41], simulated inflow using both estimates (RK and OK) have a satisfactory performance at daily time step (0.60 < R2 ≤ 0.75 and 0.50 < NSE ≤ 0.70) and a good performance at weekly time step (0.75 < R2 ≤ 0.85 and 0.70 < NSE ≤ 0.80). Furthermore, for all statistics considered, the RK simulated inflow has a better performance than the OK, for both daily and weekly time step.
5.3. Discussion
These results confirm that, as expected, the estimation that incorporates the satellite information in addition to the surface observations (RK) has a higher performance than the one that only incorporates the rain gauge data (OK), both in the rainfall statistical evaluation and hydrological simulation of the basin.
However, the magnitude of the improvement in the rainfall estimation is relatively small as expressed by the global indicators shown in Table 6, averaged both in time and space. Figure 8 and Figure 9 already suggest that the magnitude of the original error with OK and improvement with RK, might be larger in the upper part of the basin, where the density of rain gauges is notably lower and, given the lack of stations on the other side of the water part, extrapolations are required to cover the basin. This is verified in Table 9 where we limit the RMSE indicator to the higher sub-basins (see Figure 6). We limited the analysis to RMSE because it is the most robust statistic, as well as the most relevant for the application and does not require the definition of a precipitation threshold like FBS, POD and FAR. Table 9 also includes the percentage of improvement achieved with RK, which increases from 3% for the global indicator to approximately 20% in the more poorly monitored border sub-basins.
While synoptic frontal systems are prevalent through the year in the region and are responsible for most of the rainfall, convective scale storms become a relevant contributor to precipitation totals during the warm season. Of course, many times the latter are embedded in the former generating the multiscale structure of precipitations fields. However, it is well known that precipitation daily totals decorrelate with distance faster in the warm season as compared to the cold one [22]. This motivated an analysis of the seasonality of the improvement in skill when the satellite estimates are incorporated (RK). Table 9 shows the basin averaged RMSE limited to the warmest semester (October through March) and the peak of the warm season: December-January-February (DJF). Even with relatively high density of surface observations, as is the case on average in the region of study, the impact of incorporating satellite information increases as the precipitation field acquires larger amplitude in smaller scales during the warm season, from 3% up to 11%.
These analyses give an insight of the potential for improvement in skill that can be obtained with the merging methodology proposed as a function of rain gauge density and characteristic of the precipitation systems.
6. Summary and Conclusions
In this study, we developed and implemented a methodology that combines rain gauge observations and satellite-rainfall estimates at daily time step to improve the rainfall monitoring in NRT. The proposed methodology involves 3 steps: (1) regression of station data on the satellite estimate using a Generalized Linear Model, (2) interpolation of the regression residuals at station locations to the entire grid using Ordinary Kriging and (3) an application of a rain/no rain mask. The merged precipitation field thus obtained is then used in a hydrological modeling of the Rio Negro basin whose output is, in turn, coupled with an electric system modeling that guides planning and dispatch decisions for the following seven days.
The performance of the proposed merged precipitation estimate was statistically evaluated through comparison with an independent historic rain gauge dataset. The incorporation of satellite information enhances the representation of spatial variability, particularly in data-sparse regions with reductions in RMSE of up to 20%, although the overall improvement is statistically marginal.
As far as the operation of the energy system is concerned, it is the input to the reservoirs that most directly affect the electric system simulations and, in turn, management optimization. The GR4J hydrological model, with a daily time step, was implemented at 17 sub-catchments of the G. Terra basin with routing up to the reservoir. Model performance was assessed comparing model output to the estimated “theoretical” inflow to G. Terra computed from a mass budget to the reservoir and rendered satisfactory statistics: 0.60 < R2 ≤ 0.75 and 0.50 < NSE ≤ 0.70. The estimation that incorporates the satellite information in addition to the surface observations has a higher performance, for all statistics considered, compared to the one that only incorporates the rain gauge data.
In an operational setting, simplicity and robustness of the implementation are as important as accuracy. All steps are currently implemented and run on a daily basis at the Electricity Market Administration (ADME): data download and quality control, merging algorithm, hydrological modeling and electric system simulation. The presented implementation improves the estimation of the precipitation field and carries that information all the way to the decision-making stage, with its corresponding socio-economic and environmental benefits.
Author Contributions
Conceptualization and methodology, A.D.V. and P.A.; data collection and processing, P.A.; software, P.A.; validation, A.D.V. and P.A.; writing—original draft preparation, A.D.V.; writing—review and editing, A.D.V., P.A. and R.T.; supervision, R.T.; project administration, R.T.; funding acquisition, R.T. All authors have read and agreed to the published version of the manuscript.
Funding
This article results from the accumulation of work conducted in the framework of the “PRONOS Project,” funded by the Development Bank of Latin America (CAF), the ”DACC Project” with the Ministry of Livestock, Agriculture and Fisheries (MGAP), funded by the World Bank and a technical collaboration funded by the Electricity Market Administration (ADME, Uruguay).
Institutional Review Board Statement
Not applicable.
Informed Consent Statement
Not applicable.
Data Availability Statement
Most of the data used in this study are publicly available: ANA (http://www.snirh.gov.br/hidroweb/serieshistoricas, accessed on 7 January 2021), INIA (http://www.inia.uy/gras/Clima/Banco-datos-agroclimatico, accessed on 7 January 2021), UTE (https://portal.ute.com.uy/precipitaciones-ocurridas-y-prevision-de-niveles, accessed on 7 January 2021), GSMaP (https://sharaku.eorc.jaxa.jp/GSMaP/, accessed on 7 January 2021) and IMERG (https://pmm.nasa.gov/data-access/downloads/gpm, accessed on 7 January 2021). INUMET data are available upon request.
Acknowledgments
The authors would like to thank Tufa Dinku and Walter Baethgen (IRI, Earth Institute, Columbia University) for their thoughtful insight and guidance in the context of the ”DACC Project.” Also, Marco Scavino and Leonardo Moreno for their advice and support throughout the master’s thesis work that led to the initial implementation of the spatial interpolation library. Additionally, we thank Ruben Chaer (ADME) for his perpetual enthusiasm to promote new developments.
Conflicts of Interest
The authors declare no conflict of interest.
References
- Chaer, R. Simulación de Sistemas de Energía Eléctrica. Master’s Thesis, Universidad de la República, Montevideo, Uruguay, 2008. Available online: http://iie.fing.edu.uy/publicaciones/2008/Cha08/Cha08.pdf (accessed on 23 October 2020).
- Terra, R.; Baethgen, W.E. Lessons Learned in 25 Years of Informing Sectoral Decisions with Probabilistic Climate Forecasts. In Sub-Seasonal to Seasonal Prediction: The Gap Between Weather and Climate Forecasting; Robertson, A.W., Vitart, F., Eds.; Elsevier: Amsterdam, The Netherlands, 2019; pp. 439–453. [Google Scholar] [CrossRef]
- De Vera, A.; Flieller, G.; Crisci, M.; Chaer, R.; Terra, R. Integración de Ensambles de Pronósticos Hidrológicos a las Herramientas de Operación del Sistema Eléctrico en Uruguay. ENERLAC 2020, IV, 96–117, digital: 2631-2522. Available online: http://enerlac.olade.org/index.php/ENERLAC/article/view/122/147 (accessed on 25 October 2020).
- Su, F.; Hong, Y.; Lettenmaier, D. Evaluation of TRMM Multisatellite Precipitation Analysis (TMPA) and its utility in hydrologic prediction in the La Plata Basin. J. Hydrometeor. 2008, 9, 622–640. [Google Scholar] [CrossRef] [Green Version]
- Jiang, D.; Wang, K. The Role of Satellite-Based Remote Sensing in Improving Simulated Streamflow: A Review. Water 2019, 11, 1615. [Google Scholar] [CrossRef] [Green Version]
- Joyce, R.J.; Janowiak, J.E.; Arkin, P.A.; Xie, P. CMORPH: A Method That Produces Global Precipitation Estimates from Passive Microwave and Infrared Data at High Spatial and Temporal Resolution. J. Hydrometeorol. 2004, 5, 487–503. [Google Scholar] [CrossRef]
- QMORPH Information. Available online: https://www.ssd.noaa.gov/PS/PCPN/qmorph.html (accessed on 12 November 2020).
- Huffman, G.J.; Adler, R.F.; Bolvin, D.T.; Gu, G.; Nelkin, E.J.; Bowman, K.P.; Hong, Y.; Stocker, E.F.; Wolff, D.B. The TRMM multisatellite precipitation analysis (TMPA): Quasi-global, multiyear, combined-sensor precipitation estimates at fine scales. J. Hydrometeorol. 2007, 8, 38–55. [Google Scholar] [CrossRef]
- Hsu, K.L.; Gao, X.; Sorooshian, S.; Gupta, H.V. Precipitation estimation from remotely sensed information using artificial neural networks. J. Appl. Meteorol. Climatol. 1997, 36, 1176–1190. [Google Scholar] [CrossRef]
- Okamoto, K.; Iguchi, T.; Takahashi, N.; Iwanami, K.; Ushio, T. The Global Satellite Mapping of Precipitation (GSMaP) Project. In Proceedings of the 25th IGARSS, Seoul, Korea, 25–29 July 2005; pp. 3414–3416. [Google Scholar] [CrossRef]
- Kubota, T.; Aonashi, K.; Ushio, T.; Shige, S.; Takayabu, Y.N.; Kachi, M.; Arai, Y.; Tashima, T.; Masaki, T.; Kawamoto, N.; et al. Global Satellite Mapping of Precipitation (GSMaP) Products in the GPM Era. In Satellite Precipitation Measurement. Advances in Global Change Research; Levizzani, V., Kidd, C., Kirschbaum, D., Kummerow, C., Nakamura, K., Turk, F., Eds.; Springer: Berlin, Germany, 2020; Volume 67, pp. 355–373. [Google Scholar] [CrossRef]
- Huffman, G.J.; Bolvin, D.T.; Nelkin, E.J. Integrated Multi-satellitE Retrievals for GPM (IMERG) Technical Documentation (2015). NASA/GSFC Code. Available online: https://pmm.nasa.gov/sites/default/files/document_files/IMERG_doc_180207.pdf (accessed on 14 October 2020).
- Liu, Z. Comparison of precipitation estimates between Version 7 3-hourly TRMM Multi-Satellite Precipitation Analysis (TMPA) near-real-time and research products. Atmosp. Res. 2015, 153, 119–133. [Google Scholar] [CrossRef] [Green Version]
- Maggioni, V.; Meyers, P.C.; Robinson, M.D. A Review of Merged High-Resolution Satellite Precipitation Product Accuracy during the Tropical Rainfall Measuring Mission (TRMM) Era. J. Hydrometeorol. 2016, 17, 1101–1117. [Google Scholar] [CrossRef]
- Zubieta, R.; Getirana, A.; Espinoza, J.C.; Lavado-Casimiro, W.; Aragon, L. Hydrological modeling of the Peruvian–Ecuadorian Amazon Basin using GPM-IMERG satellite-based precipitation dataset. Hydrol. Earth Syst. Sci. 2017, 21, 3543–3555. [Google Scholar] [CrossRef] [Green Version]
- Beck, H.E.; Vergopolan, N.; Pan, M.; Levizzani, V.; van Dijk, A.I.J.M.; Weedon, G.P.; Wood, E.F. Global-scale evaluation of 22 precipitation datasets using gauge observations and hydrological modeling. Hydrol. Earth Syst. Sci. 2017, 21, 6201–6217. [Google Scholar] [CrossRef] [Green Version]
- Lu, D.; Yong, B. Evaluation and Hydrological Utility of the Latest GPM IMERG V5 and GSMaP V7 Precipitation Products over the Tibetan Plateau. Remote Sens. 2018, 10, 2022. [Google Scholar] [CrossRef] [Green Version]
- Zhang, Y.; Li, Y.; Ji, X.; Luo, X.; Li, X. Evaluation and Hydrologic Validation of Three Satellite-Based Precipitation Products in the Upper Catchment of the Red River Basin, China. Remote Sens. 2018, 10, 1881. [Google Scholar] [CrossRef] [Green Version]
- Amorim, J.S.; Viola, M.R.; Junqueira, R.; Oliveira, V.A.; Mello, C.R. Evaluation of Satellite Precipitation Products for Hydrological Modeling in the Brazilian Cerrado Biome. Water 2020, 12, 2571. [Google Scholar] [CrossRef]
- Nerini, D.; Zulkafli, Z.; Wang, L.; Onof, C.; Buytaert, W.; Lavado-Casimiro, W.; Guyot, J. A Comparative Analysis of TRMM–Rain Gauge Data Merging Techniques at the Daily Time Scale for Distributed Rainfall–Runoff Modeling Applications. J. Hydrometeor. 2015, 16, 2153–2168. [Google Scholar] [CrossRef] [Green Version]
- Qiu, Q.; Liu, J.; Tian, J.; Jiao, Y.; Li, C.; Wang, W.; Yu, F. Evaluation of the Radar QPE and Rain Gauge Data Merging Methods in Northern China. Remote Sens. 2020, 12, 363. [Google Scholar] [CrossRef] [Green Version]
- De Vera, A.; Terra, R. Combining CMORPH and Rain Gauges Observations over the Rio Negro Basin. J. Hydrometeor. 2012, 13, 1799–1809. [Google Scholar] [CrossRef]
- Terra, R.; De Vera, A.; Alfaro, P. Mejora del Monitoreo de la Precipitación en Uruguay Mediante la Combinación de Observaciones Pluviométricas y Estimaciones Satelitales de Precipitación; Technical Report; Proyecto DACC-SNIA, Convenio FJR FING UDELAR-MGAP: Montevideo, Uruguay, 2015. [Google Scholar]
- Perrin, C.; Michel, C.; Andréassian, V. Improvement of a parsimonious model for streamflow simulation. J. Hydrol. 2003, 279, 275–289. [Google Scholar] [CrossRef]
- ADME. Informe Anual 2019. Administración del Mercado Eléctrico, Uruguay. 2020. Available online: https://www.adme.com.uy/db-docs/Docs_secciones/nid_526/Informe_Anual_2019.pdf (accessed on 17 November 2020).
- Crisci, M.; Terra, R. Valorization of Irrigation Water in A Basin with Large Hydropower Production through Coupled Hydrological and Electric System Modelling. Water Resour. Manag. 2014, 28, 605–623. [Google Scholar] [CrossRef]
- Scherrer, S.C.; Frei, C.; Croci-Maspoli, M.; Van Geijtenbeek, D.; Hotz, C.; Appenzeller, C. Operational quality control of daily precipitation using spatio-climatological plausibility testing. Meteorologische Z. 2011, 20, 397–407. [Google Scholar] [CrossRef]
- Gebregiorgis, A.S.; Kirstetter, P.E.; Hong, Y.E.; Gourley, J.J.; Huffman, G.J.; Petersen, W.A.; Xue, X.; Schwaller, M.R. To What Extent is the Day 1 GPM IMERG Satellite Precipitation Estimate Improved as compared to TRMM TMPA-RT? J. Geophys. Res. Atmosp. 2018, 123, 1694–1707. [Google Scholar] [CrossRef]
- Global Ensemble Forecast System (GEFS). Available online: https://www.ncdc.noaa.gov/data-access/model-data/model-datasets/global-ensemble-forecast-system-gefs (accessed on 18 November 2020).
- Molfino, J. Estimación del Agua Potencialmente Disponible en los Grupos CONEAT. 2009. Available online: http://www.ainfo.inia.uy/digital/bitstream/item/4925/1/Molfino-J.H.-2009.-Estimacion-del-agua....pdf (accessed on 14 October 2020).
- Hengl, T. A Practical Guide to Geostatistical Mapping, 2nd ed.; University of Amsterdam: Amsterdam, The Netherlands, 2009; ISBN 978-90-9024981-0. [Google Scholar]
- Chilès, J.P.; Delfiner, P. Geostatistics: Modeling Spatial Uncertainty, 2nd ed.; John Wiley & Sons: Hoboken, NJ, USA, 2012; ISBN 978-0-470-18315-1. [Google Scholar]
- Hengl, T.; Heuvelink, G.B.M.; Rossiter, D.G. About regression-kriging: From equations to case studies. Comput. Geosci. 2007, 33, 1301–1315. [Google Scholar] [CrossRef]
- Müller, H. Bayesian transgaussian kriging. In Proceedings of the 15th European Young Statisticians Meeting, Castro Urdiales, Spain, 10–14 September 2007. [Google Scholar]
- Core Spatial Library. Available online: https://github.com/Ludecan/st_interp (accessed on 7 January 2021).
- Applied Project (Using the Core Library). Available online: https://github.com/Ludecan/precip_rionegro (accessed on 7 January 2021).
- McCarthy, G.T. The Unit Hydrograph and Flood Routing; U.S. Army Corps of Engineers: Washington, DC, USA, 1938.
- Narbondo, S.; Gorgoglione, A.; Crisci, M.; Chreties, C. Enhancing physical similarity approach to predict runoff in ungauged watersheds in sub-tropical regions. Water 2020, 12, 528. [Google Scholar] [CrossRef] [Green Version]
- Wilks, D.S. Statistical Methods in the Atmospheric Sciences, 2nd ed.; Academic Press: Cambridge, MA, USA; Elsevier: Amsterdam, The Netherlands, 2006. [Google Scholar]
- Dinku, T.; Ruiz, F.; Connor, S.J.; Ceccato, P. Validation and intercomparison of satellite rainfall estimates over Colombia. J. Appl. Meteor. Climatol. 2010, 49, 1004–1014. [Google Scholar] [CrossRef]
- Moriasi, D.N.; Gitau, M.W.; Pai, N.; Daggupati, P. Hydrologic and water quality models: Performance measures and evaluation criteria. Trans. ASABE 2015, 58, 1763–1785. [Google Scholar] [CrossRef] [Green Version]
- DINAGUA. Ciclos Anuales y Estacionales de Parámetros Hidrológicos (1980–2004). Informe Temático 2012, División Recursos Hídricos, Departamento de Hidrología, Dirección Nacional de Aguas, MVOTMA, Uruguay. Available online: https://www.gub.uy/ministerio-ambiente/comunicacion/publicaciones/ciclos-anuales-estacionales-parametros-hidrologicos (accessed on 22 November 2020).
- Climate Data Tools (CDT). Available online: https://iri.columbia.edu/our-expertise/climate/tools/cdt/ (accessed on 22 November 2020).
- Flieller, G.; Chaer, R. Introduction of ensemble based forecasts to the electricity dispatch simulator SimSEE. In Proceedings of the IEEE Power & Energy Society T&D–Latin America, Montevideo, Uruguay, 29 September–1 October 2020. [Google Scholar]
- Electricity Market Administration (ADME) of Uruguay. Available online: https://www.adme.com.uy/ (accessed on 7 January 2021).
Figure 1.
Delimitation of G. Terra basin and location of existing hydroelectric plants (black triangle) and pluviometric stations: near-real-time data (red square) and historic data (blue dot).
Figure 1.
Delimitation of G. Terra basin and location of existing hydroelectric plants (black triangle) and pluviometric stations: near-real-time data (red square) and historic data (blue dot).

Figure 2.
Comparison of rain gauge observations and satellite-rainfall estimates at daily time step (15 December 2019).
Figure 2.
Comparison of rain gauge observations and satellite-rainfall estimates at daily time step (15 December 2019).

Figure 3.
Estimated “theoretical” inflow to G. Terra reservoir: daily (grey dot) and 7-days filtered (blue line).
Figure 3.
Estimated “theoretical” inflow to G. Terra reservoir: daily (grey dot) and 7-days filtered (blue line).

Figure 4.
Flow chart describing the steps of the satellite-rain gauge data merging technique proposed.
Figure 4.
Flow chart describing the steps of the satellite-rain gauge data merging technique proposed.

Figure 5.
Example of application of the rain/no rain mask for the day 6 July 2017.

Figure 6.
Delimited sub-basins for hydrological modeling in G. Terra basin.

Figure 7.
Flow chart describing the steps of the operational implementation of the coupled hydrological and electric system modeling approach.
Figure 7.
Flow chart describing the steps of the operational implementation of the coupled hydrological and electric system modeling approach.

Figure 8.
Spatial distribution of RMSE at the reference data locations obtained with (a) Ordinary Kriging (stations only) and (b) Regression Kriging (stations and satellite).
Figure 8.
Spatial distribution of RMSE at the reference data locations obtained with (a) Ordinary Kriging (stations only) and (b) Regression Kriging (stations and satellite).

Figure 9.
Comparison of the interpolated precipitation fields obtained with (a) Ordinary Kriging (OK) (stations only) and (b) Regression Kriging (RK) (stations and satellite) for the day 15 December 2019.
Figure 9.
Comparison of the interpolated precipitation fields obtained with (a) Ordinary Kriging (OK) (stations only) and (b) Regression Kriging (RK) (stations and satellite) for the day 15 December 2019.

Figure 10.
Comparison between theoretical and simulated (Ordinary Kriging and Regression Kriging) daily inflows to G. Terra reservoir.
Figure 10.
Comparison between theoretical and simulated (Ordinary Kriging and Regression Kriging) daily inflows to G. Terra reservoir.

Figure 11.
Comparison between theoretical and simulated (Ordinary Kriging and Regression Kriging) 7-days filtered inflows to G. Terra reservoir.
Figure 11.
Comparison between theoretical and simulated (Ordinary Kriging and Regression Kriging) 7-days filtered inflows to G. Terra reservoir.


Table 1.
Main catchment characteristics of G. Terra basin.
| Parameter | Value |
|---|---|
| Basin area (km2) | 39,500 |
| River length (km) | 400 |
| Elevation drop in main river (m) | 320 |
| Mean slope (m/km) | 0.8 |
| Soil water storage capacity (mm) | 108 |
Table 2.
Characteristics of existing hydroelectric plants in Uruguay.
| Plant | Installed Power (MW) | Maximum Volume (Hm3) | Basin Area (km2) |
|---|---|---|---|
| G. Terra | 152 | 8800 | 39,500 |
| Baygorria | 108 | 570 | 4100 (incremental) |
| Constitución | 333 | 2854 | 18,900 (incremental) |
| Salto Grande | 945 * | 3058 * | 244,000 |
* Values corresponding to the Uruguayan 50% part of the plant.
Table 3.
Main characteristics of the satellite rainfall estimates datasets selected.
| GSMaP | IMERG | |
|---|---|---|
| Spatial resolution | 0.1° | 0.1° |
| Temporal resolution | Hourly | Half-hourly |
| Data latency (h) | 4 | 12 |
| Period of availability | 2017–Present | 2000–Present |
Table 4.
Exploratory analysis of satellite estimates for the period 1 February 2017 to 31 May 2020.
| Product | RMSE (mm) | POD (P ≥ 5 mm) | Medium Coverage (%) |
|---|---|---|---|
| IMERG | 9.59 | 0.69 | 99.3 |
| GSMaP | 12.86 | 0.71 | 99.9 |
Table 5.
Description of the GR4J-Muskingum model parameters and adopted values (SC: storage capacity; Tc: concentration-time; L: length of each stretch of the main river; Lm: mean length of the stretches of the main river).
Table 5.
Description of the GR4J-Muskingum model parameters and adopted values (SC: storage capacity; Tc: concentration-time; L: length of each stretch of the main river; Lm: mean length of the stretches of the main river).
| Parameter | Model | Description | Value |
|---|---|---|---|
| x1 | GR4J | Maximum capacity of the production store | SC (mm) |
| x2 | GR4J | Groundwater exchange coefficient | 0 mm |
| x3 | GR4J | Capacity of the nonlinear routing store | 59 mm |
| x4 | GR4J | Unit-hydrograph routing store | 1.24 × Tc0.205 (day) |
| X | Muskingum | Weight coefficient of discharge | 0.20 |
| K | Muskingum | Wave travel time | 2 × L/Lm (day) |
Table 6.
Comparison of the averaged performance metrics for the Ordinary Kriging (stations only) and the Regression Kriging (merged product) estimates for the period 1 February 2017 to 31 May 2020.
Table 6.
Comparison of the averaged performance metrics for the Ordinary Kriging (stations only) and the Regression Kriging (merged product) estimates for the period 1 February 2017 to 31 May 2020.
| Estimates | ME (mm) | RMSE (mm) | FBS | POD | FAR |
|---|---|---|---|---|---|
| Ordinary Kriging | −0.59 | 7.92 | 1.05 | 0.85 | 0.19 |
| Regression Kriging | −0.49 | 7.72 | 1.03 | 0.84 | 0.19 |
Table 7.
Comparison of the runoff ratio and total accumulated inflow for the estimated and simulated (OK and RK) series.
Table 7.
Comparison of the runoff ratio and total accumulated inflow for the estimated and simulated (OK and RK) series.
| Model | Accumulated Precipitation (Hm3) | Total Accumulated Inflow (Hm3) | Runoff Ratio | |||
|---|---|---|---|---|---|---|
| Est | Sim | ∆V | Est | Sim | ||
| Ordinary Kriging | 178,020 | 82,802 | 78,385 | −5.3% | 0.47 | 0.44 |
| Regression Kriging | 180,818 | 82,802 | 80,708 | −2.5% | 0.46 | 0.45 |
Table 8.
Comparison of the performance metrics for simulated series (OK and RK) for daily and 7-days filtered inflow.
Table 8.
Comparison of the performance metrics for simulated series (OK and RK) for daily and 7-days filtered inflow.
| Metric | Daily Inflow | 7-Days Filtered Inflow | ||
|---|---|---|---|---|
| Ordinary Kriging | Regression Kriging | Ordinary Kriging | Regression Kriging | |
| RMSE (m3/s) | 650.4 | 628.6 | 442.8 | 411.5 |
| R2 | 0.59 | 0.62 | 0.75 | 0.79 |
| NSE | 0.58 | 0.61 | 0.75 | 0.79 |
| KGE | 0.71 | 0.74 | 0.81 | 0.85 |
Table 9.
Comparison of the RMSE metrics for the Ordinary Kriging (stations only) and the Regression Kriging (merged product) estimates throughout the year and the basin and in selected seasons and sub-basins.
Table 9.
Comparison of the RMSE metrics for the Ordinary Kriging (stations only) and the Regression Kriging (merged product) estimates throughout the year and the basin and in selected seasons and sub-basins.
| Period | Year | Oct–Mar | DFJ | Year | Year |
|---|---|---|---|---|---|
| Sub-Basins | All | All | All | 1, 2, 5, 7 | 5, 7 |
| Ordinary Kriging | 7.92 | 6.91 | 7.82 | 8.85 | 9.36 |
| Regression Kriging | 7.72 | 6.51 | 7.03 | 7.63 | 7.58 |
| Relative difference | 3% | 6% | 11% | 16% | 23% |
Publisher’s Note: MDPI stays neutral with regard to jurisdictional claims in published maps and institutional affiliations. |
© 2021 by the authors. Licensee MDPI, Basel, Switzerland. This article is an open access article distributed under the terms and conditions of the Creative Commons Attribution (CC BY) license (http://creativecommons.org/licenses/by/4.0/).
Share and Cite
MDPI and ACS Style
De Vera, A.; Alfaro, P.; Terra, R. Operational Implementation of Satellite-Rain Gauge Data Merging for Hydrological Modeling. Water 2021, 13, 533. https://doi.org/10.3390/w13040533
AMA Style
De Vera A, Alfaro P, Terra R. Operational Implementation of Satellite-Rain Gauge Data Merging for Hydrological Modeling. Water. 2021; 13(4):533. https://doi.org/10.3390/w13040533
Chicago/Turabian StyleDe Vera, Alejandra, Pablo Alfaro, and Rafael Terra. 2021. "Operational Implementation of Satellite-Rain Gauge Data Merging for Hydrological Modeling" Water 13, no. 4: 533. https://doi.org/10.3390/w13040533
Note that from the first issue of 2016, this journal uses article numbers instead of page numbers. See further details here.