
Bridge Pier Scour under Ice Cover


Department of Civil Engineering, University of Ottawa, 161 Louis Pasteur Drive, Ottawa, ON K1N 6N5, Canada
*
Author to whom correspondence should be addressed.
Water 2021, 13(4), 536; https://doi.org/10.3390/w13040536
Submission received: 29 January 2021
/
Revised: 15 February 2021
/
Accepted: 17 February 2021
/
Published: 19 February 2021
(This article belongs to the Special Issue Fluvial Hydraulics Affected by River Ice and Hydraulic Structures)
Abstract
:Bridge pier scour is a complex process, which is influenced by many parameters, including the presence of ice cover around piers. To better understand the influence of ice on bridge pier scour, an artificial ice cover, equipped with either a smooth or a rough surface, was constructed and tested experimentally. The ice cover was positioned on the surface of the water and submerged to specified depths in order to replicate floating and fixed (pressurized) ice cover conditions, respectively. During each test, a velocity profile was collected beneath the ice cover, and after each test, a three-dimensional scan of the bed was collected to compare the resulting scour. It was discovered that the presence of an ice cover around a bridge pier increased pier scour under all conditions. Furthermore, as the ice cover was submerged deeper into the flow, the flow velocity increased, and greater scour resulted. For each level of submergence, the rough ice cover yielded increased scour depths compared to the smooth ice cover.
1. Introduction
Bridges that are constructed over waterways, with piers located within the flow path, are more vulnerable to failure due to pier scour. Bridge pier scour is the erosion of bed material from the region surrounding the pier’s base [1]. During high-flow events, large quantities of sediment can be removed from around and beneath the foundations of piers jeopardizing the structural integrity of the piers and consequently the bridge [2]. There are approximately 500,000 bridges in the USA National Bridge Inventory (NBI) that are built over waterways, amounting to nearly 83% of all the bridges in the NBI [2,3]. In 2011, 23,034 of such bridges in the NBI were classified as scour-critical, which, according to the USA Federal Highway Administration (FHWA), means that they are predicted to fail if a given flood event were to occur [2]. Therefore, bridge pier scour is an ongoing problem that affects many bridges in the USA, and elsewhere, ultimately endangering the safety of the public.
Bridge pier scour is caused by a three-dimensional flow separation induced by the pier. As the flow separates around the pier, three main scour-causing mechanisms arise: the horseshoe vortex upstream of the pier, flow acceleration along the sides of the pier, and wake vortices downstream of the pier (depending on the Reynolds number). When present, these components coincide and form the scour holes observed around bridge piers [1,4,5,6,7]. Detailed studies were performed by Dey et al. and Tafarojnoruz and Lauria, which examined the flow behaviour around piers by means of experimental and numerical investigations, respectively [8,9]. These studies identify the contribution of each of the aforementioned scour-causing mechanisms as the scour hole around the pier develops.
Bridge pier scour can occur under two conditions: clear water or live bed. Unlike clear-water scour, live-bed scour has the contribution of sediment from upstream, which replenishes, to some degree, the scour hole around the pier [2,6]. For this paper, only clear-water conditions will be studied.
Many parameters influence bridge pier scour. Over the years, extensive research has taken place to better understand the influence of each parameter; however, there are still some parameters for which the knowledgebase is limited. One such parameter is the presence of an ice cover around the pier. Ice on the water’s surface, which acts as an upper boundary, has been found to change the flow behaviour beneath. Specifically, the velocity (u) profile under an ice cover transitions from a logarithmic shape with the maximum u near the surface to that which resembles a pipe flow with the maximum u occurring at approximately mid-depth [10]. Due to the location of the maximum u shifting downwards within the flow depth, an increased u gradient occurs near the bed, which can induce greater bed shear stresses. As a result, more scour can occur [11,12,13].
Ice covers can possess a wide variety of shapes and configurations influenced by various factors such as weather and location. As a result, the roughness of the underside of an ice cover can vary drastically within a given reach and season, making the ice cover roughness highly irregular [14,15,16]. If the ice is thermally grown only, the roughness will frequently be minimal, and the ice will have a smooth surface contacting the passing flow [12]. On the other hand, mechanical thickening processes due to ice shoving can generate a rough ice cover [17]. For example, most often, later in the season, during the breakup period, large pieces of ice can break apart into smaller ice fragments and, similar to debris, accumulate in random patterns generating a rough surface, sometimes referred to as an ice jam [11]. Due to the unsafe conditions during field measurements of an ice jam roughness, limited data are available [16]. However, Beltaos used a remote technique consisting of a floating sensor that was deployed beneath the ice jam [14]. The floating sensor was carried with the flow while recording the elevation of the underside of the ice jam for multiple kilometers. The mean elevation and the fluctuations from the mean were translated into the average thickness and the hydraulic roughness of the ice cover, respectively. For the 20 data sets collected at various locations, the absolute roughness values (taken as the 84th percentile of the absolute deviation from the mean) varied from 0.24 to 1.15 m, averaging 0.79 m, while omitting one data point with an extremely large value of 2.34 m [14]. Zare et al. utilized a bottom-mounted Acoustic Doppler Current Profiler (ADCP) over a four-month period that included spring breakup to measure u profiles continuously at a fixed location in Nelson River, Canada [10]. Hourly averaged u profiles were fit to the log law to estimate the roughness of the bottom side of the ice surface, with equivalent Manning’s roughness values ranging from near zero (smooth) to as high as 0.08 (very rough). Therefore, an ice cover can possess an underside that is smooth or extremely rough.
The roughness of the underside of an ice cover, in conjunction with the bed roughness, has an influential role in shaping the corresponding u profile. If the ice and the bed’s roughnesses possess similar magnitudes, the location of the maximum u will occur at approximately mid-depth. However, if the surface has a greater roughness than the bed, the location of the maximum u could occur below mid-depth. This can cause a higher u gradient next to the bed, resulting in increased shear stress and potentially greater scour [11,12,17].
Solid ice covers that span the entire width of the river, which is the focus of this study, can be either unattached or attached to the banks, such that the ice is floating or fixed, respectively. When the ice is floating, it can raise or lower depending on the stage of the river. However, when the ice is attached to the banks, it is unable to adjust to varying water levels causing pressurized conditions to occur beneath the ice. Furthermore, ice covers, especially ice jams, frequently grow in size in the vertical direction due to the mechanical thickening process [18]. When an ice cover attached to the banks grows vertically, the cross-sectional area of the river channel beneath the ice decreases, and a rise in the upstream water level can occur. When this happens, the passing flow is confined to the smaller cross-sectional area causing there to be an increase in velocity, resulting in even greater scour [12,19,20].
The Hydraulic Engineering Circular No. 18 (HEC-18) has identified that an ice formation or jam is a factor that affects the local scour depth around bridge piers, as a more severe scour condition can occur with a smaller flow rate (Q). HEC-18 further states that there are many examples of foundation scour from accelerated flow beneath an ice covering, but limited field measurements of scour induced by ice jams exist. When designing a bridge, HEC-18 requires that ice effects be considered when calculating the maximum scour depth, but the HEC-18 pier scour equation does not consider ice covers. Instead, HEC-18 suggests obtaining scour data from nearby bridges to estimate the expected scour [2]. This is not always an accurate approach. According to Wuebben, the resulting bathymetry after an ice covering has subsided may not represent the deepest scour, as a portion of the scour hole could have been refilled during the ice breakup period [16].
Various researchers have identified ice covers as a parameter that requires further research, e.g., Ettema et al. ranked ice covers at a medium-level priority in terms of bridge pier scour research needs [21]. Wu et al. performed a bridge pier scour study in the presence of a floating ice cover, which examined the effect of different pier diameters and water depths on scour depth and scour width [13]. The limitations of this study were that pressurized ice covers and different ice cover roughnesses were not considered. Ackermann et al. studied bridge pier scour with a floating ice cover possessing either a smooth or a rough surface [22]. Various velocities under both live-bed and clear-water conditions were tested. The limitations of this research were that pressurized conditions were not tested and only the maximum scour depth was recorded. Lastly, Hains and Zabilansky performed a thorough study of bridge pier scour under a floating and pressurized ice cover [23]. The limitations of this study were that live-bed conditions were reached in a number of clear-water tests making the final scour data for these points unusable, and Q was changed for each test rather than being kept constant.
It is understood that ice covers influence the hydrodynamics of the flow passing beneath, which can in turn increase bed erosion. However, the full extent of the impacts an ice cover has on bridge pier scour are not known. Therefore, the intent of this study is to expand the existing knowledgebase pertaining to bridge pier scour in the presence of an ice cover. In addition to maintaining a constant flow rate and remaining in the clear-water regime amongst all tests, the objectives are to:
- Examine the differences in scour for floating versus fixed ice covers;
- Investigate the effect of different levels of ice cover submergence (flow pressurization) on scour;
- Evaluate the influence of both smooth and rough ice covers on scour.
2. Materials and Methods
2.1. Flume
The research presented in this study was completed in the University of Ottawa’s Civil Engineering Hydraulics Laboratory in Ottawa, Canada. The flume utilized for the research measured 30 m in length, by 1.5 m in width, by 0.5 m in depth. A sand section, extending the width of the flume and measuring 3.16 m in length and 0.2 m in depth, was installed near the outlet. To contain the sand, concrete false floors, the same height as the sand, were installed upstream and downstream of the sand section. The downstream false floor measured 1.25 m in length and ended at the outlet. The upstream false floor measured 4.16 m in length and included an additional gradual gravel slope, 2.25 m in length, extending upstream from the leading face to smoothly transition the passing flow onto the false floor. An acrylic cylindrical bridge pier, 0.09 m in diameter (D), was positioned in the center of the sand section and bolted to a large steel plate situated beneath the sand. The width of the pier with respect to the width of the flume was checked to ensure flow blockage would not occur. The sediment used in the sand section was uniformly graded silica sand with a median grain size diameter (d50) of 0.001 m. This sand size was selected based on a Shield’s curve analysis. To maintain a constant bed roughness before and after the sand section, the same sand was adhered to the surface of both concrete false floors. Lastly, to reduce turbulence, two flow straighteners were installed near the inlet. An illustration of the flume can be seen in Valela et al. [24].
2.2. Ice Cover Construction
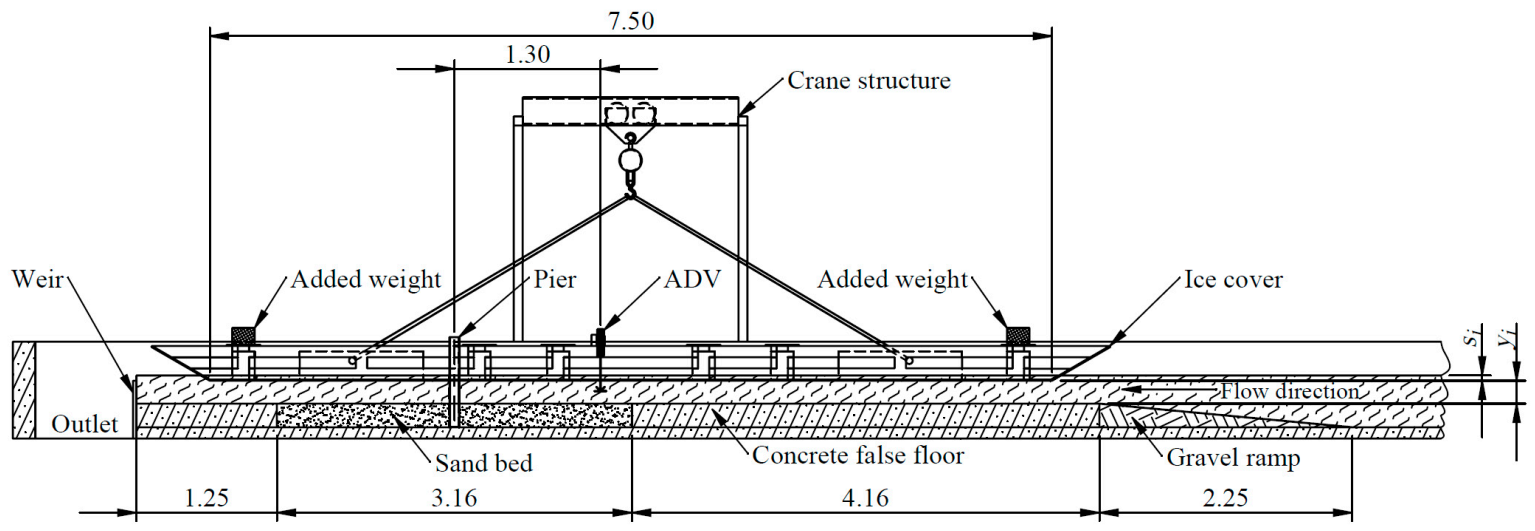
One of the objectives of this paper was to study scour under a fixed ice cover that induced pressurized flow conditions. To generate pressurized flow conditions, the ice cover was partially submerged. In order to ensure rigidity of the ice cover, it was constructed of dimensional lumber with a plywood bottom surface. The ice cover spanned the entire width of the flume and measured 7.5 m in length, therefore covering the sand section and a majority of the false floors (Figure 1). By making the ice cover this length, the ends were far enough away from the pier that the flow entering the front and exiting the rear of the ice cover did not influence the scour around the bridge pier. In addition, a fully developed flow profile was achieved prior to reaching the pier. To help guide the flow under the ice cover and avoid flow over top, two 30° sloped sections were attached to either end of the ice cover.
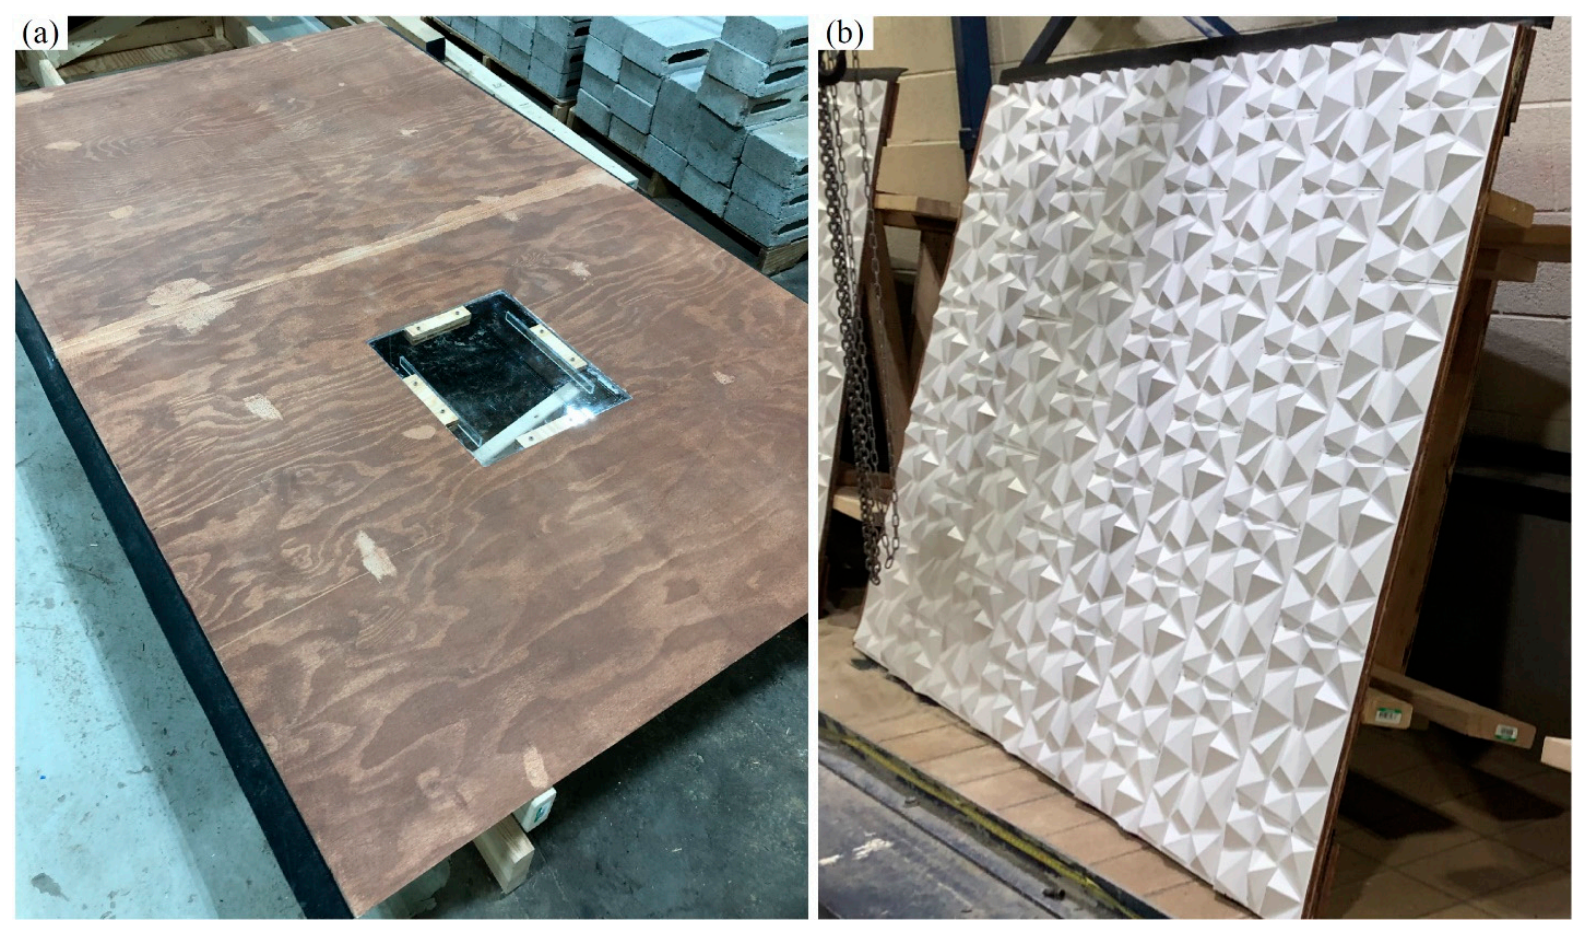
A hole, the diameter of the pier, was drilled through a bottom-flush viewing window in the ice cover to allow the pier to protrude through (Figure 2b). The hole was made so that the ice cover fit tight around the pier, limiting the flow passage in between. Due to the overall weight of the ice cover, it was constructed in three sections with a bolted connection between the sections. Once the ice cover was in the flume, it was bolted together and lowered into place for each test as one solid unit using a crane. Figure 2a displays the ice cover sections bolted together and resting on the side walls of the flume in preparation for a test.
The pressurized ice cover tests performed in this study were intended to replicate an ice cover that grows in the vertical direction, where the cross-sectional area under the ice decreases, while a constant Q is maintained. To recreate these conditions, the ice cover was submerged into the flow to different desired depths. Due to the large buoyancy forces that would otherwise be generated, water was allowed to enter the top side of the ice cover as added weight, as seen in Figure 2c. This was achieved using three fill holes at the front and three fill holes at the rear of the ice cover, as seen in Figure 2d. Once the water on top of the ice cover equilibrated with the water height in the flume, the fill holes were plugged for the duration of each test. Depending on si, additional weight was added in the form of concrete blocks to the top of the ice cover. An effort was made to reduce the transfer of water between the passing flow and the top side of the ice cover. This was achieved by using a rubber seal between the flume walls and the sides of the ice cover, as shown in Figure 2c. Furthermore, between each sheet of plywood contacting the passing flow, the edges were cut on a 45° degree angle and joined to eliminate the passage of water between the sheets.
2.3. Ice Cover Roughness
Another objective of this study was to compare scour under a smooth versus a rough ice cover. A smooth surface was created by first using plywood that possesses sanded faces. Then, any imperfections, joints, and screw heads were filled with a waterproof wood filler. Next, the entire surface was sanded to ensure a smooth finish, including the added wood filler. Lastly, a waterproofing product was applied to seal the surface using a paint brush. This resulted in a smooth and waterproof surface, as shown in Figure 3a, which closely resembles that of a thermally grown ice sheet.
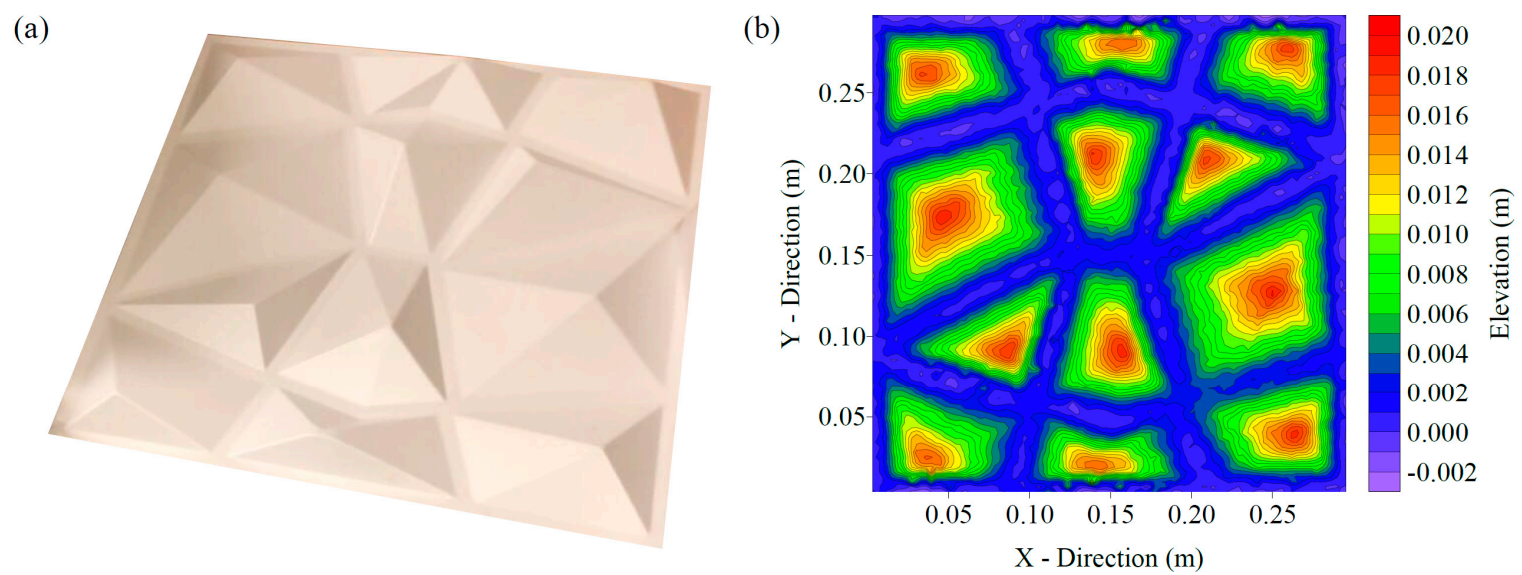
Once all of the tests requiring a smooth ice cover were complete, the rough surface tests were performed. To achieve the desired roughness, 0.3 m by 0.3 m Polyvinyl Chloride (PVC) acoustic wall panels were used to cover the existing smooth bottom of the ice cover (Figure 3b), including the viewing window installed around the pier. The acoustic panels are waterproof, rigid, and possess the desired jagged shape which resembles the bottom of an ice jam. Each individual panel, shown in Figure 4a, has the same pattern which is symmetric about the diagonal axis. To ensure a more random configuration, the panels were staggered when installed. A topographic plot of an individual panel, Figure 4b, shows a maximum peak elevation of 0.025 m. The volumetric average elevation, for a given panel, was calculated to be located at 0.005 m from the base. When the ice cover was set at specific depths, the roughness’s average elevation was used as the bottom of the ice cover.
To determine the roughness of the rough ice cover, a trial test was performed with the ice cover panels positioned flat on the flume floor facing upwards, without the presence of the ice cover. The flume was filled to a depth of 0.10 m, and a depth-averaged velocity (uavg) of 0.37 m/s was maintained. A vertical u profile was collected over the ice cover panels where the flow was fully developed, and using the law of the wall, the ice cover roughness was found to be ks = 0.013 m [25]. When using a scaling factor of 30, the maximum peak elevation and the roughness equate to 0.75 m and 0.39 m, respectively, which falls within the average range of an ice jam indicated by previous literature. Converting the ks value to a Manning’s coefficient (n) value, using the method presented by Li, yields an approximate average value of 0.0189 s/m1/3 [15].
2.4. Instrumentation
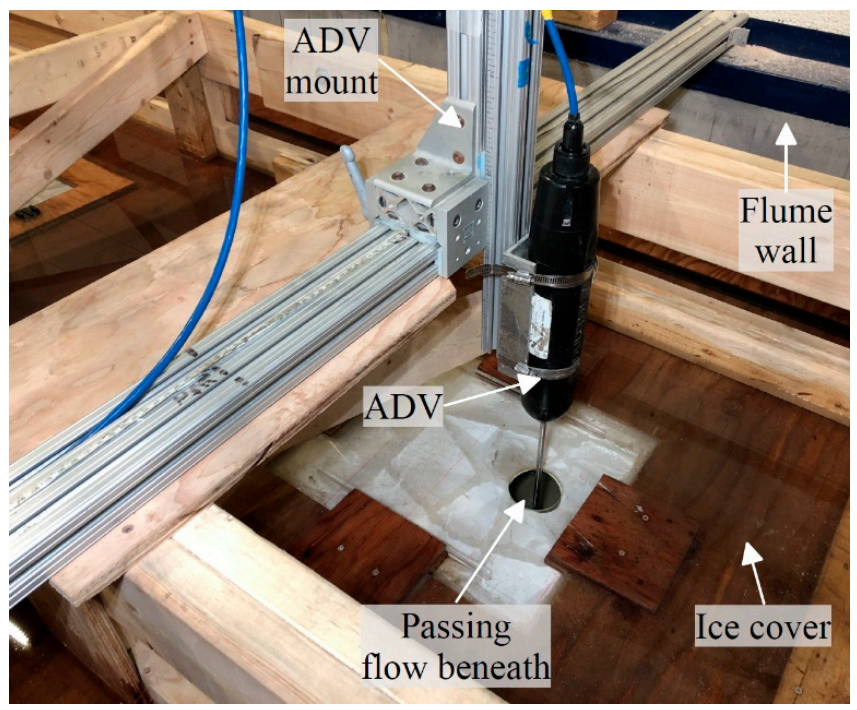
The u measurements were collected using a Vectrino Acoustic Doppler Velocimeter (ADV). For each ice cover condition tested, a vertical u profile was collected 1.3 m upstream of the pier in the center of the flume. To collect the u measurements, a hole, the diameter of the ADV probe head, was cut in the ice cover so the probe head could protrude through. The ADV mounting setup can be seen in Figure 5. A side-looking, rather than a down-looking, probe head was utilized to ensure u measurements close to the ice cover were captured. Individual u time series were collected at 0.01 m intervals between the bed and the water surface or ice cover. Data were collected at each point for two minutes at a sampling frequency of 100 Hz. The measured data were filtered, despiked, and time-averaged [26].
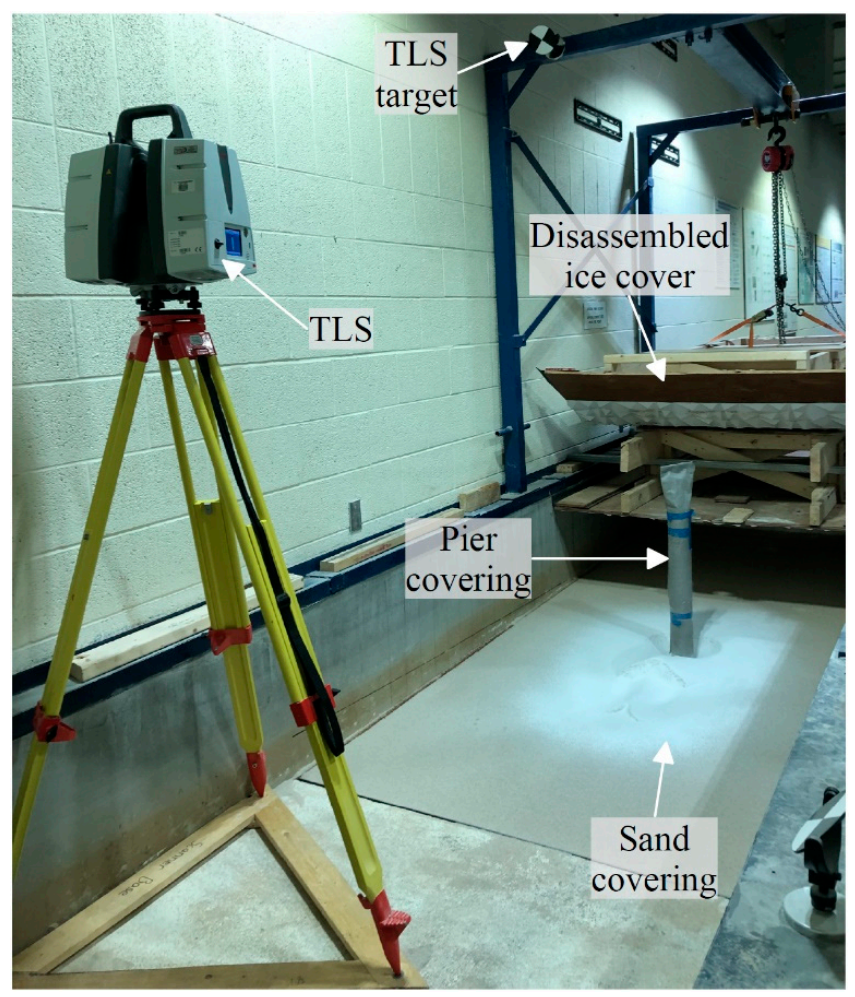
After each test was complete, the resulting bathymetry was recorded using a Leica ScanStation P50 Terrestrial Laser Scanner (TLS) (Figure 6). The accuracy of this device is +/− 0.0015 m in all three directions. To capture the sand bed with the TLS, the ice cover needed to be partly disassembled and raised after each test. To ensure accurate elevations, a very thin dusting of sodium bicarbonate was sprinkled upon the sand bed before scanning to increase opacity. Similarly, the Perspex pier was wrapped with fabric during scanning. To capture the entire bed, the TLS was setup at three locations around the pier, where a scan was performed from each location. Joining the scans together after was aided by four targets, which were placed in clear view of all three scanning locations. Once the scans were joined together, a detailed three-dimensional model of the entire scour region was created.
2.5. Protocol
A total of 13 tests were completed to examine the scour behaviour beneath an ice cover, which consisted of six tests with a smooth ice cover, six tests with a rough ice cover, and one test without any ice cover as a benchmark case. For both the smooth and rough ice covers, the same conditions were tested. One of the six tests was performed with the ice cover bottom touching the water surface, replicating the floating condition, as the flow was not pressurized below the ice cover. The remaining five tests were performed with the ice cover submerged to depths (si), which incremented by 0.015 m up to 0.075 m, achieving pressurized flow conditions under the ice cover. Setting the ice cover for each test was achieved by, first, lowering it into position with the crane. Then, depending on the required elevation, weight was added to the ice cover, in the form of water and concrete blocks, to reach the desired yi. The ice cover remained attached to the crane throughout the duration of each test to maintain the desired elevation. The distance between each of the four ice cover corners and the bed was verified prior to commencing each test to ensure the ice cover was set at the required elevation and level in all directions. The experimental trials and the corresponding naming convention are presented in Table 1.
This study is unique as each test was performed for the same duration (t) of 6 h and under the same Q (0.0825 m3/s). Q was selected to be in the clear-water regime, for all ice cover conditions, determined from initial trial tests. To ensure the flow conditions were constant among all the tests, the flow was first set and verified without the ice cover. This was accomplished using a flow control valve on the pump and an outlet weir. Then, depending on the test that was being performed, the ice cover was either lowered into position at the desired elevation or left above the water surface for the duration of the test. By beginning each test in this manner, the same flow depth (y) of 0.25 m and uavg of 0.22 m/s could be set for each test, whether or not the ice cover was being used. The time began once the ice cover was positioned at the desired elevation.
Prior to beginning each test, the ice cover was disassembled, and the bed was completely levelled. The ice cover was then reassembled and secured above the water surface. It was critical when beginning each test that the flume was slowly filled with water and that Q was gradually increased, as to avoid any initial scour.
3. Results
3.1. Velocity Data
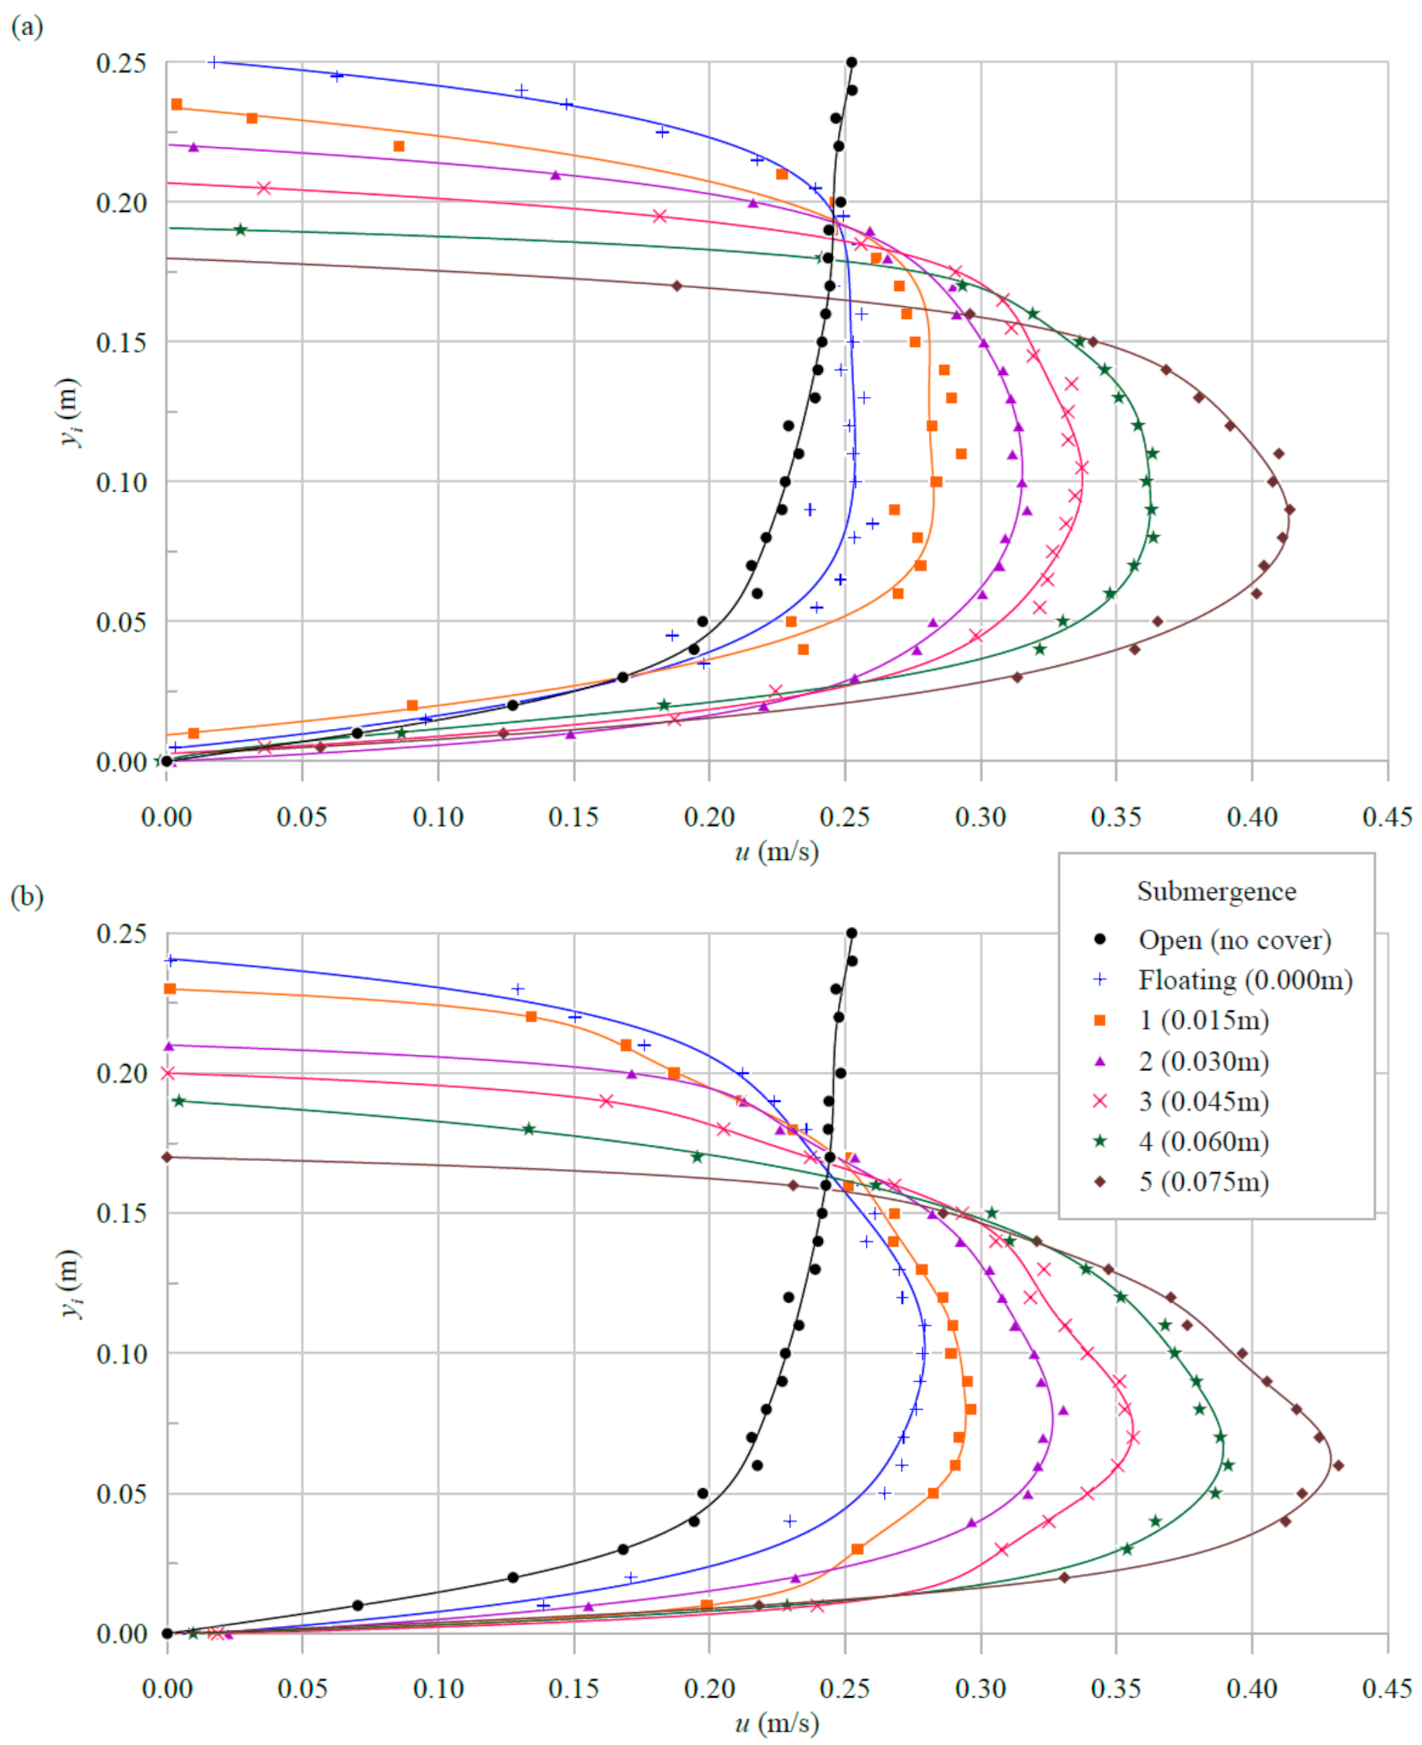
During each of the experimental conditions tested, a vertical u profile was measured upstream of the pier. The u profiles beneath the smooth and rough ice covers are presented in Figure 7a,b, respectively. In addition, the u profile from the Open case (possessing no ice cover) is presented in both plots for comparison purposes.
The Open case u profile behaves as expected, with the maximum u occurring near the surface. The u gradient near the bed for the Open case is mild, which induces a low quantity of shear stress on the bed. Meanwhile, when any ice cover is present, the u profile changes to that resembling a pipe flow. The maximum u is reached towards mid-depth while the u at the top and bottom boundary approaches zero. As either ice cover becomes more submerged reducing the depth under the ice cover, the maximum u increases and the location of the maximum u shifts downwards to remain at approximately mid-depth. Furthermore, despite some anomalies, a general trend shows that the u gradient near the bed is lower for the Open condition than most of the ice covered conditions, especially the more submerged cases. This can result in the ice covered cases inducing greater shear stress on the bed.
The roughness of the ice cover is shown to have further influenced the shape of the u profile beneath. For the same si, the u profile under the rough ice cover possesses a greater maximum u and a sharper crest, when compared to the u profile under the smooth ice cover. In addition, the location of the maximum u under the rough ice cover occurs below mid-depth, closer to the bed, whereas the location of the maximum u under the smooth ice cover occurs at approximately mid-depth. This trend is consistent amongst all si levels. As a result, the u gradient near the bed is greater under the rough ice covers.
When comparing u profiles between the floating versus submerged (fixed) ice covers, little difference is present besides the influence of si. The shape of the u profiles for the floating cases match closely to those of si = 0.015 m. The main dissimilarity is the lower maximum u for the floating cases and that corresponds to the greater cross-sectional area.
3.2. Scour Data
After each test was performed and scans of the resulting bathymetry were collected, three-dimensional models of the bed were generated. Using these models, elevation plots were created to compare the differences in scour patterns between tests. Figure 8 displays the resulting scour for the Open case, where the flow travelled in the negative X direction. In the absence of an ice cover and under the given flow conditions, the quantity of scour around the pier is minimal. A small depression can be seen wrapping around the front and sides of the pier with a corresponding mound immediately behind the pier.
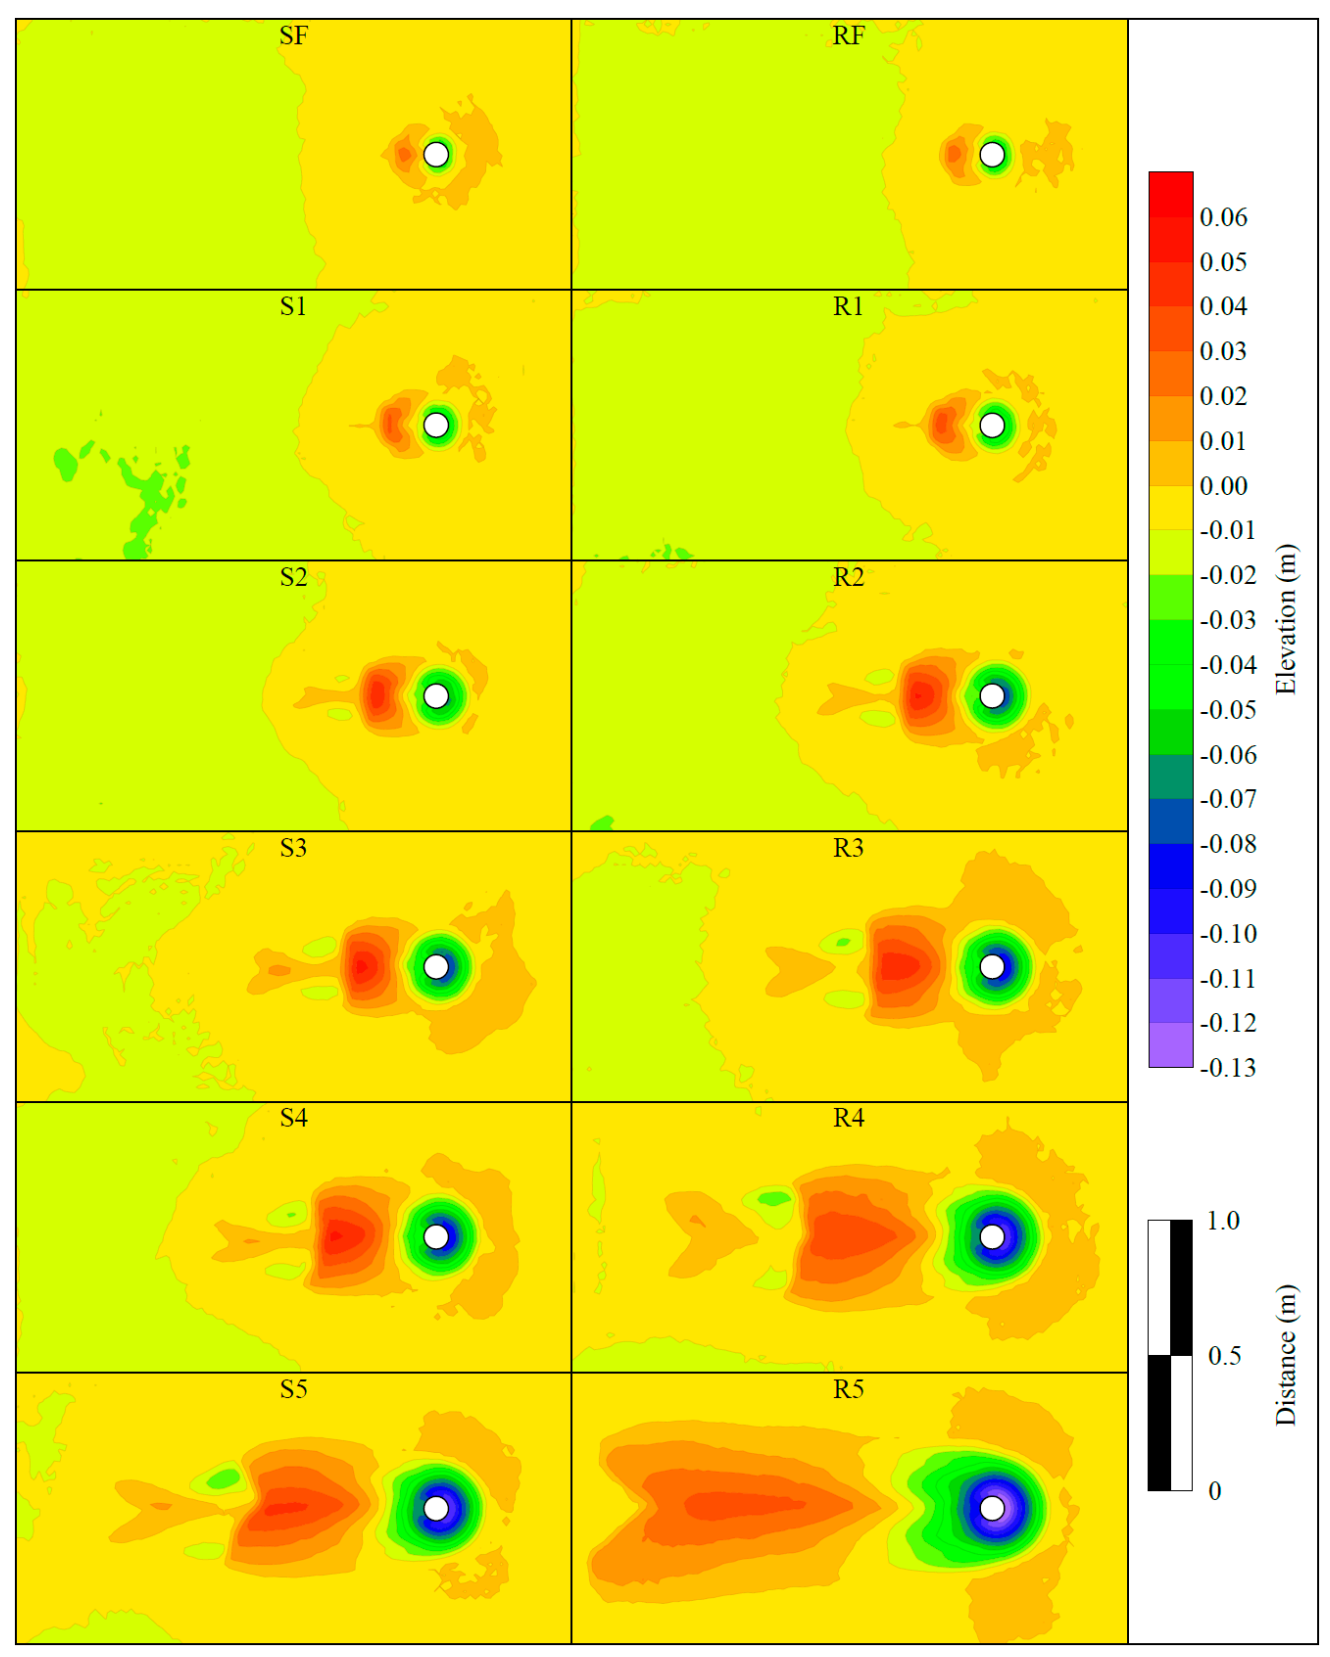
Figure 9 displays the scour plots from each of the ice cover tests. The left and right column contain the smooth and rough ice cover results, respectively, while the rows contain increasing si levels. Regardless of the ice cover roughness or submergence, all tests possessing an ice cover yielded greater scour compared to the Open case. The floating cases (SF and RF) possess the least amount of scour, of the ice cover conditions tested, and the patterns look similar to that of the Open case. The difference is a magnified version of the Open case, where there is a deeper depression around the pier followed by a larger deposition pile behind the pier. As the ice cover becomes submerged, the quantity of scour and deposition increases steadily based on the level of si. The scour grows not only in depth but also proportionally in diameter. Once the deposition pile reaches approximately 0.05 m in height, two small scour holes begin to form immediately downstream of the deposition pile, as seen in test S2 and R2. These scour holes grow in size as the ice cover becomes further submerged and, as a result, create a second deposition pile further downstream.
The difference in scour between the smooth and rough ice covers is minimal for the floating and mildly submerged ice cover tests. As si increases, the ice cover roughness has a greater influence causing there to be a larger difference in scour between the smooth and rough ice covers. However, for all test conditions, the rough ice cover yielded more scour than the smooth ice cover. Test R5 contained the greatest scour with the upstream and side depression continuing around the rear of the pier and the deposition pile extending over double the length of that in test R4 and S5. Due to the deposition pile in test R5 nearing the end of the sand section, additional scour holes were not generated downstream of the deposition pile.
The maximum scour depth (ds) for each test, as well as the percent increase in ds when compared to the Open case, are presented in Table 2. All tests were within the clear-water regime, as live-bed conditions were not reached even under the most submerged ice cover. The Open case experienced a ds of only 0.025 m, which increased drastically with the presence of any ice cover. The floating ice cover tests, SF and RF, yielded a 40% and 52% increase in ds, respectively. However, when the ice covers became submerged for tests S2 and R2, the increase in ds grew to 76% and 92%, respectively. The greatest ds was achieved for test R5, reaching a depth of 0.128 m, implying a 412% increase over the Open case. The smooth and rough ice cover tests had a difference in ds of 0.004 m between tests S1 and R1 and that grew to 0.019 m between tests S5 and R5.
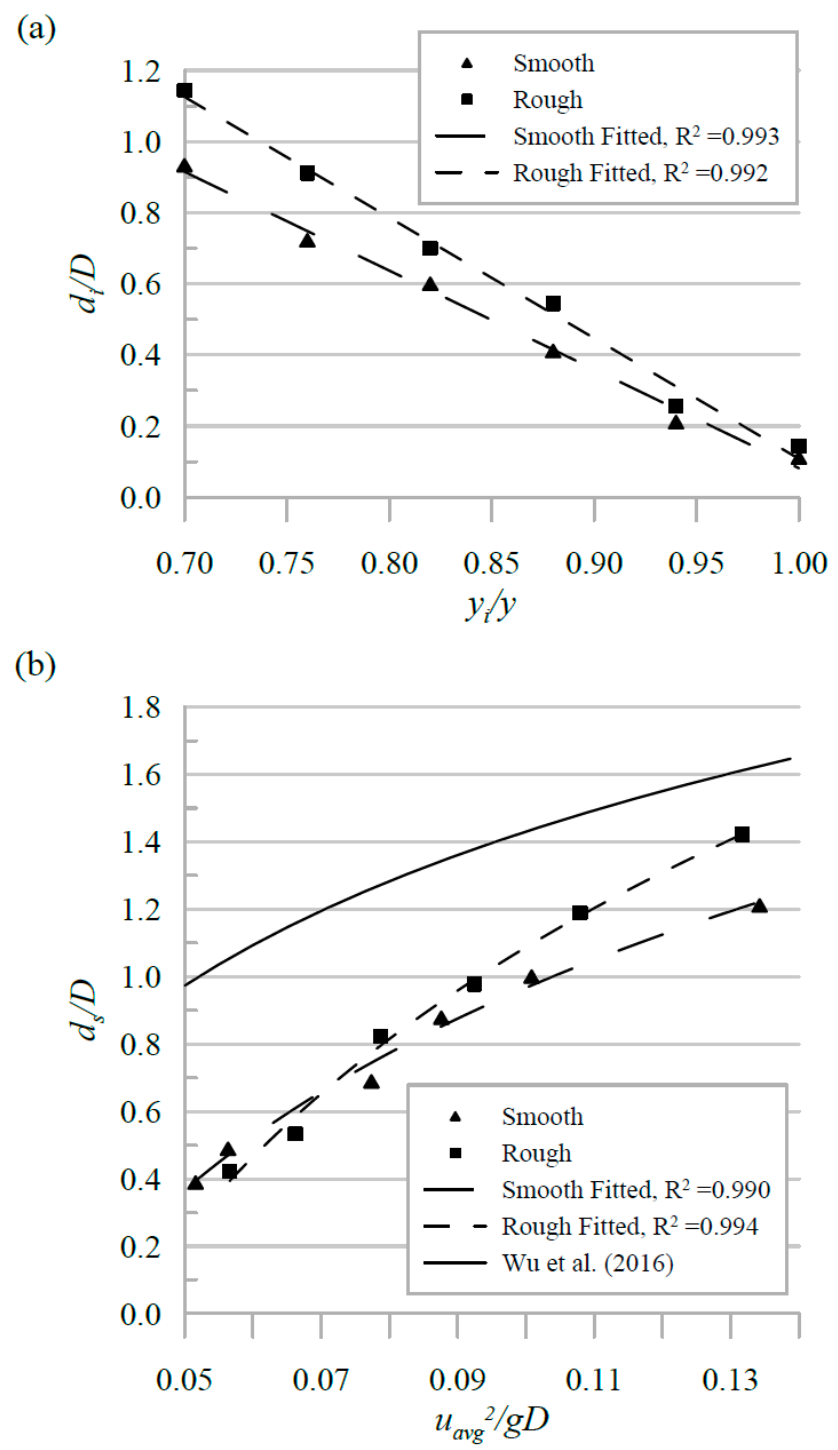
To better understand the difference between the effects of the smooth and rough ice cover on scour, the nondimensionalized ice cover scour depth (di) as a function of the nondimensionalized yi, for both ice cover roughnesses, is plotted in Figure 10a. Note that di refers to the scour caused only by the ice cover, which is ds minus the scour depth of the Open case (dp). The purpose of plotting di, as opposed to ds, was to highlight the additional scour induced by the presence of an ice cover.
Figure 10a confirms that the difference in scour between the smooth and rough ice covers is small for the floating condition but grows as the ice cover becomes more submerged. The equations of the smooth and rough fitted lines are presented in Equations (1) and (2), respectively:
where (yi/y) represents the flow confinement (pressurization), such that yi ≤ y. Equations (1) and (2) were developed from yi/y data ranging from 0.7 to 1.
The relationship between scour and flow confinement is linear for both smooth and rough ice covers. Due to a difference of 0.61 in the slopes, the data converge as yi increases.
Another method of presenting the scour depth is as a function of the pier Froude number , where g is the gravitational constant. According to Ettema et al., the pier Froude number can be seen as a way of conveying the similitude in the frequency and strength of vortices shed from the rear of a pier [27]. This parameter is often neglected when studying pier scour but has shown to be largely influential [13]. Figure 10b displays the nondimensionalized ds as a function of pier Froude number. Similar to Figure 10a, this plot also indicates that the rate of change for the smooth and rough ice covers is not the same. For pier Froude numbers below approximately 0.07, the rough ice cover data points drop below that of the smooth ice cover. In other words, to achieve the same quantity of scour under both ice covers, greater pier Froude number values are required in the presence of a rough ice cover. However, above the pier Froude number of approximately 0.07, the rough ice cover yields greater scour for the same pier Froude number. The equations for the smooth and rough ice cover fitted lines, which are nonlinear, are shown in Equations (3) and (4), respectively:
The pier Froude number was altered through changing uavg and leaving D constant, therefore implying that ds is proportional to uavg. Equations (3) and (4) are valid for D > 0 and 0 < uavg < ucr, where ucr is the critical velocity required for bed material motion.
4. Discussion
In this study, a number of conditions pertaining to the presence of surface ice around bridge piers, in regard to bridge pier scour, were analysed. One objective, which proved to be challenging to correctly replicate experimentally, was a floating ice cover. In the field, a floating ice cover can both freely adjust its elevation to accommodate the changing water levels, and it can also protrude into the passing flow to some degree, depending on the characteristics of the ice. Therefore, it is possible that a floating ice cover can generate accelerated flow beneath, which could result in similar scour behaviours to that of the mildly submerged fixed ice covers. To overcome this issue, a range of si levels were tested from just touching the surface to protruding into the flow 30% of y. Since the flow depth throughout each test remained constant and the ice cover was weighted to achieve the desired si, whether the ice cover was fixed in place or not would have no impact on the scour results. This implies that the submerged ice cover cases could represent a floating ice cover that protrudes into the flow.
Upon analysing the velocity and scour results with and without an ice cover, it is evident that the presence of any ice cover increases scour. Specifically, as an ice cover grows and becomes more submerged, the quantity of pier scour becomes greater. These scour results were confirmed by the general trend observed from the u data, which indicated an increase in the near bed u gradient as the ice covers became more submerged. Both a smooth and rough ice cover were tested, and this was to reach both ends of the possible roughness spectrum. It was discovered that the rough ice cover induced more scour than the smooth ice cover under all conditions. In addition, the quantity of scour also increased at a greater rate for the rough ice cover than the smooth ice cover, as yi decreased. For these reasons, the rough ice cover should be used from a design perspective in order to achieve a conservative design. Since many pier scour equations do not take into consideration the effects of ice covers, the results presented in Figure 10a can be used in addition to such equations to help provide further insight.
Wu et al. presented equations that relate nondimensional scour to pier Froude number, under open-channel conditions, as shown in Equation (5), and smooth ice cover conditions, as shown in Equation (6) [13]:
Equation (6) from Wu et al. and Equation (3) presented in this paper both pertain to a smooth ice cover and possess a number of similarities (Figure 10b) [13]. Specifically, the constants are almost identical, and the coefficients are relatively close given the differences in the experimental conditions. This lends credence to both Equations (3) and (6), and indicates that the experimental results presented in this paper are reasonable. The experimental conditions of Wu et al. varied from this study in that y = 0.108 m, 0.150 m, 0.210 m, d50 = 0.00051 m, and uavg = 0.24 m/s [13]. It can be noted that of the different experimental conditions, d50 and y are not considered in Equations (3) and (6), only uavg.
When comparing the equations pertaining to a smooth ice cover (Equations (3) and (6)) to Equation (4) presented in this paper, which pertains to a rough ice cover, there are notable differences. The constant and the coefficient for Equation (4) are significantly greater than that of Equations (3) and (6). Wu et al. stated that the presence of a smooth ice cover, when compared to no ice cover, has only a limited influence on the pier Froude number [13]. Meanwhile, the results presented in this study (Equations (3) and (4)) show that the presence of a rough ice cover, in comparison to a smooth ice cover, has a substantial influence on the pier Froude number. Therefore, given the findings of this paper and that of Wu et al., the pier Froude number only becomes influenced with rough ice covers [13].
The work presented in this paper contains a number of limitations which warrants further research. First, bridge pier scour is a complex process which is influenced by numerous parameters, and due to the scope of the project, not all parameters could be examined to their full extent. Specifically, only one Q, y, D, and d50 were tested, and all the tests lied within the clear-water regime. The second limitation to this paper is that only one size of ice covering was used. The ice covering extended in the upstream and downstream direction a far distance from the pier, as to replicate an infinitely long ice cover, but perhaps shorter ice covers, such as ones localized around the pier, could have a different effect on the quantity of pier scour. The third limitation is that the ice cover itself was artificial as the smooth surface consisted of treated plywood and the rough surface consisted of PVC panels. While using artificial materials improves constructability, and the chosen materials were intended to mimic natural river ice, it is possible that natural river ice would induce different flow characteristics. The last limitation is that only one u profile was measured for each test condition and it was collected in the center of the flume upstream of the pier. Additional u profiles would be beneficial as they would create a more detailed flow field; however, this is difficult to achieve with an ADV in the presence of a solid ice cover.
A point worth noting is that when the ice cover was submerged, the flow depth beneath the ice cover consequently reduced. In the absence of an ice cover, the authors acknowledge that a change in flow depth could influence the scour depth. Therefore, the scour depth experienced under a submerged ice cover could be a combination of both the flow pressurization and the reduction in flow depth. Further research is required to distinguish the contribution of both factors.
5. Conclusions
Pier scour under increasing ice cover submergence was investigated. Velocity measurements collected under the ice cover for each experimental condition confirmed that the ice cover induced an upper boundary layer, resulting in maximum velocity near mid-depth. Increased ice cover submergence resulted in greater maximum velocity, and an associated increase in the near-bed velocity gradient. Furthermore, a rougher ice cover displaced the maximum velocity closer towards the bed, and thus the near-bed velocity gradient was even greater.
After each experiment, three-dimensional scans of the bed were performed. It was found that the presence of an ice cover, regardless of the submergence level or roughness, caused an increase in scour. The bathymetry measurements confirmed that the tests with an increased velocity gradient near the bed resulted in greater scour. Specifically, as the ice cover was submerged deeper into the flow, the quantity of scour grew, and for each level of submergence, the rough ice cover generated more scour than the smooth ice cover. The most scour occurred under the rough ice cover submerged to 30% of the flow depth (the largest submergence tested), as it resulted in a 412% increase in scour depth. Therefore, solid ice covers that span the water surface around bridge piers are an influential parameter in pier scour and additional research into the topic is a necessity. Importantly, when designing a bridge pier foundation to resist the additional erosive forces induced by an ice cover, focus should be put on rough ice covers that protrude into the passing flow, as such conditions yielded the most concerning scour depths.
Author Contributions
Conceptualization, C.V., D.A.B.S., I.N., C.D.R. and H.A.; methodology, C.V., D.A.B.S., I.N. and C.D.R.; software, C.V. and D.A.B.S.; validation, C.V. and D.A.B.S.; formal analysis, C.V., I.N. and C.D.R.; investigation, C.V. and D.A.B.S.; resources, I.N. and C.D.R.; data curation, C.V. and D.A.B.S.; writing—original draft preparation, C.V.; writing—review and editing, C.V., D.A.B.S., I.N., C.D.R. and H.A.; visualization, C.V.; supervision, I.N., C.D.R. and H.A.; project administration, C.V.; funding acquisition, I.N., C.D.R. and H.A. All authors have read and agreed to the published version of the manuscript. CRediT taxonomy for the term explanation.
Funding
This research was funded by the National Research Council (NRC) Canada and by the Natural Sciences and Engineering Research Council of Canada (NSERC).
Institutional Review Board Statement
Not applicable.
Informed Consent Statement
Not applicable.
Data Availability Statement
The data are contained within this article.
Conflicts of Interest
The authors declare no conflict of interest. The funders had no role in the design of the study; in the collection, analyses, or interpretation of data; in the writing of the manuscript, or in the decision to publish the results.
References
- Chiew, Y.-M. Scour Protection at Bridge Piers. J. Hydraul. Eng. 1992, 118, 1260–1269. [Google Scholar] [CrossRef]
- Arneson, L.A.; Zevenbergen, L.W.; Lagasse, P.F.; Clopper, P.E. Evaluating Scour at Bridges, 5th ed.; U.S. Department of Transportation: Washington, DC, USA, 2012.
- Lagasse, P.F.; Clopper, P.E.; Zevenbergen, L.W.; Girard, L.G. Countermeasures to Protect Bridge Piers from Scour; Natl. Coop. Highw. Res. Progr. (NCHRP Rep. 593); Transportation Research Board: Washington, DC, USA, 2007. [Google Scholar]
- Dargahi, B. Controlling Mechanism of Local Scouring. J. Hydraul. Eng. 1990, 116, 1197–1214. [Google Scholar] [CrossRef]
- Ettema, R.; Constantinescu, G.; Melville, B.W. Flow-Field Complexity and Design Estimation of Pier-Scour Depth: Sixty Years Since Laursen and Toch. J. Hydraul. Eng. 2017, 143, 03117006. [Google Scholar] [CrossRef]
- Raudkivi, A.J. Functional Trends of Scour at Bridge Piers. J. Hydraul. Eng. 1986, 112, 1–13. [Google Scholar] [CrossRef]
- Stevens, M.A.; Gasser, M.M.; Saad, M.B.A.M. Wake Vortex Scour at Bridge Piers. J. Hydraul. Eng. 1991, 117, 891–904. [Google Scholar] [CrossRef]
- Dey, S.; Raikar, R.V.; Roy, A. Scour at Submerged Cylindrical Obstacles under Steady Flow. J. Hydraul. Eng. 2008, 134, 105–109. [Google Scholar] [CrossRef]
- Tafarojnoruz, A.; Lauria, A. Large Eddy Simulation of the Turbulent Flow Field around a Submerged Pile within a Scour Hole under Current Condition. Coast. Eng. J. 2020, 62, 489–503. [Google Scholar] [CrossRef]
- Zare, S.G.A.; Moore, S.A.; Rennie, C.D.; Seidou, O.; Ahmari, H.; Malenchak, J. Estimation of Composite Hydraulic Resistance in Ice-Covered Alluvial Streams. Water Resour. Res. 2016, 1306–1327. [Google Scholar] [CrossRef] [Green Version]
- Beltaos, S. River Ice Jams: Theory, Case Studies, and Applications. J. Hydraul. Eng. 1983, 109, 1338–1359. [Google Scholar] [CrossRef]
- Zabilansky, L.J.; Hains, D.B.; Remus, J.I. Increased Bed Erosion Due to Ice. In Proceedings of the 13th International Conference on Cold Regions Engineering, Orono, ME, USA, 23–26 July 2006; pp. 1–12. [Google Scholar] [CrossRef]
- Wu, P.; Balachandar, R.; Sui, J. Local Scour around Bridge Piers under Ice-Covered Conditions. J. Hydraul. Eng. 2016, 142, 04015038. [Google Scholar] [CrossRef]
- Beltaos, S. Hydraulic Roughness of Breakup Ice Jams. J. Hydraul. Eng. 2001, 127, 650–656. [Google Scholar] [CrossRef]
- Li, S.S. Estimates of the Manning’s Coefficient for Ice-Covered Rivers. Proc. Inst. Civ. Eng. Water Manag. 2012, 165, 495–505. [Google Scholar] [CrossRef]
- Wuebben, J.L. A Preliminary Study of Scour under an Ice Jam. In Proceedings of the 5th Workshop on Hydraulics of River Ice/Ice Jams, Winnipeg, MB, Canada, 21–24 June 1988; pp. 177–192. [Google Scholar]
- Zare, S.G.A.; Moore, S.A.; Rennie, C.D.; Seidou, O.; Ahmari, H.; Malenchak, J. Boundary Shear Stress in an Ice-Covered River during Breakup. J. Hydraul. Eng. 2016, 142, 04015065. [Google Scholar] [CrossRef]
- Ambtman, K.E.D.; Hicks, F.E. Field Estimates of Discharge Associated with Ice Jam Formation and Release Events. Can. Water Resour. J. 2012, 37, 47–56. [Google Scholar] [CrossRef]
- Zabilansky, L.J. Ice Cover Effects on Bed Scour: Case Studies. In Proceedings of the 11th International Conference on Cold Regions Engineering, Anchorage, AK, USA, 20–22 May 2002; pp. 795–803. [Google Scholar] [CrossRef]
- Ambtman, K.E.D.; Hicks, F.E.; Steffler, P.M. Experimental Investigation of the Pressure Distribution beneath a Floating Ice Block. J. Hydraul. Eng. 2011, 137, 399–411. [Google Scholar] [CrossRef]
- Ettema, R.; Constantinescu, G.; Melville, B.W. Evaluation of Bridge Scour Research: Pier Scour Processes and Predictions; Natl. Coop. Highw. Res. Progr. (NCHRP Proj. 24-27(01)); Transportation Research Board: Washington, DC, USA, 2011. [Google Scholar] [CrossRef]
- Ackermann, N.L.; Shen, H.T.; Olsson, P. Local Scour around Circular Piers under Ice Covers. In Ice in the Environment: Proceedings of the 16th IAHR International Symposium on Ice, Dunedin, New Zealand, 2–6 December 2002; Department of Physics, University of Otago: Dunedin, New Zealand, 2002; pp. 149–155. [Google Scholar]
- Hains, D.B.; Zabilansky, L.J. Laboratory Test of Scour under Ice: Data and Preliminary Results; ERDC/CRREL TR-04-9; US Army Corps Eng. Res. Dev. Center, Cold Reg. Res. Eng. Lab.: Hanover, NH, USA, 2004. [Google Scholar]
- Valela, C.; Nistor, I.; Rennie, C.D.; Lara, J.L.; Maza, M. Hybrid Modelling for Design of a Novel Bridge Pier Collar for Reducing Scour. J. Hydraul. Eng. 2020. [Google Scholar] [CrossRef]
- Sirianni, D.A.B.; Valela, C.; Rennie, C.D.; Nistor, I.; Almansour, H. Effects of Developing Ice Covers on Local Bridge Pier Scour. J. Hydraul. Res. 2020. [Google Scholar]
- Jamieson, E.C.; Post, G.; Rennie, C.D. Spatial Variability of Three-Dimensional Reynolds Stresses in a Developing Channel Bend. Earth Surf. Process. Landf. 2010, 35, 1029–1043. [Google Scholar] [CrossRef]
- Ettema, R.; Kirkil, G.; Muste, M. Similitude of Large-Scale Turbulence in Experiments on Local Scour at Cylinders. J. Hydraul. Eng. 2006, 132, 33–40. [Google Scholar] [CrossRef]
Figure 1.
Cross-sectional drawing of the ice cover apparatus installed in the flume (dimensions in m). yi is the flow depth under the ice and si is the ice cover submergence.
Figure 1.
Cross-sectional drawing of the ice cover apparatus installed in the flume (dimensions in m). yi is the flow depth under the ice and si is the ice cover submergence.

Figure 2.
Ice cover apparatus: (a) ice cover resting above the flume to allow for the flow conditions to be set, (b) pier protruding through the ice cover, (c) top view of the ice cover, and (d) fill holes used to allow the added water weight to enter above the ice cover.
Figure 2.
Ice cover apparatus: (a) ice cover resting above the flume to allow for the flow conditions to be set, (b) pier protruding through the ice cover, (c) top view of the ice cover, and (d) fill holes used to allow the added water weight to enter above the ice cover.

Figure 3.
Bottom surface of the ice cover: (a) smooth condition, and (b) rough condition.

Figure 4.
Rough ice cover: (a) individual panel, and (b) contour plot of the surface elevation of an individual panel.
Figure 4.
Rough ice cover: (a) individual panel, and (b) contour plot of the surface elevation of an individual panel.

Figure 5.
ADV setup with side-looking head protruding through the ice cover.

Figure 6.
Post-test scanning procedure.

Figure 7.
Velocity (u) profiles for Open, Floating, and submerged conditions: (a) smooth ice cover, and (b) rough ice cover.
Figure 7.
Velocity (u) profiles for Open, Floating, and submerged conditions: (a) smooth ice cover, and (b) rough ice cover.

Figure 8.
Scour contour plot for the Open trial.

Figure 9.
Scour contour plot comparison for the Floating and submerged trials.

Figure 10.
(a) Additional scour induced by the ice cover, and (b) the relationship between nondimensionalized maximum scour depth (ds) and pier Froude number.
Figure 10.
(a) Additional scour induced by the ice cover, and (b) the relationship between nondimensionalized maximum scour depth (ds) and pier Froude number.


Table 1.
Experimental trials.
| Test | si (m) | yi (m) | Ice Cover Roughness | Water Temperature (°C) | Reynolds Number | Stream Froude Number | Pier Froude Number |
|---|---|---|---|---|---|---|---|
| Open | - | - | - | 20 | 41,237 | 0.163 | 0.055 |
| SF | 0.000 (Floating) | 0.250 | Smooth | 20 | 91,187 | 0.104 | 0.052 |
| S1 | 0.015 | 0.235 | Smooth | 20 | 90,329 | 0.112 | 0.056 |
| S2 | 0.030 | 0.220 | Smooth | 20 | 99,949 | 0.135 | 0.077 |
| S3 | 0.045 | 0.205 | Smooth | 20 | 99,960 | 0.148 | 0.088 |
| S4 | 0.060 | 0.190 | Smooth | 20 | 100,299 | 0.164 | 0.101 |
| S5 | 0.075 | 0.175 | Smooth | 20 | 107,527 | 0.196 | 0.134 |
| RF | 0.000 (Floating) | 0.250 | Rough | 20 | 95,501 | 0.109 | 0.057 |
| R1 | 0.015 | 0.235 | Rough | 20 | 97,901 | 0.121 | 0.066 |
| R2 | 0.030 | 0.220 | Rough | 20 | 100,791 | 0.136 | 0.079 |
| R3 | 0.045 | 0.205 | Rough | 20 | 102,657 | 0.152 | 0.092 |
| R4 | 0.060 | 0.190 | Rough | 20 | 103,761 | 0.170 | 0.108 |
| R5 | 0.075 | 0.175 | Rough | 20 | 106,497 | 0.195 | 0.132 |
Table 2.
Scour results.
| Test | ds (m) | Increase in ds (%) |
|---|---|---|
| Open | 0.025 | - |
| SF | 0.035 | 40 |
| S1 | 0.044 | 76 |
| S2 | 0.062 | 148 |
| S3 | 0.079 | 216 |
| S4 | 0.090 | 260 |
| S5 | 0.109 | 336 |
| RF | 0.038 | 52 |
| R1 | 0.048 | 92 |
| R2 | 0.074 | 196 |
| R3 | 0.088 | 252 |
| R4 | 0.107 | 328 |
| R5 | 0.128 | 412 |
Publisher’s Note: MDPI stays neutral with regard to jurisdictional claims in published maps and institutional affiliations. |
© 2021 by the authors. Licensee MDPI, Basel, Switzerland. This article is an open access article distributed under the terms and conditions of the Creative Commons Attribution (CC BY) license (http://creativecommons.org/licenses/by/4.0/).
Share and Cite
MDPI and ACS Style
Valela, C.; Sirianni, D.A.B.; Nistor, I.; Rennie, C.D.; Almansour, H. Bridge Pier Scour under Ice Cover. Water 2021, 13, 536. https://doi.org/10.3390/w13040536
AMA Style
Valela C, Sirianni DAB, Nistor I, Rennie CD, Almansour H. Bridge Pier Scour under Ice Cover. Water. 2021; 13(4):536. https://doi.org/10.3390/w13040536
Chicago/Turabian StyleValela, Christopher, Dario A. B. Sirianni, Ioan Nistor, Colin D. Rennie, and Husham Almansour. 2021. "Bridge Pier Scour under Ice Cover" Water 13, no. 4: 536. https://doi.org/10.3390/w13040536
Note that from the first issue of 2016, this journal uses article numbers instead of page numbers. See further details here.