
Hydrochemical and Isotopic Characterization of the Waters of the Manglaralto River Basin (Ecuador) to Contribute to the Management of the Coastal Aquifer

 , , , , , and
Abstract
:1. Introduction
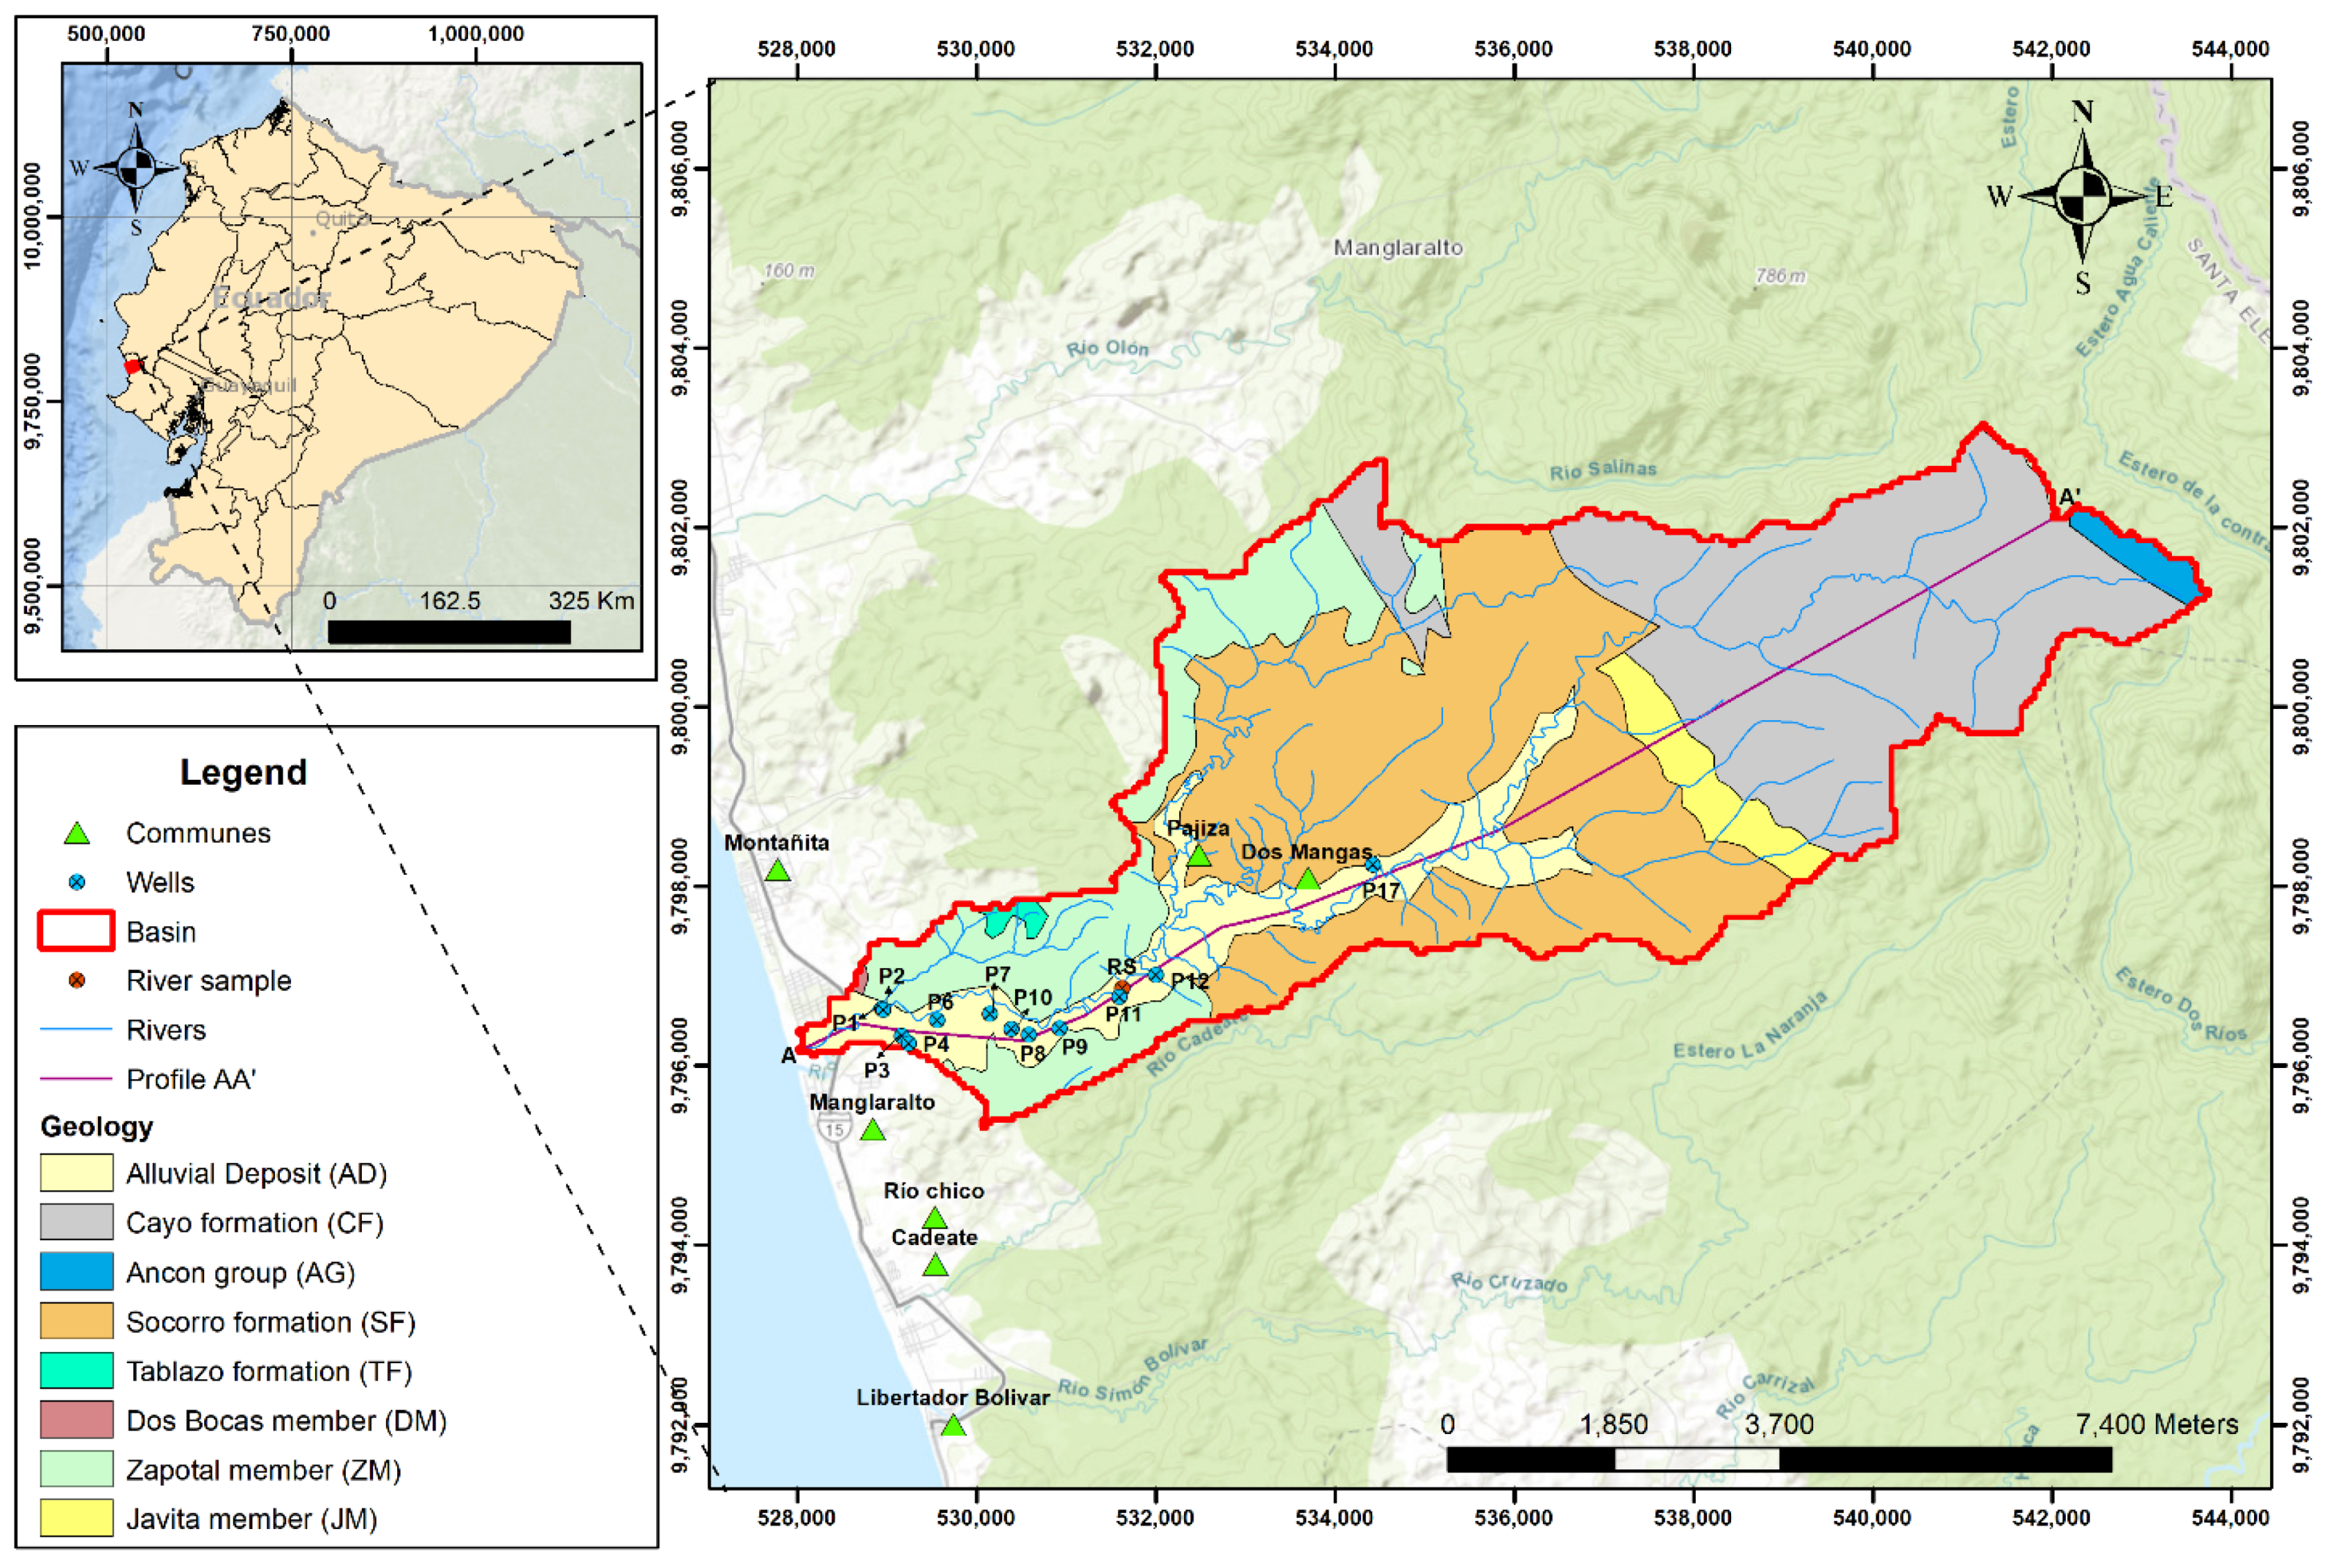
2. Materials and Methods
2.1. Fieldwork and Laboratory Analysis
2.2. Hydrochemistry
2.3. Isotopes
3. Results
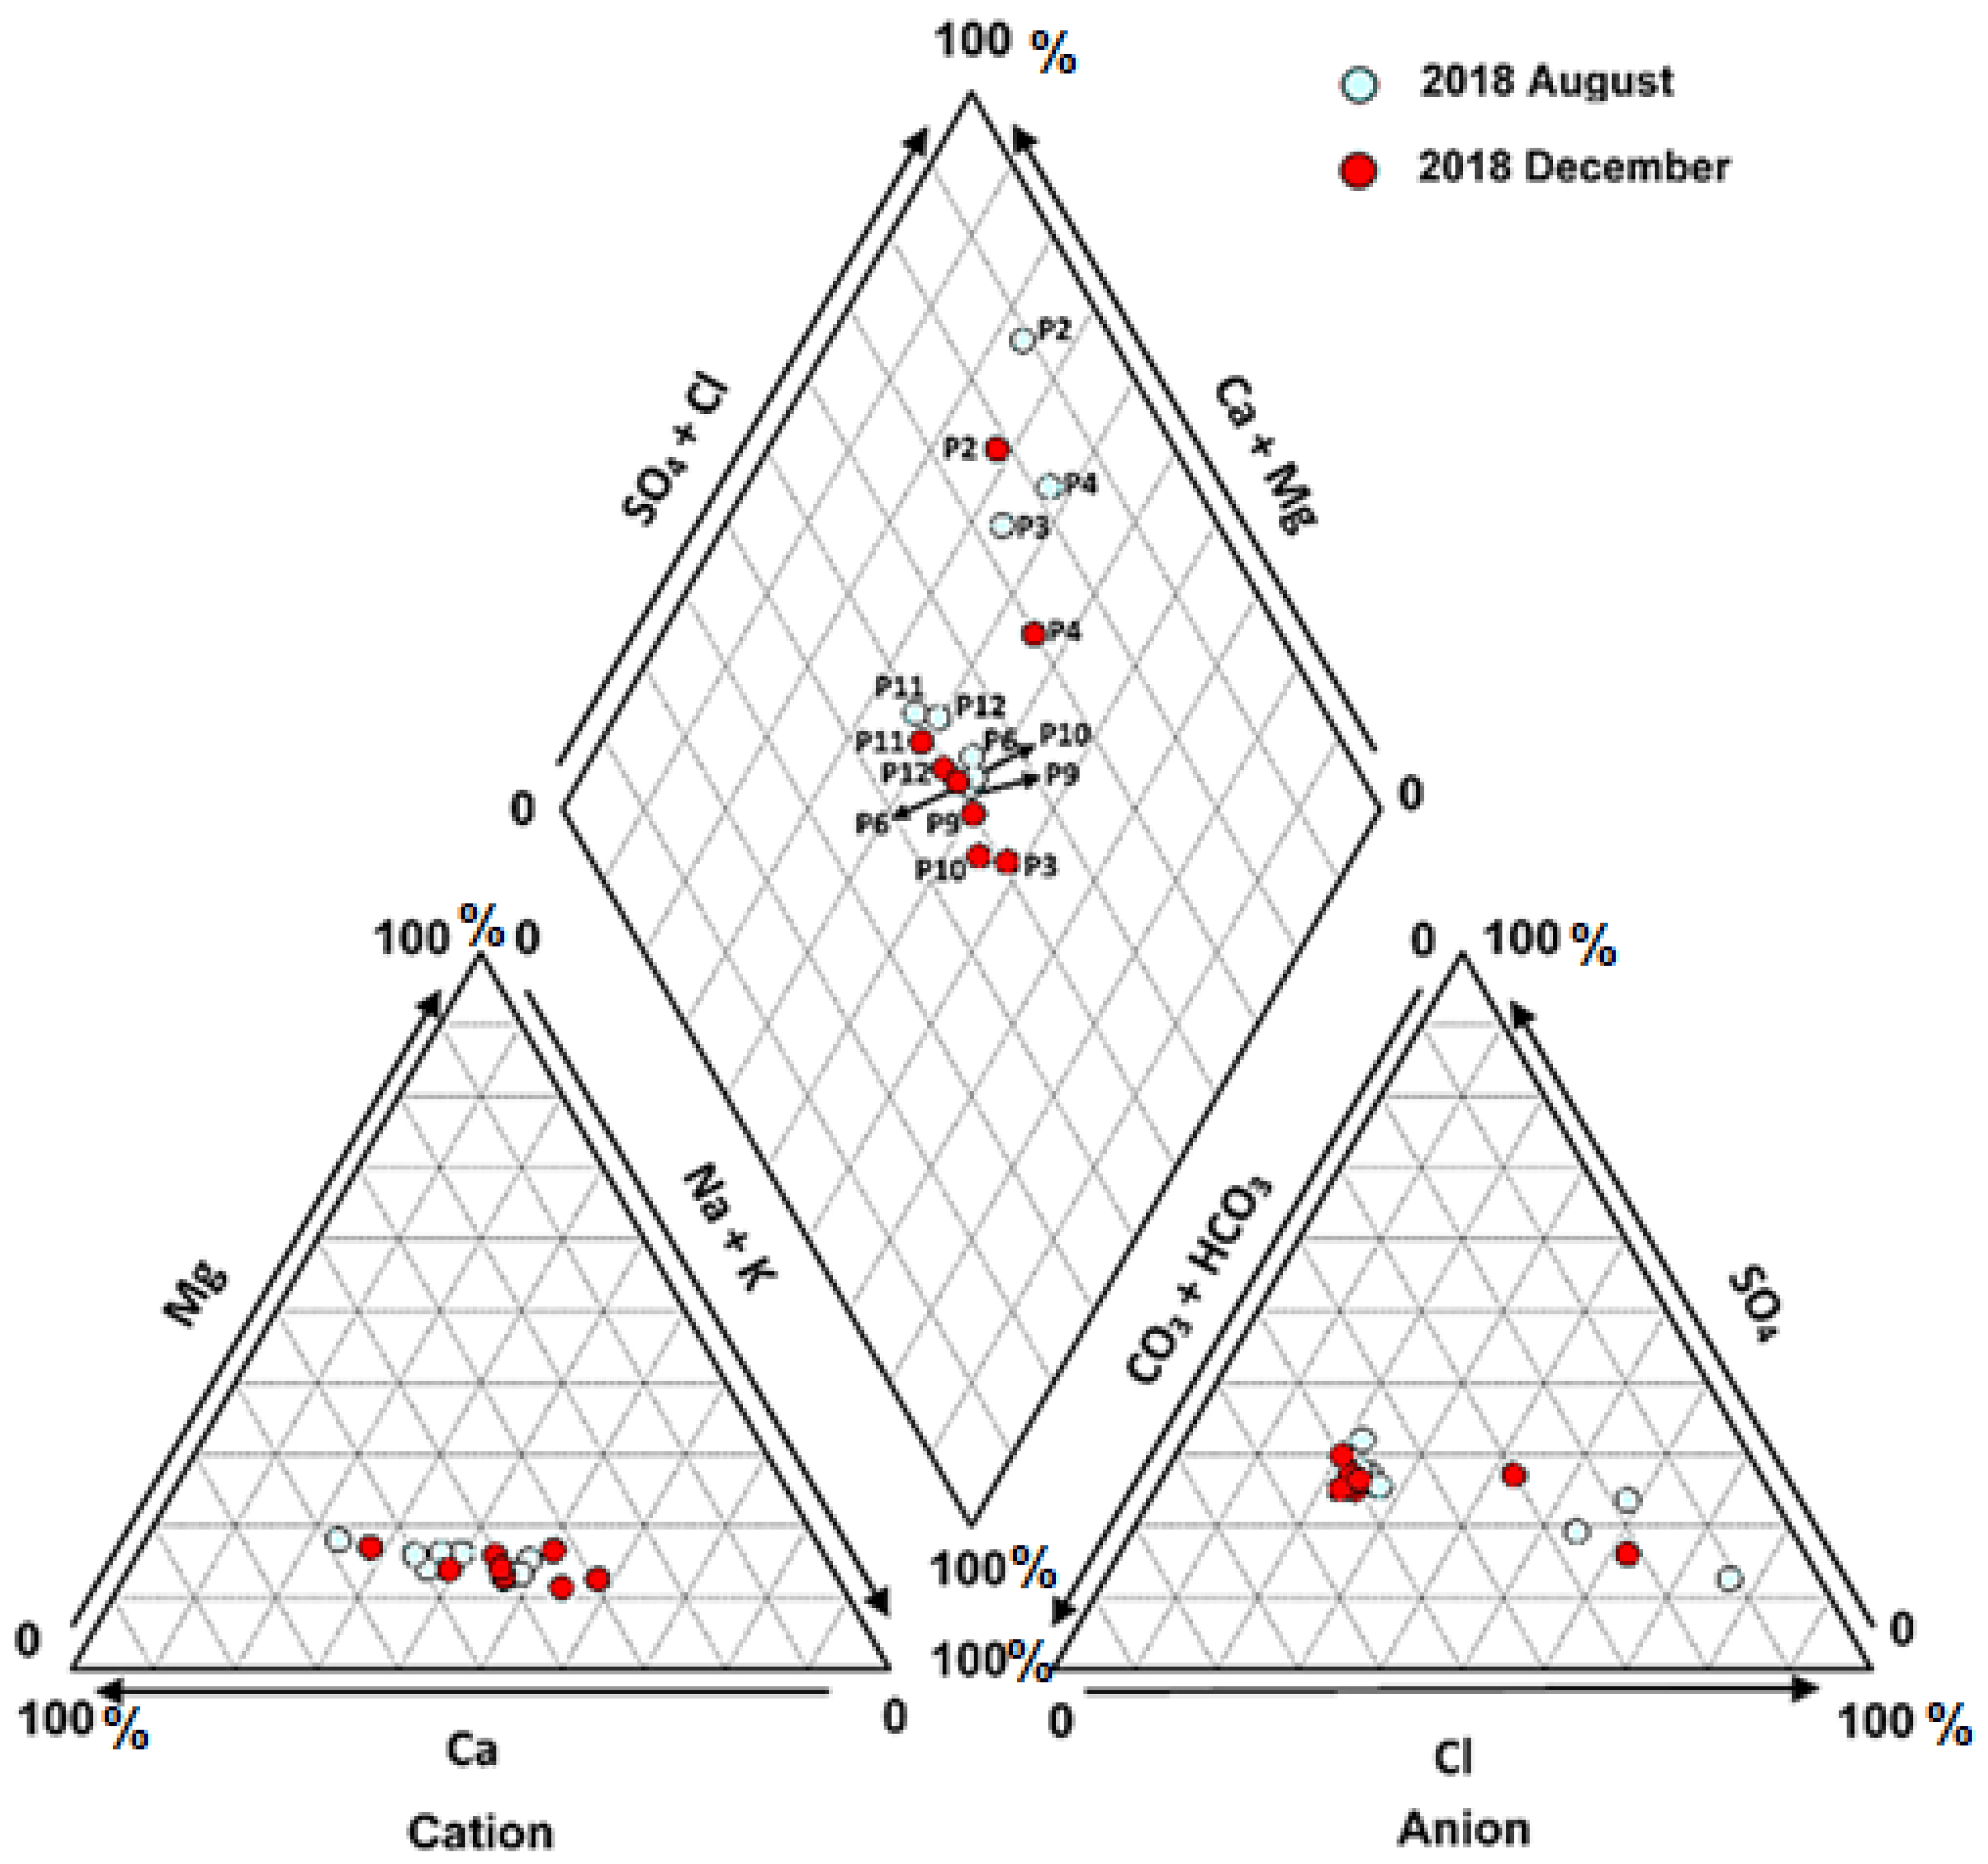
3.1. Hydrochemistry
3.2. Isotopes
4. Discussion
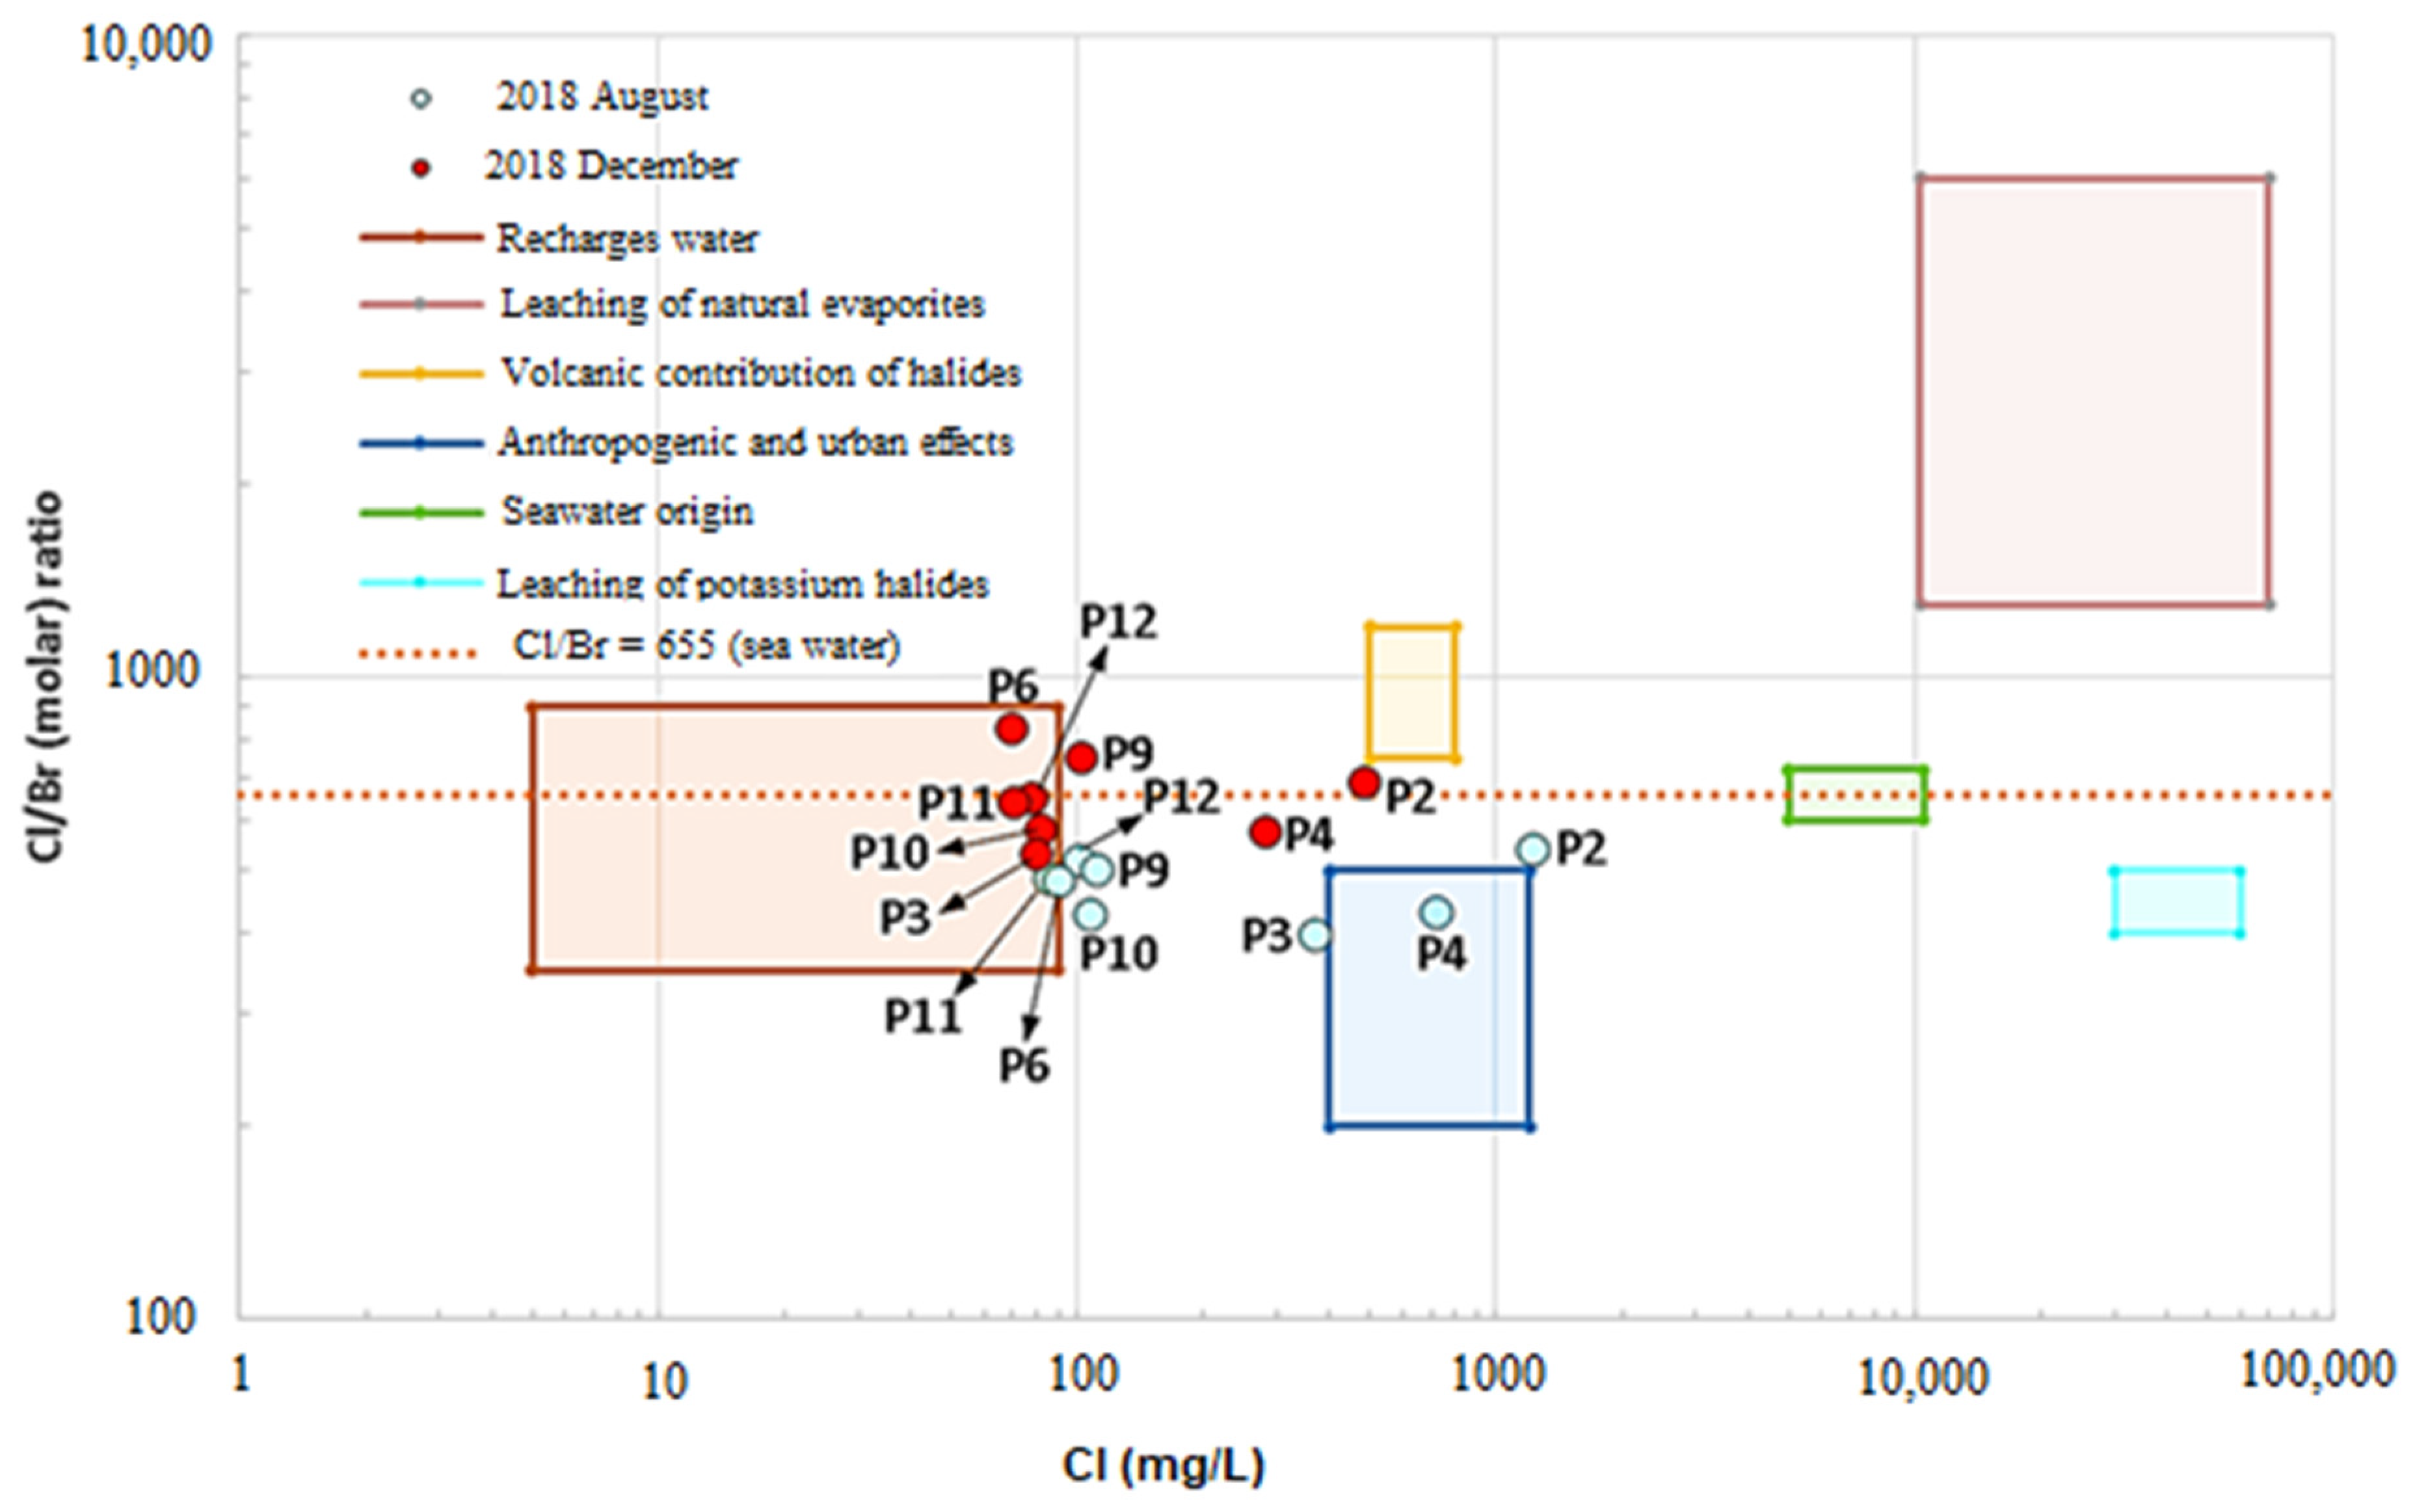
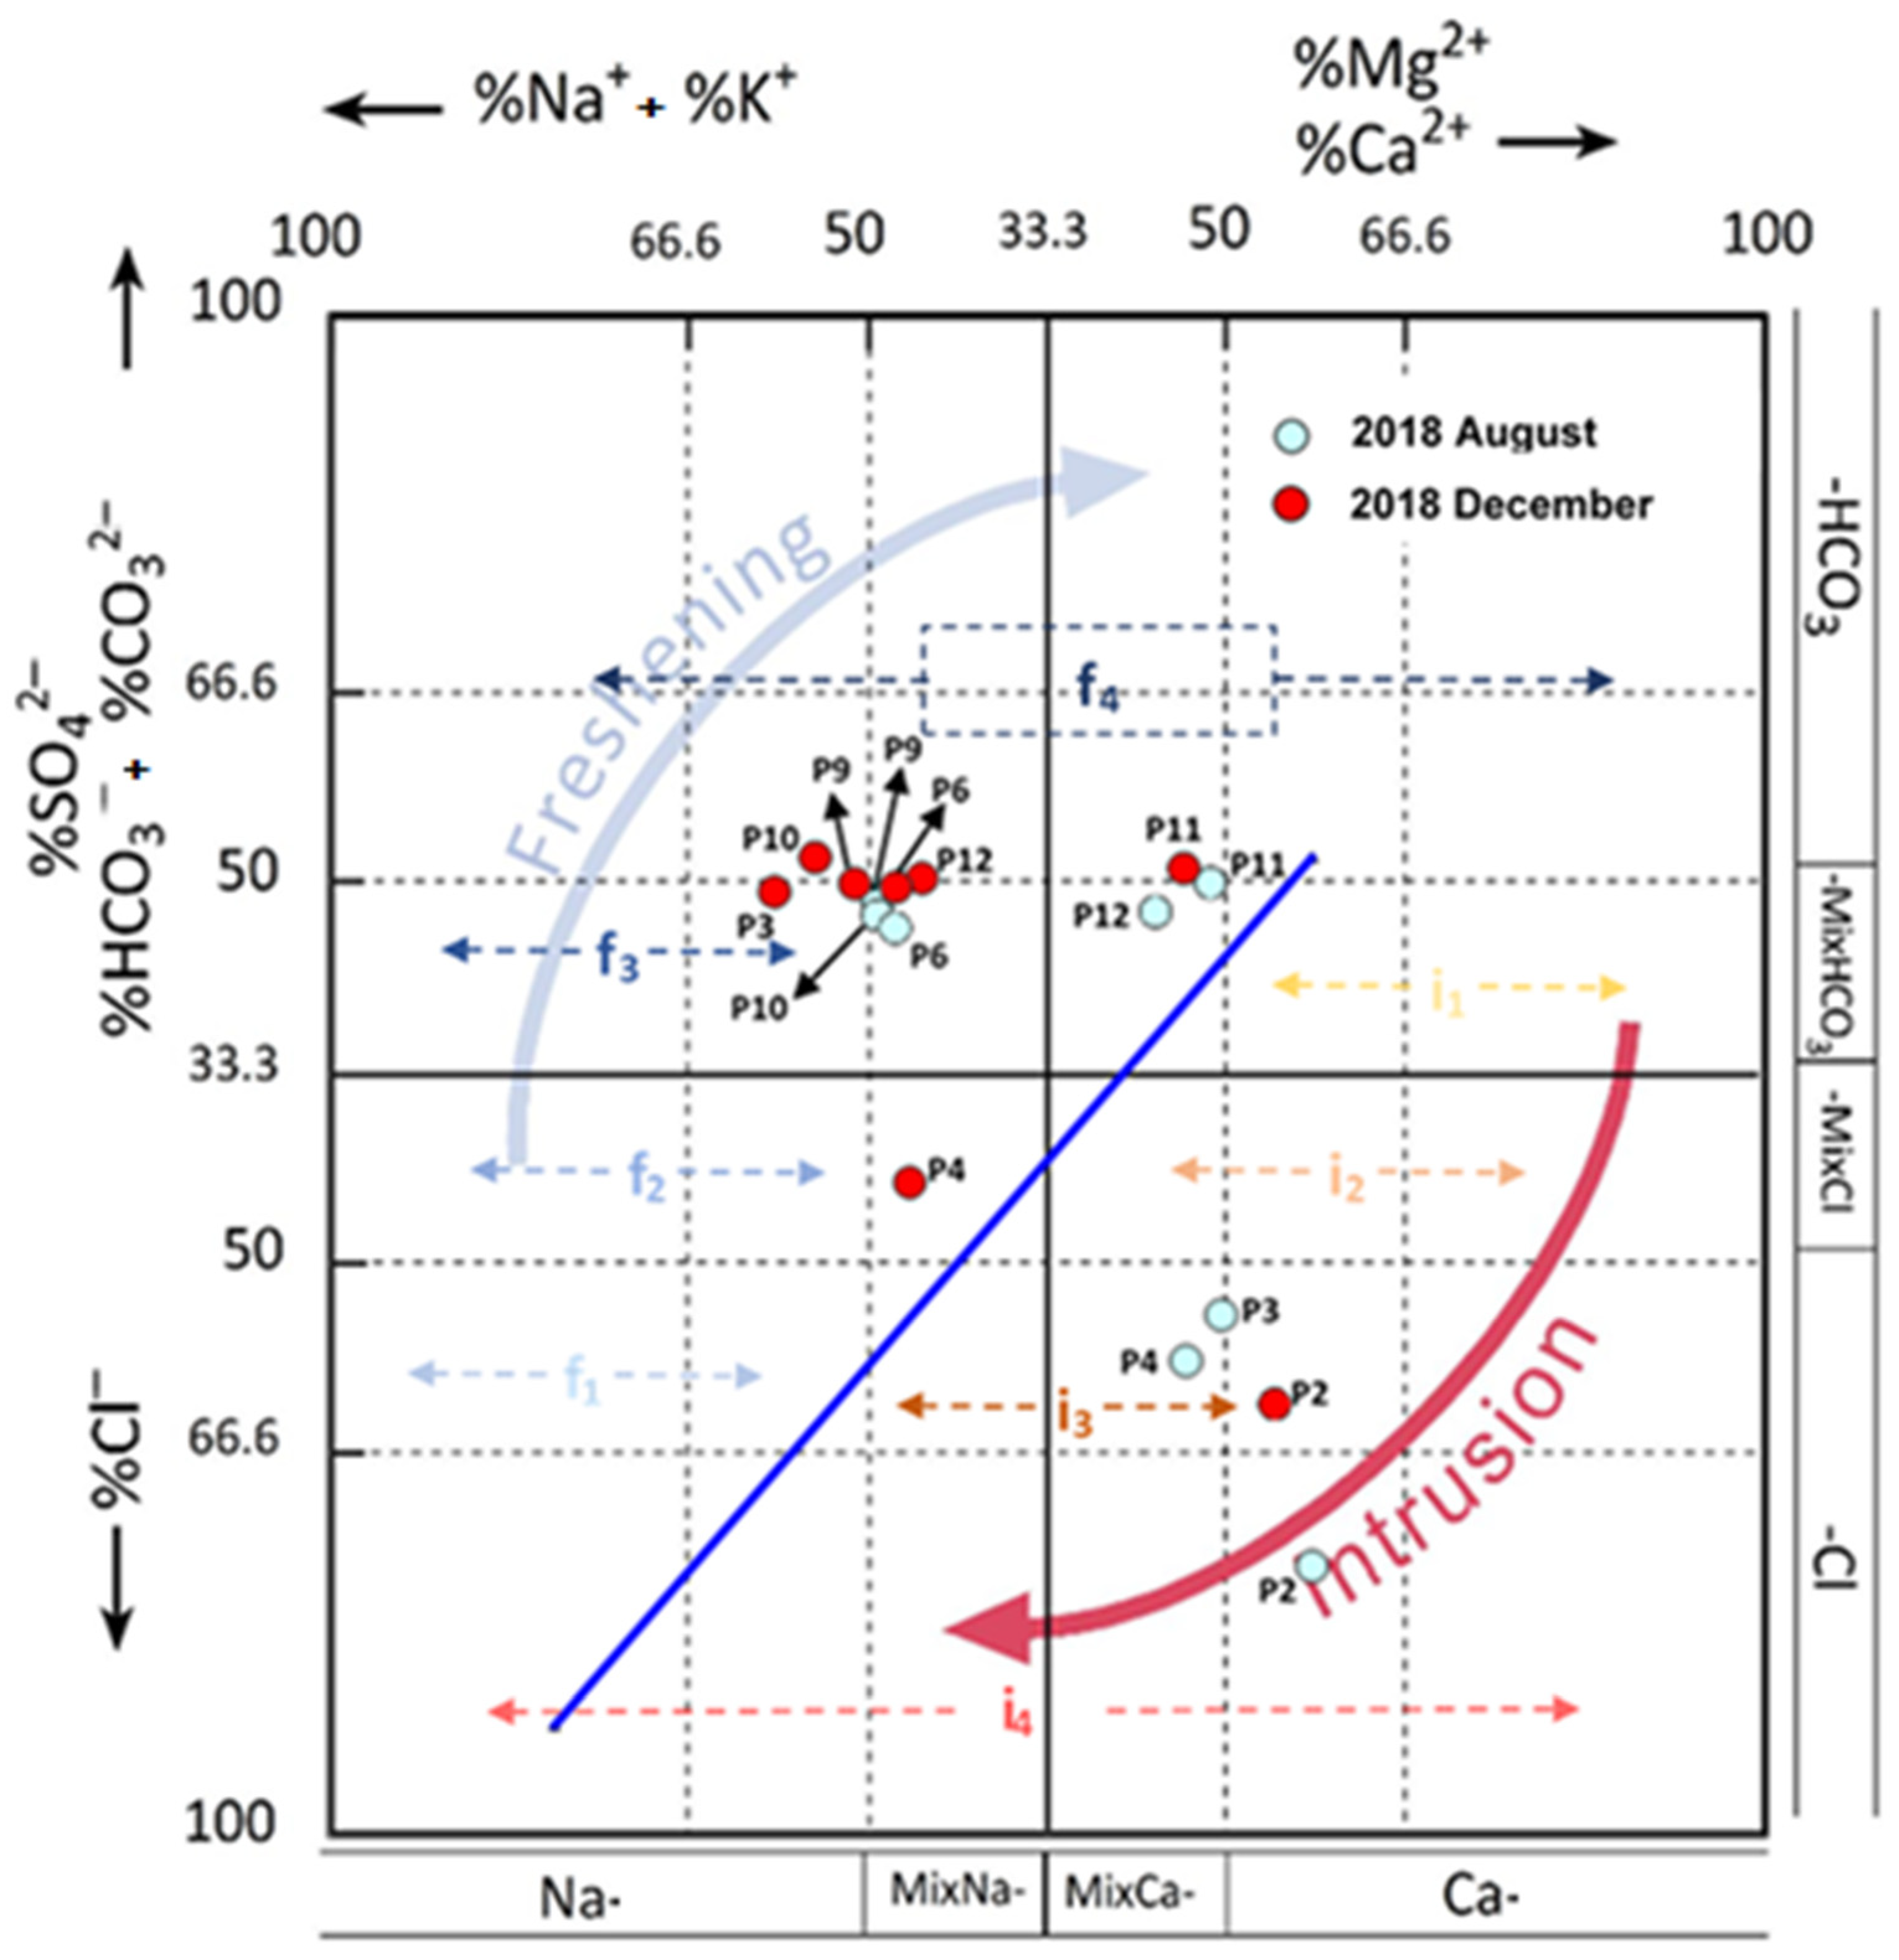
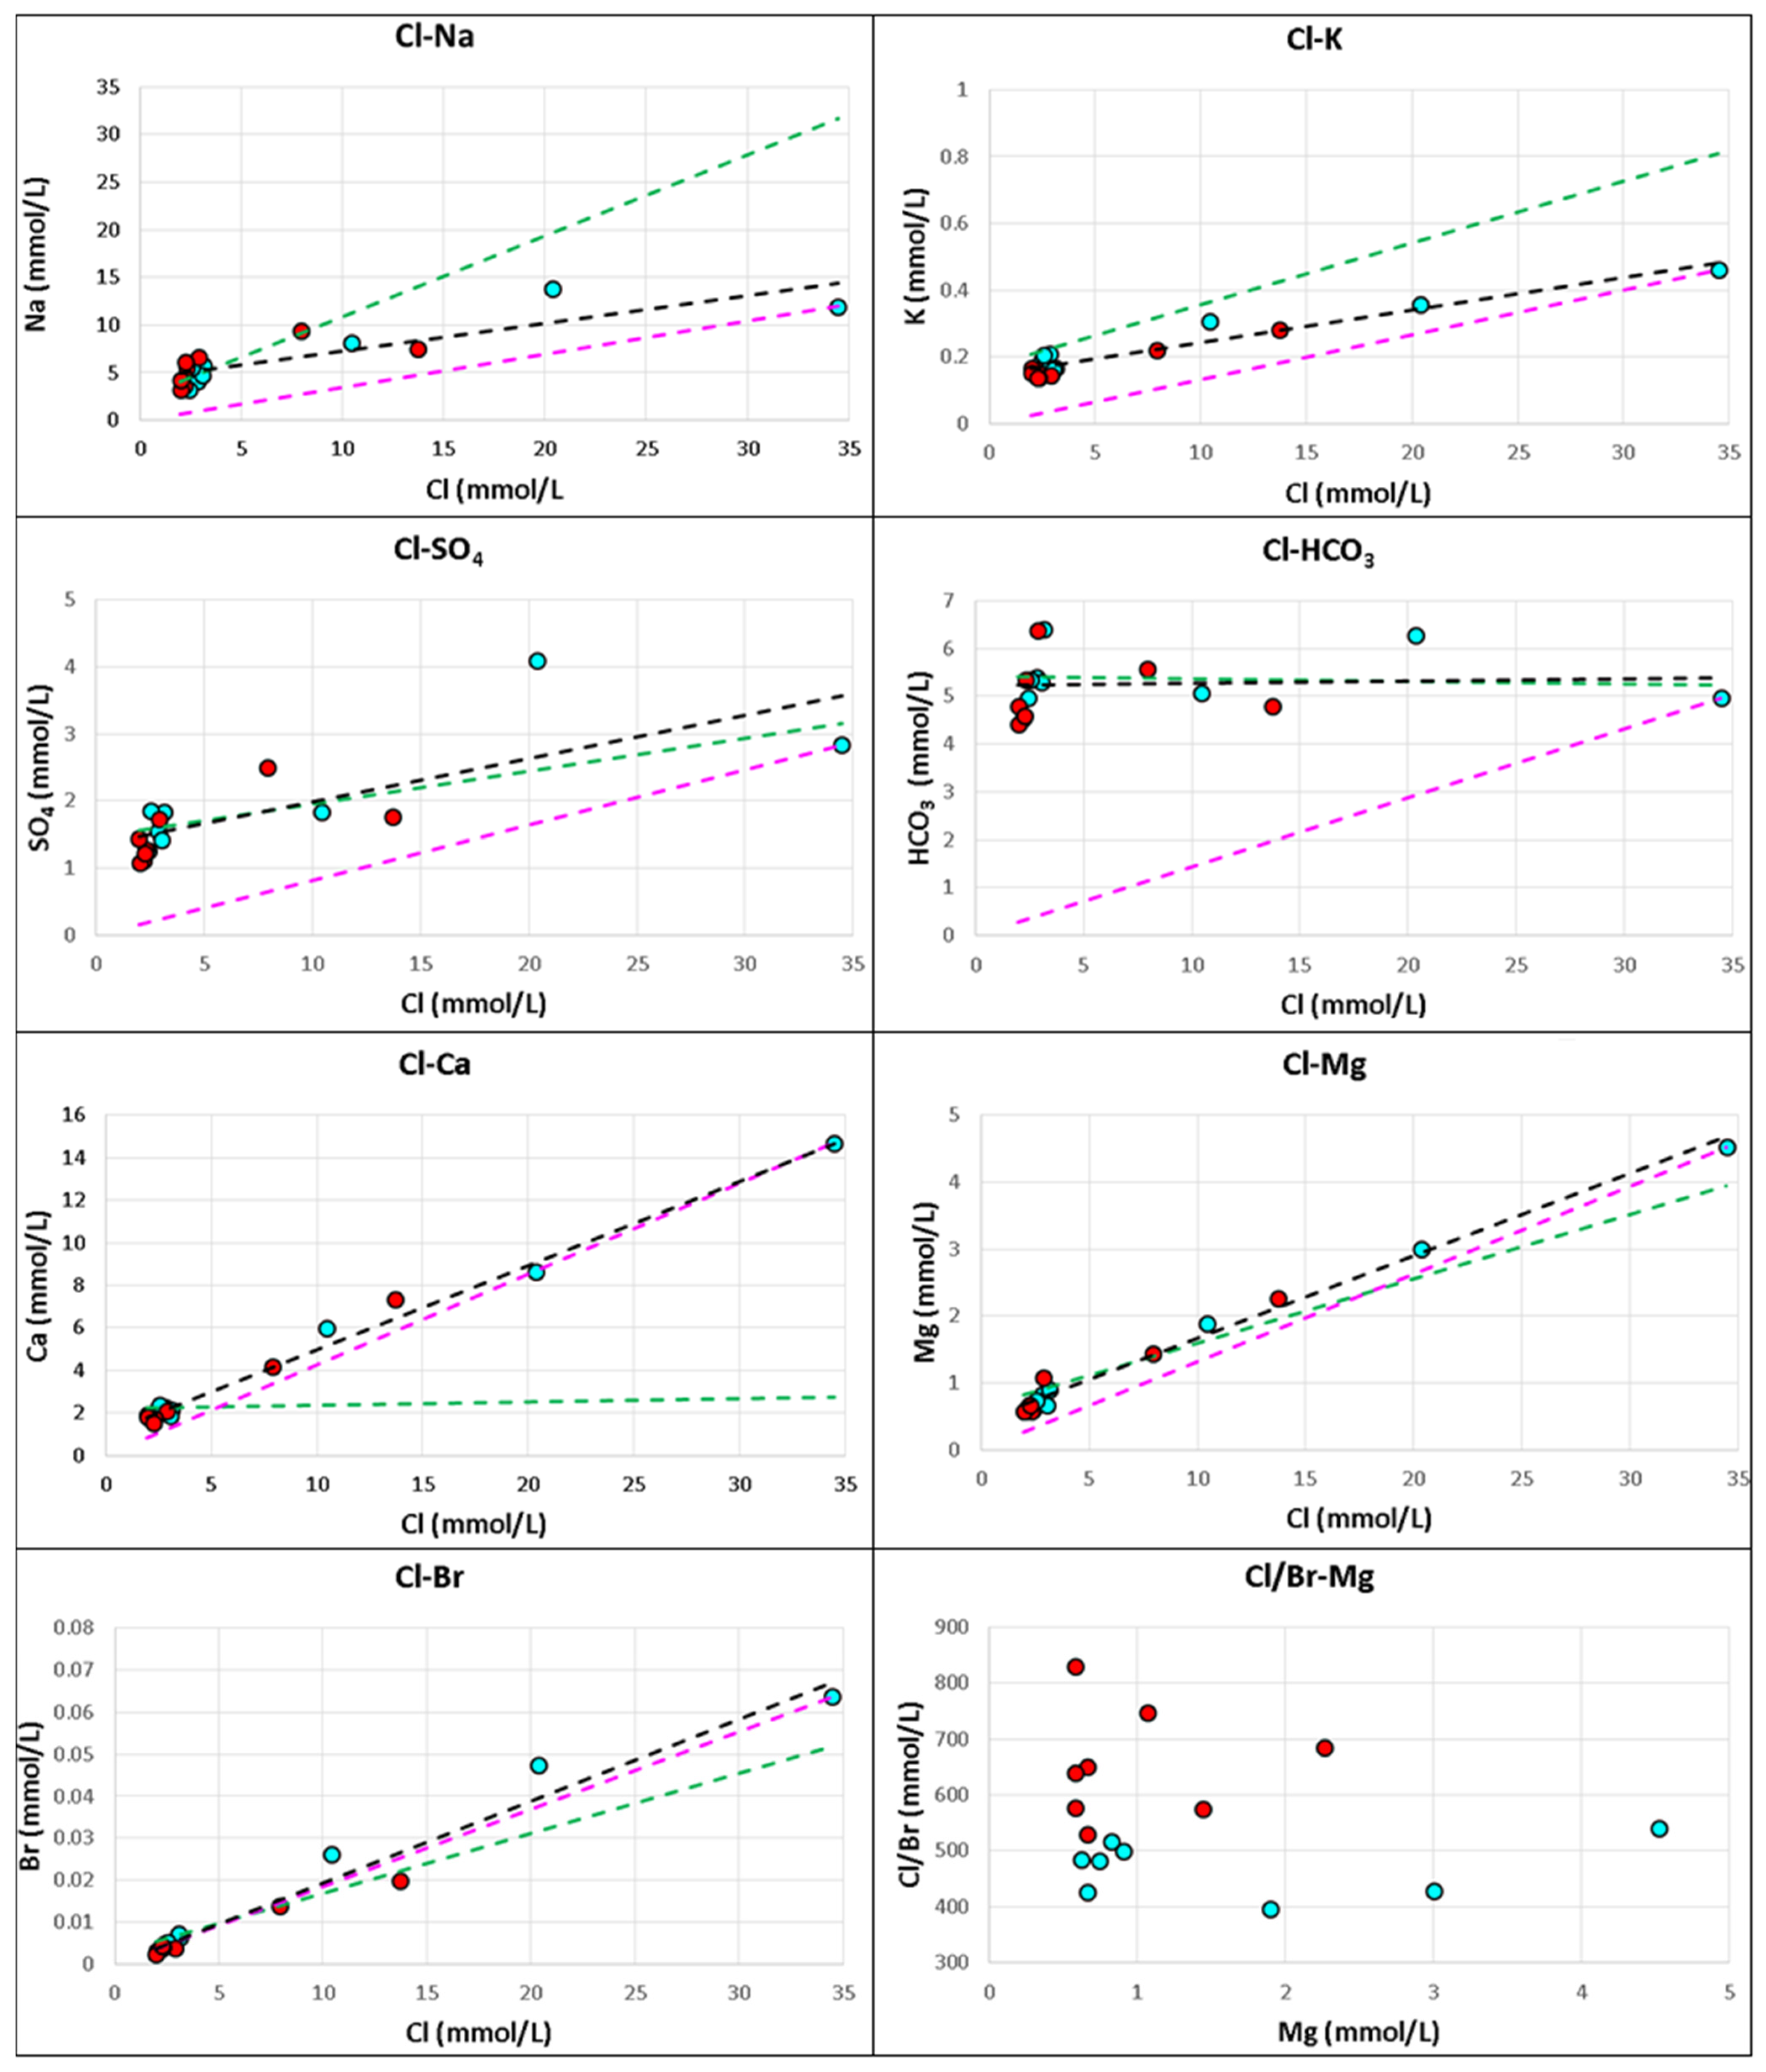
4.1. Hydrochemistry
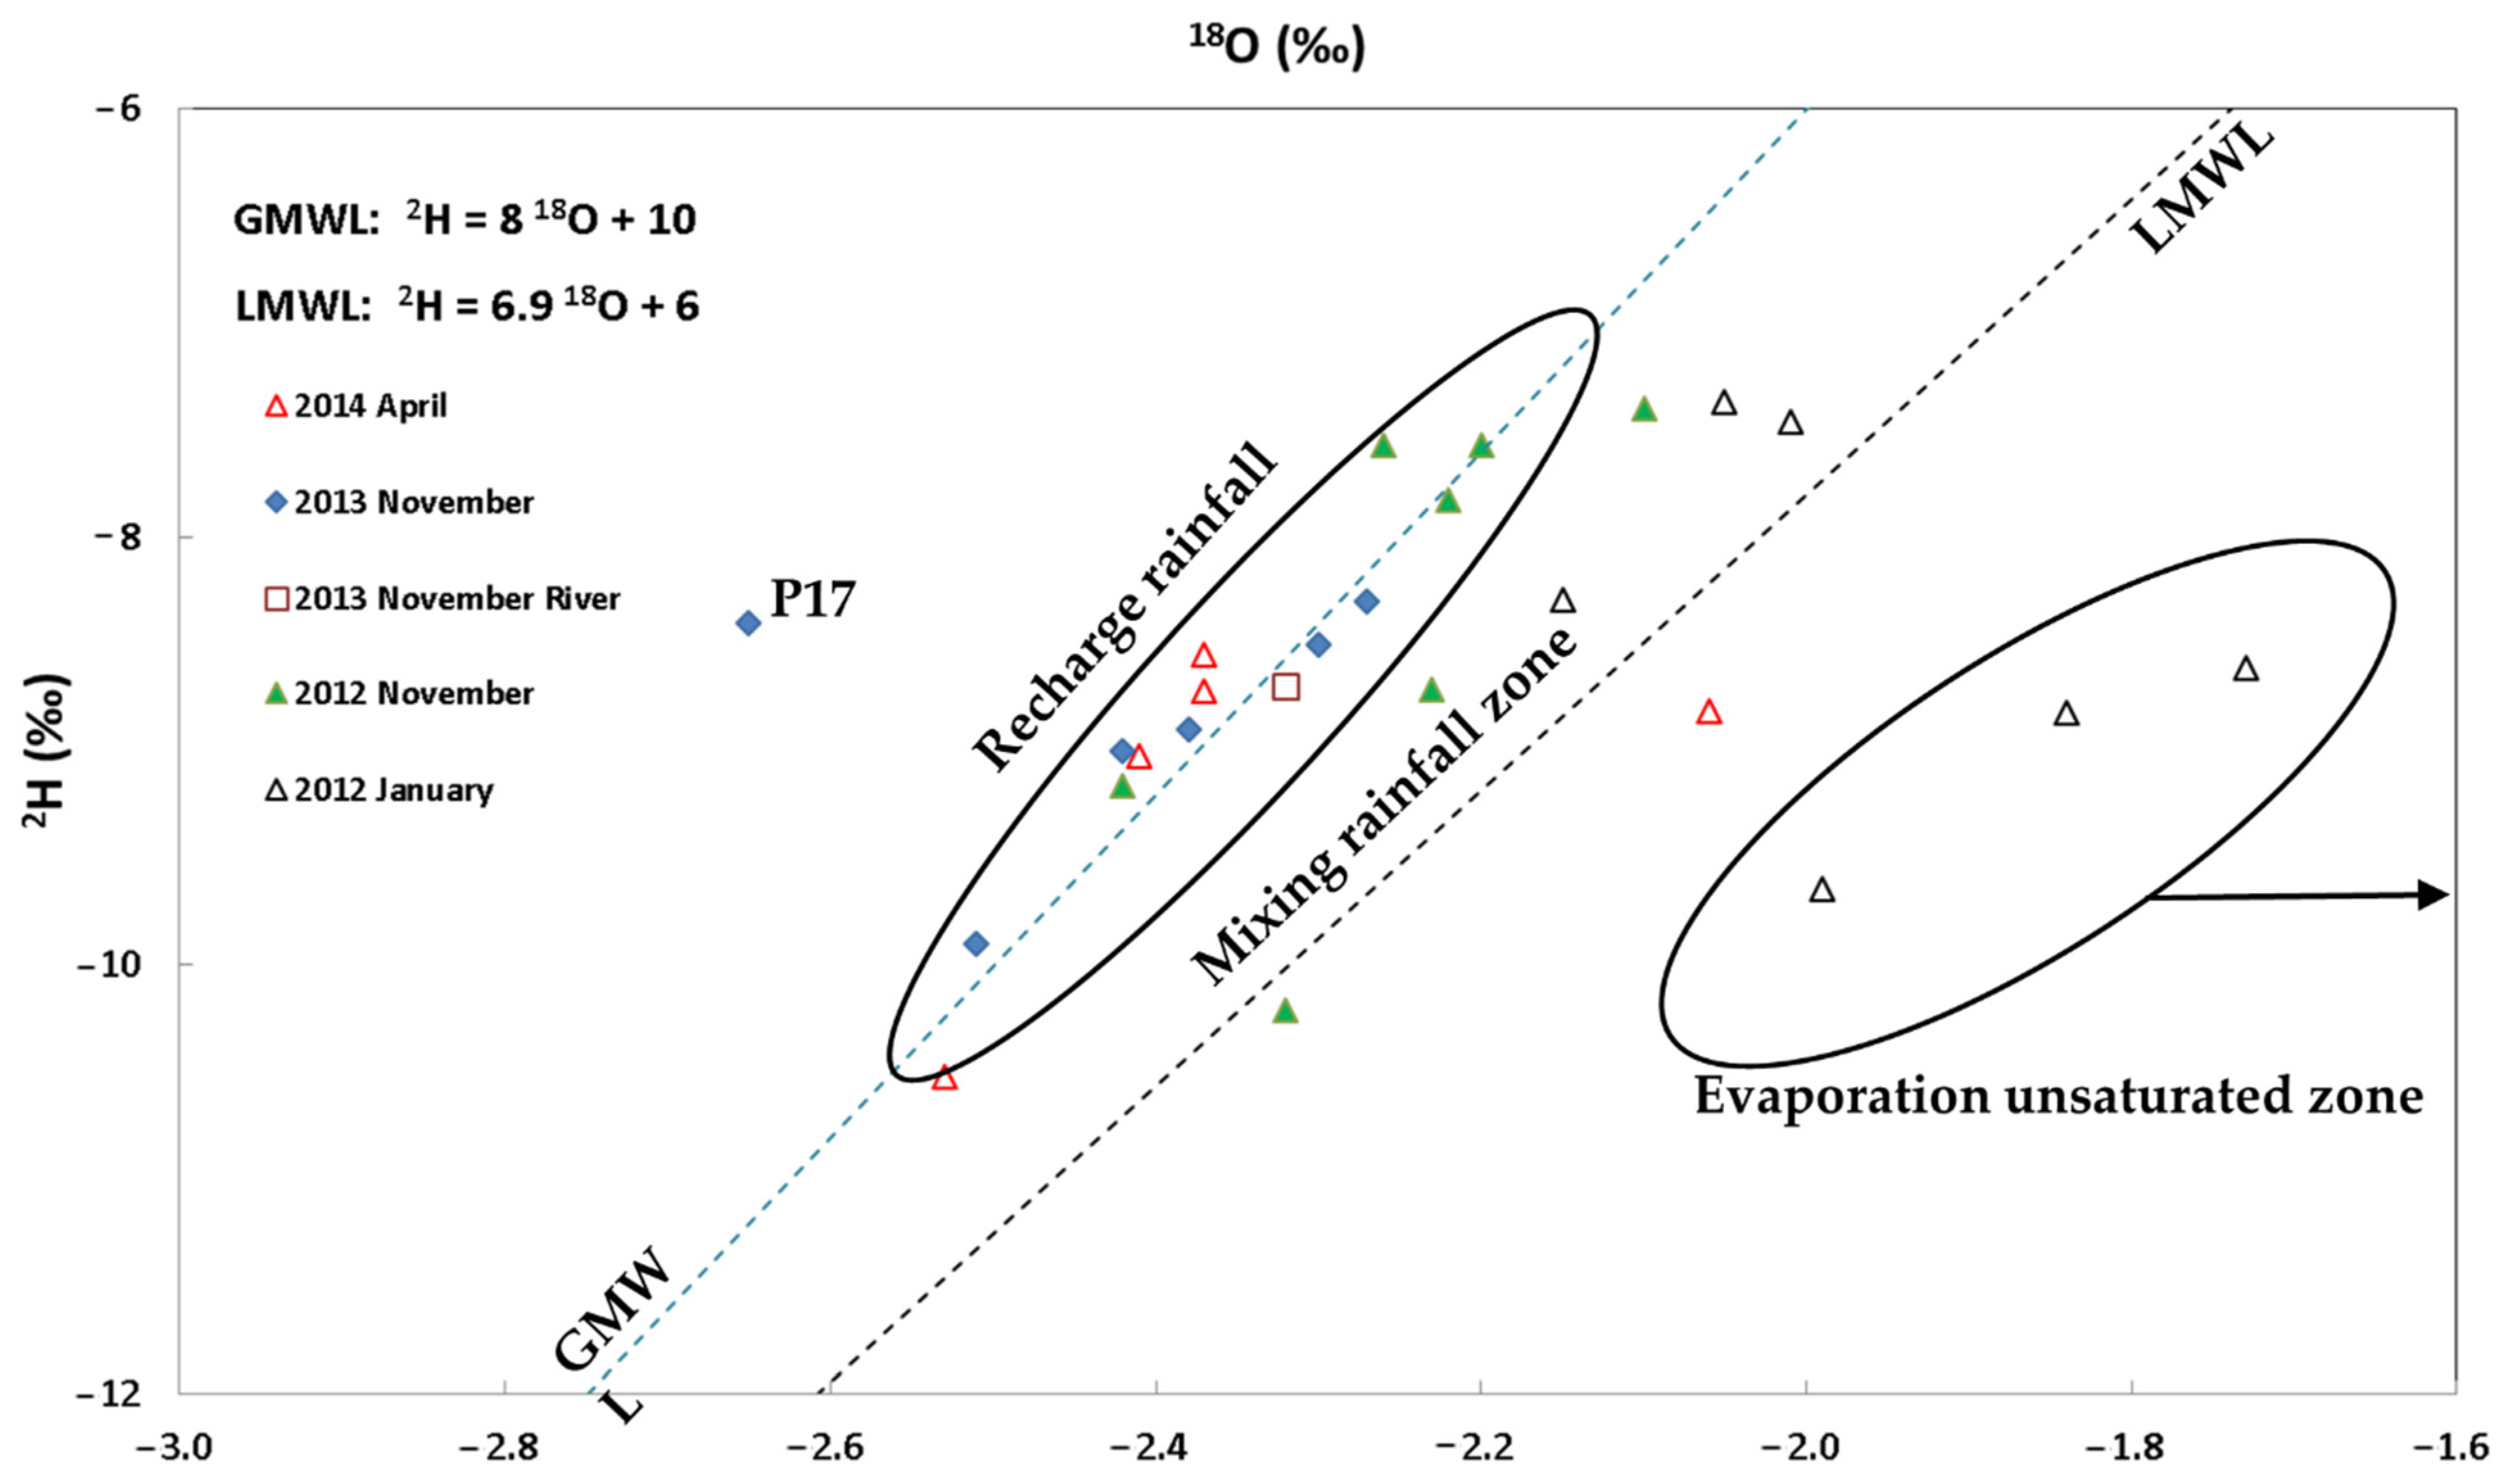
4.2. Isotopes
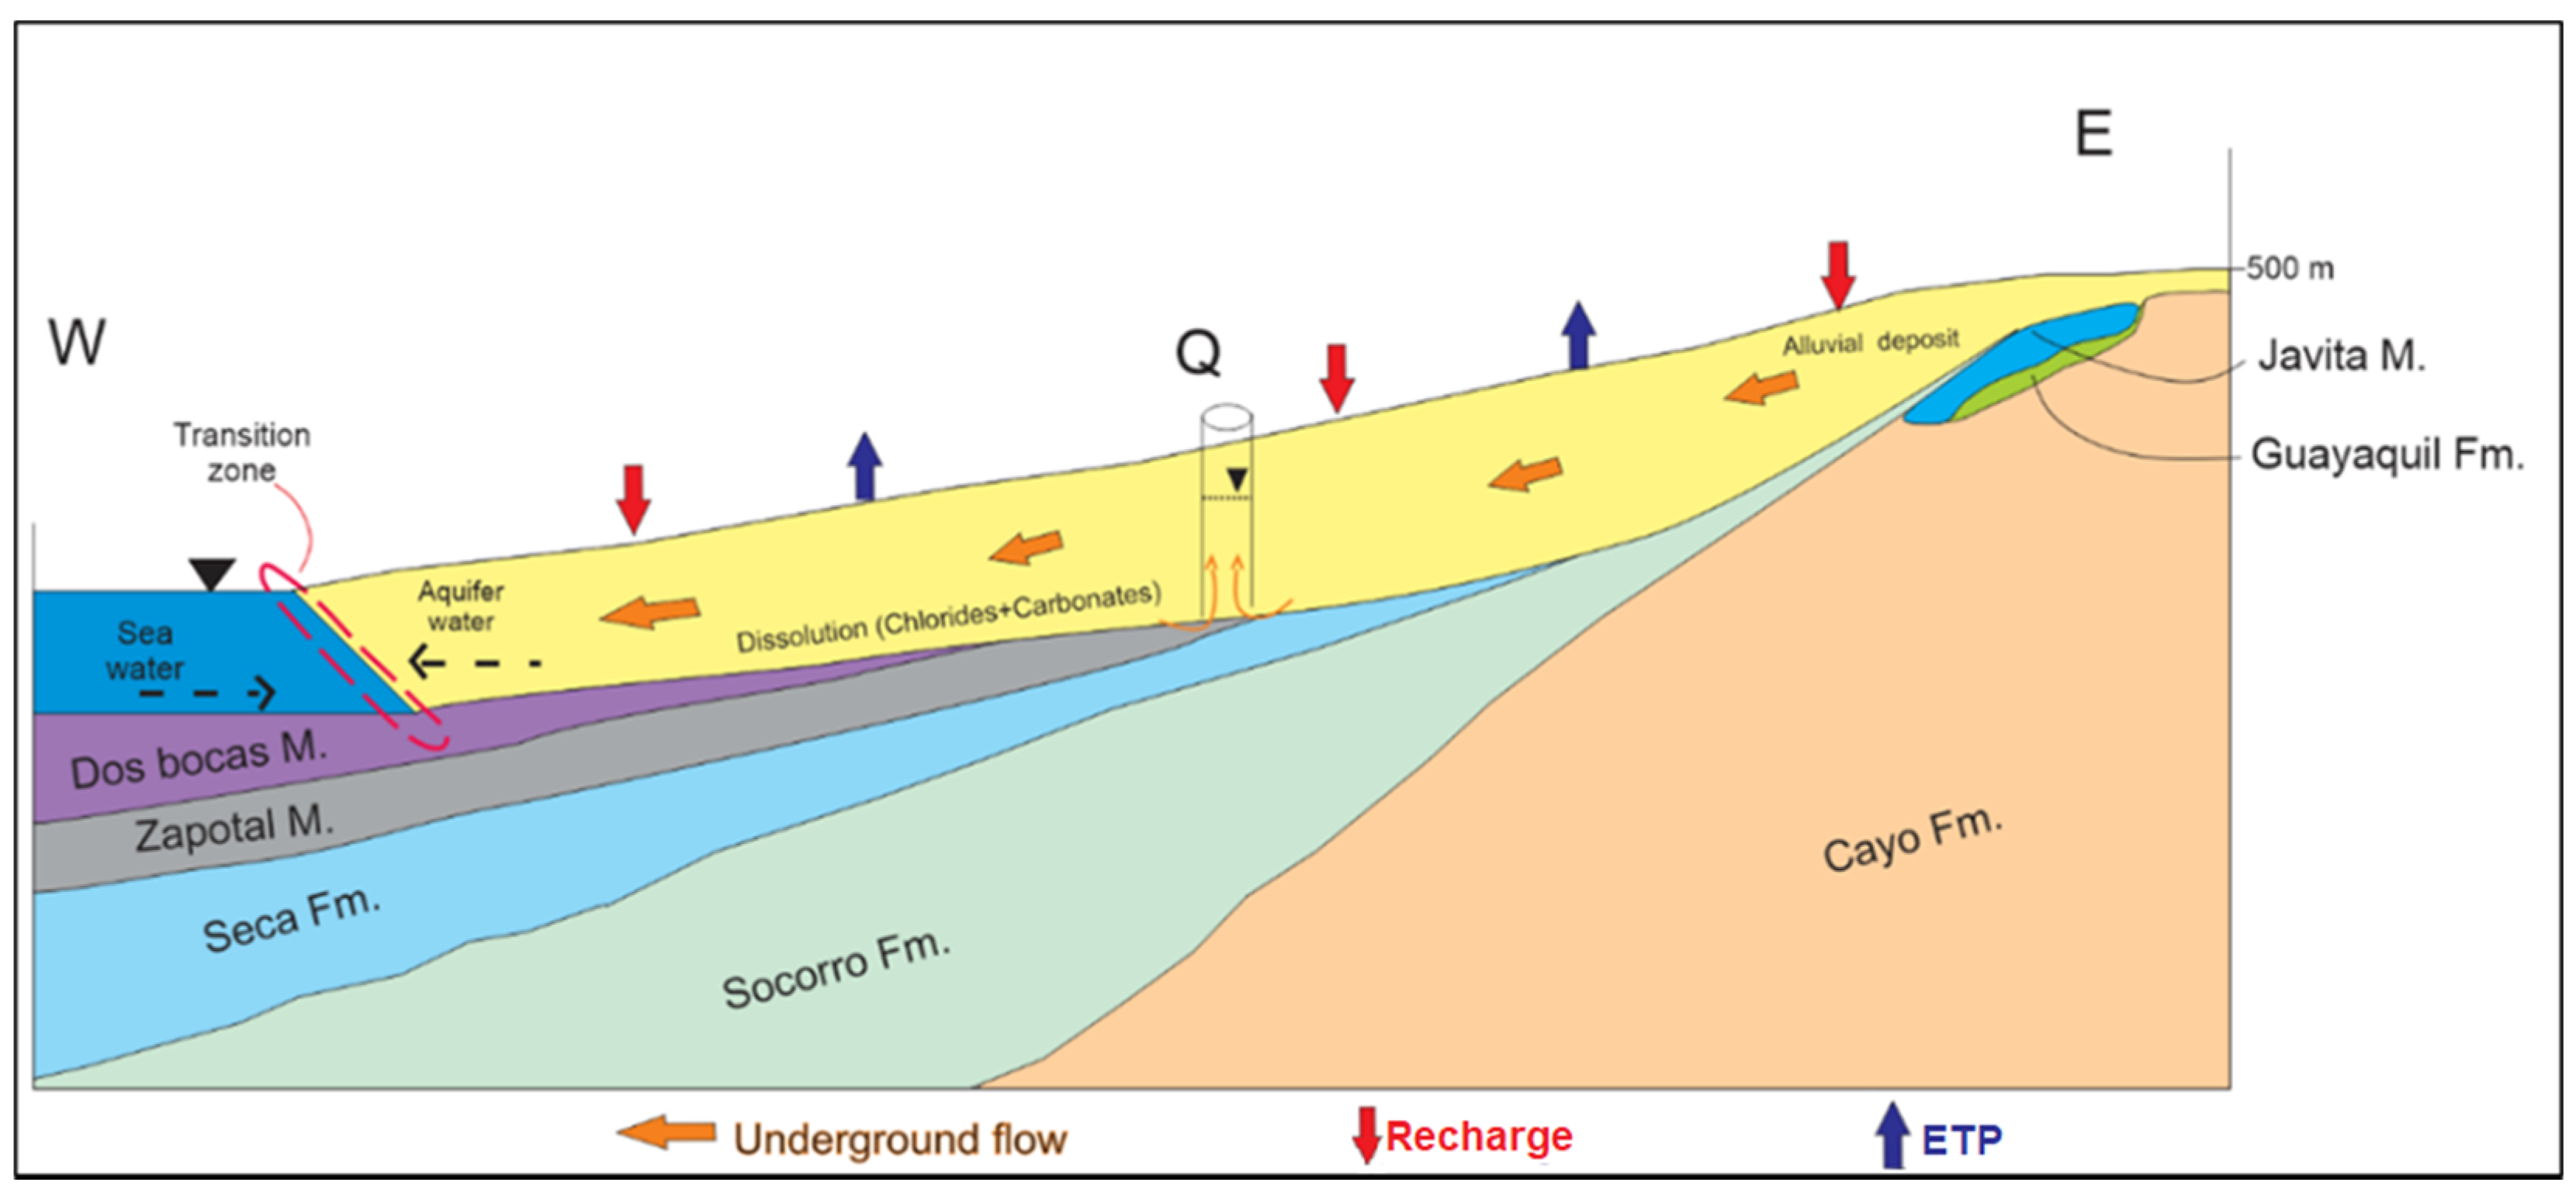
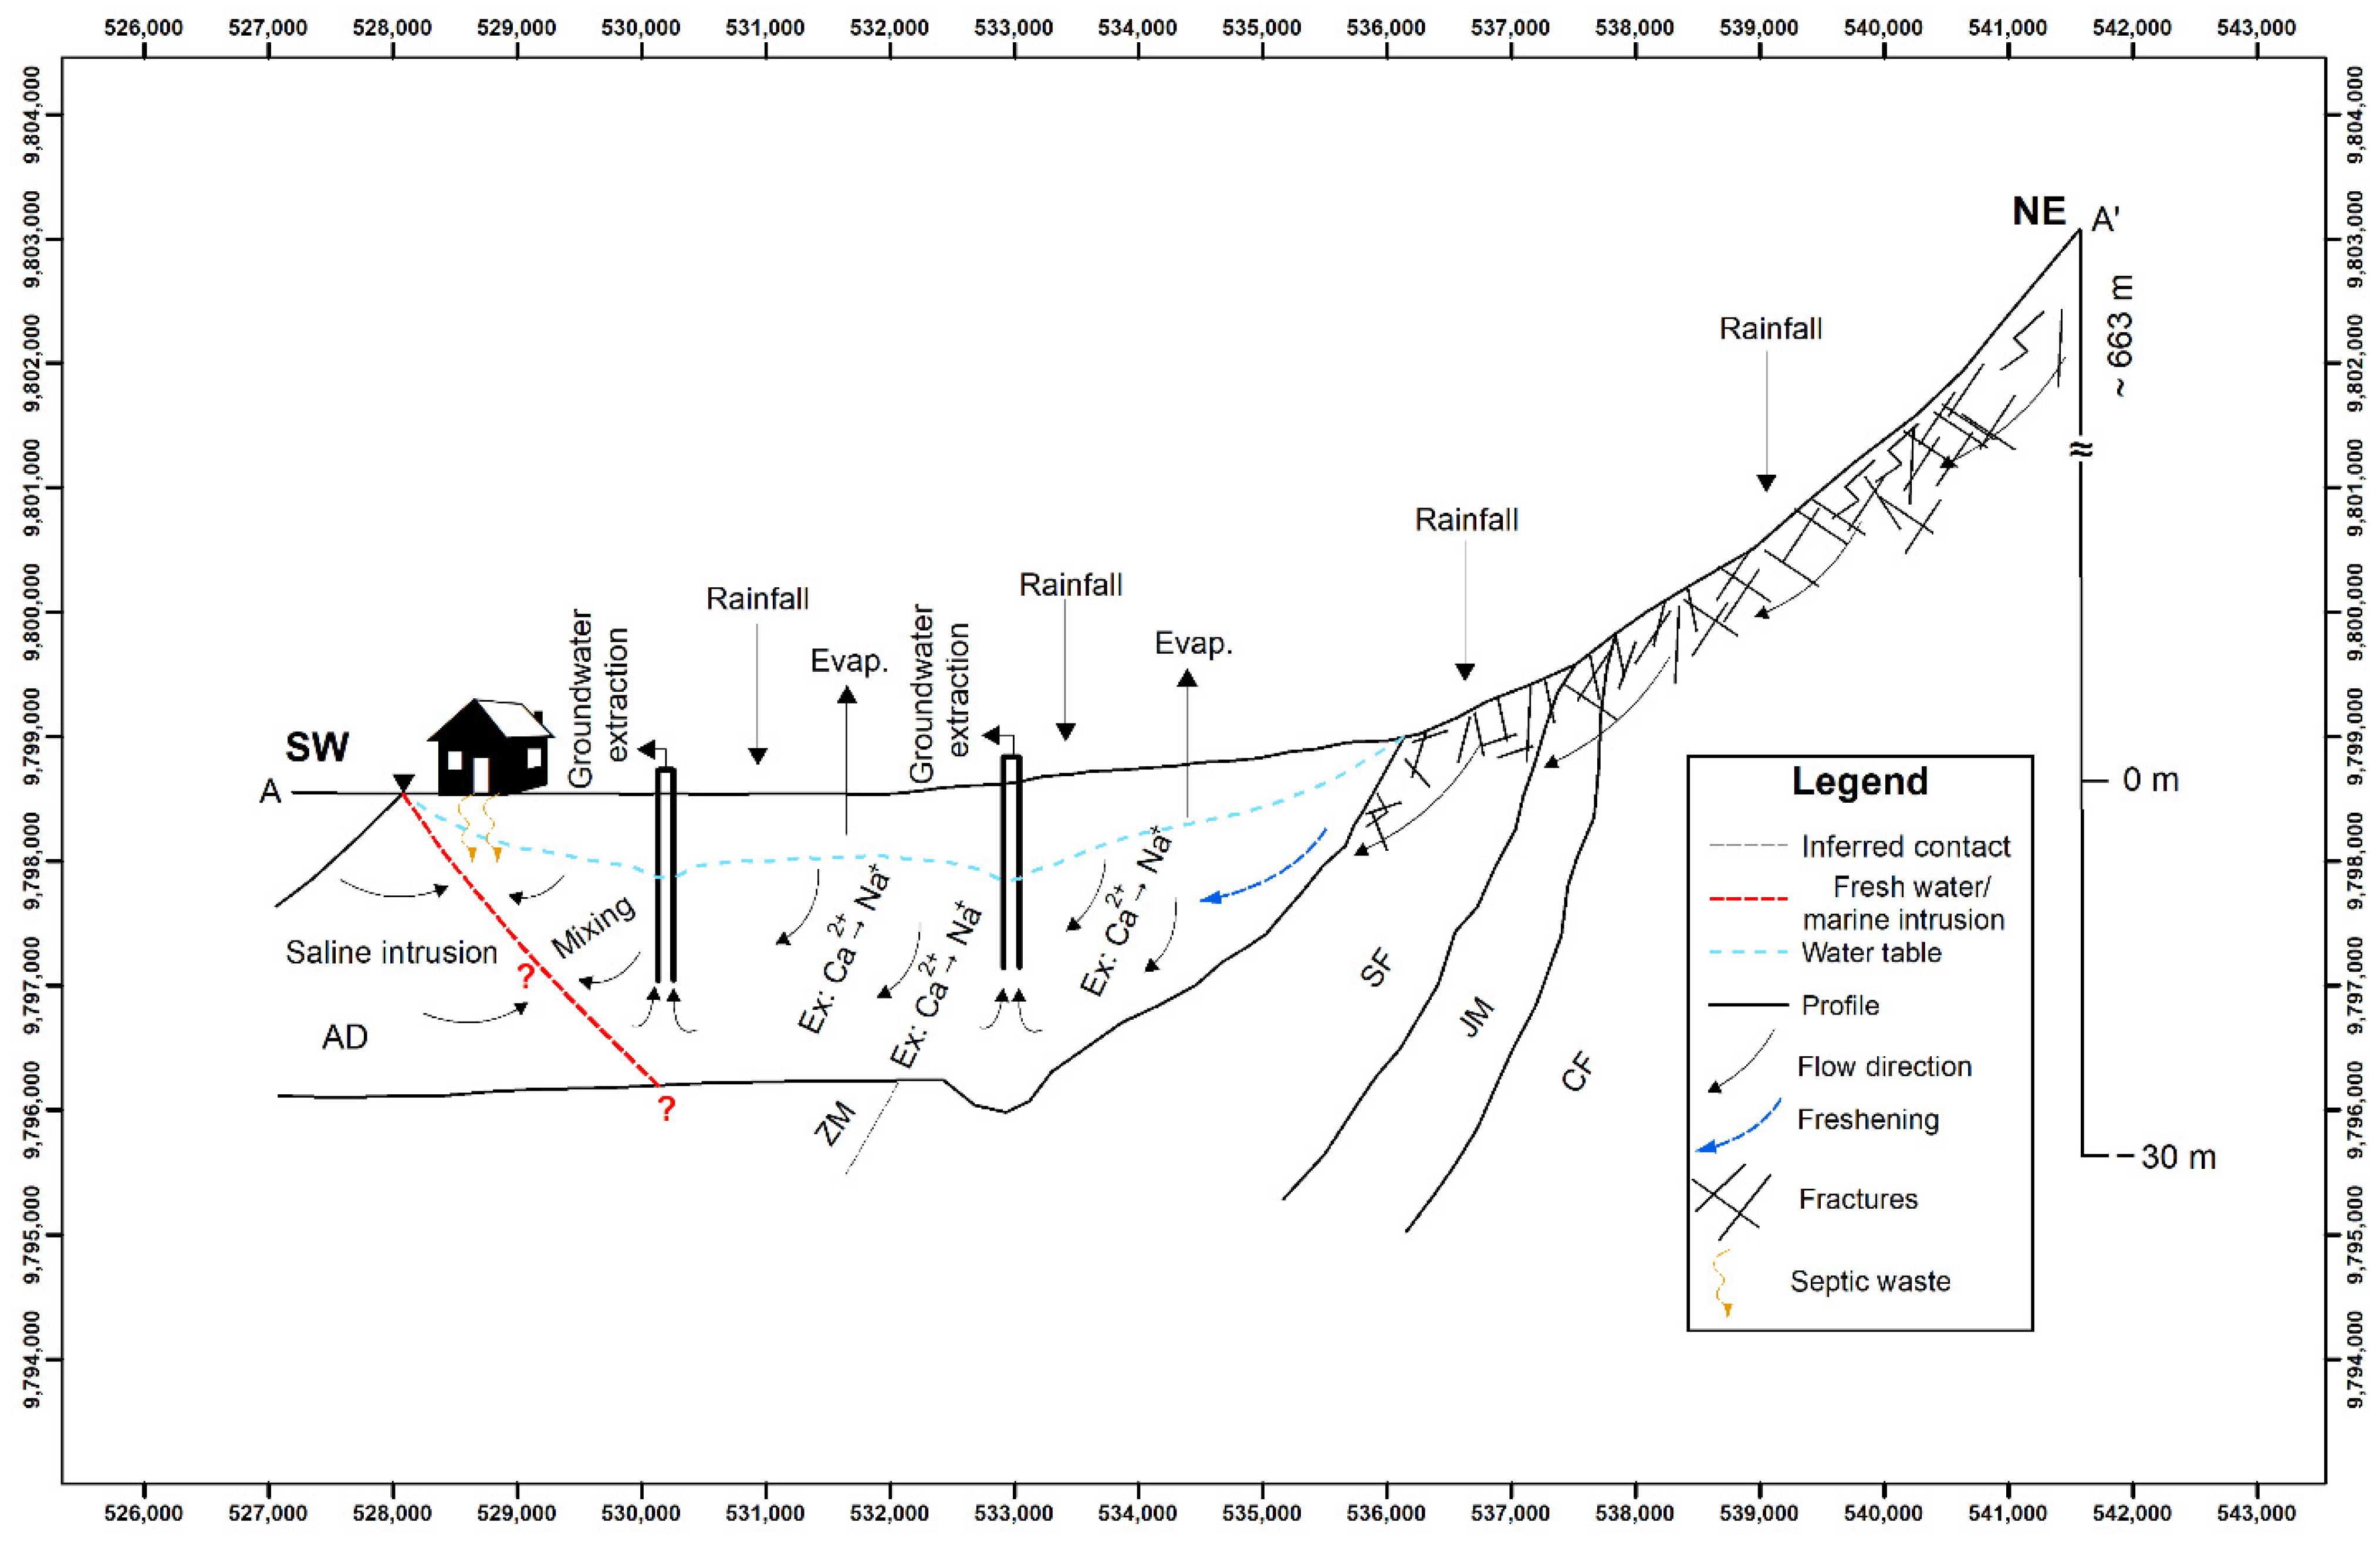
4.3. Conceptual Model
5. Conclusions
Author Contributions
Funding
Institutional Review Board Statement
Informed Consent Statement
Data Availability Statement
Acknowledgments
Conflicts of Interest
References
- Bahir, M.; Chkir, N.; Trabelsi, R.; Friha, H.A.; Zouari, K.; Chamchati, H. Hydro-geochemical behaviour of two coastal aquifers under severe climatic and human constraints: Comparative study between Essaouira basin in Morocco and Jeffara basin in Tunisia. Int. J. Hydrol. Sci. Technol 2012, 2, 75–100. [Google Scholar] [CrossRef]
- Maurya, P.; Kumari, R.; Mukherjee, S. Hydrochemistry in integration with stable isotopes (δ18O and δD) to assess seawater intrusion in coastal aquifers of Kachchh district, Gujarat, India. J. Geochem. Explor. 2019, 196, 42–56. [Google Scholar] [CrossRef]
- Collet, I.; Engelbert, A. Coastal Regions: People Living Along the Coastline, Integration of NUTS 2010 and Latest Population Grid. 2013. Available online: http://ec.europa.eu/eurostat/web/products-statistics-in-focus/-/KS-SF-13-030 (accessed on 3 September 2017).
- Small, C.; Nicholls, R.J. A global analysis of human settlement in coastal zones. J. Coast. Res. 2003, 19, 584–599. [Google Scholar]
- Bear, J.; Cheng, A.H.-D.; Sorek, S.; Ouazar, D.; Herrera, I. Seawater intrusion in coastal aquifers: Concepts, methods and practices. In Theory and Applications of Transport in Porous Media; Springer: Heidelberg, Germany, 1999; p. 625. [Google Scholar]
- Slim, D.; Loeza, C.; Munguía, N.; Peralta, J.; Velazquez, L. Sustainability strategies for coastal aquifers: A case study of the Hermosillo Coast aquifer. J. Clean. Prod. 2017, 195, 1170–1182. [Google Scholar]
- Oude Essink, G.H.P. Improving fresh groundwater supply-Problems and solutions. Ocean. Coast. Manag. 2001, 44, 429–449. [Google Scholar] [CrossRef]
- Park, S.-C.; Yun, S.-T.; Chae, G.-T.; Yoo, I.-S.; Shin, K.-S.; Heo, C.-H.; Lee, S.-K. Regional hydrochemical study on salinization of coastal aquifers, western coastal area of South Korea. J. Hydrol. 2005, 313, 182–194. [Google Scholar] [CrossRef]
- Custodio, E. Groundwater quantity and quality changes related to land and water management around urban areas: Blessings and misfortunes. In Proceedings of the 27th IAH Congress on Groundwater in the Urban Environment: Problems, Processes and Management; Chilton, J., Ed.; Balkema: Rotterdam, The Netherlands, 1997; pp. 11–22. [Google Scholar]
- Houéménou, H.; Tweed, S.; Dobigny, G.; Mama, D.; Alassane, A.; Silmer, R.; Babic, M.; Ruy, S.; Chaigneau, A.; Gauthier, P.; et al. Degradation of groundwater quality in expanding cities in West Africa. A case study of the unregulated shallow aquifer in Cotonou. J. Hydrol. 2020, 582. [Google Scholar] [CrossRef]
- Dhanasekarapandian, M.; Chandran, S.; Devi, D.S.; Kumar, V. Spatial and temporal variation of groundwater quality and its suitability for irrigation and drinking purpose using GIS and WQI in an urban fringe. J. Afr. Earth Sci. 2016, 124, 270–288. [Google Scholar] [CrossRef]
- Herrera-Franco, G.; Carrión-Mero, P.; Alvarado, N.; Morante-Carballo, F.; Maldonado, A.; Caldevilla, P.; Berrezueta, E. Geosites and Georesources to Foster Geotourism in Communities: Case Study of the Santa Elena Peninsula Geopark Project in Ecuador. Sustainability 2021, 12, 4484. [Google Scholar] [CrossRef]
- Mora, A.; Mahlknecht, J.; Ledesma-Ruiz, R.; Sanford, W.E.; Lesser, L.E. Dynamics of major and trace elements during seawater intrusion in a coastal sedimentary aquifer impacted by anthropogenic activities. J. Contam. Hydrol. 2020, 232. [Google Scholar] [CrossRef]
- Peña, H.; Suzuki, O.; Rauert, W. Isotope Hydrology Investigations in Latin America; Organismo Internacional de Energía Atómica, Estudio de Hidrología Isotópica en el Área del Salar de Llamara, Desierto de Atacama: Chile, Vienna, 1989; Volume 502, p. 113. [Google Scholar]
- El Universo. Available online: www.eluniverso.com (accessed on 12 April 2019).
- Núñez del Arco, E. Geología del Ecuador, 1st ed.; Escuela Superior Politécnica del Litoral: Guayaquil, Ecuador, 2003; pp. 42–49. [Google Scholar]
- Machiels, L.; Morante, F.; Snellings, R.; Calvo, B.; Canoira, L.; Paredes, C.; Elsen, J. Zeolite mineralogy of the Cayo formation in Guayaquil, Ecuador. Appl. Clay Sci. 2008, 42, 180–188. [Google Scholar]
- Machiels, L.; Garcés, D.; Snellings, R.; Vilema, W.; Morante, F.; Paredes, C.; Elsen, J. Zeolite occurrence and genesis in the Late-Cretaceous Cayo arc of Coastal Ecuador: Evidence for zeolite formation in cooling marine pyroclastic flow deposits. Appl. Clay Sci. 2014, 87, 108–119. [Google Scholar] [CrossRef]
- Morante, F.; Montalván, F.J.; Carrión, P.; Herrera, G.; Heredia, J.; Elorza, F.J.; Pilco, D.; Solórzano, J. Hydrochemical and geological correlation to establish the groundwater salinity of the coastal aquifer of the Manglaralto River basin, Ecuador. WIT Trans. Ecol. Environ. 2019, 229, 139–149. [Google Scholar]
- Campoverde, J.; Fajardo, I. Contribución de la Geología Aplicada Para la Mejora en el Diseño de un Dique en la Subcuenca del rio Manglaralto, Provincia de Santa Elena; Escuela Superior Politécnica del Litoral (ESPOL): Guayaquil, Ecuador, 2018. [Google Scholar]
- Arévalo, M. Propuesta de Diseño de Construcción, Acondicionamiento de un pozo de Agua y su Incidencia en la Vulnerabilidad del Acuífero Costero en Manglaralto. Master’s Thesis, Escuela Superior Politécnica del Litoral (ESPOL), Guayaquil, Ecuador, 2017. [Google Scholar]
- Herrera, G. Estudio para un Modelo de Gestión de un Acuífero Costero, mediante Metodologías Participativas y Análisis Geoestadístico en el marco del Desarrollo Local. Ph.D. Thesis, Universidad Politécnica de Madrid (UPM), Madrid, España, 2015. [Google Scholar]
- Herrera-Franco, G.; Alvarado-Macancela, N.; Gavín-Quinchuela, T.; Carrión-Mero, P. Participatory socio-ecological system: Manglaralto-Santa Elena, Ecuador. Geol. Ecol. Landsc. 2018, 2, 303–310. [Google Scholar] [CrossRef] [Green Version]
- Instituto Nacional de Estadísticas y Censos (INEC). VII Censo de Población y VI de Vivienda: Sistema Integrado de Consultas. Available online: http://redatam.inec.gob.ec/ (accessed on 2 October 2020).
- Carballo, F.M.; Brito, L.M.; Mero, P.C.; Aguilar, M.A.; Ramírez, J.T. Urban wastewater treatment through a system of green filters in the Montañita commune, Santa elena, Ecuador. WIT Trans. Ecol. Environ. 2019, 239, 233–249. [Google Scholar]
- Franco, G.H.; Quinchuela, T.G.; Macancela, N.A.; Mero, P.C. Participative analysis of socio-ecological dynamics and interactions. A case study of the Manglaralto coastal aquifer, Santa Elena-Ecuador. Malays. J. Sustain. Agric. 2017, 1, 19–22. [Google Scholar] [CrossRef]
- Herrera-Franco, G.; Carrión-Mero, P.; Aguilar-Aguilar, M.; Morante-Carballo, F.; Jaya-Montalvo, M.; Morillo-Balsera, M. Groundwater Resilience Assessment in a Communal Coastal Aquifer System. The Case of Manglaralto in Santa Elena, Ecuador. Sustainability 2020, 12, 8290. [Google Scholar] [CrossRef]
- Carrión, P.; Herrera, G.; Briones, J.; Sánchez, C.; Limón, J. Practical adaptations of ancestral knowledge for groundwater artificial recharge management of Manglaralto coastal aquifer, Ecuador. WIT Trans. Ecol. Environ. 2018, 217, 375–386. [Google Scholar]
- Herrera Franco, G.; Carrión Mero, P.; Briones Bitar, J. Management practices for a sustainable community and its impact on development, Manglaralto-Santa Elena, Ecuador. In Proceedings of the 17th LACCEI International Multi-Conference for Engineering, Education, and Technology, Montego Bay, Jamaica, 24–26 July 2019; pp. 24–26. [Google Scholar]
- Macneill, M. IAEA Helps Parched Santa Elena Find Water; IAEA Bulletin 53-1 (Online): Vienna, Austria, 2011; Volume 53, pp. 12–13. [Google Scholar]
- Piper, A.M. A graphic procedure in the geochemical interpretation of water-analyses. Eos Trans. Am. Geophys. Union 1944, 25, 914–928. [Google Scholar] [CrossRef]
- Vazquez-Suñé, E.; Serrano-Juan, A. Easy_Quim v. 5.0. Available online: https://h2ogeo.upc.edu/es/software-hidrologia-subterrania/11-software-hidrologia-subterrania/42-easy-quim (accessed on 9 November 2019).
- Alcalá, F.J.; Custodio, E. Using the Cl/Br ratio as a tracer to identify the origin of salinity in aquifers in Spain and Portugal. J. Hydrol. 2008, 359, 189–207. [Google Scholar] [CrossRef]
- Giménez-Forcada, E. Dynamic of sea water interface using hydrochemical facies evolution diagram. Ground Water 2010, 48, 212–216. [Google Scholar] [CrossRef] [PubMed]
- Giménez-Forcada, E. Space/time development of seawater intrusion: A study case in Vinaroz coastal plain (Eastern Spain) using HFE-Diagram, and spatial distribution of hydrochemical facies. J. Hydrol. 2014, 517, 617–627. [Google Scholar] [CrossRef]
- Giménez-Forcada, E. Use of the Hydrochemical Facies Diagram (HFE-D) for the evaluation of salinization by seawater intrusion in the coastal Oropesa Plain: Comparative analysis with the coastal Vinaroz Plain, Spain. HydroResearch 2019, 2, 76–84. [Google Scholar] [CrossRef]
- Monnin, C.; Tamborski, J.; Bejannin, S.; Souhaut, M.; Roques, M.; Olivier, P.; van Beek, P. Freshening of a Coastal Karst Aquifer Revealed by the Temporal Changes in a Spring Water Composition (La Palme, Southern France). Hydrology 2019, 6, 45. [Google Scholar] [CrossRef] [Green Version]
- Young, C.; Martin, J.B.; Branyon, J.; Pain, A.; Valle-Levinson, A.; Mariño-Tapia, I.; Vieyra, M.R. Effects of short-term variations in sea level on dissolved oxygen in a coastal karst aquifer, Quintana Roo, Mexico. Limnol. Oceanogr. 2017, 63, 352–362. [Google Scholar] [CrossRef]
- Appelo, C.A.J.; Postma, D. Geochemistry, Groundwater, and Pollution; A.A. Balkema: Amsterdam, The Netherlands, 2005. [Google Scholar]
- Merino, E. Evaluación de la intrusión salina en un acuífero costero y el impacto al suministro de agua potable en Manglaralto provincia de Santa Elena. Bachelor’s Thesis, Escuela Superior Politécnica del Litoral (ESPOL), Guayaquil, Ecuador, 2014. [Google Scholar]
- Craig, H. Standard for reporting concentrations of deuterium and oxygen-18 in natural waters. Science 1961, 133, 1833–1834. [Google Scholar] [CrossRef] [PubMed]
- Appelo, C.A.J.; Postma, D. Geochemistry, Groundwater and Pollution, 2nd ed.; CRC Press: London, UK, 2004. [Google Scholar] [CrossRef]
- Karanth, K. Ground Water Assessment: Development and Management; Tata McGraw-Hill Education: New York, NY, USA, 1987. [Google Scholar]
- Kim, Y.; Lee, K.S.; Koh, D.C.; Lee, D.H.; Lee, S.G.; Park, W.B.; Koh, G.W.; Woo, N.C. Hydrogeochemical and isotopic evidence of groundwater salinization in a coastal aquifer: A case study in Jeju volcanic island, Korea. J. Hydrol. 2003, 270, 282–294. [Google Scholar] [CrossRef]
- Ma, R.; Sun, Z.; Hu, Y.; Chang, Q.; Wang, S.; Xing, W.; Ge, M. Hydrological connectivity from glaciers to rivers in the Qinghai-Tibet Plateau: Roles of suprapermafrost and subpermafrost groundwater. Hydrol. Earth Syst. Sci. 2017, 21, 4803–4823. [Google Scholar] [CrossRef] [Green Version]
- Liu, S.; Tang, Z.; Gao, M.; Hou, G. Evolutionary process of saline-water intrusion in Holocene and Late Pleistocene groundwater in southern Laizhou Bay. Sci. Total Environ. 2017, 607–608, 586–599. [Google Scholar] [CrossRef]
- Mohanty, A.K.; Rao, V.V.S.G. Hydrogeochemical, seawater intrusion and oxygen isotope studies on a coastal region in the Puri District of Odisha, India. Catena 2019, 172, 558–571. [Google Scholar] [CrossRef]
- De Montety, V.; Radakovitch, O.; Vallet-Coulomb, C.; Blavoux, B.; Hermitte, D.; Valles, V. Origin of groundwater salinity and hydrogeochemical processes in a confined coastal aquifer: Case of the Rhône delta (Southern France). Appl. Geochem. 2008, 23, 2337–2349. [Google Scholar] [CrossRef]
- Gomes, O.V.O.; Marques, E.D.; Kütter, V.T.; Aires, J.R.; Travi, Y.; Silva-Filho, E.V. Origin of salinity and hydrogeochemical features of porous aquifers from northeastern Guanabara Bay, Rio de Janeiro, SE-Brazil. J. Hydrol. Reg. Stud. 2019, 22. [Google Scholar] [CrossRef]
- Appelo, C.A.J.; Geirnaert, W. Processes accompanying the intrusion of salt water. Geol. Appl. e Idrogeol. 1983, 18, 29–40. [Google Scholar]
- Han, D.; Post, V.E.A.; Song, X. Groundwater salinization processes and reversibility of seawater intrusion in coastal carbonate aquifers. J. Hydrol. 2015, 531, 1067–1080. [Google Scholar] [CrossRef]
- Ayadi, Y.; Mokadem, N.; Besser, H.; Khelifi, F.; Harabi, S.; Hamad, A.; Boyce, A.; Laouar, R.; Hamed, Y. Hydrochemistry and stable isotopes (δ18O and δ2H) tools applied to the study of karst aquifers in southern mediterranean basin (Teboursouk area, NW Tunisia). J. African Earth Sci. 2018, 137, 208–217. [Google Scholar] [CrossRef] [Green Version]
- Joshi, S.K.; Rai, S.P.; Sinha, R.; Gupta, S.; Densmore, A.L.; Rawat, Y.S.; Shekhar, S. Tracing groundwater recharge sources in the northwestern Indian alluvial aquifer using water isotopes (δ18O, δ2H and 3H). J. Hydrol. 2018, 559, 835–847. [Google Scholar] [CrossRef]
- Gopinath, S.; Srinivasamoorthy, K.; Saravanan, K.; Prakash, R. Tracing groundwater salinization using geochemical and isotopic signature in Southeastern coastal Tamilnadu, India. Chemosphere 2019, 236. [Google Scholar] [CrossRef] [PubMed]
- He, Z.; Ma, C.; Zhou, A.; Qi, H.; Liu, C.; Cai, H.; Zhu, H. Using hydrochemical and stable isotopic (δ2H, δ18O, δ11B, and δ37Cl) data to understand groundwater evolution in an unconsolidated aquifer system in the southern coastal area of Laizhou Bay, China. Appl. Geochem. 2018, 90, 129–141. [Google Scholar] [CrossRef]


| Well/Campaign | pH | T | EC | Na+ | K+ | Ca2+ | Mg2+ | Cl− | Br− | SO42− | HCO3− | TSD |
|---|---|---|---|---|---|---|---|---|---|---|---|---|
| °C | μS/cm | mg/L | mg/L | mg/L | mg/L | mg/L | mg/L | mg/L | mg/L | mg/L | ||
| mmol/L | mmol/L | mmol/L | mmol/L | mmol/L | mmol/L | mmol/L | mmol/L | |||||
| P2/August | 7.1 | 26.5 | 7080 | 274 | 18 | 588 | 110 | 1224 | 5.1 | 272 | 303 | 2869 |
| 11.97 | 0.46 | 14.70 | 4.53 | 34.48 | 0.06 | 2.83 | 4.97 | |||||
| P3/August | 7.2 | 26.9 | 3240 | 187 | 12 | 239 | 46 | 370 | 2.1 | 176 | 309 | 1242 |
| 8.17 | 0.31 | 5.98 | 1.89 | 10.42 | 0.03 | 1.83 | 5.07 | |||||
| P4/August | 7.7 | 26 | 5370 | 317 | 14 | 346 | 73 | 723 | 3.8 | 394 | 383 | 2116 |
| 13.84 | 0.36 | 8.65 | 3.00 | 20.37 | 0.05 | 4.10 | 6.28 | |||||
| P6/August | 7.5 | 26.1 | 1757 | 126 | 8.1 | 96 | 18 | 90 | 0.42 | 178 | 327 | 696 |
| 5.50 | 0.21 | 2.40 | 0.74 | 2.54 | 0.01 | 1.85 | 5.36 | |||||
| P9/August | 7.5 | 24.6 | 1729 | 133 | 6.5 | 87 | 22 | 111 | 0.5 | 176 | 391 | 775 |
| 5.81 | 0.17 | 2.18 | 0.91 | 3.13 | 0.01 | 1.83 | 6.41 | |||||
| P10/August | 7.2 | 24.5 | 1700 | 110 | 6.4 | 76 | 16 | 108 | 0.57 | 137 | 323 | 646 |
| 4.80 | 0.16 | 1.90 | 0.66 | 3.04 | 0.01 | 1.43 | 5.30 | |||||
| P11/August | 7.2 | 26 | 1512 | 74 | 7.4 | 87 | 15 | 86 | 0.4 | 121 | 303 | 572 |
| 3.23 | 0.19 | 2.18 | 0.62 | 2.42 | 0.01 | 1.26 | 4.97 | |||||
| P12/August | 7.5 | 25.2 | 1731 | 93 | 8.2 | 90 | 20 | 101 | 0.44 | 149 | 330 | 613 |
| 4.06 | 0.21 | 2.25 | 0.82 | 2.85 | 0.01 | 1.55 | 5.41 | |||||
| P2/December | 7.3 | 27.3 | 2370 | 173 | 11 | 294 | 55 | 487 | 1.6 | 170 | 293 | 1867 |
| 7.55 | 0.28 | 7.35 | 2.26 | 13.72 | 0.02 | 1.77 | 4.80 | |||||
| P3/December | 7.5 | 26.7 | 961 | 141 | 5.4 | 62 | 16 | 80 | 0.34 | 118 | 280 | 595 |
| 8.17 | 0.31 | 5.98 | 1.89 | 10.42 | 0.03 | 1.83 | 5.07 | |||||
| P4/December | 7.2 | 26.4 | 1923 | 216 | 8.6 | 167 | 35 | 281 | 1.1 | 240 | 340 | 1203 |
| 9.43 | 0.22 | 4.18 | 1.44 | 7.92 | 0.01 | 2.50 | 5.57 | |||||
| P6/December | 7.2 | 25.6 | 941 | 96 | 6 | 73 | 14 | 70 | 0.19 | 138 | 293 | 598 |
| 4.19 | 0.15 | 1.83 | 0.58 | 1.97 | 0.00 | 1.44 | 4.80 | |||||
| P9/December | 7.3 | 26 | 1296 | 151 | 5.7 | 85 | 26 | 103 | 0.31 | 166 | 389 | 794 |
| 6.59 | 0.15 | 2.13 | 1.07 | 2.90 | 0.00 | 1.73 | 6.38 | |||||
| P10/December | 7.4 | 26.4 | 1036 | 127 | 5.4 | 70 | 14 | 82 | 0.32 | 123 | 327 | 653 |
| 5.55 | 0.14 | 1.75 | 0.58 | 2.31 | 0.00 | 1.28 | 5.36 | |||||
| P11/December | 7.4 | 25.9 | 870 | 75 | 6.5 | 78 | 14 | 71 | 0.25 | 104 | 269 | 541 |
| 3.28 | 0.17 | 1.95 | 0.58 | 2.00 | 0.00 | 1.08 | 4.41 | |||||
| P12/December | 7.8 | 24.4 | 927 | 84 | 6.4 | 67 | 16 | 78 | 0.27 | 108 | 277 | 574 |
| 3.67 | 0.16 | 1.68 | 0.66 | 2.20 | 0.00 | 1.13 | 4.54 |
| Well | 2014-April | 2013-November | 2012-November | 2012-January | ||||
|---|---|---|---|---|---|---|---|---|
| 18O | 2H | 18O | 2H | 18O | 2H | 18O | 2H | |
| P2 | −2.06 | −8.8 | −2.30 | −8.5 | −2.20 | −7.6 | −2.01 | −7.5 |
| P3 | −2.37 | −8.7 | −2.51 | −9.9 | −2.22 | −7.8 | −2.15 | −8.3 |
| P4 | - | - | - | - | −2.26 | −7.6 | −2.05 | −7.4 |
| P6 | −2.41 | −9.0 | −2.27 | −8.3 | −2.10 | −7.4 | −1.84 | −8.8 |
| P7 | - | - | - | - | −2.32 | −10.2 | −1.99 | −9.6 |
| P8 | −2.37 | −8.6 | −2.42 | −9.0 | −2.23 | −8.7 | −1.73 | −8.6 |
| P12 | −2.38 | −8.9 | - | - | - | - | ||
| P17 | −2.53 | −10.5 | −2.65 | −8.4 | - | - | - | - |
| River | - | - | −2.32 | −8.7 | - | - | - | - |
| August 2018 | December 2018 | |||||
|---|---|---|---|---|---|---|
| Well | Sub-State | Phase | Ionic Facies | Sub-State | Phase | Ionic Facies |
| P2 | i4 | Seawater intrusion | Ca-Cl | i3 | Seawater intrusion | Ca-Cl |
| P3 | i3 | Seawater intrusion | MixCa-Cl | f3 | Freshwater | MixHCO3-Na |
| P4 | i3 | Seawater intrusion | MixCa-Cl | f2 | Freshwater | MixCl-MixNa |
| P6 | f3 | Freshwater | MixHCO3-MixNa | f3 | Freshwater | MixHCO3-MixNa |
| P9 | f3 | Freshwater | MixHCO3-MixNa | f3 | Freshwater | HCO3-Na |
| P10 | f3 | Freshwater | MixHCO3-MixNa | f4 | Freshwater | HCO3-Na |
| P11 | f3 | Freshwater | HCO3-MixCa | f4 | Freshwater | HCO3-MixCa |
| P12 | f3 | Freshwater | MixHCO3-MixCa | f4 | Freshwater | HCO3-MixNa |
Publisher’s Note: MDPI stays neutral with regard to jurisdictional claims in published maps and institutional affiliations. |
© 2021 by the authors. Licensee MDPI, Basel, Switzerland. This article is an open access article distributed under the terms and conditions of the Creative Commons Attribution (CC BY) license (http://creativecommons.org/licenses/by/4.0/).
Share and Cite
Carrión-Mero, P.; Montalván, F.J.; Morante-Carballo, F.; Heredia, J.; Elorza, F.J.; Solórzano, J.; Aguilera, H. Hydrochemical and Isotopic Characterization of the Waters of the Manglaralto River Basin (Ecuador) to Contribute to the Management of the Coastal Aquifer. Water 2021, 13, 537. https://doi.org/10.3390/w13040537
Carrión-Mero P, Montalván FJ, Morante-Carballo F, Heredia J, Elorza FJ, Solórzano J, Aguilera H. Hydrochemical and Isotopic Characterization of the Waters of the Manglaralto River Basin (Ecuador) to Contribute to the Management of the Coastal Aquifer. Water. 2021; 13(4):537. https://doi.org/10.3390/w13040537
Chicago/Turabian StyleCarrión-Mero, Paúl, F. Javier Montalván, Fernando Morante-Carballo, Javier Heredia, F. Javier Elorza, Joselyne Solórzano, and Héctor Aguilera. 2021. "Hydrochemical and Isotopic Characterization of the Waters of the Manglaralto River Basin (Ecuador) to Contribute to the Management of the Coastal Aquifer" Water 13, no. 4: 537. https://doi.org/10.3390/w13040537