
International Perceptions of Urban Blue-Green Infrastructure: A Comparison across Four Cities
by
 , , , and
Emily C. O’Donnell
1,* ,
,
Noelwah R. Netusil
2 ,
,
Faith K. S. Chan
3,4 ,
,
Nanco J. Dolman
5 and
and
Simon N. Gosling
1 1
School of Geography, University of Nottingham, Nottingham, NG7 2RD, UK
2
Department of Economics, Reed College, Portland, OR 97202-8199, USA
3
Faculty of Science and Engineering, School of Geographical Sciences, University of Nottingham Ningbo China, Ningbo 315100, China
4
School of Geography & Water@Leeds Research Institute, University of Leeds, Leeds LS2 9JT, UK
5
Royal HaskoningDHV, 1090 GE Amsterdam, The Netherlands
*
Author to whom correspondence should be addressed.
Water 2021, 13(4), 544; https://doi.org/10.3390/w13040544
Submission received: 28 January 2021
/
Revised: 11 February 2021
/
Accepted: 17 February 2021
/
Published: 20 February 2021
(This article belongs to the Special Issue Blue-Green Cities for Urban Flood Resilience)
Abstract
:Blue-Green infrastructure (BGI) is recognised internationally as an approach for managing urban water challenges while enhancing society and the environment through the provision of multiple co-benefits. This research employed an online survey to investigate the perceptions of BGI held by professional stakeholders in four cities with established BGI programs: Newcastle (UK), Ningbo (China), Portland (Oregon USA), and Rotterdam (The Netherlands) (64 respondents). The results show that challenges associated with having too much water (e.g., pluvial and fluvial flood risk, water quality deterioration) are driving urban water management agendas. Perceptions of governance drivers for BGI implementation, BGI leaders, and strategies for improving BGI uptake, are markedly different in the four cities reflecting the varied local, regional and national responsibilities for BGI implementation. In addition to managing urban water, BGI is universally valued for its positive impact on residents’ quality of life; however, a transformative change in policy and practice towards truly multifunctional infrastructure is needed to optimise the delivery of multiple BGI benefits to address each city’s priorities and strategic objectives. Changes needed to improve BGI uptake, e.g., increasing the awareness of policy-makers to multifunctional BGI, has international relevance for other cities on their journeys to sustainable blue-green futures.

1. Introduction
Blue-Green Infrastructure (BGI) is increasingly recognised and valued as a strategy to address the urban water challenges posed by present-day climate variability and urbanisation, and to increase the resilience of cities to future change [1,2,3,4,5,6,7,8]. At the same time, BGI can enrich society and the environment through the provision of multiple co-benefits [9,10,11,12]. International cities are gradually evolving from a sole reliance on centralised grey infrastructure towards decentralised facilities that use BGI to retain, attenuate, store and reuse surface water on site, increasing their resilience to future environmental threats [13,14]. This fundamental change in how cities manage water is driven by increasingly frequent and extreme rainfall events, drier summers, accelerating urbanisation, and reductions in public green spaces that lead to water challenges such as flooding, water scarcity, over-exploitation of groundwater, water pollution, maladaptive drainage systems and wasting of rainwater resources [15,16]. Approaches centred on ‘living with and making space for water’ [17,18] and water-sensitive urban design [19], founded on the incorporation of multifunctional blue, green and grey infrastructure in urban development and retrofit projects, are increasingly adopted internationally to address the full water spectrum (floods to droughts) and tackle social, economic and environmental challenges [20,21]. Implementation of BGI is further driven by the need to mitigate urban heat [22] and increase the value of urban natural capital [10].
BGI is defined as an interconnected network of landscape components, both natural and designed, that includes open, green spaces and water bodies (ephemeral, intermittent and perennial) which provide multiple functions [23,24]. Often referred to as green infrastructure (GI) or nature-based solutions (NBS), BGI is subtly different in that it is specifically designed to turn ‘blue’ (or ‘bluer’) during rainfall events to manage stormwater and reduce flood risk [24,25]. BGI assets include green roofs and walls, swales, rain gardens, street trees, ponds, urban wetlands, restored watercourses, reconnected floodplains, and re-naturalised and de-culverted rivers [7,26]. Healthy riparian areas in urban environments are also acknowledged as BGI assets that provide opportunities for environmental enhancement and recreation, and represent an ecological network connecting (physically, visually and ecologically) BGI in urban areas with surrounding natural areas and blue-green space [27,28]. Interlinked are soil and water bioengineering approaches, whereby plants are used alone or in combination with structural materials [29] and play a key role in the design of sustainable NBS and BGI [30].
Multifunctionality and the provision of multiple co-benefits is fundamental to the growing appeal of BGI [7,31] as is the recognition that many of the unintended, adverse side effects of grey infrastructure can be avoided by leveraging natural processes and ecosystem services [32]. As [7] summarise, BGI can reduce the impacts of climate change by mitigating risks associated with extreme storms, droughts and heatwaves; improve water security, air and water quality; enhance wildlife and biodiversity; increase urban greenspace and landscape connectivity; improve physical and mental health and wellbeing; create attractive landscapes and positive placemaking; support sustainable water resource management, and lengthen the service provision of ageing grey infrastructure currently operating beyond its design life [9,12,31,33].
This study approaches the issue of BGI perceptions in a unique way by exploring explicit perceptions of BGI in four cities at the forefront of BGI implementation, through an online survey with professionals from a range of disciplines (engineers, environmental managers, designers, planners, and those involved in strategy, policy, finance and implementation) and organisations (public, private, academia, nonprofits). To our knowledge, this is the first multi-country comparison of professional stakeholders’ perceptions of BGI, supported by a detailed online survey and supplementary analysis of open-source plans, reports and city strategies.
2. Perceptions of BGI
Despite extensive knowledge of the multiple benefits, BGI is often designed to deliver a primary benefit, typically stormwater management [34]. Numerous socio-political, technical and institutional barriers further obstruct implementation [25,35,36,37]. Low uptake of BGI is compounded by unfavourable policies and governance, limited resources, familiarity with, and preference for, traditional infrastructure, low awareness, and perceptions of higher costs, complex maintenance regimes and enhanced risk [38,39]. Understanding perceptions of BGI in the public realm is a fundamental step towards designing infrastructure that is understood (e.g., awareness of the functionality and delivery of multiple co-benefits), accepted, and desired by communities, practitioners and decision-makers [39,40].
Research into the perceptions of BGI typically focuses on residents and communities living with the assets (e.g., [40,41,42,43]). There are currently few studies that explore professional stakeholders’ (i.e., those involved in planning, designing, implementing and managing urban flood risk and water management programs) perceptions of the challenges and opportunities associated with BGI. Ref. [21] found that perceptions of BGI (specifically, green stormwater infrastructure) in two geographically proximal regions (Portland, Oregon, and Clark County, Washington) differed extensively due to the distinct socio-political climates and city-specific drivers for BGI; the opportunistic approach in Portland contrasted with greater caution and more risk-averse BGI planning and delivery in Clark County. New York City practitioners have suggested that changes in management regimes are needed to improve the value of BGI, e.g., opening up bioswales to the public to offer recreational opportunities (active–gardening, or passive–benches) [44].
Several case studies have examined professionals’ perspectives of the barriers and challenges to implementing BGI and how they have been overcome, e.g., in Australia [35]; Portland, Oregon USA [21,36], Sweden [45], Semarang City, Indonesia [2], China [46] and Newcastle, UK [39]. Recent research has also compared urban water management approaches across different cities and countries to develop an understanding of the role of BGI in urban water management, and share best practices from cities with different geographical, climatological, socio-political and governance characteristics. For example, ref. [47] interviewed local government officials to evaluate and compare the governance of sustainable stormwater management using green infrastructure (GI) in two Chinese and two Swedish cities, exploring the impact of non-hierarchical (Sweden) and hierarchical (China) political systems on GI governance. In their cross-country investigation of GI-based sustainable urban water management practices, ref. [20] found similar drivers and challenges to GI implementation in five international cities, yet the specific role of GI in each city dictated how it was used to meet development targets and tackle water challenges. Similarly, ref. [48] report different priorities for climate change adaptation within seven midsize cities in the North Sea Region, which impacts on the value given to BGI solutions.
As with professional perceptions of BGI, there are few studies of the perceptions of urban climate adaptation strategies, such as Urban Heat Island (UHI) mitigation and implementation strategies which include BGI as a key component. Ref. [49] found that green infrastructure (including green roofs) was considered the most effective UHI mitigation strategy by 56% of respondents in an international survey. In a pilot study in ten countries worldwide, ref. [50] explored awareness of climate adaptation strategies and found differences in awareness between countries and, moreover, between different respondent groups, e.g., citizens, politicians, urban planners and urban climate experts. As with BGI, greater awareness raising and best practice exemplars are of paramount importance in rising the profile of climate adaptions strategies and increasing implementation [50].
Purpose of the Research
Perceptions of BGI held by professional stakeholders in four cities, across three continents, with established BGI programs, are examined: Newcastle (UK), Ningbo (China), Portland (Oregon USA), and Rotterdam (The Netherlands). Survey responses are subsequently analysed in the context of published plans, strategies and literature from each city that relate to BGI, urban water management, or climate change adaptation agendas. Such an approach provides new insights into how BGI is viewed by professionals working both within, and outside of, the flood and water management discipline. This range of perspectives must be understood if multifunctional BGI is to become a cornerstone of urban development and retrofit projects.
The expected insights from our study are twofold. First, contextualised knowledge of BGI drivers, leadership, provision of multiple benefits, and the changes needed to enable critical barriers to be overcome and improve the uptake of BGI, will be developed for the four case study cities. This knowledge, including examples of BGI best practices and lessons learned from recent BGI programs, will be valuable to other international cities currently exploring the role of BGI in urban water management and climate change adaptation strategies. Second, the comparison of the four cities will create a nuanced understanding of how the socio-political, geographical and climatological similarities and differences between these cities influence perceptions towards BGI.
The four case study cities are first introduced, followed by a description of the methods used to collect and analyse the data. Survey results are then presented and used to inform discussion of the delivery of multiple benefits by multifunctional BGI, and how barriers to widespread implementation may be overcome by effective leadership and governance. Limitations of the survey approach are then outlined, and the key findings of this research into international perceptions of BGI are summarised.
3. Case Study Cities
The four cities make for an interesting comparison and were selected due to their different drivers for urban water management, varying approaches to governance and regulations, and different mechanisms for planning and delivery. They are also at the forefront of BGI implementation in their respective countries and have established BGI visions (Figure 1, Table 1, further details are provided in Supplementary Material).
Portland has one of the oldest and most successful BGI programs in the United States, and has invested widely in BGI over the last two decades to alleviate loadings on the piped infrastructure system, improve water quality and manage nuisance flood risk [58]. Ningbo is one of the Chinese ‘Sponge City’ pilots, tasked with transforming urban water management systems to promote water-resilient, low impact development integrated with urban planning to improve the city’s capacity to function ‘like a sponge’ by absorbing rainwater to mitigate flood risk while storing and filtering water to meet future use [14,46,59,60]. Rotterdam is a forerunner city moving towards transformative climate governance [61] and has a long history of combining urban water management, spatial planning, and climate change adaptation to increase the city’s resilience to, for example, sea level rise and increasing occurrence of pluvial flood events, while improving the quality of life of urban residents [62]. Finally, BGI is a key component in Newcastle’s management plans, including the Core Strategy and Urban Core Plan for Gateshead and Newcastle-upon-Tyne 2010–2030 [63] and Newcastle City Strategic Surface Water Management Plan [52].
4. Methods
4.1. Survey Structure and Delivery
The standard approach to survey development using focus groups to co-design the questions and subsequently update the survey instrument after initial development by the research project team [64] was not suitable for this study due to the limited number of professional stakeholders working with BGI in the case study cities; the same participants cannot be used for both focus groups and as survey participants. As with other studies of professional stakeholder perceptions (e.g., [65,66]) the survey was developed iteratively between the project team. Each question was carefully phrased to be unambiguous and address a specific research question (explored in Section 5). The questions were informed by existing literature on overcoming barriers to BGI implementation [35,36,39], perceptions of multiple benefits [40,43,67] and research and policy papers detailing the strategies of the four cities [16,68,69].
The surveys were subdivided into five sections: (1) general information; (2) benefits, beneficiaries and implementation of BGI; (3) multifunctionality and best practice; (4) collaboration; and (5) barriers and challenges. We report in this paper a sub-set of the survey questions specifically selected to focus on identifying the most important water challenges in each city; understanding what drives BGI implementation; what the perceived multiple benefits are; who the BGI leaders are; and what strategies could improve uptake of BGI. A combination of question types was used, including scalar (5-point scale), ranking, categorical, and multiple choice (Supplementary Material). The ranking, categorical and multiple choice questions included a free text option (‘other (please specify)’). The options in the questions, e.g., the changes needed to improve the uptake of BGI (Section 5.5), were decided by the researchers prior to the study. In several questions, respondents were asked to rank from ‘very significant’ to ‘very insignificant’; however, for clarity we use the term ‘significant’ in a statistical sense and report perceptions of ‘significance’ from the survey as perceptions of relative ‘importance’.
The survey took approximately 15 to 20 min to complete and was launched online through the Qualtrics XM platform. It was open from mid-March 2019 to the end of April 2019. The survey was translated into Dutch and Chinese and respondents could select their preferred language on the survey home page (Supplementary Figure S1). Participants read a participant information sheet and granted consent prior to completing the survey. Responses were anonymised and coded, i.e., P1 = Portland respondent 1. A summary of the methodological process is presented in Figure 2.
4.1.1. Participants and Response Rate
Purposive sampling was used in this geographically targeted investigation; the project team’s expert knowledge of those working with, and knowledgeable of, BGI in the four cities was used to select participants in a non-random manner. Twenty-one participants from each city were sent a personalised email from the research team inviting them to complete the survey. Limiting the sampling frame to contacts of the research team is not thought to introduce any significant bias or exclude respondents due to the team’s detailed knowledge of BGI policy and practice in the four cities and corresponding knowledge of the key professional players. In cases where the targeted respondent was unable to complete the survey (due to time constraints, for example), they identified a suitable replacement, thus broadening the sampling frame.
The small sample size in this study is primarily due to the limited number of professionals working with, and knowledgeable in, BGI, in the case study cities, especially in a relatively small city such as Newcastle (population ~280,000). While surveys of public perceptions are able to access a much larger sampling pool, i.e., typically focusing on a geographical area, such as [70] who surveyed 1750 homes in England and 2467 in Northern Ireland in their study of community preferences around BGI (with 299 returns from England and 329 from Northern Ireland), such a large initial sampling pool is not available for studies of professional perceptions of BGI. The small sample size is comparable to earlier investigations of professional stakeholder perceptions of BGI and water management. For example, ref. [39] interviewed 19 stakeholders to explore barriers to BGI implementation; eight city managers responded to [20]’s questionnaire on urban water management and green infrastructure; and [47] investigated governance factors of sustainable stormwater management with 23 participants from four different cities. 72 stakeholders from 49 river municipalities were also surveyed by [71] in an exploration of urban public services management. Participants in this study are thus deemed to be representative of the sample population, i.e., those working with BGI in each city, and comprised professional experts in BGI, stormwater management and/or climate change adaptation and mitigation, urban planning, design and implementation.
The survey was initiated by all 84 invited participants. In total, 64 (76%) successfully completed all questions. A total of 36% were from government organisations, 34% were from private organisations (such as UK water companies or environmental consultancies), 17% were academics and 13% were from nonprofits (such as environmental societies, charities and advocacy groups) (Table 2). Respondents were drawn from six disciplinary areas with the highest proportion (39%) working in engineering. 47% of the Portland respondents work in nonprofits.
4.2. Data and Statistical Analysis
The data were coded into IBM SPSS Statistics 25 software and the responses investigated using descriptive statistics. Data are presented in a bar chart (Figure 3), tables with colour scales (Figure 4 and Figure 5), a radar chart (Figure 6) and a stacked bar chart (Figure 7). Responses to the free text option in questions 1 (water challenges), 3 (drivers for BGI implementation) and 4 (BGI leaders) are not included in the figures due to the disparity of responses and fact that some provide additional commentary rather than a singular response. These data are presented in Supplementary Material.
Significant differences between the four cities were assessed using a nonparametric one-way ANOVA (Kruskal-Wallis Independent samples test). When these analyses indicated significance (at the 0.05 level), a Dunn’s Post Hoc Non-Parametric Test, adjusted by the Bonferroni correction for multiple tests, was used to determine which cities were significantly different from each other.
5. Results
5.1. Water Challenges
Overall, three water challenges are jointly ranked highest for importance by the sample population (n = 64): fluvial flood risk; increasingly frequent extreme rainfall events; and water quality deterioration and river health (median rankings, Figure 3). Median rankings in the four cities differ. Both Newcastle and Portland respondents regard ageing/outdated water and wastewater infrastructure as the highest-ranking challenge, likely due to the (historic and current) prevalence of Combined Sewer Overflows (CSOs) and flooding caused by old combined sewer systems. The highest ranking challenge in Ningbo is water quality deterioration and river health, and in Rotterdam, increasingly frequent extreme rainfall events is ranked the highest (likely due to the strong public profile of managing ‘cloudburst’ events [72]). As Rotterdam and Ningbo are delta cities, coastal flooding and storm surges was perceived to be a key water challenges (median ranking of 2 and 4, respectively, where lower rankings denote greater importance of the challenge, see Supplementary Table S1). Challenges relating to water scarcity (e.g., water supply, drought risk and low groundwater levels) are ranked lower. No statistically significant differences were observed between all four cities (Supplementary Table S1). Water challenges suggested in the free text response include pinch points in the infrastructure network, low stream flows and high water temperatures, and extreme heat (Supplementary Material).
5.2. Multiple Benefits of BGI
Two benefits (flood risk and stormwater management, and water quality improvements) are regarded as very important or important by 97% of the sample population, and by 100% of Portland respondents (Figure 4). Health and wellbeing improvements, enhanced biodiversity, increased attractiveness/aesthetics and improved sense of place are deemed very important or important by more than 80% of respondents in each city. Benefits that may not automatically be associated with BGI, such as noise reduction, provision of jobs and increase in property prices, are regarded as less important (aside from Ningbo, where 76% regard increases in property prices and noise reduction as very important or important).
Several key differences between the cities are evident. Reducing urban heat is a key benefit in Ningbo, perceived by 94% of respondents as very important or important (statistically significant difference observed between Ningbo and Newcastle, p = 0.033, Supplementary Table S2), likely due to the different climate profiles, size and density of urbanisation in these two cities (the latter being much higher in Ningbo). The educational and recreational opportunities of BGI are key benefits in Newcastle, regarded as very important or important by 100% of respondents (statistically significant difference observed between Newcastle and Portland for recreational opportunities, p = 0.006). The carbon sequestration potential of BGI is an important benefit for 100% of Portland respondents (statistically significant difference observed between Portland and Rotterdam, p = 0.001). Respondents’ disciplinary backgrounds were not found to significantly influence the perceptions of BGI benefits (Supplementary Table S3).
5.3. Drivers for BGI Implementation
Socio-political and instrumental drivers for BGI implementation differ between the four cities and within each city group, evident by the number of drivers in Figure 5 that attracted neither high nor low agreement in responses between stakeholders (shaded yellow). There is, however, a general consensus that local government plans are more effective drivers than national government legislation in all cities, although the difference between respondents regarding local government plans as an effective driver of BGI (94%) and respondents regarding national government legislation as an effective driver (88%) is much smaller in Ningbo compared with the other cities. In contrast, no Rotterdam respondents regard national government legislation as an effective driver (statistically significantly different from the other cities (p = 0.000, Supplementary Table S4)). While the Dutch National Government may provide overarching principles for urban water management, BGI strategies are driven by local and municipal authorities.
A total of 88% of Newcastle respondents perceive multi-agency approaches as an effective driver, compared with 35% in Ningbo (statistically significantly different; p = 0.013). In Portland, 80% view the recognition of BGI multifunctionality, and quantification and monetisation of the benefits and costs, as effective drivers, likely due to long-standing methods of calculating the multiple benefits of BGI [73]. Aside from Newcastle (63%), local flood authority guidance was selected by less than 50% of respondents. The role of lobbying from local communities, e.g., for agencies/organisations to act to reduce flood risk, is regarded as a more effective driver in Newcastle (50%) compared with Portland (40%), Rotterdam (19%) and Ningbo (12%). Other effective factors for driving BGI implementation were identified in the free text response, including commitment from the community (Portland), catchment plans (Newcastle), local design, construction and maintenance guidance (Portland) and “courage to deviate/to think freely” (Rotterdam, R5; Supplementary Material).
5.4. BGI Leaders
There is a marked difference in perceptions of who is currently leading BGI implementation in the four cities, and who should take the lead on initiatives (Figure 6). A total of 84% of all respondents perceive local government as BGI leaders (Figure 6e) (94% in Ningbo, Figure 6b). In contrast, only 50% believe that local government should lead, compared with 56% who think that developers should lead (Figure 6e) (100% in Newcastle, Figure 6a). Statistically significant differences are evident between cities. Private water and sewerage companies are perceived to lead BGI implementation in Newcastle significantly more than in Ningbo (p = 0.000), Portland (p = 0.000), and Rotterdam (p = 0.000) (Supplementary Table S5). Nonprofits are perceived to lead BGI implementation in Portland significantly more than in Newcastle (p = 0.005), Ningbo (p = 0.000), and Rotterdam (p = 0.000). Communities in Rotterdam and Portland are perceived to lead the way significantly more than communities in Newcastle and Ningbo (p = 0.000). No significant differences were observed when asking who should lead BGI implementation (Supplementary Table S6).
Several other options were presented in the free text responses including housing corporations (Rotterdam), Ministry of Housing and Construction Bureau (Ningbo) and landowners, land agents and surveyors (Newcastle; Supplementary Material), which suggests a leadership role should be played by these organisations in BGI delivery in new development. One respondent from Newcastle remarked that “no one organisation is leading the way—it is more via partnerships leading” (NE24), highlighting the importance of multi-agency partnerships in BGI implementation in Newcastle (which was also regarded as an effective driver by 88% of Newcastle respondents, Section 5.3). The low response rate of Ningbo respondents regarding who should lead (only 76% recorded a response and most only selected one option) suggests a different interpretation of this question than in the other cities where multiple options were selected by each respondent.
5.5. Overcoming Barriers to BGI Implementation
Overall, there is strong agreement within and between the cities that most of the 19 options suggested as ways to improve the uptake of BGI are very important or important, and therefore key to overcoming the barriers to widespread BGI implementation (Figure 7). Four changes to current systems of BGI implementation are perceived by over 90% of the sample population as essential for improving BGI uptake; increased awareness (policy-makers) (94%), wider range of funding (94%), BGI in new developments (92%), and increased funding for BGI (91%). We interpret ‘wider range of funding’ as an increase in the range of funding sources for BGI projects, e.g., public, private and nonprofit organisations, whereas ‘increased funding for BGI’ implies a net increase in funds designated to BGI projects which could potentially stem from one source. While this was not specified to the survey respondents, the fact that both options related to funding were selected by over 90% of the sample population suggests that current funding mechanisms are insufficient to deliver BGI aspirations. In contrast, stronger national legislation is deemed very important or important by 68% of the sample population (although the low percentage agreement in Rotterdam (20%) reduces the overall value).
Differences are evident between the four cities. For example, 100% of Newcastle respondents perceive changes in cultures and behaviours as very important or important, compared with 71% in Ningbo, 87% in Portland, and 73% in Rotterdam. This likely stems from a perceived reluctance to support “novel” approaches and change practices around flood and water management that [39] reported in an earlier study. Clearer maintenance responsibilities are viewed as very important or important by 100% of Ningbo respondents, compared with 88% in Newcastle, 73% in Portland, and 94% in Rotterdam.
Rotterdam has the most unique perception of the strategies to improve the uptake of BGI, and in particular, the limited role of ‘command and control’ governance. For instance, only 20% of respondents perceive stronger national legislation as very important or important (statistically significant difference to responses in Newcastle (p = 0.000), Ningbo (p = 0.000) and Portland (p = 0.001), Supplementary Table S7). Stronger enforcement from the planning system (33%) and mandatory standards (50%) are also regarded as very important or important by less than half of Rotterdam respondents (statistically significant differences between respondents from Rotterdam and the three other cities were observed and are detailed in Supplementary Table S7). Enforcement, particularly at the national level, is likely to be less effective in Rotterdam where BGI implementation is driven by local and municipal authorities.
6. Discussion
This study investigates the perceptions of BGI held by professional stakeholders in four international cities with established BGI programs and visions for a future where combined systems of blue, green and grey infrastructure are employed to address urban water challenges. This study builds on earlier evaluations and comparisons of the perceptions of sustainable stormwater management and BGI in international cities [20,47,48], bringing a wider range of disciplines to the discussion by including responses from engineers, environmental managers, designers, planners, and those involved in BGI strategy, policy, finance and implementation (albeit limited to 64 responses, see Section 4.1.1. for discussion of the small sample size). Insight into general BGI best practices from the four surveyed cities, and specific approaches of individual cities, are now discussed in the context of (1) using BGI to deliver multiple benefits, and (2) governance and leadership that facilitate widespread implementation of multifunctional BGI.
6.1. Delivery of Multiple Benefits by Multifunctional BGI
In all four cities, BGI is acknowledged as providing a range of benefits that can be categorised as biophysical (e.g., urban water cycle and environmental management); social (e.g., health and wellbeing); and economic (e.g., increased property prices). However, the most important benefits (flood risk and stormwater management, and water quality improvement) suggests that, despite the increasing international focus on BGI as multifunctional infrastructure [9,12,31,32,34], it is primarily perceived as infrastructure to manage water cycle processes. Nonetheless, agreement by the majority of the sample population that BGI improves health, wellbeing and sense of place, enhances biodiversity, and increases attractiveness of urban environments, suggests that benefit provision outside of the hydrosphere is still highly important.
The perception of multiple benefit delivery is a key component of current water management strategies in Newcastle [52], Ningbo [53], Portland [54] and Rotterdam [56]. Such approaches emphasise a move away from the traditional reliance on grey infrastructure to manage urban water, and greater support for approaches that concurrently address key social, environmental, and economic challenges [20,21]. A leading theme in all cities, and exemplified in Rotterdam, is the use of BGI to improve the quality of life [62]. Perceptions of the important benefits of BGI noted by respondents in each city are supported by local and national practices and policies, which could be regarded as exemplars for other cities looking to better incorporate multifunctional BGI into their own urban improvement strategies.
In the UK, the ‘four pillars of SuDS (sustainable drainage system) design’, comprising water quantity, water quality, amenity and biodiversity objectives [74], support many BGI systems, explaining why these benefits are regarded as very important or important by over 90% of Newcastle respondents. Urban water and extreme weather event management is only one intended outcome of Rotterdam’s climate resilience strategies. The current edition of Rotterdam’s Waterplan, Rotterdam Weather-Wise, highlights the opportunities offered by physical adaptation of the city to mitigate impacts of climate change, primarily the creation of more attractive public green spaces and blue corridors that will improve water and air quality, enhance biodiversity and improve the cityscape [72]. In Portland, BGI has typically been implemented to improve water quality, manage nuisance flood risk, and reduce loadings on the piped infrastructure system [58], explaining why 100% of respondents regard these benefits as very important or important. Carbon sequestration, also regarded as very important or important by all Portland respondents, is a key component of the Climate Action Plan and county-wide initiatives to improve natural systems and increase urban forests [75]. The key objectives of the Chinese SCP focus on water cycle and flood risk management, and improvement of the natural environment through better alignment between urban planning and water resource management [53]. Greater implementation of BGI in urban areas and conservation of existing blue and green spaces are also proposed to improve social wellbeing [68], explaining the benefits that the Ningbo participants regarded as very important or important.
The benefits of BGI that were identified as most important also align with the highest-ranking water challenges (fluvial flood risk, increasingly frequent extreme rainfall events, and water quality deterioration and river health). Unsurprisingly, the city objectives for more sustainable and resilient future water management mirror the city-specific water challenges illustrated in Figure 3. At present, risks associated with having too much water are driving urban water management agendas. The challenges related to having too little water (water supply, drought risk and low groundwater levels) have less dominance in decision making as that current risk is perceived to be low. Nonetheless, the potential for BGI to mitigate future risks of water scarcity is acknowledged by survey respondents and illustrated by the relatively high percentages who regard rainwater use, e.g., via rainwater harvesting, as a very important or important BGI benefit.
6.2. Overcoming Barriers through BGI Leadership and Governance
The perceptions of governance drivers for BGI implementation, BGI leaders, and strategies to overcome the barriers and improve BGI uptake, are markedly different between the four cities, reflecting the varied local, regional and national responsibilities for BGI implementation, and urban water management policy more generally.
6.2.1. National and Local Government Leadership
One theme that is apparent is the key role national governments are perceived to play in both leading and driving BGI implementation in Ningbo. The Chinese National Government, which has responsibility for stormwater management in China, is a key driver of BGI implementation and has provided funding for the thirty pilot Sponge Cities [53]. In the hierarchical Chinese governance system, the national government is responsible for developing mandatory standards and clearer maintenance responsibilities to enable barriers to BGI to be overcome (Figure 7). Interestingly, local government plans are perceived by a greater percentage of Ningbo respondents (94%) as drivers of BGI implementation (compared with 88% who selected the National Government, Figure 5). This may reflect the overarching role that national policy has in setting local government priorities in Chinese cities but the need for local government to implement strategies on the ground by coordinating and monitoring the work of city bureaus [47]. This aligns with the perception that the local government is Ningbo’s BGI leader (94% agreement). As respondent N29 noted:
“In China, national initiative from the central government would still be the most influential factor to drive any infrastructure building while local government would have the knowledge and capital on the ground to implement it.”
In contrast, policies that govern BGI in Rotterdam, primarily as part of wider urban water management and climate change adaptation strategies, including the Rotterdam Resilience Strategy [76] and Rotterdam Weather-Wise [72], are driven by local and municipal authorities. The Dutch National Water Plan (2016–2021) provides overarching principles and direction of national water policy over five year planning cycles [56], which are then adapted and detailed for specific regions by local and municipal governments. This explains why no Rotterdam respondents perceived national government legislation as a driver for BGI, and only 20% regarded stronger national legislation as a very important or important strategy to improve BGI uptake (Figure 7). Mandatory standards and stronger enforcement from the planning system are also not deemed as important; the Dutch National Government does not typically provide mandatory standards, instead issuing planning guidance and recommended approaches, e.g., Delta Plan on Spatial Adaptation [77]. Clear links between climate change adaptation projects and spatial planning already exist [17,56] and there is a strong focus on delivery [72]. While the development of adaptation strategies is mandatory for local and regional governments, the incorporation of BGI is encouraged but is not mandatory. On one hand, this provides local and regional governments with greater freedom to develop their adaptation measures, yet there is a risk that single purpose grey infrastructure systems will remain a favoured approach. The annual investment budget to maintain urban drainage in Rotterdam is 14.2 million Euros, yet only 10% of this budget is allowed to be invested in sustainable and multifunctional drainage solutions like BGI [78].
The importance of local government plans in driving BGI uptake is evident in all cities (Figure 5) and mirrored in the perceptions of current leaders of BGI implementation (84% selected local government, Figure 6). In Newcastle, three organisations are perceived as BGI leaders, reflecting the partnership between Newcastle City Council, the Environment Agency and Northumbrian Water (private water and sewerage company) that is evident on many BGI projects [39,52]. These organisations, and others, also helped found the 2019 Newcastle Declaration on Blue and Green Infrastructure that advocates changing working practices towards greater collaboration and mechanisms to realise the multiple benefits of BGI [79]. Multi-agency partnerships are the cornerstone of current BGI projects in Newcastle, as in many UK cities, as advocated in policy and practice, e.g., in the Newcastle City Strategic Surface Water Management Plan [52]. This explains why 88% of Newcastle respondents perceived multi-agency approaches as a driver of BGI implementation (Figure 5).
The approach in Portland is different, as individual cities and counties are advancing their own approach to BGI, with some support from Federal agencies. In a study of green stormwater infrastructure in three US cities (including Portland), ref. [58] observed that federal regulations did not appear to exert as strong of an influence on BGI as is typically presumed. This trend is echoed in the data presented here; only 47% regarded national government legislation as a very important or important driver of BGI implementation (Figure 5). Instead, the recognition of multifunctionality, and quantifying and monetising the benefits and costs of BGI, presumably to help make the case for multifunctional infrastructure to a range of potential funders, are regarded as more significant drivers of BGI.
6.2.2. Nonprofits and Citizen Advocacy
A trio of organisations are perceived as leading BGI adoption in Portland: communities, nonprofits and individual champions (Figure 6). Individual champions may be part of local government organisations, such as the Bureau of Environmental Services (BES), which manages Portland’s wastewater and stormwater infrastructure. This bottom-up, ‘grassroots’ approach, involving both public and private actors, stems from a lawsuit filed in 1991 by Northwest Environmental Advocates (NWEA) against the city of Portland alleging that regular discharges of untreated effluent (CSOs) violated the Clean Water Act. Shortly after the lawsuit was filed, Oregon’s Department of Environmental Quality (DEQ) ordered the city to reduce CSO discharges using its authority under the Clean Water Act. NWEA’s litigation resulted in a consent decree that the city of Portland obey DEQ’s order to reduce CSOs [80]. This lawsuit established “a national legal precedent that citizens can enforce narrative conditions in water pollution discharge permits.” [81].
Citizen advocacy is long-standing in Portland; indeed, the city was one of the first to advocate for green stormwater solutions to address combined sewer overflow (CSO) regulations, which was led by an involved citizen advisory panel [21]. A range of nonprofits, public and private organisations, often led by individual champions, are dedicated to conserving existing blue-green space and wildlife, improving watershed health, ensuring that greenspace is accessible to everyone, and petitioning for the equitable delivery of BGI in urban neighbourhoods. Portland, more so than the other cities, demonstrates the importance of citizen advocacy, led by informed, knowledgeable citizens with access to information on urban BGI, in raising the profile of BGI and enabling widespread delivery of BGI systems.
The role of the community in BGI implementation is most apparent in Rotterdam; the joint leaders of BGI are perceived to be local government and the community (Figure 6). Rotterdam communities play a key role in decision making around climate change adaptation and resilience, and are involved throughout the lifetime of projects. For example, the Benthemplein water square, which provides water storage during rainfall events while concurrently improving the quality of urban public space, involved a wide range of community groups in the design and planning phase. This included teachers and students at the local college, faith groups and local residents, to ensure that the final design offered activities in neighbourhood spaces that were most desired by local stakeholders, in addition to managing rainfall [82]. A move away from top-down hierarchy towards greater levels of community and citizen involvement are also key components of the Rotterdam Resilience Strategy [76]. In contrast, communities do not take such a leading role in Ningbo (perceived by 6% as leading BGI), as citizens are typically informed about SCP projects, with limited engagement and consultation [47], which again stems back to the hierarchical governance structure.
It is interesting to note that the organisations currently perceived as BGI leaders in Newcastle and Portland are different from the organisations that respondents say should be leading BGI (Figure 6). All Newcastle respondents believed that developers should be leading BGI, likely due to the housing delivery targets of Newcastle City Council over the next few decades and the focus on high quality sustainable drainage to manage water and flood risk on site [63]. In Portland, greater leadership on BGI is thought to be needed from the U.S. Environmental Protection Agency (EPA), which is the federal agency in charge of administering the Clean Water Act. EPA encourages the use of green infrastructure to manage “wet weather” and, since 2007, EPA’s Office of Water has released memos detailing how green infrastructure can be integrated into federal regulatory programs [83].
6.2.3. Improving Uptake of BGI
Despite the four case study cities having strong BGI visions and aspirations, more than 50% of the respondents from each city still perceive all options for improving BGI uptake as very important or important (Figure 7). This highlights the myriad barriers to BGI delivery that are still hampering progress [35,36], and the need for concurrent change in cognitive, normative and regulative conditions of urban water management [20]. It further suggests that the changes needed to improve BGI uptake, as outlined in Section 5.5, have international relevance for other cities on their journeys to sustainable urban water management and blue-green futures. This includes increasing the awareness of policy-makers to the multifunctional benefits of BGI that may meet different city objectives if designed with more than water management in mind. A wider range of funding, and increased funding for BGI, were very important in all cities suggesting that despite the gradual transformation from solely grey to combinations of blue, green and grey infrastructure, and changes in attitudes towards BGI, greater monetary support is still needed if cities are to meet their blue-green aspirations. Other drivers, such as building codes and rating systems, are also important for BGI implementation [49].
6.3. Key Insights
This research provides three key insights that have relevance for other cities interested in investing in BGI and progressing with their journeys to a sustainable blue-green future. First, the international acknowledgement of the multiple environmental, social and economic benefits delivered by BGI suggests a need for transformation in policy and practice towards greater implementation of BGI that is truly multifunctional, rather than being designed to specifically manage water and flood risk and only paying lip service to wider benefit provision. While BGI cannot be designed to deliver all possible benefits simultaneously, improving quality of life through high quality BGI is likely to be high on the political agendas of many cities. The geographical, climatological, socio-political and governance characteristics of cities will influence local BGI design, guided by the priorities and strategic objectives of each city, and negotiated by the stakeholders involved in BGI projects to maximise benefits and determine which benefit trade-offs will be made (e.g., see [84] for a discussion of conflicts between minimising flood and heat risks in cities).
Second, in cities with non-hierarchical governance structures, the national government plays a pivotal role in setting overarching criteria for managing urban water management and addressing environmental challenges. However, local governments typically drive BGI projects in line with their strategic objectives. Multi-agency approaches are becoming increasingly common and such collaborative approaches, particularly if they include nonprofits and community groups, are increasingly likely to deliver BGI that is understood and supported by decision makers and local communities. Cities looking to expand their BGI delivery are recommended to develop partnerships and multi-agency approaches, facilitated by frameworks that bring together disparate stakeholders to negotiate innovative solutions to specific challenges, such as Learning and Action Alliances that enable social learning, knowledge transfer and collaboration [85,86].
Finally, there is no one solution to overcoming the barriers to BGI owing to the range of biophysical and socio-political barriers that hamper progress, and the intersectional nature of the challenges [36,37]. Cities and countries also have differing abilities to support strategies to overcome the barriers (e.g., changes in national legislation may not universally be a suitable option). Concerted effort should be made to reduce some of the biophysical uncertainties through better data and improved scientific understanding alongside investment in education, partnership working and funding for both capital works and ongoing maintenance of BGI (see also [36]). While outside the scope of this study, cities interested in investing in BGI are also encouraged to explore innovative funding for BGI schemes where traditional governmental routes may not be possible, as combinations of funding have resulted in successful projects, e.g., Rebuild by Design in Hoboken, New York, funded by the federal government and private sector funding [87].
6.4. Limitations of the Survey
The conclusions drawn from this cross-country comparison of the perceptions of BGI have general applicability outside of the sampling frame, e.g., most significant BGI benefits, role of local government, and strategies to improve the uptake of BGI. However, the geographically targeted nature of this investigation precludes direct applicability of the data presented in this study with other cities due to the strong influence of local context (geographical, climatological, socio-political and governance characteristics); instead, we recommend that similar surveys be undertaken with a range of stakeholders involved in BGI in other cities, to improve understanding of BGI attitudes across the globe. Perceptions may also be influenced by many other factors that were not controlled for in this study, including demographics, broader environmental attitudes, and performance of practices associated with urban BGI that are undertaken by the respondents (e.g., dog walking, exercising, recreation), which [70] propose transcend locational and demographic factors.
The sampling frame was limited to existing contacts of the project team and does not include representation of all disciplines and organisations involved in BGI. As an example, health professionals were not surveyed despite the growing importance and acknowledgement of the physical and mental health benefits of BGI [12]. The small percentage of planners that completed the questionnaire was also disappointing, as in many cities planners are key players in BGI provision [88]. The nature of online surveys means it is difficult to control who will and will not respond; hence, better representation by these groups may have influenced the trends for each city, although respondents’ disciplinary backgrounds were not found to significantly influence the perceptions of BGI benefits (Supplementary Table S3).
With regard to the survey, the predefined responses in the categorical and multiple choice questions may not have adequately captured all respondents’ perceptions, although this was mitigated somewhat by providing space for ‘other’ responses. Finally, it is possible that some of the survey questions, originally drafted in English, were not interpreted as intended after translation into Chinese or Dutch, which might explain the low response rate of Ningbo respondents regarding who should lead BGI implementation (only 76% recorded a response and most only selected one option, rather than ‘all options that apply’).
7. Conclusions
This research presents detailed contextualised knowledge of the perceptions of BGI drivers, leadership, multiple benefits, and strategies to overcome barriers to widespread implementation, in four international cities with established BGI programs: Newcastle (UK), Ningbo (China), Portland (Oregon USA), and Rotterdam (The Netherlands). Comparing BGI perceptions in the four cities has further created a nuanced understanding of how the geographical, climatological, socio-political and governance similarities and differences between these cities influence perceptions towards BGI, and its role in urban water and environmental management. Perceptions of the water challenges and benefits of BGI are influenced by the geographical and climatological features of each city; all cities are situated along rivers which has raised awareness of fluvial flood risk and declining river health while Ningbo and Rotterdam are delta cities with increased perceived risk of coastal flooding and storm surges. Socio-political factors, governance and population dynamics has influenced perceptions of the socio-political drivers for BGI implementation, BGI leaders and how barriers to BGI may be overcome, and the influence of ‘command and control’ governance in Ningbo has illustrated marked differences between the perceptions of Ningbo stakeholders and those in the other three cities.
While BGI is primarily used to manage too much water (e.g., pluvial and fluvial flood risk), there is strong support for designing BGI to deliver social and environmental benefits, illustrating the growing international trend for BGI as a mechanism to improve quality of life in urban environments and become more than a strategy to manage water. Nonetheless, a transformative change in policy and practice towards truly multifunctional infrastructure is needed to optimise the delivery of multiple BGI benefits that address priorities and strategic objectives of cities. The multiple benefits perceived as provided by BGI attest to the need to understand a broad range of stakeholder perspectives to determine how BGI may meet the strategic objectives of different organisation and departments, and particularly those that lie outside of the flood and water management domain. One way to increase the breadth of stakeholder involvement in BGI projects is to foster greater levels of community and citizen involvement, as illustrated in Portland and Rotterdam with their move away from top-down hierarchical decision making towards ‘grassroots’ and community leadership.
The myriad barriers to BGI that hamper progress means that no one solution can hope to overcome the range of biophysical and socio-political challenges. However, better data and improved scientific understanding can help reduce biophysical uncertainties, while investment in awareness raising, greater partnership working and funding (ideally from a wider range of sources) for both capital works and ongoing maintenance of BGI may improve the uptake of BGI. New development has the potential to play a key role in delivering high quality BGI if BGI is a cornerstone of the development proposal, considered at the outset of the planning process and multifunctionality is a core component.
Supplementary Materials
The following are available online at https://www.mdpi.com/2073-4441/13/4/544/s1, detailed information on the case study cities, a copy of the survey questions and responses to the free text option in questions 1, 3–4. Figure S1: Survey home page with language selection box, Table S1: Ranking of the water challenges identified by the whole sample population and for each case study city, Table S2: Percentages of respondents in the whole sample population and each city that regarded the benefits of Blue-Green infrastructure (BGI) as very important or important, Table S3: Testing for statistically significant differences between respondents’ disciplinary backgrounds and perceptions of the very important benefits of BGI, Table S4: Effective socio-political and instrumental drivers for implementation of BGI in the four cities, Table S5: Perceptions of who are leading the way in BGI implementation in the case study cities, Table S6: Perceptions of who should lead the way in BGI implementation in the case study cities, Table S7: The percentages of respondents from each city that regard different strategies for improving the uptake of BGI as very important or important.
Author Contributions
Conceptualisation, all authors; data curation, E.C.O.; formal analysis, E.C.O.; funding acquisition, S.N.G. and E.C.O.; methodology, E.C.O. and N.R.N.; Writing—original draft, E.C.O. and N.R.N.; Writing—review & editing, F.K.S.C., N.J.D. and S.N.G. All authors have read and agreed to the published version of the manuscript.
Funding
This research was performed as part of the British Academy project ‘Developing new Blue-Green futures: multifunctional infrastructure to address water challenges’, part of the British Academy programme on Tackling the UK’s International Challenges (grant reference IC3\100093). Additional funding provided by Reed College and the Bernard Goldhammer Grant for Research on Economics and Natural Resources at Reed College.
Institutional Review Board Statement
The study was conducted according to the guidelines of the Declaration of Helsinki, and approved by the Ethics Committee of the University of Nottingham (4 March 2019).
Informed Consent Statement
Informed consent was obtained from all subjects involved in the study.
Data Availability Statement
Data sharing, such as individual responses to the survey questions, is not applicable to this study due to its confidential nature.
Acknowledgments
We would like to express our thanks to all respondents who gave their time to complete the survey and to Will Daniel and Lei Li who assisted with the Qualtrics survey.
Conflicts of Interest
The authors declare no conflict of interest. The funders had no role in the design of the study; in the collection, analyses, or interpretation of data; in the writing of the manuscript, or in the decision to publish the results.
References
- Ahmed, S.; Meenar, M.; Alam, A. Designing a Blue-Green Infrastructure (BGI) network: Toward water-sensitive urban growth planning in Dhaka, Bangladesh. Land 2019, 8, 138. [Google Scholar] [CrossRef] [Green Version]
- Drosou, N.; Soetanto, R.; Hermawan, F.; Chmutina, K.; Bosher, L.; Hatmoko, J.U.D. Key factors influencing wider adoption of blue–green infrastructure in developing cities. Water 2019, 11, 1234. [Google Scholar] [CrossRef] [Green Version]
- Kapetas, L.; Fenner, R. Integrating Blue-Green and Grey Infrastructure through an Adaptation Pathways Approach to Surface Water Flooding. Phil. Trans. R. Soc. A 2020, 378, 20190204. [Google Scholar] [CrossRef] [Green Version]
- Kozak, D.; Henderson, H.; de Castro Mazarro, A.; Rotbart, D.; Aradas, R. Blue-green infrastructure (BGI) in dense urban watersheds. The case of the Medrano stream basin (MSB) in Buenos Aires. Sustainability 2020, 12, 2163. [Google Scholar] [CrossRef] [Green Version]
- Liao, K.-H. The socio-ecological practice of building blue-green infrastructure in high-density cities: What does the ABC Waters Program in Singapore tell us? Socio-Ecol. Pr. Res. 2019, 1, 67–81. [Google Scholar] [CrossRef] [Green Version]
- McPhillips, L.E.; Matsler, M.; Rosenzweig, B.R.; Kim, Y. What is the role of green stormwater infrastructure in managing extreme precipitation events? Sustain. Resilient Infrastruct. 2020, 1, 1–10. [Google Scholar] [CrossRef]
- O’Donnell, E.; Thorne, C.; Yeakley, J.; Chan, F. Sustainable Flood Risk and Stormwater Management in Blue-Green Cities; an Interdisciplinary Case Study in Portland, Oregon. J. Am. Water Resour. Assoc. 2020, 56, 757–775. [Google Scholar] [CrossRef]
- Qi, Y.; Chan, F.K.S.; Thorne, C.; O’Donnell, E.; Quagliolo, C.; Comino, E.; Pezzoli, A.; Li, L.; Griffiths, J.; Sang, Y.; et al. Addressing Challenges of Urban Water Management in Chinese Sponge Cities via Nature-Based Solutions. Water 2020, 12, 2788. [Google Scholar] [CrossRef]
- Fenner, R. Spatial evaluation of multiple benefits to encourage multi-functional design of sustainable drainage in blue-green cities. Water 2017, 9, 953. [Google Scholar] [CrossRef] [Green Version]
- Ghofrani, Z.; Sposito, V.; Faggian, R. Maximising the Value of Natural Capital in a Changing Climate Through the Integration of Blue-Green Infrastructure. J. Sustain. Dev. Energy Water Environ. Syst. 2020, 8, 213–234. [Google Scholar] [CrossRef]
- Hamann, F.; Blecken, G.-T.; Ashley, R.M.; Viklander, M. Valuing the Multiple Benefits of Blue-Green Infrastructure for a Swedish Case Study: Contrasting the Economic Assessment Tools B£ ST and TEEB. J. Sustain. Water Built Environ. 2020, 6, 05020003. [Google Scholar] [CrossRef]
- Venkataramanan, V.; Packman, A.I.; Peters, D.R.; Lopez, D.; McCuskey, D.J.; McDonald, R.I.; Miller, W.M.; Young, S.L. A systematic review of the human health and social well-being outcomes of green infrastructure for stormwater and flood management. J. Environ. Manag. 2019, 246, 868–880. [Google Scholar] [CrossRef]
- Browder, G.; Ozment, S.; Rehberger Bescos, I.; Gartner, T.; Lange, G.-M. Integrating Green and Gray: Creating Next Generation Infrastructure. World Bank and World Resources Institute: Washington, DC, USA © World Bank and World Resources Institute. Available online: https://openknowledge.worldbank.org/handle/10986/31430 (accessed on 25 February 2020).
- Leng, L.; Mao, X.; Jia, H.; Xu, T.; Chen, A.S.; Yin, D.; Fu, G. Performance assessment of coupled green-grey-blue systems for Sponge City construction. Sci. Total Environ. 2020, 728, 138608. [Google Scholar] [CrossRef] [PubMed]
- Marlow, D.R.; Moglia, M.; Cook, S.; Beale, D.J. Towards sustainable urban water management: A critical reassessment. Water Res. 2013, 47, 7150–7161. [Google Scholar] [CrossRef]
- Nguyen, T.T.; Ngo, H.H.; Guo, W.; Wang, X.C.; Ren, N.; Li, G.; Ding, J.; Liang, H. Implementation of a specific urban water management-Sponge City. Sci. Total Environ. 2019, 652, 147–162. [Google Scholar] [CrossRef] [PubMed]
- de Graaf, R.; van der Brugge, R. Transforming water infrastructure by linking water management and urban renewal in Rotterdam. Technol. Forecast. Soc. Chang. 2010, 77, 1282–1291. [Google Scholar] [CrossRef]
- Defra. Making Space for Water: Taking Forward a New Government Strategy for Flood and Coastal Erosion Risk Management in England; Delivery Plan; Department for Environment, Food and Rural Affair: London, UK, 2005. [Google Scholar]
- Sharma, A.; Pezzaniti, D.; Myers, B.; Cook, S.; Tjandraatmadja, G.; Chacko, P.; Chavoshi, S.; Kemp, D.; Leonard, R.; Koth, B. Water sensitive urban design: An investigation of current systems, implementation drivers, community perceptions and potential to supplement urban water services. Water 2016, 8, 272. [Google Scholar] [CrossRef] [Green Version]
- Liu, L.; Jensen, M.B. Green infrastructure for sustainable urban water management: Practices of five forerunner cities. Cities 2018, 74, 126–133. [Google Scholar] [CrossRef]
- Shandas, V.; Matsler, A.; Caughman, L.; Harris, A. Towards the implementation of green stormwater infrastructure: Perspectives from municipal managers in the Pacific Northwest. J. Environ. Plan. Manag. 2020, 63, 959–980. [Google Scholar] [CrossRef]
- Gunawardena, K.; Wells, M.; Kershaw, T. Utilising green and bluespace to mitigate urban heat island intensity. Sci. Total Environ. 2017, 584, 1040–1055. [Google Scholar] [CrossRef] [PubMed]
- Ghofrani, Z.; Sposito, V.; Faggian, R. A Comprehensive Review of Blue-Green Infrastructure Concepts. Int. J. Environ. Sustain. 2017, 6, 15–36. [Google Scholar] [CrossRef]
- O’Donnell, E.; Thorne, C. Urban Flood Risk Management: The Blue-Green Advantage. In Blue-Green Cities: Integrating Urban Flood Risk Management with Green Infrastructure; Thorne, C., Ed.; ICE Publishing: London, UK, 2020. [Google Scholar]
- Deely, J.; Hynes, S.; Barquín, J.; Burgess, D.; Finney, G.; Silió, A.; Álvarez-Martínez, J.M.; Bailly, D.; Ballé-Béganton, J. Barrier identification framework for the implementation of blue and green infrastructures. Land Use Policy 2020, 99, 105108. [Google Scholar] [CrossRef]
- Abbott, J.; Davies, P.; Simkins, P.; Morgan, C.; Levin, D.; Robinson, P. Creating Water Sensitive Places–Scoping the Potential for Water Sensitive Urban Design in the UK; CIRIA: London, UK, 2013. [Google Scholar]
- Iakovoglou, V.; Zaimes, G.N.; Gounaridis, D. Riparian areas in urban settings: Two case studies from Greece. Int. J. Innov. Sustain. Dev. 2013, 7, 271–288. [Google Scholar] [CrossRef]
- Mant, J.; Thorne, C.; Burch, J.; Naura, M. Restoration of urban streams to create blue–green infrastructure. In Blue–Green Cities: Integrating Urban Flood Risk Management with Green Infrastructure; ICE Publishing: London, UK, 2020; pp. 77–97. [Google Scholar]
- Bischetti, G.B.; Di Fi Dio, M.; Florineth, F. On the Origin of Soil Bioengineering. Landsc. Res. 2014, 39, 583–595. [Google Scholar] [CrossRef]
- Zaimes, G.N.; Tardio, G.; Iakovoglou, V.; Gimenez, M.; Garcia-Rodriguez, J.L.; Sangalli, P. New tools and approaches to promote soil and water bioengineering in the Mediterranean. Sci. Total Environ. 2019, 693, 133677. [Google Scholar] [CrossRef]
- Demuzere, M.; Orru, K.; Heidrich, O.; Olazabal, E.; Geneletti, D.; Orru, H.; Bhave, A.; Mittal, N.; Feliu, E.; Faehnle, M. Mitigating and adapting to climate change: Multi-functional and multi-scale assessment of green urban infrastructure. J. Environ. Manag. 2014, 146, 107–115. [Google Scholar] [CrossRef] [PubMed]
- Keesstra, S.; Nunes, J.; Novara, A.; Finger, D.; Avelar, D.; Kalantari, Z.; Cerdà, A. The superior effect of nature based solutions in land management for enhancing ecosystem services. Sci. Total Environ. 2018, 610–611, 997–1009. [Google Scholar] [CrossRef] [Green Version]
- Netusil, N.R.; Levin, Z.; Shandas, V.; Hart, T. Valuing green infrastructure in Portland, Oregon. Landsc. Urban Plan. 2014, 124, 14–21. [Google Scholar] [CrossRef]
- Kabisch, N.; Frantzeskaki, N.; Pauleit, S.; Naumann, S.; Davis, M.; Artmann, M.; Haase, D.; Knapp, S.; Korn, H.; Stadler, J. Nature-based solutions to climate change mitigation and adaptation in urban areas: Perspectives on indicators, knowledge gaps, barriers, and opportunities for action. Ecol. Soc. 2016, 21, 39. [Google Scholar] [CrossRef] [Green Version]
- Brown, R.; Farrelly, M. Delivering sustainable urban water management: A review of the hurdles we face. Water Sci. Technol. 2009, 59, 839–846. [Google Scholar] [CrossRef] [PubMed]
- Thorne, C.R.; Lawson, E.C.; Ozawa, C.; Hamlin, S.; Smith, L.A. Overcoming uncertainty and barriers to adoption of blue-green infrastructure for urban flood risk management. J. Flood Risk Manag. 2018, 11, S960–S972. [Google Scholar] [CrossRef]
- Zuniga-Teran, A.A.; Staddon, C.; de Vito, L.; Gerlak, A.K.; Ward, S.; Schoeman, Y.; Hart, A.; Booth, G. Challenges of mainstreaming green infrastructure in built environment professions. J. Environ. Plan. Manag. 2020, 63, 710–732. [Google Scholar] [CrossRef]
- Dhakal, K.P.; Chevalier, L.R. Managing urban stormwater for urban sustainability: Barriers and policy solutions for green infrastructure application. J. Environ. Manag. 2017, 203, 171–181. [Google Scholar] [CrossRef] [PubMed]
- O’Donnell, E.; Lamond, J.; Thorne, C. Recognising barriers to implementation of Blue-Green infrastructure: A Newcastle case study. Urban Water J. 2017, 14, 964–971. [Google Scholar] [CrossRef] [Green Version]
- Everett, G.; Morzillo, A.; Lamond, J.; Matsler, M.; Chan, F. Delivering Green Streets: An exploration of changing perceptions and behaviours over time around bioswales in Portland, Oregon. J. Flood Risk Manag. 2018, 11, S973–S985. [Google Scholar] [CrossRef] [Green Version]
- Hayden, L.; Cadenasso, M.L.; Haver, D.; Oki, L.R. Residential landscape aesthetics and water conservation best management practices: Homeowner perceptions and preferences. Landsc. Urban Plan. 2015, 144, 1–9. [Google Scholar] [CrossRef] [Green Version]
- Wang, Y.; Sun, M.; Song, B. Public perceptions of and willingness to pay for sponge city initiatives in China. Resour. Conserv. Recycl. 2017, 122, 11–20. [Google Scholar] [CrossRef]
- Williams, J.B.; Jose, R.; Moobela, C.; Hutchinson, D.J.; Wise, R.; Gaterell, M. Residents’ perceptions of sustainable drainage systems as highly functional blue green infrastructure. Landsc. Urban Plan. 2019, 190, 103610. [Google Scholar] [CrossRef]
- Miller, S.M.; Montalto, F.A. Stakeholder perceptions of the ecosystem services provided by Green Infrastructure in New York City. Ecosyst. Serv. 2019, 37, 100928. [Google Scholar] [CrossRef]
- Wihlborg, M.; Sörensen, J.; Alkan Olsson, J. Assessment of barriers and drivers for implementation of blue-green solutions in Swedish municipalities. J. Environ. Manag. 2019, 233, 706–718. [Google Scholar] [CrossRef]
- Li, H.; Ding, L.; Ren, M.; Li, C.; Wang, H. Sponge City Construction in China: A Survey of the Challenges and Opportunities. Water 2017, 9, 594. [Google Scholar] [CrossRef] [Green Version]
- Qiao, X.-J.; Liu, L.; Kristoffersson, A.; Randrup, T.B. Governance factors of sustainable stormwater management: A study of case cities in China and Sweden. J. Environ. Manag. 2019, 248, 109249. [Google Scholar] [CrossRef]
- Özerol, G.; Dolman, N.; Bormann, H.; Bressers, H.; Lulofs, K.; Böge, M. Urban water management and climate change adaptation: A self-assessment study by seven midsize cities in the North Sea Region. Sustain. Cities Soc. 2020, 55, 102066. [Google Scholar] [CrossRef]
- Wang, C.; Wang, Z.-H.; Kaloush, K.E.; Shacat, J. Perceptions of urban heat island mitigation and implementation strategies: Survey and gap analysis. Sustain. Cities Soc. 2021, 66, 102687. [Google Scholar] [CrossRef]
- Lenzholzer, S.; Carsjens, G.-J.; Brown, R.D.; Tavares, S.; Vanos, J.; Kim, Y.; Lee, K. Awareness of urban climate adaptation strategies–an international overview. Urban Clim. 2020, 34, 100705. [Google Scholar] [CrossRef]
- O’Donnell, E.; Woodhouse, R.; Thorne, C. Evaluating the multiple benefits of a Newcastle SuDS scheme. Proc. Inst. Civ. Eng. Water Manag. 2018, 171, 191–202. [Google Scholar] [CrossRef] [Green Version]
- Amec Foster Wheeler. Newcastle City Strategic Surface Water Management Plan; Final Report; Report No 36634/F/001; Amec Foaster Wheeler Environment and Infrastructure UK Limited: Newcastle, UK, 2016. [Google Scholar]
- MHURD. Technical Guide for constructing Sponge Cities (in Chinese). Ministry of Housing and Urban-Rural Development (MHURD), 2014. Available online: http://www.mohurd.gov.cn/wjfb/201411/W020141102041225.pdf (accessed on 19 May 2020).
- BES. Grey to Green Accomplishments. City of Portland, Bureau of Environmental Services. Available online: https://www.portlandoregon.gov/bes/article/321331 (accessed on 7 February 2020).
- City of Rotterdam. Rotterdam Climate Change Adaptation Strategy. 2013. Available online: http://www.urbanisten.nl/wp/wp-content/uploads/UB_RAS_EN_lr.pdf (accessed on 30 April 2020).
- Ministry of Infrastructure and the Environment. Dutch National Water Plan 2016–2021; Ministry of Infrastructure and the Environment: Amsterdam, The Netherlands, 2015.
- Buro_Sant_en_Co. Four Harbour Roof Park. 2014. Available online: http://landezine.com/index.php/2014/12/four-harbour-roof-park-by-buro-sant-en-co/ (accessed on 10 March 2020).
- McPhillips, L.E.; Matsler, A.M. Temporal evolution of green stormwater infrastructure strategies in three US cities. Front. Built Environ. 2018, 4, 1–14. [Google Scholar] [CrossRef] [Green Version]
- Jiang, Y.; Zevenbergen, C.; Fu, D. Understanding the challenges for the governance of China’s “sponge cities” initiative to sustainably manage urban stormwater and flooding. Nat. Hazards 2017, 89, 521–529. [Google Scholar] [CrossRef]
- Wang, H.; Mei, C.; Liu, J.; Shao, W. A new strategy for integrated urban water management in China: Sponge city. Sci. China Technol. Sci. 2018, 61, 317–329. [Google Scholar] [CrossRef]
- Hölscher, K.; Frantzeskaki, N.; McPhearson, T.; Loorbach, D. Tales of transforming cities: Transformative climate governance capacities in New York City, US and Rotterdam, The Netherlands. J. Environ. Manag. 2019, 231, 843–857. [Google Scholar] [CrossRef] [PubMed]
- Tillie, N.; van der Heijden, R. Advancing urban ecosystem governance in Rotterdam: From experimenting and evidence gathering to new ways for integrated planning. Environ. Sci. Policy 2016, 62, 139–144. [Google Scholar] [CrossRef]
- Newcastle City Council and Gateshead Council. Planning for the Future—Core Strategy and Urban Core Plan for Gateshead and Newcastle Upon Tyne 2010–2030. 2015. Available online: https://www.newcastle.gov.uk/sites/default/files/2019-01/planning_for_the_future_core_strategy_and_urban_core_plan_2010-2030.pdf (accessed on 11 May 2020).
- Dillman, D.A.; Smyth, J.D.; Christian, L.M. Internet, Phone, Mail, and Mixed-Mode Surveys: The Tailored Design Method; John Wiley & Sons: Hoboken, NJ, USA, 2014. [Google Scholar]
- Sheikh, V. Perception of domestic rainwater harvesting by Iranian citizens. Sustain. Cities Soc. 2020, 60, 102278. [Google Scholar] [CrossRef]
- Vidiasova, L.; Cronemberger, F. Discrepancies in perceptions of smart city initiatives in Saint Petersburg, Russia. Sustain. Cities Soc. 2020, 59, 102158. [Google Scholar] [CrossRef]
- Kremer, P.; Hamstead, Z.A.; McPhearson, T. The value of urban ecosystem services in New York City: A spatially explicit multicriteria analysis of landscape scale valuation scenarios. Environ. Sci. Policy 2016, 62, 57–68. [Google Scholar] [CrossRef]
- Chan, F.K.S.; Griffiths, J.A.; Higgitt, D.; Xu, S.; Zhu, F.; Tang, Y.-T.; Xu, Y.; Thorne, C.R. “Sponge City” in China—A breakthrough of planning and flood risk management in the urban context. Land Use Policy 2018, 76, 772–778. [Google Scholar] [CrossRef]
- Lashford, C.; Rubinato, M.; Cai, Y.; Hou, J.; Abolfathi, S.; Coupe, S.; Charlesworth, S.; Tait, S. SuDS & Sponge Cities: A Comparative Analysis of the Implementation of Pluvial Flood Management in the UK and China. Sustainability 2019, 11, 213. [Google Scholar] [CrossRef] [Green Version]
- Lamond, J.; Everett, G. Sustainable Blue-Green Infrastructure: A social practice approach to understanding community preferences and stewardship. Landsc. Urban Plan. 2019, 191, 103639. [Google Scholar] [CrossRef]
- Santasusagna Riu, A.; Galindo Caldés, R.; Tort Donada, J. Assessing Inter-Administrative Cooperation in Urban Public Services: A Case Study of River Municipalities in the Internal Border Area between Aragon and Catalonia (Spain). Water 2020, 12, 2505. [Google Scholar] [CrossRef]
- Rotterdam Office of Climate Adaptation. Rotterdam Weather-Wise—Urgency document. 2020. Available online: https://www.rotterdam.nl/wonen-leven/rotterdams-weerwoord/Urgentiedocument-2020_EN.pdf (accessed on 10 March 2020).
- BES. Portland’s Green Infrastructure: Quantifying the Health, Energy, and Community Livability Benefits. City of Portland Bureau of Environmental Services (BES) and ENTRIX; 2010. Available online: https://www.portlandoregon.gov/bes/article/298042 (accessed on 8 February 2018).
- Woods Ballard, B.; Wilson, S.; Udale-Clarke, H.; Illman, S.; Scott, T.; Ashley, R.; Kellagher, R. CIRIA report C753 The SuDS Manual; CIRIA: London, UK, 2015. [Google Scholar]
- City of Portland and Multnomah County. Climate Action Plan. 2016. Available online: https://www.portlandoregon.gov/bps/article/531984 (accessed on 5 February 2019).
- City of Rotterdam. Rotterdam Resilience Strategy. 2016. Available online: http://100resilientcities.org/wp-content/uploads/2017/06/strategy-resilient-rotterdam.pdf (accessed on 25 February 2020).
- Ministry of Infrastructure and Water Management. Delta Programme 2020. Continuing the Work on the Delta: Down to Earth, Alert, and Prepared; Ministry of Infrastructure and the Environment: Amsterdam, The Netherland, 2020.
- City of Rotterdam. Rotterdam Urban Drainage Plan. 2016. Available online: https://www.rotterdam.nl/wonen-leven/grp/ (accessed on 10 December 2020).
- UFR. Newcastle Blue and Green Declaration. Urban Flood Resilience (UFR) Project Website. Available online: http://www.urbanfloodresilience.ac.uk/newcastle-blue-and-green-declaration/newcastle-blue-green-declaration.aspx (accessed on 7 February 2020).
- Inglis, J. Waterways Restored: Case Study 5—The Willamette River in Oregon. 2014. Available online: https://frontiergroup.org/blogs/blog/fg/waterways-restored-case-study-5-willamette-river-oregon (accessed on 2 June 2020).
- NWEA. Northwest Environmental Advocates (NWEA) Willamette River (Blog). Available online: https://northwestenvironmentaladvocates.org/project/willamette-river/ (accessed on 1 June 2020).
- De Urbanisten. Water Square Benthemplein. 2013. Available online: http://www.urbanisten.nl/wp/?portfolio=waterplein-benthemplein (accessed on 25 March 2020).
- US EPA Office of Water. Integrating Green Infrastructure into Federal Regulatory Programs. 2015. Available online: https://www.epa.gov/green-infrastructure/integrating-green-infrastructure-federal-regulatory-programs (accessed on 2 June 2020).
- Caparros-Midwood, D.; Dawson, R.; Barr, S. Low Carbon, Low Risk, Low Density: Resolving choices about sustainable development in cities. Cities 2019, 89, 252–267. [Google Scholar] [CrossRef]
- Ashley, R.; Blanskby, J.; Newman, R.; Gersonius, B.; Poole, A.; Lindley, G.; Smith, S.; Ogden, S.; Nowell, R. Learning and Action Alliances to build capacity for flood resilience. J. Flood Risk Manag. 2012, 5, 14–22. [Google Scholar] [CrossRef]
- O’Donnell, E.C.; Lamond, J.E.; Thorne, C. Learning and Action Alliance framework to facilitate stakeholder collaboration and social learning in urban flood risk management. Environ. Sci. Policy 2018, 80, 1–8. [Google Scholar] [CrossRef]
- Trogrlić, R.Š.; Rijke, J.; Dolman, N.; Zevenbergen, C. Rebuild by Design in Hoboken: A Design Competition as a Means for Achieving Flood Resilience of Urban Areas through the Implementation of Green Infrastructure. Water 2018, 10, 553. [Google Scholar] [CrossRef] [Green Version]
- Meerow, S. The politics of multifunctional green infrastructure planning in New York City. Cities 2020, 100, 102621. [Google Scholar] [CrossRef]
Figure 1.
Examples of Blue-Green Infrastructure (BGI) in the case study cities: (a) sustainable drainage pond in the Newcastle Great Park development site; (b) Ningbo eco-corridor; (c) bioswale in a residential area in Portland; (d) green tram tracks in central Rotterdam. Photo credits: (a,b,d) Emily O’Donnell, (c) Noelwah Netusil.

Figure 2.
A flow chart summarising the main methodological stages in this study of professional stakeholder perceptions of Blue-Green Infrastructure (BGI).
Figure 2.
A flow chart summarising the main methodological stages in this study of professional stakeholder perceptions of Blue-Green Infrastructure (BGI).

Figure 3.
Median ranking of the water challenges by the whole sample population (n = 64). Respondents were asked to rank the importance of each challenge in their city using a 1 (very important) to 10 (not important) scale; lower rankings denote greater importance of the challenge. The bars are in the order of median score. *Water quality deterioration also includes concern over river health.

Figure 4.
The level of agreement between respondents in each city regarding the perception that the benefits of BGI (Blue-Green Infrastructure) are very important or important. Values range from 0 (red, which indicate that no members of the city group found the benefit to be very important or important) to 100 (green, which indicate that all members of the city group found the benefits to be very important or important). RWH = Rainwater Harvesting.

Figure 5.
Level of agreement within cities regarding what drives implementation of BGI (Blue-Green Infrastructure). Values range from 0 (red = no members of the city group selected the drivers) to 100 (green = all members of the city group selected the drivers). Respondents could select multiple options. Physical process and risk drivers, e.g., impacts of climate change, were not included in this question (see Supplementary Material).

Figure 6.
Radar chart showing the perceptions of organisations and individuals that are leading the way, and who should lead the way, in Blue-Green Infrastructure (BGI) implementation in the four case study cities (a–d) and all data (e). The axes show the percentage of respondents that selected each group and the radii (or spokes) represent the different groups. For example, in Newcastle, 100% of respondents thought that developers should lead the way in BGI implementation as illustrated by the black line to the outer edge of the chart. Respondents were able to select multiple responses for both who should lead and who are leading, explaining why the sum of the radii for each city exceed 100%. WSC (Water and Sewerage Companies). *Environment Agency refers to the relevant national organisation in each country, e.g., the Environment Agency (UK), Environmental Protection Agency (USA), Ministry of Infrastructure and Water Management (The Netherlands) or the Housing and Construction Bureau (China).

Figure 7.
The percentage of respondents in each city that regarded the changes needed to improve the uptake of Blue-Green Infrastructure (BGI) as very important or important. The coloured stacked bars represent the four cities as per the legend; added together this gives the percentage of the whole sample population that regarded the strategies as very important or important (the remaining percentages refer to those who scored each option as either ‘neither significant or insignificant’, ‘insignificant’, ‘very insignificant’ or ‘do not know’).


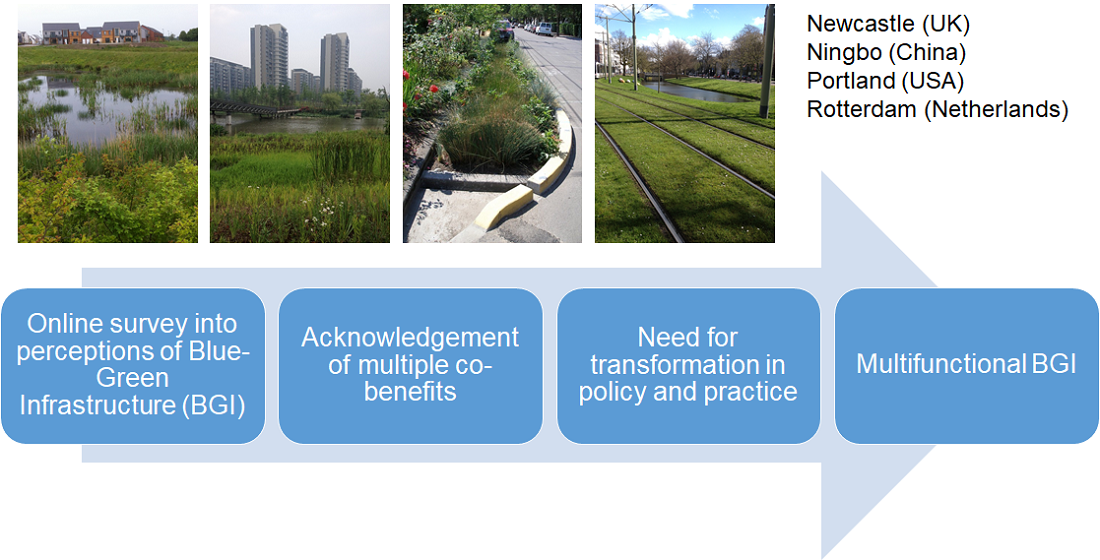
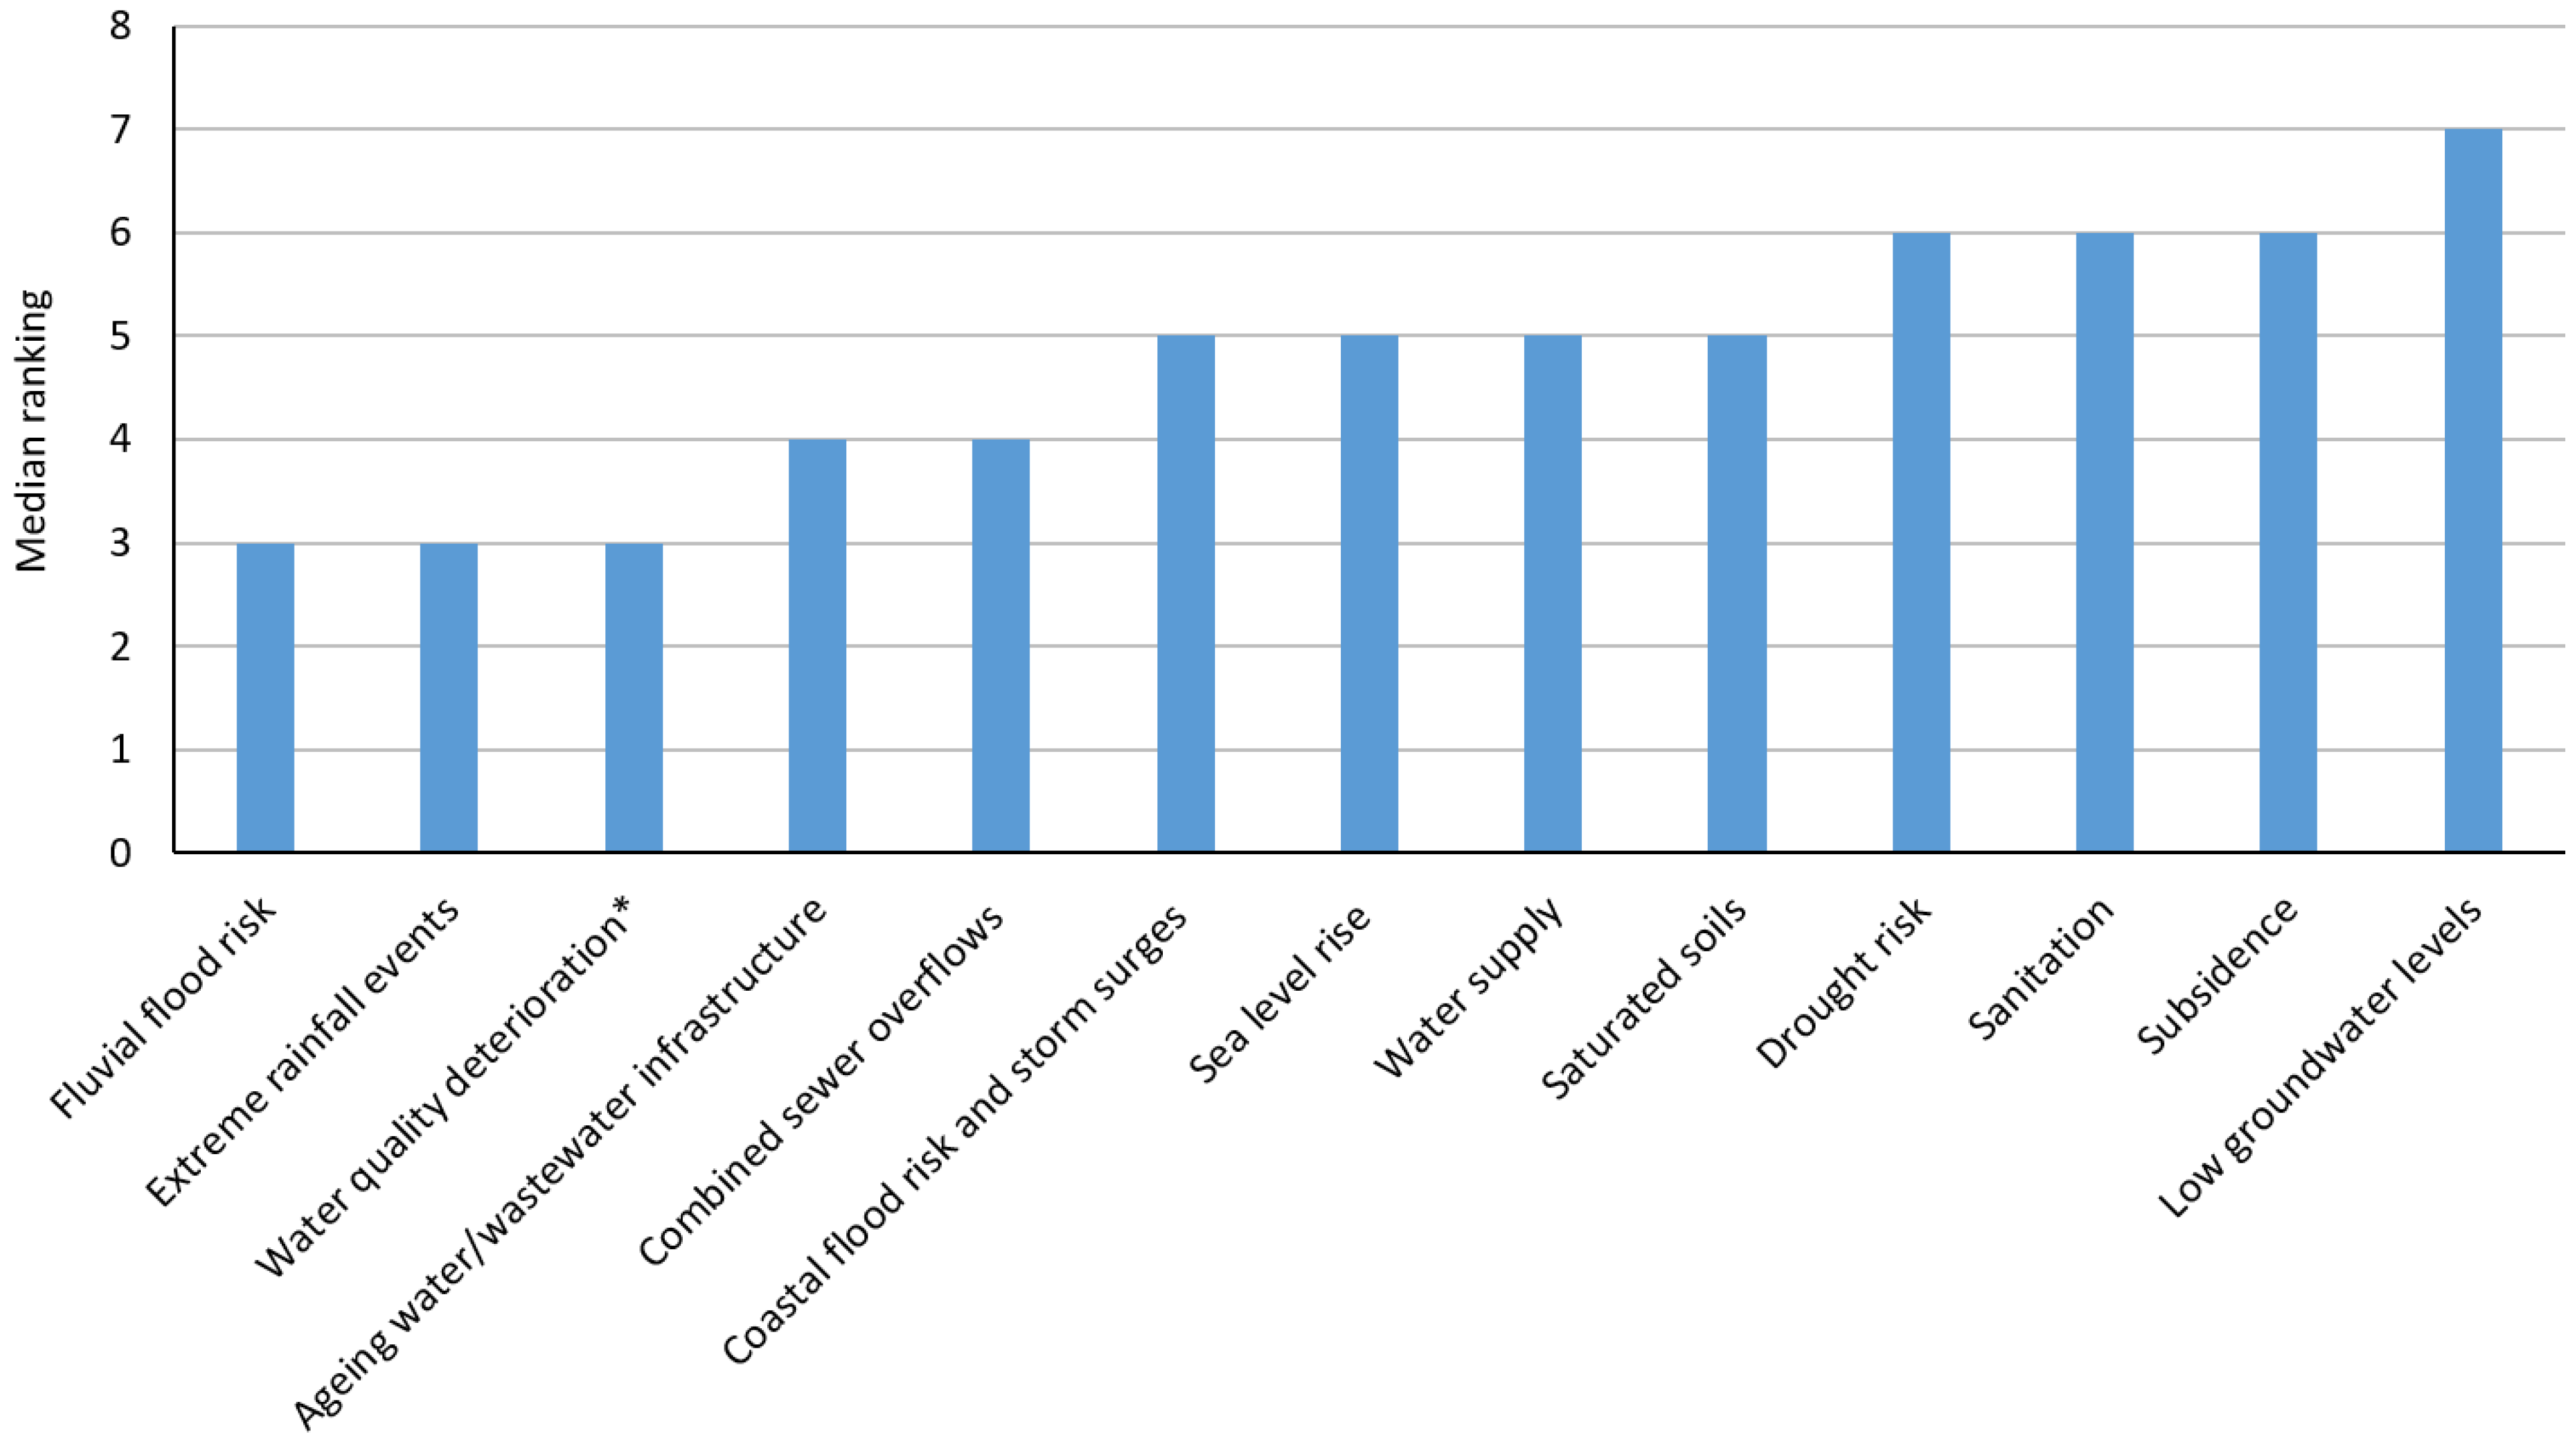
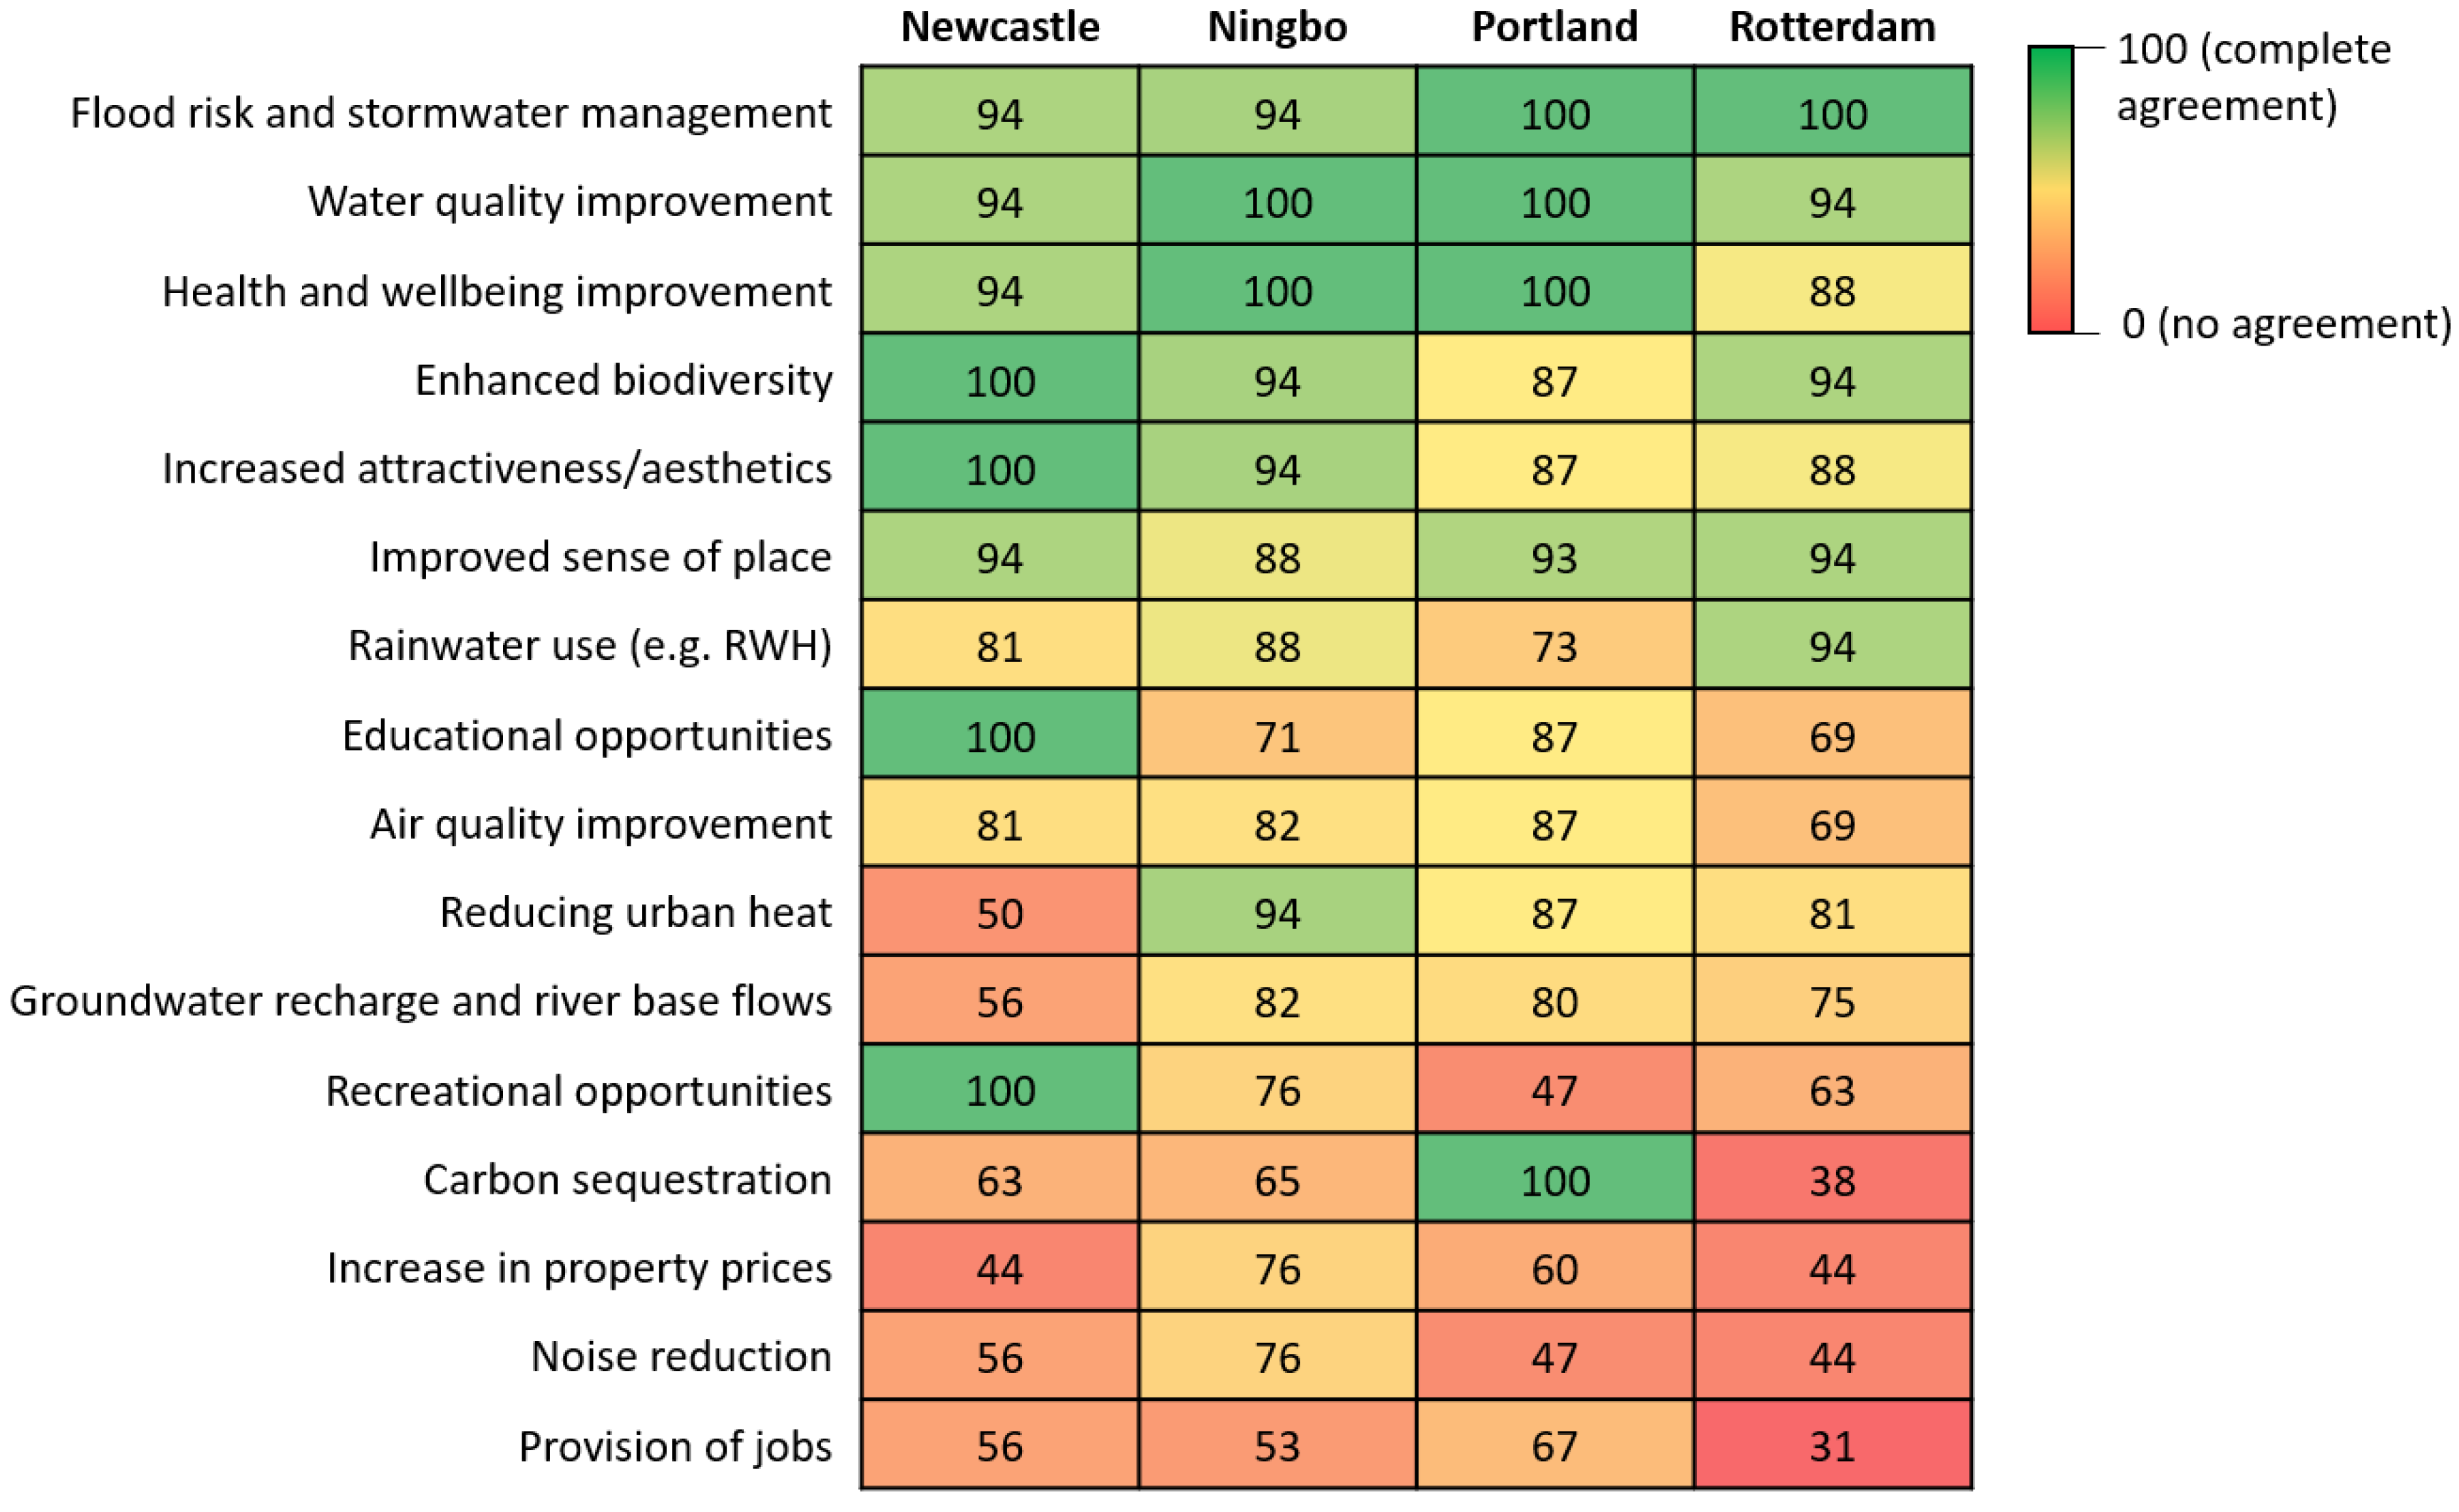
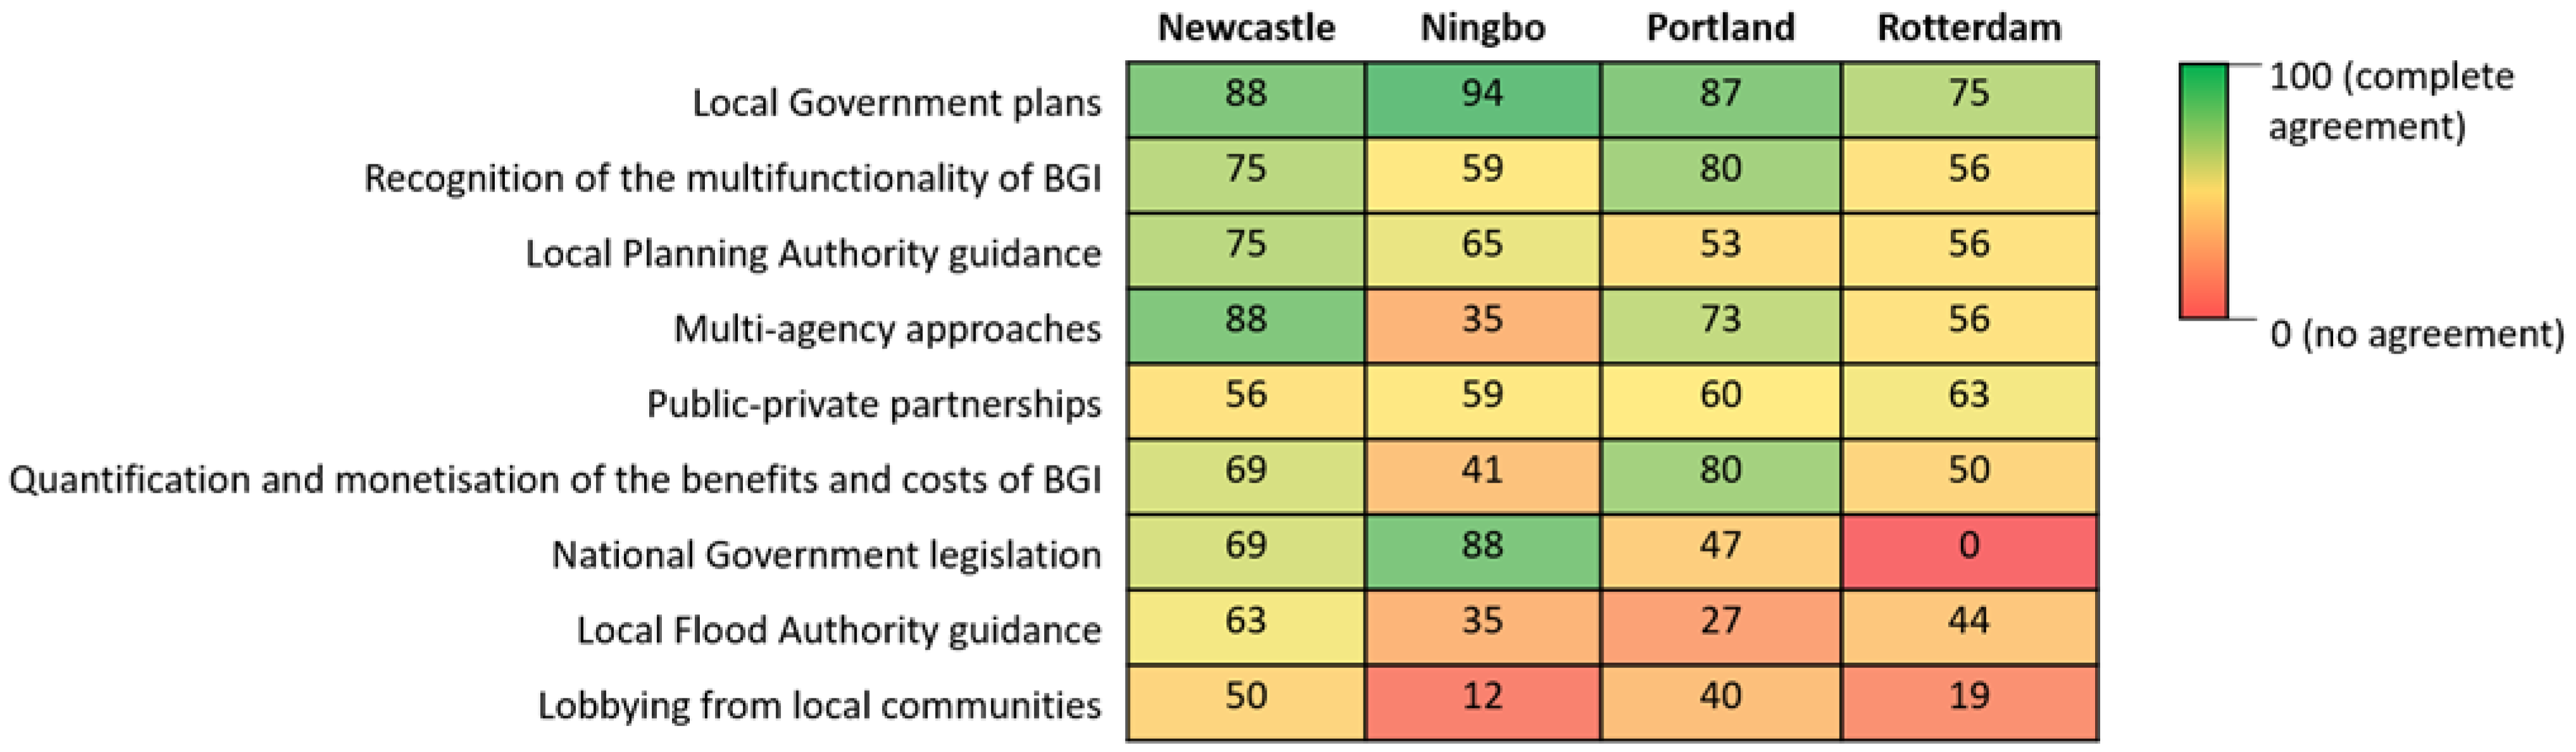
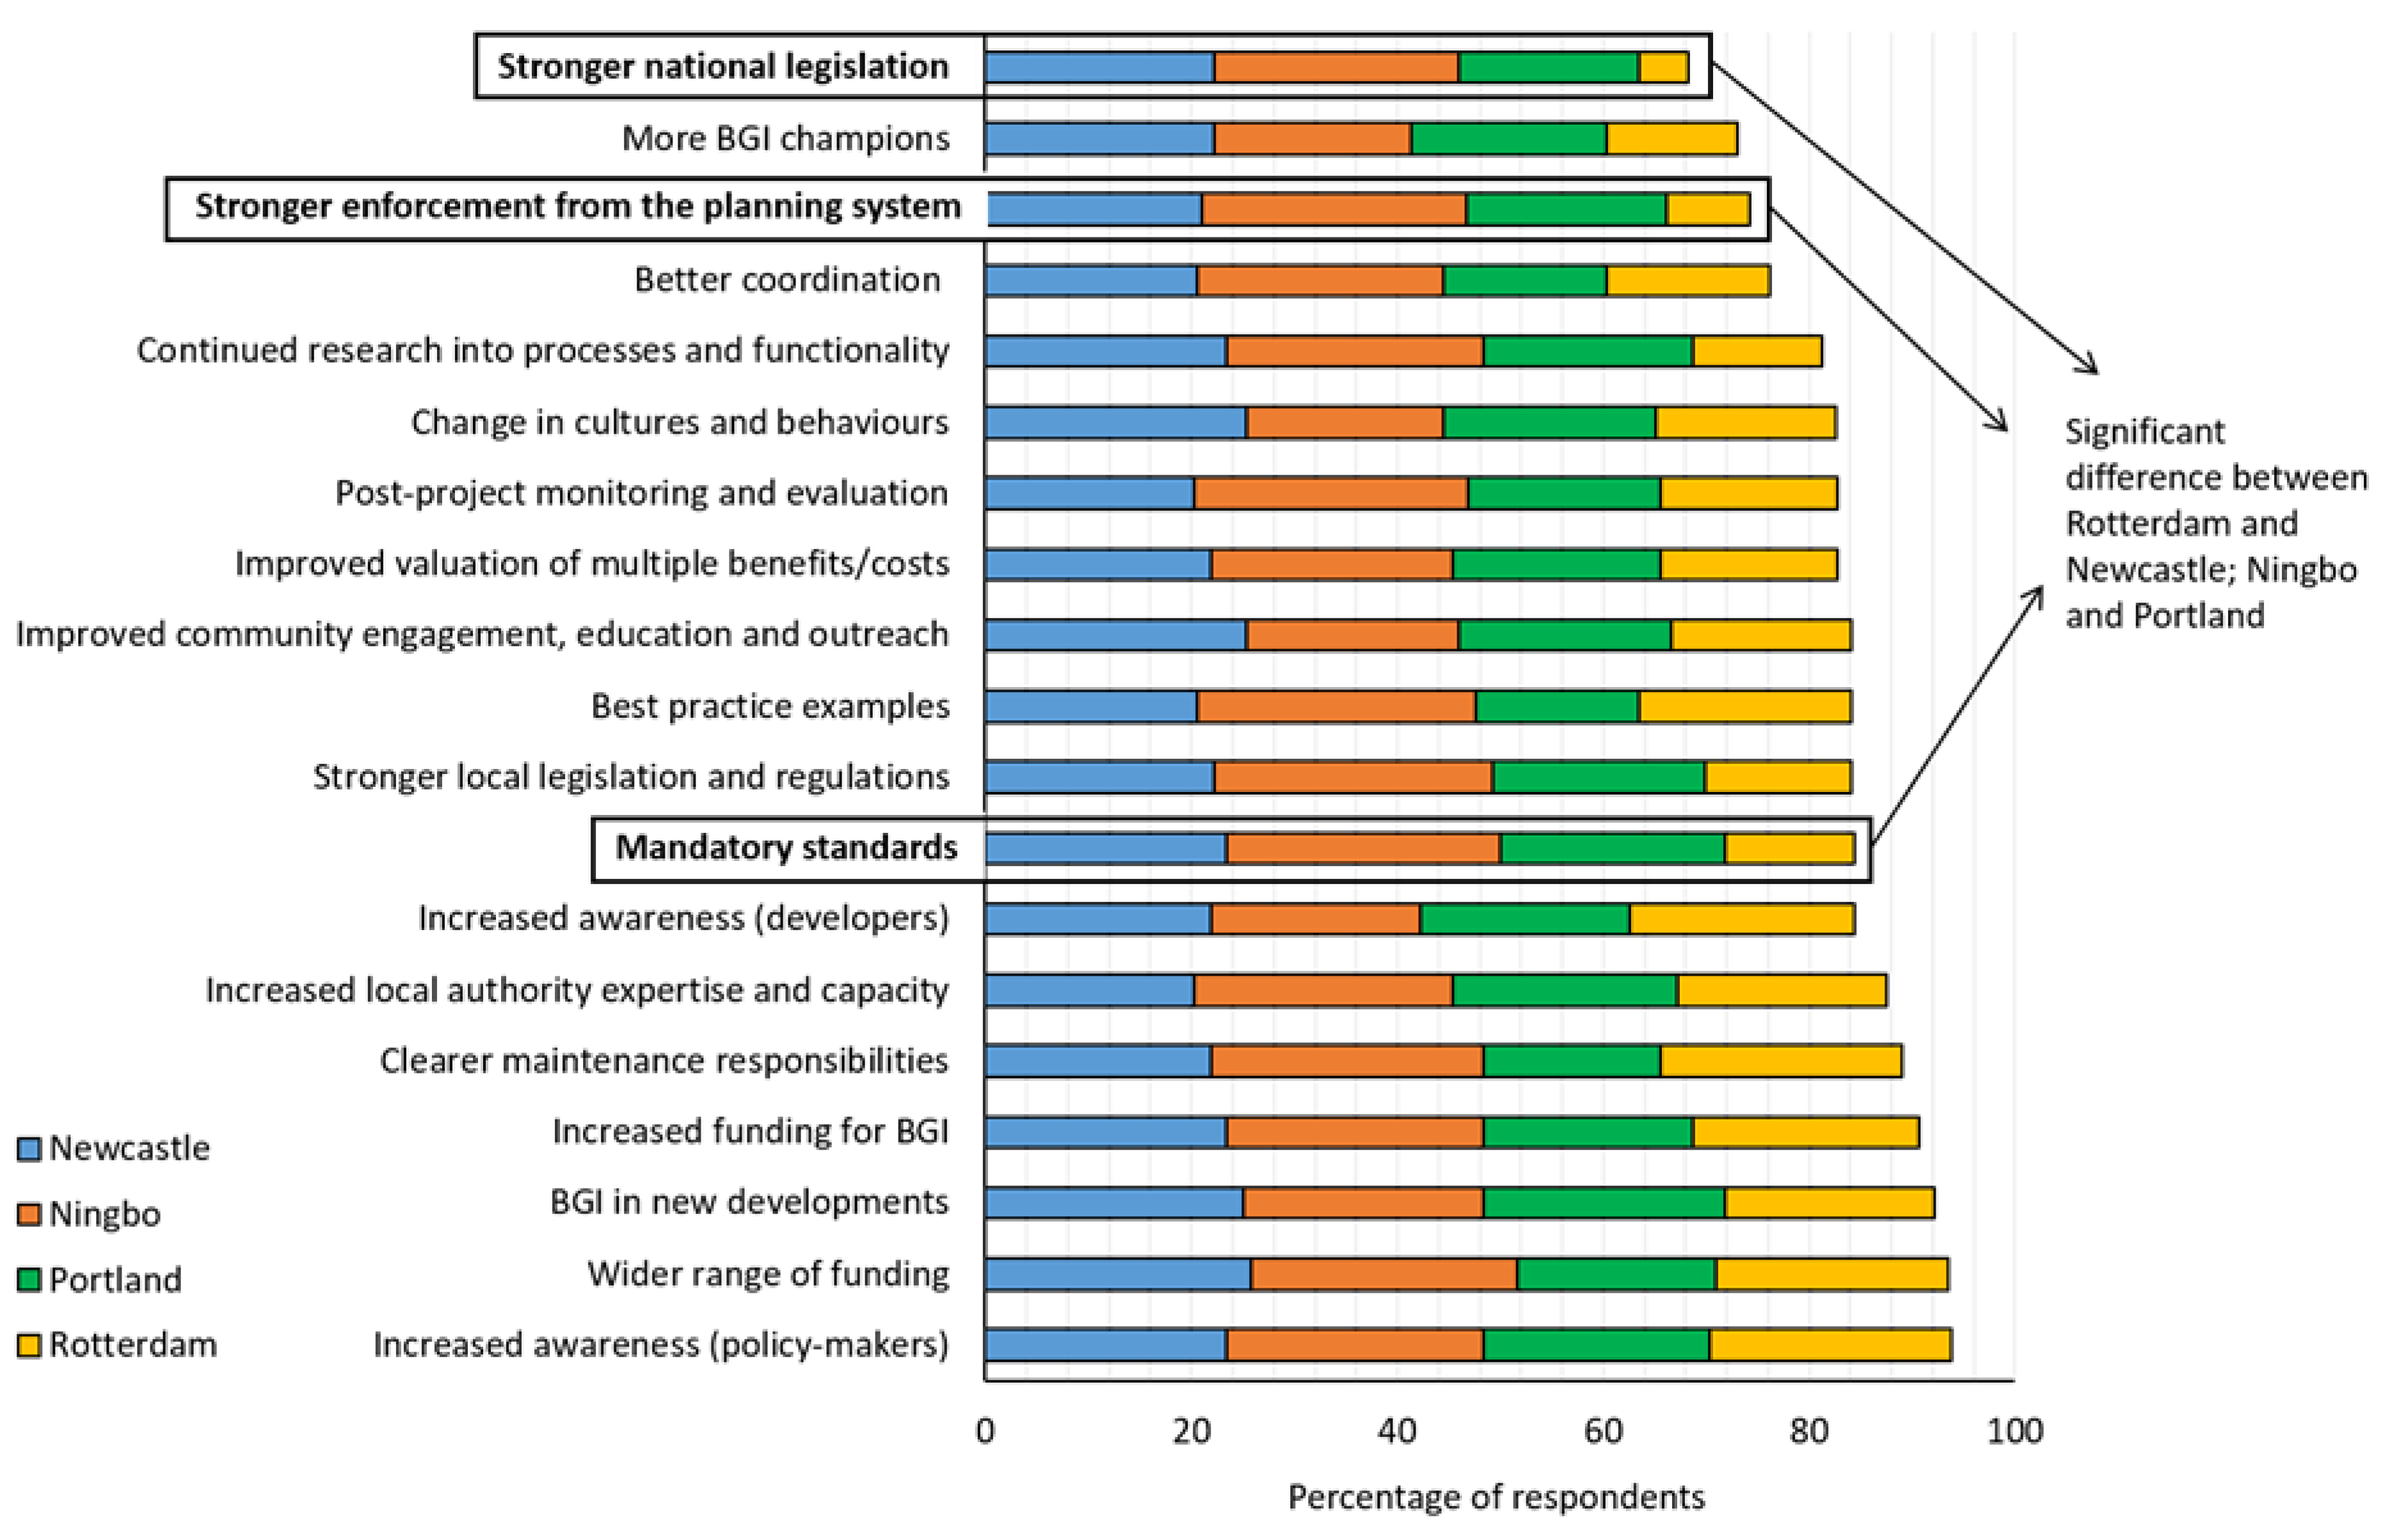
Table 1.
Background information on the four case study cities. BGI (Blue-Green Infrastructure), SuDS (Sustainable Drainage Systems), CSO (Combined Sewer Overflows).
Table 1.
Background information on the four case study cities. BGI (Blue-Green Infrastructure), SuDS (Sustainable Drainage Systems), CSO (Combined Sewer Overflows).
| City | Country | Main River | Area (km2) | Population | Drivers for BGI | BGI Assets/Approaches |
|---|---|---|---|---|---|---|
| Newcastle | UK | Tyne | 114 | 280,000 | Improving resilience to future flooding while maximising the social and environmental benefits of managing water above the ground in attractive blue-green systems | Several exemplar schemes showcase effective delivery of BGI through local and regional partnerships, e.g., SuDS ponds in Newcastle Great Park development, and the Killingworth and Longbenton surface water management scheme [51]. Proposed network of ‘Blue-Green corridors’ through city (Newcastle City Strategic Surface Water Management Plan) [52]. |
| Ningbo | China | Yong, Fenghua and Yao | 9816 | 7,500,000 | Mitigating flood risk, facilitating absorption of rainwater and subsequent storage, purification and reuse, updating current drainage system | Sponge City Program (SCP) initiated by the Chinese Government in 2013 to tackle urban water challenges, rapid urbanisation, and reduction in permeable greenspace [53]. Pilot projects in 30 cities selected for the SCP trial. 20% of their urban land should include ‘sponge’ features (e.g., rain gardens, swales, wetlands) by 2020, and 70–85% annual precipitation should be managed onsite [47]. |
| Portland | USA | Willamette and Columbia | 375.5 | 653,000 | Reducing nuisance flooding, improving water quality (e.g., by CSO reduction), and enhancing fish habitat | ‘Grey to Green’ initiative and others have invested widely in BGI to alleviate loadings on the piped infrastructure system and reduce adverse impacts on urban watercourses. To date, have delivered over 900 green streets (bioswales), more than 400 ecoroofs, over 32,000 street trees, and invested in widespread culvert replacement or removal; and reconnected and restored urban streams, floodplains and native vegetation [54]. |
| Rotterdam | The Netherlands | Maas | 325.8 | 623,000 | Increasing the city’s resilience to the impacts of future climate change [55]. | Multi-layer-safety approach: (1) maintaining and strengthening existing infrastructure (dykes, barriers, sewers), (2) redesigning the city to create more space for water storage by promoting BGI, and (3) working with other city projects to link adaptation and spatial planning [56]. To date, there are several water squares, depaving projects, 220,000 m2 of green roofs, and a rooftop park functioning as flood defence [57]. |
Table 2.
Respondents’ discipline and type of organisation (those who completed all questions). ‘Public’ typically refers to government organisations.
Table 2.
Respondents’ discipline and type of organisation (those who completed all questions). ‘Public’ typically refers to government organisations.
| City | Engineering | Environmental Management | Implementation | Landscape Architecture or Design | Planning | Strategy, Policy and Finance | Total |
|---|---|---|---|---|---|---|---|
| Ningbo, (China) | Private (3) Public (6) | Academia (3) | Academia (1) Private (1) | Academia (2) Public (1) | 17 | ||
| Newcastle (UK) | Academia (2) Private (5) Public (2) | Nonprofits (1) Private (1) Public (2) | Public (1) | Academia (1) Private (1) | 16 | ||
| Rotterdam (The Netherlands) | Private (1) Public (3) | Academia (1) | Private (3) Public (1) | Private (4) | Public (1) | Private (1)Public (1) | 16 |
| Portland (USA) | Nonprofits (1) Public (2) | Nonprofits (3) Public (2) | Academia (1) Nonprofits (1) Private (2) Public (1) | Nonprofits (2) | 15 | ||
| Percentage of total | 39% | 20% | 6% | 17% | 8% | 9% | 64 (100%) |
Publisher’s Note: MDPI stays neutral with regard to jurisdictional claims in published maps and institutional affiliations. |
© 2021 by the authors. Licensee MDPI, Basel, Switzerland. This article is an open access article distributed under the terms and conditions of the Creative Commons Attribution (CC BY) license (http://creativecommons.org/licenses/by/4.0/).
Share and Cite
MDPI and ACS Style
O’Donnell, E.C.; Netusil, N.R.; Chan, F.K.S.; Dolman, N.J.; Gosling, S.N. International Perceptions of Urban Blue-Green Infrastructure: A Comparison across Four Cities. Water 2021, 13, 544. https://doi.org/10.3390/w13040544
AMA Style
O’Donnell EC, Netusil NR, Chan FKS, Dolman NJ, Gosling SN. International Perceptions of Urban Blue-Green Infrastructure: A Comparison across Four Cities. Water. 2021; 13(4):544. https://doi.org/10.3390/w13040544
Chicago/Turabian StyleO’Donnell, Emily C., Noelwah R. Netusil, Faith K. S. Chan, Nanco J. Dolman, and Simon N. Gosling. 2021. "International Perceptions of Urban Blue-Green Infrastructure: A Comparison across Four Cities" Water 13, no. 4: 544. https://doi.org/10.3390/w13040544
Note that from the first issue of 2016, this journal uses article numbers instead of page numbers. See further details here.